
Fluvial Sediment in the Drainage Area of K-79 Reservoir ... · is the surface material in most of...
32
Fluvial Sediment in the Drainage Area of K-79 Reservoir Kiowa Creek Basin Colorado . ________ ______ ______ _ ____________ _ ________ ___ ______ _____________________ GEOLOGICAL SURVEY WATER-SUPPLY PAPER 1798-D * Prepared in cooperation with the I U.S. Department of Agriculture 1 Soil Conservation Service
Transcript of Fluvial Sediment in the Drainage Area of K-79 Reservoir ... · is the surface material in most of...

Fluvial Sediment in the Drainage Area of K-79 Reservoir Kiowa Creek Basin Colorado
. ________ ______ ______ _ ____________ _ ________ ___ ______ _____________________
GEOLOGICAL SURVEY WATER-SUPPLY PAPER 1798-D
* Prepared in cooperation with theI U.S. Department of Agriculture1 Soil Conservation Service
-T3
ZO TO
CO
C
D
00

Fluvial Sediment in the Drainage Area of K-79 Reservoir Kiowa Creek Basin ColoradoBy JAMES C. MUNDORFF
SEDIMENTATION IN SMALL DRAINAGE BASINS
GEOLOGICAL SURVEY WATER-SUPPLY PAPER 1798-D
Prepared in cooperation with the U.S. Department of Agriculture Soil Conservation Service
UNITED STATES GOVERNMENT PRINTING OFFICE, WASHINGTON : 1968

UNITED STATES DEPARTMENT OF THE INTERIOR
STEWART L. UDALL, Secretary
GEOLOGICAL SURVEY
William T. Pecora, Director
For sale by the Superintendent of Documents, U.S. Government Printing Office Washington, D.C. 20402 - Price 45 cents (paper coyer)

CONTENTS
PageAbstract________________________________________________________ DlIntroduction._ ______________-____________-.-___-_._____-_-__--_-_. 2Characteristics of the drainage area___-_--_--------_---_--------_-___ 2
Geology and drainage-____________-_--__-_-_-______--_--------- 2Vegetation and land use________________________________________ 5Soils. ___________________________________________-. 6Precipitation._ ________________________________________________ 7
Hydraulic structures.______________________________________________ 8Fluvial sediment.________________________-_-___--___-______---_-_- 11
Methods of collection and analyses of data-_--_-----_------____-_- 11Basic data.___________________________________________________ 11Suspended sediment._________________________-___-___----_---- 12Deposited sediment and trap efficiency.__________________________ 15
Significance of results.__________________________-____--_-___-_-_--- 17Selected references.-____________________-_-_____________-___------- 18Basic data._______________________________________________________ 19
ILLUSTRATIONS
Page PLATE 1. Map showing areas of deposition and of erosion in K-79
Reservoir..________________________________________ In pocketFIGURE 1. Map showing drainage area of K-79 Reservoir._____________ D3
2. Photographs showing channel of Kiowa Creek immediatelydownstream from State Route 157 in 1958 and in 1965- _____ 4
3. Photograph showing downstream end of discharge tube fromK-79 Reservoir, 1965---------------------------------- 5
4. Map showing distribution of vegetation in drainage area of K-79 Reservoir.-__-_________-__________--____-_---_--___ 6
5. Graph showing monthly cumulative percentage of precipitationin the vicinity of K-79 Reservoir, 1956-65-.______________ 8
6. Map showing hydraulic structures in K-79 Reservoir drainagearea.___-___-_---________-________--___-_-_--___--_-- 9
7. Photograph of drop structure at K-79 Reservoir,___________ 108. Diagram showing percentages of sand, silt, and clay in sus
pended-sediment samples of inflow and outflow, K-79 Reservoir..___________________________________________ 13
9. Photograph of automatic samplers, drop structure, and water- stage recorder at K-79 Reservoir--_----_-____--__------- 15
in

IV CONTENTS
TABLES
PageTABLE 1. Summary of water and sediment discharge during major out
flow periods at K-79 Reservoir, 1956-65.______________ D122. Monthly and annual summaries of water and suspended-sed
iment discharge, Kiowa Creek at K-79 Reservoir near Eastonville, Colo., 1956-65________________________ 20
3. Particle-size analyses of suspended sediment in inflow andoutflow, K-79 Reservoir______________________________ 23
4. Chemical quality of inflow and outflow, K-79 Reservoir ______ 26

SEDIMENTATION IN SMALL DRAINAGE BASINS
FLUVIAL SEDIMENT IN THE DRAINAGE AREA OF K-79 RESERVOIR, KIOWA CREEK BASIN, COLORADO
By JAMES C. MUNDOKFP
ABSTRACT
As part of a national investigation of trap efficiency of detention reservoirs, a study was made of fluvial sediment in the drainage area of K-79 Reservoir in north-central El Paso County, Oolo. This study by the U.S. Geological Survey was begun in 1956 and terminated in 1965. During this period, the average annual precipitation was near normal, although annual precipitation ranged from much below normal to much above normal. Drainage from most of the area passed through one or more upstream structures before reaching K-79 Reservoir.
From August 29, 1956, when the original survey of the reservoir was made, to July 27, 1965, when the final resurvey was made, observed sediment discharge from the reservoir was about 2,610 tons, or 2.5 acre-feet; sediment deposi tion in the reservoir was about 7.5 acre-feet. Trap efficiency was 75 percent as computed from computed volume of sediment outflow and measured volume of sediment desposition. Trap efficiency was 83 percent computed from the observed weight of sediment outflow and the computed weight of sediment deposition; the few available data on volume weight and particle sizes of deposited sediment suggest a volume weight of 80 pounds per cubic foot, or about 13,000 tons of sediment deposited in the reservoir.
Most of the sediment that entered K-79 Reservoir during 1956-60 originated in the downstream one-third of the drainage area, and during 1961-65 originated in a small area downstream from hydraulic structures Jtmilt during 1960. All the bedload discharge and most of the suspended-sediment discharge from a large part of the drainage area were trapped before reaching K-79 Reservoir.
Flocculation of sediment within the reservoir probably is not a significant cause of deposition in the reservoir. The runoff from the area is of low mineralization and is not conducive to rapid flocculation, and the detention time for runoff is only a few hours.
Neither the amount of sediment deposition in, nor the trap efficiency of, K-79 Reservoir should be regarded necessarily as representative of similar but unstruc tured areas in the Colorado Piedmont or High Plains. Under present structured conditions in the K-79 drainage area, the effective life of the reservoir should be exceptionally long.
Dl

D2 SEDIMENTATION IN SMALL DRAINAGE BASINS
INTRODUCTION
A study of the characteristics of fluvial sediment in the drainage area of K-79 Eeservoir, which is on Kiowa Creek in north-central El Paso County, Colo., began in April 1956 and ended in September 1965. This study was part of a national investigation of trap efficiency of detention reservoirs and was made by the Water Resources Division of the Geological Survey, U.S. Department of the Interior, in coopera tion with the Soil Conservation Service, U.S. Department of Agri culture. The main purpose of the study was to determine the quantity and characteristics of sediment transported into, retained in, and dis charged from K-79 Reservoir.
CHARACTERISTICS OF THE DRAINAGE AREA
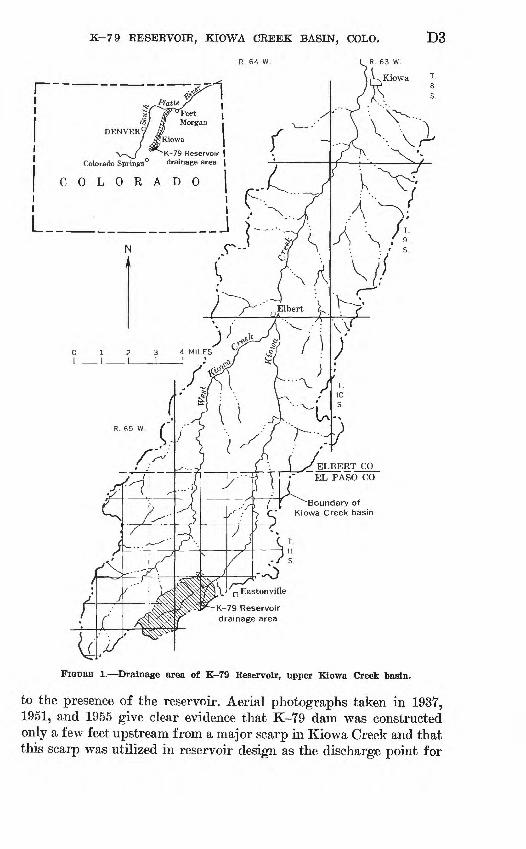
The drainage area of K-79 Reservoir is the headwaters of Kiowa Creek. That part of the Kiowa Creek basin upstream from K-79 Reservoir has an area of 3.2 square miles. (See fig. 1.)
GEOLOGY AND DRAINAGE
Only two geologic formations have a direct influence on present erosion and sedimentation in the K-79 drainage area. The Castle Rock Conglomerate, of Oligocene age, is a conglomeratic arkose that occurs principally as caprock in the forested divide areas in the south western part of the area. The Dawson Arkose, of Late Cretaceous and Paleocene age, is predominantly arkosic sandstone and clay and is the surface material in most of the basin.
Upstream from K-79 Reservoir, Kiowa Creek has an average fall of about 100 feet per mile, and altitudes range from about 7,600 feet in the forested headwaters to about 7,290 feet at the reservoir site. Channels in most of the southwestern half of the K-79 drainage area are broad grassy drains. From the extreme headwaters to State Route 157, the channel generally has a grass cover and shows little evidence of rapid erosion. At the highway, the channel type changes abruptly to a well-defined, actively eroding channel. Bank erosion and bank caving are common between Route 157 and a small reservoir about three-eighths of a mile downstream. Figure 2 shows the channel of Kiowa Creek immediately downstream from Route 157.
Conspicuous erosion immediately downstream from reservoirs com monly is attributed to the "de-silting" of the water and the release of relatively clear water. The channel downstream from K-79 Reser voir has steep banks and has a deep scour area immediately down stream from the outlet tube. The general characteristics of the channel downstream from the reservoir, however, do not appear to be related
K-79 RESERVOIR, KIOWA CREEK BASIN, COLO.
R. 64 W.
D3
DENVER[Kiowa
K-79 Reservoir I drainage area |Colorado Springs
COLORADO
ELBERT CO EL PASO CO
Boundary of Kiowa Creek basin
j_* n Eastonville
-79 Reservoir drainage area
PIGUEB 1. Drainage area of K-79 Reservoir, upper Kiowa Creek basin.
to the presence of the reservoir. Aerial photographs taken in 193Y, 1951, and 1955 give clear evidence that K-79 dam was constructed only a few feet upstream from a major scarp in Kiowa Creek and that this scarp was utilized in reservoir design as the discharge point for

D4 SEDIMENTATION IN SMALL DRAINAGE BASINS
FIGURE 2. Channel of Kiowa Creek immediately downstream from State Route 157. Upper photograph was taken on March 23, 1958. Two Ponderosa pines fell across the channel during the previous night. Note the snow clinging to the vertical surface of the detached soil mass. Lower photograph was taken in June 1965. Note changes in channel during the period 1958-65. Most of the sediment resulting from such channel erosion is trapped in upstream reservoirs and does not reach K-79 Reservoir.

K-79 RESERVOIR, KIOWA CREEK BASIN, COLO. D5
outflow from the reservoir; as the scarp migrated upstream, the channel deepened accordingly. The dam has prevented normal up stream migration of the scarp, and appreciable scour has occurred just below the discharge tube (fig. 3).
Another scarp extends across the upstream end of the reservoir, and is clearly shown on aerial phptographs taken in 1937, 1951, and 1955 and on maps made during the reservoir surveys of 1956 and 1965. The upstream migration of both this scarp and the major scarp at the down stream side of K-79 dam appears to have triggered the development of scarps in tributary channels as the mainstem scarps moved past each tributary. Neither the mainstem scarps nor the tributary scarps resulted from the presence of the reservoir.
VEGETATION AND LAND USE
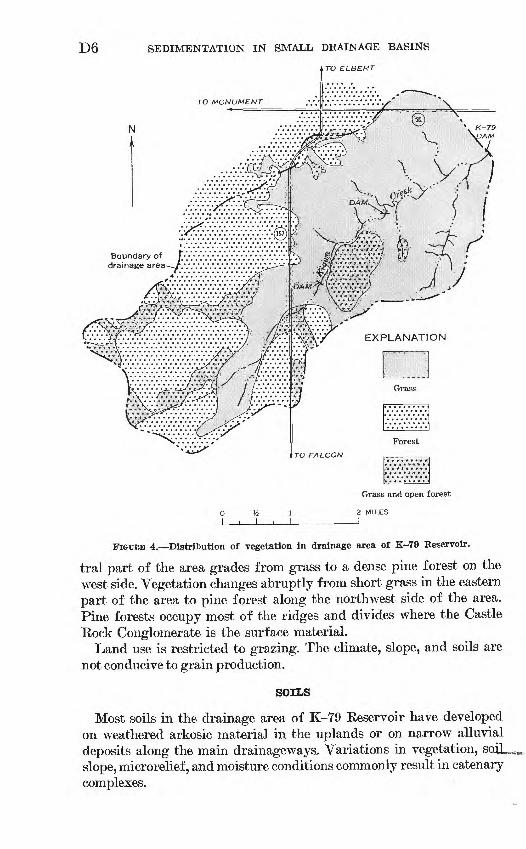
Vegetation in the K-79 drainage area ranges from dense stands of Ponderosa pine in the southwestern part of the area to sparse short grass on the steep slopes in the northeastern part. Figure 4 shows the distribution of forest and grass within the area.
Stands of Ponderosa pine range from dense to scattered scrub growth. Gently sloping to hummocky meadowland in the west-cen-
FIGURE 3. Downstream end of discharge tube from K-79 Reservoir, 1965. Dashed line shows location of bank in May 1957.
279-646 O 68 2
D6 SEDIMENTATION IN SMALL DRAINAGE BASINS
TO ELBERT
Grass and open forest
2 MILES
FIGURE 4. Distribution of vegetation in drainage area of K-79 Reservoir.
tral part of the area grades from grass to a dense pine forest on the west side. Vegetation changes abruptly from short grass in the eastern part of the area to pine forest along the northwest side of the area. Pine forests occupy most of the ridges and divides where the Castle Rock Conglomerate is the surface material.
Land use is restricted to grazing. The climate, slope, and soils are not conducive to grain production.
SOILS
Most soils in the drainage area of K-79 Reservoir have developed on weathered arkosic material in the uplands or on narrow alluvial deposits along the main drainageways, Variations in vegetation, slope, microrelief, and moisture conditions commonly result in catenary complexes.

K-79 RESERVOIR, KIOWA CREEK BASIN, CQLO. D7
Well-developed podzolic profiles were observed in some of the areas of coniferous forest. These soils, probably of the Kettle series, have an AOO horizon about 1 inch thick composed of fresh litter and pine needles grading into the A0 horizon of partially decomposed litter mixed with mineral particles. The Aa horizon, a sandy loam, is about 3 inches thick and changes abruptly into the A2 "bleicherde" horizon that ranges from 8 to 14 inches in thickness and is a very light gray loamy fine sand. The A2 horizon is underlain by the B 2 horizon, approximately 18 inches thick, which is a compact sandy clay loam. The B2 horizon is underlain by an undetermined thickness of clayey to gravelly weath ered arkose. In some of the forested areas, weakly developed soils do not have the profile typical of the Kettle series. For most of the for ested areas, the combination of thick surface litter, relatively gentle slopes, high infiltration rate, and precipitation interception by the forest cover probably results in low overland runoff and low sediment yield. During short periods of early spring, however, some soil frost commonly exists in the shaded forest areas after soil frost has disap peared from the open grassland. During such periods, runoff may be high from the forest areas.
In general, the soils in the eastern half of the area show weaker de velopment and are more erodible than those in the western half.
PRECIPITATION
No long-term precipitation records are available for the immediate vicinity of K-79 Keservoir. For the period 1921-63, unofficial records kept by the Kiowa State Bank at Kiowa, Colo., about 20 miles down stream from K-79 Reservoir, show that average annual precipitation was about 16.0 inches. During the period 1956-65, precipitation rec ords were obtained by the U.S. Weather Bureau at four stations near the drainage area of K-79. Precipitation data for these stations, all of which are within 2 miles of the area, are given in the table below.
Precipitation, in inchesYear
Eastonville 1NNW EastonvUle 2 NNE EastonvUle 3 NW Eastonville 6 WSW
19561957_________.1958_________.1959______ _I960. _1961. _-_-____.1962_ ___1963_________.1964__ _______1965.... ______
i 11. 3525. 6420. 0019. 6714. 5918. 0012. 5916. 3212. 5025.61
1 9.1823.7517.8715.4313.4718. 147.5314.558.65
24.60
9.0720.2818. 0012.7011.0614.7710.9913. 157.98
2 24.6
11. 0627.2618.7818.3417.6119.8312. 0913.579.36
21.72
1 April through December.2 Partly estimated.

D8 SEDIMENTATION IN SMALL DRAINAGE BASINS
JAN. FEB. MAR. APR. MAY JUNE JULY AUG. SEPT. OCT. NOV. DEC.
FIGURE 5. Monthly cumulative percentage of precipitation In the vicinity of K-79Keservoir, 1956-65.
The data show that average annual precipitation in the vicinity of K-79 Eeservoir during 1956-65 was about the same as the long-term average at Kiowa, and that precipitation in the drainage area of K-79 probably was significantly above normal during 4 years, below normal during 4 years, and about normal during 2 years. On the average, about 60 percent of the annual precipitation occurs from May through August (fig. 5). During 1956-65, precipitation for any given month varied greatly; for example, precipitation at Eastonville 1 NNW dur ing June 1964 was only 0.47 inch, but during June 1965 it was 11.46 inches. At the same location, total snowfall ranged from about 35 inches during the winter of 1962-63 to 141 inches during the winter of 1956-57.
HYDRAULIC STRUCTURES
Two reservoirs existed on the main channel upstream from K-79 Eeservoir throughout the period of investigation; in 1960 many small hydraulic structures were completed in the downstream half of the K-79 drainage area. (See fig. 6.) After 1960, runoff from only about 15 percent of the drainage area has entered K-79 Reservoir directly without having first passed through one or more upstream structures.

K-79 RESERVOIR, KIOWA CREEK BASIN, COLO. D9
Runoff from about 65 percent of the area has been controlled by the two mainstem reservoirs, and runoff from an additional 20 percent of the area has been controlled by the small structures constructed in 1960. As an emergency spillway is the only discharge arrangement at any of the upstream structures, a high stage is necessary for dis charge. Therefore, since 1960 the upstream reservoirs have retained most of the runoff from the upstream part of the area.
Discharge from K-79 Reservoir is through a concrete-box drop structure that is 6 feet square and has an open top and four 1-foot- square ports in the sides. (See fig. 7.) A 24-inch-diameter tube carries the water through the dam. The emergency spillway for the reservoir is about 17 feet higher than the lowest port in the drop structure.
According to the original survey of the reservoir in 1956, all points in the reservoir bottom were higher than the bottom of the lowest port in the drop structure. Thus, the reservoir had no pool except when the lowest port was closed. The lowest port was open continu ously from April 1956 to June 1958, from September 1958 to June 1959, from September 1959 to May 1961, and from October 1961 to May 1962. During these periods, the original bed of the reservoir and the sediment deposited during periods when the lowest port was closed were subject to erosion. The amount of sediment removed from the reservoir area during these periods is not known.
Eastonville
EXPLANATION
.3Sampling point and location number
Dam constructed before 1956
____TIIS Dam constructed in 1960R64W T12S =
R 65 w Stabilization structure or diversion % IMILE dike constructed in 1960
FIGURE 6. Hydraulic structures in K-79 Reservoir drainage area.

D10 SEDIMENTATION IN SMALL DRAINAGE BASINS
FIGURE 7. Drop structure at K-79 Reservoir.

K-79 RESERVOIR, KIOWA CREEK BASIN, COLO. Dll
FLUVIAL SEDIMENT
METHODS OF COLLECTION AND ANALYSES OF DATA
Data on the quantity and characteristics of sediment transported into and discharged from K-79 Eeservoir were obtained by several different instruments and methods. Most of the data on sediment discharge from the reservoir were obtained by standard methods; a U.S. DH-48 suspended-sediment sampler was used to obtain samples of outflow at the downstream end of the outflow tub (figs. 3 and 6). Additional outflow samples were obtained with automatic single- stage samplers near the drop structure in the reservoir (fig. 7) and, during a few short periods, with an automatic continuous sampler at the downstream end of the outflow tube. Reservoir inflow was sampled with a U.S. DH-48 sampler and with automatic single-stage samplers at a few inflow channels.
Problems arose in obtaining reliable outflow samples during some periods when the lowest port of the drop structure was open or when backwater in the channel submerged the lower part of the downstream end of the outflow tube. If the lowest port was open during periods of minor inflow, coarse sediment could be transported directly through the reservoir. This coarse sediment was not uniformly dispersed throughout the depth of flow in the discharge tube, and extreme care was necessary to obtain a representative depth-integrated sample at the end of the outflow tube. During periods when backwater sub merged part of the outflow tube, scoured material from the channel tended to mix immediately with water discharging at high velocity from the end of the tube. During such periods, an effort was made to keep the intake nozzle inside the tube although the high outflow velocity tended to force the sampler away from the tube.
Concentration, particle size, and discharge of suspended sediment were determined by the standard methods of the Geological Survey.
BASIC DATA
Monthly summaries of suspended-sediment discharge and tables of particle size analyses of suspended sediment for the period 1956-65 are given in tables 2 and 3. Continuous records of water and sediment discharges were not obtained during winter months, but periodic observations indicated that no major runoff occurred during winter months. Probably less than 5 percent of the water discharge and less than 2 percent of the sediment discharge occurred during periods when records were not obtained. Table 1 summarizes water and sedi ment discharges during significant observed outflow periods. Limited data on chemical characteristics of inflow and outflow obtained during the study are in table 4.

D12 SEDIMENTATION IN SMALL DRAINAGE BASINS
TABLE 1. Summary of water and sediment discharge during major outflow periods at K-79 Reservoir, 1956-65
DateWater Water
discharge discharge(cfs-days) (acre-ft)
Suspended sediment
Weightedmean Load (tons)
concentration (ppm)
1966 Julyl6-17- . 4.0 7.9Aug. 1-2----.-. ---. ._----.------- 2.1 4.1
1957Junel4-15_ -- -- --._--- 5.9 11.7 July 10-11 _ - _- _ - _ 6.8 13.5 July 23-24 - -___ 3.0 6.0 July 30-Aug. 1. - _ _ 136 270 Aug. 6-7 --- - - 2.8 5.6
1968Mar.21-22 - -.-- .-... 5.5 10.9 July 19-21- .. - - _ 3.6 7.1 July 25-27 . - - 5.4 10.7 Sept. 9-10 - - 6.4 12.7
1959 July 16-17 . - ..- - 9.8 19.4
1960 Mar.24-31 - . . 39.1 77.6
1963 3u\-yyj......................................... 23.0 45.6July 28... - - - 7.8 15.5 Aug. 24-25. . - ---- - 6.3 12.5
1964 AiJE. 3-6_. .. 5.7 11.3
1965 June 17-18. . .- 181 359June 19..-- . - 18 35.7 Aug. 4-5 -- . 4.7 9.3
2,2701,600
1,9101,5101,5704,3601,650
512741665856
1,350
527
2,420475705
721
,080154400
24.5 9.1
30.427.812.7
1,60012.5
7.67.29.7
14.8
35.6
55.6
15010.012.0
11. t
5307.55.1
SUSPENDED SEDIMENT
Water and sediment discharge into and from K-79 Keservoir occurred mainly during the summer months, and then only occasion ally. The outflow periods summarized in table 1 represent about 76 percent of the water discharge, about 97 percent of the sediment dis charge, and only about 1 percent of the time during 1956-65. About 80 percent of the sediment discharge from the reservoir during the 10- year period occurred during 5 days July 30-August 1, 1957, and June 17-18,1965.
Data on particle size of suspended sediment (fig. 8; table 3) show that nearly all the sand transported into the reservoir was retained there. Probably less than 1 percent of the sediment discharged from the reservoir was sand or gravel. The greatest quantities of sand prob ably were discharged when the lowest port of the drop structure was open during periods of minor runoff and during the earliest and latest parts of major runoff. Only during such periods were hydraulic condi tions at the drop structure suitable for the suspension of sand at the point of discharge from the reservoir. Further, when the lowest port

K-79 RESERVOIR, KIOWA CREEK BASIN, COLO. D13
o100
SAND
FIGURE 8. Percentages of sand, silt, and clay in suspended-sediment samples of inflow and outflow, K-79 Reservoir. A, inflow; , outflow.
was open and inflow to the reservoir did not exceed the discharge capac ity of the lowest port, sand may have moved as bedload into the dis charge tube and been observed as suspended sediment at the down stream end of the tube.
Neither the quantity nor the particle size of sediment transported into or discharged from K-79 Reservoir is representative of the "sedi ment yield" of the drainage area upstream from the reservoir. Before reaching K-79 Reservoir, drainage from most of the area must first pass through one or more upstream reservoirs. A small reservoir about three-eighths of a mile downstream from State Route 157 retained much of the sediment from the upstream half of the drainage area. Another small reservoir about 1 mile upstream from K-79 dam prob ably trapped much of the sediment derived from the central part of the area. Many other small dams and stabilization structures were built in the downstream half of the area in 1960 (fig. 6); these structures undoubtedly trapped appreciable quantities of sediment that otherwise would have been deposited in, or transported through, K-79 Reservoir.
279-646 O 68 3
D14 SEDIMENTATION IN SMALL DRAINAGE BASINS
Maximum observed suspended-sediment concentration of inflow to K-79 Reservoir was 94,000 ppm (parts per million) during the major flood of July 30, 1957. This concentration probably was exceeded in small tributary channels during the early part of several runoff periods, but data could not be obtained from these many small channels during storm periods. Percentage of sand generally was less than 10, although the maximum observed percentage was 29. Most observations, however, were made during the latter part of runoff periods or were obtained by automatic samplers which sample only the extreme upper part of flow where sand concentrations are expected to be less than the mean concentration of sand in the entire depth of flow.
Concentration of outflow from the reservoir was generally less than 3,000 ppm during major runoff periods, and commonly less than 10 ppm during prolonged periods of minor runoff. Sand in the outflow generally did not exceed 1 percent. When the lowest port was open, as on August 1, 1956 (see table 3), significant amounts of sand may have been discharged from the reservoir. The sand probably was transported as bedload across the reservoir and was discharged into the drop structure; the sand would have been measured as suspended sediment at the downstream end of the discharge tube.
During some periods, suspended-sediment concentrations were con stant as the water moved through the reservoir. For example, on March 22, 1958, the suspended-sediment concentration at the main inflow point was 1,500 ppm, and the concentration of outflow also was 1,500 ppm. The following excerpts from the author's field notes are pertinent:
March 22, 1958: "At low discharges, inflow travels straight through the reservoir with no dead-water storage. Low dis charges may actually increase in concentration as the water travels across the easily eroded reservoir bottom."
April 2, 1960: "The lower port in the drop inlet is again open, so that a small gully is again being eroded in the reservoir bottom. The water is dropping from the reservoir bottom into the intake structure."
During 1958-60, many small rills and gullies were observed in the reservoir bottom. The largest gully, which in some reaches was 2 feet deep, extended continuously from the main inflow point to within a few feet of the drop inlet. Undoubtedly, a part of the suspended- sediment discharge of the reservoir resulted from erosion of the origi nal reservoir bottom and of temporarily deposited sediment. Figure 9 shows the reservoir and the water level when the lowest port of the drop structure was closed.

K-79 EESEEVOIE, KIOWA CEEEK BASIN, COLO. D15
FIGURE 9. Automatic samplers, drop structure, and water-stage recorder at K-79 Reser voir. Lowest port of the drop structure was closed.
DEPOSITED SEDIMENT AND TEAP EFFICIENCY
After being completed in June 1955, K-79 Reservoir had a gross storage capacity of 134.45 acre-feet. The original survey of the reser voir was made on August 29, 1956; this survey and all subsequent re- surveys were made by personnel of the U.S. Department of Agricul ture. A resurvey of the reservoir was made on September 25, 1957, about 2 months after the major flood of July 30. The resurvey showed that about 2.4 acre-feet of sediment had been deposited during the period. During the same period about 1,710 tons, or about 1.6 acre- feet, of sediment was discharged from the reservoir. Thus, trap effi ciency during the period was about 60 percent. Nearly all the deposi tion and discharge probably resulted from the flood of July 30, 1957.
A second resurvey was made on October 17, 1961, and showed an additional 1.5 acre-feet of sediment deposition during the period Sep tember 1957-October 1961. During this period, suspended-sediment discharge from the reservoir was about 0.15 acre-foot, and trap effi ciency was about 90 percent.
A third resurvey was made on July 27,1965, and indicated that total deposition in the reservoir was about 7.5 acre-feet during the period 1956-65. Total deposition during 1956-61 was about 3.9 acre-feet ac-
D16 SEDIMENTATION IN SMALL DRAINAGE BASINS
cording to the first two resurveys. Thus> about 3J5 acre-feet of . ment was deposited during the period October 1961-July 1965. During the same period, about 750 tons, or 0.72 acre-feet, of sediment was dis charged from the reservoir. Trap efficiency during the period was about 84 percent.
From August 29,1956, when the original survey was made, to July 27, 1965, when the final resurvey was made, observed sediment dis charge from the reservoir was about 2,610 tons, or 2.5 acre-feet; sedi ment deposition in the reservoir was 7.5 acre-feet. Trap efficiency was 75 percent as computed from sediment volumes. Trap efficiency was 83 percent as computed from the observed weight of sediment outflow and the computed weight of sediment deposition; the few available data on volume weight and particle sizes of deposited sediment sug gest a volume weight of 80 pounds per cubic foot, or about 13,000 tons of sediment deposited in the reservoir.
Sediment deposition was not uniform within the reservoir area. The original survey altitudes of 1956 and resurvey altitudes of 1965 were used to prepare a map (plate 1) that shows areas of erosion and of deposition during the study period. For most of the reservoir area, altitudes were determined at 50-foot intervals along the reservoir grid ranges; therefore, details of reservoir topography, including accurate definition of small channels and gullies, could not be determined. The map shows that 0.1-1.0 foot of sediment was deposited over much of the reservoir area; deposition of 1.0-2.0 feet generally was restricted to deltas and channel fill in the main inflow chanels or to small fans immediately below gullies along the margin of the reservoir. At a few points in the reservoir, deposition of nearly 2.5 feet was observed. Deposition of less than 0.1 foot, or erosion, occurred mainly along the margins of the reservoir and especially along the easternmost of the main inflow channels at the upstream end of the reservoir.
The average volume weight of deposited-sediment samples obtained on September 25, 1957, was 77.6 pounds per cubic feet, and on Octo ber 17, 1961, was 81.5 pounds were cubic foot; the volume weight of delta deposits was appreciably higher than that of deposits in the main part of the reservoir. Particle-size analyses of delta deposits obtained in 1957 showed 46 percent gravel and 53 percent sand; reservoir deposits showed 1 percent gravel, 45 percent sand, 34 percent silt, and 20 percent clay (U.S. Dept. Agriculture, 1959).
Most of the sediment that entered K-79 Reservoir during 1956-60 originated in the downstream one-third of the drainage area, and dur ing 1961-65 originated in the small area downstream from hyraulic structures built in 1960. Thus, during 1956-60 about one-third of the drainage area contributed significant quantities of sediment to K-79
K-79 RESERVOIR, KIOWA CREElt BASIN, COLO. D17
Reservoir, and during 1961-65 about one-sixth of the drainage area contributed. All the bedload discharge and most of the suspended- sediment discharge from a large part of the drainage area were trapped before reaching K-79. The upstream structures and a decreasing effec tive-drainage area during the period of investigation probably resulted in a lower trap efficiency than would have resulted from a complete absence of upstream structures. Although much less sediment entered K-79 Reservoir as a result of upstream entrapment, the sediment that was discharged from the upstream reservoirs probably was extremely fine and had little tendency to settle during temporary detention in K-79 Reservoir. Thus, although the trap efficiency of K-79 Reservoir for sediment derived from the upstream two-thirds of the drainage area probably was low, the amount of sediment delivered to K-79 Reservoir from this area probably was small. A low trap efficiency for a reservoir in a basin having many upstream structures may indicate only that the easily trapped coarse sediments were deposited in upstream reservoirs and that the particle-size distribution of sediment that entered the downstream reservoir was finer than it would have been in the absence of upstream structures.
Flocculation of fine sediment within the reservoir probably was not a significant cause of deposition in K-79 Reservoir. The runoff from the area contained a low concentration of dissolved solids (table 4) and was not conducive to rapid flocculation. Detention time for most run off was only a few hours. Even for the flood of July 30-August 1,1957, when the total inflow was 270 acre-feet, the detention time was short; more than 50 percent of the total inflow was discharged from the reser voir during the first 6 hours, and about 90 percent was discharged during the first 24 hours. Thus, the combination of water having low dissolved-solids content and of short detention time probably pre vented significant deposition caused by flocculation of sediment.
SIGNIFICANCE OF RESULTS
The first data on suspended-sediment discharge from K-79 Reser voir were obtained in April 1956, and the last data, in September 1965. The original survey of the reservoir was not made until August 29, 1956; and the final survey was made on July 27,1965. Trap efficiency of the reservoir must, therefore, be computed only for the period between the first and last surveys, not for the period of data collection. The trap efficiency of 72 percent represents a period during which aver age annual precipitation was about normal. About 50 percent of the inflow to the reservoir and about 80 percent of the sediment discharge occurred during only 5 days of a 10-year period, during two extremely intense storms.

D18 SEDIMENTATION IN SMALL DRAINAGE BASINS
Most of the eroded sediment from a large part of the drainage area was deposited in upstream reservoirs. If the two dams on the main channel upstream from K-79 Reservoir had not been present during 1956-60 and if the additional structures had not been present during 1961-65, much more sediment would have been transported into, and deposited in, K-79 Reservoir. Although sediment discharge from the reservoir probably would have been somewhat higher in the absence of upstream structures, it would not have increased as much as sedi ment inflow. Thus both sediment deposition and trap efficiency of the reservoir would have been appreciably greater in the absence of upstream structures.
Neither the amount of sediment deposition in, nor the trap efficiency of, K-79 Reservoir should necessarily be regarded as representative of similar but unstructured areas in the Colorado Piedmont and High Plains. Under present structured conditions in the K-79 drainage area, the effective life of the reservoir should be exceptionally long. Rapid silting in upstream reservoirs or sudden failure of several of these structures during a short time could markedly alter the present rate of sediment deposition in K-79 Reservoir.
SELECTED REFERENCES
Mundorff, J. C., 1964, Fluvial sediment in Kiowa Creek basin, Colorado: U.S.Geol. Survey Water-Supply Paper 179&-A, 70 p.
U.S. Department of Agriculture, 1959, Watershed program evaluation, KiowaCreek, Colorado: Interim Prog. Kept. ARS 43-97.
BASIC DATA

D20 SEDIMENTATION IN SMALL DRAINAGE BASINS
TABLE 2. Monthly and annual summaries of water and suspended-sediment charge, Kiowa Creek at K-79 Reservoir near Eastonville, Colo., 1956-65
Month
1956 April. ...............................
July
1957
April.. . _ _.-__.._May. _________________
July... _. __ ...........
September ...........................
October. _______________
1958
April. ...............................
July. . .. . .
Water year 1958 _________ .
1959
jM\y............ ......................
Water year 1959..-----..-..--_-.-.
December. --..-._-_._..........._._._
Nu Water dis- daj
charge m* (cfs-days) cha
0.:
00.8
4.42.20
7.4
(i)fO(i)
(0:::: 4 :::::(i)5.45.78.0
143.113.82.2
178.2
0.5(i)(i)
(i)(i)
8.76.35.51.0
10.82.68.2
38.6
1.6(i)(i)
(i)(i) .....(i)
6.42.6.8
10.71.82.0
25.9
3 Q
rn:::: M :::::
mber of Suspended sediment
jan dis- Weighted rge was mean con- Load (tons) 1 cfs or centration more (ppm)
0 ....0 ....36 2 0
11
30 30 21 15 31 22
149
5
31 30 31 10 20 15 16
158
0
30 10
3 2 2 3
50
21
1,570 2,190 1,530
1,930
137 195
1,440 4,190 1,340
252
3,550
74
35358
256 37
590285 687
458
139
40 28 93
1,240 164 93
555
11
0 0 3 4
26.0 9.1 0
38.5
2.0 3.0
31.0 1, 620. 0
50.0 1.5
1, 707. 5
0.1
8.3 1.0 3.8 .1
17.2 2.0
152
47.7
0.6
.7
.2
.2 35.8
.8
.5
38.8
0.1
See footnotes at end of table.
K-79 RESERVOIR, KIOWA CREEK BASIN, COLO. D21
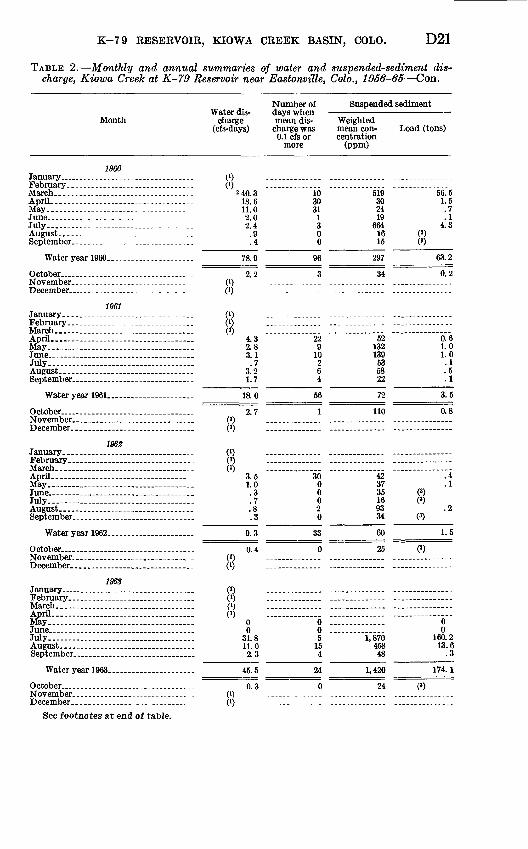
TABLE 2. Monthly and annual summaries of water and suspended-sediment dis charge, Kiowa Creek at K-79 Reservoir near Eastonville, Colo., 1956-65 Con.
Month
1960
AptiL... ...........................
July........ ........................
Water year I960..---.-..........
1961
March ...... ........................
July...... ..........................
Water year 1961 ________ .
October _________ ,. ____ .
1962
May...... ..........................
Water year 1962.. ....._
1963
May. ...............................June ________________ .July.... .........................
September __ ___ ______ .
October.... ................ ........
December __ .....................
Nun Water dis- days
charge mea (cfs-days) charj
0.1 1 m
(0i
/i\(0
0)0)..... (1)
(I)
...... (1)(I)(I)
...... (1)..... (t)
(I)(I)(I)...... ()
(l\(1)
'40.3 18.6 11.0 2.0 2.4 .9 .4
78.9
2.2
4.3 2.8 3.1 .7
3.2 1.7
18.0
2.7
3.5 1.0 .3 .7 .8 .3
9.3
0.4
0 0
31.8 11.0 2.3
45.5
0.3
iber of Suspended sediment
n dis- Weighted *e was mean con- Load (tons) cfs or centration ore (ppm)
10 30 31
1 3 0 0
96
3
22 9
10 2 6 4
56
1
30 0 0 0 2 0
33
0
0 ....0 ....5
154
24
0
519 30 24 19
664 16 15
297
34
52 132 139 5358 22
72
110
42 37 35 16 93 34
60
25
1,870 458 48
1,420
24
56.5 1.5 .7 .1
4.3
63.2
0.2
0.6 1.0 1.0 .1 .5 .1
3.5
0.8
.4
.1
.2
1.5
(3)
0 0
160.2 13.6
.3
174.1
(3)
See footnotes at end of table.

D2.2 SEDIMENTATION IN SMALL DRAINAGE BASINS
TABLE 2. Monthly and annual summaries of water and suspended-sediment dis charge, Kiowa Creek at K-79 Reservoir near Eastonville, Colo., 1956-65 Con.
Month
1964
April.. ......................... ..
June.---------------------.-----..July-.-------------.. ........... .
September.. --. ............ .
Water year 1964.. . ............
October. _ .......................
1965
March... -._.-......--....._......
June _ .................... . .July.-.------..-----....-... . .August _ _--- _- __- ______-September. .. . .
Water year 1966...............
Nu Water dis- dai
charge me (cfs-days) cha
0.:
........ (i)....... (i)....... (i)
........ 1.3....... .5....... 3.8-..--.. 6.4....... .5
....... 12.8
....... 1.0
....... CO
....... (i)
....... (i)
....... (>)
....... (i)-.-.... 2.9....... 1.1....... 194.1....... 5.7....... 7.8....... .9
....... 213.5
unber of Suspended sediment
lan dis- Weighted rge was mean con- Load (tons) I cfs or centration more (ppm)
3 0 2 4 2
11
0
16 2
23 11 8 0
60
342 148 166 654
1,040
457
15
51 168
1,050 377 361
82
979
1.2 .2
1.7 11.3 1.4
15.8
(')
0.4 .5
550 5.8 7.6 .2
564.5
' Streamflow records not obtained. Discharge, if any, not included in annual totals.2 Includes discharge only for March 21-31.3 Less than 0.05 ton.

TAB
LE 3
. P
arti
cle-
size
ana
lyse
s of
sus
pend
ed s
edim
ent
in i
njio
w a
nd o
utflo
w, ^-f
lj t
iese
rvoi
r[M
etho
ds o
f ana
lysi
s: B
, bot
tom
-with
draw
al tu
be;
P, p
ipet
; S,
sie
ve; N
, in
nativ
e w
ater
; W, i
n di
still
ed w
ater
; C
, che
mic
ally
dis
pers
ed;
M, m
echa
nica
lly d
ispe
rsed
; V, v
isua
l ac
cu
mul
atio
n tu
be]
Susp
ende
d se
dim
ent
Sam
plin
g D
ate
loca
tion
num
ber
'
1966
July
16
July
17-.
...
All
fT
1 19B7
July
10.
... ..
July
23
.
July
30 .
July
31.
Aug
. 6.-
1 3 2 2 1 1 1 4 3 3 4 2 1 3 4 1 4 3 3 4 4 2 1 3 2 2 2 1 3 3 4 2 2 2 1 1 2
Wat
er d
is-
Wat
er t
ern-
C
once
n-
Tim
e ch
arge
pe
ratu
re
Con
cen-
tr
atio
n o
f (c
fs)
(°F
) tr
atio
n
susp
ensi
on
(ppm
) an
alyz
ed
(ppm
)
5:00
p.m
...
4:0
02 .
..4
:15
2
.4:4
52......
6:3
0
9:3
0. ..
10:1
0 a.
m ..
.
2:1
52......
..2
:35
.-.
. ..
9-4n
2:4
54
...
2:5
0
3:1
5. ..
..3:2
0
..
3:3
0..
....
.
3:25
. ......
..3
:30
...
..3
:30
.-
..3:3
0.
..3:3
0-
..3:4
5
6:0
0.......
3:3
0--
..
..3:3
5
4:0
0
4:
25. .
....
.5:3
0
4:3
0
..5
:45. .
..5
:45
- .
..
5:5
0.
5:5
5
6:0
0
9:
00 a
.m _
9:0
0
8:25
p.m
...
0.25
33.5
...
33.5
...
33.5
...
33.5
...
.11
...
6.3
7.1
...
8.0
....
3.7
...
17.5 2.9
...
16.1
...
17.3
...
22.6 .5
1 ...
1.7
...
3.0
...
66.7
66
.7
11.0
...
2,52
0____
18,1
004,
610
4,03
0.......
2,51
0 ..
..
1,43
0 ...
. 89
0 .
7,86
0.
10,4
00 .
7,12
0...
4,05
0
3,95
0..
.. ..
. 4,
240
...
3,16
0
2,16
02,
290
....
...
7,95
0.......
15,7
00... .
.. .
15,7
007,
560
. ..
. 7,
560
9 nf
in43
2,
850
10,7
007
nnn
.
5,00
0 ..
..
3,30
043
2,
070
11,7
00..
..
13,5
00... .
.. .
4,45
0 ..
..
6,45
0.......
7,00
0....
8,00
048
1,
750
48
1,75
0
3,90
0
3,63
0 4,
160
4,00
0 2,
660
1,75
0 1,
050
1,38
0 6,
130
2,86
0 4,
280
3,06
0 2,
600
4,57
0 1,
940
1,34
0 1,
760
4,69
0 5,
650
5,51
0 3,
040
2,85
0 1,
600
1,64
0 5,
220
5,51
0 1,
430
1,23
0 1,
310
6,46
0 8,
010
3,30
0 5,
440
5,02
0 3,
820
1,80
0 1,
790
2,45
0
Per
cent
fin
er t
han
ind
icat
ed s
ize,
in
mil
lim
eter
s
0.00
2 0.
004
"~43
54
66
88
""ei
""6
3
"1
6
16
29
15
"~24 60
69
61
29
19
28 33
36
66 58
54
94
29
61
52
71
85
93
34
44
51
49
72
60
74
69
78 42
38
26
38
30
88
76
30
58
77
83
75
36
25
35 42
44
84
82
68
0.00
8 0.
016
""69
85
95
96 87
""9
0
"""4
8 39
51
45 38 88
94
87
46
33
42
54
51
52
96
99
86
98
52
88
85
95
98
98
65
72
82
90
98
86
96
98
96 69
61
54
63
62
98
95
47
82
96
98
96
58
44
53
67
64
63
96
97
97
0.03
1
"""9
7 98
99
100
"~99
""9
8
""76
71
75
81 57""
99
99
99
70
60
68
82
78
80
96
98
97
0.06
2
100 72
99
99
99
100 96
90
97
99
100 87
100 99
98 96
92
91
96
96
99
100 76
98
10
0 10
0 99
85
78
90
98
99 99
99
100
0.12
5 72
99 99
93
99
100 87 99 99
98
98
100
100
100 90
99
""9
2
85
97
100
100
100 99
0.25
0 0.
500
92
99
100
100
.....
98
100
100
.....
88
90
99
100
100
.. ..
.10
010
0 .....
98
100
100
100
.....
98
100
92
98
100
.....
100
100
Met
hods
of
1.00
0 2.
000
.....
.....
SP
WC
M10
0 .....
SP
WC
M..
.. .
..
SP
WC
M.... .
.. _
B
WC
M.....
....
. B
WC
M.....
. _ .
BW
CM
.... .
.....
BW
CM
....
. ..
.. .
SP
WC
M.....
SP
WC
M.....
..
SP
WC
M.....
.
SP
WC
M
.... .
PW
CM
91
92
SP
WC
M
....
.
BW
CM
.
SP
WC
M
.....
BW
CM
.....
SP
WC
M..
.. .
.....
VP
WC
M.....
VP
NM
.....
.....
VP
WC
M-.
..-
.....
VP
NM
..... -
SP
WC
M ~
SP
WC
M.....
.....
VP
WC
M.....
.....
SP
WC
M.....
--.-
. S
BW
CM
.....
.....
SB
WC
M--
.-.
.....
SB
WC
M.....
.....
VP
WC
M10
0 .....
VP
WC
M
.....
.....
VP
WC
M. _
_
.....
VP
WC
M-.
,-.
.....
SP
WC
M... .
. _
_
VP
WC
M.....
.....
SP
WC
M.....
.....
SP
NM
.....
SP
WC
MC
O
See
foot
note
s at
end
of t
able
.

TAB
LE 3
. P
arti
cle-
size
ana
lyse
s of
sus
pend
ed s
edim
ent
in i
nflo
w a
nd o
utflo
w,
K-7
9 R
eser
voir
Con
tinu
ed
Susp
ende
d se
dim
ent
Sam
plin
g D
ate
loca
tion
num
ber
l
1958
Mar
. 21
....
...
July
l9... .
..
July
25
......
Sept
. 1
0.
.Se
pt. 2
6
1959
July
16.
.. ..
.
I960
July
S.-
1 1 3 4 1 1 1 1 1 1 1 1 1 1 1 1 1 1 1 3 4 3 5 4 4 1 4 3 4 1 3 1
Wat
er d
is-
Wat
er t
ern-
T
ime
char
ge
per
ature
(c
fs)
(°F
)
4:00
p.m
...
9:0
0..
....
2:15
- --.
.2
:30
....
...
.2
:55
-__
8
:00
-..-
.-4
:35
-.
5
:30
...
7:3
0...
4:4
9.-
--9:
00 a
.m ..
.
2:39
p.m
...
2:4
5 .
. 3:0
0...
3:1
5
3
:30
....
...
3:4
5..
....
4:3
0...
10:4
5-.
.. ...
2:3
5.
.3:
002 _
__
_
1:3
02
_
.2:
30 2
_..._
. .
3:4
5.-
.
2:1
0.
...
2:1
7.
-
-2:3
0.. _
..
.2
:40
.
2:5
0.
...
2:5
0.
.3
:40
.
34.0
..
.84.0
..
7.5
...
5.0
..11
.0
...
11.5
..
10.0
..
.44
...0
7 ..
16.9
20
.3
21.6
22
.0
22.1
21
.9
20.2
«1
0.7
3.90
6.66
8.14
48
45
44
43
42
43
42
45
48
43 68
« 34
634
"34
«37
«3
1 C
once
n-
t tr
nti
on
su
(pp
m)
ai
1,37
0 59
7 1,
830
3,31
0 1,
150
741
845
1,06
0 74
1 36
1 14
9
2,37
0 2,
990
2,82
0 2,
640
2,49
0 2,
230
2,05
0 1,
020
1,91
0 7,
800
15, 4
00
7,84
0 2,
240
4,05
0
1,70
0 1,
010
2,55
0 3,
430
771
8,78
0 1,
170
Don
cen-
ra
tion
of
is
pens
ion
tialy
zed
0 (p
pm)
1,67
0 72
4 1,
360
2,47
0 3,
440
1,45
0 2,
310
1,15
0 81
0 91
0 98
9
3,30
0 4,
080
4,01
0 3.
320
3,69
0 3,
230
2,57
0 1,
430
2,84
0 8,
930
6,52
0 3,
220
1,62
0 4,
480
4,38
0 2,
620
6,35
0 5,
850
2,01
0 6,
060
2,97
0
Per
cent
fin
er t
han
indi
cate
d si
ze, i
n m
illim
eter
s M
etho
ds o
f
.002
0.
004
0.00
8 0.
016
0.03
1 0.
062
0.12
5 0.
250
0.50
0 1.
000
2.00
0
58
74
55
57
65
82
65
69
77
95
51 51
53
57
58
59
61
63
74
42
27
26
29
44
29 66
63
50
44
71
44
70
64
.....
89
96
64
....
. 67
..
...
79
....
. 92
.....
77
....
. 79
.....
.85
.....
96
54
.....
.
64 .
64
67
.....
68 ..
70
71
....
. 74
.....
88
....
. 52
..
...
32
.....
30
....
.35
.....
49
....
. 35
.....
79
....
. 75
.....
59
.....
52
....
. 78
.....
85
.....
97
.....
98
98
88
....
. 89
..
.. .
97
.....
96
.....
96
.....
87
.....
96
.....
88
92
....
.94
..
...
94
.....
96
.....
97
.....
96
.....
99
78
.....
47
.....
46
.....
49
.....
70 _
-49
..
...
98
.....
93
.....
82
.....
70
.....
Q1 70
.....
99
.....
100 99
100 99
100
100
100
100
100
100
100
100
100
100
100
100
100 99
83
75
83
96
71 99
98
99
95
96
93
10
0
100
100 94
81
93
97
78 100 99
10
0 99
98
97
....
. ..... .
.....
SP
WC
M.....
.....
----
- .....
BW
CM
....
. .....
.....
.....
PW
CM
....
. .....
.....
.....
VP
WC
M.....
----
- -
----
- S
PW
CM
... ..
.....
.....
.....
SP
WC
M.....
.... .
.....
....
. S
PW
CM
..... -
....
. ..
.. .
VP
WC
M -
....
. - - .1
S
PW
CM
. -
.....
- .
----
- S
PW
CM
....
. ..
...
....
. ..
.. .
PW
CM
....
. ..
....
. ..
...
VP
WC
M
...-
-
- .
. V
PW
CM
.....
.-.-
. .....
.....
PW
CM
.....
....
. ..... -
VP
WC
M.-
- .....
....
. V
PW
CM
....
.....
.....
.....
VP
WC
M..
...
....
. ..
...
.....
VP
WC
M.....
.....
.....
....
V
PW
CM
..
..... -
VP
WC
M99
10
0 .....
.....
VP
WC
M82
82
10
0 ___
VP
WC
M98
99
10
0 .....
VP
WC
M
98
100
....
. .....
VP
WC
M87
98
10
0 ___
VP
WC
M
.....
....
. ..
...
.....
VP
WC
M99
10
0 _
-
....
. V
PW
CM
....
. ..
...
.....
VP
WC
M10
0 ..
...
.....
VP
WC
M99
10
0 .....
.....
VP
WC
M97
99
10
0 ___
VP
WC
M
.....
.....
--.-
. .....
PW
CM
d bO

1961
Aug
. 8.. ....
1963
July
27
July
28
Aug
. 17
.-.-
-
Aug
24
Aug
. 25
_---
_
July
25 ..
Aug
. 8-.
...
1965
June
18.
. ...
June
19.
. ...
July
3 ..
.
4 4 2 2 i i i i i i i i i i i i i i i i i i i i i i i i i i i i i i
4:0
0-.
..
8:30
-
12:1
0 p.m
.-4:1
5... -
4:4
5-.
..
5:05
-- --
5:3
5...-
.--
5:50
--.-
9:4
0-.
.---
.Q
.OC
10:2
5...-
---
11:0
0...-
---
2:40
a.m
...
2:10
p.m
...
2 3:
30 p
.m...
2 3*
457
:15
2..
7
:25
2..
7:3
52
..
7:4
52
..
7:5
52..
....
8:0
52
....
..11:0
0. ..
.1
1:4
5. ..
.
1:0
0-
2:0
0.
7:30
.. .....
1:0
0. ..
.12
:05
a.m
._
65 46 8.9
6.0
3.9
4.0
3.9
3.8
3.7
2.0
14 15 14 10 1.8
9 g 12 12 12 12 12 12 10 9.5
..
.
65 64 29 5.2
1.8
«43
«43
«38 65 65 54 54 65 58 58 58 58 57 72 57
6,54
0
8,45
0 ..
.. ..
.4,
940
-.--
-..
3,42
0 ..
. .
1,68
0 ..
.-.-
.35
0 ..
....
.27
1 --
.
1,00
0 _--
....
990
-...--
.82
0 ...._
..66
7 -_
....
.35
4 ..
....
.41
0 ..
....
.1,
330
.__--
..99
8 --
---
923
_..._
_.60
6 .._.-
-.33
7 .......
589
__
....
.55
0 ..
....
.1,
910
.......
1,69
0 .......
1,73
0 ..
....
.1,
520
... _
.1,
530
.......
1,27
0 .......
778 _
.69
9 _ ..
..
1,46
0 ___ .
1,44
0 .......
1,26
0 .......
662
___ .
424
.......
43 30 42 42 46 60 89 80 68 70 68 75 61 84 54 67 64 77 83 63 64 64 64 57 74 75 66 77 78 68 79 87 87
48 32 49 52 58 78 96 86 80 80 87 92 78 96 70 80 85 93 95 83 84 79 83 74 79 77 79 93 94 85 96 92 96
61 99 93 98 98 91 98 95 98 97
74 58 83 84 94 100
100 96 98 99 99 100 96 98 98 98 99 99 99 100 94 95 96 96 100
100
100
88 99 100
100 99 100
100
100
_ _ _
99
100
.....
.....
...
95
98
100
----
- ...
100
--.-
. .....
--..
. ...
100
----
- --
._-
.... .
...
100
....-
----
- -.
-.-
.-.
100
--.-
. ..--
- .-
._-
...
100
----
- --
---
--.-
. ...
100
..--
- -_
--.
...-
- ...
100
----
- --
---
-_...
...
100
----
- --
---
----
- ...
100
----
- --
---
----
- --
.10
0 --
---
----
- --
.-
...
100
.....
....
. .....
...
100
.....
....
. .....
...
98
.....
.....
.....
...
100
__ __ __
...
100
__
_
___
___
...
100
.....
.....
.....
...
100
__
_
___
__
_
...
100
.....
....
. .....
...
100.
___
___
__
_
...
100
.....
.....
.....
...
100
.....
.....
.....
...
100
.....
.....
.....
...
.....
VP
WC
M
...
.....
VP
WC
...
.....
SP
WC
RP
WP
..
.....
SP
WC
...
.....
PW
C.-_
--
-..
BW
C...
----
- S
BW
C...
.....
SP
WC
...
----
- S
PW
C...
-...
- B
WC
...
.....
BW
C...
.....
BW
C...
.....
SB
WC
...
-.._
_ S
PW
C...
..-.
. S
PW
C...
...._
BW
C...
._.-
. B
WC
...
_-.
.-
BW
C
...
-....
SP
WC
...
._.._
SP
WC
...
.....
SP
WC
... -
SP
WC
...
.....
VP
WC
...
.....
SP
WC
...
....
. S
PW
C..
. .....
VP
WC
...
.....
SP
WC
...
.....
SP
WC
...
.....
SP
WC
... -
S..
. ..
...
SP
WC
...
.....
SP
WC
...
__
S
PW
C
1 See
figu
re 7
:1, d
owns
trea
m e
nd o
f out
let d
isch
arge
tube
; 2, o
utle
t str
uctu
re in
rese
rvoi
r; 3,
Kio
wa
Cre
ek a
bout
% m
ile u
pstr
eam
fro
m K
-79
dam
; 4,
cha
nnel
of r
ight
trib
utar
y to
rese
rvoi
r; an
d 5,
Kio
wa
Cre
ek ju
st d
owns
trea
m f
rom
Sta
te R
oute
157
.2 A
ppro
xim
ate;
tim
e fo
r aut
omat
ic s
ampl
ers
estim
ated
fro
m r
eser
voir
sta
ge a
nd w
eath
er r
ecor
ds.
3 D
aily
mea
n di
scha
rge.
4 O
btai
ned
from
gag
e-he
ight
cha
rt.
8 Mea
n, 8
:00
p.m
.-12:
00 p
.m.
6 Run
off
mos
tly f
rom
mel
ting
hail.
CO O
to
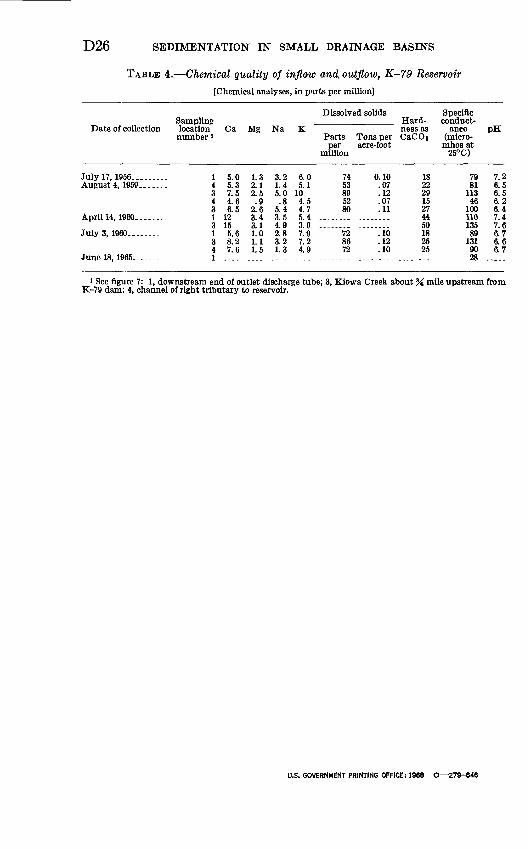
D26 SEDIMENTATION IN SMALL DRAINAGE BASINS
TABLE 4. Chemical quality of infl&w and, outflow, K-79 Reservoir
[Chemical analyses, in parts per million]
Sampling Date of collection location
number <
July 17, 1956... ......August 4, 1959...--..
April 14, I960........
JulyS, 1960... .......
June 18, 1965-.......
1 4 3 4 3 1 3 1 3 4 1
Dissolved solids Specific Hard- conduct-
Ca
5.0 5.3 7.5 4.6 6.5
12 15 5.6 8.2 7.6
Mg
1.3 2.1 2.5 .9
2.6 3.4 3.1 1.0 1.1 1.5
Na
3.2 1.4 5.0 .8
5.4 3.5 4.9 2.8 3.2 1.3
K ness as ance Parts Tons per CaCOj (micro- per acre-foot mhos at
million 25°C)
6.0 5.1
10 4.5 4.7 5.4 ..3.9 -.7.9 7.2 4.9
74 53 89 52 80
72 86 72
0.10 .07 .12 .07 .11
.10
.12
.10
18 22 29 15 27 44 50 18 25 25
79 81
113 46
100 110 135 89
131 90 28
pH
7.2 6.5 6.5 6.2 6.4 7.4 7.6 6.7 6.6 6.7
' See figure 7: 1, downstream end of outlet discharge tube; 3, Kiowa Creek about % mile upstream from K-79 dam: 4, channel of right tributary to reservoir.
U.S. GOVERNMENT PRINTING OFFICE: 1968 O 279-646


![Kiowa Election Results For Issues On November 7, 2009[1]](https://static.fdocuments.in/doc/165x107/558fce121a28ab677f8b45db/kiowa-election-results-for-issues-on-november-7-20091.jpg)
