FLUOROSIS -INDIA - ircwash.org · 3. fruits, eggs, meat, fish, sugar, gur and beverages consumed...
72
245.4 83 FL FLUOROSIS -INDIA Hyderabad Component) VL~ UBRARY INTE~: AT: ‘~L R~E~P’TNflF CENT!-” FOP fl~ ~.A LR LY AND SANiTA~~ . PROJECT REPORT SUBMITTED BY PRINCIPAL INVESTIGATOR CO-INVEST I- GATORS Dr. (Mrs.) K. RAJYALAKSHML MD.. Director. Institute of Prcventi~Medicines Public Health Laboratones and Food (Health) Authority, Hyderabad-(A P ) Dr. K. R. VENKAIAH, M. 0. Dr. N. V. RAIV1AMCHANA R~O, Ph D. Dr. NEELAM KRISHNA. M.3 B.S. DURATION OF THE PROJECT DECEMBER, 1980-AUGUST, 1983 SPON~OREDBY INTERNATIONAL DEVELOPMENT RESEARCH CENTRE CANADA. 7 245.4—4069
Transcript of FLUOROSIS -INDIA - ircwash.org · 3. fruits, eggs, meat, fish, sugar, gur and beverages consumed...

245.483 FL
FLUOROSIS -INDIAHyderabad Component)
VL~
UBRARYINTE~:AT: ‘~L R~E~P’TNflFCENT!-”FOP fl~ ~.A LR LY AND
SANiTA~~ .
PROJECT REPORT
SUBMITTED
BY
PRINCIPALINVESTIGATOR
CO-INVESTI-GATORS
Dr. (Mrs.) K. RAJYALAKSHML MD..
Director.Institute of Prcventi~MedicinesPublic Health Laboratones andFood (Health) Authority,Hyderabad-(A P )
Dr. K. R. VENKAIAH, M. 0.Dr. N. V. RAIV1AMCHANA R~O,Ph D.Dr. NEELAM KRISHNA. M.3 B.S.
DURATION OF THE PROJECT
DECEMBER, 1980-AUGUST, 1983
SPON~OREDBY INTERNATIONAL DEVELOPMENTRESEARCH CENTRE CANADA. 7
245.4—4069
CONTENTS
1. INTRODUCTION 1~NDOBJECTIVES OF THE PROJECT:
1 .1 Introduction1 .2 Methodology of Investigation
1 .3 Chemical Examination of drinking water
1 .4 Dietary surveys
1 .5 Clinical Examination of Patients
1 .6 Classification of skeletal Fluorosis
1 .7 Clinical features studied
1 .8 Radiological examination
1 .9 Biochemical Analysis
2. BASE LINE DATA:
2.1 Chemical Characteristics o~fDrinking water
2.2 Selection of subjects
2.3 Dietary Status of subjects
2.4 Results of clinical examination
2.5 Results of Radiological examination
2.6 Results of Biochemical Analysis
Tables of 1 — 2.13
3. INTERVENTION:
3.1 Intervention programme
3.2 Defluoridation of drinking water
3.3 Nutritional supplement
3.4 Biochemical profile of patients
3.5 Serum and Urinary fluoriae data
3.6 Serum and Urinary calcium levels
3.7 Serum alkaline phosphatase
3.8 Results of clinical examination
3.9 Results of Radiological examination
Tables 3.1 — 3.44
4. SUMMARYAND CONCLUSIONS:

L’~rA
I~ ~.~A~5J~JLYI -
C H A P T E R — ~ ~1~’~’~AD T~-:-~ue—— Tel. (O/~) u~ • ~t. 14 1/142
RN: ‘~~I\ U~DbG~
1.1 INTRODUCTION: LO: ~ L
Nalgonda district in Andhra Pradesh is one
of the severely flu~rosis affected districts in the
State. Studies on distribution of fluoride have
shown high frequency distribution exceeding 2.0 mg/i.
in water s~ources. A maximum of 20.0 mg/i. has been
recorded. Preliminary epidemiological surveys
revealed that people consuming water having identical
concentration of fluoride are unequally affected.
It is also observed that labourers and harijans are
more affected tham teachers and land lords in the
village. It has been reported by research workers
that there has been significant reduction in the
severity of disease on transferring the patients
from high fluoride areas to non—endemic areas having
lower fluoride concentration in drinking waters.
Substantial improvement in the condition of patients
has also been reported when they are shifted to
hospital and provided with nutritive diet. In a
highly endemic area in the district called Sivarinagudem
fluorosi~ belt having excessive fluoride containing
minerals in rocks, soils even surface waters are
found to have unusually high concentration of
5—7, mg/l.F
Reports in the literature tend to suggest
that nutrition chemical characteristics of waters
besides fluoride concentration of water influence
the onset and severity of the disease. It is
therefore planned to systematically study the
effectiveness of providing nutritive supplements
and defluoridated water to fluorosis patients
previously consuming drinking water having excessive
concentration of fluoride.

2
1 .2 ME1}~ODDLOGY OF INVESTIGATION:
Four villages with water sources having
fluoride concentration in the ranges:
A) 1.1 — 4.0 ppm
3) 4.1 — 8.0 ppm
C) 8.1 or above
were selected for the study. A total of 72 patients
have been selected in each village so that different
age groups are represented viz., 1) 0—5 years;
2) 5—10 years; 3) 10—18 years and 4) 18 + years.
24 patients of Vattipalli Village were selected
after starting the project to compensate some
patients who left Batlapalli. A village Nacharam
near Hyderabad where the fluoride concentration
in drinking water is less than 1 .5 ppm has been
selected as control for comparison of results.
1.3 COMPLETE CHEMICAL EX~AJviINATION OF_DRINKING WATER:
Water samples were collected in 2 litre
polythene cans from sources which are used by the
patients in the four villages. The samples were
analysed for pH, colour, turbidity, total hardness,
alkalinity, calcium, magnesium, sodium, potassium,
chloride fluoride and iodide following standard
procedures recommended in A.P.H.A. Standard methods
of examination of water and waste water. The data
was recorded in a proforrna.
1 .4 DIE T~RY SURVEYS:
The total dietary intake of the individual
patients was computed on the basis of different foods
consumed. Amounts of cereals, pulses, milk and
milk products, fats and oils, vegetables, roots,

3.
fruits, eggs, meat, fish, sugar, gur and beverages
consumed was determined by weighment method. Total
diet prepared for the whole family consecutively for
three days was ascertained and the individual dietary
intake was then computed from the total members of
the family. During dietary survey general food habits
of the people, vegetarian or non—vegetarian and the
prevalence of breast feeding, time of weaning and
mode of food preparation and consumption were also
ascertained. Individual nutrition evaluation was
made by recording the data in a proforma.
1 .5 CLINICAL EXAMINATION OF PATIENTS:
Incidence of dental fluorosis has been studied
under the following classifications.
Grade 0 (Normal, transluscent, smooth andgloosy teeth)
Grade 1 (White Opacities, faint Yellow line)
Grade 2 (Changes of Grade 1 i- Brown stain)
Grade 3 (Brown line pitting & clipped off edges)
• Grade 4 (Brown black + fall of teeth)
1 .5 SKELETAL FLLXJROSIS:
Incidence of skeletal fluorosis has been
e~amined as per following criteria.
0 — Normal
I — Mild. Asyrnptomatic Radiographs withincreased bone density.
2 — t~loderate. Symptomatic — Stiffness,rigidity, pain, aches.
3 — Severe — Symptomatic with moderateOsteophytosis, exostoses, markedlimiation of spine and joints,crippling deformities.

I I
4.
1 .7 THE_FOLLOWING CLINICAL FEATURES WERE STUDIED.
1. Generalised pains and aches.2. Back—ache.
3. Stiffness.4. Rigidity of spine.
5. Able to close fists.
6. Arthralgia.
7. Swelling of ‘joints.
8. Cleaving of toes.
9. Flexion at cervial spine.
10. Flexion deformities at hips and knees.
11. Limitation of movements.
12. Exostoses.
13. Associat~ rickets.
14. Associated osteomalacia.
15. Tetany
16. Goitre
17. Skin lesion
18. Constipation
19. Others if any.
As patients of fluorosis in Andhra Pradesh
were reported to have neurological symptoms
patients of the present study were examined for:
1. Head Ache; 2. Giddiness; 3. Epileptic fits;
4. Signs of nerve/cord compression;
5. Musale wasting; 6) Paraesthesia.
1 .8 RADIOLOGICAL EXAMINATION:
For ass~ssing the radiological profile of
fluorosis patients X—rays of:
1 . Fore—arm; 2. Knee joints and
3. Spine were taken.

- 5
1 .9 BIOCHEMICAL ANALYSIS:
Samples of blood and urine were collected from
normal persons in Nacharam and flurosis patients in
the four villages selected. The blood samples were
analysed for:
1 . Proteins.2. Alkaline Phosphatase.3. Urea.
• 4. Creatinine.5. Calcium.6. Phosphorous.7. Magnesium.8. Fluoride content
As it was difficult to collec’t and transport 24 hour
urine samples, samples were collected two hours after
taking meal. The samples were examined for:
1 . Calcium.2. Magnesium.3. Phosphate.4. Fluoride.5. Creatinine.6. Creatine—clearance.7. Fluoride concentration.
The base line data was collected on chemical
characteristics of drinking water, nutritional
deficiencies of patients, their clinical features
and radiological and biochemical profiles. The
data was analysed and presented in Chapter — 2.
Intervention programme was then initiated in each
village by providing potable water and nutritional
supplement to overcome the deficiencies after divid-
ing the persons into the following groups:
Group — I: Normal healthy controls living in non—endemic area (Nacharam near Hyderabad)and consuming low fluoride concentrationof water i.e. upto 1.5 ppm)

6.
Grou~~II: Fluorotic controls: Fluoride content.
a) Drinking water containing: 1.1 to 4 ppm
b) Drinking water containing: 4.1 to 8 ppm
c) Drinking water containing: 8.1 and above
Group—Ill: Provided with water containing permissible
levels of fluoride to those who were
originally consuming:
a) Drinking water containing: 1.1 to 4 ppm
b) Drinking water containing: 4.1 to 8 ppm
c) Drinking water containing: 8.1 and above
group — IV: Provided with nutritional supplement in
addition to their regular diet to those
who were consur~.ngwaters having fluoride
concentration in the three ranges.
~oup — V: Patients provided with drinking water with
permissible levels of fluoride (by
defluoridation) and nutritional supplement
in addition to their normal diet.
In these studies it was ensured that sufficient
number of persons were covered in each age group viz.,
0—5 years; 5—10 years; 10—18 years and 18 + years so
as to systematically determine the effect of providing
nutritional supplement and low fluoride water. Since
the date of intervention the clinical features,
radiological profile and blood and urine biochemical
parameters were determined after three months, six
months, nine months and one year. The data has been
recorded and analysed in Chapter — 3. Surrinary and
conclusions of the investigations have been reported
in Chapter IV.

CHAPTER —2
2. Base line data:
2.1 Chemical Characteristics of drinking water:
Water samples were collected from 85 wells in
5 villages as detailed in the following Table:
Table 2.1
No. of Bore No. of open Total• Village Wells Wells snurces
examined
Niacharam (Hyd) 2 3 5
Marriguda 3 22 25
Vattipally 1 5 5
Sivannagudem 3 32 35
Batlapalli 1 11 12
Samples were analysed for fluoride, pH,
conductivity, alkalinity, hardness, calcium,
magnesium, sodium, potassium, chloride and iodide.
The analytical results have shown variations in the
chemical characteristics of available well waters
in every village surveyed. The fluoride concentra-
tion in the waters of Nacharam Village near Hyderabad,
varies from 0.5 — 1 .5 with an average of C~9 mg/i.
The mean fluoride concentrations in the four villages
of Nalgonda District are 2.21 ; 3.2; 4.6 and 8~.2 mg/l,
respectively. Comparative study of chemical para-
meters of different villages revealed fluoride
concentration of water is significantly related to
calcium, hardness, alkalinity and alkalinity/Hard-
ness values. Salient chemical characteristics of
water of the 5 villages are recorded in Tables 2.2—2.6.
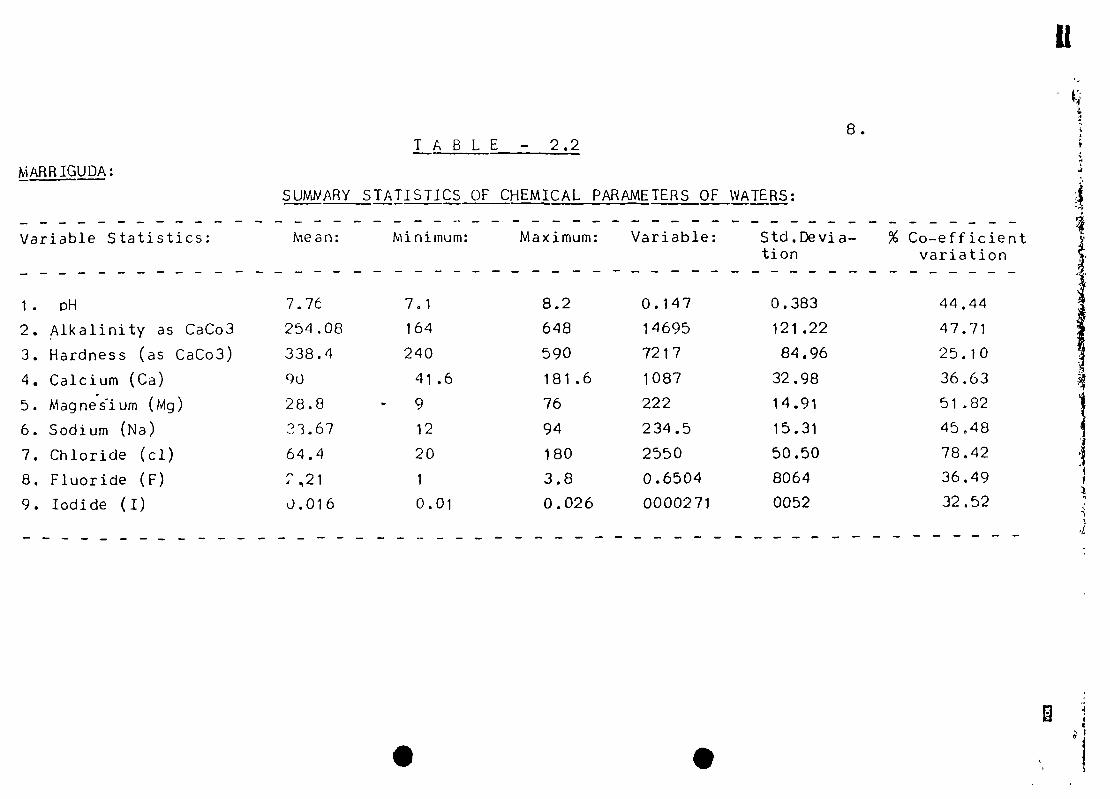
MARR IGUDA
TABLE — 2.28.
LI
SUMMARY STATISTICS OF CHEMICAL PARAMETERS OF WATERS:
Variable Statistics: Mean: Minimum: Maximum: Variable: Std.Devja— % Co—efficienttion variation
1. nH 7.7~ 7.1 8.2 0.147 0.383 44.44
2. Alkalinity as CaCo3 254.08 164 648 14695 121.22 47.71
3. Hardness (as CaCo3) 338.4 240 590 7217 84.96 25.10
4. Calcium (Ca) 90 41.6 181.6 1087 32.98 36.63
5. Magnes~ium(Mg) 28.8 - 9 76 222 14.91 51.82
6. Sodium (Na) 23.67 12 94 234.5 15.31 45,48
7. Chloride (cl) 64.4 20 180 2550 50.50 78.42
8. Fluoride (F) 2q21 1 3.8 0.6504 8064 36,49
9. Iodide (I) 0.016 0.01 0.026 0000271 0052 32.52
.

WATTIPALLI
T A B LE~ - 2.3
I
S(.MMARY STATISTICS OF CHEMICAL PARAMETERSOF ~./ATER
9.
Variable Statistics: Mean: MinImum: Maximum: Variable: - Std.Devia— %Co-efficienttion variation
1. pH
4. Calcium as Ca
5. Magnesium (W~g)
6. Iodide (I)
7. Chloride (ci)
8. Fluoride (F)
376.667
48.~6
13. 34
0.O1E~
44
3.3
7
430
352
72
6.8
0.01
20
2.6
43
0.025
68
4.0
0.0552
330.0035
524.9597
776.1786
409.7526
0.00008
335.9889
0.2 362
0.235
18.166
22.912
27. 8568
20.24
0.0028
18.33
0.486
3.24
4.711
6.083
24.44
41 .68
21 .45
41 .660
1 4 . 74
7,23
2. Alkalinity (asCaCo3) 45[~.67
3. Hardness (asCaCo3)
7.6
488
420
156.8

VILLAGE:__SIVANNAGUDA:
TABLE — 2.4
SUMMARYSTATISTICS_OF CHEMICAL PARAMETERS.
10
11
Minimum Maximum Variance Std.Devia—Variable Statistics. Mean
1. pH 7.69
2. Alkalinity (asCaCo3)
3. Hardness (asCaCo3)
tion%Co-e ffic ientvariation
4. Calcium (as Ca)
5. Magnesium (as Mg)
6. Sodium (Na)
7. Chloride (ci)
8, Fluoride (F)
9. Iodide (I)
4~)O.23
331 .72
?~.48
5c, 36
194.71
144.~ 2
4.67
0 . 01 5
7.0 8.3 337 0.581 7.55
176 736 33559 183.19 37.36
170 620 15064 122.74 36.779
12 128.8 538.24 23.2 61.86
225 124 710 26.65 44.92
100 500 6256 79.1 40.6
46 452 12328 111 76.82
3.2 6.4 0.5226 0.7228 15.48
0.01 0.02 0.000012 0.00348 23.20
.

VILLAGE: BAT LAPALL I
Variable Statistics
1. pH
2.
3.
4.
5.
6.
7.
8.
9.
Alkalinity (asCaCo3)
Hardness (as
CaCo3)Calcium (Ca)
Magnesium (Mg)
Sodium (Na)
Chloride (ci)
Fluoride (F)
Iodide (I)
25.54
26.68
31 .63
35.46
46 .02
72.30
29.43
17.99
S .
TABLE — 2.5
SUMMARY OF CHEMICAL PARAMETERS
11.
Maan Minimum Maximum Variance Std.Devia—tion
%Co—efficientVariation
7.67 7.2 8.2 0.67 0.259 3.38
641 .34 300 804 26825 163.79
297.5 140 436 6300 79.37
33.6 16 51.2 112.95 10.63
52.4 20 92.5 344.94 18.57
210.17 70 360 9356 96.73
109.5 18 272 6267 79.17
~Y.2 8.0 8.~ 4.004 2.001
U.011 0.01 0.015 0.0000039 0.00198
B

TABLE
~JM’AARYSTATISTICS OF
Parameter Sh ivannaguda Ba tiap a lii
AlkaliniflF
HardnessF
AlkalinityHardness
CalciumF
-~--~
F
243.88
315.55
0.78
32 7P
114.97
153.1
0.95
40.7
13.03
138.03 104.97
114.24 71.03
1.21 1.48
14.74 8.02
10.16 12.71
82 .22
38.14
2.16
4 30
6.72
— 2.6
LI12.
Macharem
INTER RELATIONSHIPS OF CHEMICALPARAME TERE
Marriguda Vattipalli
74.74~
.B

-;
13.
It will be seen from the results that waters of
Naigonda Villages\ have invariably alkalinity
exceeding hardness in contrast to those of
Nacharam.
The results indicate a positive correlation
between F content, alkalinity, and alkalinity/hard-
ness. An inverse correlation is also seen between
fluoride and calcium contents.
‘~No relation is discernable between F concentration
~-~d other parameters. The results~ndicate water of
Nalgonda villages contains optimum amounts of iodide.
2.2 Selection of sublects for investiaation:
Human subjects drinking the water from
different wells in the villages with F content ranging
from 1—9 mg/i. were selected so that both sexes in
different age groups are represented as shown below:
TABLE 2.7AMarriguda:
Ago group Male Female Total subjects
• 0—5 2 2
5—10 5 3 8
10—18 15 6 21
18+ 31 10 41
Total: 51 21 72
TABLE 2.7B
Si vannagudem:
0—5 1 1 2
5—10 10 6 16
10—18 17 9 26
18+ 18 10 28
46 26 72Total:

14.
TABLE 2.7C
Batlapallj
:
Age Group Male Female Total sublects
0—5 — 2 2
5—10 7 4 11
10—18 9 2 11
18+ 8 7 15
Total: 24 15 39
TABLE 2.70
Vattipallj:
0—5 1 1
5—10 2 1 3
10—18 2 1
18+ 14 3 17
Total: 19 5 24
2.3 Dietary status of subjects:
Dietary surveys on the subjects revealed that
the common staple foods consumed are Rice, Jawar,
Bajra, Red gram del, Green Gram dcl, milk, curd,
Amaranth, Cucumber, green and red chillis, sugar,
edible oil, beans, onions, tomatto ~nd tamarind. The
total intake of proteins, fats, carbohydrates, vitamins,
calcium, phosphorous and iron are computed from the
quantities of food materials consumed by referring
to I.C.M.R. Manual on nutritive value of Indian
foods. The data is presented in Tables 8 to 10.

15.
It is seen from the data all the subjects
under investigation have low dietary status, the
foods consumed having multiple deficiencies of
essential nutrients. It is noteworthy that the
intake of vitamins is less than the minimum
prescribed for the lowest age group (1—5 years) of
the subjects.
TABLE - 2.8
DIETARY STATUS
Intake of Proteins, Fats & Carbohydrates
Place Proteins: Fats: Carbohydrates Energy— (gms.) (gms.) (gms.) (K.Cal)
Minimumrequirements 19.2—53.7 — — 1350—2500
Marriguda 9.9—27.7 14.4—18.5 102—305 584—1464
Vattipalli 21 .8—37.8 10.8—14.0 184—374 922—1866
Sivannagudem 14.7—29.! 11.2—14.0 124—306 691—1490
Batlapalli 22.1—42.2 19.0—25.9 225—1002 998—2007
TABLE — 2.9
DIETARY STATUS
TABLE SHOWINI INTAKE OF VITAMINS
Place Vitamin A: Vitamin B: Riboflavin Vita—(b) mm C
(Units) (Mg) (Mg)
1100—3000 0.75—1.37 3.0—50
161—735.5 0.21—0.45 4.2—16.5
152—194 0.15—0.32 10—28
216—845.8 0.47—0.674.3 .29.8
Ma r rig u d a
Vatlapalli
Sivannagudem
Batlapalli
(Mg)
0.7—1 .25
0.29—0 .45
0 . 1 7—0.35
0.32—0.65

16.
TABLE — 2.10
DIETARY STATUS
.
INTAKE OF CALCIUM, PHOSPHOROUS,IRON.
Place Calcium Phosphor~us Iron(Mg) (Mg) (Mg)
Minimum -
requirement 400—800 —— 1 .5—25
Marriguda 127—163 243—675 4.1—13.9
Vattipalli 160—302 395—900 8 — 25
Sivannagudem 71—158 268—675 5.713.2
Batlapalli 72—222 657—1203 8.8—20
2.4 RESULTS OF CLINICAL EXAMINATION:
All the 207 patients of the four villages have
dental fluorosis in varying degrees of severity. The
degree of severity to generally found related to the
concentration of fluoride in drinking water. However
for the same levels of fluoride the degree of severity
of dental fluorosis was found more with increasing
alkalinity values of water. Clinical examination of
the patients also revealed that they were suffering from
the following symptoms of skeletal fluorosis.
1. General pains and aches, back ache.
2. Stiff neck.
3. Pain in joints.
4. Rigidity of spine.
5. Flexion deformity of hips.
6. Flexion defermity of knees.
7. Kyphosis.
8. Fixation of chest in the position of
inspiration.9. Head ache.
10. Signs of nerve/cord compression.

17.
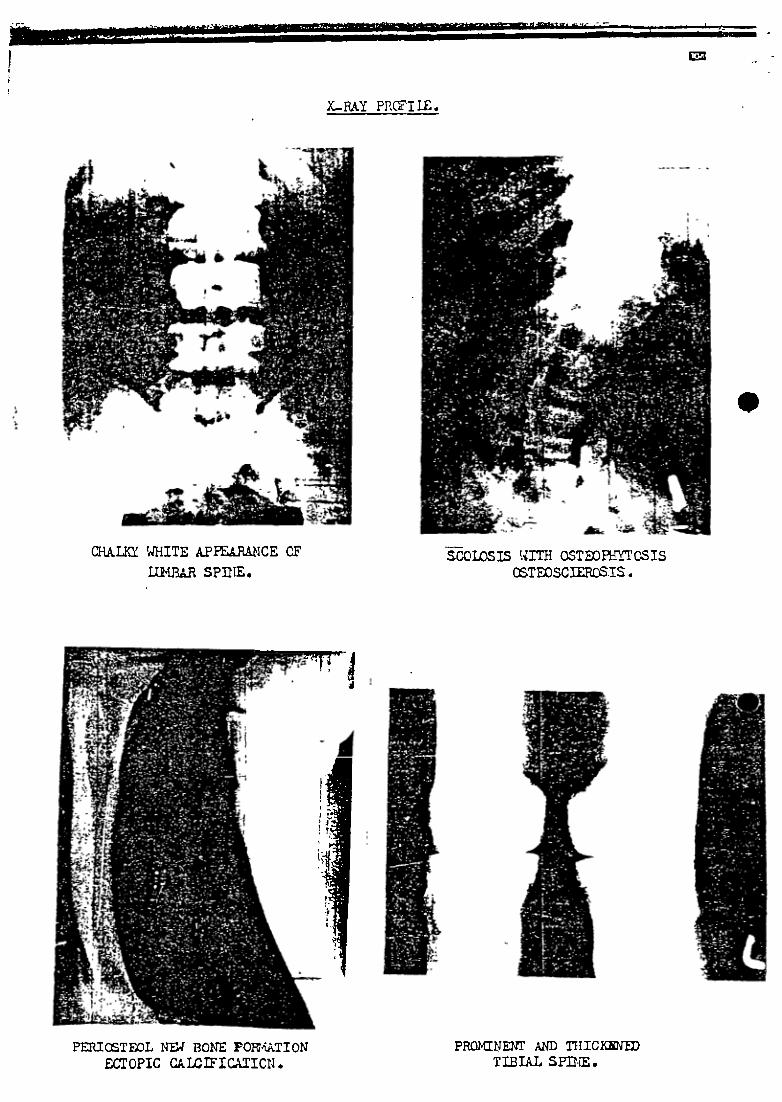
2.5 RESULTS OF RADIOLOGICAL EXAMINATION:
Radiological profiles of the Lumbar spine, fore
arm and knee joints have the following features.
1. Osteoslerosis.
2. Calcification of interossious membrane.
3. Irregular periosteal bone formation.
4. Osteophytosis.5. Exostosis.
6. Dense epiphyses and Metaphyses.
7. Osteomalacia.
8. Cystic expansion of bone.
9. Expansion of longbone ends.
10. Phalengeal resorption.
11. Neo osseous porosis.
12. Bony Ankylosis.
Some of the cases of fluorosis and radiological
profiles are shown in figures 1 to 8 cases of dental
fluorosis in different age groups are classified into
grades I, II, III and IV and skeletal fluorosis as mild,
moderate and severe respectively. The data is presented
• in Tables 2.10; 2.13.
TABLE — 2.11
The cases of dental and skeletal fluorosis inMARRIGUDA
Age group Dental. Skeletal.in Yrs.
No.of I II III IV Mild Moderate Severecases
0—5 2 2
5—10 8 — 6 2 —— 4
10—18 21 — 6 10 6 6
18+ 41 — 4 17 20 10 4 2
72 2 16 29 26 20 4 2
0—55—10
10—181 8÷
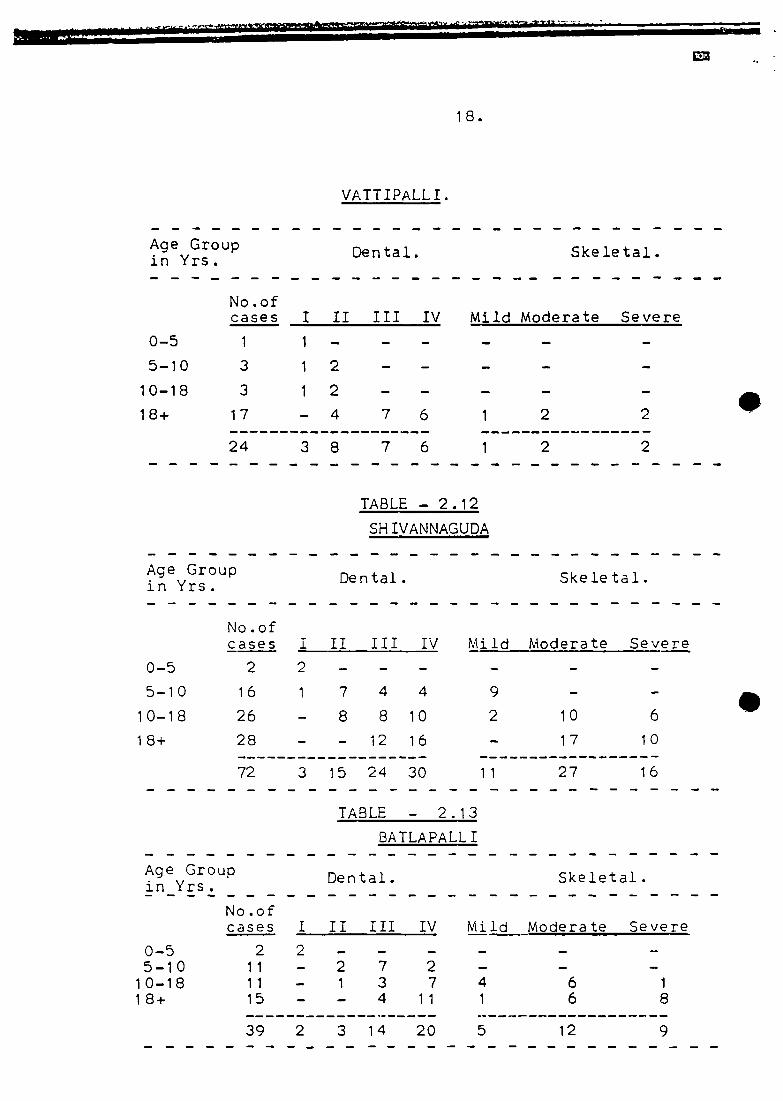
VATTIPALL I
18
Age Group Dental.
No.ofcases I II III IV
1 1 — — —
3 12 — -
3 12 — —
17 — 4 7 6
24 3 8 7 6
Age Groupin Yrs.
No .ofcases III III IV
2 2 — — —
11 — 2 7 211 — 1 3 715 — — 4 11
39 2 3 14 20
0—5
5—1 0
10—18
1 8+
Skeletal.
Mild Moderate Severe
1 2 2
1 2 2
TABLE — 2.12
SHIVANNAGUDA
Dental. Skeletal.
.
S0—5
5—10
10—18
1 8+
No.ofcases
2
I II III IV Mild Moderate Severe
-2 — — —
16 1 7 4 4 9 — —
26 — 8 8 10 2 10 6
28 — — 12 16 — 17 10
72 3 15 24 30 11 27 16
TABLE — 2.13
BATLAPALLI
Dental. Skeletal.
Mild Moderate Severe
4 6 11 6 8
5 12 9

0>(I)mC’)
0
mrC07~J0C’)CD
P}iO i’JS: COURI’EJY I NSTI lUTE 0 F PL(EVEN’I’ I V~~i [JO ICI ~ , 1Y)~AEAD.
.1
X-RAY PRCFILE.
CHALKY ¶JHITE £FPEI&RANCE OFU}IBAR SPINE.
IttICETEOL NEW BONE POWiATIONE~OPICCkLCThICATICN.
SCOLOSIS WITh OSTEOfl{YTOSIScSTFLOSCnBOSIS.
PRO}CNEW~ AND T1IIC1~ffDTIBI~ SPINE.
.

19
It will be seen from data in Tables 2.10 — 2.13
that in all the villages, the degree of severity of
both dental and skeletal fluorosis increase with the
age of patients. In Marriguda and Vattipalli majority
of patients studied were suffering from dental fluorosis
and a few from mild skeletal fluorosis. On the other
hand in Sivannagudem and Batlapalli more number of cases
of skeletal fluorosis are encountered in consonance
with increasing concentration of fluoride in drinking
water.
2.6 RESULTSOFBIOCHEMICAL ANALYSIS:
Results of Biochemical analysis of blood samples
of the fluorosis patients of Nalgonda revealed raised
alkaline phospho~tase values ranging from 15—59 units.
It could also be observed that serum fluoride concen-
tration increased 5—10 fold (0.15—0.8) compared to
values of normal persons of Nacharam (0.01 to 0.06).
The values of blood urea, creatinine, phosphorous
and m~.griesium are within normal limits.
The concentration of fluoride in the urine of
fluorosis subjects range from 7.5 — 31 mg/i, while
in normal persons of Nacharam the values are as low
as 0.8 — 0.9 mg/i. The concentration of Urinary
phosphate, creatinine and creatinine clearance values
of fluorosis subjects are within normal ranges, observed
for subjects of Nacharam Village.
It is note worthy that in some cases, the
urinary fluoride concentration is more than the
amount to be expected from the linearity relation
normally observed with drinking water F.Concentra—
tion. The anamoly is seen mostly in patients
drinking water containing below 5.0 mg/l.F. The
anamoly suggests that some of the patients may be
ingesting substaninal amounts of fluoride through food.

CHAPTER - 3
3.1 INTERVENTION:
After conducting epidemiological, nutritional
surveys clinical examination and studying initial
radiological profiles of the patients intervention
programme was introduced by providing:
1 . Defluorida ted water to one group.
2. Nutritional supplement to second group.
3. Defluoridated water and nutritional
supplements to the third group.
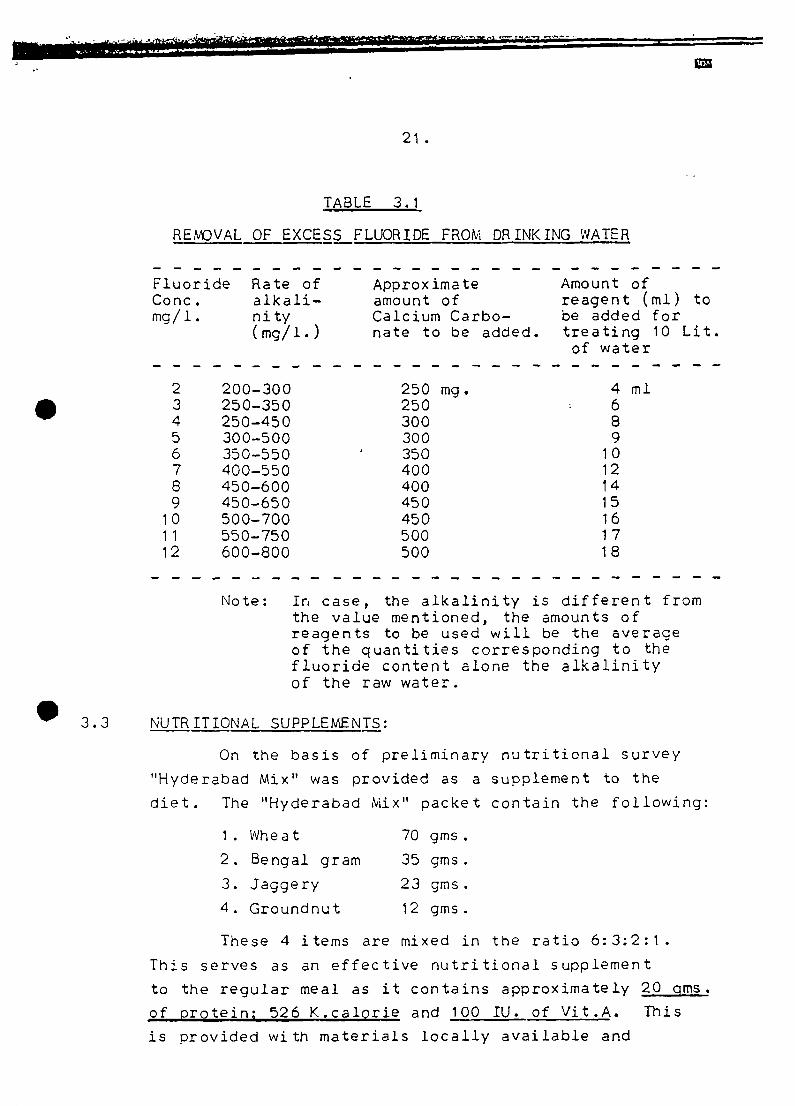
3.2 DEFLUORIOATION OF ~,VATER:
A cheap and simple defluoridation process
was evolved in Institute of Preventive Medicine. The
process consists of adding a little calcium carbonate
powder and measured dosage of saturated filter alum
solution to the raw water in a pot or bucket and
mixing for 5 minutes. The floccules of alluminium
hydroxide complexes absorb fluoride and settle down
in the bottom of the container in half an hour.
The clean supernatant water contains permissive con-
centration of fluoride (F = 1.0 mg/lit).
The amounts of saturated filter alum (A12(S04)3
18H20 to be added for different concentration of
fluoride and alkalinity.values are shown In following
Table 3.1.
21.
RE NOVAL OF EXCESS
TABLE 3.1
FLUORIDE FROM DRINKING WATER
FluorideConc.mg/i.
Approximateamount ofCalcium Carbo-nate to be added.
250 mg.250300300350400400450450500500
Amount ofreagent (ml) tobe added fortreating 10 Lit.
of water
4 ml689
10121415161718
On the basis of preliminary nutritional survey
“I-iyderabad Mix1’ was provided as a supplement to the
diet. The “Hyderabad Mixu packet contain the following:
1 . Wheat
2. Bengal gram
3. Jaggery
4. Groundnut
These 4 items are mixed in the ratio 6:3:2:1.
This serves as an effective nutritional supplement
to the regular meal as it contains approximately 20 gms
.
of protein; 526 K.calprie and 100 IU. of Vit.A. This
is provided with materials locally available and
.
Rate ofalkali—n I ty(mg/i.)
200—300250—350250—450300—500350—550400—550450—600450—650500—700550—750600—800
234567B9
101112
Note: In case, the alkalinity is different fromthe value mentioned, the amounts ofreagents to be used will be the averageof the quantities corresponding to thefluoride content alone the alkalinityof the raw water.
3.3 NUTRITIONAL SUPPLEMENTS:
70 gms.
35 gms.
23 gms.
12 gms.

—‘—r...~,-—.~ ~
22.
acceptable to the population of the area and who can
continue to use them even after the intervention and
our study is over.
METHOD OF PREPARATION:
Clean grains are roasted and ground into a
powder. Each packet contains 140 gms.
MODE OF INTAKE:
1. As powder.
2. Mixed with milk as porridge.
3. Prepare the chapaties (daily bread as perlocal custom)
4. Laddoos (small balls consumed as sweet dish).
3.4 RESULTS OF INTERVENTION:
a) Biochemical profile of the patients
After intervention the blood and urine of the
patients were analysed for different parameters once
in 3 months. The results have been subjected to
statistical analysis. The results have not shown
significant changes in the following parameters.
Blood Urine
Urea Magnesium
Creatinine Phosphate
Phosphorous Creatinine
Magnesium Creatinine clearance
The salient statistical data of values of
significant parameters are presented in Tables 3.2 — 3.5.
It will be seen from the tables that there is
moderate increase in the protein and calcium profiles
of blood of groups II, III and IV compared to
fluorosis control group (Group—I). The variations

23.
are more pronounced in the case of Sivannaguda and
Batlapalli Villages. As expected positive correla-
tion could be seen in the groups III and IV who
received nutritional supplement compared to other
groups. However the variations were not found
statistically significant.
. Significant positive variation could be seen
in the alkaline phosphatase values of blood in
group—Il, III and IV compared to Group—I (Control).
The reduction is statistically significant (P( 0.05)
in all the villages for group—IV (Nutritional
supplements + Defluoridation).
The results of calcium content of urine
have shown general reduction in all the groups. The
reduction is significant (Pc 0.05) in regard to
Marriguda Village in groups III and IV compared to
other groups.
Regarding urinary fluoride profile it is
interesting to note that the values of groups — II,
III and IV are uniformly high compared with the
value of control group — I. It is therefore
evident that the fluoride already absorbed is
immobilized and excreted in the urine on cessation
of excessive fluoride ingestion through drinking
water.

24
STAT1ST TCA~TABLE 3.2
SUMMARY OF BIO-CHEMICALPROFItE OF MARRIGUDA PATIENTS.
Mean + S.D. Mean + S.D. Mean + S.D.
÷
+
+
+
0.35
0.48
0.49
0.49
7.19
6.90
7.32
7.32
+
+
+
+
0.31
0.41
0.34
0.24
7.12
7.06
7.47
7.53
Blood
Initial,———
Mean + S.D.
3-months follow—up————____
6-months follow—up 9—months—_________________
follow—up 12 monthsfo1low~Mean ÷SD
Total Pro-teins (Gm%)
Group—I 6.77 ±0.oO 6.88 0.28
Group—Il 6.61 ±0.55 6.72 0.28
Group—Ill 7.32 + 1.50 (.91 0.34
Group—IV 6.64 ÷0.81 7.02 0.24
Q~yj~( Mg%)
Group—I 11.82 ÷1.~5 11.41 0.74
Group—Il 10.55 ÷ 1.62 10.98 1.42
Group—Ill 11.42 ÷ 1.16 12.22 0.90
Group—IV 10.72 -F 1.65 11.26 1.37
Fiuoride(Mg/l)
Group—I 0.18 -t- 0.05 0.16 + 0.03 0.16 0.03 ±0.03
Group—Il 0.19 + 0.0’~ 0.15 + 0.05 0.14 + 0.02 + 0.02
Group-Ill 0.17 ±0.0~ 0.15 + 0.04 0.13 + 0.03 ±0.02
Group—IV 0.19 ÷0.O~ 0.14 -F 0.04 0.14 + 0.04 0.16 ÷0.03 0.13 + 0.03
+
+
+
+
0.21
0.28
0 .36
0,19
+
+
+
+
0.70
1 .51
1 .42
1 . 70
7.12
7.14
7.56
7 . 70
+
+
+
+
11.49
11 .12
11 .94
11 . 49
+
+
+
+
0.62
1 .42
0.93
1 .6)
11 .49
11 .37
12.26
11 .91
+
+
÷
+
0.76
1 .56
0.96
1 .41
11 .74
11 . 80
12.52
12.23
+
+
+
+
0.15
0.13
0.14
0.04
±0.04
~ 0.04
0.12
0.10
0.12
I .

ITABLE — 3.2 Contd.. 25
URINE (Mg%)
CALCIUM
Group— I
Group—Il
Group—Ill
Group— IV
FLUORIDE (Mg/i)
Group—I
Group—Il
Group—Ill
Group— IV
Group — I:Group— Ii:Group—Ill:Group— IV:
Alk.Phost (K.A.U.)
Group—I
Group—Il
Group—Ill
Group—IV
24.54 ÷ 10.46 28.05 9.22 20.08 7.92 19.31 7.39 19.89 6.34
24.69 1~.20 24.06 ±16.17 21.07 12.23 20.30 11.24 18.40 ±6.9223.00 -F i3.0~ 19.11 ±10.87 16.94 8.70 16.07 7.93 14.32 6.7227.86 13.76 21.21 + 11.56 10.37 9.90 17.19 8.83 15.46 + 8.53
TABLE — 3.2
9.27 2.07 7.45 ±~11 6.99 2.12 6.95 2.19 6.74 2.32
10.46 2.72 9.23 ÷3.07 8.57 + 2.74 8.46 2.72 7.89 + 2.79
11.16 + 3.06 8.00 ±2.87 6.84 + 2.38 7.86 3.61 6.73 2.23
11.21 ~.79 8.28 3.47 7.21 3.01 6.46 5.96 6.11 ±6.36
6.12 3.23 4.71 2.49 4.62 -f- 2.56 5.92 3.46 6.20 ±2.92
5.28 2.14 3.79 ±1.43 3.41 1.18 5.42 2.07 6.21 ±1.90
5.85 + 3.45 3.93 ±1.93 3.86 ÷1.80 7.85 -~- 3,00 8.85 ÷3.82
6.02 2.29 4.79 3.30 4.03 1.99 8.53 3.26 9.22 ÷3.25
Fluorosis control.Patients receivin~ defloridated water.Nutritional suopl~rnent.Dofluoridpt~d water + Njtritionai supplement.

TABLE — 3.3 26STATISTICAL SUNMAH”OF BIOCHEMICAL PROFILE OF VATTIPALLY PATIENTS.
Blood j~t~fj ~ .12 months follow-upMean ±S.C. Mean ± S.D. Me~j~+ sTh.
TotalProg~Jns (Gm~
Calcium (Mg%)
Group—I
Gr.up—II
Group—Ill
Group—IV
Fluoride (Mg/i)
Group—I
Group—Il
Group—Ill
Group—IV
23.66 ±8.88 22.88 ±10.24
20.44 ~ 9.26 20.28 ~ 10.36
20.28 ±10.34 18.42 ~ 8.28
19.45 ~ 11.22 16.26 + 9.34
Group—I
Group—Il
Group—Ill
Group—IV
6.67
6.~8
6.89
6.62
+
F
-1-
+
9.96 ±9.4E ~
i0.2~ ±9.8~~3±
0.58
0.62
0.76
0.82
1 .67
1 .26
1 . 84
1.66
0.04
0.06
0.03
0.02
6.92 ±0.48
6.96 i: 0.86
7.29 ~ 0.49
7.45 ±0.35
10.32 ÷0.82
10.58 ±0.98
11.44 ±_1.02
11.14 ±0.94
0.11 + 0.03
0.11 ±0.04
0.15 ±0.04
0.14 ±0.05
0.12
0.14
0.18
0.17
+
+
F
÷
F’
6.98 :t7.12 ~
7.68
7.77
10.46
10.94
12.84
12.84
0.12
0.10
0.11
0.10
0 . 34
0.36
0.24
0.19
0 .92
0.78
1 .22
1 .22
0 . 04
0 . 05
0.05
0.02
+
+
+
+
+
+
+
+
Alk. Phost (KAU)
Group—I 25.68 ~ 11.54
Group—lI 22.72 + 10.86
Group—Ill 27.5L~+ 12.28
Group—IV 27.88 ~ 11.45
I S

STABLE 3.3
27
Urine
Calcium (Mg%)
Group I
Group II
Group III
Group IV
Fluoride (Mg/i)
Group I
Group II
Group III
Group IV
11.66
lu.
1 I . 48
11 . 35
8 . 72
8.14
7.88
8.’~i
2.84
~ 2.68
3.08
~ 2.12
3.18
±2.94
±~
2.72
1 0 . 84
9.98
8.22
8.14
8.44
8.65
1 0 . 08
10.16
2.33
2.44
±2.12+ 2.36
±2.38
2.08
±2.36
±2.27
10.18 ~ 2.86
9.67 ~ 2.36
8.66 ~ 2.32
8.63 + 2.48
8.64 ±2.46
9.20 ±2.18
11.28 ~ 2.32
12.14 + 2.86
InitialM~an+ S.D.
ômnonths follow—up !2_months follow~y~Mean + S.D. Mean + S.D.

TABLE — 3.4
STATISTICAL_SUVJ~1JRY OF BlO—CHEMICAL PROFILE OF_SIVANNAGUDEMPATIENTS28.
12 monthsfollow—unMean ±S.D.
Tota1~roteins(Gm%)
Group I
Group II
Group III
Group IV
Calcium (Mg%)
Group I
Group II
Group III
Group IV
Flouride (Mg/i)
Group I
Group II
Group III
Group IV
Alk.Phost. (KAU)
Group I
Group II
Group III
Group IV
6.84 ±0.36
6.73 ±0.51
6.81 ÷0.61
6.83 ±0.55
11.95 ~ 1.86
12.56 ~ 1.82
12.20 ~ 1.6”
11.52 ~ 2.23
6.85 ~ 1.36
6.65 ~ 0.48
7.03 ±0.42
6.93 ±0.40
11.37 ~ 2.72
12.49 ~ 1.62
12.65 ±1.36
11.58 ÷ 1.63
6.92 ±0.33
6.71 ±0.38
7.25 ~ 0.25
7.21 ±0.32
11.83 -4- 1.50
12.13 ~ 1.49
12.60 + 1.55
11.69 ~ 1.46
0.14 +0.05
0.17 -t- 0.11
0.17 ±0.11
0.15 ~ 0.07
7.08 ±0.38
6.88 ±0.40
7.61 ~ 0.21
7.50 ~ 0.21
11.87 ÷ 1.44
12.42 1.36
12.88 ~ 1.45
11.99 ±1.33
0.13 ~ 0.05
0,17 ±0.10
0,17 -~- 0.10
0,15 ±0.06
7.15 ±7.00 ±7.66
7.61 ±
12.32 ~
12.76 ±13.21 ±12.27 ~
0.14 ~
0.15
0.11 ~
0.14 ~
0.30
0 .29
0 .23
0.29
1 .41
1.34
1 .43
1 .26
0.04
0.08
0.0.3
0.07
Mean ±S.LJ.
Blood. - - Initial 3-mcnths follow-up 6—months follow—up 9
bean ±S.D. Mean ±S.D.
months floow—up
Mean ~ S.D.
0.15 ±0.07
0.176 ±0.12
0.14 ~ 0,05
0.16 + 0.08
29.46 ~ 12.01
29.94 ±12.’1
29.06 ±14.12
29.32 + 9.05
0.16 ~
0.15 ~
0.15 ±0.15 ~
23.51 ±26.89 ±26.21 ~
21.16 +
0.11
0.10
0.10
0.07
7.90
11.53
13.17
7.94
23.41 ~ 7.46
23.48 ÷9.11
23.78 + 11.98
18.81 ~ 7.25
23.73 ~ 8.89
20.60 ~ 8.19
20.19 ~ 9.32
16.48 ±6.31
22.69 ±9.24
17.80 ±7.55
17.61 + 8.15
14.65 ~ 5.19
I S

29TABLE 3.4
STATISTICAL_SUMMARYOF URINE PROFILE OF SIVANNAGUDEMPATIENTS
3—months follow—up 6—months follow—up 9 months follow—up 12 months-~ — — —_____ __________ ______________ follow—~
Mean ±S.D. Mean ±S.D. Mean ±S.D. Mean ±S.D,
URINE
Calcium (Mg%)
Group I
Group II
Group 111
Group IV
Fluoride (Mg/i)
Group I
Group II
Group Ill
Group IV
13.69 ±3.1’1
12.00 ±4.69
13.38 ~ 3.~’6
10.36 ±3.43
6.88 ~ 1.97
6.03 ~ 2.23
6.83 ~ 2.71
6.90 ~ 2.12
10.56 ~ 2.07
9.88 ±3.43
10.68 ~ 2.07
8.47 ±2.44
5.60 +1.75
5.04 ±1.39
5.75 ±2.09
5.72 ~ 2.55
10.10 -1- 1.58
9.88 ±3.05
10.24 ±2.15
10.12 ~ 3.15
5.62 ~ 1.57
6.00 ±2.93
8.50 ±4.52
10.49 ~ 6.98
9.90 ~ 1.56
9.51 ~ 2.77
9~~s~ 2.19
9.73 ±2.94
6.12 ±1.97
7.52 ±3.67
9.29 ±4.61
12.25 ±6.74
9.43 ~ 1.589.25 ±2.72
9.38 ±2.05
9.21 ~ 2.69
6.43 ±2.17
8.68 ÷3.66
10.12 ±4.84
13.10 ±6.74
Urine Initial
Mean ±S.D.
6.65 6.92 ±0.42 7.03 7.15
6.70 6.88 ~ 4.86 6.98 7.07
6.74 6.90 ±4.92 7.32
6.75 6.88 ±0.45 7.094 7.50 :
9.76 10.89 ~ 1.41 11.04
8.71 10.06 ~ 1.58 10.365
8.64 9.70 ±1.61 10.06
8.48 9.57 ±1.75 10.13
0.42 0.14 ~ 0.03 0.13 0.14 -
0.19 0.13 ±0.03 0.13 0.13 -
0.13 0.12 ~ 0.03 0.12 0.12 ~
0.15 0.13
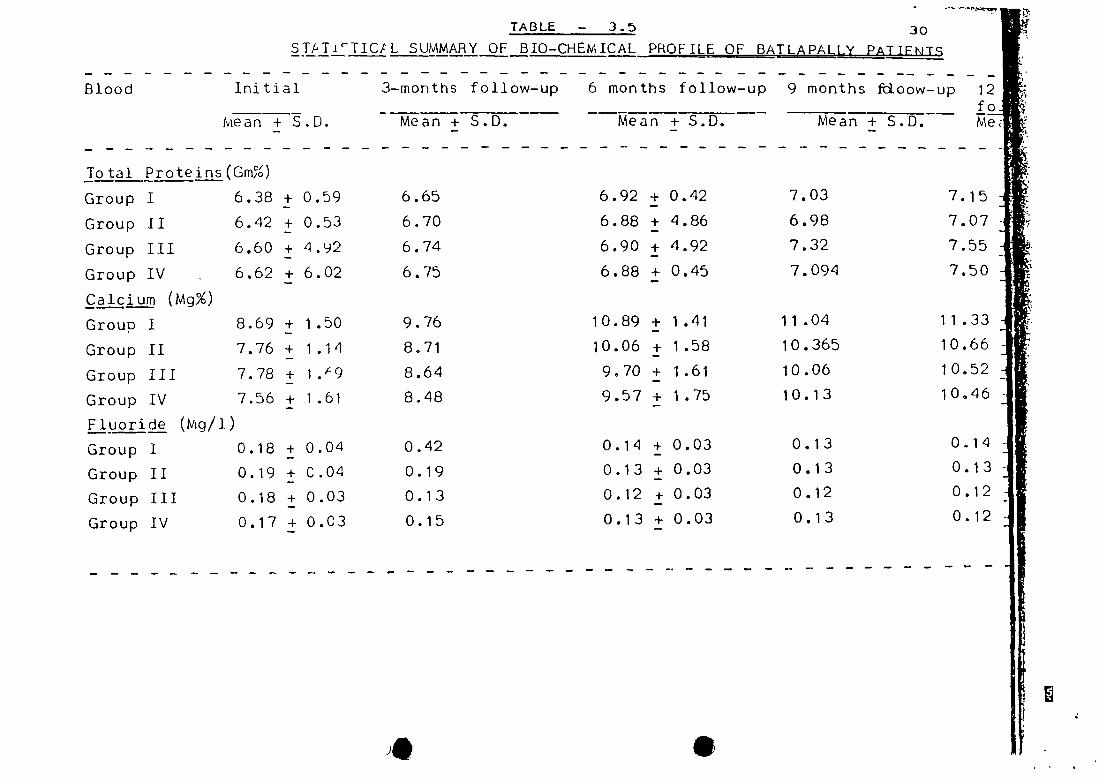
TABLE — 3.5 30
STI~TIdTIC~L_SUMMARYOF BlO—CHEMICAL PROFILE OF BATLAPALLY PATIENTS
3—months follow—up 6 months follow—up
Mean ±S.D. Mean ~ S.D.
9 months fdoow-up 12
Mean ±S.D. Me~
Blood Initial
Mean ±S.D.
Total__Proteins(Gm%)
Group I 6.38 ~ 0.59
Group II 6.42 ~ 0.53
Group III 6.60 ±4.92
Group IV 6.62 ±6.02
~ (Mg%)
Group I 8.69 ~ 1.50
Group II 7.76 ±1.14
Group III 7.78 ±1.~9
Group IV 7.56 1 .61
Fluoride (Mg/i)
Group I 0.18 ±0.04
Group II 0.19 ±C.04
Group III 0.18 ±0.03
Group IV 0.17 + 0.03
11.33
10.66
10,52 ~H
10.46 = F0.12 :0.13 ±0.03
S

CaicjjQ(Mg%)
Group I
Group II
Group III
Group IV
26.07 ±9.71
25.81 ±8.89
~ ~ 12.8732.28 ±10.91
9.81 ±2.68 7.94
10.89 ±~
9.91 ±3.08
3.24 8.80
6.28 ±1.05
6.89 ±1.02
5.06 ±1.11
7.46 ±1.63
6.01
5.46
4.96
6.04
15.66 ±8.32
12.88 ~ 8.72
23.06 ~ 10.34
18.96 ±8.69
12 monthsow- up
Mean + S.D.
5.76 ±1.83
5.23 ~ 1.57
4.10 :t 1.03
5.80 ±1.46
0 31.
TABLE 3.5 Contd..
AikPhost (KAU)
Group I
Group II
Group III
Group IV
23,07 19.24 ~ 7.23 16.C4
19.49 18.57 ~ 10.45 16.32
34.01 32.67 ±11.16 26.58
27.31 24.44 ±12.46 22.35
U r i ne
TABLE — 3.5
STATISTIAL SUMMARY OF_BlO—CHEMICALPROFILE OF BATLAPALLY PATIENTS
Initial - 3-months follow—up 6 months follow—up 9 months —
____ ________ _______—— foUow-~Mean -4- Sji. Mean + S.D. Mean + S.D. Mean + S.D.
9.48
7.58
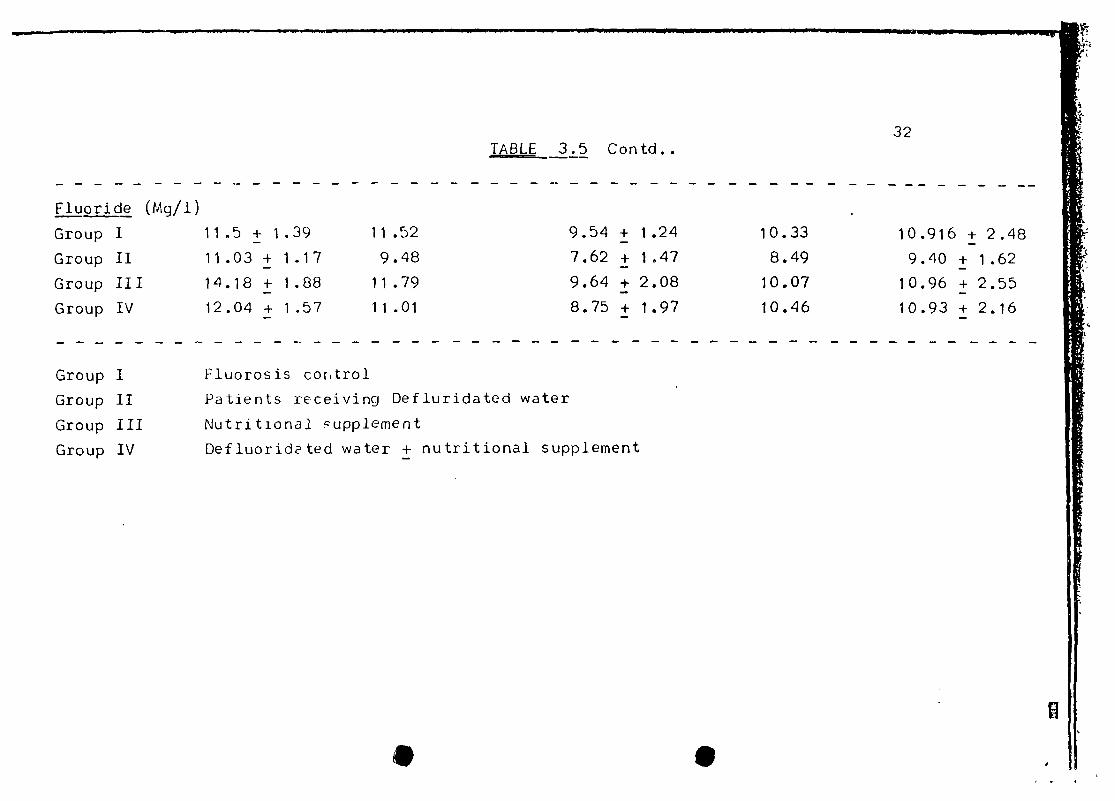
TABLE 3.5 Contd..32
L.
[~yoride (Mg/I)
Group I
Group II
Group III
Group IV
Group
Group
Group
Group
I
II
“I
IV
11.5 ~ 1.39
11.03 ±1.17
14.18 ±1.88
12.04 + 1.57
11 .52
9.48
11.79
11 .01
9.54 ~ 1.24
7.62 ±1.47
9.64 ±2.08
8.75 + 1.97
10.33
8.49
10.07
10.46
10.916 ±2.48
9.40 ±1.62
10.96 ±2.55
10.93 ~ 2.16
Fluorosis cor1trol
Patients receiving Defluridated water
Nutritional ~uppIement
Defluorid.?ted water + nutritional supplement
I I
33.
The changes in the biochemical profiles of
calcium, fluoride and alkaline phosphatase are ~also
discernable in individual patients of different age
groups when compared to values of normal individuals
of Nacharam. Variations in salient biochemical
parameters in individual patients of different age
groups compared to normal individuals of Nacharam
are shown in Tables 3.6 — 3.9.
3.5 OBSERVATIONSOF SERUM FLUORIDE DATA:
The data reveales that the subjects receiving
the defluoridated water or nutritional supplement or
both have serum fluoride levels gradually reducing
from a maximum of 0.6 ppm to 0.08 ppm over a period
of 12 months. The reduction is maximum in the
subjects receiving both defluoridated water and
nutritional supplements. The variations though
not uniform, are observed in all age groups. Maximum
initial concentration of 0.6 ppm and maximum reduc-
tion of 0.3 ppm could be seen in subjects of
Batlapalli village who were previously exposed in
highest levels of fluoride in drinking water. Maximum
reduction in the fluoride content of serum is also
seen in all the villages in the subjects over
18 years (18+). -
The reduced F concentration in serum samples
is invariably more than the maximum concentration of
0.06 ppm. in the samples of non—endemic area of
Nacharam. These observations point out important
messageviz.
34.
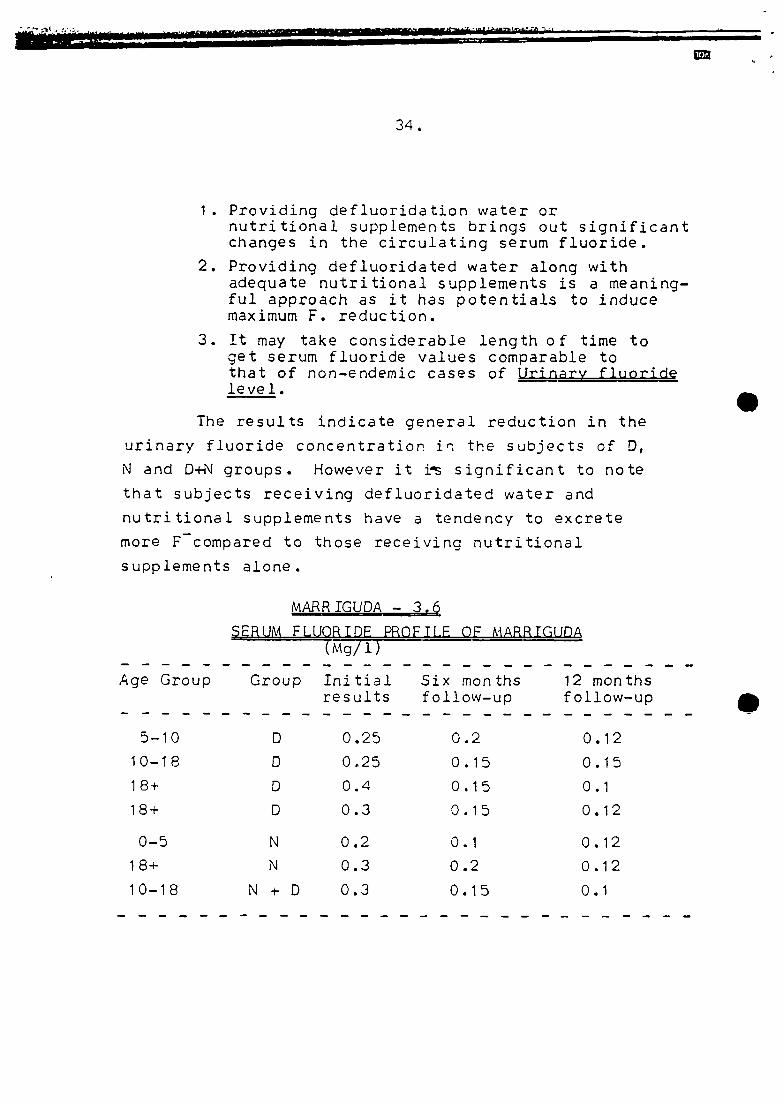
1 . Providing defluoridation water ornutritional supplements brings out significantchanges in the circulating serum fluoride.
2. Providing defluoridated water along withadequate nutritional supplements is a meaning-ful approach as it has potentials to inducemaximum F. reduction.
3. It may take considerable length of time toget serum fluoride values comparable tothat of non—endemic cases of Urinary fluoridelevel.
The results indicate general reduction in the
urinary fluoride concentration jr~ the subjects of 0,
N and 0-i-N groups. However it i’s significant to note
that subjects receiving defluoridated water and
nutritional supplements have a tendency to excrete
more Fcompared to those receiving nutritional
supplements alone.
MARRIGUDA— 3.6
SERUMFLUORIDE PROFILE OF MARRIGUDA(Mg/i)
Age Group Group Initial Six months 12 monthsresults follow—up follow—up
5—10 0 0.25 0.2 0.12
10—18 0 0.25 0.15 0.15
18+ 0 0.4 0.15 0.1
18+ 0 0.3 0.15 0.12
0—5 N 0.2 0.1 0.12
18+ N 0.3 0.2 0.12
10—18 N + 0 0.3 0.15 0.1

35.
TABLE — 3.8
NORMAL VALUES OF NACHARAM
Parameter. No rrnal values of the a~e:qr0u2
0—5 5—10 10—18 18+
Serumfluoride (Mg/i)
Urine Fluoride(Mg/i)
0.04 0.06 0.05 0.06
URINARY FLUORIDE
Age group Group
TABLE — 3.7
EXCRETION
(Mg/i)
Initialres ults
OF PATIENTS IN MARRIGUDA
.
Six monthsfol low—up
12 monthsfollow—up
18+ D 4.0 3.0 7.0
0—5 N 2.0 6.6 9.2
5—10 N 5.0 11.2 17.0
10—18 N 2.8 2.0 7.0
18-i- N 6.1 2.4 2.0
5—10 N + 0 1.5 3.0 16.0
10—18 N -i- D 1.1 2.0 6.5
18-i- N + 0 3.4 2.4 1.4
0.8 0.9 1.1 1.4

- -,. ~‘... - f..-
1 0—18
18+
5—10
10—18
1 8-i-
0—5
5—10
1 8+
0
0
N
N
N
N +D
N÷D
N +D
Initialresults
0.1
0.15
0.2
0.15
0.1
0.2
0.15
0.2
Six monthsfollow—up
0.08
0.08
0.12
0.1
0.1
0.12
0.15
0.15
12 monthsfollow—up
0.06
0.06
0.1
0.08
0.8
0.11
0.1
0.1
TABLE — 3.10
URINARY FLUORIDE EXCRETION(~Ti)
36.
TABLE — 3.9
SERUM FLUORIDE PROFILEfl~g7rY
Age group Group
OF VATTIPALLY
OF PATIENTS IN VATTIPALLY
10—18 D 10.0 9.8 11.2
18+ D 11.0 1.0.6 12.8
5—10 N 6.8 7.2 10.8
10—18
18+
N
N
7.6
5.0
7.4
5.6
10.4
7.6
0—5 N i- D 9.2 9.8 11.2
5—10 N + 0 6.8 6.8 7.8
18-i- N + 0 6.0 7.0 8.4

37
0—5
5—10
1 8+
10—18
0—5
5—10
10—18
N
N
N
D
N+ 0
N +D
N-i-D
Initialresults
0.2
0.2
0.2
0.35
0.15
0.15
0.40
Six monthsfollow—up
0.15
0.10
0.15
0.25
0.10
0.15
0.25
12 monthsfollow.up
0.10
0.10
0.10
0.25
0.1
0.15
TABLE - 3.11
SERUM FLUORIDE PROFILE OF SIVANNAGUDEM(mg/i) —
Age group Group
URINARY
0
TABLE — 3.12
FLUORIDE EXCRETION OF PATIENTS IN SHIVANNAGUDEMTmg7ir
0—5 N 5.0 7.5 10.0
0—5 N 3.5 12.5 14.0
5—10 N 9.3 12.0 13.0
18-i- N 9.0 22.0 24.0
18-i- D 8.0 14.0 18.0
18-i- D 4.0 31.0 28.0
5—10 N ÷0 4.0 7.5 10.6
5—10 N + 0 4.0 19.0 22.0
10—18 N + D 4.2 8.0 10.0
10—1.8 N + 0 4.2 17.0 20.0
38.
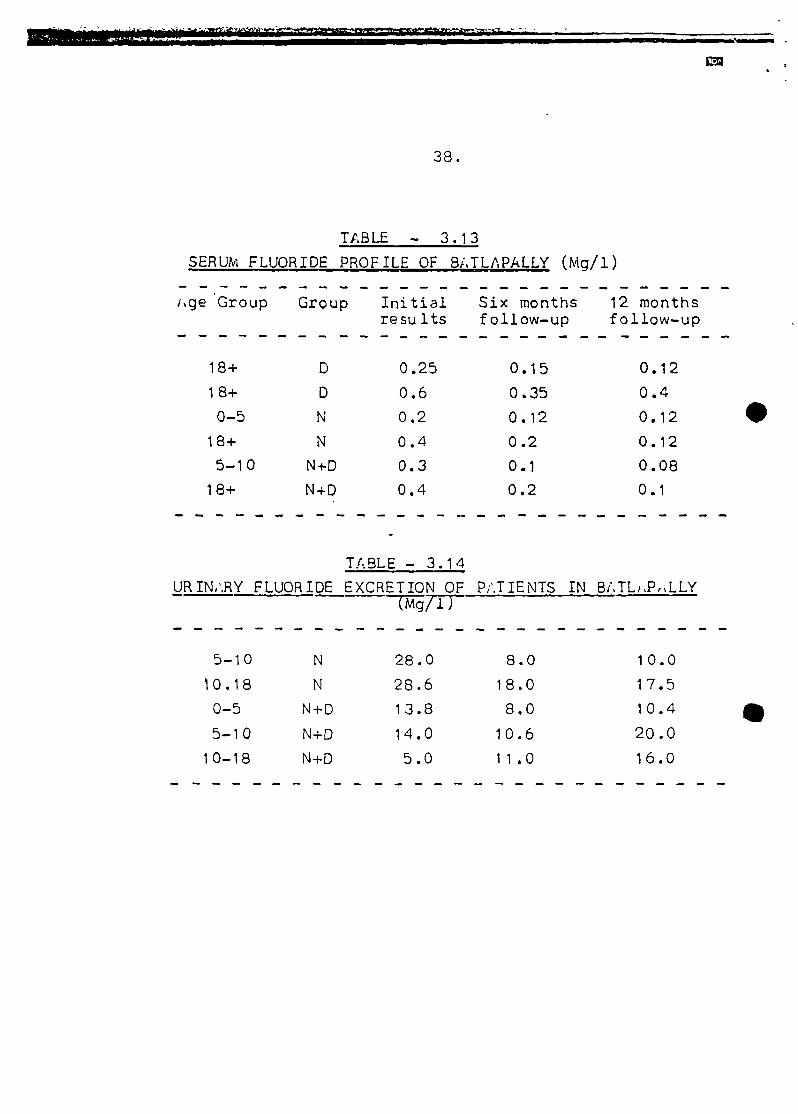
TABLE — 3.13
SERUMFLUORIDE PROFILE OF BATLAPALLY (Mg/i)
e~ge Group Group Initial Six monthsresults follow—up
18+ D 0.25 0.15
18+ D 0.6 0.35
0—5 N 0.2 0.12
18+ N 0.4 0.2
5—10 N-i-D 0.3 0.1
18+ N+D 0.4 0.2
TABLE — 3.14
URIN1.RY FLUORIDE EXCRETION OF
12 monthsfollow—up
0.12
0.4
0.12
0.12
0.08
0.1
PATIENTS IN B/.TL~.P~~LLY(Mg/I)
5—10 N 28.0 8.0 10.0
~I0.18 N 28.6 18.0 17.5
0—5 N+D 13.8 8.0 10.4
5—10 N÷D 14.0 10.6 20.0
10—18 N+D 5.0 11.0 16.0
S

39 4
3.6 SERUM AND URINARY CALCIUM LEVELS:
The data on serum and urinary calcium levels
of some of the subjects on the four villages are
presented in Table 3.1~ to 3.23. The d~t~ indicate
that the calcium levels in the serum substantially
. increased in subjects of all th~ age gr~up5 receiv-
ing nutritional supplements alone or in combination
with defluoridated water. But those receiving
deflucrjdated water alone have not registered any
increase in serum fluoride level. In the case of
urine, significant decrease in urine concentration
is evident in all the groups. However the reduc-
tion in urine calcium concentration is more in
the subjects receiving nutritional supplements either
alone or combined with defluoridated water compared
to only defluoridated water group.
TABLE — 3.15
O SERUMCALCIUM PROFILE OF MARRIGUDA:
Age—group Group. Initial Six months 12 monthsresults follow—up follow—up
0—5 N 13.0 13.0 13.2
5—10 N 6.0 8.4 10.0
10—18 N 11.0 12.8 14.0
18+ N 11.0 12.0 12.8
5—10 N+D 10.0 11.4 12.0
10—18 N-i-0 11.0 12.0 13.0
18+ N+D 8.8 8.8 10.6
18-i- N-i-D 11.6 13.6 14.0

40.
TABLE — 3.16 -
URINARY CALCIUM EXCRETION OF PATIENTS IN WLARRIGUDA________— cMg%)
Age group Group — Initial — Six months 12 monthsresults follow—up follow—up
0—5 N 10.4 9.0 8.2
10—18 N 7.6 4.0 4.0
18+ N 12.0 9.0 7.2
18+ N 21.5 10.0 3.0
5—10 0 9.0 7.2
TABLE — 3.18
URINARY CALCIUM EXCRETION OR PATIENTS IN VATTIPALLI (Mg%)
1 0—18 0 12.0 11.6 10.8
18+ 0 11.5 11.0 10.0
1 0—18 N 11.5 10.8 9.8
5—10 N 11.0 10.5 9.8
1 8÷ N 10.4 9.6 8.6
0—5 N + D 10.0 9,2 8.6
5—10 N ÷0 11.0 10.4 . 9.0
TABLE — 3.17
SERUMCALCIUM PROFILE OF VATTIPALLI(Mg %)
Group Initial Six months 12 monthsresults follow—up follow—up
Age group
1 0—18
18+
5—10
10—18
18+
0—5
5—10
D
D
N
N
N
N+D
N-i-D
7.0
8.5
8.0
8.6
9.0
10.0
9.0
7.2
8.9
9.2
9.4
9.8
11 .0
9.8
7.8
9.2
10.4
10.8
11 .0
11 .5
11.0

TABLE — 3.19
Parame ter
Serum Calcium(mg %)
Urine Calcium(mg %)
Mean values of age group
0—5 5—10 10—18 18+
1 0.5 1 0.0 9.6 9.2
1 0.2 1 0.8 10.2 9.8
41
NACHARAM CONTROL GROUPCALCIUM CONC. ~_SERUM & URINE
TABLE — 3.20
SERUMCALCIUM PROFILE OF SHIVANNAGUDEM(Mg %)
Initial Six monthsfollow—up
12 monthsresults follow—up
.
Age Group Group
0—S N 13.2 14.2 15.0
0—5 N 12.8 13.0 13.6
5—10 N 11.6 12.0 13.4
10—18 N 9.6 10.6 11.0
0—5 D + N 10.0 11.2 12.0
5—10 0 + N 10.0 11.8 12.4
10—18 0 + N 8.0 10.0 11.0
10—18 D + N 12.4 13.2 13.8
18-i- 0 + N 12.0 12.6 13.0
18-i- 0 + N 9.6 10.2 10.8
TABLE — 3.21
URINARY CALCIUM EXCRETIONOF PATIENTS IN SHIVANNAGUDEM(mg%)
5—105—10
10—1818+
5—105—10
10—1818+
NNNN
0-i-N0-i-N0-i-N0-i-N
15.013.012.011.012.018.012.014.0
12.8 11.010.2 9.65.6 4.08.6 8.08.6 9.07.8 7.0
10.0 10.09.6 9.0

42.
TABLE — 3.23
URINARY CALCIUM EXCRETION OF PATIENTS IN BATLAPALLY (mg%)
Age Group Group Initial Six months 12 monthsresults follow—up follow—up
0—5 N 9.0 8.0 7.4
5—10 0 16.4 9.0 7.6
18÷ 0 17.0 12.2 11.6
0—5 N+D 16.0 10.4 9.6
10—18 N+D 9.8 3.4 4.0
18-i- N+D 11.0 10.0 9.4
TABLE—3.22
SERUMCALCIUM PROFILE OF BATLAPALLY (Mg %)
Age Group — Group — Initial Six months 12 monthsresults follow—up follow—up
0—5 N 7.2 9.6 10.4’
10—18 N 7.0 9.4 10.0
18+ NJ 5.6 10.0 11.0
10—18 0 5.4 6.6 6.0
5—10 N+D 7.0 11.2 11.8
10—18 N+D 6.4 8.6 9.6
10—18 N+D 6.6 10.0 10.8
18-i- N+D 7.8 10.0 11.6
43.
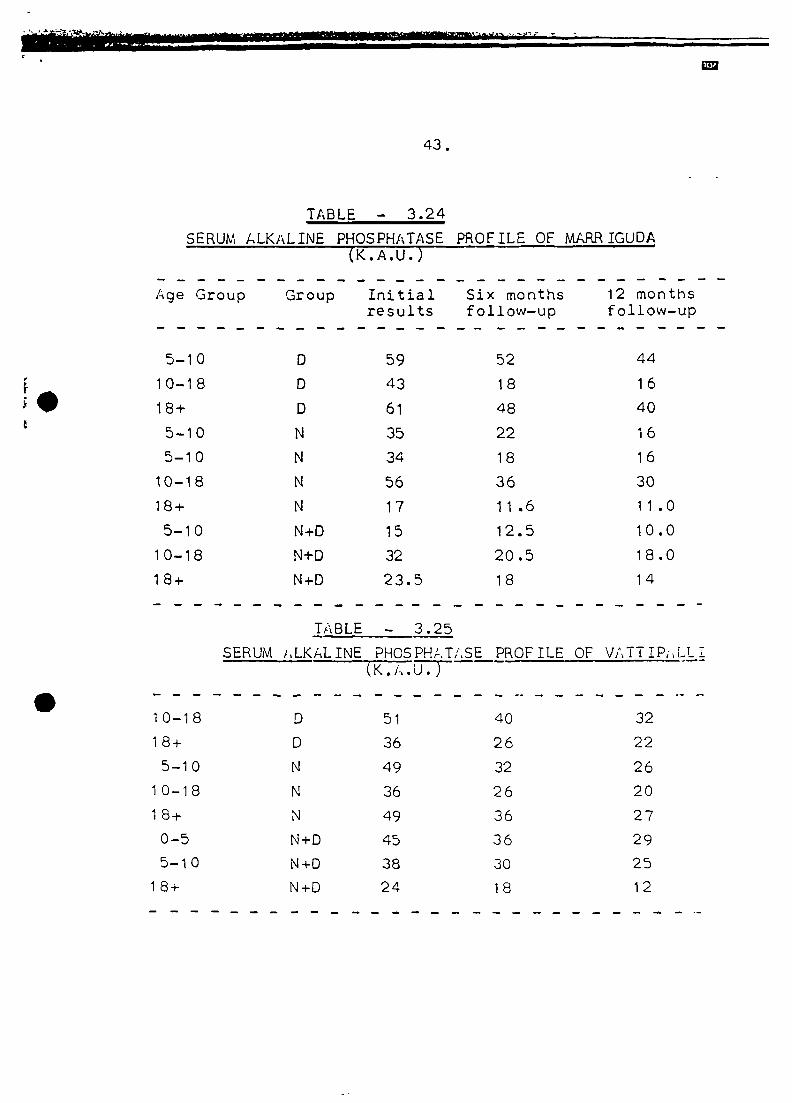
TABLE — 3.24
SERUM ALK/\LINE PHOSPHATASE
(K.A.u.)
Age Group Group Initialresults
PROFILE OF MARSIGUDA
Six monthsfollow—up
12 monthsfollow—up
5—10 0 59 52 4410—18 D 43 18 16
18-i- D 61 48 40
5—10 N 35 22 16
5—10 N 34 18 16
10—18 N 56 36 30
18÷ N 17 11.6 11.0
5—10 N+D 15 12.5 10.0
10—18 N+D 32 20.5 18.0
18+ N+D 23.5 18 14
.
TABLE
SERUMi.LKALINE
— 3.25
PHOSPHAT/.SE PROFILE(K.f-..u. )
OF VATTIP.-~LLI
10—18 0 51 40 3218÷ D 36 26 22
5—10 N 49 32 26
10—18 N 36 26 20
18-i- N 49 36 27
0—5 N+D 45 36 29
5—10 N+D 38 30 25
18+ N+D 24 18 12

44.
3.7 SERUM ALKALINE PHOSPHATASE:
The data of serum alkaline phosphase has been
presented in Tables 3.24 to 3.28.
It will be seen from the results that there has
been significant reduction in the alkaline phosphatase
values in all the age groups and indeferent cjroups of
study, after intervention. However the values are
far higher than the norma]. values recorded for persons
of Nacharam.
TABLE — 3.26
SERUMALKALINE PHOSPHALASEPROFILE OF SHIVANNAGUDEM(K.A.U.)
Six monthsfollow—up
12 monthsfollow—up
Age Group Group InitialRes ults
0—5 N 31.5 24.0 20.0
0—S N 39.25 34.0 18.0
5—10 N 31 .5 28.0 22.0
10—18 N 39.7 30.0 22.0
18+ N 16.0 14.0 11.0
0—5 N-i-D 26.0 20.0 16.0
5—10 N+D 29.0 20.0 14.0
5—10 N+D 33.0 30.0 24.0
10—18 N+D 21.0 20.0 16.0
10—18 N+D 31.0 22.0 18.0
18-i- N-i-D 16.0 10.0 9.0
18+ N-i-D 23.0 10.0 16.0

5—10
18+
0—5
5—10
10—1 8
18+
0—5
5—10
1 0—18
1 8÷
0
0
N
N
N
N
N +0
N +0
N +D
NJ-s-D
Initialresults
40.0
12.0
63.6
44.0
28.0
12.0
31 .0
25.0
33.0
48.0
Six monthsfollow—up
24.0
10.2
48.0
22.0
18.0
9.6
24.0
20.0
28.0
36.0
12 monthsfollow—up
20.0
9.6
34.0
16.0
14.0
8.0
20.0
16.0
20.0
24.0
TABLE — 3.28
. MEAN SERUM
Age Group
0—5
5—1 010—18
NACHARAM SUBJECTS
ALKALINE PHOSPHi.TI-.SE ACTIV ITY
Serum Alkaline PhosphataseK.A.U. (Units)
15
16
18.5
_____ -~ --~-
45.
TABLE — 3.27
SERUMALKALINE PHOSPHATASEPROFILE OF BATLAPALLYt~.A.U.)
Age Group Group
1 8+ 20.5

-- ------•~- —..-—..-.--. ~ -
46.
3.8 RESULTS OF CLINICI1L EXAMINATIONS AFTER INTERVENTION:
The results of clinical and radiological
examinations after intervention are tabulated and
presented in Tables 3.29 to 3.44.
It will be observed from the results that
patients of control group continued to suffer from
all the symptoms found initially. -
There has been ~significant improvement in the
physical disabilities experienced by the subjects on
receiving nutritional supplements alone or in combina-
tion with def1~~~rjdated water. In the case of
patients receiving defluorjdated water alone, they
were relieved of vague body pains but the joint
pains persisted.
Maximum relief could be observed in the
subjects of Marriguda and Vattipalli Villages and
minimum in patients of Batlapalli Village.
The results suggest that some of the symptoms
experienced by the people can be attributable to
malnutrition.
3.9 RESULTS_OF Ri-~DIOLOGICAL EXAM INAT ION:
Findings .of radiological examination reveal
no change in the radiological profiles in some cases
and slight changes in others. The changes include
1. Little regression in coarse tra~Diculation pattern.
2. Decreased periosteal new bone formations.
3. Decreased Osteosclerosis and 4. Decreased ossifica-
tion of inter~seous membrane.

ST~~BLE— 3.29
CONTROLGROUP MhRRIGUD/-~
c~ Initia
\O. 0—5 5—10 10—18 18+ M F Clinical Radiological
feature feature
Final
Clinical Radiological
6 5 1 Bcdy Aches,BEck ache,Arthialgia,stiffness.
Moderate:— Incre-ased Bone densityOs teosclelos is1Irrigular perios—teal bone formationcalcification ofInterosseouS memb-rane, coarse tra—biculation.
Complains ofBackache andstiffness,Ar thralgia.
No change
9 9 Generalised Crippled:— Increa—Body pains, sed bone densityBackache, OsteosCle1~3lsstiffness, coarse trabicula—s~’ielling of tion, irregularjcints, limi— periosteal bonetation of move— formation, calci—ments r~gidity fication of Inte—of the spine rosseous membraneand numbness. thic~ened, exostosis
OsteophytosiS, de-formed bone.
Complain5 of No changestiffness, swell-ing of joints.No change inlimitation move-ments, rigidityof the spine, slightimproVemefl --
in numbness.
47.
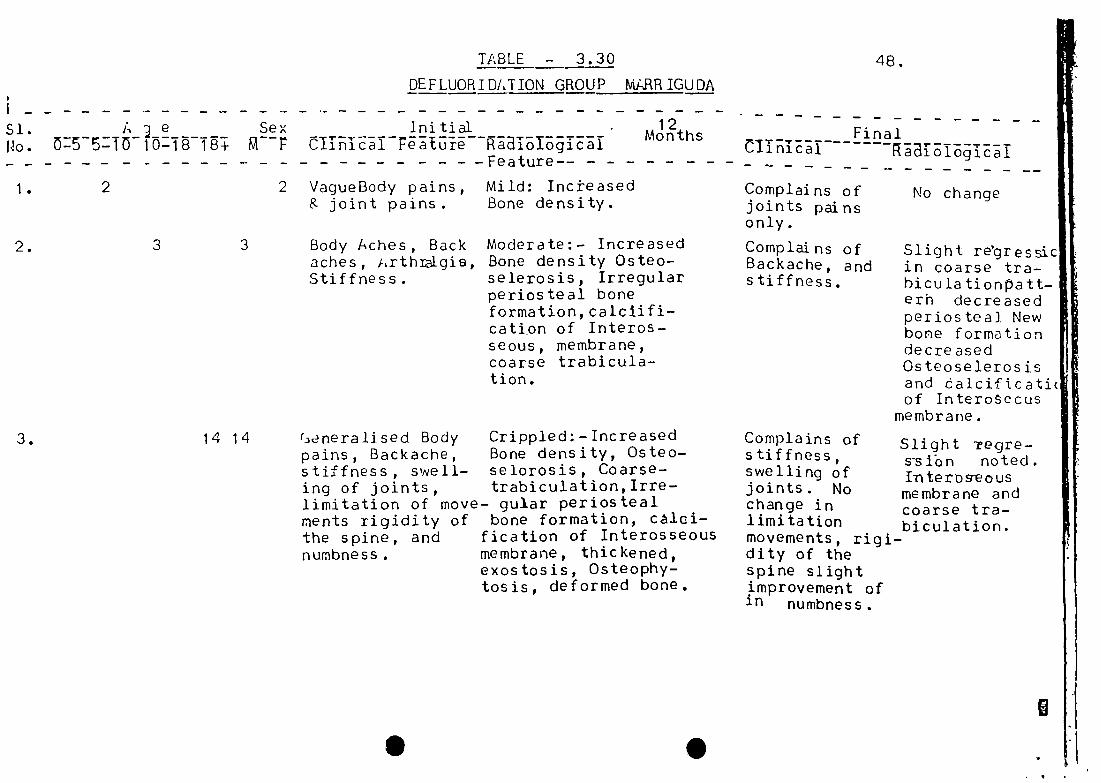
TABLE — 3.30
DEFLUORID/JION_GROUP__MARRIGUDA
48.
2 VagueBody pains,8- joint pains.
Body Aches, Backaches, i~rthi~lgia,Stiffness.
1~neralised Bodypains, Backache,stiffness, swell-ing of joints,limitation of movements rigidity ofthe spine, andnumbness.
Mild: IncteasedBone density.
Moderate:— IncreasedBone density Osteo—selerosis, Irregularperiosteal boneformation, caiclifi—cation of Interos—seous, membrane,coarse trabicula—tion.
Crippled: — IncreasedBone density, Osteo—selorosis, Coarse—trabiculat ion, Irre—
— gular periostealbone formation, calci-
fication of Interosseousmembrane, thickened,exostosis, Osteophy—tosis, deformed bone.
Complains ofjoints painsonly.
Complains ofBackache, andstiffness.
Complains ofstiffness,swelling ofjoints. Nochange inlimitationmovements, rigi-dity of thespine slightImprovement ofin numbness.
No change
Slight re~ressic~in coarse tra—hiculationpa-tt—erh decreasedperiosteal Newbone form~tjondecreasedOsteoseleros isand L~alcificatiof Intero~ecus
membrane.
Slight Treçjre—ssion noted.Iriteroseousmembrane andcoarse tra—biculation.
Initial 12— MonthsClinicaT Feature Ra~ioIogical
Feature
Si. A ~ e Sex~. ~:5:TO1O:T~T~ ~
2
3 3
14 14
Final~linicaT
B
S .

S T~BLE - 3.31
NUTRITION GROUP MARRIGUDA
. 49.
i’~ 9e -— Sexo—~~—iO 1~—T8T8÷ M F
Initial~Ii~i1TgaI6I6~iE~I Months
fetures
VagueBody pains‘& joint pains
3 1 Bodyaches,backachE ,Arthx~gia,stiffness
12 8 4 GEneralised bodypains, backaches
stiffness, swell-ing of joints,limitation of movements~ regidityof the spine andnumbness.
Mild increasedbone density
Moderate: —Incre-ased bone densityOs teoseleros is,irregular perio—steal bone forma-tion ca~.Lcifica—tion of iriterosseous—— membrane, coarsetrabiculation.
Crippled: —Increasedbone density, Osteo—sclerosis, coarsetrabiculation, irre—
— gular periostealbnne formation, calc-
ification of inu~—rosseous membranethic.keneçi,exostosiS,Ostephytosis ,deformedbone.
Mod~rate impro—
vem.~t
No ~ompiai nts No changeof ~ody painsand joint pains.
SliQht reç~re—.sslo-n in coarsc~trabiculationpetter -~ de—creased perio-steal — newbone forma-tion, decrea-sed Osteos~ le-~rosis and osi—fication ofin~erosseousmemtrane.
No ~omplains of Slight re-gre.boc, pains and ssIo~ notedba~ache5, re— intrasiousduc~i0~ of membrane andS ~ ,slight coarse trabiCh~ges in limi— culation.ta~10~of move—melts, no comp—~~IS of numbness.
SI.No.
1. 2
1
1 1 Mal- Nutrition
12
4
— Finalci. nic aai~I6~iE~T
No ~omplainsof body aches& b.Ickaches,red1~t~0~ofStIr~fness
B
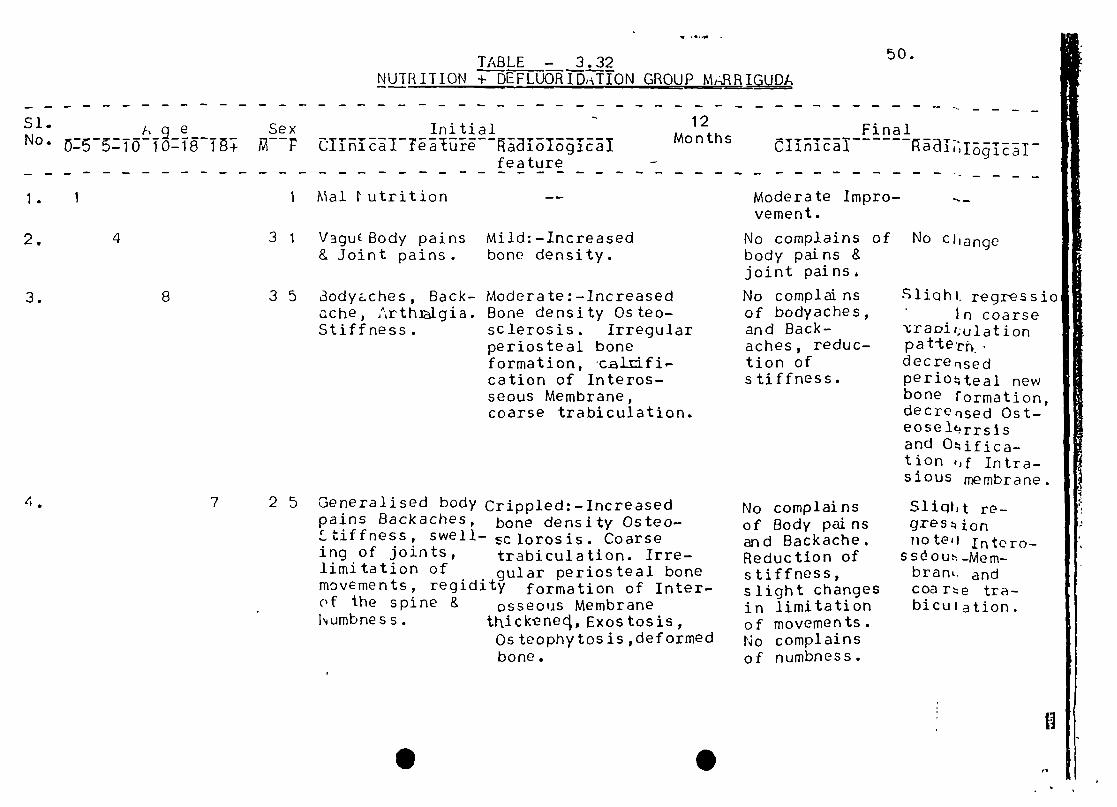
50.TABLE__— 3.32NUTR ITT ON ~E F LUO~Th,~TTONGROUP MARS IGUDA
1 Mal 1’ utrit ion
3 1 V3guE Body pains& Joint pains.
3 5 3ody~ches, Back—cche, Arthi&gia.Stiffness.
Mild: —Increasedbone density.
Moderate: —increasedBone density Osteo—sclerosis. Irregularperiosteal boneformation, calr:ifi—cation of Interos—seous Membrane,coarse trabiculation.
Moderate Impro-vement.
No complains ofbody pains &joint pains~
No complainsof bodyaches,and Back-aches, reduc-tion ofstiffness.
No complainsof Body pal nsand Backache.Reduction ofstiffness,slight changesin limitationof movements.No complainsof numbness.
Sli~hi. regressio~
In coarsetraoi ‘;ulat ionpa t-te~1-~.decreq5~~perjo~tea1 newbone formation,decroq~~~Ost—eose
1~rrslsand °~ifica—tiori f Intra—S~OU5 membrane.
Slight re—gres ~note4l Intoro—
SSëOU~-.Me m—bran&. andcoar~e tra—bicu I ation.
SI.No.
1. 1
4
8
Sex Initial 121F ~ Months
feature -
Final~Ii~E~I
No change
7 2 5 Generalised body Crippled:—Increasedpains Backaches, bone density Osteo—~tiffness, swell— sclorosi5. Coarseing of joints, trabiculation. Irre—limitation of gular periosteal bonemovements, regidity formation of Inter—c’f the spine & osseo’js MembraneI~umbness. ti~ickonec~,Exostosis,
Os teophytosis ,deformedbone.
1.
S .

S STABLE — 3.33
CONTROLGROUP—VATTIPALLY
Si~ A e Sex Initial 6 Final
No. ~:55:Tr~ T~—TBT~MP cTT~3:c~IFea~ure~ ~aaioTogi~ai months ~aaioI~rc~ CIfl~i~I
Features
1.
2.
3.
2 2 GeneralisedBody pains,backache,stiffness,sv~elling ofjoir.ts, limi-tation of
movE~rnentS.Reridity ofthe spineand numbness.
Crippled: — IncreasedBone density Osteo—sclerosis coarsetrabiculat ionIrregular perlo—steal bone forma-tion, calcificationof Interosseousmembrane thickened,exostosis, osteo—phytosis, deformedbone.
Complaints ofstiffness,swelling ofjoints, Nochange inlimitationmovements,Regidity ofthe Spine,slightimp rove tsand numbness.
51
4. No change

TABLE — 3.34 52.
DEFLUORIDATION GROUP - VATTIPALLY
Vague Body pains,and joint pains.
5 4 1 ~eneralised Bodypains, Backache,Stiffness ,Swell—ing cf Joints,limitation ofmovenents.Regic’ity of thespi.nc andnurrbness.
Mild: — IncreasedBone density.
Crippled: —IncreasedBone densityOs teos c leros iscoarse trabicula—tion — Irregularperiosteal boneformation, cal-cification ofIn teros S eousmembrane thick-ened, exostosisosteophytosis,deformed bone.
No change Complaints ofJoint painsonly.
Cornplai ntsof stiffness,swelllnq ofjoints, Nochange inlimitationmovements,Regidity ofthe spine,slightimprovementin numbness.
SI. A9eNo. 0—b 5—10 10—18 18÷ M F Clinical feature
1.
Sex Initial
2.
3.
4.
6 - FinalRadiological months Radiological Clinicalfeature
Slight re-gressionnotedIriteros s-~ousmembrane andcoarsetrabi cu—lation.
. .B

TABLE — 3.35W NUTRITION GROUP - VA1TIP~LY
SI. A9e0—5 5—10 10—18 18+ M F
Initialad~6~i~T 6
FEatures Features months
FinalRI31~I~ ~1i ~I~T
3
2
1 2 Vague Bodypains, andjoint pains.
1 1 Bodyaches,b:r1~ache,C t~ ffi esst~rthraigia.
Mild: —IncreasedBone density.
Moderate: —IncreasedBone density Osteosc—lerosis, Irregularperios teal bone forma-tion calcification ofInterosseous membrane,coarse trabeculatlon.
No change
Slight regre-SSion incoarse tra~—culation—pettrindecreasedperios tealNew bcneforma tiondecreased osteo—sclerosis andosification ofIn teros s.~ous
Complaints ofjoint painsonly.Complaints ofBackacheand stiff-ness.
membrane.
Slight regre-ssion noted
In e:osSeou~mumbrano 3ndcoerse trabi—cu) tien.
Complaints ofstiffness ,sv~elling of joints,No change inlimi1~aticr Li
mcvc. me r~RC-qiaiiy of thospinC, si ic;hi,
rn.-c,\’ern~-rr in~tjrpb~-~sc
53.
4 3 1 Generalised Body Crippled:—Increasedpains. Backache, Bone density Osteosc—s.~iffness, S”ieil— lerosis coarse trahecu—incj of joints, Jation, Irregular perio—]iii~ation 01 steal bone formation;mov~men~s, Regidity cE’lcificatir~n ofof the spinL and interosseous memhrac~o
thickc.~ed, C X’jSO S
os~cophytos:s i~c~ri1~d
B

TABLE — ~ 54.NUTRITION+DEFLUORIDATION GROUP - VATTIPALLY
)l. 610. 0—5 5—10 10—18 18+ M F Clinical feature Radiological
feature
3 1 2 Vague Body pains,and joint pains.
Mild: IncreasedBone density.
No change No complair~ts ofBody palms andjoint pains.
4 3 1 Generalised Bodypains, Backache,~tiffn�ss, Swell-ing of Joints,limitation of
1.1cvements.Regidity of theSpine Endnumbness.
Crippled: —Increa-sed Bone density,Os teoscieros iscoarse, trabicula—tion, Irregularperlos teal boneformation, cal-cification ofIn terosseousmembrane thick-ened, exostosis,asteophy tos is,deformed bone.
Slightregress ionnoted Intero—~seousmembraneand coarsetrabicula—tion.
No complaintsof Bodypainsand Backache,Reduction ofstiffness, slightchanges inlimitation ofmovements. Nocomplaints ofnumbness.
B
4
MonthsFinal
R I51~I~ ~H~I~T
. .
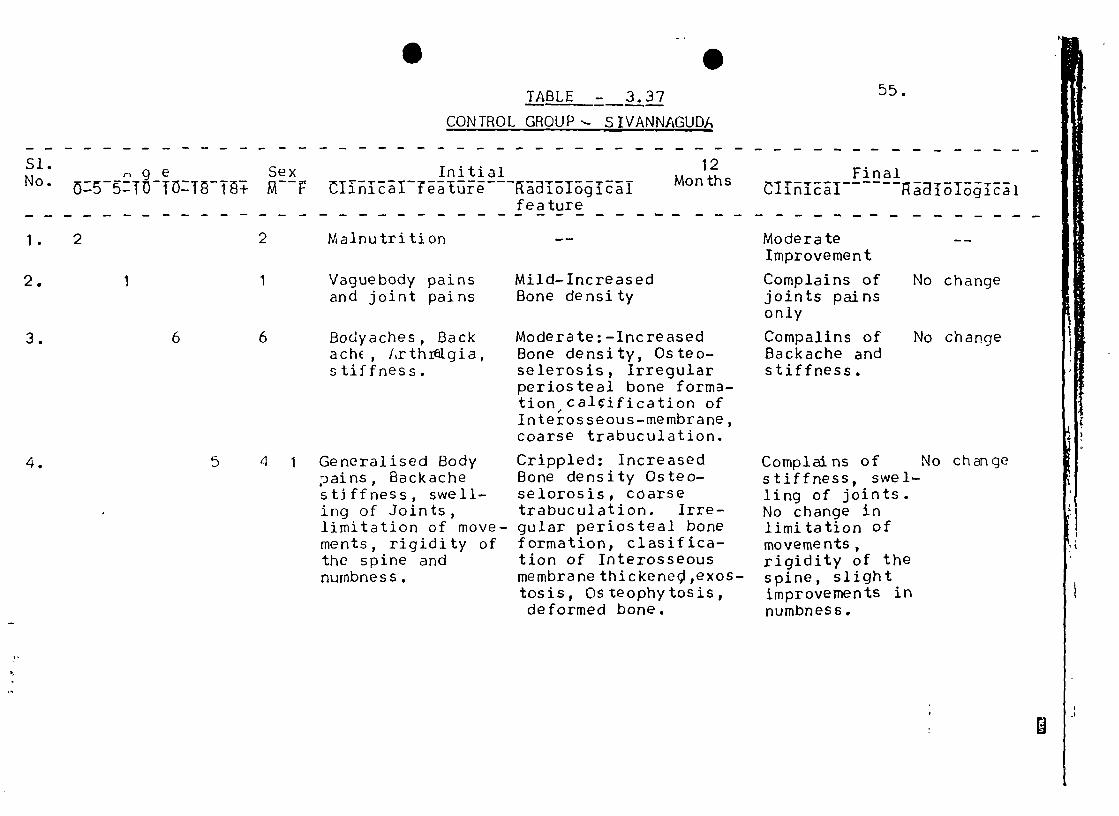
STABLE — 3.37
S
CONTROLGROUP’.- SIVANNAGUDA
55.
~ge SexO:5:TOTO:T~T~ M~F
Initial~Iin~aI T~~Eure a2i~I6~ic~I
12 FinalMonths ~iTnic Ri6I6~IE~i
feature
2 Malnutrition
1 Vaguebody painsand joint pains
6 Bodyaches, Backach� , /~rthreIgia,stiffness.
5 4 1 Generalised Body2ains, Backachestiffness, swell-ing of Joints,limitation of move-ments, rigidity ofthe spine andnumbness.
Mild—IncreasedBone density
Moderate: —IncreasedBone density, Osteo—selerosis, Irregularperiosteal bone forma—tionca]-cification ofInterosseous—membrane,coarse trabuculation.
Crippled: IncreasedBone density Osteo—selorosis, cciarsetrabuculation. Irre-gular periosteal boneformation, clasifica—tion of Interosseousmembrane thickened ,exos—tosis, Osteophytosis,deformed bone.
ModerateImprovement
Complains of No changejoints painsonly
Compalins of No changeBackache andstiffness.
Complains ofstiffness, swel—ling of joints.No change inlimitation ofmovements,rigidity of thespine, slightimprovements innumbness.
SI.No.
1. 2
1
6
No change
F;
I
B

TABLE — 3.38
DEFLUORIDATION GROUP ~VANNI~GUDA
56.
Vaguebody pains8. joint pains.
Generalised Bodypains, Back—Ache
stiffness, Swell-ing of joints,imitation ofmovements ,Rigi—dity of the Spineand Numbness.
Mild: — Inc reasedBone density.
Moderate :—Increa—sed Bone densityOs teos~leros is.Irregular perios—teal bone forma-tion ( salcjfjca—tion of Inteross—eous—mernbrane.Coarse trabucula—tion.
Crippled: IncreasedBone density Osteo—seJ~rosis, Coarsetrabucula tion.Irregular perio—steal hone forrna—tion c.L2Lcifica—tion of InterosseOus—rnembrance , thickenec~,exostosis, Osteo—phytosiS, deformedbone.
Complains ofjoints painsonly.
Complains ofBackache andstiffness.
Complains ofStiffness,Swelling ofjoints. Nochange inlimitation ofmovements.Rigidity ofthe spine slightimprovements innumbness.
No change
Slight regress-ion in coarsetrabuculationpatterndecreased)perio—steal—New boneformation, de-creased—Os teose—lerosis andcalGificationof Inte~osSejoMSmemDrane.
Slight regre-ssion notedin teros S eous~rm~zi~mwzea n dcoarse trabucu—lation.
Si. A ~ e Sex
No. ~5~5T~ TO:T~T~,~F
4 4
7
• . 12Initial
CIiIT~~i~e a~T61~~ Monthsfeature
FinalClinical Ra0iol3~i~I
6 1 Bodyaches,Back—\che ,/.rthi~1gia,stiffness.
6 6
L
.B
.
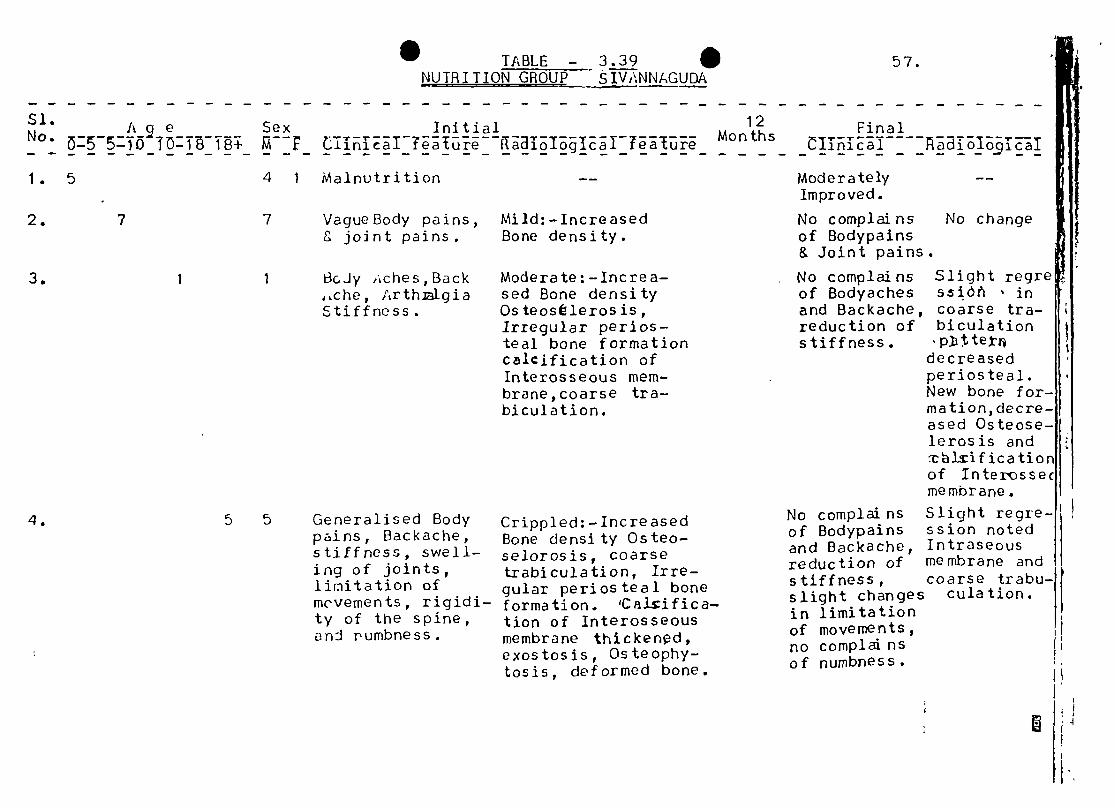
TABLE — 3.39 SNUTRITION GROUP SIVJ\NNAGUDA
Sex
4 1 Malnutrition
7 VagueBody pains,~ joint pains.
1 BcJy ~ches,Backd~che, ArthmlgiaStiffness.
5 5 Generalised Bodypains, Backache,stiffness, swell-ing of joints,limitation ofmcvements, rigidi-ty of the spine,ani rumbness.
Mild: —IncreasedBone density.
Moderate: —Increa-sed Bone densityOs teos~leros is,irregular peri.os—teal bone formationc~lcjfjcatjon ofInterosseous mem—brane,coarse tra—biculation.
Crippled: —IncreasedBone density Osteo—selorosis, coarsetrabiculation, Irre-gular perios teal boneformation. ‘Ci~J-~ifica--tion of Interosseousmembrane thickened,exostosis, Osteophy—tosis, deformed bone.
Final_C~i~i l:~ ~I~l ~5I~ IModerately
Improved.
No complains No changeof Bodypains8. Joint pains.
Slight regI’esziOñ incoarse tra—biculation•p~te~
decreasedperios teal.New bone f or—mation, decre-ased Osteose—lerosis and
~li1 f i c a t i oof Interossecmembrane.
No complains Slight regre—of Bodypains ssion notedand Backache, Intraseousreduction of membrane and Fstiffness, coarse trabu—slight changes culation. Fin limitationof movements,no complai nsof numbness.
Ft.
Si.No.
1. 5
Pt e
o:55:T~TOTWT~
7
Initial 12i~IIT~~tu aaioIo~l~ITeaEure Months
57.
No complainsof Bodyachesand Backache,reduction ofstiffness.
B

TABLE — 3.40NUTRITION + DEFLUORIDATION GROUP SHIVANNAGUDA
58
1 1 Malnutrition
5 4 1 JagueBody pai ns
and joint pains.
3 3 Bcdy /tches, Backache, Arthr~igia,S±iffness.
13 9 4 Generalised bodypains, Backache,stiffness, swell-ing of joints,limitation ofmovements, regi—dity of the spineand numbness.
Mild:lncreased 12Bone density.
Moderate :—Increa—sed Bone densityOs teosclerosis,Irregular p~rios—teal bone formation~al~.ification ofInterosseous—membrane,coarse trabuculation.
FinalCIInical ~a~I3~i~T
No complainsof Body pains No change& joint pains.
Slight regre—Ssion~.i-r~ —.
coarse tribu—culation pattern,.
decreasedperiosteal—Newbone formation,decreased Osteo—sclerosis-- andcalcjflcationof Intraseous
membrane.
Slight regress—ion noted.I n t e r 0550 o usmembrane andcoarse trabu—culation.
2
1. e Sex — — — Initial —
• ~:55:TO iT~T~i M F CIiniE~I Te~~e - ~aT3I6giEalfeature
12Months
Moderate Imp-rovement.
No complainsof Bodyaches,and Backache,reduction ofS tiffness.
No complainsof Body painsand Backache,Reduction ofstiffnessslight changesin limitationof movements.No complainsof numbness.
Crippled:—Incre—ased Bone densityOs teose toros is,Coarse trabucula—tion, irregularperios teal boneformation, colcia—sification of Inter—sseous membranethicked, exostosis,Osteophytosis, de-formed bone.
.B
S
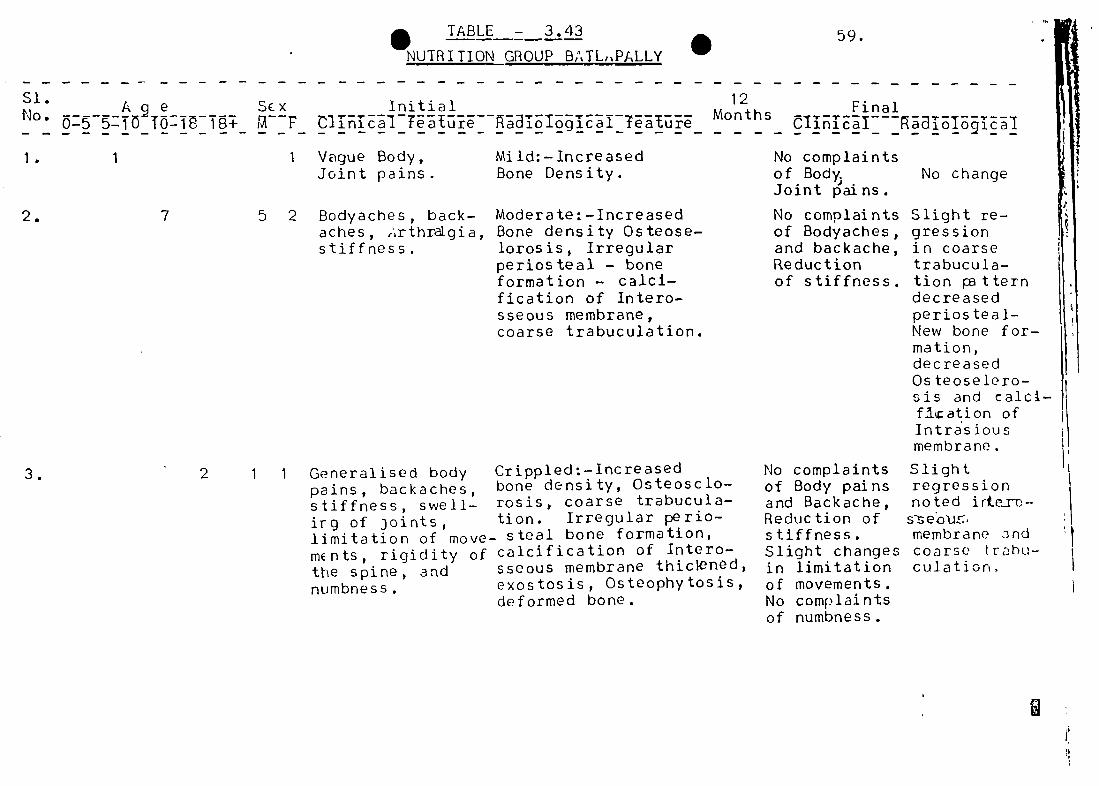
• TABLE — 3.43
NUTRI lION GROUPBATL1~PALLY59.
Initial 12 FinalMonths —ClinicalTeaEure RaaioiogicaiTea~ure Clinical ~a~ioIo91ca1
1 Vague Body,Joint pains.
No complaintsof BodyJoint pains.
No complaintsof Bodyaches,and backache,Reductionof stiffness.
No change
Slight re—gres sionin coarsetrabucu Ia—tion patterndecreasedperios teal—New bone for-mation,decreasedOs teoseloro—sis and calci—fi~ation ofIntras iou smembrane.
Si.N A ~ e S�.x_°: o:5~:TOTo:T~T~
Mild:—Increased
Bone Density.
7 5 2 Bodyaches, back— Moderate:—Increasedaches, ~~rthraIgia, Bone density Osteose—stiffness. lorosis, Irregular
perios teal — boneformation — calci-fication of Intero—sseous membrane,coarse trabuculation.
2 1 1 Generalised body Crippled:_InCreaSedpains, backaches, bone density, Osteosclo—stiffness, swell— rosis, coarse trabucula—irg of joints, tion. Irregular perio—limitation of move— steal bone formation,mEnts, rigidity of calcification of Intero—the spine, a~d sseous membrane thiclened,numbness. exostosis, Osteophytosis,
deformed bone.
No complaints Slightof Body pains regressionand Backache, noted irtaro-Reduction of s~eo1Jr~stiffness. membrane 3ndSlight changes coarse tr~hu—in limitation culatiort.of movements.No complaintsof numbness.
B

2 2 Vague Body pains,and Joint pains.
3 2 1 Body Aches, Back—ache, ,‘~rthmlgia,Stiffness.
9 8 3 Generalised Body
nins, Backache,stiffness, swell-ing of joints,limitation of move-ments. Rigidityof the spine andnumbness.
Moderate: — IncreasedBone density Osteo—sclerosis, Irregularperiosteal bone for-mation celcificationof Interosseous membrane.Coarse trabuculation.
Crippled: — IncreasedBone density Osteselo—rosis, coarse trabucu—latlon. Irregularperios teal bone forma-tion, celcification of
Interossesous membranetfticke,led,exostosjs, Osteo—
phytosis, deformed bone.
Complains of No changeJoint painsonly.
Complains of No changeBacil”ache andstiffness.
Complains of No changestiffnessswelling ofjoints, Nochange in li-mitation of move-ments, Rigi-dity of thespine, slightimprovement Innumbness.
TABLE — 3.41 60.
CONTROLGROUP - BATLAPALLY
Si~ A ~ e Sex — —— Initial —~ M th FinalNo. ~ WP rnIni~aIea~u~e ~a2ioIo9icaI T~a~ure- Ofl S ~Ii~I Ra~i~-i
Mild:—Increased Bonedensity.
.1
E1~
ii. .

• TABLE — 3.42 •DEFLUORIDATION GROUP- BATLAPALLY
Si. i~ g eNo.
Moderate: —IncreasedBone density Osteo—sclerosis, irregularperios teal bone for-mation cicificationof Interosseous—mem—brane, coarse trabu—culation.
Final~1I~iI~I i ~l~iE~I
No change
Slight regre-ssion in coarsetrabucul ati.onpattern, decreasedperiosteal Newbone formation,decreased Osteo—sclerosis andcalsificationof jnterosseouSmembrane
Complains of Slight regre-stiffness, ssjon. noteswelling of interossi-oucJoints, no membrane, andchange in coarse trabucu--limitation,of ~.ation.movements. Rigi-dity of the spine.Slight improvementin numbness.
61
Sex Initial 12MP ~lII?~~u a~i~T3~i~I Months
feature
1 Vague Body andJoint pains.
2 1 Bodyaches, Backaches ,rttthr~gia,stiffness.
1.
2. 3
3.
Mild: IncreasedBone density.
Complains ofJoint pains only.
Complains ofBackache andstiffness.
9 4 5 GeriEralised Body Crippled:—Increasedpains, Backache, Bone density Osteosc—stiffness, swell— lorosis, coarse trabu—ing of Joints, culation, Irregularlimitation of pe~iosteal bone for—mcvements, rigi— mation, calcificationdity of the spine, of Interosseous mem—and numbness. brane. Thickened exos—
tosis, Osteophytosis,deformed bone.
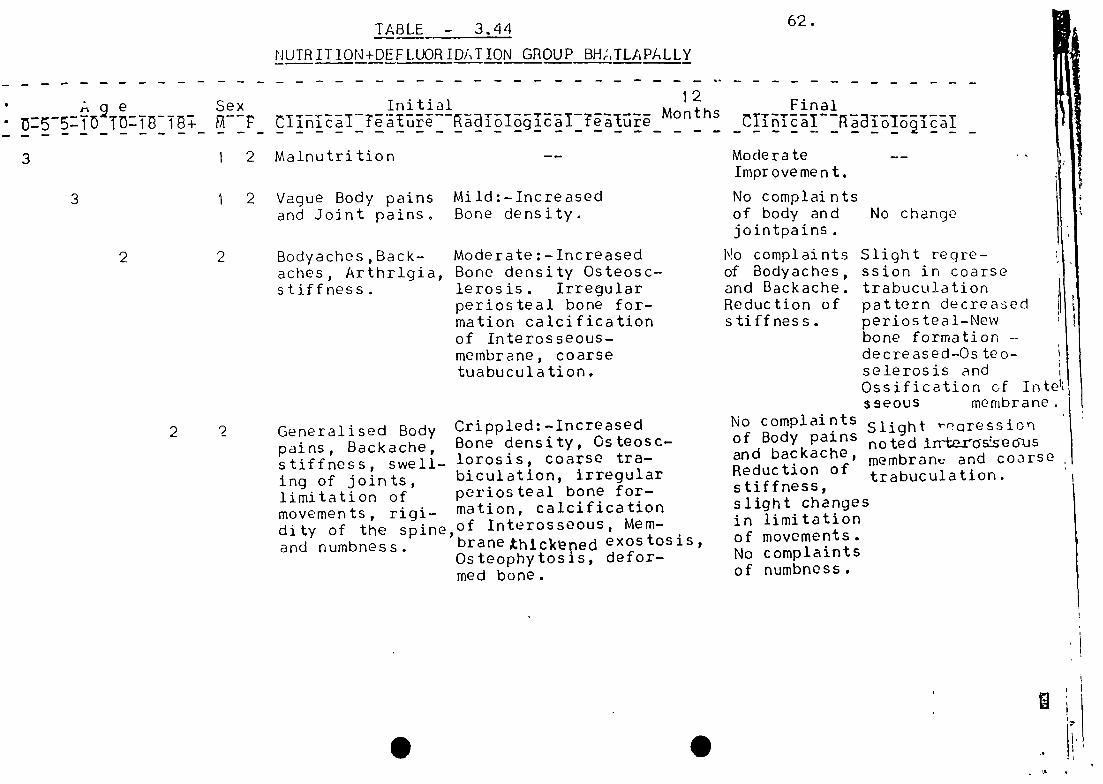
62TABLE - 3.44
NUTRITION÷DEFLUORIDATION_GROUP_BHATLAPALLY
1 2 Malnutrition
3 1 2 Vague Body painsand Joint pains.
2 2 Bodyaches,Back—aches, Arthrlgia,stiffness.
2 2 Generalised Bodypains, Backache,stiffness, swell-ing of joints,limitation ofmovements, rigi-dity of the spineand numbness.
Moderate: —IncreasedBone density Osteosc—lerosis. Irregularperiosteal bone for-mation calcificationof Interosseous—membrane, coarsetuabuculation.
Crippled: —IncreasedBone density, Osteosc—lorosis, coarse tra—biculation, irregularperios teal bone for-mation, calcificationof InterosseouS, Mem—
‘brane,thjck~ned exostosis,Osteophytosis, defor-med bone.
Moderate
Improvet.
No complaintsof body andjointpains
No change
Slight regre-ssion in coarset r a bu CU 1 a t ionpattern decreasedperiosteal—Newbone formation --
decreased—Os teo—sclerosis andOssification c-f Intosseous membrane.
A9e Sex~55T~ To:T~T~f;~—_c
Initial 12 Final~ I I~R ~I~I -
Mi ld:—IncreasedBone density.
N!o complaintsof Bodyaches,and Backache.Reduction ofs tiff ness.
No complaintsof Body pains Slight vr~areSSiOfland backache, noted IIrtarc~S~Sec~JSReduction of membrane and coarsestiffness, trabuculation.slight changesin limitationof movements.No complaintsof numbness.
I I

- - --
63.
It can be concluded from the observations
that the remobilisation of deposited fluoride is
possible and the changes of skeletal fluorosis are
reversible but the process is slow. The duration
of 12 months is too short a period to expect
substantial improvement in bone structural con-
figuration. Beneficial changes can be expected
by providing defluoridated water and nutritional
supplements. These measures will be more useful
in the period proceeding the on set of crippling
deformities.

~. - — -- - - _______________ — -~
___ __ - - _-~ -
CHA PTER — iv
SUMMARY AND CONCLUSIONS:
1 . Wc~ter borne fluorosis is prevalent in 10 States
in India. The disease is highly endemic in as many as
17 districts of Andhra Pradesh. Epidemiological inves-
tigations revealed, low nutritional status of people,
besides fluoride concentration in drinking water might
aggrevate severity of symptoms. -
A research project has been sponsored by
International development and research centre to study
the effectiveness of providing defluoridated drinking
water and nutritional supplements separately as well as
in combination in arresting the progress of fluorosis.
Four villages have been selected in Nalgonda District
so that the fluoride concentrations of drinking water
sources are in the ranges 1 .1 — 4.0, 4—1 — 8.0 and
above 8 mg/i. 72 patients have been s elected in each •village so that both sexes in the age groups 1—5, 5—10,
10—18 and above 18 years old ~re represented. Normal
persons of a village, Nacharam near Hyderabod, whose
water sources contain permissible fluoride concentra-
tion havo also been included in the study for comparison
of results. Base line data was computed on chemical
characteristics of drinking water, dietary intake of
the subjects, their clinical radiclogicai. and bio-
chemical profiles . In tervention programme was then
initiated deviding the subjects of each village into
the following groups.

- - —:-- - - —-..—-——----—-———— - -— —
~i~: ~ ~ ----— __
65.
1 . Norma]. controls of Nacharam.
2. Fluorosis control group.
3. Subjects provided with defluorid~ted water.
4. Subjects provided with nutritinnal supplom~nt.
5. Subjects provided with defluoridated water
and nutritional supplements.
The simple process of domestic dofluoridation
evolved in Institute of Preventive Medicine has been
used for removing excessive fluoride. A product
termed Hyderabad Mix is provided as Nutritional
supplement.
Results of water analysis revealed that the
characterics of water of Nalgonda villa-ges are dis-
tinctly different from those of Nacharam. The
alkalinity of former is always more than hardness and
the ratio of the two parameters increasod with
fluoride concentration.
Data of dietary intake of the subjects revealed
that foods consumed have multiple deficiencies of
essential nutrients viz, proteins, calcium, phospharous,
iron, vitamins etc.
The values of biochemical pararnaters — Blood,
urea, creatinine, phosphorous, magnesium are within
normal limits. The results have shown significant
increase in the alkaline phosphatase activity of
serum and fluoride concontration in blood and urine.
It is interesting to note normal linearity relation
between fluoride concentration in drinking water and
urine has not been found in some of the cases. The
urinary fluoride concentrations has been significantly
high indicating substantial intake of fluoride through
foods also. -
-~ —-— - - —- -. - ——--—-—— ——-——-- ———
~- -~ ~ —- - —
66.
All the subjects of the four fluorosis endemic
villages were found suffering from dental fluorosis in
varying degrees of severity in direct relation to fluoride
concentration of drinking water. The severity of symptoms
were also influenced by increasing alkalinity content of
water. Some of the subjects of investigations were also
suffering from skeletal fluorosis, mild to severe in
intensity, depending on drinking water F. Concentration.
Most of the severe cases are from Sivannagudem and
Batlapalli villages, where the average fluoride concen-
tration of water exceeds 5.2 ppm and 7.8 ppm respectively.
After initiation of intervention prograrr~ne gradual
relief from body pains and joint pains were reported by
the subjects who drunk defluoridated water or consumed
nutritional supplement. Radiological profiles of the
patients, showed slight changes. The reai its indicate
that the process of mobilisation of skeletal fluoride
is reversible but the duration of investigationis too
short a time to find substantial rectification of
skeletal abnormalities. The findings of clinical and
radiological examinations are substantiated by bio-
chemical data. Statistical evaluation of biochemical
data revealed significant reduction in alkaline
phosphatase activity, and serum fluoride concentration.
However, these values are far higher than the normal
values even 12 months after intervention. Significant
urinary fluoride concentration has been found even on
cessation of fluoride ingestion thus indicating romobi—
lisatian of fluoride and its exeretion. The results nf
the present investigation provide evidence to show that
significant relief can be obtained in severity of
fluorosis on using defluoridated drinking water and
nutritional diet.

p
__ -
67.
The inferances of present study suggest that it
is worthwhile to conduct further studies
1. To determine the effectiveness of providing
calcium salts either orally as medicines or by
addition in water.
2. To find out effectiveness of reducing alkalinity
of fluoride water to the normal level.
3. To determine the contribution of fluoride intake
from different foods grown in endemic areas of
fluorocis
4. To determine the relationship of formation of
urinary calculi and fluorosis.
5. Feasibility of supplying extra nutrients to
the undernomishod people who are prepared to
defloridate their drinking water.
6. To study the effect of Tamarind juice in
the food preparation of fluoride patients.
.

‘I
.