Fluorine and the Environment. Agrochemicals, Archaeology, Green Chemistry & Water
297
-
Upload
omar-ruelas -
Category
Documents
-
view
261 -
download
6
description
Agrochemicals, Archaeology, Green Chemistry & Water i
Transcript of Fluorine and the Environment. Agrochemicals, Archaeology, Green Chemistry & Water

Fluorine and the Environment
Agrochemicals, Archaeology,Green Chemistry & Water
i

ASSOCIATE EDITORS
B. Ameduri, Research Director, CNRS, Montpellier, France
P. Atkins, Director of Environmental Affairs, Alcoa Inc., New York, USA
G. Haufe, Muenster University, Germany
J. Knowles, UCL, London, UK
T. Nakajima, Aichi Institute of Technology, Toyota, Japan
M. Pontie, Laboratory of Environmental Sciences, Angers, France
R. Syvret, Research Associate, Air Products, Allentown, PA, USA
S. Tavener, York University, UK
J. Winfield, Glasgow University, UK
ii

Advances in Fluorine Science
Fluorine andthe Environment
Agrochemicals, Archaeology,Green Chemistry & Water
Volume 2
Edited by
Alain Tressaud
Research Director CNRS,
ICMCB-CNRS
University of Bordeaux I
Pessac Cedex,
France
Amsterdam � Boston � Heidelberg � London � New York � Oxford � Paris
San Diego � San Francisco � Singapore � Sydney � Tokyo
iii
Elsevier
Radarweg 29, PO Box 211, 1000 AE Amsterdam, The Netherlands
The Boulevard, Langford Lane, Kidlington, Oxford OX5 1GB, UK
First edition 2006
Copyright r 2006 Elsevier B.V. All rights reserved
No part of this publication may be reproduced, stored in a retrieval system
or transmitted in any form or by any means electronic, mechanical, photocopying,
recording or otherwise without the prior written permission of the Publisher.
Permissions may be sought directly from Elsevier’s Science & Technology Rights
Department in Oxford, UK: phone (+44) (0) 1865 843830; fax (+44) (0) 1865 853333;
email: [email protected]. Alternatively, you can submit your request online by
visiting the Elsevier web site at http://elsevier.com/locate/permissions, and selecting
Obtaining permission to use Elsevier material.
Notice
No responsibility is assumed by the publisher for any injury and/or damage to persons
or property as a matter of products liability, negligence or otherwise, or from any use
or operation of any methods, products, instructions or ideas contained in the material
herein. Because of rapid advances in the medical sciences, in particular, independent
verification of diagnoses and drug dosages should be made.
Library of Congress Cataloging in Publication Data
A catalogue record for this book is available from the Library of Congress.
British Library Cataloguing in Publication Data
A catalogue record for this book is available from the British Library.
ISBN-13: 978-0-444-52672-4
ISBN-10: 0-444-52672-2
ISSN: 1872-0358
Printed and bound in Italy
06 07 08 09 10 10 9 8 7 6 5 4 3 2 1
For information on all Elsevier publications
visit our website at books.elsevier.com
iv

CONTENTS
Contributors vii
Preface ix
1. Fluoride Removal from Water Using Adsorption Technique 1
Maurice S. Onyango and Hitoki Matsuda
2. Water Defluoridation Processes: A Review. Application: Nanofiltra-tion (NF) for Future Large-Scale Pilot Plants 49
M. Pontie, C. Diawara, A. Lhassani, H. Dach, M. Rumeau,
H. Buisson and J.C. Schrotter
3. Calixpyrrole–Fluoride Interactions: From Fundamental Research toApplications in the Environmental Field 81
Angela F. Danil de Namor and Ismail Abbas
4. Fluorine-Containing Agrochemicals: An Overview of RecentDevelopments 121
George Theodoridis
5. Fluorine: Friend or Foe? A Green Chemist’s Perspective 177
Stewart J. Tavener and James H. Clark
6. Emerging ‘‘Greener’’ Synthetic Routes to Hydrofluorocarbons: MetalFluoride-Mediated Oxyfluorination 203
M.A. Subramanian and T.G. Calvarese
7. Fluorine Analysis by Ion Beam Techniques for Dating Applications 215
M. Dobeli, A.A.-M. Gaschen and U. Krahenbuhl
8. Fluorine and Its Relevance for Archaeological Studies 253
Ina Reiche
Subject Index 285
v

This page intentionally left blank
vi

Contributors
Ismail Abbas 81
H. Buisson 49
T.G. Calvarese 203
James H. Clark 177
H. Dach 49
Angela F. Danil de Namor 81
C. Diawara 49
M. Dobeli 215
A.A.-M. Gaschen 215
U. Krahenbuhl 215
A. Lhassani 49
Hitoki Matsuda 1
Maurice S. Onyango 1
M. Pontie 49
Ina Reiche 253
M. Rumeau 49
J.C. Schrotter 49
M.A. Subramanian 203
Stewart J. Tavener 177
George Theodoridis 121
vii

This page intentionally left blank
viii

Preface
‘‘Advances in Fluorine Science’’ is a new book series presenting critical multi-
disciplinary overviews on areas in which fluorine and fluoride compounds have a
decisive impact. The individual volumes of Advances in Fluorine Science are
thematic, addressing comprehensively both the science and applications on top-
ics including the Environment, Green chemistry, Medicine, Health & Life Sci-
ences, New Technologies & Materials Science, Energy and the Earth Sciences.
The first volume of the series, that is ‘‘Fluorine and the Environment: Atmos-
pheric Chemistry, Emissions & Lithosphere’’ covered a wide scope of important
issues about our atmospheric environment. The contributions, written by chem-
ists and environmental scientists, mostly dealt with the effects of fluorine-based
gases and emissions either from natural or anthropogenic origin. The present
volume deals with other topics concerned by Fluorine and the Environment, in-
cluding Water, Agrochemicals, Green Chemistry, Analytical aspects and Archae-
ology.
Fluorine constitutes 0.065% of the Earth’s crust and is among the first fifteen
elements in importance on Earth. This element is present in most parts of the
geosphere: it is found as fluoride ion in more than 300minerals, in volcanic
magmas, large crystals, etc; also in oceans, lakes, rivers, and all other forms of
natural water; in the bones, teeth, and blood of all mammals, in some plants, etc.
Various fluorine-containing ores are used in advanced technologies, e.g. the
metallurgy of aluminium which has been developed one century ago thanks to the
flux properties of cryolite (Na3AlF6). We can quote also rare-earth elements,
largely used in TV screens, which are extracted from fluorocarbonate minerals,
and natural crystals of fluorite (or fluorspar) which are nowadays used as starting
material for the growth of ultra pure single crystals of CaF2: such an ultra-high
quality material is required for use as windows for the development of 157 nm
lithography ion microelectronics.
In the present volume, the key-position of fluoro-products in agriculture is re-
viewed, since a large percentage of agro-chemicals and pesticides contain at
least one fluorine atom. However, improvements in the use of fluorine-based
products in agrochemicals could not be developed without taking into consider-
ation a safer environment, on both levels of greener synthesis routes and a
reduction of the negative impact on plants and organisms. Green chemistry which
ix

can be defined as ‘‘the utilization of a set of principles that reduces or eliminates
the use or generation of hazardous substances in the design, manufacture and
application of chemical products’’ tends to achieve the ultimate goal of zero-waste
processes. Within this scope, fluorine has a very peculiar place, since its high
reactivity yields several advantages, for instance in by-passing various polluting
multi-step reactions. In quite different fields, fluorine-based materials could be
used as efficient tools for protecting our cultural heritage, either for wood artefacts
or stone conservation. Using up-to-date techniques such as ion beam analyses,
this element could also help relative dating applications, ranging from burial
durations of archaeological bones and teeth to the determination of exposure
ages of meteorites on the Antarctic ice shield. This element has allowed indeed
solving several archaeological enigmas.
However, the negative impact of fluorides on plants, animals and human be-
ings—as already pointed out in the first volume—cannot be forgotten and pol-
lution and illness mechanisms should be confined, in order to find adapted
solutions. Although most pollution is coming through airborne particles, the
amount of fluorine present in drinking water and food should be also strictly
controlled, in order to stay within acceptable levels. An important excess of flu-
oride ions may cause endemic fluorosis, as found in rural areas of Western
Africa, Ethiopia, Rajasthan, or in desertic zones of China. The regular use of
defluoridation techniques of water, as presented here in two contributions, has
become therefore an extremely important mean to solve acute health problems
related to high fluoride concentrations.
Through the topics which are discussed within the present volume, we can be
point out among the major issues of the volumes:
- an original approach of the complex relationships between chemistry and the
environment, by collating complementary visions on a same important environ-
mental issue relating with fluorine and fluoride products;
- a better awareness—through the example of fluoride products—that we are
surrounded by [made with] chemistry and chemicals which are compulsory for
our life conditions and for our future, insofar man gives himself the means to
improve his environment.
We can anticipate that the forthcoming volumes of the series will deal with
fluorine & fluoride products in medicine and health.
Alain Tressaud
Malmussou, May 2006
Prefacex

CHAPTER 1
Fluoride Removal from Water UsingAdsorption Technique
Maurice S. Onyango,1 and Hitoki Matsuda2,�
1Centre for Process Engineering, Department of Process Engineering, University of
Stellenbosch, Stellenbosch, Private Bag X1, Matieland, 7602, South Africa2Department of Chemical Engineering, Nagoya University, Furo-cho, Chikusa-ku, Nagoya
468-8603, Japan
Contents
1. Introduction 2
2. Technologies and potential technologies for removing fluoride from water 4
2.1. Non-treatment and blending techniques 4
2.2. Precipitation/coagulation 5
2.3. Membrane techniques 5
2.4. Ion exchange (IE) 6
2.5. Electrochemical technique 7
2.6. Adsorption technique 8
2.7. Fluoride removal technique screening 8
2.7.1. Cost 8
2.7.2. Regulatory compliance 9
2.7.3. Appropriateness of the technique 9
2.7.4. Environmental burden 9
2.7.5. Public perception and acceptance 9
3. Development of defluoridation adsorption unit: algorithm 10
3.1. Established and potential adsorption media for fluoride 13
3.2. Characteristics of fluoride adsorption onto surface-tailored low-silica zeolite 25
3.2.1. Surface modification of zeolite 26
3.2.2. Batch fluoride adsorption equilibrium 27
3.2.3. Prediction of mass transfer processes 27
3.2.4. Defluoridation in zeolite column 30
3.3. Configurations and modes of operation of adsorbent-based defluoridation
units 37
3.3.1. ‘‘Tea bag’’ POU system 38
3.3.2. ‘‘Coffee filter’’ POU system 38
3.3.3. Household defluoridation POU unit 39
3.3.4. Cartridge POU system 41
3.3.5. Household POE systems 41
�Corresponding author.;
E-mail: [email protected]
FLUORINE AND THE ENVIRONMENT, VOLUME 2
ISSN 1872-0358 DOI: 10.1016/S1872-0358(06)02001-X
r 2006 Elsevier B.V.All rights reserved
1

3.3.6. Community-based tube-well-attached defluoridator 42
3.3.7. Centralized water treatment 43
3.4. Implementation of defluoridation units: challenges and prospects 43
4. Conclusions 44
Appendix: List of acronyms 45
References 45
AbstractManagement of contaminants such as fluoride is a major public issue. Fluoride of geogenic
origin in groundwater used as a source of drinking water is a major concern because
fluoride content above permissible levels is responsible for human dental and skeletal
fluorosis. Consequently, water sources containing elevated levels of fluoride have to
be treated. Coagulation/precipitation, electrochemical, electrodialysis, reverse osmosis,
adsorption and hybrid processes combining adsorption and dialysis are widely used
defluoridation techniques. Currently, however, the development of cost effective and clean
processes due to economic constraints and stringent environmental policies is desired.
Adsorption technique is arguably one of the most versatile of all the defluoridation
techniques due to a number of reasons such as cost, diverse end-uses, socio-cultural
acceptance, regulatory compliance, environmental benignity and simplicity. For this tech-
nique, activated alumina, bone char and clay adsorption media are the most developed.
During the past two decades, extensive research has focused on a number of alternative
adsorbents, some exhibiting improved fluoride sorption performances while at the same
time do not alter the quality of treated water. Studies have also shifted toward systematic
modeling to approximate adsorber design parameters. In view of these, this review opens
with a description of paradigm shifts in drinking water sources and highlights the genesis
and toxicological effects of fluoride in drinking water as a means of defining the existing
problem. Next, potential and established techniques for defluoridation are revisited. This is
closely followed with a review of defluoridation adsorbents recognized by the World Health
Organization and those novel defluoridation adsorbents reported in literature over the last
two decades, with special reference to drinking water. Emphasis is laid on their availability,
fluoride sorption capacity and mechanisms. In recognizing surface-tailored zeolite as a
novel sorbent, detailed analysis of fluoride adsorption behavior is provided for this sorbent.
Finally, defluoridation adsorption unit configurations, and challenges to and prospects for
their implementation are briefly discussed.
1. INTRODUCTION
Water is a finite and vulnerable natural resource and the bulk of it is stored as
saltwater in the oceans [1]. For the saltwater to be used for industrial, agricultural
or household purposes, an expensive conversion process would be required.
Thus, freshwater, because of its purity, is generally used in human activities as
opposed to saltwater. It is estimated that only 3% of the world’s water supply is
fresh water and of this, only a third is available as either surface water or
groundwater. Over the years, the world population has been surging upward,
while most economies have stagnated. The increase in population has exerted an
enormous pressure on the world’s limited freshwater supply. It is estimated that
M. S. Onyango and H. Matsuda2

water use has been growing at more than twice the rate of the population in-
crease [2]. The end result has been overutilization and pollution of the existing
water resources.
From time immemorial, surface water played a pivotal role to human life as a
source of drinking water because of its easy access compared with any other
water source. A few decades ago, the use of contaminated surface water sources
was found to contribute to the transmission of waterborne bacterial diseases.
Thus, a paradigm shift in water usage from surface to groundwater was inevitable.
Groundwater is one of the most valuable natural resources possessed by many
developed and developing nations. It is reliable in dry seasons or droughts be-
cause of the large storage, is cheaper to develop, since, if unpolluted, it requires
little or no treatment and it can often be tapped where it is needed, on a stage-
by-stage basis. As a result, groundwater has become immensely important
for human water supply in urban and rural areas in developed and developing
nations alike. Countless large towns and many cities derive much of their
domestic and industrial water supply from aquifers, both through municipal well
fields and through many private bore holes. However, a gloom picture hangs over
the use of groundwater in certain regions. Studies have shown that in certain
regions, though groundwater has been perceived to be clean, contain contami-
nants that are deleterious to human health. Amongst the most notable of these
contaminants is fluoride [3].
Fluoride in groundwater is mostly of geogenic origin arising from breakdown of
rocks containing the fluoride ions. In addition, anthropogenic sources such as
infiltration of chemical fertilizers in agricultural areas and liquid wastes from in-
dustrial entities also contribute to fluoride ions in groundwater. Over the years,
fluoride in drinking water above permissible limits has attracted public health
interest. At low concentrations fluoride can reduce the risk of dental cavities.
Exposure to somewhat higher amounts of fluoride can cause dental fluorosis. In
its mildest form this results in discoloration of teeth, while severe dental fluorosis
includes pitting and alteration of tooth enamel. When water containing severely
higher concentration of fluoride is ingested for a long period of time, changes to
bone, a condition known as skeletal fluorosis, may result. This can cause joint
pain, restriction of mobility and possibly increase the risk of some bone fractures.
Putting the above health effects into consideration, there are maximum con-
taminant levels (MCL) for fluoride in drinking water set by each country depending
also partly on its economic and technological powers. For example, in 1974,
Tanzania adopted a value of 8mg/L [4] for rural water supply, in 1985 the USEPA
raised the maximum allowable concentration to 4mg/L, while Canada and the
WHO recommend a permissible limit of 1.5mgF/L. Waters containing fluoride
ions above the preceding permissible levels have to be treated. There are several
treatment techniques that have been developed or show potential for remedying
fluoride-contaminated water. These techniques include: coagulation/precipitation,
Fluoride Removal from Water Using Adsorption Technique 3
the use of membranes, ion exchange, electrodialysis and adsorption, among
others. The choice of a treatment technique for a given utility usually depends on
the concentration of the ions, chemical species in source water, existing treat-
ment processes, treatment costs, handling of residuals [5] and versatility of a
given technique. Because of limitations in terms of cost, production of enormous
waste and difficulty in end-use applications of some of the above treatment
techniques, an environmentally benign, robust and low-cost technique has to be
devised for remedying contaminated water. Proponents of adsorption technology
argue that the technique is economical and efficient and produces high-quality
water [6]. Thus, there have been a lot of studies on the removal of fluoride by use
of various adsorbents [7–23]. More importantly, adsorption technique is versatile
and can be used in large-scale central water treatment systems and in the de-
velopment of a small-scale point-of-entry (POE) or point-of-use (POU) system.
Our main focus for this review is to briefly and critically describe some of the
defluoridation techniques as a means of getting a basis to support the adsorption
technique, to evaluate the defluoridation adsorbents now being utilized and those
novel defluoridation adsorbents reported in literature over the last two decades,
with special reference to drinking water. Emphasis is laid toward the adsorbents
availability, fluoride sorption capacity and where applicable their kinetic adsorp-
tion characteristics and column performances are reported. Detailed character-
istics of fluoride adsorption onto surface-tailored zeolite are provided. In addition,
various adsorber configurations are reexamined and challenges to and prospects
for their application to less developed countries (LDCs) are discussed.
2. TECHNOLOGIES AND POTENTIAL TECHNOLOGIES FORREMOVING FLUORIDE FROM WATER
An extensive review of the literature has been performed to critically evaluate
what technologies are presently being utilized, and what technologies may po-
tentially be applicable to the removal of fluoride from drinking water. A summary
of the technologies is presented in the succeeding subsections.
2.1. Non-treatment and blending techniques
In areas where several water sources are available, installation of multiple wells
may provide an opportunity for obtaining water with low fluoride levels without
necessarily treating the water. These methods ensure that the water entering
the distribution network meets the maximum contaminant level, by blending the
targeted source waters. Two other strategies are to recharge the aquifer and to
treat a side-stream and subsequently blend the treated water with the untreated.
This latter strategy reduces the amount of water to be treated and thus decreases
M. S. Onyango and H. Matsuda4

the design flow. One disadvantage of this method is that the MCL can only be
achieved if the quality of the source waters is good.
2.2. Precipitation/coagulation
In this method, fluoride removal from water is mediated by calcite, Mg(OH)2,
Al(OH)3 or Fe(OH)3 floc formation. The principle involved in this technology is that
the fluoride ions adsorb on the flocs and are then subsequently removed either
simultaneous or in succeeding treatment units such as sedimentation, fixed bed or
microfiltration unit. A lot of studies have been reported on the use of alum [24] (and
hence Al(OH)3) and lime [4,25]. In the 70 s, a co-precipitation technique, the so-
called ‘‘Nalgonda technique’’, was introduced to the Indian population for fluoride
removal from drinking water and also has been tested at pilot scale level in LDCs
such as Kenya, Senegal and Tanzania. The method involves the addition of alum
and lime into water followed by rapid mixing. After some time, the stirring intensity
is reduced and this induces floc formation that is subsequently removed by simple
settling. According to the report of the National Environmental Engineering
Research Institute (NEERI) of Nagpur, India, the technique is applicable to differ-
ent levels of water treatment. On a small scale (household), the chemicals are
introduced in buckets or drums, while on a medium scale for a small community, a
fill-and-draw plant is used. For large-scale operation, a process combining mixing,
flocculation and sedimentation is used.
Although precipitation is an economical and a robust technique in the removal
of fluoride from water, the technique has been found to suffer from excessive
sludge generation and dewatering such sludge has proven to be difficult since
the solid size and content are extremely small and low, respectively; instability of
the sludge under adverse environmental conditions has too been reported and in
most cases, achieving the maximum contaminant level has been found to be
difficult. Considering the fact that chemical handling is involved in precipitation/
coagulation technique, this technique may not be popular with many uneducated
groups, especially in LDCs. Therefore, the technique is only suited to centralized
water treatment system. In line with the above disadvantages, this technique has
not been very attractive to many end users.
2.3. Membrane techniques
As the quality of drinking water sources gets worse, the methods of water
treatment or the traditional water treatment systems need to be modernized.
Pressure-driven membrane systems such as reverse osmosis (RO), nanofiltra-
tion (NF) and ultrafiltration (UF) and electric-driven membrane system such as
Fluoride Removal from Water Using Adsorption Technique 5

electrodialysis (ED) are considered as alternative innovative and efficient tech-
nology with great future prospects for the purification and reprocessing of water
and sewage. Basic advantages arising from the application of membrane proc-
esses as compared with traditional water treatment systems are as follows:
production of water of invariable quality, smaller quantity of added chemical
substances, lower consumption of energy, compactness of the installation, pos-
sibility to effect full automation of the process, application in both small and larger
scale treatment systems as POE and POU, and simultaneous removal of other
dissolved species in water. Owing partly to the above wholesale advantages,
several studies have recently been reported on the use of membranes, in par-
ticular NF and RO membranes. Pontie et al. [26,27] and Diawara et al. [28] have
presented various aspects of application of NF to defluorinating water, while
Arora et al. [29] have studied extensively on the use of RO for the treatment of
water containing fluoride under various experimental conditions such as feed
composition and pH (see also their contribution in this book). They found that up
to 95% of fluoride could be removed from water. At present, the WHO and United
States Environmental Protection Agency (USEPA) classify RO as one of the
best demonstrated available technology (BDAT). A full-scale plant operation
specifically constructed for fluoride removal is found at Fort Irwin. Interestingly,
Lhassani et al. [30] have shown that by optimizing the pressure, selective
desalination of fluorinated brackish water by NF is feasible and drinking water
can be produced at much lower cost than by using RO.
Although membrane use has received universal acceptance, a number of limi-
tations has slowed its use in some regions. Fouling arising from feed water
characteristics is a major problem and due to high quantity of water rejection
typically between 35% and 65%, it is not suitable to regions where water is
scarce. Moreover, brine discharge from RO plant is highly concentrated and
requires treatment. The technique also involves a high investment cost, requires
high technology for operation and maintenance and therefore does not suit
developing countries.
2.4. Ion exchange (IE)
Ion-exchange resins are most commonly used in water treatment processes to
soften the water supply by exchanging sodium ions for ‘‘hardness’’ ions including
calcium and magnesium. Ion-exchange filters exchange the major ions present
in the water, removing fluoride and other ions in water. Selective fluoride removal
can be performed using the calcium form of DOWEX G-26 (H) strong acid cation-
exchange resin. The calcium forms an insoluble complex with the fluoride in water
with low to high salt concentrations. Soluble anions such as sulfate, arsenic,
selenium and nitrate and TDS can compete with fluoride and can affect the run
M. S. Onyango and H. Matsuda6

length ([31]). Thus, if systems contain high levels of suspended solids and pre-
cipitated iron that can cause clogging of the IE bed, then pre-treatment may be
required. USEPA has proposed passage of water through a series of columns to
improve removal and decrease regeneration frequency.
Some of the limitations to the use of ion exchange include the production of a
highly concentrated waste by-product stream that poses a disposal problem (this
problem can be reduced by brine recycling). Run length is affected by sulfate
level. The technology is only recommended primarily for small groundwater sys-
tems with low sulfate and low TDS. Another limitation to its use is that it requires a
high level of operator skill and therefore not popular with many end-users.
2.5. Electrochemical technique
Electrochemical technique (also electrocoagulation) is a simple and efficient
method for the treatment of potable water. This process is characterized by a
fast rate of contaminant removal, a compact size of the equipment, simplicity in
operation and low capital and operating costs. Moreover, it is particularly more
effective in treating wastewaters containing small and light suspended particles,
such as oily restaurant wastewater, because of the accompanying electroflotation
effect.
The electrochemical technique is in general at a developmental stage and
therefore is not an established technology for defluoridation. Some researchers
[32,33] have demonstrated that electrocoagulation (EC) using aluminum anodes
is effective in defluoridation. In the EC cell, the aluminum electrodes first sacrifice
themselves to form aluminum ions. Afterward, the aluminum ions are transformed
into Al(OH)3 before being polymerized to Aln(OH)3n. The Al(OH)3 floc is believed
to adsorb F� strongly as shown by the following reaction:
AlðOHÞ3 þ xF�3AlðOHÞ3�xFx þ xOH�. ð1Þ
At aluminum cathode, hydrogen gas is released according to the following reaction:
2H2Oþ 2e� ) H2 þ 2OH�ð2Þ
Unfortunately, up to date, no solid evidence was reported to support the hypothesis
of the above adsorption mechanism. Moreover, the hydrogen gas produced at the
EC cathode prevents the flocs from settling properly on leaving the electrolyzer
[34]. In order to overcome this problem, an EC process followed by an electro-
flotation (EF) operation can be applied. In this combined process, the EC unit
is primarily for the production of aluminum hydroxide flocs. The EF unit would
undertake the responsibility of separating the formed flocs from water by floating
them to the surface of the cell.
Fluoride Removal from Water Using Adsorption Technique 7

2.6. Adsorption technique
Adsorption in water treatment is a robust technique for removing water-soluble
ions, especially when these ions exist in water at low concentrations. Coin-
cidentally, fluoride ions exist in some groundwaters at low concentrations, which
are above the permissible limits. The principle behind this technique is that a
component (fluoride in our case) is transported by diffusion from the bulk phase
to the solid surface where it is bound at the surface or interface between two
phases by either chemical or physical forces [35]. Numerous investigations have
focused on surface adsorption as a means of removing fluoride from water. As a
result of these studies various water treatment plants using treatment media
such as activated alumina or bone char have been constructed and are in use
in several countries. One example is a water purification plant in Kansas that
utilizes activated alumina [36]. Several other smaller fluoride treatment facilities
are scattered all over India, Kenya and Tanzania, among other nations.
2.7. Fluoride removal technique screening
The treatment techniques mentioned above are those that are widely reported
in literature. Their application in a specific geographical region depends on a
number of factors. In discussing these factors, our argument will be biased
toward application of the various techniques in LDCs because these regions bear
the highest occurrence of fluoride contamination of drinking water. These factors
are also the basis of a decision framework for helping utilities determine the most
appropriate technique.
2.7.1. Cost
To understand how cost of a given technique is important, we need first to identify
the countries that are most affected by fluoride contamination of drinking water.
Among these countries are Kenya, Tanzania, Uganda, Ethiopia, India, Mexico,
Argentina, Libya, Senegal, Pakistan, Srilanka, New Zealand and China. Most
of these countries have low per capita incomes and therefore application of a
given technique will depend on the cost of the technique. Moreover, the distri-
bution of wealth in some of these countries is such that majority of people live
below poverty line. In line with this, only low-cost options that perform adequately
well may be applicable. Most literatures indicate that membrane techniques,
ion exchange and electrochemical technique are medium to high cost, while
adsorption and precipitation/coagulation techniques are low-cost fluoride treat-
ment options.
M. S. Onyango and H. Matsuda8
2.7.2. Regulatory compliance
Currently, the WHO recommends a maximum value of 1.5mgF/L in drinking
water. Countries like India have lowered their permissible limits to 1.0mg/L. The
performance of the technologies considered in this review depends on the quality
of the water to be treated. In general, most of these technologies will meet the
WHO’s maximum allowable concentration (MAC) values. However, precipitation/
coagulation method has been found to rarely meet the safe levels of fluoride in
drinking water. To achieve safe levels using this technique, a treatment train
involving the addition of an adsorption unit or a membrane unit is required. The
latter comes with additional cost.
2.7.3. Appropriateness of the technique
A given technology of choice should be tailor-made to suit the local conditions of
the region in which it is intended. The local conditions include the fact that most of
the contaminated water are obtained from tube wells, that the wells are scattered
all over the region where in most cases there is no electricity, that the users are
mainly women with no strong education and no sound incomes [37]. In consid-
ering these factors, ion exchange, membrane and electrochemical techniques are
automatically disqualified, as they require medium- to high-level skills to operate.
Moreover, they cannot be applied to areas where there is no supply of electricity.
2.7.4. Environmental burden
In the 21st century, the impetus to protect the environment is very strong. Con-
sequently, the benefits arising from a given technology should not override the
environmental load the technology imparts on the environment. Most technolo-
gies considered in this review increase environmental load to certain extent. For
example, precipitation/coagulation is known to produce a large amount of sludge
that has low content of solid and thus difficult to dewater. Adsorption on the other
hand produces non-hazardous spent regeneration solution containing a high
content of fluoride and thus an additional chemical handling facility would be
required. Membrane processes on their part reject a large amount of water, while
ion exchange produces highly concentrated brine. Based on these assessments,
these technologies will all impact negatively on the environment. Adsorption
technique, however, produces little amount of non-hazardous waste.
2.7.5. Public perception and acceptance
Public perception and acceptance is critical to the success of a given fluo-
ride treatment technique. To make a technique popular, there must be an
Fluoride Removal from Water Using Adsorption Technique 9
understanding of local socio-cultural inclination. In general, all the techniques
considered here have positive public perception. However, adsorption technique
based on bone char adsorbent is known to be unacceptable to several religious
groups. Also, some clique of people has mistakenly associated activated alumina
(AA) with aluminum poisoning. Thus, they do not believe that water treated with
AA is clean to drink.
Considering the above screening strategies as well as the summary in Table 1,
it is observed that adsorption technique for fluoride removal from water is an
established, low-cost, environmentally benign technique that has public accept-
ance. Thus, our discussion will henceforth concentrate on adsorptive removal of
fluoride from drinking water.
3. DEVELOPMENT OF DEFLUORIDATION ADSORPTION UNIT:ALGORITHM
Most people in LDCs are affected by fluoride-contaminated drinking water sup-
plied by the numerous scattered tube wells. The most feasible solution to this
problem is to develop a cost-affective technique with diverse end-uses. As already
mentioned in the previous sections, one robust technique is that based on
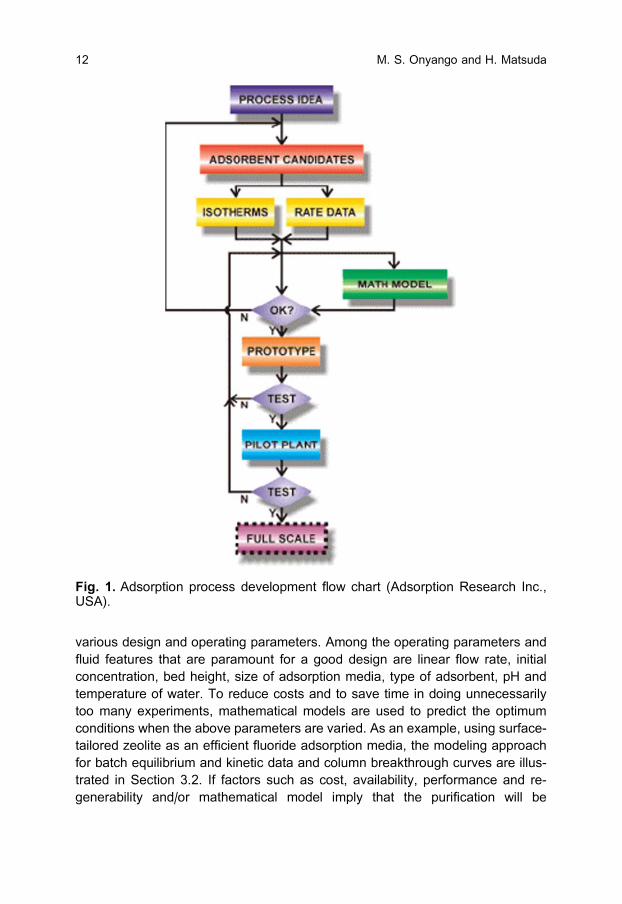
adsorption. The development of an adsorption unit in general requires a number of
stages. These are summarized in the Fig. 1 (Adsorption Research Inc. USA).
According to the Adsorption Research Inc. (USA), the adsorption unit develop-
ment stages frequently follow a pattern, with ideas being generated and data
being collected, all focused on developing a full-scale process. As Fig. 1 suggests,
the process idea in our case is to defluoridate drinking water. Since the technique
to be adopted is known, i.e. adsorption, the next stage is to examine the adsorp-
tion media. Frequently, a few or even several adsorbent candidates are examined
as potential choices. To this end, we have provided in Section 3.1 a description of
some of the adsorption media reported in literature over the last two decades.
To evaluate the adsorbents, the relevant factors such as cost implication,
availability, performance and regenerability are considered. The performance of
an adsorption media for defluoridation is indicated as isotherms and rate data,
while costs in general are determined by local availability, regenerability of the
adsorption media, whether the media is synthetic or natural, needs further
processing before use, among others. Using such factors as mentioned above, it
is frequently possible to decide beforehand whether an adsorbent is suitable or
not. In order to design an effective adsorption separation or purification unit using
a chosen adsorption media, preliminary design information is required [38]. Often,
these pieces of information are gathered through the performance of an exten-
sive series of experiments that are time consuming and expensive. The aim of
such a study is to predict a priori what will happen in a full-scale operation under
M. S. Onyango and H. Matsuda10

Table 1. Summary of fluoride removal technology screening
Screening strategy
Precipitation and
coagulation
Membrane
processes Ion exchange Electrochemical Adsorption
Cost Low High Medium May be high Low
Regulatory
compliance
MCL not
achievable
MCL achievable MCL achievable MCL achievable MCL
achievable
Appropriateness Nalgonda method
applicable to
LDCs
Not appropriate to
LDCs
Not appropriate to
LDCs
Not appropriate to
LDCs
Appropriate
to LDCs
and is
versatile
Environmental
burden
Difficult to
dewater sludge
Water rejection
high
Highly concentrated
brine
At development
stage
Non-
hazardous
waste
Public perception
and acceptance
Acceptable Acceptable Acceptable At development
stage
Acceptable
Note: Non-treatment technique is not considered.
Fluorid
eRemovalfro
mWaterUsingAdsorptio
nTechnique
11
various design and operating parameters. Among the operating parameters and
fluid features that are paramount for a good design are linear flow rate, initial
concentration, bed height, size of adsorption media, type of adsorbent, pH and
temperature of water. To reduce costs and to save time in doing unnecessarily
too many experiments, mathematical models are used to predict the optimum
conditions when the above parameters are varied. As an example, using surface-
tailored zeolite as an efficient fluoride adsorption media, the modeling approach
for batch equilibrium and kinetic data and column breakthrough curves are illus-
trated in Section 3.2. If factors such as cost, availability, performance and re-
generability and/or mathematical model imply that the purification will be
Fig. 1. Adsorption process development flow chart (Adsorption Research Inc.,USA).
M. S. Onyango and H. Matsuda12
successful, then a prototype system may be built. Otherwise, additional adsorb-
ent candidates would be evaluated. If the prototype tests are successful, a larger
pilot plant might be built, for on-site testing. During the on-site tests, field-based
performance and acceptability are evaluated. In case the prototype tests
are unsuccessful, it is necessary to revise the model conditions or parameters,
or possibly to look at other adsorbent candidates. If the pilot plant tests are
successful, a full-scale plant could be built. Conversely, it is necessary to revise
the model conditions or parameters, or possibly to look at other adsorbent can-
didates again. Among the configurations (pilot/full-scale configurations, where
applicable) that are considered in this review are ‘‘tea bag’’ POU, ‘‘coffee filter’’
POU, household POU, cartridge POU, community-based tube-well-attached
defluoridator, household POE and centralized water treatment systems. By virtue
of the nature of these configurations, some are extremely simple and their
developments do not necessarily follow the algorithm illustrated in Fig. 1.
3.1. Established and potential adsorption media for fluoride
Adsorption technology is frequently used as a robust technique to remove water-
soluble ions that are detrimental to human health from aqueous solutions,
especially when these ions exist in low concentrations. Thus, a lot of studies have
been reported in literature on the use of various adsorbents for fluoride removal
from drinking water. The studies have mainly been motivated by the need to have
alternative adsorbents that are low in cost, have local availability, require little
processing and are superior in performance. Synthetic adsorbents have good
capacities for fluoride but are always expensive, while natural materials that are
available in large quantities or certain wastes from agricultural or industrial con-
cerns may potentially be low-cost materials. An overview of some of the ad-
sorbents that have been reported in literature over the last two decades are
given below.
(a) Activated alumina. AA are commonly used as adsorbents, desiccants and
catalysts and therefore the chemistry, size and structure of these aluminas are
tailored to specific applications. Based on pH in water, four kinds of AA can be
identified. These are: basic (pH 9.570.5), neutral (pH 7.570.5), weakly acidic
(pH 6.070.5) and acidic (pH 4.570.5) AA. As an adsorbent, AA has been widely
applied in the removal of contaminants from water. Removal of fluoride by AA is
an established treatment technology and has been and is still practiced both by
small- and large-scale water treatment enterprises. The WHO and USEPA clas-
sify AA adsorption as one of the best demonstrated available technology (BDAT)
for fluoride removal. AA has high affinity for fluoride because in aqueous
environment at pH values below its pHpzc – the point of zero charge – it
forms protonated (QAl-OH2+) and neutral (QAl-OH) aluminol sites, which are
Fluoride Removal from Water Using Adsorption Technique 13

responsible for binding fluoride ions by formation of inner-sphere complexes.
Because of the good performance of AA, several researchers have studied its
fluoride sorption behavior under varying conditions [36,39–46]. Interestingly,
different researchers have obtained different adsorption capacities as shown in
Table 2. Usually, the efficiency of the AA for adsorbing fluoride is generally poor
on the first adsorption cycle unless the alumina is pre-treated. A pre-treatment
that involves allowing a dilute aluminum sulfate solution (�29 g Al2(SO4)3 18H2O/
L) to remain in contact with the alumina for 1 h is found to be particularly sat-
isfactory. In another similar pre-treatment of AA to improve its performance,
Wasay et al. [46] intensively studied the effect of impregnating AA with La (III)
and Y (III) ions. They found that the capacity of AA after the impregnation in-
creased twofold. Ku and Chiuo [44] using g-activated alumina found optimal ad-
sorption (capacity ¼ 16.3mgF/g) of fluoride to take place in the pH range 4–6.
Although AA is a robust adsorbent for fluoride uptake, it is expensive and its
performance is affected by the presence of co-ions in water such as silicates,
sulfates, chlorides, bicarbonates and phosphates. The effect of bicarbonate ions
on the performance of AA is particularly strong, i.e. the removal efficiency of
fluoride by AA decreases significantly with an increase in bicarbonate content.
This is partially due to the fact that bicarbonate ions buffer water pH at higher
values thus reducing the number of active sites on AA available for binding
fluoride. This brings us to another factor (pH) from solution chemistry that induces
a negative effect on the performance of AA. The pH has an inhibiting effect of
fluoride uptake since solution pH determines the speciation of fluoride, the
number and the distribution of active sites on AA. In the acidic media (pHo7), the
fluoride uptake by AA usually decreases with a decrease in pH due to the fact that
Table 2. Summary of adsorption capacities of AA
Source Material Capacity (mg F/g)
Mode of
operation
Anonymous [36] Al-pretreated AA 4.6 Column
Ghorai and Pant [39] Locally (India) available
AA
2.41 Batch
Coetzee et al. [45] Type 504C, Fluka 0.5 Batch
Li et al. [17] g-Al2O3 3.70 Batch
Ku and Chiuo [44] g-activated alumina 16.34 Batch
Ramos et al. [11] a-alumina 8.42 Batch
Wasay et al. [46] AA 3.3 Batch
Wasay et al. [46] La(III)-pretreated AA 6.3 Batch
Wasay et al. [46] Y(III)-pretreated AA 6.1 Batch
Rubel [61] AA 0.627–2.627 Pilot plant
M. S. Onyango and H. Matsuda14
HF is weakly ionized (pHo3.2), and soluble alumino–fluoro complexes are
formed resulting in the presence of aluminum ions in the treated water and low-
ering of the active sites. At near neutral pHs, the uptake of fluoride is maximum.
Assuming that the pHpzc of AA is about 8–9 as reported in several literatures, then
at near neutral pHs the active sites consist ofQAl-OH2+ (protonated) andQAl-OH
(non-protonated) aluminol sites. The interaction between fluoride and the pro-
tonated aluminol sites leads to the formation of inner-sphere complexes and
elimination of water. The reaction can be represented by
¼ Al-OHþ2 þ F�3 ¼ AlFþ H2O ð3Þ
The protonated aluminol sites are the most effective fluoride sorption sites and
are usually responsible for the rapid kinetics due to coulombic attraction between
the positively charged sites and the negatively charged fluoride species. The
reaction with non-protonated sites involves ligand exchange, leads also to the
formation of inner-sphere complexes, releases hydroxyl ions, is slow and char-
acterized by a higher activation energy.
¼ Al-OHþ F�3 ¼ AlFþOH�ð4Þ
Further increase in pH beyond pHpzc is expected to enhance electrostatic shield-
ing of the active sites and to reduce their number and activity. This argument
explains why AA is reported to perform poorly at pH4pHpzc.
The use of AA in water defluoridation has been limited to certain extent
to countries with well-established economies. AA being synthetic is relatively
expensive and may not be locally available in all fluoritic regions. India has
an increasing incidence of fluorosis, both dental and skeletal, and with some
62 million people at risk. High-fluoride groundwaters are present especially in the
hard rock areas south of the Ganges valley and in the arid northwestern part of
the country. Owing to the robust performance of the Indian economy over the
years, more and more AA-based tube-wells-attached columns are being used to
defluoridate drinking water. Moreover, in recent times, an Indian company called
Mytry De-Fluoridation Technologies (MDFFT) has produced and implemented
AA-based defluoridation filters. The Mytry filter is a two-bucket system with the
upper bucket containing the filter media. Murcott [47] reported that since 2004,
the MDFFT had sold 9000 units and produced 50 units daily.
(b) Bone char. Bone char, a mixed adsorbent containing around 10% carbon
and 90% calcium phosphate, is mainly produced by the carbonization of bones.
Structurally, the calcium phosphate in bone char is in the hydroxyapatite form.
Bone char has traditionally been used to decolorize sugar solutions in the sugar
refining industry for many years. More than four decades ago, it was recognized
as a potential medium for partial defluoridation of water. The defluoridation proc-
ess was reportedly of the ion exchange in which carbonate radical of the apatite,
Ca(PO4)6.CaCO3, was replaced by fluoride to form an insoluble fluorapatite [48].
Fluoride Removal from Water Using Adsorption Technique 15

Bone char is therefore a well-established adsorbent for water defluoridation.
Unfortunately, the treated water in some cases had bad taste. Moreover, socio-
cultural acceptance in some communities was lacking, while at the same time
cost and availability of raw materials were inhibiting. In 1988, however, the WHO
recommended bone char for use in fluoride removal from drinking water in LDCs.
Earlier, USEPA [49] reported that a full-scale defluoridation plant was operational
in South Dakota, while Phanfumvanit and LeGeros [50] presented a robust bone
char-based defluoridation units for individual households. Mwaniki [51] presented
more interesting results of fluoride sorption characteristics of different grades of
bovine bone char. They found that the 24 h-batch capacity of fluoride depended
on the temperature of the heat-treatment of the bones. Black-grade bone char
(heat-treated at 3501C) had a capacity of 11.4mg/g, gray grade (heat-treated at
4501C) had a capacity of 2.4mg/g, while white grade (heat-treated at 4501C) had
a capacity o0.3mg/g. Although black bone char (BBC) has high capacity for
fluoride, Menda [52] reported from a Tanzanian experience that the water quality
arising from the use of BBC was low due to bad smell and discolored water.
In a laboratory study, Abdel-Raouf and Daifullah [53] reported that the bone
char derived by heating animal bone to 500–6001C could be used to remove
fluoride from drinking water. Table 3 summarizes some of the capacities of
bone char reported in literature.
Owing to enormous challenges facing Tanzania as most of her groundwaters
have excess fluoride levels and most of the population is poor, a robust system of
making bone char for water defluoridation has been devised in order to cut the
cost of production. It involves charring raw fresh bones in an easy-to-use
charcoal-fueled kiln at about 500–6001C. The charred bones are then pulverized
into grains of sizes ranging between 0.5 and 2mm and used in POU systems for
treating cooking and drinking water only [4]. In Kenya where fluoride in drinking
Table 3. Summary of adsorption capacities of various grades of bone char
Source Material Capacity (mg F/g)
Mode of
operation
USEPA [49] Bone char 2.2 Full-scale
plant
operation
Mwaniki [51] Black bone char 11.4 Batch
Mwaniki [51] Gray bone char 2.4 Batch
Mwaniki [51] White bone char 0.3 Batch
Abe et al. [19] Bone char 43 Batch
Mjengera and
Mkongo [4]
Locally made bone
char
7000 L/4 kg column Column POU
operation
M. S. Onyango and H. Matsuda16

water has also enormously attracted public health attention, the Catholic Diocese
of Nakuru (CDN) has extensively researched and is in the implementation phase
of a bone char-based household and community filters for water defluoridation. In
the latter system, the bone char is either placed into a two-bucket POU system or
into a large tank through which water contaminated with fluoride is passed [47].
(c) Hydroxyapatite. Hydroxyapatite is a highly crystallized material. One report
by Fan et al. [16] gives its specific surface area as 0.052m2/g and very close to
that of calcite, quartz and fluorspar. The uptake of fluoride in hydroxyapatite is
dominated by ion exchange. In water defluoridation, the fluoride ions firstly
adsorb onto hydroxyapatite surfaces and the adsorbed fluoride is exchanged with
OH group at the nearest surface of apatite particles, and then exchanged with
the mobile OH group inside the hydroxyapatite particles, resulting in a much
higher uptake of fluoride by hydroxyapatite. The exchange process can be rep-
resented by
Ca10ðPO4Þ6ðOHÞ2 þ nF�¼ Ca10ðPO4Þ6ðOHÞ2�nFn þ nOH�
ð5Þ
As a consequence of the above reaction, the capacity of hydroxyapatite for
fluoride was found to be 4.54 [16].
(d) Carbonaceous materials. Carbon-based adsorbents have widely been used
in adsorption processes for water treatment. Most of these adsorbents have very
high internal surface area needed for adsorption. However, the affinity of anions
by carbon is quite low. Thus, Ramos et al. [11] utilizing the high surface area of
activated carbon, and the high affinity and capacity of aluminum toward fluoride
ions, produced a novel sorbent, aluminum-impregnated carbon. In a batch study,
they found that the aluminum-impregnated carbon had a 3–5 times higher
capacity of fluoride than that of plain carbon. Just like with any other sorbent, the
performance of aluminum-impregnated carbon was found to be dependent upon
the pH of the impregnating solution, temperature of calcinations and solution pH
of fluoride-containing water. In another study, Li et al. [54] used Al2O3-doped
carbon nanotubes to remove fluoride from water. Carbon nanotubes are needle-
like cylindrical tubules of concentric graphitic carbon capped by fullerene-like
hemispheres. Since their discovery [55], great efforts have focused on their
synthesis, characterization, theoretical investigation and their applications. Owing
to their novel mechanical and electronic properties, large specific area and high
thermal stability, they have a tremendous potential for future engineering appli-
cations, in such areas as hydrogen storage, field emission, catalyst supports and
composite materials, among others. Application of carbon nanotubes as adsorb-
ent in environmental pollution control is an emerging field. For this reason, Li et al.
[17] prepared aligned carbon nanotubes (ACNTs) by catalytic decomposition of
xylene using ferrocene as catalyst and tested the adsorbent in fluoride adsorp-
tion. They found a moderate capacity of ACNTs for fluoride. In explaining the
mechanism of fluoride uptake by ACNT, they cited the availability of defects and
Fluoride Removal from Water Using Adsorption Technique 17

coats of amorphous carbon. These defects and amorphous carbon offered active
sites for fluoride adsorption on the outer surfaces of the ACNTs. Additionally, the
inner cavities and the micropores or mesopores composed by internano-
tube space between the densely ACNTs may have also contributed to the effec-
tive adsorption of fluoride. In a research using various carbonaceous materials
such as charcoal, carbon black and activated carbons, Abe et al. [19] found the
percentage of fluoride ion removal by the carbonaceous materials to increase
with an increase in iodine-adsorption capacity. They explained that it meant that
the adsorbability of the fluoride ions onto carbonaceous materials depended
upon the specific surface area. Generally speaking, the amount of adsorbates
adsorbed onto carbonaceous materials depends upon pore size distribution be-
cause adsorption occurs in pores, suggesting a physical adsorption.
Although a lot of research has been reported on the use of various carbon-
aceous materials in defluoridation, no known column or full-scale plant operation
is easily available in open literature. One reason for this is that most carbon-
aceous materials show poor adsorption capacity (Table 4) for fluoride and there-
fore only laboratory-scale performances have so far been reported. Amorphous
alumina supported on carbon nanotubes on the other hand show high capacity
(28.7mgF/g adsorbent) for fluoride and is therefore a promising material for
drinking water defluoridation.
(e) Geomaterials. Geomaterials are low-cost adsorbent resources used in
water and wastewater treatment. In addition, they are mostly locally available and
require minimal processing, if any, before they are used. Moges et al. [56] in-
tensively investigated both in batch and column operation modes, the fluoride
adsorption ability of fired clay chips from a region in Ethiopia. They found that
the clay had an appreciable fluoride adsorption capability and could lower the
fluoride levels in drinking water to an acceptable value (Table 5).
Table 4. Summary of adsorption capacities of various carbonaceous materials
Source Material Capacity (mg F/g)
Mode of
operation
Ramos et al. [11] Plain carbon 0.49 Batch
Ramos et al. [11,82] Al-impregnated
carbon
1.07 Batch
Li et al. [54] ACNTs 4.1 Batch
Li et al. [17] Al2O3/CNT 28.7 Batch
Abe et al. [19] Carbon black 0.2 Batch
Abe et al. [19] Activated carbons 0.34 (coal based) Batch
Abe et al. [19] Charcoals 0.07 Batch
M. S. Onyango and H. Matsuda18

Zevenbergen et al. [7] attempted to make use of a locally available Kenyan soil
derived from volcanic ash (i.e. Ando soils or soils with andic properties) as a
fluoride adsorbent. The Ando soil contains in small quantities aluminum, iron and
silica. It is probably these constituents that provide the active sites for fluoride
ions. The ability of the Kenyan Ando soil to adsorb fluoride was determined
experimentally. The batch capacity for fluoride adsorption was estimated at
5.51mg/g, using the Langmuir isotherm model. These results were extended to
possible technical application using a one-dimensional solute transport model.
Based on the results it was concluded that the use of Ando soils appeared to be
an economical and efficient method for defluoridation of drinking water on a small
scale in rural areas of Kenya and other regions along the Rift Zone. Further
research was warranted to evaluate its practical applications and social accept-
ance. In another study, Srimurali et al. [8] tested charfine, lignite, bentonite and
kaolinite in fluoride sorption. At optimum conditions using a solution containing
5mgF/L, the authors found that charfine and bentonite had an appreciable ad-
sorption capacity of 38% and 46%, respectively. They explained, on the one
hand, that the mechanism of uptake of fluoride by bentonite proceeded by ad-
sorption onto the lattice structure and possibly by reaction with aluminum silicate,
while on the other, fluoride adsorption on charfine proceeded by chemical inter-
action due to the surface heterogeneity and imperfections contained in charfine.
Limestone is another promising geomaterial for drinking water defluoridation.
However, it has only been tested in wastewater containing high concentration of
fluoride. In a research work by Reardon and Wang [60], limestone was used in a
two-column continuous flow system (limestone reactor) to reduce fluoride con-
centrations from wastewaters to below the MCL of 4mg/L for wastewater. Calcite
was forced to dissolve and fluorite to precipitate in the first column. The degas-
sing condition in the second column (did not serve to remove fluoride) caused the
Table 5. Summary of adsorption capacities of selected geomaterials
Source Material Capacity (mg F/g)
Mode of
operation
Moges et al. [56] Fired clay 0.20 Batch
Moges et al. [56] Fired clay 0.285 Column
Zevenbergen et al. [7] Ando soil 5.51 Batch
Srimurali et al. [8] Bentonite 1.15 Batch
Srimurali et al. [8] Charfine 0.95 Batch
Wang and Reardon [57] Tertiary soil 0.150 Column
Sugita et al. [58] Kaolinite E0.667 Batch
Das et al. [59] Titanium-rich
bauxite
3.7–4.1 Batch
Fluoride Removal from Water Using Adsorption Technique 19
precipitation of the calcite dissolved in the first column, thus returning the treated
water to its approximate initial composition.
In a study by Wang and Reardon [57], heavily weathered tertiary soil from
Xinzhou, China was used as a sorbent for defluoridation of high-fluoride drinking
water. The soil was composed of quartz, feldspar, illite and goethite, with Fe oxide
content of 6.75%. The authors found the soil’s sorption capacity (150 mg/g) to be
about a quarter of the low-end range of values reported by Rubel [61] for com-
mercially available AA. The sorption of F– ions was specific and involved ligand
exchange between hydroxyl ions and fluoride ions according to the equation
� FeOHþ F�3 � FeFþOH�ð6Þ
The authors further explored the optimum heating temperature and found that
heating the tertiary soil at 400–5001C enhanced the adsorbent’s fluoride removal
capacity. Moreover, a preliminary column experiment showed that 4.0 kg of
4001C heat-treated soil could treat more than 300 L of 5mg/L fluoride feed water
before the effluent fluoride concentration of 1.0mg/L was reached. To minimize
environmental impact of the used material, a cost-effective regeneration tech-
nique was devised and it involved rinsing the soil with sodium carbonate solution,
followed with dilute HCl and finally twice with distilled water.
Using coal-based sorbents, Sivasamy et al. [62] evaluated their ability to re-
move fluoride from water. On equilibrium basis, Langmuir and Freundlich models
were used to describe the data points, while the kinetic data points were inter-
preted in terms of reaction and mass transfer processes. Kaolinite, adioctahedral
two-layered (silica and alumina) silicate (1:2 type), has also been tested in drink-
ing water defluoridation. Recently, Sugita et al. [58] and earlier Kau et al. [63] and
Weerasooriya et al. [10] presented fluoride adsorption results of kaolinite. The
fluoride-binding sites in kaolinite consist of aluminol and silinol sites. The authors
explained that the fluoride–kaolinite interaction led to the formations of both the
inner- and outer-sphere complexes.
Bauxite ores, abundantly available in many parts of India, usually contain
oxides/oxyhydroxides of Al, Fe and Si. The titania content in the bauxite ore
depends upon the geological process that controlled the development of bauxite
and usually varies in the range of 1–3wt%. However, bauxite ore from several
parts of central India (especially in the states of Jharkhand and Chattisgarh)
mainly consists of oxides/oxyhydroxides of Ti and Al and small amounts of Fe
and Si. Each of these oxides/oxyhydroxides possesses good adsorption capacity
for fluoride as also seen in several recent investigations [9,16,64–66]. In an at-
tempt to devise a simple and cost-effective fluoride removal process using locally
available F sorbent (e.g., titanium-rich bauxite (TRB)), a study was designed to
evaluate the adsorption capacity and to optimize the fluoride adsorption para-
meters using TRB so that a suitable adsorption process could be developed in
future to abate fluoride from drinking water. The effect of pH, heat-treatment and
M. S. Onyango and H. Matsuda20

regeneration ability of the material were studied. Considering the pH profile and
nature of oxides/oxyhydroxides present in TRB, the adsorption of fluoride is rep-
resented by the following two-step protonation/ligand-exchange mechanism:
� SOHðsÞ þ HþðaqÞ$ � SOHþ
2ðsÞ ð7Þ
� SOHþ2ðsÞ þ F�
ðaqÞ$ � SFðsÞ þ H2O ð8Þ
which gives the net reaction
� SOHðsÞ þ Hþþ F�
ðaqÞ$ � SFðsÞ þ H2O ð9Þ
where RS represents the surface of adsorbent. This two-step mechanism is
favorable at pHo6. However, at pH 4 6, fluoride ion is pre-dominantly adsorbed
by the following mechanism:
� SOHðsÞ þ F�ðaqÞ$ � SFðsÞ þOH�
ð10Þ
The progressive decrease of fluoride uptake at pH 4 6 is mainly due to two
factors: the electrostatic repulsion of fluoride ion to the negatively charged sur-
face of the TRB (pHzpc ¼ 7.05–7.5) and the competition for active sites by ex-
cessive amount of hydroxyl ions. The adsorption capacities of the geomaterials
described above are summarized in Table 6.
(f) Waste-derived adsorbents. Waste-derived adsorbents are considered low-
cost alternative defluoridation media. The ability of treated alum sludge to remove
fluoride from aqueous solution was investigated by Sujana et al. [9]. Alum sludge
is a waste product generated during the manufacture of alum from bauxite. This
material mainly consists of aluminum and titanium with small amounts of unde-
composed silicates. It is well known that these constituents have fluoride ions
affinity. In using this material in fluoride adsorption, the authors argued that they
solved two problems, fluoride contamination and waste disposal problems. The
fluoride uptake was found to follow the Langmuir isotherm suggesting sorption on
Table 6. Summary of adsorption capacities of selected waste-derived materials
Source Material Capacity (mg F/g)
Mode of
operation
Sujana et al. [9] Alum sludge 5.39 Batch
Cengeloglu et al. [13] Red mud 3.12 Batch
Cengeloglu et al. [13] Activated red mud 6.29 Batch
Mahramanlioglu et al.
[14]
SBE 7.75 Batch
Liao and Shi [67] Zr(IV)-loaded
collagen fiber
43.51 Batch
Fluoride Removal from Water Using Adsorption Technique 21

homogeneous sites, while kinetically the adsorption reaction was first order. Also
from an environmental and economic standpoint, spent bleaching earth (SBE),
a solid waste from edible oil-processing industry, was tested as a low-cost
adsorbent for fluoride adsorption [14]. SBE has two components: residual oil not
removed by filter pressing and montmorillonite clay. When not utilized as in this
case, the material is normally disposed off directly to landfill either in a dry state or
as wet slurry. The material was found to be most effective at pH 3.5 and the
adsorption transient curves were best described by second-order kinetics.
Another waste material that has found fluoride adsorption application is the red
mud. Just like the alum sludge, red mud (bauxite wastes of alumina manufacture)
emerges as an unwanted by-product during the alkaline-leaching of bauxite in the
Bayer process. C- engeloglu et al. [13] reported that about 500,000m3 of strongly
alkaline (pHE12–13) red mud water was dumped annually into specially con-
structed dams around Seydigehir Aluminium Plant-Turkey. Since the plant began
to operate, the red mud accumulated and posed severe environmental problem.
Consequently, the authors investigated the possibility of utilizing the material in
the original or activated form as an adsorbent for the removal of fluoride from
aqueous solution. They explained that the uptake of fluoride involved ligand-
exchange reaction as follows:
MOHþ HþÐ MOHþ
2 ð11Þ
MOHþ2 þ F�
Ð MOH2 � Fðor MFþ H2OÞ ð12Þ
MOH ][ + 2F−
MOF
MF 2 + H2O[ ð13Þ
where M represents metal ion (Al, Fe or Si). The first reaction involves the
protonation of the neutral sites, usually taking place at pH values below the pHpzc
of the adsorption media (red mud). According to the second reaction, fluoride ions
interact with the positively charged sites to form either the outer-sphere com-
plexes or inner-sphere complexes with elimination of water molecule. The third
reaction involves interaction between fluoride and the neutral sites forming inner-
sphere complex.
Collagen fiber, an abundant natural biomass, comes from the skin of animals
and has been traditionally used as raw material in leather manufacturing. The
collagen molecule is composed of three polypeptide chains with triple-helical
structure, and they are aggregated through hydrogen bonds to form collagen
fiber. Collagen fiber is water insoluble but is a hydrophilic material. According to
the principles of leather manufacture, collagen fiber that has abundant functional
groups is capable of chemically reacting with many kinds of metal ions, such as
Cr(III), Al(III), Zr(IV). Thus, Liao and Shi [67] prepared a novel adsorbent by
impregnating Zr(IV) on collagen fiber, and its adsorption behavior in removing
M. S. Onyango and H. Matsuda22

fluoride from water was investigated. The adsorption capacity was 43.51mg/g
(Table 6) at pH ¼ 5.5. The adsorption isotherms were well fitted with the
Langmuir equation. The adsorption capacity increased with an increase in tem-
perature suggesting an endothermic adsorption. These facts imply that the
mechanism of chemical adsorption might have been involved in the adsorption
process of fluoride on the adsorbent and that fluoride ions formed a monolayer on
the surface of the adsorbent. The adsorption kinetics of fluoride onto Zr(IV)-
impregnated collagen fiber were described by Lagergren’s pseudo-first-order rate
model. In addition, results of desorption indicated that this adsorbent was easily
regenerated by use of dilute NaOH solution.
In a similar study operated in a batch mode, Oguz [23] used gas concrete waste
materials to remove F– from aqueous solutions under varying experimental con-
ditions such as solution pH and temperature. It was thought that the removal of
fluoride by gas concrete took place both by adsorption and precipitation of Al3+ and
Ca2+ salts. As a result of this study, it was concluded that wastes of gas concrete
were an efficient adsorbent (about 96%) for the removal of fluoride ions from water.
(g) Polymeric materials. Chelating resins have been recognized for their prom-
ising metal-adsorption properties. Utilizing their ability to adsorb trivalent metals
and their large internal matrices, several author have studied extensively the
application of metal-loaded polymeric resins as potential adsorbents for anions: in
particular, fluoride. La(III)-loaded PMA resin, Zr(IV)-loaded Amberlite XAD-7,
La(III)-AFB resin, Pr(III)-AFB resin [68], Al(III)-AMPA resin [69], La(III)-impreg-
nated silica gel, cross-linked pectic acid (CPA) gel, phosphorylated cross-linked
orange juice (POJR) gel, La(III)-loaded 200CT resin, saponificated orange resi-
due (SOJR) are some of the polymeric adsorbents that have been tested for
fluoride uptake in acidic to near neutral pH range using a batch mode of operation.
For these materials, their capacities are appreciable higher than those of other
adsorbents. Because of the metal loading onto the adsorbents, the mechanism of
fluoride removal from water is that due to ligand exchange between fluoride ions
from water and hydroxyl ions from the resin. Not much is known about the large-
scale operation of these adsorbents and nor is their long-term stability well de-
fined from the scanty literature available. However, Fang et al. [70] presented
column dynamics of fluoride removal from water using La(III)-loaded 200CT resin.
They found that the adsorbent could only process 50-bed volumes before break-
through was reached indicating that the high-batch capacities (Table 7) of these
adsorbents are fallacious. Because these kinds of adsorbent are synthetic, they
are expected to be relatively expensive.
(h) Layered double hydroxides. In nature layered double hydroxides (LDHs) are
very rare; however, they can be synthesized in a laboratory by a co-precipitation
method. The applications of LDHs as adsorbents to selectively remove anionic
organic or inorganic pollutants from aqueous solutions have attracted consider-
able attention in the recent past [71–79] .The LDHs, also called hydrotalcite-like
Fluoride Removal from Water Using Adsorption Technique 23
compounds or anion clays, consist of brucite-like hydroxide sheets. Many cations
can be incorporated in the brucite-like sheets. The general formula is
½MII1�xM
IIIx ðOHÞ2�
xþ½ðAn�Þx=n �mH2O�x� ð14Þ
where MII is divalent cation like Mg2+, Zn2+, Cu2+, etc., MIII trivalent cations like
Al3+, Cr3+, Fe3+, etc. and An– anion [80]. Owing to the partial substitutions of MIII
for MII, the hydroxide sheets are positively charged and require intercalation of
anions such as CO32–, Cl– or NO3
– to remain electrically neutral. Studies have
shown that LDHs can uptake some inorganic or organic anionic pollutants by
exchange with interlayer anions [74,75], but the efficiency of uptake is affected
considerably by the properties of interlayer anions. Generally, LDHs have greater
affinities for multivalent anions such as CO32– and PO4
3� than for monovalent
anions. In a recent study by Das et al. [18], calcined Zn/Al hydrotalcite-like com-
pound (HTlc) was used to remove fluoride from aqueous solution. The maximum
adsorption took place within 4 h at pH 6.0. The fluoride removal was exothermic in
nature, the efficiency increased with an increase in the adsorbent dose, but de-
creased with an increase in the fluoride concentration. The maximum adsorption
capacity was 16.2mg/g at 301C.
(i) Zeolites. Zeolites are aluminosilicates with a framework structure of (SiAl)O4
tetrahedral containing pores filled with water molecules and exchangeable cat-
ions. The ions and molecules of water contained in the voids have a considerable
freedom of movement that leads to ion exchange and reversible dehydration.
Zeolites are abundantly available in both natural and synthetic form and among
them are: Zeolite A, Zeolite X, Zeolite Y, Zeolite F9, Clinoptilolite, Mordenite, HSZ
Table 7. Summary of adsorption capacities of selected polymeric materials
Source Material
Capacity (mg F/g)
(BV: bed volume)
Mode of
operation
Chikuma and
Nishimura [68]
Pr(III)-AFB resin 0.5 Batch
Popat et al. [69] Al(III)-AMPA
resin
11.16 Batch
Popat et al. [69] Al(III)-AMPA
resin
86.7 BV Column
Fang et al. [70] 200CT resin 5.39 Batch
Fang et al. [70] 200CT resin 50 BV at breakthrough Column
Fang et al. [70] IR124 resin 42.0 Batch
Fang et al. [70] CPA gel 39.3 Batch
Fang et al. [70] POJR gel 22.2 Batch
Fang et al. [70] SOJR gel 16.15 Batch
M. S. Onyango and H. Matsuda24

300HUD, Erionite, Zeolite ZSM-5, Offretite, Type L and Omega. Over the years,
zeolites have gained enormous applications especially in sorption processes as
evidenced from researches by Song et al. [81], Garcıa-Sanchez et al. [82], Farm
[83], Doula and Ioannou [84], Majdan et al. [85], Dakovic et al. [86], Dal Bosco
et al. [87], Turan et al. [88] and Wingenfelder et al. [89]. Recent adsorption data of
anions by surface-tailored zeolite suggests that this novel media has potential for
water treatment [90–95].
By using the wet impregnation method, a novel adsorbent, aluminum-loaded
Shirasu-zeolite P1 (Al-SZP1), was developed for the removal of fluoride ions from
aqueous system [96]. The dependence of removal percentage upon aluminum
concentration in the loading solution, pH, initial concentration and co-existing
anions was investigated. The rate of adsorption of fluoride followed first-order
kinetics, equilibrium data described by Freundlich isotherm, while the mechanism
was supposedly an ion exchange process between fluoride and the hydroxide
groups on the surface of A1-SZP1. In another study, a new adsorbent, cerium(IV)
oxide coated on SiMCM-41 ((Ce)SiMCM-41), was prepared by Xu et al. [97] for
the removal of fluoride ions from water. Factors investigated were the number of
impregnations, Ce/Si ratios, the concentration of F– ions, pH values and calci-
nation temperatures. The dynamics, isotherms and mechanism of adsorption of
F– ions were discussed. Using a similar impregnation method, Onyango et al.
[98–100], have shown that low-silica zeolites can be charge-reversed and used in
fluoride removal from water. Table 8 summarizes some of the reported zeolite
capacities.
3.2. Characteristics of fluoride adsorption onto surface-tailored low-silica zeolite
In this section, detailed analysis of fluoride adsorption characteristics are pro-
vided. Zeolite-adsorption media is chosen for this purpose. Zeolites are well
Table 8. Summary of adsorption capacities of zeolites
Source Material Capacity (mg F/g)
Mode of
operation
Xu et al. [97] (Ce)SiMCM-41 114.4 Batch
Onyango et al. [98] La-exchanged F9 54.3 Batch
Onyango et al. [98] Al-exchanged F9 39.5 Batch
Onyango et al. [100] Al-exchanged A4 41.4a Batch
Onyango et al. [100] Al-pretreated HUD 28.1a Batch
Onyango et al. [100] Na-Al-pretreated HUD 34.8a Batch
a Indicates values are determined from Dubinin–Radushkevitch isotherm.
Fluoride Removal from Water Using Adsorption Technique 25
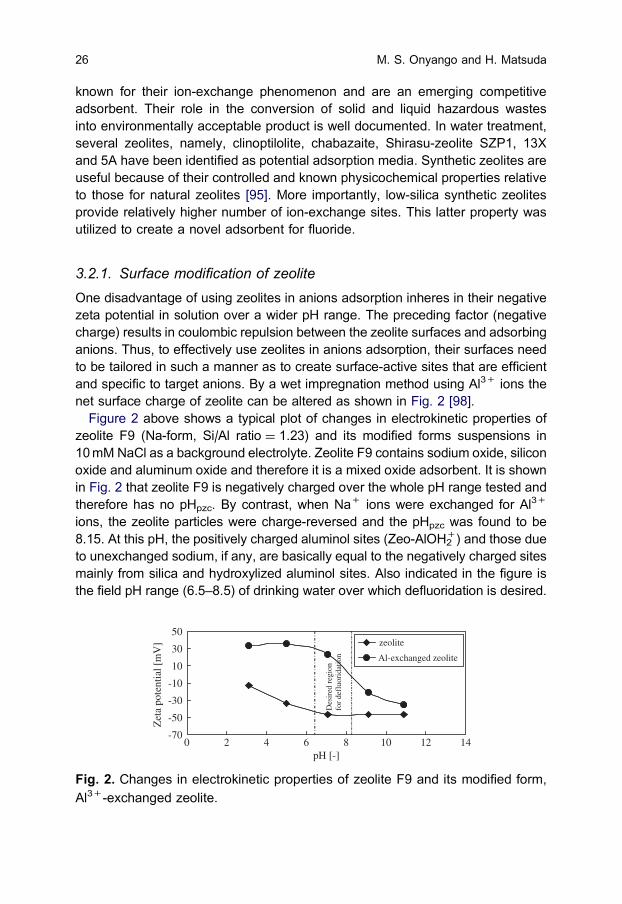
known for their ion-exchange phenomenon and are an emerging competitive
adsorbent. Their role in the conversion of solid and liquid hazardous wastes
into environmentally acceptable product is well documented. In water treatment,
several zeolites, namely, clinoptilolite, chabazaite, Shirasu-zeolite SZP1, 13X
and 5A have been identified as potential adsorption media. Synthetic zeolites are
useful because of their controlled and known physicochemical properties relative
to those for natural zeolites [95]. More importantly, low-silica synthetic zeolites
provide relatively higher number of ion-exchange sites. This latter property was
utilized to create a novel adsorbent for fluoride.
3.2.1. Surface modification of zeolite
One disadvantage of using zeolites in anions adsorption inheres in their negative
zeta potential in solution over a wider pH range. The preceding factor (negative
charge) results in coulombic repulsion between the zeolite surfaces and adsorbing
anions. Thus, to effectively use zeolites in anions adsorption, their surfaces need
to be tailored in such a manner as to create surface-active sites that are efficient
and specific to target anions. By a wet impregnation method using Al3+ ions the
net surface charge of zeolite can be altered as shown in Fig. 2 [98].
Figure 2 above shows a typical plot of changes in electrokinetic properties of
zeolite F9 (Na-form, Si/Al ratio ¼ 1.23) and its modified forms suspensions in
10mM NaCl as a background electrolyte. Zeolite F9 contains sodium oxide, silicon
oxide and aluminum oxide and therefore it is a mixed oxide adsorbent. It is shown
in Fig. 2 that zeolite F9 is negatively charged over the whole pH range tested and
therefore has no pHpzc. By contrast, when Na+ ions were exchanged for Al3+
ions, the zeolite particles were charge-reversed and the pHpzc was found to be
8.15. At this pH, the positively charged aluminol sites (Zeo-AlOH2+) and those due
to unexchanged sodium, if any, are basically equal to the negatively charged sites
mainly from silica and hydroxylized aluminol sites. Also indicated in the figure is
the field pH range (6.5–8.5) of drinking water over which defluoridation is desired.
-70
-50
-30
-10
10
30
50
0 2 4 6 8 10 12 14pH [-]
Zet
a po
tent
ial [
mV
]
Al-exchanged zeolite
Des
ired
reg
ion
for
defl
uori
datio
n
zeolite
Fig. 2. Changes in electrokinetic properties of zeolite F9 and its modified form,
Al3+-exchanged zeolite.
M. S. Onyango and H. Matsuda26

Over this pH range, the number of active sites in Al-exchanged zeolite F9 is
expected to reduce substantially as can be deduced from the fall in zeta poten-
tial. Using the surface-modified zeolite, batch equilibria and kinetics and column
dynamic were studied.
3.2.2. Batch fluoride adsorption equilibrium
Figure 3 summarizes the typical equilibrium data for fluoride sorption on
0.150–0.300mm surface-tailored zeolite F9. Only the low-concentration range
was considered where the Henry’s law is applicable. Co-incidentally, fluoride ions
exist in natural systems, such as groundwater, at low concentrations. It is
observed that the data fit well to the linear isotherm suggesting sorption onto sites
with high capacity for fluoride. From Fig. 3, the linear isotherm constant, K
( ¼ 2.337 L/g), was obtained and coupled into the diffusion model, equation (16).
3.2.3. Prediction of mass transfer processes
Adsorption process involves the transfer of a species from the bulk solution to the
adsorbent surface, then to the interior matrix of the adsorbent where the species
is bound onto the active sites. Figure 4 shows the effect of varying initial fluoride
concentration from 5 to 20mgF/L. The quantities of fluoride removed from
the solution increased with an increase in initial concentration. Diffusion is a
passive transport process driven/governed by the concentration gradient at the
solution/sorbent interface. At higher initial concentration, the driving force, which
is the difference between the bulk-phase concentration and the sorbed-phase
concentration, is expected to be higher. This leads to larger uptake in both the
early and longer contact times, for higher initial concentration.
During transport, both external and intraparticle mass transfer resistances play
a role to a varying degree. A first step in adsorber design is to predict or
Qe = 2.3371Ce
R2 = 0.9962
0
2
4
6
8
10
0 1 2 3 4
Ce [mg/L]
Qe
[mg/
g]
Fig. 3. Linear adsorption isotherm. Initial fluoride concentration ranged from5–20mg/L.
Fluoride Removal from Water Using Adsorption Technique 27

determine these resistances. Thus, a batch operation mode was adopted to de-
termine the film and intraparticle diffusion coefficients under varying initial fluoride
concentration (5–20mg/L), as an example. The mass transfer values obtained
from such study can then be used as first estimates in mechanistic modeling of
columns. The evaluation of external resistance to mass transfer was done, by
determining the film diffusion coefficients according to a simple method proposed
by Mckay [101]. The method involves the calculation of the initial slope of the
concentration against time curve and substituting the obtained value into Equation
dðCt=CoÞ
dt
����t¼0
¼ �kfSA ð15Þ
where kf is the film diffusion coefficient (cm/s) and SA the specific surface area of
the zeolites (cm�1). The specific surface area is expressed as
SA ¼6ms
rpdð1� �pÞð16Þ
where ms is the zeolite mass per unit volume (g/cm3), rp the density of zeolite
(g/cm3), d the average zeolite size (cm) and ep the porosity. The film diffusion
coefficients determined according to equation (15) are summarized in Table 9.
The magnitude of kf values was in the range 2.07� 10�2–3.08� 10�2 cm/s. This
range of kf values is high implying less external resistance to mass transfer.
Moreover, they are comparable to those reported by Mahramanlioglu et al. [14]
and Ghorai and Pant [39] for fluoride adsorption on SBE and AA, respectively, and
indicate the rapidity with which fluoride ions were transported to the external
surface of the zeolites.
In general, as an adsorbate is transported in the internal matrix of adsorbent,
there is tendency of adsorbate–adsorbate interaction in the pores and hopping,
from site to site, of adsorbed species along the wall of the adsorbent. These
phenomena give rise to pore and surface diffusion resistances to intraparticle
0
1
2
3
4
5
6
7
8
0 50 100 150 200 250 300 350Time [min]
Upt
ake
[mgF
/g] 5 mg/l
10 mg/l
15 mg/l20 mg/lintraparticlediffusion
Fig. 4. Effect of initial concentration on fluoride uptake: particle size,0.150–0.300mm; sorbent dose, 2 g/L; agitation speed, 300 rpm and solutiontemperature, 295.1K.
M. S. Onyango and H. Matsuda28

mass transfer. Thus, a parallel pore–surface diffusion model for a differential
radial shell of zeolite adsorbent is given by
�p@c
@tþ rpð1� �pÞ
@q
@t¼ Dp�p
1
r2@ r2 @c
@r
� �@r
þ rpDs
1
r2@ r2 @q
@r
� �@r
ð17Þ
where c and q are the pore- and adsorbed-phase concentrations, respectively, Dp
and Ds the pore and surface diffusion coefficients, ep the particle porosity, rp theparticle density, r the radial dimension and t the time. In this model it is assumed
that a local equilibrium exists between the adsorbing fluoride ions and those in
pore phase for 0rrrro and that equilibrium is described by a linear isotherm as
described in Section 3.2.2. Analytical solution of the above equation is given by
Crank [102]:
Qav;t ¼ Qe 1�X1n�1
6aðaþ 1Þ expð�b2nk0tÞ
9þ 9aþ b2na2
( )ð18Þ
where ro is the mean particle radius, Qav,t is the average amount adsorbed in the
pore and surface, Qe the equilibrium concentration and bns are the positive non-
zero roots of
tan bn ¼3bn
3þ ab2nð19Þ
and a ¼ 1/rK represents the sorbent load factor and k0 ¼ De/ro2 represents the
intraparticle diffusional time constant, De (combines pore and surface diffusion
coefficients) is the effective intraparticle diffusion coefficient and r equal to sor-
bent mass to particle-free volume. The intraparticle resistance to sorbate trans-
port is determined by intraparticle diffusion coefficient, DeU Thus, the De values
were determined, by minimizing the normalized standard deviation (Dq%) and
are summarized in Table 9. As the initial concentrations were raised, the effec-
tive diffusion coefficients decreased in a non-linear fashion. McKay and Al-Duri
[103] found a non-linear decrease in effective diffusivity with an increase in
dyes concentration and attributed this to surface diffusion effects. To the contrary,
Table 9. Summary of mass transfer parameters for batch fluoride adsorption
Initial concentration
(mg/L) Mass transfer parameters
Kf (cm/s) De (cm2/s) NBi ¼ kf ro/De (�) Dq%5 3.05� 10�2 1.11� 10�9 *100 4.66
10 2.07� 10�2 5.27� 10�10 *100 1.45
15 2.45� 10�2 3.22� 10�10 *100 2.16
20 3.08� 10�2 2.68� 10�10 *100 1.48
Fluoride Removal from Water Using Adsorption Technique 29
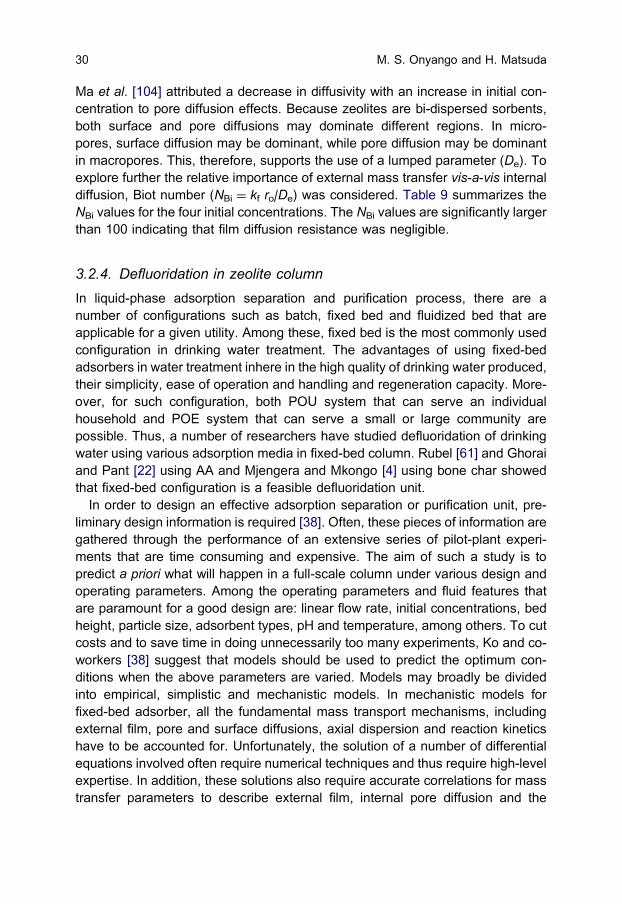
Ma et al. [104] attributed a decrease in diffusivity with an increase in initial con-
centration to pore diffusion effects. Because zeolites are bi-dispersed sorbents,
both surface and pore diffusions may dominate different regions. In micro-
pores, surface diffusion may be dominant, while pore diffusion may be dominant
in macropores. This, therefore, supports the use of a lumped parameter (De). To
explore further the relative importance of external mass transfer vis-a-vis internal
diffusion, Biot number (NBi ¼ kf ro/De) was considered. Table 9 summarizes the
NBi values for the four initial concentrations. The NBi values are significantly larger
than 100 indicating that film diffusion resistance was negligible.
3.2.4. Defluoridation in zeolite column
In liquid-phase adsorption separation and purification process, there are a
number of configurations such as batch, fixed bed and fluidized bed that are
applicable for a given utility. Among these, fixed bed is the most commonly used
configuration in drinking water treatment. The advantages of using fixed-bed
adsorbers in water treatment inhere in the high quality of drinking water produced,
their simplicity, ease of operation and handling and regeneration capacity. More-
over, for such configuration, both POU system that can serve an individual
household and POE system that can serve a small or large community are
possible. Thus, a number of researchers have studied defluoridation of drinking
water using various adsorption media in fixed-bed column. Rubel [61] and Ghorai
and Pant [22] using AA and Mjengera and Mkongo [4] using bone char showed
that fixed-bed configuration is a feasible defluoridation unit.
In order to design an effective adsorption separation or purification unit, pre-
liminary design information is required [38]. Often, these pieces of information are
gathered through the performance of an extensive series of pilot-plant experi-
ments that are time consuming and expensive. The aim of such a study is to
predict a priori what will happen in a full-scale column under various design and
operating parameters. Among the operating parameters and fluid features that
are paramount for a good design are: linear flow rate, initial concentrations, bed
height, particle size, adsorbent types, pH and temperature, among others. To cut
costs and to save time in doing unnecessarily too many experiments, Ko and co-
workers [38] suggest that models should be used to predict the optimum con-
ditions when the above parameters are varied. Models may broadly be divided
into empirical, simplistic and mechanistic models. In mechanistic models for
fixed-bed adsorber, all the fundamental mass transport mechanisms, including
external film, pore and surface diffusions, axial dispersion and reaction kinetics
have to be accounted for. Unfortunately, the solution of a number of differential
equations involved often require numerical techniques and thus require high-level
expertise. In addition, these solutions also require accurate correlations for mass
transfer parameters to describe external film, internal pore diffusion and the
M. S. Onyango and H. Matsuda30
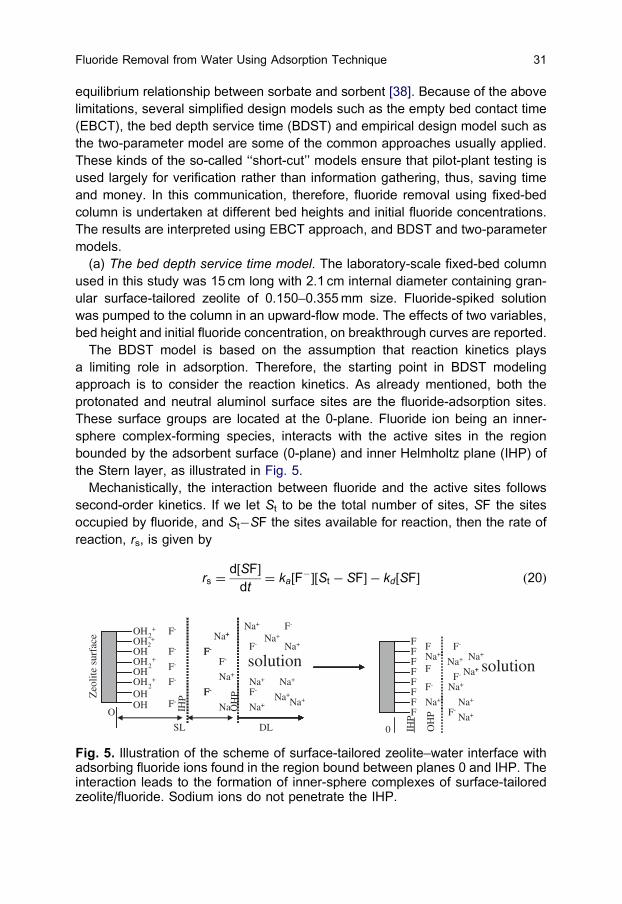
equilibrium relationship between sorbate and sorbent [38]. Because of the above
limitations, several simplified design models such as the empty bed contact time
(EBCT), the bed depth service time (BDST) and empirical design model such as
the two-parameter model are some of the common approaches usually applied.
These kinds of the so-called ‘‘short-cut’’ models ensure that pilot-plant testing is
used largely for verification rather than information gathering, thus, saving time
and money. In this communication, therefore, fluoride removal using fixed-bed
column is undertaken at different bed heights and initial fluoride concentrations.
The results are interpreted using EBCT approach, and BDST and two-parameter
models.
(a) The bed depth service time model. The laboratory-scale fixed-bed column
used in this study was 15 cm long with 2.1 cm internal diameter containing gran-
ular surface-tailored zeolite of 0.150–0.355mm size. Fluoride-spiked solution
was pumped to the column in an upward-flow mode. The effects of two variables,
bed height and initial fluoride concentration, on breakthrough curves are reported.
The BDST model is based on the assumption that reaction kinetics plays
a limiting role in adsorption. Therefore, the starting point in BDST modeling
approach is to consider the reaction kinetics. As already mentioned, both the
protonated and neutral aluminol surface sites are the fluoride-adsorption sites.
These surface groups are located at the 0-plane. Fluoride ion being an inner-
sphere complex-forming species, interacts with the active sites in the region
bounded by the adsorbent surface (0-plane) and inner Helmholtz plane (IHP) of
the Stern layer, as illustrated in Fig. 5.
Mechanistically, the interaction between fluoride and the active sites follows
second-order kinetics. If we let St to be the total number of sites, SF the sites
occupied by fluoride, and St�SF the sites available for reaction, then the rate of
reaction, rs, is given by
rs ¼d½SF�
dt¼ ka F
�½ � St � SF½ � � kd SF½ � ð20Þ
OH
P
Na+
NaNa+
Na
F-
F-
F-
F-
F-
F-
OH
0
+Na+
Na+
Na+
Na+
Na+
Na+
solution
+
Na+
+
Na+
Na+
Na+
F-
F- F
DL
OH
OH
OH2+
OH
2+
OH2+
F-
F-
F-
F-
F-
FFFFF
FF
F
Zeo
lite
surf
ace
solution
SL
O IHP
Na+
Na+
Na+
-
F-
F-
F
F
F-
OH
OH2+
IHP
OH
P
Na+
Na+
Fig. 5. Illustration of the scheme of surface-tailored zeolite–water interface withadsorbing fluoride ions found in the region bound between planes 0 and IHP. Theinteraction leads to the formation of inner-sphere complexes of surface-tailoredzeolite/fluoride. Sodium ions do not penetrate the IHP.
Fluoride Removal from Water Using Adsorption Technique 31

or simply
dq
dt¼ kacðqm � qÞ � kdq ð21Þ
where [SF] ¼ q, [St] ¼ qm, [F�] ¼ c, ka is the forward rate constant and kd the
backward rate constant. If the zeolite–fluoride bonding is strong, then ka b kd.
Moreover, Bohart and Adams [105] simplified the above expression for ion ex-
change as follows:
dq
dt¼ �kaqc ð22Þ
In carrying out material balance over a small control volume of a fixed bed, it
is considered that fluoride removal is solely by adsorption onto the zeolite par-
ticles. Additionally, the system is assumed to be isothermal, non-equilibrium and
non-adiabatic single-component fixed-bed adsorption. For the control volume
(Fig. 6), Axdz, for a limiting situation z-0, the material balance is given by
@Cz
@t¼ DL
@2Cz
@z2� u
@Cz
@z� Cz
@u
@z�
ð1� �Þ
�rs
@q
@tð23Þ
where Ax is the cross-sectional area of the bed, z the axial dimension, DL the axial
dispersion coefficient, Cz the concentration, w (Fig. 6) the bed weight, u the linear
velocity, e the bed porosity and rs the particle density. For mathematical expe-
diency, axial dispersion is assumed negligible and for dilute solution u is assumed
to be constant, and therefore a combination of equations (22) and (23) gives
@Cz
@tþ u
@Cz
@z¼ �kaqc ð24Þ
δz
Control
volumeδwε
CzDLu
uDLCz-δz
Fig. 6. Control volume of a fixed bed over which material balance is carried.
M. S. Onyango and H. Matsuda32

If the volumetric sorption is expressed by No (gF/L), then the solution of equation
(24) over the bed length is given by a simplistic model, well known as the BDST,
expressed as
lnCo
Ct� 1
� �¼ ln ekaNoZ=u � 1
� �� kaCot ð25Þ
The linearized form of the above equation is given by
t ¼NoZ
Cou�
1
kaCo
lnCo
Cb
� 1
� �; for Ct ¼ Cb ðbreakthrough concentrationÞ ð26Þ
Application of the BDST model (equation (25)) to simulate breakthrough curves of
fluoride adsorption onto zeolite in a fixed bed is shown in Fig. 7. The BDST model
satisfactorily simulates the experimental data points. It is observed that as the
bed height is raised, it takes longer time for a given concentration to exit due to
increases in the number of active sites and possibly due to increase in contact
time. The BDST model was further considered in the linearized form according to
equation (26) and as shown in Fig. 8, in which the service time is correlated with
the bed depth. A highly significant linear regression line was obtained. From the
linear plot, for Cb ¼ 1.5mg/L (WHO permissible limit), the rate constant ka was
found to be 8.3� 10�4 L/mg/min. The critical bed depth was also determined. The
critical bed depth (Z0) represents the theoretical depth of adsorbent necessary to
prevent the sorbate concentration to exceed the limit concentration Cb. From
equation (26) when t ¼ 0, we have
Z0 ¼u
kaNo
lnCo
Cb
� 1
� �ð27Þ
The critical bed depth (Z0) was found to be 0.8 cm. When the column capacity at
breakthrough was compared with batch capacity at the same concentration, the
0
2
4
6
8
10
0 500 1000 1500 2000 2500Time [min]
Eff
luen
t con
cent
ratio
n [m
gF/L
]
2 cm (8.2 g)
3 cm (12.3 g)
4.0 cm (16.4 g)
BDST model
Fig. 7. Effect of bed height on fluoride removal from water. BDST model sim-ulation is represented by continuous line. Initial concentration ¼ 10mg/L; flowrateE9.8mL/min; particle size ¼ 0.150–0.355mm; and pH ¼ 6.2–6.4.
Fluoride Removal from Water Using Adsorption Technique 33

former was found to be higher. This and other useful pieces of information are
summarized in Table 10.
In another experimental run, the initial fluoride concentration was varied from
5 to 20mg/L as shown in Fig. 9. It is observed that the higher the concentration,
the steeper the slope of breakthrough curves, hence a reduction in zone spread-
ing time. Also, the breakthrough curves shift towards the origin with increase in
initial concentration. These observations are due to the fact that at higher con-
centration, the active sites are quickly filled up. From this figure and model simu-
lation, the times required for the exit concentration to rise to breakthrough point
(Cb ¼ 1.5mg/L) and 50% of initial concentration at the exit and column capacity
were determined and are summarized in Table 10.
In optimizing fixed bed, it is important to know how the EBCT affect the ad-
sorbent exhaustion rate (AER) (AER: mass of adsorbent per volume of water
treated at breakthrough). Thus, AER was determined at various adsober heights
and initial concentrations. On the one hand, it was found that an increase in bed
height resulted in a decrease in AER, while on the other, an increase in initial
concentration resulted in a corresponding increase in AER (Table 10). The former
suggests that within the range of heights used in this study, a longer bed is
preferred, while from the latter, it can be concluded that lower concentrations lead
to processing of more bed volumes.
(b) The two-parameter model. A simple two-parameter model is an empirical
expression for modeling breakthrough curves and it takes the form [106]
Ct
Co
¼1
21þ erf
ðt� toÞ exp sðt=t0Þ� �
ffiffiffi2
pst0
� �ð28Þ
where erf[x] is the error function of x, defined by
erf½x� ¼2ffiffiffiffiP
p
Z x
0
expð�Z2Þ dZ ð29Þ
where t is the column residence time, t0 the time at which the effluent concen-
tration is half the influent concentration and s represents the standard deviation
t = 330Z - 113R2 = 0.9987
t = 260Z - 209R2 = 1
0
200
400
600
800
1000
1200
1400
0 1 2 3 4 5
Bed Depth [cm]
Serv
ice
time
[min
] 0.15 Co0.5 Co
Fig. 8. BDST: fixed bed design.
M. S. Onyango and H. Matsuda34

Table 10. Summary of BDST and EBCT data
Variable
Lowest
concentration
(mg/L)
Time to
breakthrough,
Cb (min)
Time to 0.5
Co (min)
Capacity at
Cb (mg/g)
Batch
capacity at Cb
(mg/g) EBCT (min) AER (g/L)
Effect of Bed depth
2 cm 0.42 310 540 3.72 3.49 0.69 2.70
3 cm 0.19 573 891 4.64 3.49 1.06 2.13
4 cm 0.21 830 1200 4.79 3.49 1.39 2.02
Effect of initial concentration
5mg/L 0.23 1211 1524.5 3.79 3.49 1.06 1.04
10mg/L 0.19 573 891 4.64 3.49 1.06 2.13
20mg/L 0.28 307.5 473 4.93 3.49 1.06 3.84
Fluorid
eRemovalfro
mWaterUsingAdsorptio
nTechnique
35

which is a measure of the slope of the breakthrough curve. Chu [106] further
suggests that the use of simpler and more tractable models that avoid the need
for numerical solution appears more suitable and logical and could have imme-
diate practical benefits. In general, such a model is easier to use and more
efficient from a computational point of view compared to the use of full mech-
anistic models which are much more complicated mathematically. For these
reasons, we also explored the possibility of simulating the breakthrough curves
using the two-parameter model (equation (28)), by considering the effects of bed
height and initial fluoride ions concentration.
The model parameters s and t0 for the adsorption of fluoride onto surface-
tailored zeolite were determined by matching equation (28) with experimental
data. This was done by minimizing the objective function, f, expressed as
f ¼X Cecp � Ccal
�� ��n
ð30Þ
where Cexp and Ccal are the experimental and calculated values of concentration
at the column exit and n is the number of data points. In Figs. 10 and 11, the
breakthrough curves determined using the best-fit values of s and t0 are rep-
resented by continuous lines. As was with the case of BDST model, the data
points are well represented with the two-parameter model. When the height of the
bed and the initial concentration were increased, s decreased (Table 11). The
parameter t0 on the other hand increases with an increase in bed height and a
decrease in initial concentration.
Although both the BDST and two-parameter models fit the experimental data
points so well, care should be taken when they are being used in fixed-bed
design. Consequently, Chu [106] in contradicting an early work of Ko et al. [38],
suggests that these models should not be used to predict breakthrough a priori.
The modeling approach presented here is thus for the purpose of illustration only.
0
0.2
0.4
0.6
0.8
1
0 500 1000 1500 2000 2500 3000Time [min]
Ct /
Co
[-]
20 mgF/L10 mg/L5 mg/LBDST model
Fig. 9. Effect of initial concentration on fluoride removal from water. BDST modelsimulation is represented by continuous line. Bed height ¼ 3 cm, flow rate-E9.8mL/min; particle size ¼ 0.150–0.355mm; and pH ¼ 6.2–6.4.
M. S. Onyango and H. Matsuda36

A better approach would be to correlate the model parameters with several
process variables before the model can be used to design and scale-up the
column.
3.3. Configurations and modes of operation of adsorbent-baseddefluoridation units
Once an adsorption media is chosen and where applicable, model simulations
are satisfactory, the next step would be to consider various defluoridator con-
figurations. There are several attractive water treatment configurations based
on adsorption technique. These configurations are also principally applicable to
water defluoridation. The choice of a given configuration will depend on the
amount of water to be treated, the knowledge base of the general population of a
given region where the configuration is to be applied, performance and costs of
0
0.2
0.4
0.6
0.8
1
0 500 1000 1500 2000 2500Time [min]
Ct/
Co
[-]
20 mg/L10 mg/L5 mg/ltwo parameter model
Fig. 11. Effect of initial fluoride concentration on fluoride removal from water.Two-parameter model simulation is represented by continuous line.
0
2
4
6
8
10
0 500 1000 1500 2000 2500
Time [min]
Eff
luen
t con
cent
ratio
n [m
g/L
]
2 cm (8.2g)3 cm (12.3g)4 cm (16.4 g)two parameter model
Fig. 10. Effect of bed height on fluoride removal from water. Two-parametermodel simulation is represented by continuous line.
Fluoride Removal from Water Using Adsorption Technique 37

adsorption media and of developing a given defluoridation unit. Established and
potential defluoridation configurations and their modes of operation are described
below.
3.3.1. ‘‘Tea bag’’ POU system
Fluoride-related health hazards are associated with the use of fluoride-contami-
nated water for drinking and cooking. This corresponds only to 2–4 L per capita
per day. Fluoride removal in rural areas in LDCs, where centralized water treat-
ment and distribution facilities are unavailable, should consequently be carried
out at a household level and the system applied should be simple and affordable.
In this regard, ‘‘tea bag’’ POU system becomes handy. Although this kind of
system has not been specifically reported for water defluoridation, it has been
tested for arsenic [37,107]. It is therefore a short-term potential technique worth
considering. In this technique, adsorption medium is placed in a tea bag-like
packet, which is subsequently placed in a bucket of water to be treated. To
ensure faster defluoridation kinetics, the bag should be swirled inside the water. It
therefore operates like a batch reactor and hence requires a relatively longer
adsorption time to achieve the permissible levels. Since the swirling motion is
supposed to be human-powered, the technique would require a material with very
fast kinetics or very fine adsorption media.
3.3.2. ‘‘Coffee filter’’ POU system
This is also a simple and potential adsorbent-based technique that is worth
considering as a short-term solution to fluorosis pandemic. Laboratory trials
for the removal of arsenic from water have been reported [107]. Principally, the
operation of this kind of defluoridation unit is similar to that of a coffee filter.
Table 11. Summary of two-parameter model data
Bed height (cm) Model parameters
s (�) t0 (min)
2 0.315 525
3 0.293 890
4 0.250 1167
Initial concentration (mg/L)
5 0.300 1505
10 0.293 890
20 0.230 473
M. S. Onyango and H. Matsuda38

Accordingly, water to be treated is passed through adsorption media contained in
a filter paper. In doing so, the adsorption media retains fluoride ions, while clean
water passes through the filter. Thus, because of the dynamic nature of this
process, the adsorption time is relatively shorter than that of the ‘‘tea bag’’ POU
system. This kind of system may be handy when only a small amount of water for
drinking and cooking is needed. One disadvantage of such a system is that the
quality of treated water cannot be guaranteed since its performance depends on
the ingenuity of the user.
3.3.3. Household defluoridation POU unit
The use of household defluoridation POU units has increased in recent times in
several developing countries such as Kenya, Tanzania and India. As the name
suggests, the units are mostly small and can only treat a small amount of water to
serve a household. These units operate under the same principle as fixed beds;
water to be defluoridated is passed in an upward or downward flow through a
small column or bucket containing adsorption media. The designs, however, vary
from region to region. The mostly reported adsorption media for this kind of
defluoridator are AA and bone char. In India, for example, a Mytry defluoridation
filter, which is a two-bucket system with the upper bucket containing AA has been
developed and implemented. Murcott [47] reported that since 2004, the MDFFT
had sold 9000 units and produces 50 units daily.
In the same country, UNICEF launched an AA household defluoridator unit
shown in Fig. 12 [108]. The unit basically consists of two chambers, upper bucket
containing adsorption media and lower chamber where the treated water is col-
lected. The upper chamber is fitted with a simple flow control device (removable
circular ring) at the bottom. The average flow is 10 L/h. The main component of
this unit is a PVC casket containing 3Kg of AA giving a bed depth of 17 cm.
A perforated plate of either stainless steel or tin metal is placed on the top of AA
bed to facilitate uniform distribution of raw water. The lower chamber of the
defluoridator is fitted with a tap to draw the treated water. Since adsorption media
efficiency reduces during operation, regeneration is required for economic and
environmental impacts reasons. Thus, exhausted AA can be regenerated by dip-
regeneration method. In this method, the casket containing exhausted AA is
placed in a plastic bucket containing 8 L of 1% NaOH for 4 h. The casket is then
transferred to a bucket containing water and is rinsed by occasional lifting.
Thereafter, the casket is placed in a plastic bucket containing 8 L of 0.20% H2SO4
for 4 h. Other reports indicate that AA can be regenerated by aluminum sulfate
solution [31]. Once regeneration is done, the AA is washed till the pH rises above
7.0 and is then ready for the next defluoridation cycle.
Aluminum oxide present in soil has been utilized to make brick pieces of
15–20mm sizes that are effective in drinking water defluoridation. When the
Fluoride Removal from Water Using Adsorption Technique 39

bricks are burnt in a kiln, they become activated. A defluoridation unit using brick
pieces has been developed. The unit consists of two PVC concentric pipes, the
inner being 20mm diameter serves as the raw water inlet, while the outer one has
a diameter of 225mm. The bricks are packed in the space between the inner and
outer pipes and raw water is allowed to come in contact with the bricks from the
bottom of the unit through a perforated plate. This unit is estimated to treat 16 L of
water for drinking and cooking. Currently, the unit retails at an equivalent of USD
14 and can operate for 3 months before replacement of the media.
Moges et al. [56] and Agarwal et al. [109] have reported that ground-fired clay
pot could effectively defluoridate drinking water. However, the process is ex-
tremely slow. The use of mud pots dates back to ancient times. When mud pots
are fired, they become activated and have affinity for fluoride ions. The ability to
remove the fluoride ions, however, depends on the alumina content of the soils
used for molding the pots. These kinds of pots are cost effective and their use do
not require any know-how. They are estimated to retail at USD 0.33/pot.
In Tanzania where fluorosis is also endemic, a household bone char filter
column defluoridator has been developed [4]. This unit is slightly differently con-
figured from those described above. It has two separate detached sections. The
upper section holds water to be treated, while the lower section is column-like and
contains the adsorption media. Water from the upper section is passed by gravity
AA
220 mm
220
mm
50 mm
20 mm
150
mm
2
1
3
4
56
7Legend
1. Tap2. Collection chamber3. Flow orifice4. Perforated lower lid5. Detachable casket for AA6. Upper chamber7. Removable perforated upper
lid
AA Activated alumina
Fig. 12. Household-level AA filter [108].
M. S. Onyango and H. Matsuda40

to the bottom of the column and by upward flow the water is contacted with the
adsorption media. Treated water is directly withdrawn from the top of the column.
The disadvantage of household water treatment systems relative to those of
centralized water treatment systems is that it is difficult to monitor the perform-
ance of the units since they would be scattered in rural settings that are not easily
accessible.
3.3.4. Cartridge POU system
Cartridge POU systems are common in regions with tap water. They are relatively
expensive and are not common in developing countries. The cartridges are usu-
ally installed under the sink to treat water for cooking and drinking. The Envi-
ronmental and Research Technology – India has however developed over and
under the counter kitchen units that do not require any electricity to operate and
can be easily moved from one place to another. The adsorption media used is AA
packed in a 300 � 9 3/400 cartridge for optimum use. This cartridge can last for 6
months when used to treat water containing 10 ppm fluoride and 12 months when
the fluoride content is 5 ppm, calculated on a daily consumption of 20 L of water
per family. Recently also, an attempt has been made by Mavura et al. [110] to
construct a cartridge to be used for the defluoridation of drinking water. This
cartridge packed with bone char material can be fixed onto a domestic faucet as a
flow-through defluoridation unit. The construction material was PVC of various
sizes made from a 3/400 pipe. The efficiency of fluoride removal was determined
for the following parameters: cartridge length, flow rate of water, compactness of
bone char material and particle size with the aim of determining the optimum
conditions for a good cartridge.
3.3.5. Household POE systems
When a water system serves a few dozen homes or less, POE water treatment
systems may provide a low-cost alternative to centralized water treatment. In
POE systems, rather than treating all water at a central facility, treatment units
are installed at the entry point to individual households or buildings. POE sys-
tems can save the cost of installing expensive new equipment in a central water
treatment facility. Moreover, POE systems can also save the considerable costs
of installing and maintaining water distribution mains when they are used in
communities where homeowners have individual wells. Lahlou [111], however,
reports that AA-based POE system may be relatively expensive in terms of initial
operating and maintenance costs compared with other POE systems. Regula-
tors often have significant objections to using POE devices. Concerns include
the difficulty and cost of overseeing system operation and maintenance when
Fluoride Removal from Water Using Adsorption Technique 41

treatment is not centralized, and liability associated with entering customers’
homes. These objections have merit, particularly as system size increases and
the complexity of monitoring and servicing the devices increases. Using central-
ized water treatment should be the preferred option, and POE or POU treatment
should be considered only if centralized treatment is not possible. In general,
POE systems for drinking water defluoridation suit mainly developed countries or
those countries in economic transition.
3.3.6. Community-based tube-well-attached defluoridator
Tube-well-attached defluoridator is increasingly becoming popular among the
rural population in several LDCs and thus is a community-based water treatment
solution. This kind of unit (Fig. 13) is used to treat water serving several house-
holds or institutions like schools. In India, a fluoride treatment plant using AA
housed in a column operated in a down-flow mode is reported. The water from
the tube-well hand pump enters the unit at the bottom and flows upward through
the AA media onto which fluoride is adsorbed. Up-flow mode has also been
reported by Daw [112]. The adsorption media requires regular monitoring, so that
once the breakthrough point is exceeded, regeneration is effected. The frequency
of regeneration depends on the raw water fluoride concentration and flow rate.
1
2
1
3
4
4
Legend
1. Tap2. Defluoridator3. Hand pump4. Valve
Fig. 13. Hand pump-attached defluoridation unit [112].
M. S. Onyango and H. Matsuda42
After exhaustion, the AA media is regenerated and restored with sulfuric acid and
caustic soda. The process of regeneration and restoration requires skilled per-
sonnel, for which village-level volunteers can be trained.
3.3.7. Centralized water treatment
Fluoride can also be removed from a centralized water treatment point. This is
common in developed or countries in economic transition and provides a long-
term solution to fluoride problem in drinking water. A full-scale water purification
plant based on AA-adsorption media was reported to be in operation in Kansas,
USA. In this technique, all water to the distribution system is treated irrespective
of its intended use. Thus, it is unrealistic way of defluoridating water since the
main concern is usually fluoride ions contained in drinking water. From the tech-
nical point of view, however, centralized water treatment guarantees the quality of
drinking water since the performance of the defluoridation plant can easily be
monitored. Wider application of this technique for the sole purpose of removing
fluoride from water is not widely reported in literature.
3.4. Implementation of defluoridation units: challenges andprospects
In most third world countries as opposed to the developed nations, most people
live in the rural areas where water is scarce, the available sources are scattered,
the areas are inaccessible and the locals are ill educated. Moreover, it is esti-
mated that several hundreds of millions of people rely on unsafe drinking water
containing contaminants such as fluoride. The contaminants are known to cause
chronic poisoning. Efforts should thus be made to enlighten the rural population
about the dangers of consuming fluoride-containing water. Also, effective tech-
nologies for community and household water treatment and storage, in combi-
nation with improved hygiene should be instituted [113]. Water technologies aim
to make water clean, available, sustainable and economical. Several community
and household configurations based on adsorption technique have been de-
signed (Section 3.3) that can suit different geographical regions. Unfortunately,
only three adsorbents are currently well recognized by WHO. These are AA, bone
char and clay-based adsorbent. AA is relatively expensive and has low capacity
for fluoride, while bone char has limited acceptance in certain regions due to
religious reasons. Fortunately, indications are that some economies are growing
up rapidly and several other good performing adsorbents (Section 3.1) are now
available in abundant quantities and some at reduced cost since they are derived
from waste materials. However, as indicated in the previous sections, not so
much is known about their performance in the field since they have only been
Fluoride Removal from Water Using Adsorption Technique 43

tested under laboratory conditions. More work is thus required to ascertain their
performances.
Experience has shown that community water treatment systems hardly pass
the test of time. This is partly due to a lack of sense of ownership by the user
communities, resulting in indifferent attitude toward the operation and mainte-
nance of these plants [112]. Defluoridation plants are no exception. To succeed,
a holistic participatory approach should be adopted in dealing with defluoridation
plants/units. The local government, private sector, community-based organiza-
tions (CBOs) and the local water users should form a concerted effort in miti-
gating the fluoride problem and implementing treatment technologies. In this
regard, the local government should devise a cost-sharing method in which, say,
they provide maintenance personnel but impose some tariffs to water users.
Additionally, public–private partnership should be encouraged. Women being the
main users of fluoride treatment technologies in rural areas should not be isolated
but should participate fully. Indian experience in arsenic treatment technologies
has shown that technical solution alone will rarely lead to a sustainable solution
[47]. Thus, local knowledge and ingenuity should be inputted into implementation
phase to reach higher success rates because they address the problems or
issues specific to the community.
4. CONCLUSIONS
This paper provided an overview of the defluoridation techniques with accom-
panying decision framework for helping utilities determine the most appropriate
technique. We biased our discussions towards applications of these techniques
to LDCs where fluoride occurrence and distribution is a major issue. Conse-
quently, adsorption technique was vouched for its low cost in general, versatility
and environmental benignity, and formed the main focus of our discussion. The
emphasis was placed on established and potential adsorption media that are in
use or those reported in literature over the last two decades. An attempt was
made to critically evaluate the performances of selected adsorption media, in-
terms of batch capacity, batch kinetics and column adsorption characteritics,
where applicable. It was shown that several adsorption media are attractive for
water defluoridation. However, there was paucity of information regarding field
application of most adsorption media, the quality of treated water, the stability of
the adsorption media and the long term availability. Moreover, the use of ad-
sorption as a drinking water treatment technique faces major challenges such as
dependeces of perfomance on solution pH, fast breakthrough by established
adsorption media and accumulation of bacteria in the media. An emerging novel
adsorbent, surface tailored zeolite, was discussed in more details using recent
laboratory data.
M. S. Onyango and H. Matsuda44
The use of adsorbent based POU or POE system was described as an at-
tractive defluoridation configuration that should be given more impetus in LDCs.
Though a lot of challenges exist to implementation of defluoridators, it was sug-
gested that a holistic participatory approach by all stakeholders be adopted in
fluorotic areas in remedying fluoride contaminated drinking water.
APPENDIX: LIST OF ACRONYMS
POE point-of-entry
POU point-of-use
LDC less developed countries
NEERI National Environmental Engineering Research Institute
RO reverse osmosis
NF nanofiltration
UF ultrafiltration
ED electrodialysis
USEPA United States Environmental Protection Agency
BDAT best demonstrated available technology
IE ion exchange
EF electroflotation
AA activated alumina
BBC black bone char
ACNT aligned carbon nanotubes
MCL maximum contaminant level
TRB titanium-rich bauxite
SBE spent bleaching earth
LDH layered double hydroxides
EBCT empty bed contact time
BDST bed depth service time
MDFFT Mytry De-Fluoridation Filter Technologies
REFERENCES
[1] Earth Summit, Comprehensive Assessment of the Freshwater Resources of theWorld. Agenda 21, Chapter 18, paragraphs 18.6 and 18.8, as endorsed at the UnitedNations Conference on Environment and Development, Rio de Janeiro, June 1992.
[2] United Nations (UN), Comprehensive Assessment of the Freshwater Resources ofthe World, 1999, http://geocompendium.grid.unep.ch/reference_scheme/final_ver-sion/GEO/Geo-2-121.htm (Accessed October 2005).
[3] Unesco, Trace Elements in Water and Public Health, http://www.iah.org/briefings/Trace/trace.htm (Accessed October 2004).
[4] H. Mjengera, G. Mkongo, Phys. Chem. Earth 26 (2003) 1097.[5] H. Chen, M.M. Frey, D. Clifford, S.L. McNeill, M. Edwards, J. AWWA 91 (1999) 74.[6] K.K.H. Choy, J.F. Porter, G. McKay, Chem. Eng. Sci. 59 (2004) 501.[7] C. Zevenbergen, L.P. van Reeuwijk, G. Frapporti, R.J. Louws, R.D. Schuiling, Sci.
Total Env. 188 (1996) 225.
Fluoride Removal from Water Using Adsorption Technique 45

[8] M. Srimurali, A. Pragati, J. Karthikeyan, Environ. Poll. 99 (1998) 285.[9] M.G. Sujana, R.S. Thakur, S.B. Rao, J. Colloid Interface Sci. 206 (1998) 94.[10] H. Weerasooriya, H.U.S. Wickramarathne, H.A. Dharmagunawardhane, Colloid
Surf. A: Physicochem. Eng. Aspects 144 (1998) 267.[11] R.L. Ramos, J. Ovalle-Turrubiartes, M.A. Sanchez-Castillo, Carbon 37 (1999) 609.[12] A.M. Raichur, M.J. Basu, Sep. Purif. Technol. 24 (2001) 121.[13] Y. Cengeloglu, E. Kir, M. Ersoz, Sep. Purif. Technol. 28 (2002) 81.[14] M. Mahramanlioglu, I. Kizilcikli, I.O. Bicer, J. Fluorine Chem. 115 (2002) 41.[15] L. Ruixia, G. Jinlong, T. Hongxiao, J. Colloid Interface Sci. 248 (2002) 268.[16] X. Fan, D.J. Parker, M.D. Smith, Water Res. 37 (2003) 4929.[17] Y.-H. Li, S. Wang, X. Zhang, J. Wei, C. Xu, Z. Luan, D. Wu, Mater. Res. Bull. 38
(2003) 469.[18] D.P. Das, J. Das, K. Parida, J. Colloid Interface Sci. 261 (2003) 213.[19] I. Abe, S. Iwasaki, T. Tokimoto, N. Kawasaki, T. Nakamura, S. Tanada, J. Colloid
Interface Sci. 275 (2004) 35.[20] S. Annouar, M. Mountadar, A. Soufiane, A. Elmidaoui, M.A.M. Sahli, Desalination
165 (2004) 437.[21] Y. Zhou, C. Yu, Y. Shan, Sep. Purif. Technol. 36 (2004) 89.[22] S. Ghorai, K.K. Pant, Sep. Purif. Technol. 42 (2005) 265.[23] E. Oguz, J. Hazard. Mater. 117 (2005) 227.[24] A. Mekonen, P. Kumar, A. Kumar, Water Res. 35 (2001) 3127.[25] F. Shen, X. Chen, P. Gao, G. Chen, Chem. Eng. Sci. 58 (2003) 987.[26] M. Pontie, C.K. Diawara, M. Rumeau, Desalination 151 (2003) 267.[27] M. Pontie, H. Buisson, C.K. Diawara, H. Essis-Tome, Desalination 157 (2003) 127.[28] C.K. Diawara, S.M. Lo, M. Rumeau, M. Pontie, O. Sarr, J. Membr. Sci. 219 (2003) 103.[29] M. Arora, R.C. Maheshwari, S.K. Jain, A. Gupta, Desalination 170 (2004) 105.[30] A. Lhassani, M. Rumeau, D. Benjelloun, M. Pontie, Water Res. 35 (2001) 3260.[31] Anonymous, Arsenic in Drinking Water: Treatment Technology: Removal, 1993, http://
www.dainchi-consul.co.jp/ENGLISH/arsenic/treat1.html (Accessed March 2001).[32] L.S. Cheng, Water Supply 3 (1985) 177.[33] N. Mameri, A.R. Yeddou, H. Lounici, D. Belhocine, H. Grib, B. Bariou, Water Res. 32
(1998) 1604.[34] F. Pouet, F. Persin, M. Rumeau, Water Res. 25 (1992) 247.[35] S.D. Faust, O.M. Aly, Chemistry of Water Treatment, Ann Arbor Science, Ann Arbor,
1983, p. 723.[36] Anonymous, Fluoride Removal by Activated Alumina, Available at http://www.
tramfloc.com/tf78.html (Accessed October 2005).[37] S. Murcott, Appropriate remediation technologies for arsenic-contaminated wells in
Bangladesh, in Proc. Int. Conf. Arsenic in Ground Water in Bangladesh: Sourcesand Remedies, Wagner College, Staten Island, New York, February 27–28, 1999.
[38] D.C.K. Ko, J.K. Porter, G. McKay, Ind. Eng. Chem. Res. 38 (1999) 4868.[39] S. Ghorai, K.K. Pant, Chem. Eng. J. 98 (2004) 165.[40] H. Lounici, D. Belhocine, H. Grib, M. Drouiche, A. Pauss, N. Mameri, Desalination
161 (2004) 287.[41] H. Lounici, L. Adour, D. Belhocine, A. Elmidaoui, B. Bariou, N. Mameri, Chem. Eng.
J. 81 (2001) 153.[42] C.-F. Chang, P.-H. Lin, W. Holl, Colloids and Surfaces A: Physicochemical and
Engineering Aspects 280 (2006) 194.[43] E.A. Savinelli, A.P. Black, J. AWWA 50 (1958) 33.[44] Y. Ku, H.M. Chiuo, Water, Air, Soil Pollut. 133 (1–4) (2002) 349.[45] P.P. Coetzee, L.L. Coetzee, R. Puka, S. Mubenga, Water SA 29 (2003) 33.[46] S.A. Wasay, S. Tokunaga, S.W. Park, Sep. Sci. Technol. 31 (1996) 1501.[47] S. Murcott, Arsenic and Fluoride Removal-New Household Approaches for
Addressing Chemical Contamination, WHO International Network to Promote
M. S. Onyango and H. Matsuda46

Household Water Treatment and Safe Storage, B. Gordon (Ed.), Issue 2, May 2005,P. 8.
[48] Rao, C.R. Nagendra, Fluoride and environment-a review, in M.J. Bunch, V. MadhaSuresh, T. Vasantha Kumaran (Eds.), Proc. Third Int. Conf. Environ. Health, Chen-nai, India, 15–17 December, 2003, Chennai: Department of geography, University ofMadras and Faculty of Environmental Studies, York University, p. 386–389.
[49] US Environmental Protection Agency (USEPA), Technologies and costs for the re-moval of fluoride from potable water supplies, Science and Technology Branch Cri-teria and Standards Division, Office of Drinking water, Washington, DC, 1985, 29–32.
[50] P. Phanfumvanit, R.Z. Legeros, Fluoride 30 (1997) 207.[51] D.L. Mwaniki, J. Dent. Res. 71 (1992) 1310.[52] A. Menda, Tanzania: challenges and successes of water defluoridation, Available at
http://www.scienceinafrica.co.za/2004/july/fluoride, (Accessed in September 2005).[53] M.W. Abdel-Raouf, A.A. Daifullah, Adsorpt. Sci. Technol. 15 (1997) 539.[54] Y.-H. Li, S. Wang, A. Cao, D. Zhao, X. Zhang, C. Xu, Z. Luan, D. Ruan, J. Liang,
D. Wu, B. Wei, Chem. Phys. Lett. 350 (2001) 4.[55] S. Iijima, Nature 354 (1991) 56.[56] G. Moges, F. Zewge, M. Socher, J. Afr. Earth Sci. 22 (1996) 479.[57] Y. Wang, E.J. Reardon, Appl. Geochem. 16 (2001) 531.[58] H. Sugita, T. Komai, S. Okita, S. Tokunaga, I. Matsunaga, J. Mining Miner. Process.
Inst. Jpn. 121 (2005) 416.[59] N. Das, P. Pattanaik, R. Das, Colloid Interface Sci. 292 (2005) 1.[60] E.J. Reardon, Y. Wang, Environ. Sci. Technol. 24 (2000) 3247.[61] F. Rubel Jr., The removal of excess fluoride from drinking water by the activated
alumina method, in: J.L. Shupe, H.B. Peterson, N.C. Leone (Eds.), Fluoride Effects onVegetation, Animals and Humans, Paragon Press, Salt Lake city, 1983, pp. 345–349.
[62] A. Sivasamy, K.P. Singh, D. Mohan, M. Maruthamuthu, J. Chem. Technol.Biotechnol. 76 (2001) 717.
[63] P.M.H. Kau, D.W. Smith, P. Binning, Geoderma 84 (1998) 89.[64] Y. Cengeloglu, E. Kir, M. Ersoz, Water Res. 37 (2003) 4929.[65] D. Mohapatra, D. Mishra, S.P. Mishra, G.R. Choudhury, R.P. Das, J. Colloid In-
terface Sci. 275 (2004) 355.[66] L. Ngee, T. Ishihara, S. Ueshima, H. Nishiguchi, Y. Takita, J. Colloid Interface Sci.
272 (2004) 299.[67] X.P. Liao, B. Shi, Environ. Sci. Technol. 39 (2005) 4628.[68] M. Chikuma, M. Nishimura, React. Polym. 13 (1990) 131.[69] K.M. Popat, P.S. Anand, B.D. Dasare, React. Polym. 23 (1994) 23.[70] L. Fang, K.N. Ghimire, M. Kuriyama, K. Inoue, K. Makino, J. Chem. Technol.
Biotechnol. 78 (2003) 1038.[71] M.A. Ulibarri, I. Pavlovic, M.C. Hermosın, J. Cornejo, Appl. Clay Sci. 10 (1995) 131.[72] Y. You, G.F. Vance, H. Zhao, Appl. Clay Sci. 20 (2001) 13.[73] E.L. Crepaldi, J. Tronto, L.P. Cardoso, J.B. Valim, Colloid Surf. A: Physicochem.
Eng. Aspects 211 (2002) 103.[74] T. Toraishi, S. Nagasaki, S. Tanaka, Appl. Clay Sci. 22 (2002) 17.[75] J. Orthman, H.Y. Zhu, G.Q. Lu, Sep. Purif. Technol. 31 (2003) 53.[76] N.N. Das, J. Konar, M.K. Mohanta, S.C. Srivastava, J. Colloid Interface Sci. 270
(2004) 1.[77] R. Chitrakar, S. Tezuka, A. Sonoda, K. Sakane, K. Ooi, T. Hirotsu, J. Colloid
Interface Sci. 290 (2005) 45.[78] O.P. Ferreira, S. Gomes de Moraes, N. Duran, L. Cornejo, O.L. Alves, Chemo-
sphere 62 (2006) 80.[79] K. Kuzawa, Y.-J. Jung, Y. Kiso, T. Yamada, M. Nagai, T.-G. Lee, Chemosphere 62
(2006) 45.[80] M.-X. Zhu, Y.-P. Li, M. Xie, H.-Z. Xin, J. Hazard. Mater. 120 (2005) 163.
Fluoride Removal from Water Using Adsorption Technique 47
[81] K.C. Song, H.K. Lee, H. Moon, K.J. Lee, Sep. Purif. Technol. 12 (1997) 215.[82] A. Garcıa-Sanchez, A. Alastuey, X. Querol, Sci. Total Environ. 242 (1999) 179.[83] C. Farm, Sci. Total Environ. 298 (2002) 17.[84] M.K. Doula, A. Ioannou, A. Microporous Mesoporous Mater. 58 (2003) 115.[85] M. Majdan, S. Pikus, M. Kowalska-Ternes, A. Gladysz-Plaska, P. Staszczuk,
L. Fuks, H. Skrzypek, J. Colloid Interface Sci. 262 (2003) 321.[86] A. Dakovic, M. Tomasevic-Canovic, V. Dondur, G.E. Rottinghaus, V. Medakovic, S.
Zaric, Colloid Surf. B: Biointerfaces 46 (2005) 20.[87] S.M. Dal Bosco, R.S. Jimenez, W.A. Carvalho, J. Colloid Interface Sci. 281 (2005) 424.[88] M. Turan, U. Mart, B. Yuksel, M.S. C- elik, Chemosphere 60 (2005) 1487.[89] U. Wingenfelder, B. Nowack, G. Furrer, R. Schulin, Water Res. 39 (2005) 3287.[90] M.P. Elizalde-Gonzalez, J. Mattusch, R. Wennrich, P. Morgenstern, Microporous
Mesoporous Mater. 46 (2001) 277.[91] M.P. Elizalde-Gonzalez, J. Mattusch, W.-D. Einicke, R. Wennrich, Chem. Eng. J. 81
(2001) 187.[92] Y.-H. Xu, Tsunenori Nakajima, A. Ohki, J. Hazard. Mater. 92 (2002) 275.[93] M.S. Onyango, H. Matsuda, T. Ogada, J. Chem. Eng. Jpn. 36 (2003) 477.[94] M.S. Onyango, Y. Kojima, H. Matsuda, A. Ochieng, J. Chem. Eng. Jpn. 36 (2003) 1516.[95] S. Shevade, R.G. Ford, Water Res. 38 (2004) 3197.[96] Y.-H. Xu, A. Ohki, S. Maeda, Toxicol. Environ. Chem. 76 (2000) 111.[97] Y.-M. Xu, A.-R. Ning, J. Zhao, J. Colloid Interface Sci. 235 (2001) 66.[98] M.S. Onyango, Y. Kojima, O. Aoyi, E.C. Bernardo, H. Matsuda, J. Colloid Interface
Sci. 279 (2004) 341.[99] M.S. Onyango, Y. Kojima, D. Kuchar, S.O. Osembo, H. Matsuda, J. Chem. Eng.
Jpn. 38 (2005) 701.[100] M.S. Onyango, Y. Kojima, D. Kuchar, M. Kubota, H. Matsuda, Sep. Sci. Technol. 41
(2006) 683.[101] G. McKay, Chem. Eng. J. 27 (1983) 187.[102] J. Crank, The Mathematics of Diffusion, Clarendon Press, Oxford, U.K., 1975.[103] G. McKay, B. Al-Duri, J. Chem. Tech. Biotechnol. 48 (1990) 269.[104] Z. Ma, R.D. Whitley, N.-H.L. Wang, AICHE J. 42 (1996) 1245.[105] G.S. Bohart, E.Q. Adams, J. Chem. Soc. 42 (1920) 523.[106] K.H. Chu, Chem. Eng. J. 97 (2004) 233.[107] B. Petrusevski, J. Boere, S.M. Shahidullah, S.K. Sharma, J.C. Schippers, Water
SRT – Aqua 51 (2002) 135.[108] P. Mariappan, T. Vasudenvan, (2005) Domestic defluoridation techniques and sector
approach for fluoris mitigation, http://www.twadboard.com/photos/nletjune02_01.pdf(Accessed October 2005).
[109] M. Agarwal, K. Rai, R. Shrivastav, S. Dass, J. Cleaner Prod. 11 (2003) 439.[110] W.J. Mavura, F.T. Mwanyika, G. Wrensford, B. Chem. Soc. Ethiopia 18 (2004) 1.[111] Z.M. Lahlou, Point of use/point of entry systems, A National Drinking Water Clear-
ingHouse Fact Sheet, Available at http://www.nesc.wvu.edu/ndwc/pdf/OT/TB/TB_Sp03_point.pdf (Accessed October 2005).
[112] R.K. Daw, People-centred approaches to water and environmental sanitation:Experiences with domestic defluoridation in India, Paper presented at the 30thWEDC International Conference, Vientiane, Lao PDR, 2004.
[113] IRC Report, Household water treatment, IRC International Water and SanitationCentre, The Netherlands, http://www.irc.nl/page/8028 (Accessed October 2005).
Note from the Editor
See also in this series the chapter by M. Pontie et al. on nanofiltration processes.
M. S. Onyango and H. Matsuda48

CHAPTER 2
Water Defluoridation Processes: A Review.Application: Nanofiltration (NF) for Future
Large-Scale Pilot Plants
M. Pontie,1,� C. Diawara,2 A. Lhassani,3 H. Dach,1,3 M. Rumeau,4
H. Buisson,5 and J.C. Schrotter5
1Group analysis and processes (GAP), University of Angers, 2, Bd. Lavoisier, 49045Angers cedex 01, France
2Chemistry Dept., University Cheikh Anta Diop, LaChimia, Dakar Fann, Senegal3Faculty of Science and Technology, Laboratory of Applied Chemistry, P.O. Box 2202,
Fez, Morocco424 Quai du commandant Meric, 34300 Le Grau d’Agde, France
5Veolia Water, Anjou Recherche, Chemin de la Digue, BP 76, 78603 Maisons-Laffitte,France
Contents
1. Introduction 51
2. Background 51
2.1. The origin and distribution of fluoride in groundwaters 51
2.2. Fluorosis 52
2.3. Symptoms of fluorosis 53
2.4. Ways of solving the problem: defluoridation techniques 55
3. Defluoridation processes 56
3.1. Precipitation methods 56
3.1.1. Methods based on coprecipitation 56
3.1.2. Methods based on F� precipitation with calcium and phosphate
compounds 57
3.2. Adsorption methods 57
3.2.1. Activated alumina 58
3.2.2. Clays and soils 58
3.2.3. Other sorbents 58
3.3. Ion-exchange resins 59
3.4. Electrochemical technique 59
3.5. Membrane processes 59
�Corresponding author. Tel.: +33-2-41-73-52-07; Fax.: +33-2-41-73-53-52;
E-mail: [email protected]
FLUORINE AND THE ENVIRONMENT, VOLUME 2
ISSN 1872-0358 DOI: 10.1016/S1872-0358(06)02002-1
r 2006 Elsevier B.V.All rights reserved
49

4. Comparison between nanofiltration and reverse osmosis operations 60
4.1. Theory 61
4.2. Experiments 63
4.2.1. Membrane materials 63
4.2.2. Bench scale pilot plant 64
4.2.3. Contact angle measurements 66
4.2.4. AFM experiments 66
4.3. Results and discussion 67
4.3.1. Pure water permeabilities of the membranes 67
4.3.2. Saline aqueous solution permeabilities of the membranes 68
4.3.3. Roughness of the membranes 69
4.3.4. Contact angle measurements 70
4.3.5. Determination of salt retention 70
4.3.6. Hydrodynamical approach 70
4.3.7. Phenomenological approach 73
4.3.8. Results from the Fatick area 74
5. Conclusions 75
Appendix: List of symbols and acronyms 75
References 76
AbstractDefluoridation of waters using clays as substrates has become popular in many countries
to solve problems related to high fluoride concentrations in drinking water in rural areas.
But this treatment is limited to low fresh water production. In this work, F� elimination using
a nanofiltration (NF) operation will solve problems for-large-scale pilot plants in the future.
Results obtained in these fields help-users to facilitate the selection between reverse
osmosis (RO) and NF membranes of the most cost-effective membrane for desalination of
high fluorinated water. Two sorts of characterization have been developed: (i) physico-
chemicals, in terms of hydrophobicity/hydrophilicity, morphology and topography aspects
and (ii) mass transfer in terms of pure water and saline solution permeabilities, charged
solute rejections and molecular weight cut-off (MWCO). A model inspired by the phen-
omenological approach proposed by Kedem and Katchalsky (KK) will help to quantify both
parts of the mass transfer occurring in NF and RO, i.e. the pure convection and the pure
diffusion, separately. This new and original approach will be applied to three membranes, 2
NF and 1 LPRO (low-polarization reverse osmosis), respectively. The study will be limited
to low concentration polarization by using diluted solutions (10�3–10�1M) and high tan-
gential flow rate (4ms�1) under low conversion ratio (5%), operational conditions. Different
tools such as contact angle measurements, topography and roughness measurements
using atomic force microscopy (AFM), hydraulic permeability and salt solution permea-
bility, will be used to characterize the three membranes. This analytical approach will be
coupled with the Spiegler, Kedem and Katchalsky (SKK) phenomenological mass transfer
model in order to determine the mass transfer parameters s and Ps for synthetic chloride
and sulphate solutions.
This novel integer approach makes it possible to determine today an NF most efficient
membrane for the elimination of excess F� in a Senegalese water sample taken from the
endemic region of Fatick. This membrane denoted NF90 works very well due to its diffu-
sional behaviour for fluoride rejection, its high hydraulic permeability and sufficient ob-
served rejection for F� in comparison to RO.
M. Pontie et al.50
1. INTRODUCTION
Fluorosis caused by high fluoride (F�) intake predominantly through drinking
water containing F� concentrations higher than 1mgL�1, is a chronic disease
manifested by mottling of teeth in mild cases (dental fluorosis) and changes in
bone structure (skeletal fluorosis), ossification of tendons and ligaments, and
neurological damage in more severe cases [1–3].
Today an increasing concern is being expressed that these adverse effects of
fluorosis are irreversible, in particular for African, Indian and Chinese populations
living in rural areas in which drinking water is supplied from wells and boreholes
with high F� concentrations. The development of a long-term solution to the
defluoridation of F� contaminated groundwaters is thus of critical importance.
This would require appropriate water treatment procedures. Appropriate tech-
nology must be technically simple, cost effective, easily transferable, using local
resources and accessible to the rural community.
The removal of fluoride from water using defluoridation techniques is a com-
mon practice worldwide, both domestically and industrially. Current methods of
fluoride removal from water include adsorption onto activated alumina, bone char
and clay,1 precipitation with lime, dolomite and aluminium sulphate, the Nalgonda
technique [4], ion exchange [5] and membrane processes such as reverse os-
mosis (RO), electrodialysis and very recently NF [6–9].
This chapter is organized into two parts: (i) the first part is dedicated to a review
on the defluoridation processes of drinking waters (see Table 1) and (ii) the
second part is based on the presentation of original results concerning a com-
parison study of NF and RO for a selective defluoridation of a highly fluorinated
brackish water from the endemic region of Fatick (Senegal).
2. BACKGROUND
2.1. The origin and distribution of fluoride in groundwaters
High F� concentrations in groundwater are found in many countries around the
world, notably in Africa, Asia and USA [21,22]. The most severe problems as-
sociated with high F� waters occur in China [23], India [24] and the Rift Valley
countries in Africa [25]. Groundwaters with high fluoride contents have been
studied in detail in Africa, in particular, Kenya and Tanzania [12,26–28]. The
abundance of F� in Rift Valley groundwaters is due to the weathering of alkaline
volcanic rocks rich in F�. Typical fluoride concentrations of towns in the Rift
Valley are between 1 and 33mgL�1. High fluoride groundwater is also found in
1 Note of the Editor: See also in this series the chapter by M. Onyango and H. Matsuda et al. on
adsorption processes.
Water Defluoridation Processes: A Review 51

the East Upper Region of Ghana [29]. The concentration of fluoride was found to
be between 0.11 and 4.60mgL�1. The hydrogeology and hydrochemistry of
ground waters in Senegal have been thoroughly studied by Y. Travi [30]. In
France, two major basins are concerned, the Aquitan Basin and Parisian Basin
with F� concentrations between 0.6 and 4.2mg L�1.
2.2. Fluorosis
Fluoride has certain physiological properties [31,32] of great importance to hu-
man health. The role of fluoride in the process of mineralization of certain tissues
is important. At low concentrations fluoride stabilizes the skeletal system by in-
creasing the size of apatite crystals and reducing their solubility [12]. Although
beneficial effects can be demonstrated at low concentrations, it has detrimental
effects when concentrations exceed the threshold [33].
The relationship between fluoride and dental caries was first noted in the early
part of the 20th century when it was observed that residents of certain areas of
USA developed brown stains on their teeth. In the 1930s, it was observed that the
prevalence and severity of this type of mottled enamel was directly related to high
amounts of ingested fluoride [34].
Endemic fluorosis is known to be global in scope, occurring in all continents
and affecting many millions of people. Cases of skeletal fluorosis have been
Table 1. Materials and methods of defluoridation
Process Reference
Coprecipitation (Nalgonda technique)
aluminium salts
Dahi [10]
Precipitation calcium and phosphate
compounds
Larsen [11]
Adsorption/ion exchange Moges [12] and Veressinina [13]
Activated alumina Hao [14] and Schoeman [15,16]
Fly ash Chaturvedi [17]
Clays Srimurali [64]
Soils Omueti and Jones [18]
Sulphonated carbonaceous materials Mohan Rao [5]
Membrane processes
RO
Elmidaoui [19]
Electrodialysis Pontie [6,7,20]
Lhassani [8]
NF Diawara [9]
M. Pontie et al.52
reported all over the world [35]. According to a report from UNICEF [36], fluorosis
is endemic in at least 25 countries across the globe. The fluorosis problem is
most severe in the most populous countries in the world, China and India [37–39].
For example, in China some 38 million people are reported to suffer from dental
fluorosis and 1.7 million from the more severe skeletal fluorosis. In India fluorosis
is endemic in 15 states, with over six million people seriously afflicted [40].
The drinking water standards for fluoride ion stipulated by WHO authorities are
between 0.8 and 1.5mgL�1, the average suggested in USA by US Public Health
is 0.7–1.2mgL�1 and 0.7–1.5mgL�1 in UE.
2.3. Symptoms of fluorosis
Fluoroapatite is a less soluble order of magnitude than hydroxyapatite, the prin-
cipal mineral constituent of bone. The F� ion substitutes for the OH� ion, leading
to a buildup of F� in bone tissue which may eventually lead to skeletal fluorosis.
Early in the development of fluorotic changes in the skeleton, the patient often
complains of a vague discomfort in the limbs and the trunk. Pain and stiffness in
the back appear next, especially in the lumbar region. In severe fluorosis, in
addition to joint problems, some victims can experience deformation of their
bones (Fig. 1). The stage at which skeletal fluorosis becomes crippling usually
occurs between 30 and 50 years of age in endemic regions. The factors which
govern the development of skeletal fluorosis are (a) the prevalence of high levels
in fluoride intake, (b) continual exposure to fluoride, (c) strenuous manual labour,
(d) poor nutrition and (e) impaired renal function due to disease [41].
Human beings throughout history have suffered from dental fluorosis, but until
the 20th century the cause of the condition was unknown. Given the common
incidence of high F� groundwaters in the East African Rift Valley [43], it is evident
that ancient people could have suffered from dental fluorosis. The mottling of
teeth is one of the earliest and most easily recognized symptoms [44]. It is the
permanent teeth that are most affected. They lose their normal creamy white
translucent colour and become rough, opaque and chalky white. Dental fluorosis
is a developmental disturbance which increases with time. Therefore primary
teeth are less severely affected than the permanent teeth, and those teeth which
erupted first (the incisors and first permanent molars) are less affected than those
erupting later, the premolars and other permanent molars [45].
The first signs of dental fluorosis (moderate dental fluorosis) are thin white lines
running across the entire enamel surface and which can only be seen after drying
the tooth surface [46]. With more fluorosis these thin lines become broader,
merge and may be clear without the need for drying. At slightly greater severity
the tooth surface shows distinct, irregular, opaque or cloudy white areas, caused
by increasing porosity of the tooth enamel. Dental fluorosis has been studied in
several parts of South Africa [47–49] and in West Africa in Senegal, especially for
Water Defluoridation Processes: A Review 53

the endemic region of Fatick. In this area, waters with high level of fluoride are
circulating below a phosphated eocene roof; As shown in Fig. 2, the fluoride level
drastically decreases with the disappearance of the phosphated roof [30]. The
findings by Mothusi [48] indicated that in the North West province of South Africa,
dental fluorosis has resulted in cases of psychological trauma, particularly among
adolescents. In areas with fluoride levels of drinking water exceeding 3mgL�1, a
high demand of local inhabitants for extracting teeth and replacing them with
dentures is noticed. Dental fluorosis was also investigated in areas surrounding
the Pilanesberg complex [50]. It was reported in this study that severe dental
fluorosis occurred in 28% of the population, while 41% had moderate dental
fluorosis. The same results were reported in the study by Du Plessis [25]. He
Fig. 1. Illustration of a hand attained by osseous fluorosis in Senegal after regularingestion of drinking water with F� level higher than 4mg/L for 30 years of ex-position in an endemic region [42].
M. Pontie et al.54

found that 39% of pupils in the Bloemfontein area had clearly dental fluorosis.
The spatial variations of dental fluorosis in seven villages was studied by
Zietsman [51]. Furthermore the concentration of fluoride in drinking water was
recently shown by Steiner [52] to be inversely correlated with the incidence of
dental caries and cancer. It is proposed that dental caries, cancer and possibly
other diseases are the result of a nutritional deficiency in fluoride.
2.4. Ways of solving the problem: defluoridation techniques
The prevention of fluorosis through treatment of drinking water in rural areas is a
difficult task because of economical and technological restrictions. Defluoridation of
water is the only measure to prevent fluorosis and many different defluoridation
techniques have been developed [17]. However, many cannot be easily implemented
in areas where the problems occur. This section gives a brief overview of defluor-
idation methods (see Table 1).
Defluoridation processes can be classified into four main groups: Adsorption
methods, in these methods sorbents such as bone charcoal, activated alumina
and clay are used in column or batch systems. Ion-exchange methods, these
methods require expensive commercial ion-exchange resins. Coprecipitation and
Fig. 2. Scheme showing F� concentrations in groundwaters at the limits of theendemic region of Fatick (Senegal, west Africa). (Bold line includes border of thephosphated eocene ‘‘roof’’; dotted lines indicates fluoride iso-concentrations(mg L�1)) [30].
Water Defluoridation Processes: A Review 55
contact precipitation methods, these methods coprecipitate F� with, for example,
aluminium sulphate and lime (Nalgonda technique) or precipitate F�, for example,
with calcium and phosphate compounds. Membrane processes, these include
RO, electrodialysis and NF methods. The last one is very promising for large-
scale pilots plants in the future.
Taking into account the realities of the problem as outlined in this short review,
the provision of an affordable and technologically simple solution must obviously
lie in empowering the local communities to construct viable defluoridation sys-
tems from local and readily available materials. There is thus a need for devel-
oping low cost methods to remove fluoride from water. The removal of fluoride
using locally available clays has been studied in many countries where the
problem occurs and the development of laboratory scale defluoridation columns
to study the efficiency of fluoride removal using different sorbents is recom-
mended for local communities.
3. DEFLUORIDATION PROCESSES
3.1. Precipitation methods
Precipitation methods can be divided into two categories, those based on co-
precipitation of adsorbed F� and those based on the precipitation of insoluble
fluoride compounds.
3.1.1. Methods based on coprecipitation
Coprecipitation (e.g. the Nalgonda technique) is the process by which aluminium
salts (aluminium chloride and aluminium sulphate) are added to F� contaminated
drinking waters [53,54].
This process is used in three ways: A bucket system designed to be used on
household scale; Fill and draw plants to be used on a community scale; A wa-
terworks flow system developed for larger communities.
(i) Bucket system. The bucket defluoridation system was first practised for do-
mestic use in Tanzania [27]. The two chemicals (aluminium chloride and
aluminium sulphate) are added simultaneously to the raw water bucket and
stirred with a wooden paddle. Lime is added to adjust the pH of water to about
6.7. After addition of the chemicals it is left to settle for about 1 h. This process
is suitable for a daily routine, where one bucket of water is treated for one
day’s water supply of about 20 L. The process produces water with residual
F-between 1 and 1.5mgL�1 [10].
(ii) Fill and draw system. This system is also used in Tanzania for the defluor-
idation of drinking water [27]). It consists of a cylindrical vessel equipped with
M. Pontie et al.56

a hand-operated stirring mechanism. The vessel is filled with raw water and a
defluoridation procedure similar to the one using the bucket system is per-
formed. Raw water is pumped onto the tank and the required amounts of
alum, lime and bleaching powder are added. The contents are stirred slowly
for 10min and allowed to settle for 2 h. The defluoridated supernatant water is
withdrawn and supplied through stand posts. The settled sludge is discarded.
(iii) Waterworks flow system. A bigger defluoridation system is used for larger
communities. This system involves the combined use of alum and lime for the
defluoridation process [10]. It consists of several components, namely, reac-
tors a sump well, sludge drying beds, elevated service reservoir, electric room
and chemical storehouse. The raw water from the source is pumped to the
reaction-cum-sedimentation tank, which is referred to as a reactor. A sludge
pipe with a sluice valve is provided to withdraw the settled sludge once a day.
The Nalgonda technique has been introduced in many countries, e.g. India,
Kenya, Senegal and Tanzania. However, the method has a number of disad-
vantages. These include: the treatment efficiency is about 70%, which means the
process cannot be used in cases of high fluoride contamination; a large amount
of aluminium sulphate, up to 700–1200mgL�1 may be needed; the adverse
health effects of dissolved aluminium species in the treated water.
3.1.2. Methods based on F� precipitation with calcium and phosphatecompounds
Many methods for the precipitation of fluorides with salts of calcium, aluminium
and iron are reported in the literature (46–48). Precipitation processes are gov-
erned by the solubility of a forming salt [55]. The most common method of treat-
ment is the precipitation of calcium fluoride using calcium from either lime or
calcium chloride. The fundamental problem that exists using lime arises from the
low solubility of the calcium hydroxide. It therefore requires excess of reagent to
complete precipitation. The relatively high solubility of the calcium fluoride does
not allow a complete removal of F�. An additional difficulty with lime precipitation
is the poor settling characteristics of the precipitate. The lime-based fluoride
removal can be improved by using CaCl2-lime mixture. The highly soluble CaCl2provides more calcium than lime without increasing pH. Fluoride removal by lime
and CaCl2-lime costs about the same.
3.2. Adsorption methods
Fluoride can be removed by adsorption onto many adsorbent materials. The
criteria for the selection of suitable sorbents are cost of the medium and running
costs, ease of operation, adsorption capacity, potential for reuse, number of
Water Defluoridation Processes: A Review 57

useful cycles and the possibility of regeneration. Some of the most frequently
encountered sorbents are reviewed in this section.
3.2.1. Activated alumina
Activated alumina is a granular form of aluminium oxide (Al2O3) with very high
internal surface area, typically in the range of 200–300m2 g�1. This high surface
area gives rise to a very large number of sites in the material on which adsorption
can occur. It has been widely used for removal of F- from drinking water [14,16].
The mechanism of F� removal from water is similar to those of a weak base ion-
exchange resin. Fluoride removal efficiency is excellent (typically 495%), and is
dependent on pH. Fluoride removal capacity is best in the narrow range of pH
5.5–6. Fine (28–48 mesh) particles of activated alumina are typically used for
removal. The adsorption sites of activated alumina are also attractive for a
number of anions different from F�. The selectivity sequence [56] of activated
alumina in the pH range of 5.5–8.5 is
OH�4H2AsO�4 4SiðOHÞ3O
�4HSeO�3 4F�4SO2�
4 4CrO2�4 b HCO�
34Cl�4NO�34Br�4I�
Activated alumina can be regenerated by flushing with a solution of 4% sodium
hydroxide which displaces F� from the alumina surface (p. 51). This procedure is
followed by flushing with acid to re-establish a positive charge on the surface of
the alumina.
3.2.2. Clays and soils
The first comprehensive study of fluoride adsorption onto minerals and soils was
published in 1967 [57]. Since that time, several workers have investigated the
adsorption of fluoride on various substrates. These studies include the use of
Ando soils of Kenya [58], Illinois soils of USA [59], Alberta soil Luther [60], il-
lite–goethite soils in China [2] clay pottery [61,62], fired clay [63], fired clay chips
in Ethiopia [12], kaolinite [64], bentonite and kaolinite [65,66] and fly ash [17].
3.2.3. Other sorbents
In addition to activated alumina, clays and soils, other materials such as spent
bleaching earth, spent catalyst, rare earth oxides, bone charcoal and activated
carbon were studied as sorbents for F�. Mahramanlioglu [67] investigated the
adsorption of F� using spent bleaching earth. They found that the removal of F�
depends on the contact time, pH and adsorbent concentration. Lai and Liu [68]
studied the F� removal from water with spent catalyst. Their findings showed that
spent catalysts could be utilized as adsorbent for F� removal. Its adsorption
capacity was comparable to that of activated alumina. Raichur and Basu [69]
studied the great potential for F� removal from water using rare earth oxides.
Rare earth oxides showed. Lu [70] investigated the removal of F� using red mud,
M. Pontie et al.58

which was found to be 82%. For a sustainable development of such processes,
adsorbent reuse should be engaged and waste water treated.
3.3. Ion-exchange resins
Ion-exchange resins are effective in removing F� from water. Mohan Rao and
Bhaskaran [71] studied the removal of F� using ion-exchange materials such as
sulphonated material from coconut shell, Carbion, Tulsion and Zeocarb 225.
From the results, it was evident that Zeocarb 225 had the highest F� removal
capacity and sulphonated material of coconut shell has the lowest one. It was
also indicated that the ion- exchange material could be regenerated by aluminium
sulphate solution (2–4%). Castel et al. [72] studied the removal of F� by a two-
way ion-exchange cyclic process. This system used two anion-exchange col-
umns. The results show that this process can effectively remove fluoride from
water. The use of anion-exchange resins for F� removal is not current because of
their relatively high costs. The presence of other anions such as chloride and
sulphate also presents a major problem when using ion-exchange resins for F�
removal. Because F� removal is accompanied by sorption of other anions, the
sorption capacity is limited to 0.5mgL�1 of F�concentration level in the bulk [13].
3.4. Electrochemical technique
Electrochemical technique (also electrocoagulation) is a simple and efficient
method for the treatment of drinkable water. Recent results reported by Part-
hasarathy and Yang [54,55] have demonstrated that electrocoagulation (EC)
using aluminium anodes is effective in defluoridation. In the EC cell, the alumin-
ium electrodes sacrifice themselves to form aluminium ions first. Afterwards the
aluminium ions are transformed into Al(OH)3 before being polymerized to
Aln(OH)3n. The Al(OH)3 floc is believed to adsorb F� strongly as illustrated by the
equation.
AlðOHÞ3 þ xF�¼ AðOHÞ3�xFx þ xOH�
Usually the EC operation is completed by an electroflottation (EF) in order to
separate the formed floc from water by floating them to the surface cell [73–75].
3.5. Membrane processes
Membrane processes such as RO, NF, dialysis and electrodialysis have become
recently developed methods for F� removal from drinking waters [6,8,15,76–78]
and brackish waters [7,9,79]. The second part of this chapter is dedicated to the
presentation of recent results obtained from the comparison of RO and NF
membranes processes for a selective defluoridation of a Senegalese brackish
water from the endemic region of Fatick.
Water Defluoridation Processes: A Review 59

4. COMPARISON BETWEEN NANOFILTRATION AND REVERSEOSMOSIS OPERATIONS
The NF membrane is a type of pressure-driven membrane which properties are
situated between RO and ultrafiltration (UF) membranes. NF offers several ad-
vantages such as low operation pressure, high flux, high retention of multivalent
anion salts and organics compounds with molecular weight above 300Da, relatively
low investment and low operation/maintenance costs. Because of these advan-
tages, the applications of NF worldwide have increased. The history of NF dates
back to the 1970s when RO membranes with a reasonable water flux operating at
relatively low pressures were developed. Hence, the high pressures traditionally
used in RO resulted in a considerable energy cost. Thus, membranes with lower
rejections of dissolved components, but with higher water permeability, appeared
be a great improvement for separation technology. Such low-pressure RO mem-
branes became known as NF membranes. By the second half of the 1980s, the
interest for NF had become established, and the first applications were reported as
detailed in a recent review [80]. Today 10% of brackish waters market in the world
is dedicated to NF membranes [81]. While NF is a relatively new membrane proc-
ess, it is already widely used for water treatment in different parts of Europe, Israel
and the US. Striving towards improved quality, efficiency and applicability, research
is continuing in an attempt to understand and model the varying parameters in-
volved during NF. A technique that is often used for the evaluation of membranes is
the flux and rejection behaviour of uncharged and charged solutes [82]. However,
many membranes have to be screened before finding a suitable one.
NF is used when high molecular weight solutes have to be separated from a
solvent. It is effective in the production of drinking water, especially in the case of
water softening. Compared to RO, a lower retention is found for monovalent ions. But
very recently [9], it has been found that NF separates the ions of the same valency
for a selective defluorination of brackish water. RO and UF have shown, respectively,
solution-diffusion and convection mass transfers. In NF, a synergism between both
can be observed but strongly depends on the operational conditions (pH, ionic
strength, flow rate, transmembrane pressure) and on the membrane material used.
The aim of the present chapter is to establish a systematic approach in the
characterization of commercial NF and low-pressure RO membranes in order to
help the user to the better choice between NF and RO operations.
The first part is dedicated to the characterizations of two NF membranes,
denoted NF270, NF90 and one low-pressure RO membrane, denoted BW30. We
will give two sorts of characterizations: (i) a physico-chemical one, involving hy-
drophobicity, morphology and topography experiments and (ii) a mass transfer
one occurring via water and synthetic salt solution permeability measurements
(denoted Lp and Lp0, respectively), charged solutes rejections and diffusive fluxes
for NaCl and Na2SO4 solutions.
M. Pontie et al.60

Furthermore, these characterizations will be completed in determining mass
transfer parameters s and Ps, Cconv and Jdiff , respectively, the reflection coeffi-
cient and the solute permeability of the membranes, the part of solute mass
transfer dedicated to convection and Jdiff the part of mass transfer dedicated to
hydration-diffusion, for two synthetic chlorides and sulphates sodium salts so-
lutions under different concentrations, 10�3 and 10�1M.
In a second part, recent results dedicated to the comparison of NF and RO
membranes for the defluoridation of a Senegalese water sample from the en-
demic region of Fatick, Senegal will be presented and illustrated with a semi-
industrial pilot plant.
4.1. Theory
The transport of solutes through a membrane can be described by using the
principles of irreversible thermodynamics (IT) to correlate the fluxes with the forces
through phenomenological coefficients. For a two-components system, consisting
of water and a solute, the IT approach leads to two basic equations [83].
Jv ¼ PwdP
dx� s
dpdx
� �ð1Þ
Js ¼ �Ps
dcsdx
þ ð1� sÞJvcs ð2Þ
where Jv and Js are, respectively, the solvent flux and the solute flux, and dP/dx
and dP/dx define, respectively, the pressure and osmotic gradients inside the
membrane; Pw is the filtration coefficient (m2 s�1Pa�1) or specific hydraulic per-
meability constant, s the local reflection coefficient, PM the local solute perme-
ability coefficient (m2 s�1) and cs the local solute concentration in the membrane at
a distance x from the membrane surface (molm�3).
With constant fluxes and constant transport parameters (PS and s), the integration
of equation (2) on the membrane thickness yields, in term of the real salt rejection.
R ¼sð1� FÞ
1� sFð3Þ
with F ¼ e�ð1�s=PsÞdmJv ¼ e�ð1�s=PMÞJv ¼ e�Pe
where PM ¼ Ps=dm is the overall permeability coefficient and Pe ¼ 1� s=PMJvis the Peclet number [84].
From equation (3), it appears that the retention increases with increasing water
flux and reaches a limiting value s at an infinitely high water flux. As the diffusive
flux of the solute can be neglected in the range of the higher water flux, the
reflection coefficient s is a characteristic of the convective transport of the solute.
A s value of 100% means that the convective solute transport is totally hindered
or that no transport by convection takes place at all. This is the case for ideal RO
Water Defluoridation Processes: A Review 61

membranes in which the membranes have dense structure and no pores are
available for convective transport. Equation (3) however only relates the mem-
brane surface concentration to the permeate concentration. It needs to be com-
bined with concentration polarization if the permeate concentration is to be
related to the bulk feed concentration which results in the combined film theory –
Spiegler–Kedem [85].
According to the film theory, the relation between the observed rejection rate
and the true rejection rate may be expressed as
ln1� Robs
Robs
� �¼ ln
1� R
R
� �þ
JvK
ð4Þ
where K is the mass transfer coefficient.
Substitution of equation (3) into equation (4) and rearranging results in the
following equation [85]:
Robs ¼1
1�s
s 1�e� 1�s
PM
� �Jv
! eJv=K þ 1ð5Þ
By using a non-linear parameter estimation method by supplying the data of Robs
vs. Jv taken at different pressures but at constant feed rate and constant feed
concentration for each set, equation (5) may be used to estimate the membrane
parameters s and PM and the mass transfer coefficient, K, simultaneously [84]. A
wide variation of transmembrane pressure at a constant feed flow rate is required
to prevent poor regression due to too many unknowns (s, Ps and K) compared to
the experimentally available variables (Jv and Robs). Even in this case, poor
regression might still be obtained for high values of K. In this particular case, the
inequality KbJv holds at most values of Jv. This point prevents to obtain K with a
high level of confidence because Robs equals R (equation (5) reduces to equation
(3) for any value of KbJv). To the authors opinion, the best way to determine sand Ps values is to work under experimental conditions so that KbJv (high tan-
gential rate and low pressure). This allows to obtain directly the true rejection and
then s and Ps using a non-linear least squares estimation procedure that make
equation (3) fit the data as closely as possible.
Another way to quantify the convective and diffusive parts is to express equa-
tion (2) as
Js dx ¼ �Psdcs þ 1� sð ÞJvcs dx
with constant fluxes and constant transport parameters (Pw and s), the integra-
tion of this equation on the membrane thickness (dm) yields
JvCpdm ¼ �PsDcs þ 1� sð ÞJv
Zdm
csdx
M. Pontie et al.62

or
JvCp ¼ �PMDcs þ 1� sð ÞJvCint ð6Þ
where Cint ¼ 1=dmRdm
cs dx is the mean solute concentration inside the mem-
brane.
Note that this equation is identical to the Kedem–Katchalsky model and does
not imply a linear concentration gradient as it is frequently reported. It may be
expressed as well as [7,8]
Jdiff þ JvCconv ¼ CPJv
where Jdiff is the solute flux due to diffusion, and Cconv is the solute concentration
due to convection [ ¼ (1�s)Cint].
Then the concentration in the permeate becomes
CP ¼JdiffJv
þ Cconv ð7Þ
By following Cp vs. the reverse of the permeate flux, it is possible to quantify
separately both part of the solute mass transfer occurring in NF: convection and
solvation (hydration)/diffusion as developed recently [9]. The results are expected
to be valid only in some limited domains of operating conditions (Jdiff and
Cconv ¼ Ctes) but may be useful for the comparison of the behaviour of different
membranes.
Since NF membranes have pores, a reflection coefficient below 100% will be
found if the solutes are small enough to enter the membrane pores. During our
experiments we have limited the concentration polarization by using dilute so-
lutions and high flow rate. In fact, the SKK model was developed first for un-
charged membranes such as RO membranes while most NF membranes are
charged, negatively or positively, depending upon the physico-chemical condi-
tions (pH, ionic strength) and the kind of used material. The membrane charge
has been neglected in the present study because the membranes employed
appear to have an RO behaviour.
4.2. Experiments
4.2.1. Membrane materials
The membranes under study are thin-film composite membranes composed of
two layers as illustrated in Fig. 3; a thin polyamide film as active layer and a large
mesoporous polysulphone as the support layer. The three studied membranes are
2 NF membranes, noted NF90, NF270 and a low-polarization reverse osmosis
(LPRO) membrane , noted BW30. All membranes were purchased from Filmtec
(DOW, USA); the specifications of the membranes are given in Table 2. The
chemical structures of the support and active layer materials are reported in Fig. 4
[86]. Polyamide material is the more used but some authors have reported results
Water Defluoridation Processes: A Review 63

with cellulosic membranes [87]. Before use, the membranes were rinsed with UP
MilliQ water (Millipore system, France) until the conductivity of the permeate re-
mains below UP water conductivity (3mScm�1). The effective surface membrane
area was 472 cm2. All the salts used (NaCl, Na2SO4) were of analytical grade from
Aldrich (France) and used as received. All solutions were prepared from a MilliQ
water with a purity water presenting a conductivity lower than 3 mScm�1
and pH ¼ 6.7. The salts analyses were carried out by a conductimeter after
standardization for each salt and concentration were deduced for single salt so-
lutions.
4.2.2. Bench scale pilot plant
The NF/LPRO pilot plant was supplied by Sepratech (Separation Technoloy, INC,
US), and consisted of a feed tank, a pump and planar module, as detailed in Fig.
5. All studies were done using a low conversion rate (5%) and a high tangential
flow rate (� 4ms�1) in order to minimize the polarization concentration effects.
The applied transmembrane pressures were in the range of 0–25 bar. The tem-
perature was maintained at 251C.
ultrathin barrier layerin polyamide
0.3 -3 µm
reinforcingfabric inpolysulfone
40 µmmicroporouspolysulfone
120 µm
Fig. 3. Schematic diagram of thin film composite membranes.
Table 2. NF and LPRO membrane characteristics from Filmtec (DOW)
NF270 NF90 BW30
Maximum temperature (1C) 45 35 45
Pressure range (bar) 17 25 41
pH range 3–10 3–9 2–11
NaCl rejection (%) 40–60 85–95 99.5
Product name NF270-400 NF90-400 BW30-400
Material Polyamide Polyamide Polyamide
M. Pontie et al.64

Permeated solutions were recycled during the runs except for samples with-
drawn for the calculation of observed retention denoted Robs according to
Robs ¼ 1�Cp
Co
ð8Þ
NH NH CO
COOH
COCONHNH
n
CO
CO
1-n
C
CH3
CH3
O S
O
O
O[ ]n
- A -
- B -
Fig. 4. Chemical structures of the support (A) and active layers (B) of theNF(NF90, NF270) and LPRO (BW30) membranes.
Fig. 5. Flow diagram of the NF/LPRO plant (lab-scale experiments, Janu-ary–March 2005).
Water Defluoridation Processes: A Review 65

where Cp and Co are the concentrations in the permeate and feed solutions,
respectively. But, under hydraulic conditions we can consider that Robs ¼ Rreal.
Pure water flux through a membrane can be described by-Darcy’s law
Jv ¼ LpDP ð9Þ
with Lp the hydraulic permeability of the membrane usually given in
L h�1m�2 bar�1.
4.2.3. Contact angle measurements
The contact angle measurements were carried out by the sessile drop technique.
The different membranes were primarily washed twice with deionized water for a
period of 24 h and then dried at room temperature over silica gel in a dessicator. A
droplet of UP milliQ water solution (a volume of 1–2 mL) was deposited onto the
surface with a microsyringe and contact angles of the droplet with the surface
were measured with a KRUSS G10 contact angle meter. Reported values cor-
respond to the average of the contact angles (right and left) of 5 droplets. During
the short time of measurement (less than 1min), no change in contact angle was
observed. Contact angles do not give absolute values but allow a comparison
between each material. A variation of 21 in the angle is needed to differentiate
each kind of materials with the low roughness NF membranes studied.
4.2.4. AFM experiments
Atomic force microscopy (AFM) studies contribute also to the improvement of the
NF membranes, especially for desalination of brackish water. AFM characteri-
zation of a series of commercial NF and RO membranes of different polymer
types for brackish water desalination had not been attempted, so far. Thus, as
reported by Hilal [79], it is imperative to study the properties of these membranes
and to show that the characteristics obtained from AFM correlate to the process
behaviour. This is expected to provide substantial new insights into the influence
of NF/RO membrane properties on performance, providing a database for the
selection of NF membranes to account for the complexities of brackish water.
The AFM equipments used were conducted with a Nanoscope III device from
VEECO (USA). The membrane morphologies were imaged in contact mode in air
with a scan rate of 1Hz and 400� 400-pixel resolution. The cantilevers used for
such imaging were from Veeco, with a specified spring constant between 0.44
and 0.63Nm�1 and a resonant frequency of 17–20 kHz. The mean roughness
(denoted Ra) is the mean value of surface relative to the centre plane. The plane
for which the volume enclosed by the image above and below this plane are equal
and is calculated as
Ra ¼1
LxLy
Z Ly
0
Z Lx
0
zðx; yÞ�� �� dx dy ð10Þ
M. Pontie et al.66

where z(x,y) is the surface relative to the centre plane and Lx and Ly are the
dimensions of the surface analysed.
4.3. Results and discussion
4.3.1. Pure water permeabilities of the membranes
The flux solvent evolution of pure water with the transmembrane pressure across
NF/LPRO membranes are reported in Fig. 6. The linear dependence of fluxes with
the transmembrane pressure shows that Darcy’s law is verified. As expected, the
hydraulic permeabilities determined from the slopes (Table 3) show higher values
for NF than LPROmembranes, due to their larger pore size. The NF90 membrane
shows the higher hydraulic permeability with Lp ¼ 14.8 L h�1m�2 bar�1.
y = 14.82x
R2 = 0.99
y = 5.13x
R2 = 0.99
y = 3.53x
R2 = 0.98
0
50
100
150
200
250
0 5 10 15 20
NF90NF270BW30
Flu
x (
L.h
-1.m
-2)
Pressure(bar)
Fig. 6. Pure water flux (y) as a function of the transmembrane pressure (x) (DP)for NF membranes (NF270, NF90) and low-pressure RO membrane (BW30) atT ¼ 25 1C, R being the linear regression coefficient.
Table 3. Pure water and saline solution (NaCl 0,1M) permeabilities, contactangles and critical pressures of NF and LPRO membranes
Membrane Lp (70.7) Lp0 (70.3) y (1) Pc (bar)
(L h�1m�2 bar�1) (L h�1m�2 bar�1) (77) (70.1)
NF270 5.1 2.9 38 0.8
NF90 14.8 5.0 64 1.6
BW30 3.5 1.5 76 3.8
Water Defluoridation Processes: A Review 67

4.3.2. Saline aqueous solution permeabilities of the membranes
The interest in knowing the permeability of the membranes for a salty solution is
to predict the fluxes which could be obtained for a real brackish water (total
salinity near 6 g L�1) without fouling. This parameter is not given by the mem-
brane suppliers.
In the Fig. 7, we have reported the flux as function of the transmembrane
pressure (DP) for a NaCl solution at a concentration of 10�1mol L�1 (6 g L�1)
which is typical of a synthetic brackish water. The linearity observed suggests
that this salty solution follows the Kedem–Katchalscky model (i.e. Spiegler–Ke-
dem model, with pressure and osmotic linear gradients). For linear gradients,
equation (1) amounts to
Jv ¼ PwDPDx
� sDpDx
� �¼ Pw
DPdm
� sDpdm
� �
or
Jv ¼ L0
p DP� sDp½ � ð11Þ
with
L0
p ¼ P0
w=dm: membrane permeability to salty solution (m s�1 kPa�1) or usually
explained in L h�1m�2 bar�1 and Pc ¼ sDp: critical pressure (kPa)
The critical pressures (Pc) obtained with this model are reported in- Table 3.
The Pc values show that the flux through the RO membrane (BW 30) starts under
y = 5.01x - 7.81
R2 = 0.99 y = 2.87x - 2.30R2 = 0.99
y = 1.52x - 5.60R2 = 0.99
0
10
20
30
40
50
60
70
80
90
100
0 5 10 15 20 25 30
NF90
NF270
BW30
Pressure (bar)
Flu
x (
L.h
-1.m
-2)
Fig. 7. Water flux of NaCl solution at 10�1M as a function of the transmembranepressure for NF membranes (NF270, NF90) and low-pressure RO membrane(BW30).
M. Pontie et al.68

the theoretical osmosis pressure (around 4.5 bar for a solution of NaCl 0.1M)
suggesting that this RO membrane is more open than usual.
For the NF membranes (NF90 and NF270), the critical pressure is only slightly
under 2 bars. The accumulation of NaCl on the membrane surface is limited by the
high flow rate and the imposed low conversion ratio. Owing to more open pores
in NF membranes than in RO membranes, the osmosis pressure is lower in
the formers and then NF is less limited by osmosis pressure than LPRO for which
the theoretical value of the osmosis pressure is mass transfer limiting. Finally, the
interest in NF in presence of salt is due to its higher hydraulic permeability and also
to its lower critical pressure. Furthermore the NF90 membrane shows the higher
hydraulic permeability to the NaCl 0.1M solution with Lp0 ¼ 5.0 Lh�1m�2 bar�1.
4.3.3. Roughness of the membranes
AFM characterizations have been performed to determine the morphology and
the topography of the studied membranes. The results obtained for one scan of
1�1 mm2 of the three membranes studied are reported in Fig. 8.
The resulting roughness for two scans (50� 50 mm2 and 1� 1mm2), are re-
ported in Table 4. It may be seen that Ra is higher for the NF90 membrane which
has more open pores. But, the more interesting result is that the NF270 present a
lower roughness than the LPRO BW30 membrane. As usually observed, the
average roughness decreases as the nominal molecular weight cut-off (MWCO)
decreases.
Fig. 8. 3D images of the NF270 (a), NF90 (b) and BW30(c).
Water Defluoridation Processes: A Review 69

4.3.4. Contact angle measurements
In Table 3, are reported the results of contact angle measurements determined
by the sessile drop method and conducted on dry samples. Usually, the lower the
contact angle the more hydrophilic is the material. Then, it appeared clearly that
the more hydrophilic membrane surface is NF270. For NF90 and BW30 mem-
branes it is more difficult to conclude because contact angle measurements can
be highly influenced by their high roughness.
4.3.5. Determination of salt retention
Usually, to compare the selectivity of different membranes, the graph of the
observed retention, denoted Robs, as function of the transmembrane pressure
(DP) is used (see Fig. 9a). For the three studied membranes the data obtained at
DP ¼ 5 and 15 bar are reported in Table 5.
4.3.6. Hydrodynamical approach
The originality of the present approach is to build with the same results as in
graph 9a, representing Cp as function of 1/Jv, as illustrated in Fig. 9b. Then, the
permeate concentration as a function of the reverse permeate flow (1/Jv) re-
vealed a linear evolution in conformity to the equation (8) for the membranes
studied. For 1/Jv-0, the convective part of the solute mass transport, Cconv, is
obtained and from the slope we got Jdiff, the diffusion part of the mass transfer. All
values of Cconv and Jdiff. obtained for the NF270, NF90 and BW30 membranes
are reported in Table 6. From Cconv. values, we can conclude that the NF270
membrane is more convective than NF90 and BW30 membranes, for both stud-
ied salts: NaCl and Na2SO4. The slopes obtained confirm also that the NF90 has
a more diffusionnal behaviour than the NF270. A recent study has demonstrated
that diffusional NF membranes are recommended for high fluoride rejection
(p. 9), then the NF90 should be the best membrane for a selective defluoridation
of drinking waters.
Furthermore, from Cconv values it is possible to calculate the MWCO of the
three membranes, with [88]
Cconv ¼ C0 1�M
Sc
� �1=3" #2
ð12Þ
Table 4. Average roughness of NF90, NF270 and BW30 membranes
Membrane NF270 NF90 BW30
Field analysed 50�50 mm2 1�1 mm2 50�50 mm2 1�1 mm2 50�50 mm2 1�1 mm2
Ra (nm) 4575 1375 390720 298710 290710 125725
M. Pontie et al.70

with M, molecular weight of a solute, Sc, MWCO of the membrane and C0,
initial concentration of the solute in the feed. The results of calculated MWCO are
reported in Table 7. The results obtained show that the best conditions to deter-
mine NF MWCO is under diluted solution (10�3M) using a divalent salt such as
Na2SO4. We observed that the sequence BW30oNF90 oNF270, is in good
correlation with the convective properties of those membranes which is very low
for the LPRO and highest for the NF270. This method is a very simple way to
determine quickly the MWCO of a microporous membrane as recently re-
ported [91].
y = 0.009x + 0.001R2 = 0.98
y = 0.025x + 0.038R2 = 0.98
y = 0.863x + 0.0008R2 = 0.99
0
0.05
0.1
0.15
0.2
0 0.5 1 1.5 2 2.5
NF90NF270BW30
0
10
20
30
40
50
60
70
80
90
100
0(a)
(b)
5 10 15 20 25 30
NF90NF270BW30
Cp
(g
.L–1
)
∆P (bar)
Ro
bs
(%)
1/Jv (h.L-1)
Fig. 9. (a) Observed retention (Robs) vs. the transmembrane pressure (DP) (NaCl0.001M, pH ¼ 6.5). (b) Permeate concentration (Cp) vs. the ratio 1/Jv (NaCl0.001M, pH ¼ 6.5).
Water Defluoridation Processes: A Review 71

Table 5. Robs values determined for NF90, NF270 and BW30 membranes withdifferent transmembrane pressure applied and two different salts (NaCl andNa2SO4)
Robs (%) (P ¼ 15 bar)
Concentration0.001 0.1
(mol L�1) P ¼ 5 bar P ¼ 15 bar P ¼ 5 bar P ¼ 15 bar
NF270 34 59 11 20
NaCl NF90 15 62 5 50
BW30 — 94 — 93
P ¼ 15 bar
NF270 93 60
Na2SO4 NF90 99 98
BW30 99 98
Table 6. Cconv, Jdiff values obtained from simplified SKK model
Cconv (g L�1) Jdiff Cconv (g L
�1) Jdiff(molm�2 s�1) (molm�2 s�1)
Concentration(mol L�1) 10�3 10�1
NaCl NF270 0.0380 2.5�10�6 2.95 2.5�10�5
(79� 10�7) (71� 10�5)NF90 0.0008 0.8�10�4 0.11 2.3�10�3
(78� 10�6) (73� 10�4)BW30 0.0010 0.9�10�6 0.01 3.5�10�5
(70.2�10�6) (71� 10�5)Na2SO4 NF270 0.0084 3.7�10�7 4.15 4.2�10�5
(70.6�10�7) (70.9�10�5)NF90 0.0024 7.4�10�7 0.03 6.2�10�6
(70.5�10�7) (70.9�10�6)BW30 0.0016 1.0�10�7 0.01 3.7�10�6
(70.1�10�7) (70.7�10�6)
Table 7. Molecular weight cut-off determined from equation (12) from Cconv ex-perimental results
MWCO(Da ) calculated MWCOa
Concentration Na2SO4 (mol L�1) 10�3(720) 10�1(715) (77) (Da)
NF270 308 2000 120
NF90 213 190 250
BW30 187 159 96
a Determined from the molecular weight cut-off of a NF70 membrane and its hydraulicpermeability. Source: From Pontie [20].
M. Pontie et al.72
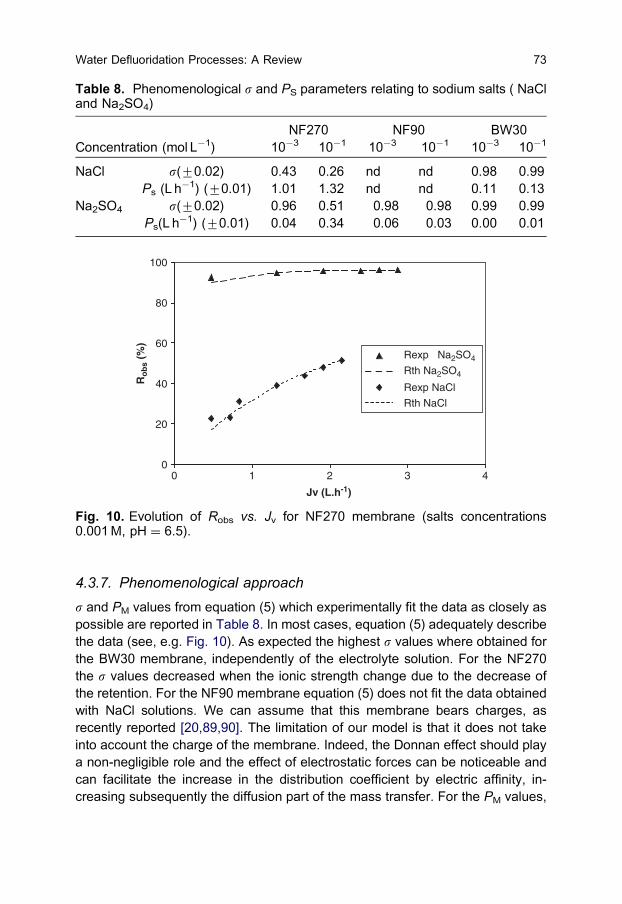
4.3.7. Phenomenological approach
s and PM values from equation (5) which experimentally fit the data as closely as
possible are reported in Table 8. In most cases, equation (5) adequately describe
the data (see, e.g. Fig. 10). As expected the highest s values where obtained for
the BW30 membrane, independently of the electrolyte solution. For the NF270
the s values decreased when the ionic strength change due to the decrease of
the retention. For the NF90 membrane equation (5) does not fit the data obtained
with NaCl solutions. We can assume that this membrane bears charges, as
recently reported [20,89,90]. The limitation of our model is that it does not take
into account the charge of the membrane. Indeed, the Donnan effect should play
a non-negligible role and the effect of electrostatic forces can be noticeable and
can facilitate the increase in the distribution coefficient by electric affinity, in-
creasing subsequently the diffusion part of the mass transfer. For the PM values,
Table 8. Phenomenological s and PS parameters relating to sodium salts ( NaCland Na2SO4)
NF270 NF90 BW30
Concentration (mol L�1) 10�3 10�1 10�3 10�1 10�3 10�1
NaCl s(70.02) 0.43 0.26 nd nd 0.98 0.99
Ps (L h�1) (70.01) 1.01 1.32 nd nd 0.11 0.13
Na2SO4 s(70.02) 0.96 0.51 0.98 0.98 0.99 0.99
Ps(L h�1) (70.01) 0.04 0.34 0.06 0.03 0.00 0.01
0
20
40
60
80
100
0 321 4
Rexp Na2SO4
Rth Na2SO4
Rexp NaCl
Rth NaCl
Ro
bs
(%)
Jv (L.h-1)
Fig. 10. Evolution of Robs vs. Jv for NF270 membrane (salts concentrations0.001M, pH ¼ 6.5).
Water Defluoridation Processes: A Review 73

if we compare the values obtained for Na2SO4, we can observe the following
order at low ionic strength:
NF904NF2704BW30
We observed a modification between both NF membranes at high ionic strength,
with the following order:
NF2704NF904BW30
We can attribute this modification to a decrease in the diffuse layer thickness
under ionic strength variations. It seems also that the NF90 membrane is less
sensitive to ionic strength modifications in comparison to NF270.
4.3.8. Results from the Fatick area
A sample of water (40L) has been filtrated from the endemic region of Senegal
(Fatick) with the three membranes previously described, under industrial condi-
tions. Water analysis (see Table 9) show higher F� and Cl� concentrations than the
WHO standards. All the results are reported in Fig. 11. The evolution of the fluoride
contents in the permeate increase with the following order: NF2704NF904BW30.
Table 9. Fatick’s water analysis (Senegal)
F�(mgL�1) Cl�(mgL�1) Turbidity (NTU) pHTotal salinity(mgL�1)
Feed water 3.76 670 0.6 8.15 2361WHO
standards1.5 200 1 6.5–9 500
0
0.5
1
1.5
2
2.5
3
3.5
0 2 4 6 8 10
NF90NF270BW30
NF90NF270BW30
F-in
the
perm
eate
(m
g/L)
Time (h.)
Fig. 11. F� concentrations in the permeate vs. time during the filtration of theFatick water on NF90, NF270 and BW30 membranes (Feed composition: seeTable 9; operation conditions: Transmembrane pressure 7.5 bars; conversionratio 0.87).
M. Pontie et al.74

It can be concluded that the best NF tested membrane is NF90. Furthermore with
this membrane the F� amount exhibits a good level in terms of prophylactic effect.
On the other hands with NF270 and BW30 membranes the F� concentration are
respectively too high and too low in comparison to the NF90.
Furthermore, we determined the Silt density Index (denoted SDI) of the water
and obtained a value of 3.1. The parameter SDI has become the accepted standard
for assessing the suitability of membrane processes, particularly for RO. The SDI
value is merely a measure of the decline in filtration rate of a membrane filter under
standard test conditions. The test is indeed an indirect ‘‘measurement’’ of all sus-
pended solids, bacterial and colloidal matter in the water to be treated through an
attempt to sacrificially plug a microporous cellulose ester membrane filter. The
value obtained means that Fatick water has a low fouling properties for microporous
membranes. This result permit to counter-balance the high roughness obtained for
the NF90 membrane because a high roughness is usually associated to a high
fouling properties of the membrane material. Those results confirm to a large scale
experiments the interest in NF for water defluoridation as previously reported [1].
5. CONCLUSIONS
This article is a review of all the processes reported for drinking water defluori-
dation for fresh water preparation on both domestic- and industrial scales. Recent
results are also reported on new NF membranes for a more selective defluor-
idation of drinking waters in Senegal. This original result permit to check that the
commercialized NF90 membrane is more efficient due to its diffusional behaviour
for salts, its high hydraulic permeability and its intermediate rejection of F�. Fur-
ther experiments are now being conducted in order to classify all commercial NF
membranes. Operating conditions (transmembrane pressure, membrane mate-
rial, conversion ratio, feed composition and membrane morphology) are the keys
to selectivity for a better predictive NF operation in the future.
It is well known that the application of defluoridation techniques constitutes a
big challenge in third world countries. Unfortunately, of the 25 countries in the
world with severe fluoride problems, most have low economies. Then, two com-
plementary approaches will have to be developed in the future depending on the
local conditions: (i) defluoridation using clay for rural areas and (ii) defluoridation
using NF for urban areas supported by private funds, for drinking water for all.
APPENDIX: LIST OF SYMBOLS AND ACRONYMS
Cconv solute concentration due to convection (g L�1)
Cp solute concentration in the permeate (g L�1)
C0 solute concentration in feed (g L�1)
Water Defluoridation Processes: A Review 75

Jdiff solute flux due to diffusion (molm�2 s�1 )
PS solute permeability vs. membrane (L h�1m�2 bar�1)
Jv solvent flux (L h�1)
Js solute flux (L h�1)
Lp pure water permeability (L h�1m�2 bar�1)
Lp0 saline solution permeability (L h�1m�2 bar�1)
DP transmembrane pressure (bar)
DP osmotic pressure difference across membrane (bar)
Robs observed retention (%)
s reflection coefficient
Ra membrane roughness (nm)
DCs the concentration difference between each side of the membrane (mol L�1)
NF nanofiltration
RO reverse osmosis
UF Ultrafiltration
LPRO low-polarization reverse osmosis
MWCOmolecular weight cut-off
KK Kedem and Katchalsky
SKK Spiegler, Kedem and Katchalsky
EC electrocoagulation
AFM atomic force microscopy
SDI silt density index
WHO World Health Organization
REFERENCES
[1] M. Pontie, M. Rumeau, M. Ndiaye, C. Mart Diop, Sur le proble me de la fluorose au Sene gal: bilan des connaissances et pre sentation d’une nouvelle me thode de defluoruration des eaux de boisson, Cahiers Sante 6 (1) (1996) 27–36.
[2] Y. Wang, E.J. Reardon, Activation and regeneration of a soil sorbent for defluoridationof drinking water, App. Geochem. 16 (2001) 531–539.
[3] S.Ghorai, K.K. Pant, Investigations on the column performance of fluoride adsorption byactivated alumina in a fixed bed. Report, Indian Institute of Technology Kharagpur, 2002.
[4] M. Srimurali, A. Pragathi, J. Karthikeyan, A study on removal of fluorides from drinkingwater by adsorption onto low-cost materials, Environ. Pollut. 99 (1998) 285–289.
[5] N.V.R. Mohan Rao, C.S. Bhaskaran, Studies on defluoridation of water, J. of FluorineChem. 41 (1988) 17–24.
[6] M. Pontie, Electrokinetics phenomena and ionics transfer across microporous mem-branes, PhD Thesis, University of Tours, France, 1996.
[7] M. Pontie, H. Buisson, C.K. Diawara, H. Essis-Tome, Studies of halide ions masstransfer in nanofiltration – application to selective defluorination of brackish water,Desalination 157 (2003) 127–134.
[8] A. Lhassani, M. Rumeau, D. Benjelloun, M. Pontie, Selective demineralisation ofwater by nanofiltration application to the defluoridation of brackish water, Water Res.35 (2001) 3260–3264.
[9] C.K. Diawara, S.M. Lo, M. Rumeau, M. Pontie, O. Sarr, A phenomenological masstransfer approch in nanofiltration of halide ions for a selective defluorination of brack-ish drinking water, J. Membr. Sci. 219 (2003) 103–112.
M. Pontie et al.76

[10] E. Dahi, F. Mtalo, B. Njalo, H. Bregnhj, Defluoridation using the Nalgonda technique inTanzania, 22nd WEDC Conference, 1996.
[11] M.J. Larsen, E.I. Pearce, S.J. Jensen, Defluoridation of water at high pH with use ofbrushite, calcium hydroxite, and bone char, J. Dent. Res. 72 (11) (1993) 1519–1525.
[12] G. Moges, F. Zewge, M. Socher, Preliminary investigations on the defluoridation ofwater using fired clay chips, J. Afr. Earth Sci. 21 (4) (1996) 479–482.
[13] Y. Veressinina, M. Trapido, V. Ahelik, R. Munter, Fluoride in drinking water: theproblem and its possible solutions, Proc. Estonian Acad. Sci. Chem. 50 (2) (2001)81–88.
[14] O.J. Hao, A.M. Asce, C.P. Huang, M. Asce, Adsorption characteristics of fluoride ontohydrous alumina, J. Environ. Eng. 112 (6) (1986) 1054–1069.
[15] J.J. Schoeman, G.W. Leach, An investigation of the performance of two newly in-stalled defluoridation plants in South Africa and some factors affecting their perform-ance, Water Sci. Technol. 19 (1986) 953–965.
[16] J.J. Schoeman, H. Macleod, The effect of particle size and interfering ions on fluorideremoval by activated alumina, Water SA 13 (4) (1987) 229–234.
[17] A.K. Chaturvedi, K.P. Yadava, K.C. Pathak, V.N. Singh, Defluoridation of water byadsorption on fly ash, Water, Air Soil Pollut. 49 (1990) 51–60.
[18] J.A.I. Omueti, R.L. Jones, Fluoride adsorption by Illinois soils, J. Soil Sci. 28 (1977)546–572.
[19] A. Elmidaoui, F. Elhanouni, M. Taky, L. Chay, M.A.M. Sahli, L. Echihabi, M. Hafsi,Optimization of nitrate removal operation from ground water by electrodialysis, Sep.Purif. Technol. 29 (2002) 235–244.
[20] M. Pontie, C.K. Diawara, M. Rumeau, Streaming effect of single electrolyte masstransfer in nanofiltration: potential application for the selective defluorination of brack-ish drinking waters, Desalination 151 (2002) 267–274.
[21] W. Czarnowski, K. Wrzesniowska, J. Krechniak, Fluoride in drinking water and humanurine in Northern and Central Poland, Sci. Total Environ. 191 (1996) 177–184.
[22] N. Azbar, A. Turkman, Defluoridation in drinking waters, Water Sci. Technol. 42 (1–2)(2000) 403–407.
[23] W. Wang, R. Li, J. Tan, K. Luo, L. Yang, H. Li, Y. Li, Adsorption and leaching offluoride in soils of China, Fluoride 35 (2) (2002) 122–129.
[24] M. Agarwal, K. Rai, R. Shrivastav, S. Dass, Defluoridation of water using amendedclay, J. Cleaner. Products 11 (2003) 439–444.
[25] J. B. Du Plessis, What would be the maximum concentration of fluoride in water thatwould not cause dental fluorosis? Fluoride and fluorosis, The Status of S. Afr. Res.,North West Province, 4, 1995.
[26] T. Chernet, Y. Trafi, V. Valles, Mechanism of degradation of the quality of naturalwater in the lakes region of the Ethiopian rift valley, Water Res. 35 (12) (2002)2819–2832.
[27] H. Mjengera, G. Mkongo, Appropriate defluoridation technology for use in fluoroticareas in Tanzania, 3rd WaterNet Symp., Water Demand Management for SustainableDevelopment, 2002.
[28] W.K.N. Moturi, M.P. Tole, T.C. Davies, The contribution of drinking water towardsdental fluorosis: a case study of Njoro division, Nakuru district, Kenya, Environ.Geochem. Health 24 (2002) 123–130.
[29] W.B. Apambire, D.R. Boyle, F.A. Michel, Geochemistry, genesis and health impli-cations of fluoriferous groundwaters in the upper regions of Ghana, Environ. Geol. 33(1997) 13–24.
[30] Y. Travi, Hydrogeologie et hydrologie isotopique des aquiferes fluores du bassin duSenegal, PhD Thesis, University of Paris-Sud, Orsay (1988); Memoire No. 95, CNRS,ISSN 0302-2684, 1993.
[31] W.J. Muller, R.G.M. Heath, M.H. Villet, Finding the optimum: fluoridation of potablewater in South Africa, Water SA 24 (1) (1998) 21–27.
Water Defluoridation Processes: A Review 77

[32] G. Notcutt, F. Davies, Biomonitoring of volcanogenic fluoride, Furnas Caldera,Sao Miguel, Azores, J. Volcan. Geoth. Res. 92 (1999) 209–214.
[33] Y.H. Li, S. Wang, A. Cao, D. Zhao, X. Zhang, C. Xu, Z. Luan, D. Ruan, J. Liang,D. Wu, B. Wei, Adsorption of fluoride from water by amorphous alumina supported oncarbon nanotubes, Chem. Phys. Lett. 38 (3) (2001) 469–476.
[34] H.T. Dean, Classification of mottled enamel diagnosis, J. Am. Dent. Assoc. 211(1934) 421–1426.
[35] S. Hillier, C. Cooper, S. Kellingray, G. Russell, H. Hughes, D. Coggon, Fluoride indrinking water and risk of hip fracture in the UK: a case-control study, The Lancet 335(2000) 265–269.
[36] A.K. Susheela, Sound planning and implementation of fluoride and fluorosis mitiga-tion programme in an endemic village, International Workshop on Fluoride in DrinkingWater, 2001.
[37] J. Cao, Y. Zhao, J. Liu, Brick tea consumption as the cause of dental fluorosis amongchildren from Mongol, Kazal and Yugu populations in China, Food Chem. Toxicol. 35(1997) 827–833.
[38] K.F. Fung, Z.Q. Zhang, J.W.C. Wong, M.H. Wong, Fluoride contents in tea and soilfrom tea plantation and the release of fluoride into tea liquor during infusion, Environ.Pollut. 104 (1999) 197–205.
[39] A. Mekonen, P. Kumar, A. Kumar, Integrated biological and physicochemical treat-ment process for nitrate and fluoride removal, Water Res. 35 (13) (2002) 3127–3136.
[40] C.A. Kailash, S.K. Gupta, A.B. Gupta, Development of new low cost defluoridationtechnology (KRASS), Water Sci. Technol. 40 (2) (1999) 167–173.
[41] A. Nicolay, P. Bertocchio, E. Bargas, F. Coudore, G.L. Chahin, J.P. Reynier, Hype-rkalemia risks in hemodialysed patients consuming fluoride-rich water, Clin. Chim.Acta 281 (1999) 29–36.
[42] M.H. Sy, P. Sene, S. Diouf, Fluorose osseuse au niveau de la main, Societe d’Editionde l’association d’enseignement medical des hopitaux de Paris, 15 (2) (1996)109–115.
[43] S.V. Walvekar, B.A. Qureshi, Endemic fluorosis and partial defluoridation of watersupplies – a public health concern in Kenya, Comm. Dent. Oral Epidemiol. 10 (3)(1982) 156–160.
[44] W. Choi, Y. Chen, The removal of fluoride from waters by adsorption, J. AWWA,Water Technol. (1979) 562–570.
[45] A.C. Pereira, B.H.W. Moreira, Analysis of three dental fluorosis indexes used inepidemiologic trials, Braz. Dent. J. 10 (1) (1999) 1–60.
[46] H.T. Dean, F.H. Arnold, E. Elvove, Domestic water and dental caries, Publ. HealthReport 57 (1942) 1115–1179.
[47] I.L. Carstens, A.J. Louw, E. Kruger, Dental status of rural school children in a sub-optimal fluoride area, J. Dent. S. Afr. 50 (9) (1995) 405–411.
[48] B. Mothusi, Psychological effects of dental fluorosis. Fluoride and fluorosis, The Sta-tus of S. Afr. Res., Pilanesberg National Park, North West Province, 7, 1995.
[49] A.J. Louw, U.M.E. Chikte, Fluoride and fluorosis. The status of research in SouthAfrica, Tygerberg, South Africa. 2nd International Workshop on Fluorosis and De-fluoridation of Water, Int. Soc. Fluoride Res., 1997.
[50] M.J. Rudolph, M. Molefe, U.M.E. Chikte, Dental fluorosis with varying levels of flu-oride in drinking water. Fluoride and fluorosis, The Status of S. Afr. Res., North WestProvince, 5, 1995.
[51] S. Zietsman, The relationship between the geological variation, the F� of the waterand the spatial variation in the occurrence of dental fluorosis in an endemic area, J. S.Afr. Geol. 71 (1987) 102–108.
[52] D.M. Steiner, G. Steiner, Fluoride as essential element in the prevention of disease,Med. Hypotheses 62 (2004) 710–717.
M. Pontie et al.78

[53] M. Yang, T. Hashimoto, N. Hoshi, H. Myoga, Fluoride removal in a fixed bed packedwith granular calcite, Water Res. 33 (16) (1999) 3395–3402.
[54] C.L. Yang, R. Dluhy, Electrochemical generation of aluminium sorbent for fluorideadsorption, J. Hazard. Mater. 94 (3) (2002) 239–252.
[55] N. Parthasarathy, J. Buffle, W. Haerdi, Combined use of calcium salts and polymericaluminium hydroxide for defluoridation of waste waters, Water Res. 20 (4) (1986)443–448.
[56] R. Johnston, H. Heijnen, Safe water technology for arsenic removal. Report, WorldHealth Organization (WHO), 2002.
[57] C.A. Bower, J.T. Hatcher, Adsorption of fluoride by soils and minerals, J. Soil Sci. 3(103) (1967) 151–154.
[58] C. Zevenbergen, L.P. Van Reeuwijk, G. Frapporti, R.J. Louws, R.D. Schuiling, Asimple method for defluoridation of drinking water at village level by adsorption onAndo soils in Kenya, Sci. Total Environ. 188 (1996) 225–232.
[59] J. Omueti, R.L. Jones, Fluoride adsorption by Illinois soils, J. of Soil Sci. 28 (1977)546–572.
[60] S.M. Luther, L. Poulsen, M.J. Dudas, P.M. Rutherford, Fluoride sorption and mineralstability in an Alberta soil interacting with phosphogypsum leachate, Can. J. Soil Sci.76 (1996) 83–91.
[61] A.K. Chaturvedi, K.C. Pathak, V.N. Singh, Fluoride removal from water by adsorptionon China clay, Appl. Clay Sci. 3 (1988) 337–346.
[62] S. Hauge, R. Osterberg, K. Bjorvatn, K.A. Selvig, Defluoridation of drinking water withpottery: effect of firing temperature, Scand. J. Dent. Res. 102 (1994) 329–333.
[63] K. Bjorvatn, A. Bardsen, R. Tekle-Haimanot, Defluoridation of drinking water by use ofclay/soil, Bergen, 2nd International Workshop on Fluorosis and Defluoridation ofWater, Publ. Int. Soc. Fluoride Res. 1997.
[64] M.P. Motalane, C.A. Strydom, Potential groundwater contamination by fluoride fromtwo South African phosphogypsums, Water SA 30 (4) (2004) 465–468.
[65] M. Srimurali, A. Pragathi, J. Karthikeyan, A study on removal of fluorides from drink-ing water by adsorption onto low-cost materials, Environ. Pollut. 99 (1998) 285–289.
[66] P.M.H. Kau, D.W. Smith, P. Binning, Experimental sorption of fluoride by kaolinite andbentonite, Geoderma 84 (1998) 89–108.
[67] M. Mahramanlioglu, I. Kizilcikli, I.O. Biccer, Adsorption of fluoride from aqueous so-lution by acid treated spent bleaching earth, J. Fluorine Chem. 115 (1) (2002) 41–47.
[68] Y.D. Lai, J.C. Liu, Fluoride removal from water with spent catalyst, Sep. Sci. Technol.31 (20) (1996) 2791–2803.
[69] A.M. Raichur, M. JyotiBasu, Adsorption of fluoride onto mixed rare earth oxides, Sep.Purif. Technol. 24 (1–2) (2001) 121–127.
[70] Y.C. Lu, K. Esengul, M. Ersoz, Removal of fluoride form aqueous solution by usingred mud, Sep. Purif. Technol. 28 (1) (2002) 81–86.
[71] N.V.R. Mohan Rao, C.S. Bhaskaran, Studies on defluoridation of water, J. FluorineChem. 41 (1988) 17–24.
[72] C. Castel, M. Schweizer, M.O. Simonnot, M. Sardin, Selective removal of fluoride ionsby a two-way ion-exchange cyclic process, Chem. Eng. Sci. 55 (17) (2000)3341–3352.
[73] L.S. Cheng, Electrochemical method to remove fluorine from drinking water, WaterSupply 3 (1985) 177–186.
[74] N. Mameri, A.R. Yeddou, H. Lounci, D. Belhocine, H. Grib, B. Bariou, Defluoridationof septentrional Sahara water of North Africa by electrocoagulation process usingbipolar aluminium electrodes, Water Res. 32 (5) (1998) 1604–1612.
[75] F. Pouet, F. Persin, M. Rumeau, Intensive treatment by electrocoagulation – flotation– tangential flow microfiltration in areas of high seasonal population, Water Res. 25(1992) 247–253.
Water Defluoridation Processes: A Review 79

[76] H. Garmes, F. Persin, J. Sadeaur, G. Pourcelly, M. Mountadar, Defluoridation ofgroundwater by a hybrid process combining adsorption and Donnan dialysis, Desali-nation 145 (2002) 287–291.
[77] L. Durand-Bourlier,J. M. Laine, Proc. Membrane Technology Conf., New Orleans,1997, pp. 1–16.
[78] M. Hichour, F. Persin, J. Sandeaux, C. Gavach, Fluoride removal from waters byDonnan dialysis, Sep. Purif. Technol. 18 (2000) 1–11.
[79] Z. Amor, B. Bariou, N. Mameri, M. Taky, S. Nicolas, A. Elmidaoui, Fluoride removalfrom brackish water by electrodialysis, Desalination 133 (2001) 215–223.
[80] N. Hilal, H. Al-Zoubi, A. Mohammad, A. Abu-Arabi, A comprehensive review ofnanofiltration membranes: treatment, pretreatment, modelling and atomic force mi-croscopy, Desalination 170 (2004) 281–308.
[81] J. M. Rovel, State and behaviour of seawater desalination in the future, Proc.CHEMRAWNXV, 21–23 June 2004, Paris, pp. 22–28.
[82] H.M. Krieg, S.J. Modise, K. Keizer, H.W.J.P. Neomagus, Salt rejection in nanofiltra-tion for single and binary salt mixtures in view of sulphate removal, Desalination 171(2004) 205–215.
[83] K.S. Spiegler, O. Kedem, Thermodynamics of hyperfiltration (reverse osmosis): cri-teria for efficient membranes, Desalination 1 (1966) 311–326.
[84] S. Jain, S.K. Gupta, Analysis of modified surface pore flow model with concentrationpolarization and comparison with Spiegler–Kedem model in reverse osmosis system,J. Membr. Sci. 232 (2004) 45–61.
[85] Z.V.P. Murphy, S.K. Gupta, Estimation of mass transfer coefficient using a combinednonlinear membrane transport and film theory model, Desalination 109 (1997) 39–49.
[86] R.J. Petersen, Composite membranes, J. Membr. Sci. 83 (1993) 81–93.[87] A. Maurel, Dessalement de l’eau de mer et des eaux saumatres, Tech et Doc, 2001.[88] A. Lhassani, M. Rumeau, d. Benjelloun, Essais d’interpretation des mecanismes de
transfert des sels en nanofiltration, Tribune de l’eau 1–3 (2000) 100–107.[89] M. Manttari, T. Pekuri, M. Nystrom, NF270 a new membrane having promising char-
acteristics and being suitable for treatment of dilute effluents from the paper industry,J. Membr. Sci. 242 (2004) 107–116.
[90] D. Violleau, H. Essis-Tome, H. Habarou, J.P. Croue, M. Pontie, fouling studies of apolyamide nanofiltration membrane by selected natural organic matter: an analyticalapproach, Desalination 173 (2005) 223–238.
[91] H. Dach, J. Leparc, H. Suty, C. Diawara, A. Jadas-Hecart, A. Lhassani, M. Pontie,Innovative approach for characterization of nanofiltration (NF) and low pressure re-verse osmosis (LPRO) membranes for brackish water desalination, Desalination,2006 (submitted).
M. Pontie et al.80
CHAPTER 3
Calixpyrrole–Fluoride Interactions: FromFundamental Research to Applications in the
Environmental Field
Angela F. Danil de Namor,� and Ismail Abbas
Laboratory of Thermochemistry, Chemistry Division, School of Biomedical and MolecularSciences, University of Surrey, Guildford, Surrey GU2 7XH, UK
Contents
1. Fluoride dilemma 82
2. Supramolecular chemistry 84
3. Calix[4]pyrroles 85
4. Selective interaction of calix[4]pyrroles with the fluoride anion 86
5. 1H NMR studies 88
6. Conductometric measurements 91
7. Thermodynamics of complexation 95
8. Solution thermodynamics of reactants and products 109
9. The medium effect of the complexation of calix[4]pyrrole and its derivatives with
the fluoride anion 110
10. Calix[4]pyrroles and their applications 112
10.1. Calix[4]pyrrole sensors for fluoride 112
10.2. Calix[4]pyrrole-based materials 114
11. Final conclusions 115
References 117
AbstractSynthetic macrocycles such as calixpyrroles are capable of complexing anions and dis-
criminating between them most effectively. This chapter is concerned with calixpyrrole and
derivatives with selective properties towards the fluoride anion as demonstrated through
the use of spectrometric, electrochemical and thermal (calorimetry) data. Selectivity is one
of the main features in supramolecular chemistry. As such the importance of thermody-
namics in assessing quantitatively selectivity is emphasised. An account is given about the
steps undertaken for the thermodynamic characterisation of the binding process involving
calixpyrroles and the fluoride anion in different media. Thus based on stability constant
data, selectivity factors are calculated to illustrate the anion, receptor and medium effects
on the selective binding of calixpyroles with the fluoride anion. Representative examples
are given to demonstrate the role of solvation on the complexation process.
�Corresponding author.;
E-mail: [email protected]
FLUORINE AND THE ENVIRONMENT, VOLUME 2
ISSN 1872-0358 DOI: 10.1016/S1872-0358(06)02003-3
r 2006 Elsevier B.V.All rights reserved
81

The applications of calixpyrroles in the design of sensors and new materials with po-
tential use as decontaminant agents for the removal of fluorides from water are discussed.
1. FLUORIDE DILEMMA
Fluorine is a non-metal, characterised by its reactivity and electronegativity [1].
As such it combines with most elements (except oxygen and noble gases) to form
fluorides (inorganic and organic). In the environment, inorganic fluorides pre-
dominate over organic fluorides [2]. During last century environmental concern
about fluorides was focused on inorganic compounds although there are about 30
naturally occurring as well as manufactured organo-fluorides that are released
into the environment [2]. Identified World reserves of fluorite (natural mineral form
of calcium fluoride) are around the order of 500 million tonnes [2]. There is a wide
range sources of fluorides which can be classified under two headings.
(i) Naturally occurring fluoride, for which the main source results from the
weathering of fluoride minerals while the second major source are volcanoes
through their release of gases containing hydrogen fluoride into the atmos-
phere with annual emissions of inorganic fluorides of the order of
60–6000 ktonnes. The third major natural source is provided by marine aer-
osols (20 ktonnes of inorganic fluorides per year) [3].
(ii) Fluoride resulting from human activities. Representative examples of these
activities are aluminium smelting, phosphate processing operations, combus-
tion of coal, manufacture of steel, brick, tile, clay and glass products, domestic
sewage, etc. Consequently fluorides are found in water, air and soil, as well as
in plants and animals and therefore these are part of the food chain consumed
by humans. While fluoride air pollution occurs mainly in the vicinity of industrial
areas, fluoride is released into the environment by a wide range of sources
[4,5]. It is also likely that some of the fluorides emitted into the air are even-
tually carried into surface water through precipitation. Levels of fluoride in
surface waters vary according to the location and the proximity to emission
sources. The concentration of fluoride in unpolluted fresh and seawater gen-
erally ranges from 0.03 to 0.3 ppm for the former and 1.2 to 1.5 ppm for the
latter [6].
Air pollution can lead to a substantial increase in fluoride content in soils
through
(i) Particulate fluoride
(ii) Absorption of gaseous fluoride from rain or snow and
(iii) Fluoride-containing water used in irrigation. It has been reported [7] that more
than 90% of the natural fluoride content in soils is practically insoluble or
A. F. Danil de Namor and I. Abbas82

tightly bound to soil particles. The fluoride content appears to be lower near
the surface than in the inside particles indicating that its soluble fraction may
be easily removed from the soil surface by water seeping into the ground. It
appears therefore that under normal conditions the amount of fluoride avail-
able to plants may be relatively small even from rich-fluoride soils.
At this stage it seems relevant to describe some of the implications related to
fluoride contamination in ecosystems. There is plenty of evidence in the literature
[7,8] on the transformation that many environmental contaminants can undergo
by the action of living organisms. In some cases, the resulting substance (me-
tabolite) is characterised by a higher degree of toxicity than the pollutant in its
original form. A typical example is the methylation of mercury by bacteria [9].
There is evidence that some plants are able to synthesise organic fluoride com-
pounds, mainly fluoroacetate and fluorocitrate from inorganic fluorides. In fact,
fluoroacetates and their related compounds are among the most poisonous sub-
stances known [10]. Indeed, their toxicity is much higher than that of inorganic
fluorides.
Environmental contamination by fluorides and fluoride exposure via drinking
water, foodstuffs and dental products has been the subjects of many scientific
papers and review articles [11,12]. The fluoride ion is a direct cellular poison with
the ability to bind calcium and therefore to interfere with the activity of proteolytic
and glycolytic enzymes such as phosphatases, hexokinase, enolase, succinic
dehydrogenase and pyruvic oxidase. It is well established that oxygen consump-
tion and blood clotting are inhibited by fluoride and erythrocyte glycolysis is sub-
stantially induced by this anion [13]. Hydrogen fluoride inhalation leads to
extreme irritation of the respiratory tract. Thus, its contact with skin and eyes
results in coughing and choking. Irritation caused by the liquid or vapour may
result in severe burns and long term or permanent visual defects. For detailed
information regarding the implications associated with environmental contami-
nation by fluorides, readers are referred to excellent papers and review articles
available in the literature [14,15].
Given the implications involved in fluoride contamination in the environment,
the development of
(i) New technological approaches for the removal of fluorides from contaminated
sources and
(ii) Analytical tools for monitoring fluorides in water are issues of priority concern.
Given that this chapter aims to highlight the scope of supramolecular chem-
istry in the environmental field and in particular, calix[4]pyrroles, the following
section discusses some of the main concepts involved in supramolecular
chemistry and the potential applications offered by calix[4]pyrroles due to their
selective behaviour for fluorides over other environmentally relevant anions.
Calixpyrrole– Fluoride Interactions 83

2. SUPRAMOLECULAR CHEMISTRY
As the field expands the definition of this subject gains complexity. Based on
Lehn’s statement [16], supramolecular chemistry is concerned with the interac-
tion of two or more chemical species held together by intermolecular forces.
Thus, the interaction between a receptor (host) and a substrate (guest) forms a
supermolecule. This complex commonly consists of a macrocyclic ligand as the
host for an ionic or neutral guest. Non-covalent interactions include ion–dipole,
dipole–dipole, hydrogen binding and van der Waals forces [17]. Key features of
supramolecular chemistry involve firstly recognition, where the host shows se-
lectivity towards one substrate over another. Secondly, there is a chemical
transformation in the nature of the guest upon complexation with the host, al-
lowing for translocation of the guest through media it would not normally be able
to pass through by itself. It is this complex formation that is thought to be re-
sponsible for the transport of hydrophilic ions across lipophilic membranes. How-
ever, there are other important factors to be considered and these have been
discussed in details by Danil de Namor and co-workers [18]. Generally speaking,
the supermolecule can be viewed as a protective casing which effectively masks
the ion from the hydrophobic media, thus allowing it to pass through.
The earliest recognised examples of synthetic supramolecular structures were
the complexes formed from crown ethers and metal cations [19]. Since then
numerous macrocycles have been synthesised. Representative examples are
the cryptands [20]. These differ from crown ethers in that the former contains a
tridimensional cavity while the latter are characterised by a hole. Similarly,
calix[4]arenes are compounds with a ‘cup’-like structure that through lower rim
functionalisation gives rise to a hydrophilic and a hydrophobic cavity, thus allow-
ing the reception of ionic species in the former and neutral species in the latter.
Most of the above mentioned macrocycles are known for their capability to serve
as cation receptors.
However, anion receptors remain less well developed for a number of reasons
which have clearly stated in a review article published by Dietrich [21].
Among these are
(i) as compared with isoelectronic cations, anions are considerably larger.
Therefore the charge/size ratio is lower than that for cations. As a result
highly flexible receptors are required.
(ii) Anions have different geometries and the design of receptors needs to take
into account an appropriate orientation for a given anion.
(iii) Anions are characterised by higher hydration energies than cations of similar
size. Therefore the competition between solvent and receptor for the anion is
greater.
(iv) Receptor–anion interactions are usually weaker than those involving cations.
A. F. Danil de Namor and I. Abbas84
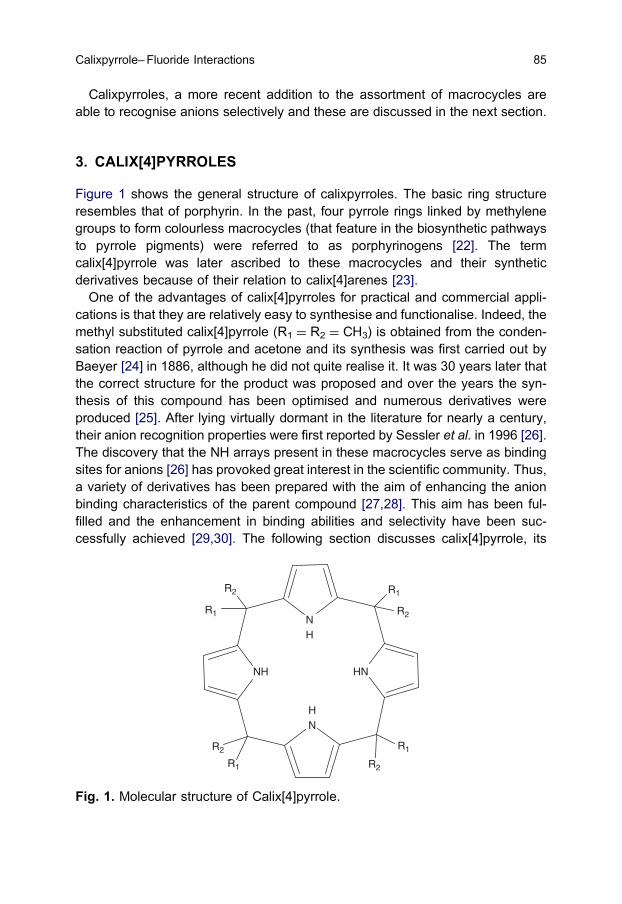
Calixpyrroles, a more recent addition to the assortment of macrocycles are
able to recognise anions selectively and these are discussed in the next section.
3. CALIX[4]PYRROLES
Figure 1 shows the general structure of calixpyrroles. The basic ring structure
resembles that of porphyrin. In the past, four pyrrole rings linked by methylene
groups to form colourless macrocycles (that feature in the biosynthetic pathways
to pyrrole pigments) were referred to as porphyrinogens [22]. The term
calix[4]pyrrole was later ascribed to these macrocycles and their synthetic
derivatives because of their relation to calix[4]arenes [23].
One of the advantages of calix[4]pyrroles for practical and commercial appli-
cations is that they are relatively easy to synthesise and functionalise. Indeed, the
methyl substituted calix[4]pyrrole (R1 ¼ R2 ¼ CH3) is obtained from the conden-
sation reaction of pyrrole and acetone and its synthesis was first carried out by
Baeyer [24] in 1886, although he did not quite realise it. It was 30 years later that
the correct structure for the product was proposed and over the years the syn-
thesis of this compound has been optimised and numerous derivatives were
produced [25]. After lying virtually dormant in the literature for nearly a century,
their anion recognition properties were first reported by Sessler et al. in 1996 [26].
The discovery that the NH arrays present in these macrocycles serve as binding
sites for anions [26] has provoked great interest in the scientific community. Thus,
a variety of derivatives has been prepared with the aim of enhancing the anion
binding characteristics of the parent compound [27,28]. This aim has been ful-
filled and the enhancement in binding abilities and selectivity have been suc-
cessfully achieved [29,30]. The following section discusses calix[4]pyrrole, its
NH
R1
NH
HN
NH
R1
R1
R2
R2
R2
R2
R1
Fig. 1. Molecular structure of Calix[4]pyrrole.
Calixpyrrole– Fluoride Interactions 85

derivatives and their interaction with the fluoride anion as assessed from spec-
trometric (1H NMR, fluorescence spectroscopy), electrochemical (conductometry
and cyclic voltammetry) and thermal (titration calorimetry) techniques.
4. SELECTIVE INTERACTION OF CALIX[4]PYRROLES WITH THEFLUORIDE ANION
The task of designing anion receptors is much more complex than that involving
cations due to the chemical and physico-chemical characteristics of anions such
as their size, geometry and often their pH dependence.
Selectivity is one of the main features in supramolecular chemistry and the
search for receptors able to discriminate between one substrate from another has
greatly motivated the synthetic developments in this area. A quantitative eval-
uation of the selective behaviour of a receptor for one species (ionic or neutral)
over another can be obtained from the ratio of their thermodynamic stability
constants in a given solvent and a given temperature.
Therefore, thermodynamics plays a fundamental role in supramolecular chem-
istry. However, thermodynamics is rigorous and as such, a great deal of ancillary
information is required prior to the formulation of an equation representative of
the process taking place in solution, such as, the composition of the complex and
the nature of the speciation in solution. For the latter and when electrolytes are
involved, knowledge of the ion-pair formation of the free and complex salts in the
appropriate solvent is required particularly in non-aqueous solvents. This infor-
mation would allow the establishment of the concentrations at which particular
ions are the predominant species in solution. Similar considerations must be
taken into account when neutral receptors are involved, given that in dipolar
aprotic or inert solvents, monomeric species are not always predominant in so-
lution. In addition, awareness of the scope and limitations of the methodology
used for the derivation of thermodynamic data for the complexation process is
needed and this aspect has been addressed elsewhere [18].
Unfortunately, these issues have not been often considered and have led to
some controversy in the anion complexation data involving calixpyrroles. The
following sections will discuss 1H NMR, conductometric and thermodynamics
studies involving calixpyrrole, its derivatives and their interactions with the flu-
oride anion in different media.
In the molecular recognition arena, the design and development of receptors
that will bind selectively a single guest from a collection of putative guest species
is an important goal. The calixpyrrole anion receptors (1–21) that show high
selectivity for the fluoride anion are given here. Among the anion receptors,
colorimetric and fluorescent chemosensors (22–31) are discussed later in the
chapter.
A. F. Danil de Namor and I. Abbas86
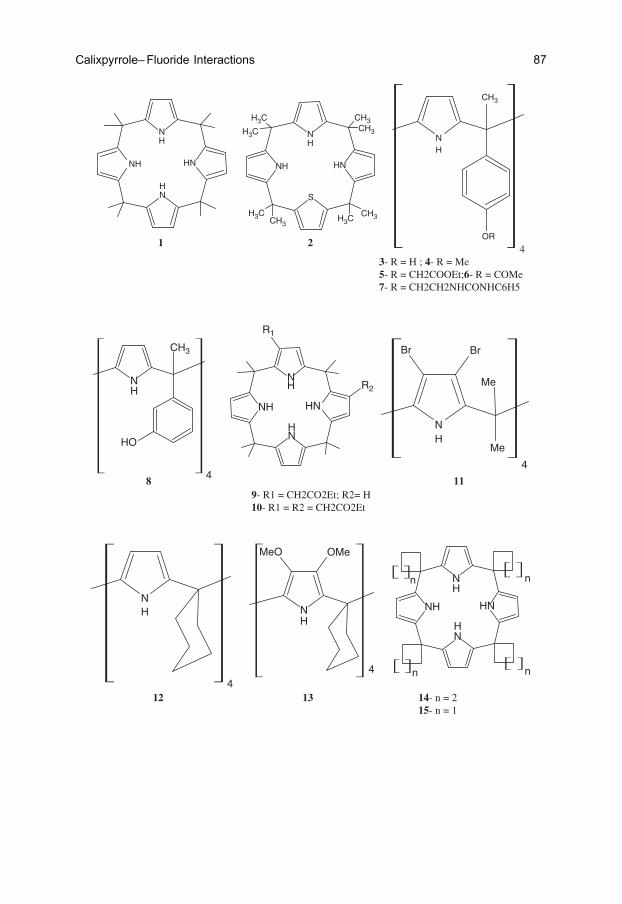
NH
S
HN
NH
H3C
H3C
H3CCH3
CH3
CH3
CH3
CH3
H3C
24
1
NH
NH
HN
NH
3- R = H ; 4- R = Me5- R = CH2COOEt;6- R = COMe7- R = CH2CH2NHCONHC6H5
NH
OR
NH
CH3
HO
4
NH
Me
Me
BrBr
4
NH
NH
HN
NH
R1
R2
8 119- R1 = CH2CO2Et; R2= H10- R1 = R2 = CH2CO2Et
NH
412
NH
MeO OMe
4
13 14- n = 2 15- n = 1
NH
NH
HN
NH
n
nn
n
Calixpyrrole– Fluoride Interactions 87

NH
NH
NH
NH NH
O
16
NH
NH
NH
NH
O
NH
17
NH
NH
NH
NH
O
NH
18
5. 1H NMR STUDIES
1H NMR studies have been carried out with the aim of
(i) Establishing the sites of interaction of the receptor with the anion.
(ii) Determining the composition of the anionic complex.
(iii) Calculating the complex stability constant.
Solvents selected are acetonitrile-d3, dimethyl sulphoxide-d6 and dichloro-
methane-d2. The choice of these solvents was based on the following facts:
(i) The ligands are soluble in these media (unless otherwise indicated).
(ii) In acetonitrile and dimethyl sulphoxide, anion salts are predominantly in their
ionic forms at low concentrations. Dichloromethane offers a low permittivity
medium and therefore ion-pair formation of the free or anionic complex salts
may occur. Therefore, our discussion will be limited to the former two solvents
as far as 1H NMR studies are concerned.
Thus, Table 1 reports chemical shift changes found by the addition of anion
salts to calix[4]pyrrole and its derivatives relative to those for the free ligand in
acetonitrile-d3 and dimethyl sulphoxide-d6 at 298K. These data reveal that the
A. F. Danil de Namor and I. Abbas88

Table 1. 1H NMR chemical shifts changes (Dd (ppm)) of (a) 1, 2, 3, 8 and 19 in acetonitrile and (b) 1 and 2 in d6-DMSO uponcomplexation with halide anions at 298K
(a) Acetonitrile
Dd (ppm)
1 2 3-aaaa 8-aabb 8-abab 19
Anion NH Pyrrole-H HN1 (HN2) HPyrrole 1 (HPyrrole 2) OH HN1 (HN2) OH NH OH NH
F� 5.18 �0.28 — �0.26 0.47 0.09 — 5.48 0.22 3.47
(3.82) (�0.15) (�0.31)
Cl� 3.61 �0.26 2.92 �0.23 �0.04 0.08 1.89 2.08 0.69 1.93
(2.25) (�0.13) (�0.33)
Br� 3.16 �0.24 0.75 �0.22 �0.02 0.12 0.77 1.00 0.12 1.65
(0.67) (�0.06) (�0.25)
I� 0.06 0.02 0.05 �0.01 0.00 — — 0.10 0.00 —
(0.09) (0.00)
(b) Dimethyl sulphoxide
Dd (ppm)
1 2
Anion NH Pyrrole-H HN1(HN2) HPyrrole 1 (HPyrrole 2)
F� 3.597 �0.283 — �0.140
(3.290) (�0.105)
Cl� 2.090 �0.025 0.070 �0.017
(0.040) (�0.007)
Br� 0.304 �0.057 0.010 �0.007
(0.004) (�0.002)
I� 0.003 �0.008 0.005 �0.002
(0.003) (�0.001)
Calixpyrro
le–Fluorid
eInteractio
ns
89

receptors are not only effective anion binding agents in solution but they are also
able to recognise anions selectively with a marked preference for the fluoride ion
relative to other spherical (chloride, bromide and iodide) and non-spherical (di-
hydrogen phosphate) anions. The most substantial changes are observed for the
pyrrole NH and b-CH protons, indicating that these provide the sites of interaction
between these ligands and anions in solution. Thus, significant downfield shifts
are observed in the NH protons of calixpyrrole derivatives (1, 2, 8-abab and 19)
upon the addition of halides in acetonitrile-d3 [31–34], although ligands 1 and 2
exhibit similar pyrrole b-CH chemical shift changes upon the addition of an ex-
cess amount of anion salt.
NHNH
HNNH
NH NH
OO
19
NH
4
20
NH
CH3
Br4
21
On the other hand, the pyrrole-NH protons of 1 show a greater downfield
chemical shift change for fluoride (Dd ¼ 5.18 ppm) than those for 2
(Dd ¼ 3.82 ppm). Undoubtedly, the replacement of a pyrrole unit in 1 by a thiop-
hene ring, 2 reduces the affinity of 2 for fluoride relative to 1 in this solvent.
As far as 3-aaaa is concerned, the low solubility of this ligand in acetonitrile-d3has led to difficulties in the location of NH signal in the spectrum due to its
broadness. At high [F�]/3-aaaa ratios, a second-binding process, involving pre-
sumably the interaction between the fluoride anion and the phenolic OH residues
was observed [35]. Thus, chemical shift changes exhibited by the OH protons are
reported in Table 1. A clear picture emerging from the 1H NMR data is that as far
as the halide ions are concerned, there is a definite size effect in moving down the
group. In fact, linear relationships are found in most cases when the Dd values for
the NH protons are plotted against the anion radii [17]. Representative examples
are given in Fig. 2.1H NMR data in dimethyl sulphoxide-d6 are also shown in Table 1. For the
interaction of 1 and 2 with the halide ions, Dd values in this solvent relative to
acetonitrile-d3 reflect the medium effect on the complexation process. The data
reveal that in moving from acetonitrile-d3 to dimethyl sulphoxide-d6, there is a
substantial decrease in the strength of complexation of these ligands with these
anions, although the selectivity trend remains unaltered.
A. F. Danil de Namor and I. Abbas90

Although, in some cases the composition of the anion complex could be ob-
tained from 1H NMR data, this is not universally found. Therefore, the compo-
sition of the anion complex and the nature of speciation in solution are often
established through conductance measurements and some representative ex-
amples on the systems investigated are discussed in the next section.
6. CONDUCTOMETRIC MEASUREMENTS
Conductance measurements have proved to be particularly useful for
(i) Establishing the concentration range over which the free and complex elec-
trolytes are predominantly as ionic species in solution.
(ii) The determination of the composition of the anion complex. For these pur-
poses two separate sets of experiments are required.
The former requires very accurate measurements of conductance carried out
at different ionic strengths of the electrolyte under study. Molar conductances are
then plotted against the square root of the ionic strength of the electrolyte, I1/2. A
representative example is shown in Fig. 3, where the molar conductance of the
fluoride salt (tetra-n-butylammonium as counter ion) is plotted against the square
root of the ionic strength of the electrolyte. It should be noted that for a 1:1
electrolyte and provided that this is the only species in solution, ionic strength, is
R2 = 0.99
0
1
2
3
4
5
6
1.2 1.4 1.6 1.8 2 2.2
Ionic radius (A°)
∆δ
∆δ Ν
ΗΝ
Η (p
pm)
12819Linear (1)Linear (2)Linear (8)Linear (19)
Cl-
F- Br-
R2 = 0.99
R2 = 0.91
R2 = 1
Fig. 2. Relationship between ionic radii (A0) of halide anions and Dd (ppm).
Calixpyrrole– Fluoride Interactions 91

equal to the molar concentration. This plot shows that the behaviour of these salts
is typical of that expected for strong electrolytes [36,37].
As far as the determination of the composition of the complex is concerned, this
can be obtained from the variation of electrical conductance of an ionic solution
titrated with a solution of the neutral receptor as a result of the different mobilities
of the species in solution. Plots of molar conductances, Lm, against the ratio of
the concentrations of the receptor and anion can provide useful information re-
garding the strength of anion–receptor interaction. In fact, several conclusions
can be drawn from the shape of the conductometric titration curves.
Generally speaking, plots with a small slope, showing no change in the gradient
indicate that little or no complexation has occurred. A noticeable change indicates
moderate complexation. If a sharp break is observed, this implies the formation of
a highly stable complex. Illustrative examples of curves showing the molar con-
ductance as a function of the ligand:anion ratio are given in Fig. 4. This figure
unambiguously demonstrates the selective behaviour of 1 for the fluoride anion
relative to chloride and bromide anions in acetonitrile. Indeed, the conductometric
titration curve of fluoride with 1 shows two straight lines intersecting at the 1:1
stoichiometry of the complex demonstrating the formation of a highly stable
complex relative to chloride (noticeable change in curvature, moderate complex-
ation) or bromide (plot with small slope, weak complex).
The slope of the conductometric titration curve gives a measure of not only the
strength of complexation but also its solvation. If an increase in conductance is
observed on complex formation, this may indicate that the anions are highly
solvated and therefore less mobile than the complex ion. This behaviour is un-
common but has been previously observed for systems involving lithium and
y = -70.966x + 139.97
110
115
120
125
130
135
140
145
150
155
160
0.004 0.006 0.008 0.010 0.012 0.014 0.016
I1/2
Λm
(S.c
m2 .m
ol-1
)
Fig. 3. Molar conductance (in units of S cm2mol�1) of Bu4NF as a function of thesquare root of molar concentrations in acetonitrile at 298.15K.
A. F. Danil de Namor and I. Abbas92
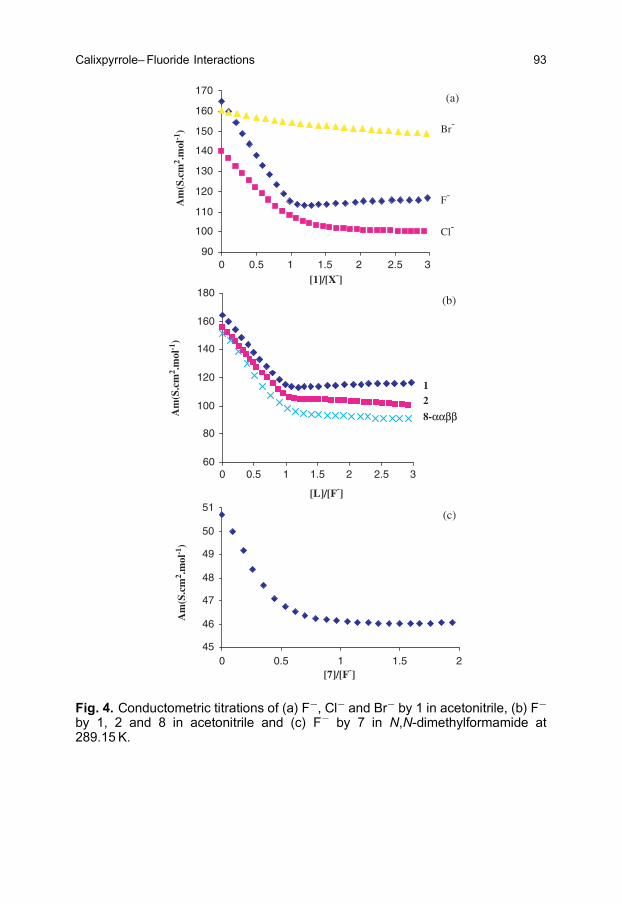
45
46
47
48
49
50
51
0 0.5 1 1.5 2[7]/[F-]
Am
(S.c
m2 .m
ol-1
)
(c)
90
100
110
120
130
140
150
160
170
0 0.5 1 1.5 2 2.5 3[1]/[X-]
F-
Cl-
Br-
(a)
Am
(S.c
m2 .m
ol-1
)
60
80
100
120
140
160
180
0 0.5 1 1.5 2 2.5 3
[L]/[F-]
Am
(S.c
m2 .m
ol-1
)
1 2
8-ααββααββ
(b)
Fig. 4. Conductometric titrations of (a) F�, Cl� and Br� by 1 in acetonitrile, (b) F�
by 1, 2 and 8 in acetonitrile and (c) F� by 7 in N,N-dimethylformamide at289.15K.
Calixpyrrole– Fluoride Interactions 93

some crown ethers [38]. In solvents of low permittivity such as dichloromethane,
an increase in Lm values is often observed. This is attributed to the fact that the
free salt is not fully dissociated and therefore ion pairs are also present in so-
lution. The addition of the ligand leads to the formation of a complex electrolyte,
which is more dissociated than the uncomplexed salt. The conductance behav-
iour observed for titrations involving fluoride and other halide anions follows the
expected pattern with a decrease in Lm value upon complex formation. This is
frequently attributed to the increase in the size of the fluoride anion in moving
from the free to the complex state, which results in a lower mobility and con-
sequently a decrease in conductivity.
The affinity of the various calix[4]pyrrole receptors (1, 2, 8-aabb) for the fluoride
anion in acetonitrile at 298.15K is reflected in the conductometric titration curves
of fluoride against the ligand/anion ratio. The data shown in Fig. 4b are in accord
with 1H NMR studies which show (Table 1) that the most significant chemical shift
changes in the resonances of pyrrole NH and b-CH protons of receptors 1 and 2
were observed upon complexation with the fluoride anion in acetonitrile.
Like calix[4]arenes, calix[4]pyrroles are versatile ligands to the extent that the
composition of the anion: receptor complex is solvent dependent. A represent-
ative example is that involving 8 and the fluoride anion. As shown in Fig. 4b, the
well-defined change in curvature observed at 1:1 ligand:fluoride mole ratio in-
dicates that in acetonitrile one fluoride anion interacts per unit of receptor 8.
However, in moving from acetonitrile to N,N-dimethylformamide, the noticeable
changes in curvature observed at a ligand/anion mole ratio of 0.5 and 1, indicate
respectively the formation of a 1:2 and 1:1 anion complexes, respectively, in this
solvent.
The enhancement in the receptor capacity to host anions has been success-
fully achieved by the design of double-cavity ligands. This is reflected in the
conductometric titration curve (Fig. 4c) for the fluoride anion when titrated with
receptor 7. In fact, in N,N-dimethylformamide, this receptor takes up two anions
per unit of ligand while discriminating against other spherical (chloride, bromide
and iodide) and non-spherical (hydrogen sulphate, perchlorate, nitrate and tri-
fluoromethane sulphonate) anions except H2PO4�. With this anion only the for-
mation of a 1:1 complex was observed.
From the above discussion it is concluded that
(i) 1 and 2 are able to discriminate among the halide anions following the se-
quence
F�4Cl�4Br�4I�
(ii) The hosting capacity of 7 is greater for the fluoride anion relative to the
dihydrogen phosphate anion in N,N-dimethylformamide.
A. F. Danil de Namor and I. Abbas94

(iii) The two calix[4]pyrrole isomers, 8-aabb and 8-abab can discriminate between
anions in acetonitrile. Thus, while 8-aabb isomer is able to host two dihydro-
gen phosphate anions in acetonitrile relative to fluoride and other anions (1:1
complexes), 8-aabb can still complex two dihydrogen phosphate as well as
two fluoride anions relative to chloride.
7. THERMODYNAMICS OF COMPLEXATION
We have already discussed the relevant information required for the formation of
an equation representative of the process taking place in solution. This is an
essential requirement in the derivation of thermodynamic data, given that these
must be referred to a well-defined process. In this section, the thermodynamics of
complexation of calix[4]pyrroles and the fluoride anion is discussed. Only for
comparative purposes and mainly for the calculation of the selectivity factor, data
for other ions are included. Thus, Table 2 reports the stability constants and
derived standard Gibbs energies, enthalpies and entropies of complexation of
calix[4]pyrrole and its derivatives in a wide-range solvents [acetonitrile (MeCN),
N,N-dimethylformamide (DMF), dichloromethane (DCM), dimethyl sulphoxide
(DMSO) and propylene carbonate (PC)] at 298.15K (unless otherwise indicated).
The methodology used for the determination of the stability constant (expressed
as log10Ks) and the enthalpy of complexation, DcH is indicated at the footnote of
Table 2. The standard Gibbs energy of complexation, DcG0 is calculated from the
relationship shown below
DcG0¼ �RT ln Ks ð1Þ
In this equation R and T are the gas constant and the temperature (K),
respectively. The data are referred to the standard state where the activity of
reactants and product is equal to 1mol dm�3.
Standard entropies of complexation are calculated from
DcG0¼ DcH� TDcS
0ð2Þ
Thermodynamic data reported in Table 2 reflect the affinity of these
calix[4]pyrrole derivatives for the fluoride relative to other anions. Among the
halides the selectivity trend follows the sequence
F�4Cl�4Br�4I�
However, the fact that fluorides are (i) associated with the application of some
phosphate fertilisers that many leach into surface waters and shallow ground
water and (ii) by-product of the phosphate fertiliser industry which are the primary
sources of fluoride pollution call upon the need of receptors that are able
to interact with both anions. Calix[4]pyrrole and most of the derivatives have
Calixpyrrole– Fluoride Interactions 95
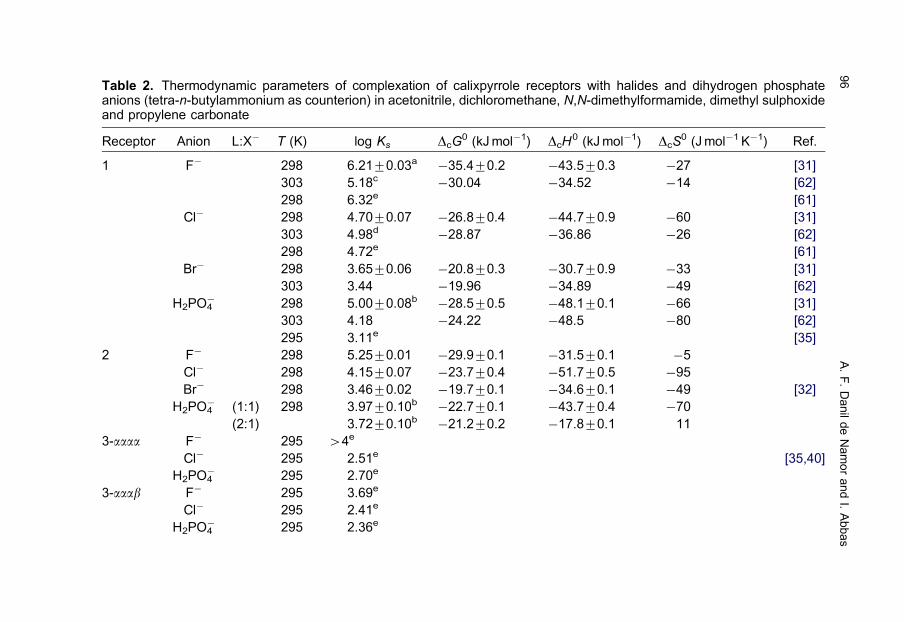
Table 2. Thermodynamic parameters of complexation of calixpyrrole receptors with halides and dihydrogen phosphateanions (tetra-n-butylammonium as counterion) in acetonitrile, dichloromethane, N,N-dimethylformamide, dimethyl sulphoxideand propylene carbonate
Receptor Anion L:X� T (K) log Ks DcG0 (kJmol�1) DcH
0 (kJmol�1) DcS0 (Jmol�1 K�1) Ref.
1 F� 298 6.2170.03a �35.470.2 �43.570.3 �27 [31]
303 5.18c �30.04 �34.52 �14 [62]
298 6.32e [61]
Cl� 298 4.7070.07 �26.870.4 �44.770.9 �60 [31]
303 4.98d �28.87 �36.86 �26 [62]
298 4.72e [61]
Br� 298 3.6570.06 �20.870.3 �30.770.9 �33 [31]
303 3.44 �19.96 �34.89 �49 [62]
H2PO4� 298 5.0070.08b �28.570.5 �48.170.1 �66 [31]
303 4.18 �24.22 �48.5 �80 [62]
295 3.11e [35]
2 F� 298 5.2570.01 �29.970.1 �31.570.1 �5
Cl� 298 4.1570.07 �23.770.4 �51.770.5 �95
Br� 298 3.4670.02 �19.770.1 �34.670.1 �49 [32]
H2PO4� (1:1) 298 3.9770.10b �22.770.1 �43.770.4 �70
(2:1) 3.7270.10b �21.270.2 �17.870.1 11
3-aaaa F� 295 44e
Cl� 295 2.51e [35,40]
H2PO4� 295 2.70e
3-aaab F� 295 3.69e
Cl� 295 2.41e
H2PO4� 295 2.36e
A.F.DanildeNamorandI.Abbas
96

Table 2. Continued
Receptor Anion L:X� T (K) log Ks DcG0 (kJmol�1) DcH
0 (kJmol�1) DcS0 (Jmol�1 K�1) Ref.
3-aabb F� 295 44e
Cl� 295 3.15e [35,40]
H2PO4� 295 2.71e
4-aaaa F� 295 44e
Cl� 295 2.45e [35,40]
H2PO4� 295 o 2
4-aaab F� 295 3.04e
Cl� 295 2.34e [35,40]
295 o 1.9
4-aabb F� 295 3.66e
Cl� 295 o 2e [35,40]
H2PO4� 295 o 2
8-aabb F� 298 3.0870.02b �17.670.1 �97.170.8 �267
Cl� 298 2.5970.04b �14.870.2 �55.4670.04 �136
H2PO4� (1:1) 298 3.6070.02b �20.5470.04 �24.5570.06 �13 [33]
(1:2) 2.5070.03b �14.4370.04 �22.6370.06 �28
8-abab F� (1:1) 298 5.0070.04b �28.570.2 �31.470.3 �10 [33]
(1:2) 4.7270.01b �27.070.1 �61.570.3 �116
Cl� 298 2.3670.03b �13.570.1 �86.370.3 �244
H2PO4� (1:1) 298 4.8070.02b �27.470.3 �20.270.1 25
(1:2) 2.6670.10b �15.270.5 �29.970.6 �50
16 F� 298 5.17f [40]
Cl� 295 44e
298 4.86f
Calixpyrro
le–Fluorid
eInteractio
ns
97
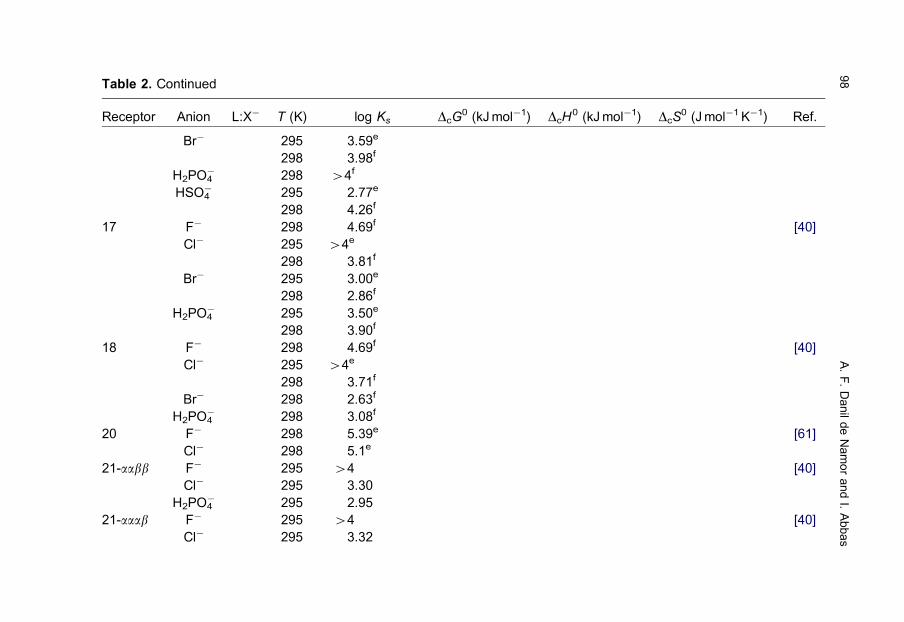
Table 2. Continued
Receptor Anion L:X� T (K) log Ks DcG0 (kJmol�1) DcH
0 (kJmol�1) DcS0 (Jmol�1 K�1) Ref.
Br� 295 3.59e
298 3.98f
H2PO4� 298 44f
HSO4� 295 2.77e
298 4.26f
17 F� 298 4.69f [40]
Cl� 295 44e
298 3.81f
Br� 295 3.00e
298 2.86f
H2PO4� 295 3.50e
298 3.90f
18 F� 298 4.69f [40]
Cl� 295 44e
298 3.71f
Br� 298 2.63f
H2PO4� 298 3.08f
20 F� 298 5.39e [61]
Cl� 298 5.1e
21-aabb F� 295 44 [40]
Cl� 295 3.30
H2PO4� 295 2.95
21-aaab F� 295 44 [40]
Cl� 295 3.32
A.F.DanildeNamorandI.Abbas
98

Table 2. Continued
Receptor Anion L:X� T (K) log Ks DcG0 (kJmol�1) DcH
0 (kJmol�1) DcS0 (Jmol�1 K�1) Ref.
H2PO4� 295 2.95
22 F� 5.34f [46]
Cl� 4.02f
H2PO4� 5.22f
23 F� 46f [46]
Cl� 4.26f
H2PO4� 5.65
24h F� 45.30f [46]
Cl� o4f
H2PO4� 5.83f
Dichloromethane
1 F� 298 4.23e [26,40]
Cl� 298 2.54e
Br� 298 1e
I� 298 o 1e
H2PO4� 298 1.99e
HSO4� 298 o 1e
9 F� 298 3.04e [28]
Cl� 298 1.67e
H2PO4� 298 o 1
11 F� 298 4.43e [28,40]
Cl� 298 3.63e
H2PO4� 298 2.81e
Calixpyrro
le–Fluorid
eInteractio
ns
99

Table 2. Continued
Receptor Anion L:X� T (K) log Ks DcG0 (kJmol�1) DcH
0 (kJmol�1) DcS0 (Jmol�1 K�1) Ref.
295 2.81e
12 F� 295 3.56e [26,40]
Cl� 295 2.07e
H2PO4� 295 o 1
13 F� 295 3.24e [40]
Cl� 295 o 1.3e
14 F� 295 3.48e [40]
Cl� 295 2e
15 F� 295 3.36e [40]
Cl� 295 o 2e
16 F� 298 4.94f [40,47]
Cl� 298 3.69f
Br� 298 3.01f
H2PO4� 298 4.20f
17 F� 298 4.52f [47]
Cl� 298 2.96f
H2PO4� 298 3.56f
18 F� 298 4.49f [47]
Cl� 298 2.79f
N,N-dimethylformamide
1 F� 298 6.870.3a �39.070.5 �26.270.5 43 [31]
Cl� 298 4.270.1 �24.070.6 �14.570.1 32
Br� 298 3.470.1 �19.170.7 �9.270.9 33
H2PO4� 298 4.870.1b �27.470.6 �18.870.3 29
A.F.DanildeNamorandI.Abbas
100

Table 2. Continued
Receptor Anion L:X� T (K) log Ks DcG0 (kJmol�1) DcH
0 (kJmol�1) DcS0 (Jmol�1 K�1) Ref.
2 F� 298 3.7170.02 �21.370.1 �9.270.4 40 [32]
Cl� 298 3.48 7 0.04 �19.8 7 0.2 �21.3 7 0.9 �5
7 F� (1:1) 298 4.370.2b �24.670.8 �21.170.2 12 [43]
(1:2) 298 2.870.3b �15.770.2 �6.470.4 32
H2PO4� 298 4.1170.03b �23.470.2 �22.7470.02 3
8-aabb F� (1:1) 298 3.47 0.1b �19.270.8 �13.670.3 19 [33]
(1:2) 298 3.270.2b �18.271.1 �7.670.2 35
Dimethyl sulphoxide
1 F� 295 44e [41]
Cl� 295 2.99e
H2PO4� 295 3.75e
2 F� 298 2.1270.02 �12.170.4 �24.570.3 �42 [32]
6 F� 298 1.86e [42]
26 F� 295 46g [41]
Cl� 295 2.76g
H2PO4� 295 3.66g
27 F� 295 46g [41]
Cl� 295 2.81g
H2PO4� 295 3.91
28 F� 295 46g [41]
Cl� 295 3.45g
H2PO4� 295 5.20g
Calixpyrro
le–Fluorid
eInteractio
ns
101
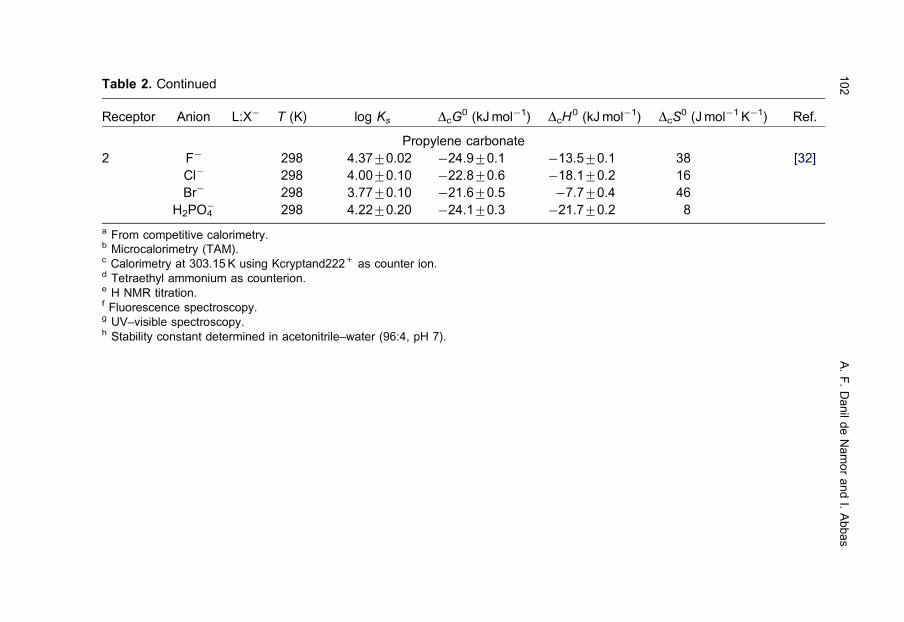
Table 2. Continued
Receptor Anion L:X� T (K) log Ks DcG0 (kJmol�1) DcH
0 (kJmol�1) DcS0 (Jmol�1 K�1) Ref.
Propylene carbonate
2 F� 298 4.3770.02 �24.970.1 �13.570.1 38 [32]
Cl� 298 4.0070.10 �22.870.6 �18.170.2 16
Br� 298 3.7770.10 �21.670.5 �7.770.4 46
H2PO4� 298 4.2270.20 �24.170.3 �21.770.2 8
a From competitive calorimetry.b Microcalorimetry (TAM).c Calorimetry at 303.15K using Kcryptand222+ as counter ion.d Tetraethyl ammonium as counterion.e H NMR titration.f Fluorescence spectroscopy.g UV–visible spectroscopy.h Stability constant determined in acetonitrile–water (96:4, pH 7).
A.F.DanildeNamorandI.Abbas
102

potential applications for the removal of both species from contaminated sources,
although these are selective for fluorides.
Data in Table 2 reveal that with a few exceptions, the stability of the complexes
is enthalpy controlled and entropy destabilised. As previously stated, the variations
observed in the thermodynamics of complexation of these systems as a result of
the medium effect are the result of the solvation changes that the reactants (anion
and receptor) and the product (complex anion) undergo in moving from one me-
dium to another. This issue will be carefully addressed in the next section.
Given that selectivity is one of the main features in supramolecular chemistry,
this is now discussed under three main leadings.
(i) Selectivity of calix[4]pyrrole for fluoride over other anions.
A quantitative assessment of selectivity requires accurate stability constant
data. Whenever possible, different techniques should be used to derive stability
constant data. In doing so, the scope and limitations of the methodology em-
ployed to derive the data must be carefully considered.
Availability of stability constant data allows the calculation of the selectivity
factor, S, which is calculated from the ratio of stability constants of two ions and a
given receptor in a given solvent and temperature as shown below
SX1=X2¼
K ys ðX1Þðs1Þ
K ys ðX2Þðs1Þ
ð3Þ
In equation (3), K ys is the thermodynamic stability constant, as defined else-
where [31]. Inspection of Table 3 shows that all the calix[4]pyrrole receptors
(except 8-aabb, 22 and 24) in non-aqueous solvents at a given temperature are
more selective for the fluoride anion relative to other anions (X�¼ Cl�, Br�, I�,
HSO4� and H2PO4
�).
NH
NH
HN
NH
NHSO O
N CH3
CH3 CH3 CH3
HC3
22
NH
NH
HN
NH
NHSO O
SO3-
ON +N
Et
Et Et
Et
23
NH
NH
HN
NH
NH
NHS
CO2H
O OHO
24
Calixpyrrole– Fluoride Interactions 103

Table 3. Selectivity factor SF�=X2of calix[4]pyrrole ligands for fluoride anion rel-
ative to other anions (X2 ¼ Cl�, Br�, I� and H2PO4�) in acetonitrile (MeCN), di-
chloromethane (DCM), N,N-dimethylformamide (DMF), dimethyl sulphoxide(DMSO) and propylene carbonate (PC)
SF�=X2
Receptor T (K) X2 MeCN DCM DMF DMSO PC
1 298 Cl� 32 49 398 410a
Br� 363 1698 2512
I� 45,684 o 1698
H2PO4� 16 174 100 42a
2 298 Cl� 13 2 2
Br� 62 4
H2PO4� 19 1
3-aaaa 295 Cl� 431
H2PO4� 420
3-aaab 295 Cl� 19
H2PO4� 21
3-aabb 295 Cl� 47
H2PO4� 419
4-aaaa 295 Cl� 435
H2PO4� 4100
4-aaab 295 Cl� 5
H2PO4� 414
4-aabb 295 Cl� 446
H2PO4� 446
7 298 H2PO4� 2b
8-aabb Cl� 3
H2PO4� 0.3b
8-abab Cl� 436
H2PO4� 2b
9 298 Cl� 23
H2PO4� 4110
11 298 Cl� 6
H2PO4� 42
12 298 Cl� 31
H2PO4� 4363
13 295 Cl� 488
14 295 Cl� 30
15 295 Cl� 423
16 298 Cl� 2 18
Br� 15 85
A. F. Danil de Namor and I. Abbas104

As an illustrative example, receptor 1 is more selective for fluoride relative to
chloride, bromide, iodide and dihydrogen phosphate by factors of 32, 363, 45,684
and 16, respectively. In acetonitrile receptors 8-aabb, 22 and 24 show a higher or
similar selectivity to dihydrogen phosphate relative to fluoride. On the other hand,
the calixpyrrole derivative 2 exhibits a similar selectivity towards dihydrogen
phosphate as for fluoride anion [S ¼ (Ks(F�)/Ks(H2PO4
�)) ¼ 1].
(ii) Selectivity of calix[4]pyrrole for the fluoride anion in one solvent,
s1, relative to another, s2. This is defined as the stability constant ratio of a
given calix[4]pyrrole with the fluoride anion in one solvent (s1) relative to
Table 3. Continued
SF�=X2
Receptor T (K) X2 MeCN DCM DMF DMSO PC
H2PO4� 415 5
HSO4� 8
17 298 Cl� 8 36
Br� 68
H2PO4� 6 9
18 298 Cl� 10 50
Br� 115
H2PO4� 41
20 298 Cl� 2
21-aaab 295 Cl� 45
H2PO4� 411
21-aabb 295 Cl� 45
H2PO4� 411
22 Cl� 21
H2PO4� 1
23 Cl� 455
H2PO4� 42
24 Cl� 420
H2PO4� 40.3
26 295 Cl� 41738
H2PO4� 4219
27 295 Cl� 41549
H2PO4� 4123
28 295 Cl� 4355
H2PO4� 46
a T ¼ 295K.b Ks1 of complexation process was considered in calculation.
Calixpyrrole– Fluoride Interactions 105
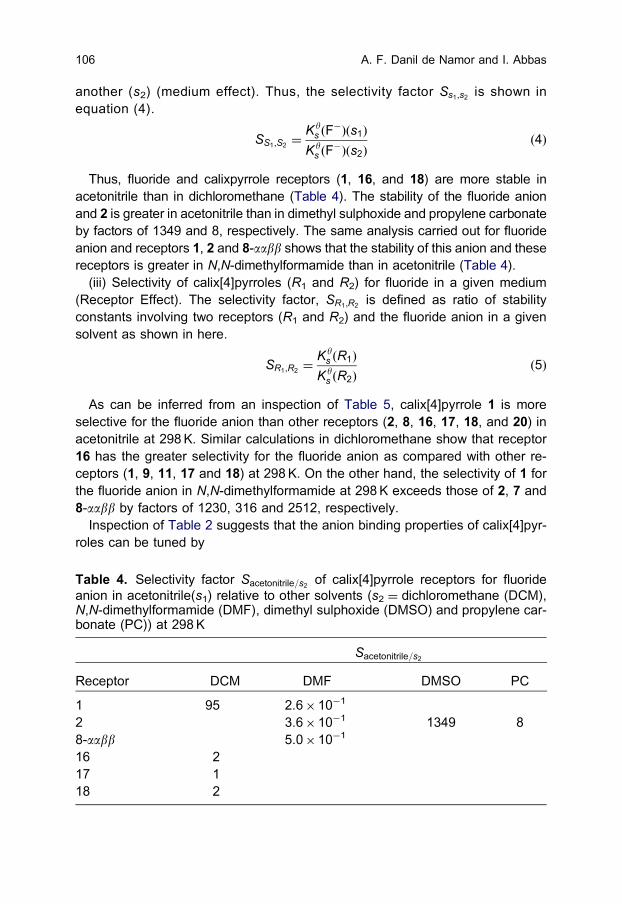
another (s2) (medium effect). Thus, the selectivity factor Ss1;s2 is shown in
equation (4).
SS1 ;S2¼
K ys ðF
�Þðs1Þ
K ys ðF
�Þðs2Þ
ð4Þ
Thus, fluoride and calixpyrrole receptors (1, 16, and 18) are more stable in
acetonitrile than in dichloromethane (Table 4). The stability of the fluoride anion
and 2 is greater in acetonitrile than in dimethyl sulphoxide and propylene carbonate
by factors of 1349 and 8, respectively. The same analysis carried out for fluoride
anion and receptors 1, 2 and 8-aabb shows that the stability of this anion and these
receptors is greater in N,N-dimethylformamide than in acetonitrile (Table 4).
(iii) Selectivity of calix[4]pyrroles (R1 and R2) for fluoride in a given medium
(Receptor Effect). The selectivity factor, SR1 ;R2is defined as ratio of stability
constants involving two receptors (R1 and R2) and the fluoride anion in a given
solvent as shown in here.
SR1 ;R2¼
K ys ðR1Þ
K ys ðR2Þ
ð5Þ
As can be inferred from an inspection of Table 5, calix[4]pyrrole 1 is more
selective for the fluoride anion than other receptors (2, 8, 16, 17, 18, and 20) in
acetonitrile at 298K. Similar calculations in dichloromethane show that receptor
16 has the greater selectivity for the fluoride anion as compared with other re-
ceptors (1, 9, 11, 17 and 18) at 298K. On the other hand, the selectivity of 1 for
the fluoride anion in N,N-dimethylformamide at 298K exceeds those of 2, 7 and
8-aabb by factors of 1230, 316 and 2512, respectively.
Inspection of Table 2 suggests that the anion binding properties of calix[4]pyr-
roles can be tuned by
Table 4. Selectivity factor Sacetonitrile=s2 of calix[4]pyrrole receptors for fluoride
anion in acetonitrile(s1) relative to other solvents (s2 ¼ dichloromethane (DCM),N,N-dimethylformamide (DMF), dimethyl sulphoxide (DMSO) and propylene car-bonate (PC)) at 298K
Sacetonitrile=s2
Receptor DCM DMF DMSO PC
1 95 2.6� 10�1
2 3.6� 10�1 1349 8
8-aabb 5.0� 10�1
16 2
17 1
18 2
A. F. Danil de Namor and I. Abbas106

(i) Appending different groups to the C-rim of these receptors (9, 11, 13)[39,40].
(ii) Functionalisation with chromophores (29–31) [41].
(iii) Synthesising receptors with extended (3–6 and 8) [33,35,40,42] and double
cavities (7) [43].
Some of the factors contributing to the stability of these complexes are now
highlighted. Thus, the lower stability constants of 13 for fluoride and chloride
relative to 12 [26,40] in dichloromethane may be attributed to the electron-do-
nating ability of the eight C-rim methoxy groups which reduces the acidity of the
pyrrole NH protons and hence its anion binding ability. The possibility of ion-pair
formation in this solvent (low permittivity) cannot be excluded.
NH
NH
HN
NH
Ar
O
OO
OOH
29
30
31
Ar:
NH
NH
HN
NH X
Y
25- X= H2, Y = C(CN)226- X = Y = O 27- X = O, Y = C(CN)228- X = Y = C(CN)2
Table 5. Selectivity factor SR1=R2of calix[4]pyrrole receptor R1 for fluoride anion
relative to another receptor R2 in acetonitrile (MeCN), dichloromethane (DCM),N,N-dimethylformamide (DMF) at 298K
SR1=R2
R2 MeCN (R1 ¼ 1) DCM (R1 ¼ 16) DMF (R1 ¼ 1)
1 1 5 1
2 9 1230
7 81(1:1)a 316
8-aabb 1349 2512
8-abab 16
9 79
11 3
16 11 1
17 33 3
18 33 3
20 7
a Enhanced Capacity.
Calixpyrrole– Fluoride Interactions 107

Likewise, 9 shows lower stability constants than 1 in dichloromethane. This
reduction in the anion-binding strength may result from the unfavourable inter-
actions between the bound anion and the lone pair electrons of the oxygen atoms
of the C-rim ester group or again ion pair formation in this solvent.
However, the anion-binding properties of 29–31 receptors [41] seem to be
stronger than those involving 1. This may be attributed to the electron-withdraw-
ing nature of the dicyanomethylidene, which enhances the ability of the pyrrole
NH protons and hence increase their anion binding abilities of these ligands.
The orientation of the phenol group in 8-aabb [33] turned the affinity of this
isomer towards the tetrahedral dihydrogen phosphate (1:2, ligand:anion ratio)
over the remaining spherical anions (1:1, ligand:anion ratio). Both isomers of 8
show a similar trend in terms of selectivity except that the 8-abab receptor shows
an enhanced selectivity and capacity to interact with the fluoride anion in ace-
tonitrile. Thus, the interaction of 8-abab with fluoride is greater than that for the
dihydrogen phosphate anion. The most distinctive feature of the data in Table 2
is that the stability of anion-1 complexes is greater than for 2 in acetonitrile and
N,N-dimethylformamide. This is attributed to the replacement of one pyrrole unit
in 1 by a thiophene unit in 2 that led to a decrease in the complex stability of 2
relative to 1.
Attempts to correlate stability constant data for 1 and 2 in acetonitrile with the
chemical shift changes, Dd, of the pyrrole proton led to straight lines (Fig. 5).
These findings clearly demonstrate the selective behaviour of these receptors for
the fluoride anion.
R2 = 0.99
R2 = 0.98
0
1
2
3
4
5
6
7
-0.3 -0.28 -0.26 -0.24 -0.22 -0.2
∆δ∆δPyrrole_H (ppm)
log
Ks
21Linear (2)Linear (1)
F-
Cl-
Br-
Fig. 5. Linear relationship between log Ks of 1 and 2 and Dd values for the pyrroleproton in acetonitrile at 298K.
A. F. Danil de Namor and I. Abbas108

8. SOLUTION THERMODYNAMICS OF REACTANTS ANDPRODUCTS
Thermodynamics parameters of solution (DsP0; P ¼ G, H, S) of reactants (anion
salt, MX and receptor, L) and product (complex salt, MLX) combined with cor-
responding data for the anion complexation process, DcP0, in a given solvent, s1,
have been extensively used by us with the aim of deriving the thermodynamics
referred to the coordination process, DcoordP0, where reactants and products are
in their pure physical state
DcoordP0¼ DsP
0ðMXÞðs1Þ þ DsP
0ðLÞðs1Þ þ DcP
0ðs1Þ � DsP
0ðMLXÞðs1Þ ð6Þ
These data provide a useful mean of checking the reliability of the thermo-
dynamic parameters associated with the solution and complexation processes.
Indeed, coordination data should be the same (within the experimental error)
independently of the solvent used in the solution process. This statement is now
corroborated by representative examples involving the fluoride anion and 1. Thus
in fulfilling the requirements of equation (6), the enthalpies of solution of the
reactants (Bu4NF and 1) and product (Bu4N1F) are combined with the enthalpies
of complexation of the fluoride anion and 1 in acetonitrile (MeCN) (equation (7))
and N,N- dimethylformamide (DMF) (equation (8)) to derive the enthalpy of
coordination for this system in the solid state.
1(MeCN) + Bu4N+ + F-(MeCN)∆sH°
-39.1 kJ mol-1Bu4N1F (MeCN)
∆sH°33.2 kJ mol-1
Bu4N1F (sol.)∆sH°
-11.7 kJ mol-1
∆sH°39.0 kJ mol-1
∆sH°21.6 kJ mol-1
1 (sol.) + Bu4NF (sol.)
ð7Þ
1(DMF) + Bu4N+ + F-(DMF)∆sH°
-26.2 kJ mol-1Bu4N1F (DMF)
∆sH°13.7 kJ mol-1
Bu4N1F (sol.)∆coordH°
-11.6 kJ mol-1
∆sH°-2.7 kJ mol-1
∆sH°31.0 kJ mol-1
1 (sol.) + Bu4NF (sol.)
ð8Þ
Calixpyrrole– Fluoride Interactions 109

It can be concluded that for the fluoride-1 system, both DcoordH0 values
(equations (7) and (8)) derived from acetonitrile (DcoordH0¼ �11.7 kJmol�1) and
N,N-dimethylformamide (DcoordH0¼ �11.6 kJmol�1) are in good agreement. For
further details regarding the applicability of coordination data readers are referred
to literature [18,44].
9. THE MEDIUM EFFECT OF THE COMPLEXATION OFCALIX[4]PYRROLE AND ITS DERIVATIVES WITH THE FLUORIDEANION
The variations observed in the thermodynamics of complexation of calix[4]pyrrole
and its derivatives with the fluoride anion (Table 2) as a result of the medium
effect are controlled by the solvation changes that reactants and product undergo
in moving from one solvent to another. These differences in solvation are re-
flected in the thermodynamic parameters of transfer, DtP0 for the reactants (flu-
oride and receptor) and the product (the anion complex) from a reference solvent,
s1 to another solvent, s2. The relationship between these parameters and the
thermodynamics of complexation, DcP0, in these solvents is shown in Equation
(9).
DcP0ðs1Þ � DcP
0ðs2Þ ¼ DtP
0ðLÞðs1 ! s2Þ
þ DtP0ðF�
Þðs1 ! s2Þ � DtP0ðLF�
Þðs1 ! s2Þ ð9Þ
Equation (9) implies that complexation is favoured in a medium which is a good
solvater for the product and poor for the reactants.
As far as fluoride is concerned, the determination of the standard Gibbs energy
of the fluoride salts is by no means a trivial task. Indeed, the salts often undergo
solvation when exposed to a saturated atmosphere of a non-aqueous solvent.
The calculation of the solution Gibbs energy requires the same composition of the
solid in equilibrium with the saturated solution. Therefore, it is not always possible
to derive transfer Gibbs energy data for the fluoride salt in non-aqueous media.
However, the medium effect can be easily assessed in terms of enthalpy data.
Availability of DtH0 values from acetonitrile to N,N-dimethylformamide for L
(L ¼ 1, 2 and 8), the fluoride anion (based on Ph4AsPh4B convention [45]) and
the DcH0 values in acetonitrile and DMF (Table 2), allows the calculation via the
cycle of DtH0 values for the fluoride complex. The latter is also based on the
Ph4AsPh4B convention [45]. By inserting the appropriate equations in the ther-
modynamic cycles (equations (10)–(12)), it follows that, as far as receptors 1 and
2 are concerned, the higher enthalpic stability for the complexation process in
acetonitrile relative to N,N-dimethylformamide is entirely due to the favourable
contribution of the free anion overcoming those for the ligand and its complex
since these contribute unfavourably to complexation in acetonitrile.
A. F. Danil de Namor and I. Abbas110
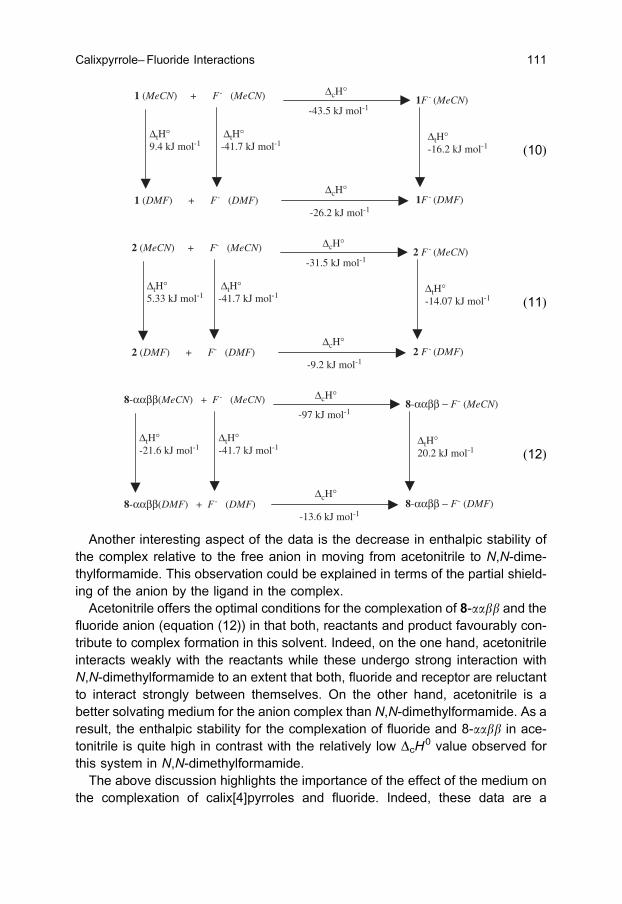
1 (DMF) + F- (DMF)∆cH°
-26.2 kJ mol-11F - (DMF)
∆tH°-16.2 kJ mol-1
1F - (MeCN)∆cH°
-43.5 kJ mol-1
∆tH°-41.7 kJ mol-1
∆tH°9.4 kJ mol-1
1 (MeCN) + F - (MeCN)
ð10Þ
2 (DMF) + F- (DMF)∆cH°
-9.2 kJ mol-12 F - (DMF)
∆tH°-14.07 kJ mol-1
2 F - (MeCN)∆cH°
-31.5 kJ mol-1
∆tH°-41.7 kJ mol-1
∆tH°5.33 kJ mol-1
2 (MeCN) + F- (MeCN)
ð11Þ
8-ααββ(DMF) + F - (DMF)∆cH°
-13.6 kJ mol-18-ααββ − F - (DMF)
∆tH°20.2 kJ mol-1
8-ααββ − F - (MeCN)∆cH°
-97 kJ mol-1
∆tH°-41.7 kJ mol-1
∆tH°-21.6 kJ mol-1
8-ααββ(MeCN) + F - (MeCN)
ð12Þ
Another interesting aspect of the data is the decrease in enthalpic stability of
the complex relative to the free anion in moving from acetonitrile to N,N-dime-
thylformamide. This observation could be explained in terms of the partial shield-
ing of the anion by the ligand in the complex.
Acetonitrile offers the optimal conditions for the complexation of 8-aabb and the
fluoride anion (equation (12)) in that both, reactants and product favourably con-
tribute to complex formation in this solvent. Indeed, on the one hand, acetonitrile
interacts weakly with the reactants while these undergo strong interaction with
N,N-dimethylformamide to an extent that both, fluoride and receptor are reluctant
to interact strongly between themselves. On the other hand, acetonitrile is a
better solvating medium for the anion complex than N,N-dimethylformamide. As a
result, the enthalpic stability for the complexation of fluoride and 8-aabb in ace-
tonitrile is quite high in contrast with the relatively low DcH0 value observed for
this system in N,N-dimethylformamide.
The above discussion highlights the importance of the effect of the medium on
the complexation of calix[4]pyrroles and fluoride. Indeed, these data are a
Calixpyrrole– Fluoride Interactions 111

reflection of the inherent nature of the solvent and the highly significant involve-
ment in the solvation of reactants and product which control the strength of
interaction between anion and receptor in one medium relative to another.
It is quite clear from Table 2 that there is a great deal to be investigated on the
thermodynamics of fluoride–receptor interactions in different media.
10. CALIX[4]PYRROLES AND THEIR APPLICATIONS
The following section discusses some of the applications of calixpyrrole deriv-
atives in aspects related to fluoride chemistry, which are relevant to environ-
mental issues.
From the environmental point of view, calix[4]pyrrole and its derivatives show
considerable promise in two main areas.
(i) The development of optical-based sensor systems which enable in situ, rapid
detection of fluorides in water.
(ii) New materials for the removal of fluorides from contaminated sources. These
can be achieved by their incorporation into solid support polymeric frame-
works. These calixpyrrole-based materials are likely to play a significant con-
tribution in the development of new technological approaches for the removal
of fluorides from water. Some of the progress made so far on calixpyrrole
anion sensors is now briefly described.
10.1. Calix[4]pyrrole sensors for fluoride
Optical sensors result from the combination of a receptor (able to recognise the
substrate and a reporter (chromophore). Thus, changes in the absorption or
emission properties resulting from the receptor-substrate binding process allow
the detection of the substrate. Most of the contributions on calix[4]pyrrole-based
anion sensors have been made by Sessler and co-workers [40,46,47]. These
authors have developed anion sensors by linking either a fluorescent report group
to calixpyrrole or through the use of p-nitrophenolate anions taking part in a
displacement reaction. Anthracene derivatives (16–18) were used as signalling
devices while 1 was the receptor. The fluorescence of these receptors quenched
significantly in the presence of anions. Quenching data were used to calculate the
stability constants of these receptors in their interaction with the halide and di-
hydrogen phosphate anions. It was stated by Sessler and co-workers [40,46] that
the most efficient quenching was observed after the addition of fluoride anion,
although to a lesser extent, quenching was also observed with other anions.
Sensors based on receptors 22–24 also reported by Sessler [47] appear to be
remarkably selective for fluoride relative to other halide and phosphate anions. It
A. F. Danil de Namor and I. Abbas112

seems that the presence of an additional binding site involving amide or thiourea
moieties in the receptors has certainly enhanced their selective behaviour for
dihydrogen phosphate relative to chloride.
Another interesting development in anion sensing is that reported by Nishiyabu
and Anzenbacher [41]. These authors by the condensation reaction involving
2-formyl-octamethylcalix[4]pyrrole and 1,3-indanedione derivatives obtained sen-
sors with push–pull chromophores able to display strong intramolecular charge
transfer. Thus, an increase in signal output and significant changes in anion
selectivity were observed relative to that involving the parent calix[4]pyrrole.
Thus, the presence of anions, in particular fluoride led to dramatic colour changes
before and after addition of fluoride-containing salts. However, the addition of
chloride, bromide and nitrates led to weak or no colour changes [41]. Anion
affinities of these sensors follow the sequence 26427428 in dimethyl sulphox-
ide at 295K (Table 2).
More recently, a new class of covalent-linked calix[4]pyrrole–anthraquinone
compounds (29–31) have been introduced by Sessler’s group [48]. These are
considered to be powerful naked eye sensors for fluoride, chloride and dihydro-
gen phosphate ions in dichloromethane. The most pronounced colour change
was observed upon the addition of the fluoride anion into a solution of the re-
ceptor 30 in dichloromethane. The addition of bromide, iodide or nitrate anions
did not lead to significant colour changes.
The complexation of a calixpyrrole dimer with the p-nitrophenolate anion [49] has
been used as a colorimeter sensor by displacing the chromogen anion upon the
addition of targeted anions. In this case anions, such as fluoride, displace the p-
nitrophenolate anion from the complex thus enhancing the absorbance of the
p-nitrophenolate anion. This was observed as a colourless to yellow colour change.
Sessler, Gale and co-workers [50] have produced ion selective electrodes
(ISEs) containing calix[4]pyrrole moieties.
From the environmental viewpoint, the design of ISEs particularly for the
‘in situ’ monitoring pollutants in water is important mainly in the Developing World
where the most sophisticated analytical instrumentation is not always available
and water contamination by toxic ions is on the increase. For supramolecular
chemists, ISEs could offer a convenient tool for characterisation of the ion-
binding properties of the receptor under interfacial organic-aqueous conditions
rather than in water. In the latter medium, either due to low solubility of the
receptor or weak receptor–ion interaction, the affinity involved between receptor
and host cannot be assessed. It is well established that the sensitivity and se-
lectivity obtained for a given neutral carrier depend significantly on the membrane
composition and on the properties of mediator employed as well as the PVC/
plasticiser ratio used. The PVC-membrane solutions in Sessler’s work were pre-
pared by mixing the ionophore 1, the plasticiser [2-nitrophynel octyl ether
(o-NPOE)] and PVC, both, in presence and absence of a lipophilic additive
Calixpyrrole– Fluoride Interactions 113

[tridodecylmethylammonium chloride (TDDMA)]. The influence of pH on the sen-
sitivity and linear range of the membrane was investigated, where the pH was
adjusted with sodium hydroxide and sulphuric acid solutions. At low pH values
(3.5 and 5.5), PVC ion selective electrode containing 1 displayed strong anionic
responses towards halide and dihydrogen phosphate anions. However, at high
pH ¼ 9.0 the ISEs derived from 1 deviate from the Hofmeister selectivity series
(Br�oCl�oOH�EF�oHPO42�). Consequently, the potentiometric selectivity of
ISEs based on 1 is pH dependent.
10.2. Calix[4]pyrrole-based materials
The attachment of macrocycles to solid supports via covalent bonding has been
the subject of many investigations [51,52]. Low yields generally obtained in the
synthetic work and the wide range of applications of these compounds encour-
aged researchers to find economical ways to use these receptors. The natural
choice was to incorporate macrocyclic ligands into polymeric supports or silica so
these can be recycled. Blasius and co-workers [53–55] carried out pioneering
work in this area. Indeed, these authors have prepared a considerable number of
polymeric macrocyclic compounds via a polymerisation of crown ethers (dibenzo-
18-crown-6 and others) or a cryptand with formaldehyde in formic acid. The
properties and applications of these polymers have been extensively discussed
by Blasius’s group. These materials have been mostly used for cation extraction
processes. Blasius’s approach has been extended to calixpyrroles by Kaledkow-
ski and Trochimczuk [56] and by the authors [57]. In fact, the former workers have
used two strategic approaches to obtain calixpyrrole-based chelating resins. One
of them consisted in anchoring meso-tetramethyltetrakis(p-hydroxylphenyl)
calix[4]pyrrole, 3, to the vinylbenzyl chloride (VBC)/divinyl benzene (DVB) co-
polymer via the OH moieties. The second approach is based on Blasius’s method
using the same calix[4]pyrrole derivative. Preliminary investigations carried out
on the anion extraction properties of these materials appear to indicate that while
the modified co-polymer is able to remove 44% of fluoride, the percentage of the
fluoride anion extracted by the condensation resin was 88% from 10�3 molar
solutions of fluorides in acetonitrile. Quite clearly these results demonstrate the
higher degree of efficiency of the latter resins relative to that of the modified co-
polymer. These percentages of extraction are likely to be substantially reduced if
water instead of acetonitrile was the source of fluoride. This is due to the com-
petitive effect between the former solvent and the resin for the anion. There is still
a great deal of research required to establish the relevant parameters (temper-
ature, ionic strength, maximum loading capacity of the material, interfering ions)
for optimising the extraction process. However, the use of these materials as
decontaminating agents for the removal of fluoride from water seems to be
promising.
A. F. Danil de Namor and I. Abbas114

Silica gel supports containing amidocalix[4]pyrrole groups (Gel M and Gel B)
have been reported by Sessler et al. [58] for use in HPLC for anion separation.
Several anions including fluoride were retained by these materials.
NH NH
HNNH
Me
NH
O
SiO2
SiO2
Ge l M
NH
NH
HN
NH
O
NH
Ge l B
11. FINAL CONCLUSIONS
Calix[4]pyrrole and derivatives involved in this chapter are those receptors which
are able to recognise selectively the fluoride anion in solution. It is shown that the
fluoride anion binding ability of these receptors can be tuned.
a. By appending different groups to the carbon or C-rim of the calixpyrrole (9,11
and 13).
b. Functionalisation with chromophores (29–31).
c. Synthesising receptors with extended (3–6 and 8) and double cavities (7).
However, calix[4]pyrrole 1 is more selective for the fluoride anion than other
receptors (2, 8, 16, 17, 18 and 20) in acetonitrile.
When information was available, calix[4]pyrrole–fluoride interactions were dis-
cussed on the basis of 1H NMR, conductometry, titration calorimetry, UV–Visible
and fluorescence spectroscopy.
Calix[4]pyrroles are versatile ligands to the extent that the composition of the
anion:receptor complex is solvent dependent. This chapter has been concerned
with the affinity of calix[4]pyrrole for the fluoride anion. It was therefore con-
sidered of relevant to focus attention on the steps required for the derivation of
reliable thermodynamic data. It is indeed the ratio between stability constants
which defines quantitatively the selectivity factor. Thus, representative examples
are given to demonstrate selectivity in terms of anion, receptor and solvent. The
key role played by solvation in the complexation of these receptors with the
fluoride anion is unambiguously demonstrated in the variations observed in the
stability constants, enthalpies and entropies of complexation of these systems in
the various solvents (Table 2). One convenient measure to assess solvation
is through the thermodynamics of transfer of product and reactants from one
Calixpyrrole– Fluoride Interactions 115

medium to another. Thus, illustrative examples for various systems are given
using enthalpy data. Unfortunately, fluoride salts undergo extensive solvation
when exposed to saturated atmosphere of a non-aqueous solvents and therefore
it is not possible to determine their transfer Gibbs energies in moving from one to
another solvent.
We have included in this chapter stability constants for these systems in di-
chloromethane, although this is a low permittivity medium and therefore the re-
liability of these data may be reduced by the formation of ion pairs. However,
these data may be useful in solvent extraction processes due to the immiscibility
of this solvent with water which allows the direct partition of electrolytes in the
dichloromethane solvent system [59,60].
Results illustrating the thermodynamics of calixpyrroles and derivatives with
fluoride collected in Table 2 show that there is a great deal to be done in this area.
In addition, we are not aware of any data available on heat capacities involving
these systems. This particular aspect of thermodynamics remains dormant.
Although, the main emphasis of this chapter lies on the fundamental aspects of
calixpyrrole–fluoride complexation reactions, with the major part being devoted to
the thermodynamic properties of these systems, calixpyrrole receptors seem to
be promising for the development of chemical sensors and for the removal of
fluorides from water. They also show promise for the separation of anion subst-
rates.
As far as chemical sensors are concerned, colorimetric chemosensors for an-
ions based on calix[4]pyrrole (16–18, 22–31) showed strong binding to the flu-
oride anion. Receptors (29–31) are the first naked-eye detectable chemosensors
that are able to discriminate between different anionic substrates as a result of
detectable colour changes. On the other hand, the fluorescence of the receptors
(16–18, 22–28) is quenched significantly in the presence of anionic guests.
Among the anion carriers, calixpyrrole receptors have found applications as
components in anion-selective membrane electrodes. The potentiometric selec-
tivity for membranes ISEs based on calix[4]pyrrole, 1 towards a range of anions,
namely fluoride, chloride, bromide and dihydrogen phosphate was found to be
pH-dependent.
As far as calix[4]pyrrole-based materials are concerned, particular emphasis
should be placed on the production of chelating resins. Those obtained by the
condensation reaction of calix[4]pyrrole and formaldehyde in the presence of
formic acid offer potential for their use as extracting agents for fluoride removal
from water. Their advantage relies on the fact that a single-step procedure is
required for polymerisation. However, research in this area is in a preliminary
stage. Much work needs to be done to establish the full capacity of these ma-
terials to take up fluoride from water, the kinetics of the process, and the optimum
experimental conditions for fluoride extraction. Although, their ability to extract
fluoride reaches a value of 88% from solutions of tetra-n-butylammonium fluoride
A. F. Danil de Namor and I. Abbas116

in acetonitrile, it is expected that much lower percentages are to be extracted
from water. Indeed, their scope as water decontaminating agents requires ex-
perimental work taking into account ionic species likely to be present in water.
Among these, the counter-ion effect may be significant but can be closely pre-
dicted from available data on the transfer Gibbs energies of cations from water to
non-aqueous medium [45]. For commercial applications, the recycling of these
materials need to be investigated.
Undoubtedly, the future will bring further progress in this area and more de-
velopments on the synthesis of calix[4]pyrrole anion receptors. However, the
design of anion receptors is still a challenging task.
REFERENCES
[1] N.N. Greenwood, A. Earnshaw, Chemistry of the Elements, Pergamon Press,Toronto, 1984.
[2] H.L. Weinstein, Fluorides in the Environment: Effects on Plants and Animals, CABI,Cambridge, MA, USA, 2004.
[3] R.B. Symonds, W.I. Rose, M.H. Reed, Nature 334 (1988) 415–418.[4] R.L. Roy, P.G.C. Campbell, S. Premont, J. Labrie, Toxicol. Chem. 19 (2000)
2457–2466.[5] J.A. Camargo, J.V. Ward, K.L. Martin, Arch. Environ. Contam. Toxicol. 22 (1992)
107–113.[6] D.K. Datta, L.P. Gupta, V. Subramanian, Bangladesh Environ. Geol. 39 (2000)
1163–1168.[7] J.A. Camargo, Chemosphere 50 (2003) 251–264.[8] S. Klein, H. Woggon, R. Macholz, Nahrung 23 (12) (1985) 59.[9] J.T. Trevors, J. Basic Microbiol. 26 (8) (1986) 499–504.
[10] R.J. Hall, Fluoride 1 (1) (1968) 9–14.[11] M. Grimaldo, V. Borja-Aburto, A. Ramirez, M. Rosas, F. Diaz-Barriga, Environ. Res.
68 (1995) 25–30.[12] M. Alarcon-Herrera, I. Martin-Dominguez, R. Trejo-Vazquez, S. Rodriguez-Dozal,
Fluoride 34 (2001) 138.[13] M. Kessabi, Rev. Med. Vet. 135 (1984) 497–510.[14] G. Aydin, E. C- ic-ek, M. Akdogan, O. Gokalp, J. Appl. Toxicol. 23 (2003) 437–446.[15] N.J. Chinoy, Indian J. Environ. Toxicol. 1 (1991) 17–32.[16] J.-M. Lehn, Supramolecular Chemistry: Concepts and Perspectives, VCH, New York,
1995.[17] J.W. Steed, J.L. Atwood, Supramolecular Chemistry, Wiley, Chichester, UK, 2000.[18] A.F. Danil de Namor, R.M. Cleverley, M.L. Zapata-Ormachea, Chem. Rev. 98 (1998)
2495–2525.[19] B. Dietrich, Cryptands: coordination chemistry of alkali, alkaline-earth and toxic cat-
ions, Met. Ions Biol. Med. Proc. Int. Symp. 1 (1990) 447–451.[20] J.M. Lehn, Pure Appl. Chem. 50 (9–10) (1978) 871–892.[21] B. Dietrich, Pure Appl. Chem. 65 (7) (1993) 1457–1461.[22] P.G. Sammes, Comprehensive Organic Chemistry. The Synthesis and Reactions of
Organic Compounds: Heterocyclic Compounds 4, Pergamon Press.[23] P.A. Gale, J.L. Sessler, V. Karl, J. Chem. Soc. Chem. Comm. 1 (1998) 1–8.[24] A. Baeyer, Ber. Dtsch. Chem. Ges. 19 (1886) 2184.[25] W.H. Brown, W.N. French, Can. J. Chem. 36 (1958) 371.
Calixpyrrole– Fluoride Interactions 117

[26] P.A. Gale, J.L. Sessler, V. Kral, V. Lynch, J. Am. Chem. Soc. 118 (21) (1996)5140–5141.
[27] C. Bucher, R.S. Zimmerman, V. Lynch, J.L. Sessler, J. Am. Chem. Soc. 123 (2001)9716–9717.
[28] P.A. Gale, J.L. Sessler, W.E. Allen, N.A. Tvermoes, V. Lynch, J. Chem. Soc. Chem.Comm. 7 (1997) 665–666.
[29] H. Miyaji, J.L. Sessler, Supramol. Chem. 13 (2001) 661–669.[30] W. Sato, H. Miyaji, J.L. Sessler, Tetrahedron Lett. 41 (2000) 6731–6736.[31] A.F. Danil de Namor, M. Shehab, J. Phys. Chem. B 107 (2003) 6462–6468.[32] A.F. Danil de Namor, I. Abbas, H. Hammud, J. Phys. Chem. B 110 (2006)
2142–2149.[33] A.F. Danil de Namor, M. Shehab, I. Abbas, M.V. Withams, J. Phys. Chem. 110 (2006)
126653–126659.[34] C.H. Lee, J.S. Lee, H.K. Na, D.W. Yoon, H. Miyaji, W.S. Cho, J.L. Sessler, J. Org.
Chem. 70 (2005) 2067–2074.[35] P. Anzenbacher Jr., K. Jursikova, V.M. Lynch, P.A. Gale, J.L. Sessler, J. Am. Chem.
Soc. 121 (1999) 11020–11021.[36] C. Drucker, Z. Physik. Chem. 105 (1923) 472–475.[37] R. Lorenz, Z. Anorg. Allgem. Chem. 118 (1921) 209–222.[38] A.F. Danil de Namor, C.Y.Ng. Joe, M. LIosa Tonco, M. Salomon, J. Phys. Chem. 100
(1996) 14485–14491.[39] P.A. Gale, J.L. Sessler, W.J. Genge, V. Kral, M.A. Mckervey, J.L. Sessler, A. Walker,
Tetrahedron Lett. 38 (49) (1997) 8443–8444.[40] J.L. Sessler, P. Anzenbacher Jr., H. Miyaji, K. Jursıkova, E.R. Bleasdale, P.A. Gale,
Ind. Eng. Chem. Res. 39 (2000) 3471–3478.[41] R. Nishiyabu, P. Anzenbacher Jr., Org. Lett. 8 (2006) 359–362.[42] C.J. Woods, S. Camiolo, M.E. Light, S.J. Coles, M.B. Hursthouse, M.A. King,
P.A. Gale, J.W. Essex, J. Am. Chem. Soc. 124 (2002) 8644–8652.[43] A.F. Danil de Namor, M. Shehab, J. Phys. Chem. B 109 (2005) 17440–17444.[44] A.F. Danil de Namor, Calixarenes 2001, Z. Asfari, V. Bohmer, J. Harrowfield,
J. Vicens (Eds.), Kluwer Academic Publishers, Dordrecht, 2001, Chapter 19, p. 346.[45] B.G. Cox, G.R. Hedwig, A.J. Parker, D.W. Watts, Aust. J. Chem. 27 (1974) 477–501.[46] P. Anzenbacher Jr., K. Jursikova, J.L. Sessler, J. Am. Chem. Soc. 122 (2000)
9350–9351.[47] H. Miyaji, P. Anzenbacher Jr., J.L. Sessler, E.R. Bleasdale, P.A. Gale, J. Chem. Soc.
Chem. Comm. 17 (1999) 1723–1724.[48] H. Miyaji, W. Sato, J.L. Sessler, Angew. Chem. Int. Ed. 39 (10) (2000) 1777–1780.[49] P.A. Gale, L.J. Twyman, C.I. Handlin, J.L. Sessler, J. Chem. Soc. Chem. Comm. 18
(1999) 1851–1852.[50] V. Kral, J.L. Sessler, T.V. Shishkanova, P.A. Gale, R. Volf, J. Am. Chem. Soc. 121
(1999) 8771–8775.[51] A. Katz, P.D. Costa, A.C.P. Lam, J.M. Notestein, Chem. Mater. 14 (2002)
3364–3368.[52] P.D. Barata, A.I. Costa, P. Granja, J.V. Prata, React. Funct. Polym. 61 (2004)
147–151.[53] E. Blasius, K.P. Janzen, M. Keller, H. Lander, T. Nguyen-Tien, G. Scholtien, Talanta
27 (2) (1980) 107–126.[54] E. Blasius, K.P. Janzen, W. Adrian, W. Klein, H. Klotz, H. Luxenburger, E. Mernke,
V.B. Nguyen, T. Nguyen-Tien, R. Rausch, J. Stockemer, A. Toussaint, Talanta 27(20) (1980) 127–141.
[55] E. Blasius, K.P. Janzen, H. Luxenburger, V.B. Nguyen, H. Klotz, J. Stockemer,J. Chromatogr. 167 (1978) 307–320.
[56] A. Kaledkowski, A. Trochimczuk, XIX-th Ars Separatoria- Z"oty Potok, Poland, 2004,89–92.
A. F. Danil de Namor and I. Abbas118

[57] M. Shehab, PhD Thesis, University of Surrey, 2005.[58] J.L. Sessler, P.A. Gale, J.W. Genge, Chem. Eur. J. 4 (1998) 1095–1099.[59] A.F. Danil de Namor, M. Shehab, J. Phys. Chem. A 108 (2004) 7324–7330.[60] A.F. Danil de Namor, A. Pugliese, A.R. Casal, M. Barrios-Lereno, P.J. Aymonino,
F.J. Sueros Velarde, Phys. Chem. Chem. Phys. 2 (2000) 4355–4360.[61] X.K. Ji, D.S. Black, S.B. Colbran, D.C. Craig, K.M. Edbey, J.B. Harper, G.D. Willett,
Tetrahedron 61 (2005) 10705–10712.[62] F.P. Schmidtchen, Org. Lett. 3 (2002) 431–434.
Calixpyrrole– Fluoride Interactions 119

This page intentionally left blank
120

CHAPTER 4
Fluorine-Containing Agrochemicals: AnOverview of Recent Developments
George Theodoridis�
FMC Corporation, P.O. Box 8, Agricultural Products Group, Princeton, NJ, USA
Contents
1. Introduction 122
2. Fluorine-containing agrochemicals: developments prior to 2001 124
2.1. Fluorinated alkyl aromatic and heteroaromatic agrochemicals 124
2.1.1. Trifluoromethyl aromatic agrochemicals 124
2.1.2. Trifluoromethyl heterocyclic agrochemicals 135
2.2. Fluorinated alkyl groups attached to heteroatoms 140
2.2.1. Trifluoromethoxy group 140
2.2.2. Trifluoromethylthio derivatives 143
2.2.3. Difluoromethoxy group 145
2.2.4. Miscellaneous fluoroalkyl groups attached to oxygen and nitrogen 147
2.3. Aromatic fluorine compounds 150
2.3.1. Herbicides 151
2.3.2. Insecticides 153
2.3.3. Fungicides 155
2.4. Aliphatic and olefinic fluoroalkyl groups 156
3. Fluorine-containing agrochemicals: recent developments 157
3.1. Herbicides 159
3.2. Insecticides 161
3.3. Fungicides 164
4. Summary 166
References 167
AbstractThe dramatic effect of fluorine on the biological activity of agrochemicals such as her-
bicides, insecticides, fungicides, and plant growth regulators has earned fluorine a unique
place in the toolbox of the agrochemical chemist. Introduction of fluorine into a biologically
active molecule during the structure–activity optimization process can dramatically modify
its biological activity by affecting any of a number of parameters, such as binding to a
target receptor or enzyme, transporting the bioactive molecule from the point of application
to the target site, and blocking metabolic deactivation. This enhanced role of fluorine in the
�Corresponding author. Tel: +1-609-951-3522, Fax: +1-609-951-3603;
E-mail: [email protected]
FLUORINE AND THE ENVIRONMENT, VOLUME 2
ISSN 1872-0358 DOI: 10.1016/S1872-0358(06)02004-5
r 2006 Elsevier B.V.All rights reserved
121

discovery of new agrochemicals is reflected in more than three-fold increase in the number
of fluorine-containing agrochemicals in the past three decades. In this review, we discuss
recent developments and challenges in the field of fluorine-containing agrochemicals and
place them in the context of work done in the past five decades.
1. INTRODUCTION
According to the U.S. Census Bureau, world population reached six billion in June
of 1999. It predicts that another billion will be added by 2013. With the world
population constantly expanding, and the available farmland steadily diminishing,
continued improvements in the production of food crops and fiber present a
persistent challenge. Agrochemicals continue to play a key role in crop protection,
while at the same time meeting the requirements for products that are safe for the
environment. In addition to ensuring a safe and cheap supply of food and fiber,
agrochemicals are essential tools in the public health sector in their control of
disease-carrying urban pests such as cockroaches, mosquitoes, and rodents.
They also find non-crop use in the protection of homes against termites and ants.
With each passing decade, newer, more efficacious agrochemicals, with more
environmentally favorable physico-chemical properties, are introduced. The in-
creased biological activity of these newer molecules requires lower application
rates, which in turn translates into less environmental impact. These newer ma-
terials are slowly replacing older molecules, which required higher application
doses or had become pest-resistant. For example, the introduction of the safe
and highly active pyrethroid insecticides eventually displaced a number of highly
chlorinated and persistent insecticides. Another example was the introduction of
the sulfonylurea herbicides in the 1980s, whose very low application rates rev-
olutionized the industry. In this landscape of the ever-present need to develop
safer, more environmentally friendly, cost-effective agrochemicals, fluorine will
continue to play a major role.
The dramatic effect of fluorine on the biological activity of numerous herbicides,
insecticides, and fungicides has earned fluorine a unique place in the toolbox of
the agrochemical chemist. These improvements in biological activity are dramatic
enough to often, though not always, justify the added costs of incorporating
fluorine into the molecule. In addition, the increased biological potency of the new
fluorine-containing agrochemicals has resulted in both improved efficacy under
field application with less material and significantly less impact on the environ-
ment. It is the balance between biological efficacy and cost of production that
determines the success of a new agrochemical active ingredient.
A clear indication of the key role that fluorine plays in the development of new
agrochemicals is the dramatic increase – more than triple – in the number of
fluorinated agrochemicals in the past three decades: from 23 out of 543 (4%)
listed in the 1977 edition of the Pesticide Manual [1], to the 126 (14%) out of
G. Theodoridis122

858 in the latest edition of the Pesticide Manual [2], of which 45% are herbicides,
33% are insecticides, and 18% are fungicides. The most common fluorine-
containing groups of agrochemicals are aromatic fluorine, 37%, and aromatic
trifluoromethyl, 32%.
The improved processes for the introduction of fluorine into biologically active
molecules have resulted in the availability of more cost-effective fluorine-con-
taining raw materials and intermediates. With an emphasis on biological efficacy,
performance, and cost, this work attempts to review fluorine-containing agro-
chemicals of commercial potential that have been assigned an ISO name, and it
is divided into two parts. The first part, Section 2, encompasses compounds
introduced prior to 2001, and the second part, Section 3, covers developments
after 2001. Within each part, the review is organized by grouping together all
herbicides, insecticides, fungicides, plant growth regulators, and rodenticides,
respectively, according to the kind of fluorine group present, for instance, aro-
matic trifluoromethyl-containing herbicides or aromatic fluorine. Classifying the
agrochemicals this way more readily points up both the synthesis and the unique
properties of each fluorinated group.
Fluorine-containing agrochemicals have been previously reviewed [3–7]. The
earliest review that specifically covers the subject of fluorinated agrochemicals is
that by Geoffrey Newbold [3], in which he discusses the various chemical classes
of fluorinated agrochemicals. More recent reviews [4,6,7] discuss the unique
properties that result from introducing fluorine into biologically active molecules.
The design of new agrochemicals involves the systematic structure–activity
optimization of a biologically active molecule [8]. Most industrial research labs
come upon these biologically active molecules, or hits, via the screening of
compounds through a battery of biological tests. Structure–activity optimization of
biologically active molecules is a complex process that attempts to optimize a
variety of parameters, such as binding to a target receptor or enzyme, trans-
porting the bioactive molecule from the point of application to the target site, and
blocking metabolic deactivation. Introduction of fluorine into a biologically active
molecule during the optimization process can dramatically modify its biological
activity by affecting any of the parameters previously mentioned.
A number of general reviews discuss the synthesis of fluorine-containing or-
ganic molecules [9,10]. In general, introducing fluorine into a molecule results in
considerable increase in costs. Yet the costs must be weighed against the unique
properties that fluorine gives to biologically active molecules. Primary among
those properties are:
� Lipophilicity. In general, the replacement of hydrogen by fluorine in a molecule
increases its lipophilicity, particularly with groups such as CF3 and OCF3. Lip-
ophilicity plays a key role in the transport of molecules through plant and insect
cuticles. In addition to lipophilicity, increasing the number of fluorine atoms in a
Fluorine-Containing Agrochemicals 123
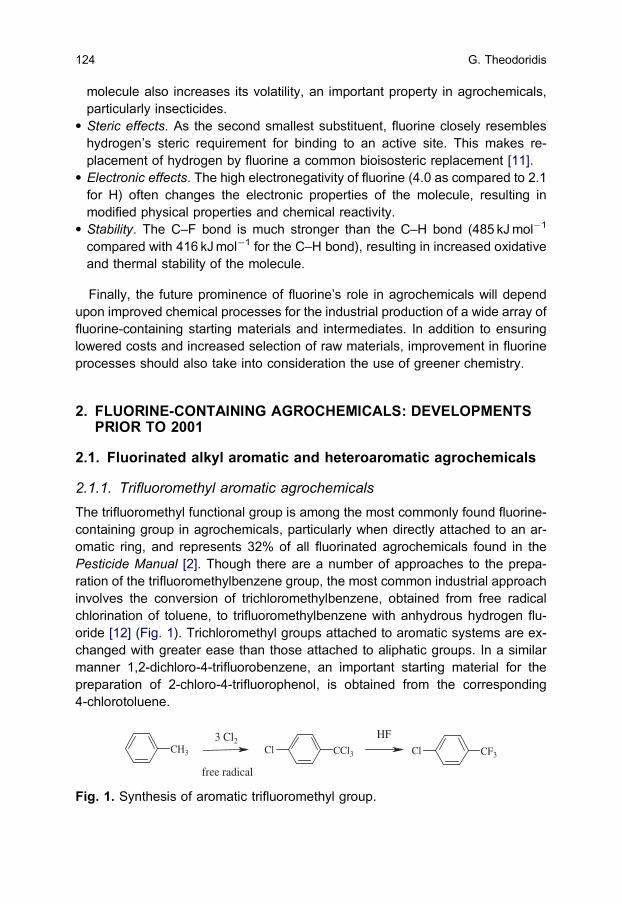
molecule also increases its volatility, an important property in agrochemicals,
particularly insecticides.� Steric effects. As the second smallest substituent, fluorine closely resembles
hydrogen’s steric requirement for binding to an active site. This makes re-
placement of hydrogen by fluorine a common bioisosteric replacement [11].� Electronic effects. The high electronegativity of fluorine (4.0 as compared to 2.1
for H) often changes the electronic properties of the molecule, resulting in
modified physical properties and chemical reactivity.� Stability. The C–F bond is much stronger than the C–H bond (485 kJmol�1
compared with 416 kJmol�1 for the C–H bond), resulting in increased oxidative
and thermal stability of the molecule.
Finally, the future prominence of fluorine’s role in agrochemicals will depend
upon improved chemical processes for the industrial production of a wide array of
fluorine-containing starting materials and intermediates. In addition to ensuring
lowered costs and increased selection of raw materials, improvement in fluorine
processes should also take into consideration the use of greener chemistry.
2. FLUORINE-CONTAINING AGROCHEMICALS: DEVELOPMENTSPRIOR TO 2001
2.1. Fluorinated alkyl aromatic and heteroaromatic agrochemicals
2.1.1. Trifluoromethyl aromatic agrochemicals
The trifluoromethyl functional group is among the most commonly found fluorine-
containing group in agrochemicals, particularly when directly attached to an ar-
omatic ring, and represents 32% of all fluorinated agrochemicals found in the
Pesticide Manual [2]. Though there are a number of approaches to the prepa-
ration of the trifluoromethylbenzene group, the most common industrial approach
involves the conversion of trichloromethylbenzene, obtained from free radical
chlorination of toluene, to trifluoromethylbenzene with anhydrous hydrogen flu-
oride [12] (Fig. 1). Trichloromethyl groups attached to aromatic systems are ex-
changed with greater ease than those attached to aliphatic groups. In a similar
manner 1,2-dichloro-4-trifluorobenzene, an important starting material for the
preparation of 2-chloro-4-trifluorophenol, is obtained from the corresponding
4-chlorotoluene.
CH3 CCl3Cl CF3Cl3 Cl2
free radical
HF
Fig. 1. Synthesis of aromatic trifluoromethyl group.
G. Theodoridis124

The preparation of complex trifluoromethylbenzene-containing agrochemicals
is based on the derivatization of several key-starting materials, such as trifluoro-
methylbenzene. Trifluoromethylbenzene is prepared in large volumes, and is the
basis for the synthesis of 3-aminobenzotrifluoride. Treatment of trifluoromethyl-
benzene with a solution of concentrated nitric and sulfuric acids at low temper-
atures results in a mixture of ortho-, meta-, and para-isomers in a 6/91/3 ratio
(Fig. 2). Catalytic hydrogenation of 3-nitro trifluoromethylbenzene, followed by
distillation, produces the desired 3-aminobenzotrifluoride [13–15].
2.1.1.1. Herbicides
The first significant commercial impact of fluorine in agriculture occurred with the
introduction several decades ago of an aromatic trifluoromethyl group in several
classes of herbicides, such as dinitroaniline, diphenyl ether, and bleaching her-
bicides. These early classes of herbicides continue to be used today, though their
sales are steadily declining as newer, more effective materials are replacing
them.
Dinitroaniline herbicides. Trifluralin (Treflans), a 4-trifluoromethyl substituted
2,6-dinitroaniline derivative, was the first main fluorine-containing herbicide to be
marketed, with 18,000 tons sold in 1982 in the United States alone [16].
Trifluralin, which was introduced in 1960 by Eli Lilly, is a pre-emergence herbicide
used in soybean for the control of a variety of grass and broadleaf weeds [17]. It is
prepared from the nitration of 4-chlorobenzotrifluoride, followed by nucleophilic
displacement of chlorine with di-n-propyl amine (Fig. 3). Following the success of
trifluralin, a number of related N,N-dialkyl 4-trifluoromethyl 2,6-dinitroaniline her-
bicides were later introduced [18].
CF3
CF3
NO2
CF3
NH2
91%
HNO3 [H2]
Catalytichydrogenation
Fig. 2. Preparation of 3-aminobenzotrifluoride.
CF3Cl CF3 Cl
NO2
NO2
CF3 N(CH2CH2CH3)2
NO2
NO2HNO3
H2SO4
(n-Pr)2NH
Trifluralin
Fig. 3. Synthesis of the herbicide trifluralin.
Fluorine-Containing Agrochemicals 125

Urea herbicides. Phenyl urea chemistry represents one of the earliest classes
of herbicides. Replacement of the aromatic chlorines of diuron with a trifluoro-
methyl group resulted in improved crop selectivity. Fluometuron (Cotorans) and
parafluron are both selective urea herbicides, fluometuron developed for the
control of grass and broadleaf weeds in cotton. It was prepared from the cor-
responding 3-trifluoromethyl anilines. A number of other phenyl urea herbicides
were introduced later, including trimefluor, 3-chloro-4-trifluoromethoxyphenyl-
N,N-dimethyl urea [19].
CF3 NH
N
O
CH3
CH3
CF3O NH
N
O
CH3
CH3Cl
NH
N
O
CH3
CH3CF3
Fluometuron TrimefluorParafluron
Diphenyl ether herbicides. The diphenyl ether class of herbicides belongs to a
broader area of herbicides known as protoporphyrinogen oxidase (Protox) her-
bicides [20,21]. Diphenyl ether herbicides were initially introduced over four dec-
ades ago in the 1960s with the discovery of nitrofen by Rohm and Haas (now Dow
AgroSciences) [22] and bifenox by Mobil [23]. These early diphenyl ether herbi-
cides did not attain a significant role in the control of weeds in commercial crops
until the 1970s, with the introduction of the trifluoromethyl compounds oxyfluorfen
[24] and acifluorfen–sodium [25]. Replacement of the chlorine with a trifluorome-
thyl group resulted in a dramatic increase in the herbicidal properties of these
compounds, in terms of both potency and the spectrum of weeds controlled.
Cl O
Cl R
NO2 CF3 O
Cl
NO2
R
Nitrofen R = HBifenox R = CO2CH3 Acifluorfen-sodium R = CO2Na
Oxyfluorfen R = OEt
Later, it was found that replacement of the carboxylic sodium salt group of
acifluorfen–sodium with a methyl sulfonamide group to give fomesafen [26,27]
provided good soybean safety when applied postemergently. Other trifluorome-
thyl-containing diphenyl ethers with further derivatized carboxylic groups include
fluoroglycofen–ethyl and lactofen. Diphenyl ethers can be prepared in a variety of
ways [28], the most common approach involving the nucleophilic displacement of
a halogen with an appropriate phenolate salt, followed by nitration to give aci-
fluorfen–sodium (Fig. 4) [29].
Phytoene desaturase bleaching herbicides. Bleaching herbicides inhibit the
synthesis of carotenoids in plants [30,31]. A number of phytoene desaturase her-
bicides such as norflurazon (Solicams, Zorials), flurochloridone (Racers), fluri-
done (Sonars), and diflufenican (Fenicans, Legacys) have been commercialized.
G. Theodoridis126

They are generally used in cotton for the pre-emergence control of weeds. An
exception is flurochloridone [32,33], which is used in sunflowers, and the more
recently introduced diflufenican [34], which is used in cereal crops. In all cases,
these herbicides have a trifluoromethyl group in the meta position of the aromatic
ring.
N
CF3
N
O Cl
NH
CH3
CF3
N
OCl
Cl
Norflurazon Flurochloridone
CF3
N
O
CH3
F
F
NH
O
N
OCF3
Fluridone Diflufenican
3-Trifluoromethylaniline, directly or indirectly, is the starting material for the
synthesis of all four of the herbicides norflurazon, flurochloridone, fluridone, and
diflufenican. Norflurazon is prepared from 3-trifluoromethylphenyl hydrazine,
which is obtained from the diazotization and reduction of 3-trifluoromethylaniline
[35]. Diflufenican is prepared from the reaction of 3-trifluoromethylphenol and
2-chloro-3-carboxylic acid pyridine, with 3-trifluoromethylphenol also being ob-
tained from the diazotization of 3-trifluoromethylaniline (Fig. 5).
A number of carotenoid biosynthesis inhibitors that came later include flurtam-
one [36,37], introduced in 1997, which is used as a pre-emergence and preplant
incorporated herbicide. Flurtamone can be prepared in several steps from
3-(trifluoromethylphenyl)acetonitrile and ethyl phenylacetate (Fig. 6).
CF3 Cl
Cl
OK
CO2K
CF3 O
Cl
NO2
OHO
CF3 O
Cl
NO2
RO
+1) KOH/heat
2) Nitration
Acifluorfen-sodium R= ONaFomesafen R= NHSO2CH3
Fluoroglycofen-ethyl R= OCH2CO2EtLactofen R= OCH(CH3)CO2Et
Fig. 4. Synthesis of diphenyl ether carboxylic acid intermediate.
Fluorine-Containing Agrochemicals 127
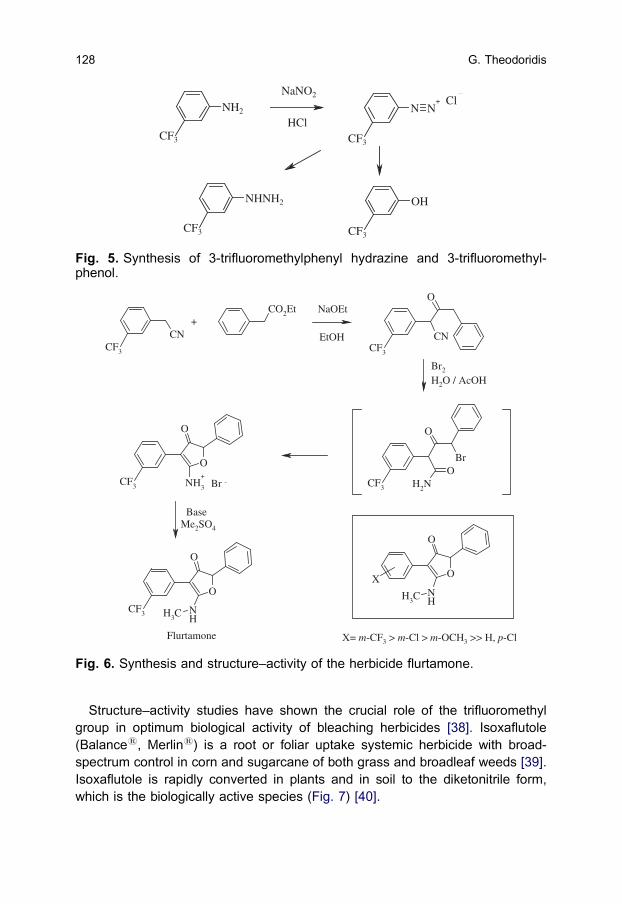
Structure–activity studies have shown the crucial role of the trifluoromethyl
group in optimum biological activity of bleaching herbicides [38]. Isoxaflutole
(Balances, Merlins) is a root or foliar uptake systemic herbicide with broad-
spectrum control in corn and sugarcane of both grass and broadleaf weeds [39].
Isoxaflutole is rapidly converted in plants and in soil to the diketonitrile form,
which is the biologically active species (Fig. 7) [40].
CF3
O
O
NHCH3
CF3
CN
CO2Et
CF3
O
CN
CF3
O
Br
NH2
OCF3
O
O
NH3
+
O
O
NHCH3
X
+
Br2
H2O / AcOH
NaOEt
EtOH
BaseMe2SO4
Br -
X= m-CF3 > m-Cl > m-OCH3 >> H, p-Cl Flurtamone
Fig. 6. Synthesis and structure–activity of the herbicide flurtamone.
CF3
NH2
CF3
N N+
CF3
NHNH2
CF3
OH
ClNaNO2
HCl
Fig. 5. Synthesis of 3-trifluoromethylphenyl hydrazine and 3-trifluoromethyl-phenol.
G. Theodoridis128

2.1.1.2. Insecticides
GABA insecticides. The N-phenylpyrazole insecticide fipronil, launched in 1993
by Rhone-Poulenc [41], is among the most successful insecticides introduced in
over a decade.1 A highly versatile insecticide, it is effective against a broad
spectrum of insect pests that are detrimental to crops, animals, and public health.
Fipronil acts at the gamma-aminobutyric acid (GABA) receptor to block the chlo-
ride channel [42]. The product is sold as Terminators for termite control, and as
Frontlines for flea and tick treatment in dogs and cats. According to the 2002
Phillips McDougall report, sales of Frontlines in 2001 were $358 million.
One approach to the introduction of the trifluoromethylsulfinyl group in fipronil
involves the reaction of 5-amino-3-cyano-1-(2,6-dichloro-4-trifluoromethylphe-
nyl)pyrazole and trifluoromethylsulfinyl chloride in toluene (Fig. 8) [43]. Exposure
of fipronil to sunlight results in the extrusion of sulfur oxide, to give a
4-trifluoromethylpyrazole photoproduct derivative [44].
Insect growth regulators. Initially discovered in the mid-1970s, insect growth
regulators (IGRs) act by inhibiting chitin synthesis in insects [45,46]. This inter-
esting class of insecticides offers an alternative to known neurotoxic insecticides.
It was originally discovered by serendipity by Dutch researchers at Philips-
Duphar in the 1970s, while they were working with the herbicides diuron and
dichlobenil. Initial attempts to create a new herbicide by combining the structural
features of these two herbicides failed, with the end hybrid product, shown in
Fig. 9, not effective as a herbicide. Instead, the benzoyl urea turned out to have
insecticide activity and exhibited unique insect symptomology [47].
A number of representatives in this class of insecticides have a N-benzoyl-N0-
phenyl urea group, where the benzoyl ring has halogens in the 2 and 6 positions,
and substitution in the phenyl ring varies widely from molecule to molecule. One,
flufenoxuron (Cascades, Europes, Sigonas) [48], commercialized in 1993, con-
trols insect and mite pests in vegetables, vines, citrus, cotton, and other crops.
Another, bistrifluron (Hanaros) [49], is an experimental insecticide with control-
ling activity against lepidopterous and whiteflies in fruits.
CH3SO2
CF3
O
NO
CH3SO2
CF3
O
O
NC
Soil or plant
metabolism
Isoxaflutole
Fig. 7. Metabolic conversion of the herbicide isoxaflutole to its active form.
1 [Note of the Editor: A recent article by A. Lattes and B. Sillion on the effects of Fipronil appeared in
‘‘Actualite Chimique’’ 294, pp. 6– 10, 2006].
Fluorine-Containing Agrochemicals 129
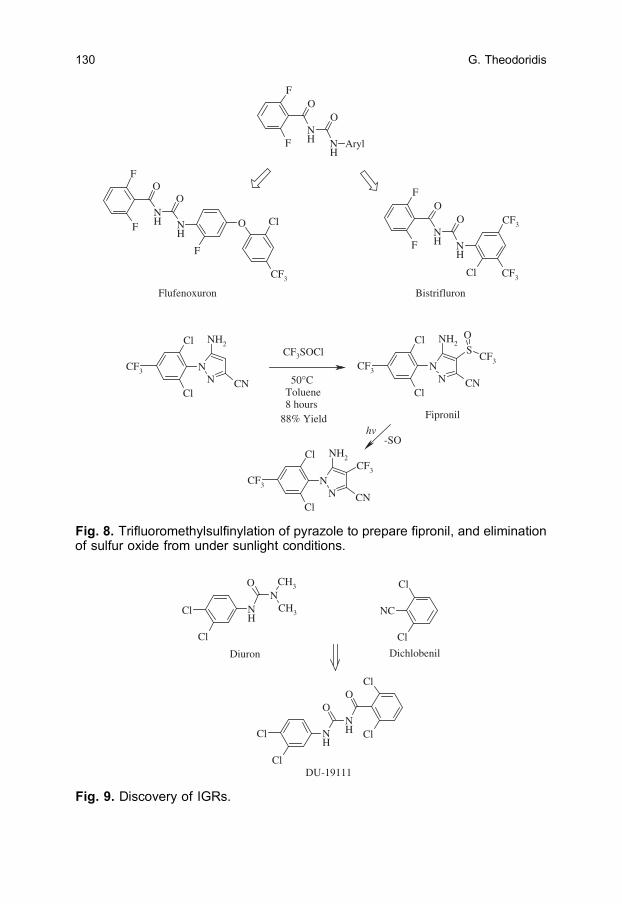
F
FNH
O
NH
O
Aryl
F
FNH
O
NH
O
F
O Cl
CF3
F
FNH
O
NH
O
Cl CF3
CF3
Flufenoxuron Bistrifluron
Cl
Cl
NH
NO CH3
CH3
Cl
Cl
NC
NH
NH
OO
Cl
ClCl
Cl
Diuron Dichlobenil
DU-19111
Fig. 9. Discovery of IGRs.
NN
SCF3
Cl
Cl
CF3
ONH2
CN
NN
Cl
Cl
CF3
NH2
CN
NN
Cl
Cl
CF3
NH2
CN
CF3
CF3SOCl
50°CToluene8 hours
88% Yield Fipronil
hv-SO
Fig. 8. Trifluoromethylsulfinylation of pyrazole to prepare fipronil, and eliminationof sulfur oxide from under sunlight conditions.
G. Theodoridis130

Pyrethroid insecticides. The natural pyrethrins, which act on the voltage-gated
sodium channel, are highly potent insecticides obtained from flowers of the chry-
santhemum plant. Though the pyrethrins are highly active insecticides, they are
not stable enough for commercial use. However, a number of structural mod-
ifications of the early pyrethrin molecule resulted in a wide range of stable com-
mercially useful pyrethroid insectides.
O
O
OH O
OO
NH
Cl
CF3
H
NC
Pyrethrin Fluvalinate
A large number of synthetic pyrethroids with a variety of aromatic and aliphatic
fluorine substituents have been commercialized, and will be discussed in the
sections on fluorinated ether, aromatic fluorine, and fluorinated aliphatic groups,
respectively. Fluvalinate (Mavriks) [50] is a trifluoromethylphenyl pyrethroid, in-
itially introduced by Zoecon (later Zandos Ag) and later replaced by tau-fluvalin-
ate, which contains two of the four isomers of fluvalinate. Tau-fluvalinate
(Apistans) is a synthetic pyrethroid used for the topical treatment of honeybees
against the parasitic mite Varroa jacobsoni. Mite resistance to tau-fluvalinate has
been reported [51].
2.1.1.3. Fungicides
b-Methoxyacrylates. This is an important class of commercial fungicides based
on a group of natural products, the strobilurins (see Fig. 10), such as strobilurin A
and oudemansin A. Strobilurins act by inhibition of mitochondrial respiration. In
1996, the first representatives of this class of fungicide were launched, including
azoxystrobin [52]. In 1999, the first fluorine-containing strobilurin, trifloxystrobin
(Flints) [53], was launched by Syngenta and later acquired by Bayer for $760
million.
Sterol biosynthesis inhibiting insecticides. The earliest examples of sterol bio-
synthesis inhibitors were triadimefon, imazalil, and triarimol. These compounds
act by blocking the C14 alpha demethylation step in ergosterol biosynthesis [54].
Further work in this area has resulted in numerous fungicides, a number of them
containing aromatic fluorine, perfluoroalkyl ethers, and the trifluoromethylphenyl
group (Fig. 11). In this section, we will discuss the trifluoromethylphenyl sterol
biosynthesis inhibitors, such as triflumizole and fluotrimazole.
Triflumizole (Trifmines, Procures) [55] was obtained in several steps from
4-chloro-2-trifluoromethyl acetanilide, which was prepared from the reaction of
4-chloro-2-trifluoromethylaniline and propyloxyacetyl chloride. Conversion of the
Fluorine-Containing Agrochemicals 131
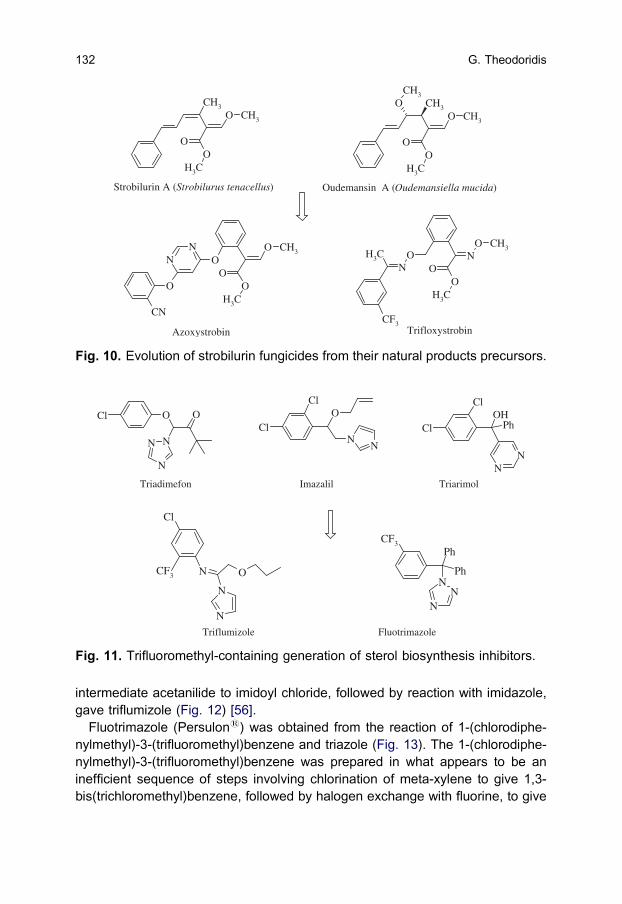
intermediate acetanilide to imidoyl chloride, followed by reaction with imidazole,
gave triflumizole (Fig. 12) [56].
Fluotrimazole (Persulons) was obtained from the reaction of 1-(chlorodiphe-
nylmethyl)-3-(trifluoromethyl)benzene and triazole (Fig. 13). The 1-(chlorodiphe-
nylmethyl)-3-(trifluoromethyl)benzene was prepared in what appears to be an
inefficient sequence of steps involving chlorination of meta-xylene to give 1,3-
bis(trichloromethyl)benzene, followed by halogen exchange with fluorine, to give
CH3
OO
O
CH3
CH3
CH3
OO
O
CH3
CH3
OCH3
OO
O
CH3
CH3O
NN
O
CN
NO
O
O
CH3
CH3O
NCH3
CF3
Strobilurin A (Strobilurus tenacellus) Oudemansin A (Oudemansiella mucida)
Azoxystrobin Trifloxystrobin
Fig. 10. Evolution of strobilurin fungicides from their natural products precursors.
OCl O
NN
N
Cl
ClO
NN
Cl
Cl
NN
PhOH
Triadimefon Imazalil Triarimol
Cl
NCF3 O
N
N
CF3
N
NN
Ph
Ph
Triflumizole Fluotrimazole
Fig. 11. Trifluoromethyl-containing generation of sterol biosynthesis inhibitors.
G. Theodoridis132
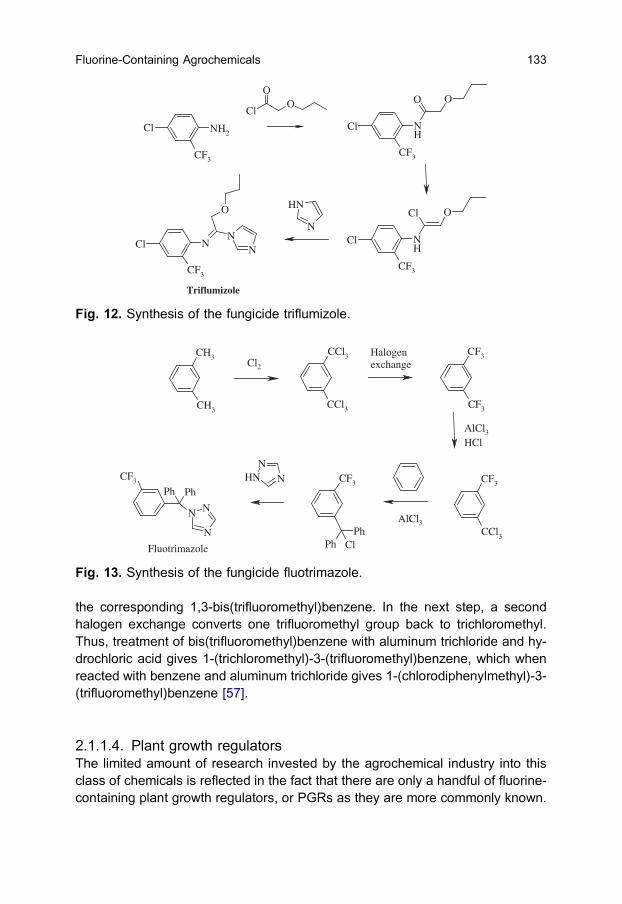
the corresponding 1,3-bis(trifluoromethyl)benzene. In the next step, a second
halogen exchange converts one trifluoromethyl group back to trichloromethyl.
Thus, treatment of bis(trifluoromethyl)benzene with aluminum trichloride and hy-
drochloric acid gives 1-(trichloromethyl)-3-(trifluoromethyl)benzene, which when
reacted with benzene and aluminum trichloride gives 1-(chlorodiphenylmethyl)-3-
(trifluoromethyl)benzene [57].
2.1.1.4. Plant growth regulators
The limited amount of research invested by the agrochemical industry into this
class of chemicals is reflected in the fact that there are only a handful of fluorine-
containing plant growth regulators, or PGRs as they are more commonly known.
Cl N
CF3
O
NN
Cl NH2
CF3
Cl NH
CF3
O O
Cl NH
CF3
Cl O
Cl
OO
NH
N
Triflumizole
Fig. 12. Synthesis of the fungicide triflumizole.
CH3
CH3
CCl3
CCl3
CF3
CF3
CF3
CCl3
CF3
ClPh
Ph
CF3
PhPh
N
N
N
NH NN
AlCl3HCl
AlCl3
Cl2Halogenexchange
Fluotrimazole
Fig. 13. Synthesis of the fungicide fluotrimazole.
Fluorine-Containing Agrochemicals 133

As their name implies, plant growth regulators are used by farmers to modify the
growth of a plant in a particularly advantageous way. The best example of a
trifluoromethyl-containing plant growth regulator is flumetralin, which is used to
control suckers in tobacco [58]. Flumetralin (Primes) is readily synthesized from
2-chloro-1,3-dinitro-5-(trifluoromethyl)benzene and 2-chloro-6-fluoro-N-ethyl-
benzylamine (Fig. 14) [59].
2.1.1.5. Rodenticides
Flocoumafen (Storms) and bromethalin are two examples of aromatic trifluoro-
methylbenzene-containing rodenticides. Flocoumafen is a second-generation
anticoagulant. It acts by inhibiting the metabolism of vitamin K1, which results in
depletion of vitamin K1-dependent clotting factors in plasma. Flocoumafen is
effective against rodents, which have become resistant to other anticoagu-
lant rodenticides. As shown in Fig. 15, flocoumafen is prepared from the ben-
zylation of the corresponding phenol intermediate and 4-trifluoromethylbenzyl
chloride [60].
Though the mode of action of bromethalin [61] is not known, it has been de-
termined that it is not an anticoagulant as flocoumafen is. The presence of four
bulky groups ortho to the tertiary nitrogen makes its synthesis challenging.
Bromethalin synthesis involves introducing one or more of the ortho bulky groups
after the formation of diphenylamine (Fig. 16) [62].
ClCF3
NO2
NO2
NHF
Cl
NCF3
NO2
NO2Cl
F
+
Flumetralin
Fig. 14. Synthesis of the plant growth regulator flumetralin.
OO
OH
OH
ClCF3
OO
OHO
CF3
Flocoumafen
Fig. 15. Synthesis of the rodenticide flocoumafen.
G. Theodoridis134

2.1.2. Trifluoromethyl heterocyclic agrochemicals
2.1.2.1. Herbicides
A number of 2-trifluoromethylbezimidazole herbicides were developed in the
1960s, but they have since being replaced by newer, more effective herbicides.
Examples of 2-trifluoromethylbezimidazole herbicides are chlorflurazole [63,64]
and fluoromidine [65]. The 2-trifluoromethylimidazopyridine heterocycle ring in
fluoromidine is prepared from the reaction of trifluoroacetic acid and the corre-
sponding 5-chloro-2,3-diaminopyridine (Fig. 17) [66]. The mode of action of
Cl
CF3
O2N
Br
Br
BrNH2 NH
CF3
O2N
Br
Br
Br
F
CF3
O2N
NO2
NH
CH3
N
CF3
O2N
Br
Br
Br
CH3
NO2
N
CF3
O2N
CH3
NO2
+
1) Methylation2) Nitration
Bromethalin
+
Bromination
Fig. 16. Synthesis of the rodenticide bromethalin.
N
NH2
NH2
Cl
Cl
Cl
NH
NCF3
N
Cl
NH
NCF3
CF3CO2H
Reflux 3 hours
Chlorflurazole
Fluoromidine
Fig. 17. Synthesis of 2-trifluoromethylimidazopyridine heterocycle ring.
Fluorine-Containing Agrochemicals 135

2-trifluoromethylbezimidazole herbicides is known: they act as uncouplers of the
oxidative phosphorylation process [67,68].
More recent examples of trifluoromethyl heteroaryl-containing herbicides
include the trifluoromethyl uracil and pyridazine classes of Protox herbicides
[69]. Benzfendizone is a postemergence herbicide that provides good control
of grass and broadleaf weeds in tree fruits and vines, as a cotton defoliant, and in
total vegetation control. The 6-trifluoromethyl group in the uracil ring is essen-
tial for biological activity; replacing it with methyl results in complete loss of
activity [70].
NN
O
O
CF3Cl
O
OO
O NN
O
O
CF3
OO
O
Benzfendizone Butafenacil
Flufenpyr-ethyl
NN
O
CF3Cl
F
O
OO
The uracil heterocycles are readily prepared in high yields from the corre-
sponding arylisocyanates and from ethyl trifluoromethylaminocrotonate in the
presence of a base [71]. The uracil heterocycle is then directly N-methylated with
methyl iodide in a one-pot reaction (Fig. 18).
A number of trifluoromethylpyridine-containing agrochemicals have found their
way into commercial use. The grass herbicide fluazifop-P-butyl (Fusilades),
which is prepared from 2-chloro-5-trifluoromethylpyridine (Fig. 19), is one such
product.
Another example of a trifluoromethyl heteroaryl-containing herbicide is di-
thiopyr (Dimensions) [72]. Structure–activity studies have demonstrated that a
fluorinated alkyl group is required for optimum activity at the 2 and/or 6 positions
of the pyridine ring [73]. Thiazopyr (Mandates, Visors), a herbicide related to
dithiopyr, was introduced by Monsanto in 1992 and later sold to Rohm and Haas.
It is used for the pre-emergence control of annual grass and a few broadleaf
weeds in tree fruit, vines, sugar cane, and other crops.
G. Theodoridis136
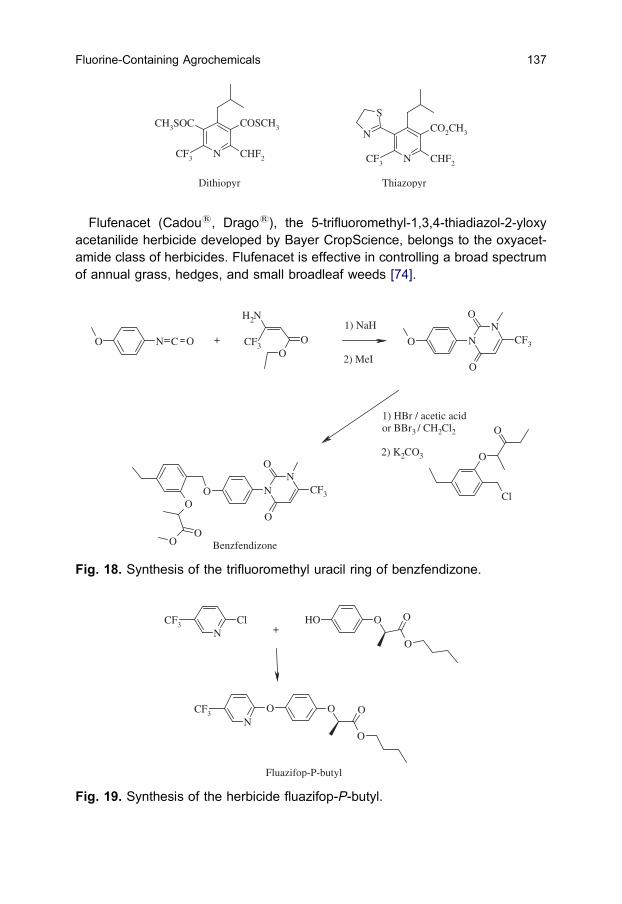
NCF3
CH3SOC COSCH3
CHF2 NCF3 CHF2
CO2CH3
S
N
Dithiopyr Thiazopyr
Flufenacet (Cadous, Dragos), the 5-trifluoromethyl-1,3,4-thiadiazol-2-yloxy
acetanilide herbicide developed by Bayer CropScience, belongs to the oxyacet-
amide class of herbicides. Flufenacet is effective in controlling a broad spectrum
of annual grass, hedges, and small broadleaf weeds [74].
NCF3
O O
O
O
OH O
O
O
NCF3 Cl
+
Fluazifop-P-butyl
Fig. 19. Synthesis of the herbicide fluazifop-P-butyl.
NN
O
O
CF3OO N C O CF3
NH2
OO
Cl
O
O
OO
OO
NN
O
O
CF3
+
1) HBr / acetic acidor BBr3 / CH2Cl2
2) K2CO3
1) NaH
2) MeI
Benzfendizone
Fig. 18. Synthesis of the trifluoromethyl uracil ring of benzfendizone.
Fluorine-Containing Agrochemicals 137

S
NN
CF3 O
N
O
F
Flufenacet
The sulfonylurea herbicides represents a class of novel, highly selective, and
very potent herbicides introduced by DuPont in the 1980s, when it revolutionized
the herbicide industry by reducing application rates, generally below 100g /ha,
levels previously not thought possible [75]. The mode of action of the sulfonylurea
herbicides is by inhibition of the acetolactate synthase (ALS) enzyme, a key en-
zyme in the biosynthesis of branched amino acids, such as leucine, isoleucine, and
valine [76]. A large number of sulfonylurea molecules were developed by various
companies; the general structure of the first compounds in this class is shown in
Fig. 20. Replacement of the phenyl ring with trifluoromethylpyridine resulted in
1997 in two new herbicides, flazasulfuron (Katanas, Paranduls), from Ishihara
Sangyo Kaisha [77], and flupyrsulfuron-methyl (Lexuss), from DuPont [78].
2.1.2.2. Insecticides
IGRs. Chlorfluazuron (Atabrons) [79] belongs to the N-benzoyl N0-phenyl IGR
family of insecticides. These compounds act by inhibition of chitin formation in the
insect.
O
Cl
Cl
NH
NH
OO
F
F
N
Cl
CF3
Chlorfluazuron
SNH
OO O
NH
N
NR1
R2
OO
NS
NH
OO O
NH
N
NO
O
CF3
NS
NH
OO O
NH
N
NO
O
CF3
OO
Flazasulfuron Flupyrsulfuron-methyl
Fig. 20. Trifluoromethylpyridine-containing sulfonylurea herbicides.
G. Theodoridis138

Chlorfenapyr (Phantoms), a trifluoromethyl-containing pyrrole ring insecticide,
belongs to a new class of uncouplers of oxidative phosphorylation [80]. The
original insecticidal lead that resulted in chlorfenapyr was the fermentation pro-
duct dioxapyrrolomycin, isolated from a Streptomyces strain [81]. The presence
of the trifluoromethyl group is essential for a broad spectrum of insecticide and
acaricide activity.
OO
Cl
Cl
NHCl
ClNO2
ClN
Br
CF3
CN
O
ChlorfenapyrDioxapyrrolomycin
Chlorfenapyr can be prepared in several steps from the corresponding amino
acid derivatives and trifluoroacetic anhydride (Fig. 21) [82].
2.1.2.3. Fungicides
b-Methoxyacrylates. As discussed earlier, in 1996 the first representatives of this
class of fungicides were launched, including azoxystrobin [83]. Another entry in
this class of fungicides is the trifluoromethyl pyridalyl-containing molecule pi-
coxystrobin (Acantos) [84].
O
O O
ON
CF3
O
CNO
O O
O
NN
Azoxystrobin Picoxystrobin
ClNH2
OOH
ClNH
OOH
OCF3
O
N
O
CF3
Cl
NHCF3
Cl
CN
Cl
CN
NHCF3
Cl
CNBr
(CF3CO2)2O (CF3CO2)2O
CH3CN Et3N
Br2 / NaOAc
ACOH95% Yield
Chlorfenapyr
ClCH2OEt
t-BuOK
Fig. 21. Preparation of the insecticide chlorfenapyr.
Fluorine-Containing Agrochemicals 139

Interestingly, replacement of the 6-trifluoromethyl-2-pyridyloxy ring of picoxyst-
robin with 2-isopropyloxy-6-trifluoromethyl-4-pyrimidyloxy results in a shift from
fungicide to acaricide activity in the resulting compound, fluacrypim (Titarons)
[85]. Thifluzamide (Batons, Greatams, Greatums, Pulsors) [86], 20,60-dibromo-
2-methyl-40-trifluoromethoxy-4-trifluoromethyl-1,3-thiazole-5-carboxanilide, is a
fungicide that acts by inhibition of succinate dehydrogenase in the tricarboxylic
acid cycle. Thifluzamide can be applied foliarly or as a seed treatment in a variety
of crops for the control of a number of basidomycete diseases. Thifluzamide is
rapidly absorbed by roots and leaves and translocated throughout the plant.
O
O O
ONN
CF3
O NH
Br
Br
OCF3
ON
S
CF3
Fluacrypim Thifluzamide
2.2. Fluorinated alkyl groups attached to heteroatoms
2.2.1. Trifluoromethoxy group
The trifluoromethyl and trifluoromethoxy groups of aromatic agrochemicals are
often interchangeable, with availability of synthesis starting materials and cost as
the determining factors. The synthesis of the trifluoromethoxybenzene derivatives
involves a somewhat similar synthetic pathway to that used to prepare trifluoro-
methylbenzene. Chlorination of the methyl group under free radical conditions
gives trichloromethoxybenzene in good yields; this is followed by displacement of
the chlorines with anhydrous hydrogen fluoride (Fig. 22).
The electronic properties of the trifluoromethoxy group closely resemble those
of halogens, such as chlorine and bromine. For instance, nitration studies have
shown that trifluoromethoxy benzene nitrates several times slower than benzene,
the trifluoromethyl group deactivating the aromatic ring via an inductive electron-
withdrawing effect. This inductive electron-withdrawing effect is somewhat bal-
anced by the ability of the oxygen of the trifluoromethoxy group to act as an
electron donor via resonance, with nitration occurring only at the ortho- and para-
positions of the aromatic ring [6].
OCH3
OCCl3
OCF3Cl2 HF
Fig. 22. Two-step synthesis of the trifluoromethoxy group.
G. Theodoridis140

2.2.1.1. Herbicides
The trifluoromethoxybenzene group is not commonly found in herbicides. One
exception is the herbicide trimefluor, which is prepared from methyl 4-methoxy
benzoate in four steps (Fig. 23) [19]. Trimefluor is a selective pre- and post-
emergence herbicide for use in cotton.
Another example found in herbicides is the ALS inhibitor flucarbazone–sodium
(Everests) [87]. This postemergence wheat herbicide controls grass weeds, as
well as a number of broadleaf weeds of commercial significance.
S NOO
OCF3
O
N NN
O
ONa+
Flucarbazone-sodium
2.2.1.2. Insecticides
Indoxacarb (Stewards, Avaunts) [88] is an insecticide commercialized by Dup-
ont in 2000, with broad-spectrum control of lepidopteran insects. Of the two
possible optical isomers, only one is biologically active, the (S)-enantiomer [89].
Indoxacarb is a proinsecticide: it is not toxic to insects until it goes through an
activation process by the insect’s metabolic system, which cleaves the N-car-
bomethoxy group to the NH insect active form. Indoxacarb acts by blocking the
sodium channel, at a site different from that of the pyrethroids. Because indo-
xacarb binds to a different site, no cross-resistance with pyrethroids has been
observed. Structure–activity studies of oxadiazine insecticide analogs of indoxa-
carb against Spodoptera frugiperda showed that the trifluoromethoxy substituent
in the para position provided the best biological activity [90].
OO
O CH3
CH3
OCCl3
O
ClO
CCl3
Cl
O
Cl
OCF3
Cl
O
NH2
CF3O NH
N
O
CH3
CH3Cl
Cl2
hv
Cl2
SbCl5
1) HF2) NH2
1) NaOCl
2) NH(CH3)2
Trimefluor
Fig. 23. Synthesis of the herbicide trimefluor.
Fluorine-Containing Agrochemicals 141
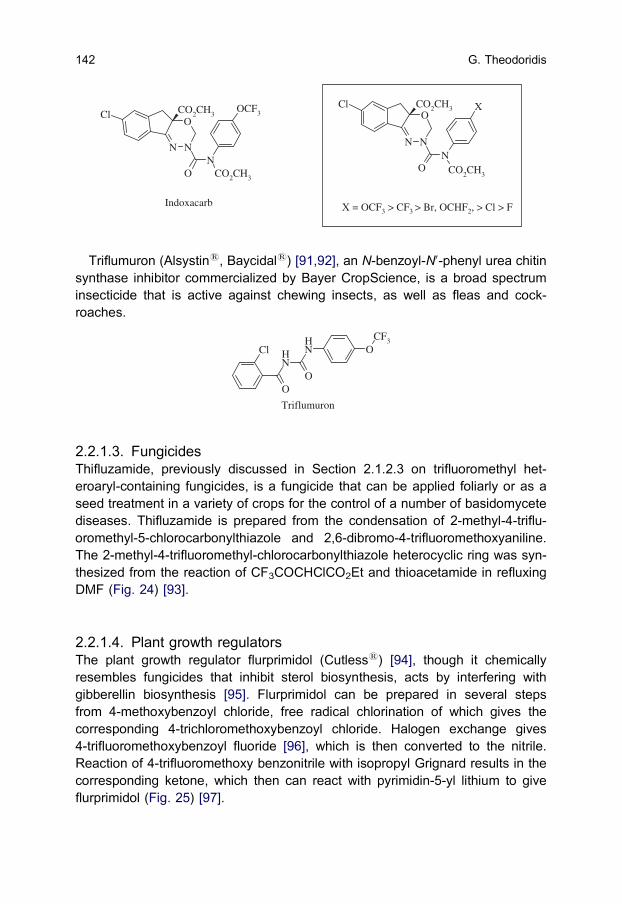
O
NN
Cl CO2CH3
ON
OCF3
CO2CH3
O
NN
Cl CO2CH3
ON
X
CO2CH3
X = OCF3 > CF3 > Br, OCHF2, > Cl > FIndoxacarb
Triflumuron (Alsystins, Baycidals) [91,92], an N-benzoyl-N0-phenyl urea chitin
synthase inhibitor commercialized by Bayer CropScience, is a broad spectrum
insecticide that is active against chewing insects, as well as fleas and cock-
roaches.
O
NH N
H
O
Cl OCF3
Triflumuron
2.2.1.3. Fungicides
Thifluzamide, previously discussed in Section 2.1.2.3 on trifluoromethyl het-
eroaryl-containing fungicides, is a fungicide that can be applied foliarly or as a
seed treatment in a variety of crops for the control of a number of basidomycete
diseases. Thifluzamide is prepared from the condensation of 2-methyl-4-triflu-
oromethyl-5-chlorocarbonylthiazole and 2,6-dibromo-4-trifluoromethoxyaniline.
The 2-methyl-4-trifluoromethyl-chlorocarbonylthiazole heterocyclic ring was syn-
thesized from the reaction of CF3COCHClCO2Et and thioacetamide in refluxing
DMF (Fig. 24) [93].
2.2.1.4. Plant growth regulators
The plant growth regulator flurprimidol (Cutlesss) [94], though it chemically
resembles fungicides that inhibit sterol biosynthesis, acts by interfering with
gibberellin biosynthesis [95]. Flurprimidol can be prepared in several steps
from 4-methoxybenzoyl chloride, free radical chlorination of which gives the
corresponding 4-trichloromethoxybenzoyl chloride. Halogen exchange gives
4-trifluoromethoxybenzoyl fluoride [96], which is then converted to the nitrile.
Reaction of 4-trifluoromethoxy benzonitrile with isopropyl Grignard results in the
corresponding ketone, which then can react with pyrimidin-5-yl lithium to give
flurprimidol (Fig. 25) [97].
G. Theodoridis142

2.2.2. Trifluoromethylthio derivatives
2.2.2.1. Herbicides
In the 1970s, it was discovered that a number of trifluoromethanesulfonalides
exhibited herbicidal and plant growth regulator activity [98,99]. Perfluidone, fluo-
ridamid, and mefluidide are three representatives of this class of herbicides.
Perfluidone [100] is a selective pre-emergent herbicide introduced for the control
of Cyperus esculentus and of many varieties of grass and selected broadleaf
weeds in cotton, turf, rice, sugar cane, and other crops. Fluoridamid was followed
by mefluidide (Embarks), which is far more effective.
NH
SO2CF3
CH3
NH
ONH
SO2CF3
CH3
NH
CH3O
NH
SO2CF3
CH3
S
O
O
Perfluidone MefluidideFluoridamid
NH
Br
Br
OCF3
ON
SCH3
CF3
OCF3
OO
Cl
S
NH2
CH3
S
NCF3
CH3COCl
Br
Br
OCF3
NH2
+
Thifluzamide
Fig. 24. Synthesis of the fungicide thifluzamide.
OCH3
O
Cl
OCCl3
O
ClO
CF3
O
F
OCF3
CNOCF3
OO
CF3
N
N
OH
N N
Li
HFCl2
Flurprimidol
Fig. 25. Synthesis of the plant growth regulator flurprimidol.
Fluorine-Containing Agrochemicals 143
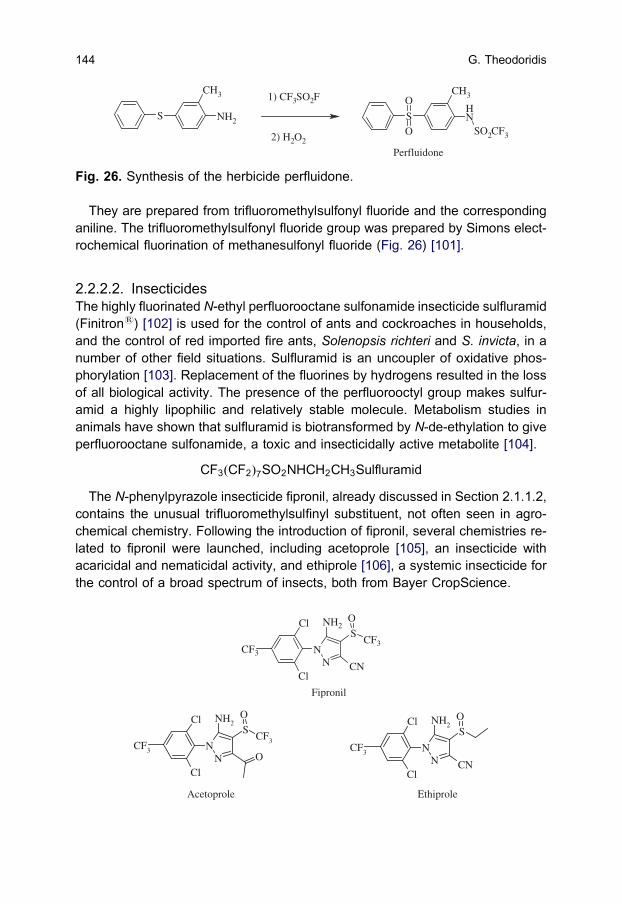
They are prepared from trifluoromethylsulfonyl fluoride and the corresponding
aniline. The trifluoromethylsulfonyl fluoride group was prepared by Simons elect-
rochemical fluorination of methanesulfonyl fluoride (Fig. 26) [101].
2.2.2.2. Insecticides
The highly fluorinated N-ethyl perfluorooctane sulfonamide insecticide sulfluramid
(Finitrons) [102] is used for the control of ants and cockroaches in households,
and the control of red imported fire ants, Solenopsis richteri and S. invicta, in a
number of other field situations. Sulfluramid is an uncoupler of oxidative phos-
phorylation [103]. Replacement of the fluorines by hydrogens resulted in the loss
of all biological activity. The presence of the perfluorooctyl group makes sulfur-
amid a highly lipophilic and relatively stable molecule. Metabolism studies in
animals have shown that sulfluramid is biotransformed by N-de-ethylation to give
perfluorooctane sulfonamide, a toxic and insecticidally active metabolite [104].
CF3ðCF2Þ7SO2NHCH2CH3Sulfluramid
The N-phenylpyrazole insecticide fipronil, already discussed in Section 2.1.1.2,
contains the unusual trifluoromethylsulfinyl substituent, not often seen in agro-
chemical chemistry. Following the introduction of fipronil, several chemistries re-
lated to fipronil were launched, including acetoprole [105], an insecticide with
acaricidal and nematicidal activity, and ethiprole [106], a systemic insecticide for
the control of a broad spectrum of insects, both from Bayer CropScience.
NN
SCF3
Cl
Cl
CF3
ONH2
CN
Fipronil
NN
SCF3
Cl
Cl
CF3
ONH2
ON
N
SCl
Cl
CF3
ONH2
CN
Acetoprole Ethiprole
NH2
CH3
S NH
SO2CF3
CH3
S
O
O
1) CF3SO2F
2) H2O2
Perfluidone
Fig. 26. Synthesis of the herbicide perfluidone.
G. Theodoridis144

2.2.3. Difluoromethoxy group
In fluorinated agrochemicals, the difluoromethoxy group is less commonly en-
countered than the trifluoromethoxy group. The difluoromethoxy group is readily
available from the reaction of a phenoxy group and difluorocarbene, generated
from chlorodifluoromethane and a base (Fig. 27) [6,107–109].
2.2.3.1. Herbicides
The difluoromethoxy group is widely used in a variety of herbicides, such as the
ALS enzyme inhibitor primisulfuron-methyl (Beacons) [110]. It is believed that
introduction of the difluoromethoxy group in primisulfuron-methyl is responsible
for its selective control of grass weeds in corn. It has been shown that corn can
deactivate primisulfuron-methyl by hydroxylation of the aromatic rings [111].
Synthesis of the 4,6-difluoromethoxypyrimidin-2-yl amino portion of prim-
isulfuron-methyl involves the reaction of the dihydroxy pyrimidine with difluoro-
carbene, which is generated in situ from chlorodifluoromethane and a base such
as sodium hydroxide (Fig. 28) [112,113].
Pyraflufen-ethyl (Ecoparts) [114] is a broadleaf weed postemergence herbi-
cide for use in cotton and cereals. Pyraflufen belongs to the family of herbicides
that inhibit the Protox enzyme.
N N
F
Cl
OEtO2C
CH3
O CHF2
Cl
Pyraflufen-ethyl
2.2.3.2. Insecticides
We have earlier discussed the pyrethroid area of insecticides. A number of ester
and non-ester pyrethroid insecticides have incorporated the difluoromethoxy
group as a means of widening their biological activity to the control of mites [115].
Flucythrinate (Cybolts, Cythrins, Pay-Offs) [116] provides control of a variety of
sucking insects, beetles, and lepidoptera in cotton and pome fruits. Later, a close
analog, flubrocythrinate, was commercialized [117].
OH OCHF2HCClF2
NaOH
F2C:
Fig. 27. Difluoromethylation of phenol derivatives.
Fluorine-Containing Agrochemicals 145

OO
OHF2C
NCO R
R = H FlucythrinateR = Br Flubrocythrinate
In some instances, chlorine is successfully replaced with a difluoromethoxy
group while retaining desirable properties. Flucythrinate was introduced after
fenvalerate by two different companies; the only difference was the replacement
of the 4-chloro group of fenvalerate with a difluoromethoxy group in flucythrinate.
These two molecules have similar insecticidal properties, and though the chem-
ical groups chlorine and difluoromethoxy are chemically different, their Hammet
electronic values s and their hydrophobic parameters p lie relatively close to each
other in parameter space (Fig. 29) [118].
SN
NOH
OH
SN
N
O
O O
O CHF2
CHF2
SO
ONCO
OO
N
N
O
O CHF2
CHF2
NH2
SNH N
H
OO
O
N
NO
O
CHF2
CHF2
OO
1) HCClF2
NaOH
2) Oxidation
NH3
Primisulfuron-methyl
Fig. 28. Synthesis of the herbicide primisulfuron-methyl.
OO
NCO
R
R substituents sigma pi 0.1 MR Cl 0.23 0.71 0.60 Fenvalerate OCHF2 0.18 0.31 0.79 Flucythrinate
Fig. 29. Comparison of physico-chemical parameters of chlorine and difluoro-methoxy chemical groups in fenvalerate and flucythrinate.
G. Theodoridis146

2.2.3.3. Fungicides
Diflumetorim (Piricats, Pyricuts) [119] is a non-systemic fungicide for use in
cereals and ornamentals. Diflumetorim inhibits the germination of powdery mil-
dew and rust.
OCHF2
NN
NH
Cl
Diflumetorim
2.2.4. Miscellaneous fluoroalkyl groups attached to oxygen and nitrogen
2.2.4.1. Miscellaneous fluoroalkyl groups attached to oxygen
Insecticides. There are a number of agrochemicals with fluoroalkyl groups at-
tached to oxygen with varying lengths of the carbon chain and differences in
fluorine content. One such example is the pyrethroid insecticide acrinathrin
(Rufasts, Ardents) [120], where the halogens of cypermethrin have been re-
placed with a polyfluorinated ester group.
OO
CNOCl
ClO
O
CNO
OO
CF3CF3
H
Cypermethrin Acrinathrin
Several N-benzoyl-N0-phenyl urea IGRs have a variety of polyfluorinated et-
hers. As mentioned earlier, these compounds act by inhibition of chitin synthesis
in insects at the larval stage. They act mainly by ingestion, but in some cases
they inhibit fecundity, exhibiting both ovicidal and contact toxicity [121]. Following
the success of diflubenzuron, the first IGR compound to be commercialized, an
intense search for more potent acylureas resulted in the development of newer
molecules, such as hexaflumuron, lufenuron, novaluron, and noviflumuron.
Changing the N-aryl portion of the molecule, while the 2,6-difluorophenyl acyl
urea remained constant, resulted in molecules with different potencies and insect
spectrum control. For instance, novaluron, a novel molecule in this class of in-
secticides, acts both by ingestion and contact, and is far more effective on eggs
of larvae of B. tabaci, and suppressing developing stages of the leafminer
Liriomyza huidobrensis, than teflubenzuron and chlorfluazuron, which are dis-
cussed in more detail in Section 2.3.2 [122].
Fluorine-Containing Agrochemicals 147

F
FO
NH N
H
O
Aryl
OCl
ClF
FFFH
OCl
Cl
FF
FF
FF
OClO
FF
FF
FF
OCl
ClF
F F
F
F
FF
Aryl =
Hexaflumuron NoviflumuronNovaluronLufenuron
Fungicides. The triazole fungicides represent one of the most significant
chemical classes of commonly used agrochemicals [123]. The triazole fungicide
tetraconazole (Eminents, Lospels, Domarks) [124] is an example of tetra-
fluoroethoxy-containing agrochemical. The 1,1,2,2-tetrafluoroethyl ether group is
introduced by the addition of tetrafluoroethylene to the hydroxy group of an
alcohol or phenol in the presence of a base [125].
Cl
ClO
N
N
N
CF2F2CH
Tetraconazole
Fludioxonil (Saphires, Maxims, Celests, Wispects) [126] belongs to the phe-
nyl pyrrole family of fungicides, originally developed from the natural product lead
pyrrolnitrin, which is an antifungal secondary metabolite produced by Pseudo-
monas pyrrocinia [127]. Fludioxonil is used for the control of a broad spectrum of
foliar pathogens in vegetables, grapes, stone fruits, and other crops.
O
O
NH
CNF
F
NH
Cl
O2NCN
Pyrrolnitrin Fludioxonil
The phenyl pyrroles can be prepared in a variety of ways [128,129]. Lithio-2,2-
difluoro-1,3-benzodioxole, obtained from the reaction of 2,2-difluoro-1,3-ben-
zodioxole with n-butyl lithium at �101C, was reacted with ethyl ethoxymethylene
G. Theodoridis148

cyanoacetic ester to give ethyl 2-cyano-2-(2,3-difluoro-1,3-benzodioxol-4-yl)-2-prop-
enoic ester, which was immediately reacted with p-toluenesulfonylmethyl isocya-
nide to produce fludioxonil (Fig. 30).
2.2.4.2. Miscellaneous fluoroalkyl groups attached to nitrogen
N-Difluoromethyl. The difluoromethyl group directly attached to nitrogen is not
commonly encountered in agrochemical research. Two examples of N-difluoro-
methylated agrochemicals are sulfentrazone (Authoritys, Borals, Capazs)
[130,131] and carfentrazone-ethyl (Aims, Affinitys, Auroras) [132], both herbi-
cides belonging to the same class, Protox. Nitrogen difluoromethylation is ob-
tained from the reaction of the triazolinone with chlorodifluoromethane and a
base. A structure–activity study of aryl triazolinones revealed the need for the
N-difluoromethyl group for optimum activity in this class of herbicides (Fig. 31)
[133].
N-Trifluoromethyl. The fungicide, insecticide, acaricide thiadiflur (Cropotexs)
[134] is one of the few compounds that have been commercialized that has the
unusual N-trifluoromethyl group. Thiadiflur was prepared from the di-aza-2,4-
diene intermediate CF3N ¼ CFCF ¼ NCF3 [135].
NS
N
NN
CF3
CF3
Thiadiflur
O
OF
FLi
O
CN
CO2Et O
OF
F
CN
CO2Et
SO
O NCO
O
NH
CNF
F
Fludioxonil
Fig. 30. Synthesis of the fungicide fludioxonil.
Fluorine-Containing Agrochemicals 149

2.3. Aromatic fluorine compounds
The industrial routes to the synthesis of aromatic fluorine compounds, in which
fluorine is directly bonded to an aromatic ring carbon, have been previously
reviewed [136]. In contrast to the synthesis of aromatic chlorine and bromine
compounds, aromatic fluorine-containing molecules require the use of special-
ized chemical equipment and additional safety precautions. The reason for these
measures is the toxicity and corrosive nature of fluorine reagents.
There are two basic industrial approaches to the introduction of fluorine into an
aromatic ring: (1) diazotization procedures and (2) halogen exchange (Halex). A
third – and the most promising – approach is aromatic electrophilic fluorination.
Diazotization procedures. Widely used for the production of aromatic fluorine is
the Balz–Schiemann reaction. The approach involves diazotization of the aniline
and isolation of the insoluble tetrafluoroborate salt, followed by decomposition
under heating conditions (Fig. 32). Initially introduced in 1927 [137,138], it did not
achieve commercial utility until the mid-1980s. A modification of the Balz–Schie-
mann reaction involves replacing the tetrafluoroborate with other counterions
such as a fluorine anion [139].
Halogen exchange (halex). This procedure involves the displacement of an
activated aromatic halogen with a fluorine anion [140,141]. It has been exten-
sively used for the synthesis of fluorinated aromatic intermediates, such as 2,6-
difluorobenzonitrile (Fig. 33) [142].
Aromatic electrophilic fluorination. Much research recently has been focused
on aromatic electrophilic fluorinations [143], though the approaches studied were
limited to small-scale work. A search for alternative routes to the synthesis of the
carfentrazone-ethyl herbicide intermediate, 4-chloro-2-fluorophenyl triazolinone,
resulted in the investigation of a number of aromatic electrophilic reagents. These
investigations have made significant progress toward developing practical and
cost-effective large-scale industrial use of these reagents. Among the various
NN
N
OCHF2
CH3
Cl
Cl
NH
CH3SO2
NN
N
OCHF2
CH3
F
ClCl
OO
Order of biological potency of triazolinone ring N-substituents
CHF2 >> Et, i-Pr > CH2F > Me
Carfentrazone-ethylSulfentrazone
Fig. 31. Structure–activity of N-substituted triazolinone Protox herbicides.
G. Theodoridis150
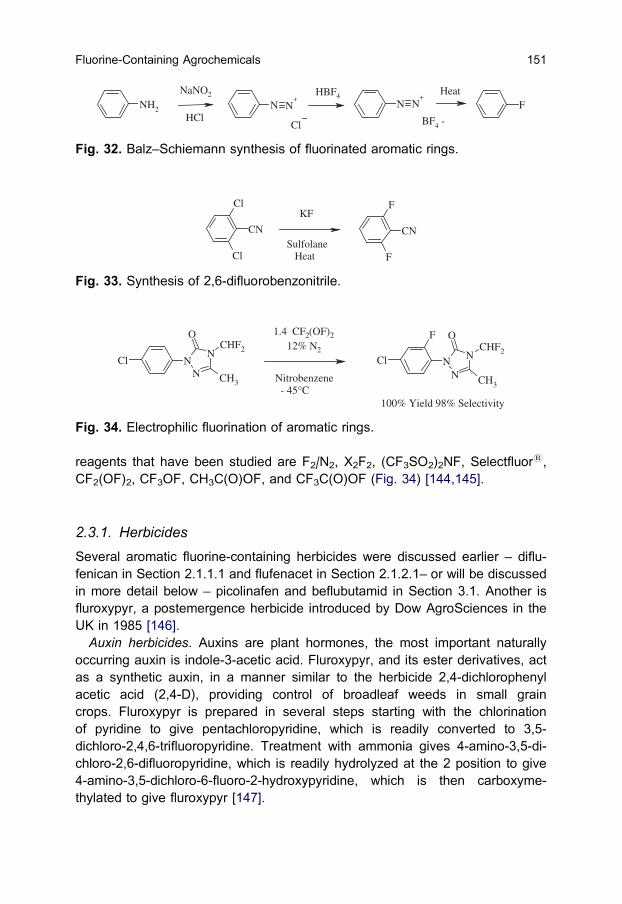
reagents that have been studied are F2/N2, X2F2, (CF3SO2)2NF, Selectfluors,
CF2(OF)2, CF3OF, CH3C(O)OF, and CF3C(O)OF (Fig. 34) [144,145].
2.3.1. Herbicides
Several aromatic fluorine-containing herbicides were discussed earlier – diflu-
fenican in Section 2.1.1.1 and flufenacet in Section 2.1.2.1– or will be discussed
in more detail below – picolinafen and beflubutamid in Section 3.1. Another is
fluroxypyr, a postemergence herbicide introduced by Dow AgroSciences in the
UK in 1985 [146].
Auxin herbicides. Auxins are plant hormones, the most important naturally
occurring auxin is indole-3-acetic acid. Fluroxypyr, and its ester derivatives, act
as a synthetic auxin, in a manner similar to the herbicide 2,4-dichlorophenyl
acetic acid (2,4-D), providing control of broadleaf weeds in small grain
crops. Fluroxypyr is prepared in several steps starting with the chlorination
of pyridine to give pentachloropyridine, which is readily converted to 3,5-
dichloro-2,4,6-trifluoropyridine. Treatment with ammonia gives 4-amino-3,5-di-
chloro-2,6-difluoropyridine, which is readily hydrolyzed at the 2 position to give
4-amino-3,5-dichloro-6-fluoro-2-hydroxypyridine, which is then carboxyme-
thylated to give fluroxypyr [147].
Cl
Cl
CN
F
F
CN
KF
Sulfolane Heat
Fig. 33. Synthesis of 2,6-difluorobenzonitrile.
NH2N N
+N N
+
Cl BF4 -
FNaNO2
HCl
HBF4 Heat
Fig. 32. Balz–Schiemann synthesis of fluorinated aromatic rings.
NN
N
OCHF2
CH3
F
ClNN
N
OCHF2
CH3
Cl
1.4 CF2(OF)2
12% N2
Nitrobenzene - 45°C
100% Yield 98% Selectivity
Fig. 34. Electrophilic fluorination of aromatic rings.
Fluorine-Containing Agrochemicals 151

N O
Cl
NH2
Cl
F
O
OH
Cl
Cl OCO2H
NH
CO2H
Indole-3-acetic acid 2,4-D Herbicide Fluroxypyr
A new class of plant auxin herbicides are the phytotropins, exemplified by the
semicarbazone diflufenzopyr [148]. Diflufenzopyr is a systemic herbicide for the
selective control of broadleaf and perennial weeds in corn. Unlike the early auxin
herbicides, such as 2,4-D and dicamba, which acted as mimics of indole-3-acetic
acid, phytotropins prevent polar auxin transport in sensitive plants, causing
stunting and loss of tropic response [149].
N
CO2H
NNH
NH
O F
F
Diflufenzopyr
Protox herbicides. A number of Protox herbicides share a 2-fluorophenyl group.
Initial investigations into an alternative synthesis of 2-fluoro-4-chlorophenyl
triazolinones resulted in the very promising use of newer fluorinating reagents.
The actual synthesis of carfentrazone-ethyl involved the use of 2-fluoroaniline as
the starting material (Fig. 35) [150].
ALS herbicides. Two classes of ALS-inhibiting herbicides are the sulfonylurea
herbicides, discussed in Sections 2.1.2.1 and 2.2.3.1, and the imidazolinone
herbicides. A third class of ALS-inhibiting herbicides is the 1,2,4-triazolo
[1,5-a]pyrimidine-2-sulfonanilides. The triazolopyrimidine sulfonanilides act by
disrupting the biosynthesis of branched chain amino acids in plants. Represent-
atives of this class of herbicides include florasulam (Boxers, Nikoss) [151], in-
itially introduced in Belgium in 1999 and used for the postemergence control of
broadleaf weeds in cereals and corn, and flumetsulam (Broadstrikes) [152], used
alone or in combination with other herbicides for the control of broadleaf weeds in
soybean and corn.
NCH3
N
N
NSO2
NH
F
F
N
N
NNSO2
NH
F
F
O
F
CH3
Florasulam Flumetsulam
G. Theodoridis152

2.3.2. Insecticides
Benzoylphenyl urea. Substitution at the anilide portion of the molecule, partic-
ularly at the 4 position, has resulted in a variety of different commercial benzoyl-
phenyl urea insecticides; diflubenzuron (Dimilins), with chlorine at the 4 position
of the anilide, provides one of the earliest examples [153]. The trifluoromethyl-
containing benzoylphenyl ureas flufenoxuron and bistrifluron were discussed in
Section 2.1.1.2, and chlorfluazuron was discussed in Section 2.1.2.2. Tefluben-
zuron (Nemolts) is used for the control of lepidoptera, coleoptera, diptera, and
hemiptera larvae on vines, pome fruit, cabbages, vegetables, and cotton.
ClNH
NH
OO
F
F
ONH
NH
OO
F
F
NCl
Cl
Cl
CF3Chlorfluazuron Diflubenzuron
FNH
NH
OO
F
F
F
Cl
Cl
ONH
NH
OO
F
F
CF3
ClF
Flufenoxuron Teflubenzuron
F
FNH
O
NH
O
Cl CF3
CF3
Bistrifluron
NH2
F
NN
N
OCHF2
CH3
F
ClCl
OO
Several
steps
Carfentrazone-ethyl
Fig. 35. Synthesis of the herbicide carfentrazone-ethyl.
Fluorine-Containing Agrochemicals 153

Aromatic fluorine plays a decisive role in the biological activity of benzoylphenyl
urea insecticides. Extensive quantitative structure–activity relationships, or
QSAR, was performed by Verloop and Ferrell on the larvicidal activity of Pieris
brassicae using a number of substituted benzoylphenyl ureas containing aro-
matic fluorines [154]. The results of the study showed that an electron-withdraw-
ing and hydrophobic group, as well as a small-size substituent such as fluorine,
are necessary for optimal biological activity at the 2 and 6 aromatic positions.
Interestingly, the 2,6-difluorophenyl modification was originally undertaken to re-
duce persistence in soil by impacting environmental stability such as soil deg-
radation (Fig. 36) [4].
The 2,4-diaryloxazoline etoxazole [155] is a highly active insecticide and acari-
cide that was commercialized in 1998. Its mode of action appears to be similar to
that of other benzoylphenylurea IGRs [156]. Etoxazole is highly active against
eggs, larvae, and nymphs of a number of mites. It also controls green rice leaf-
hoppers, aphids, and diamondback moth. In addition to its broad spectrum of
biological activity, etoxazole has a favorable environmental profile, with low
mammalian toxicity and short environmental persistence [157].
F
F
O
N
O
Etoxazole
Pyrethroids. Following the successful introduction of the first commercial pyre-
throid insecticides in the 1970s, new pyrethroid molecules, such as cyfluthrin
(Baythroids), the first fluorine-containing pyrethroid [158], were introduced in
the1980s. Cyfluthrin was several times more active than cypermethrin for the
control of cotton pests [159]. Later, in 1988, tefluthrin (Forces, Forzas) [160] was
introduced as an insecticide with soil applications.
Cl
ClNH2
O
Cl NH
NH
OO
X
XF
FOH
O
X = ClSoil t1/2 = 6-12 months
X = FSoil t1/2 = 2-3 days Diflubenzuron
Fig. 36. Influence of fluorine on soil stability of benzoylphenyl urea insecticides.
G. Theodoridis154

CF3
Cl
OO
F F
FF
ClCl
OO
ONC
F
Cyfluthrin Tefluthrin
Cl
OO
ONC
F
Cl
Flumethrin
In addition to the classical ester pyrethroids previously discussed in Sections
2.1.1.2, 2.2.3.2, and 2.2.4.1, two non-ester pyrethroid molecules were reported
by the FMC Corporation in the late 1980s and early 1990s: protrifenbute [161]
and eflusilanate [162]. Structure–activity investigations of eflusilanate found that
removal of the fluorine atom resulted in a 10-fold loss of biological activity [163].
Cl
O
F
SiO
O
F
Eflusilanate Protrifenbute
2.3.3. Fungicides
In addition to the trifluoromethylphenyl sterol biosynthesis inhibitors discussed in
Section 2.1.1.3, a number of fluorine phenyl-containing azoles were introduced in
the years 1984 through 1993. Though these molecules share some common
structural features, such as the triazole heterocycle and a 4-fluorophenyl ring in at
least three of the four fungicides shown below, each also has unique chemical
features. For instance, in the case of flusilazole (Punchs, Nustars, Triumphs,
Olymps) [164], a silicon atom is present. This represented that first time silicon
Fluorine-Containing Agrochemicals 155
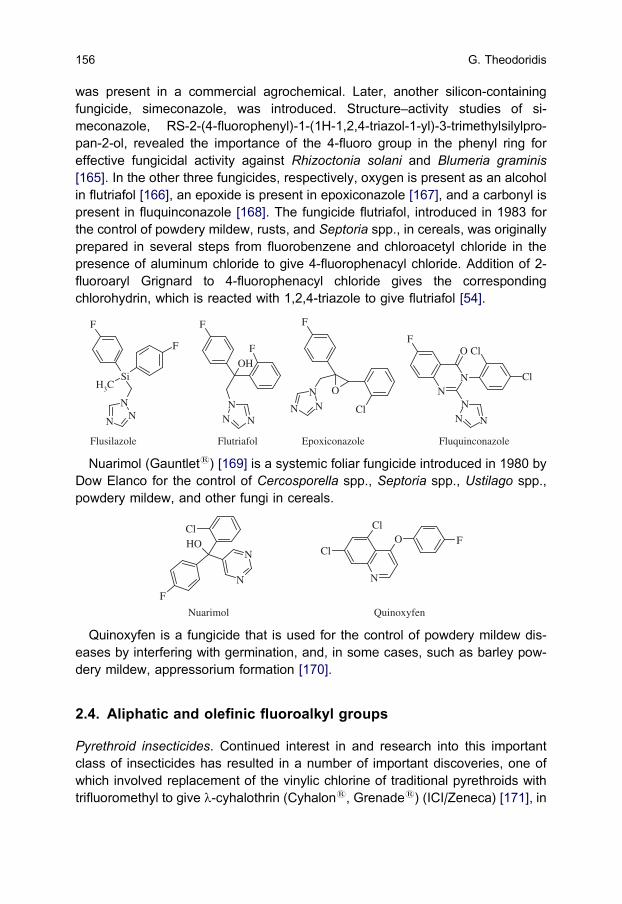
was present in a commercial agrochemical. Later, another silicon-containing
fungicide, simeconazole, was introduced. Structure–activity studies of si-
meconazole, RS-2-(4-fluorophenyl)-1-(1H-1,2,4-triazol-1-yl)-3-trimethylsilylpro-
pan-2-ol, revealed the importance of the 4-fluoro group in the phenyl ring for
effective fungicidal activity against Rhizoctonia solani and Blumeria graminis
[165]. In the other three fungicides, respectively, oxygen is present as an alcohol
in flutriafol [166], an epoxide is present in epoxiconazole [167], and a carbonyl is
present in fluquinconazole [168]. The fungicide flutriafol, introduced in 1983 for
the control of powdery mildew, rusts, and Septoria spp., in cereals, was originally
prepared in several steps from fluorobenzene and chloroacetyl chloride in the
presence of aluminum chloride to give 4-fluorophenacyl chloride. Addition of 2-
fluoroaryl Grignard to 4-fluorophenacyl chloride gives the corresponding
chlorohydrin, which is reacted with 1,2,4-triazole to give flutriafol [54].
Si
F
N
N N
F
CH3
Cl
O
F
N
N N
NN
OF
N
NN
Cl
ClOH
F
F
N
NN
Flusilazole FluquinconazoleEpoxiconazoleFlutriafol
Nuarimol (Gauntlets) [169] is a systemic foliar fungicide introduced in 1980 by
Dow Elanco for the control of Cercosporella spp., Septoria spp., Ustilago spp.,
powdery mildew, and other fungi in cereals.
OH
N
N
Cl
F
N
O F
Cl
Cl
Nuarimol Quinoxyfen
Quinoxyfen is a fungicide that is used for the control of powdery mildew dis-
eases by interfering with germination, and, in some cases, such as barley pow-
dery mildew, appressorium formation [170].
2.4. Aliphatic and olefinic fluoroalkyl groups
Pyrethroid insecticides. Continued interest in and research into this important
class of insecticides has resulted in a number of important discoveries, one of
which involved replacement of the vinylic chlorine of traditional pyrethroids with
trifluoromethyl to give l-cyhalothrin (Cyhalons, Grenades) (ICI/Zeneca) [171], in
G. Theodoridis156

1980, and bifenthrin (Talstars) (FMC) [172] and tefluthrin (Forces, Forzas)
[160], in 1988. Tefluthrin was discussed in Section 2.3.2, on aromatic fluorine
compounds. Replacement of vinylic chlorine with trifluoromethyl resulted in a
significant increase in biological activity. These compounds are prepared from the
esterification of the acid with the appropriate alcohol. The acid portion is obtained
from the reaction of the olefin with trichloro-2,2,2-trifluoroethane under free rad-
ical conditions, followed by ring formation with sodium butoxide in 1,2-dime-
thoxyethane (Fig. 37) [173]. Several approaches are available for the synthesis of
the trifluoromethyl vinyl ester portion of pyrethroids [174].
The non-ester pyrethroid flufenprox is a broad spectrum insecticide with re-
sidual activity against hemiptera, lepidoptera, and coleopteran insects in rice. It is
reported that flufenprox is safe to beneficial insects such as spiders and preda-
ceous mites [175].
OCF3
O
O Cl
Flufenprox
3. FLUORINE-CONTAINING AGROCHEMICALS: RECENTDEVELOPMENTS
This section will primarily focus on fluorinated agrochemicals in advanced stages
of development that have been assigned an ISO name since 2001. Some im-
portant sources of information are the latest edition of Global Insecticide Direc-
tory, Agranova, and The Pesticide Manual. However, in many cases, only limited
information is available about the synthesis, biology, mode of action, and struc-
ture–activity characteristics of the molecules.
New agrochemicals introduced in the past five years include new chemistries
with known modes of action, such as the protoporphyrinogen inhibitor bencarba-
zone, the phytoene desaturase picolinafen and beflutamid, and sodium channel
pyrethroids; new chemistries with possibly new modes of action, such as flonic-
amid and pyridalyl; and new chemistries with established new modes of actions,
such as flubendiamide, which activates ryanodine-sensitive intracellular calcium
release channels, ryanodine receptors RyR, in insects.
We have also noticed renewed interest in the use and synthesis in agrochem-
icals containing the pentafluorosulfanyl group, first in the early 1990s, mostly from
work done at Zeneca in the UK. In those early patents, the –CF3 group was
replaced with – SF5 in known diphenyl ether herbicides and in insecticides such
Fluorine-Containing Agrochemicals 157
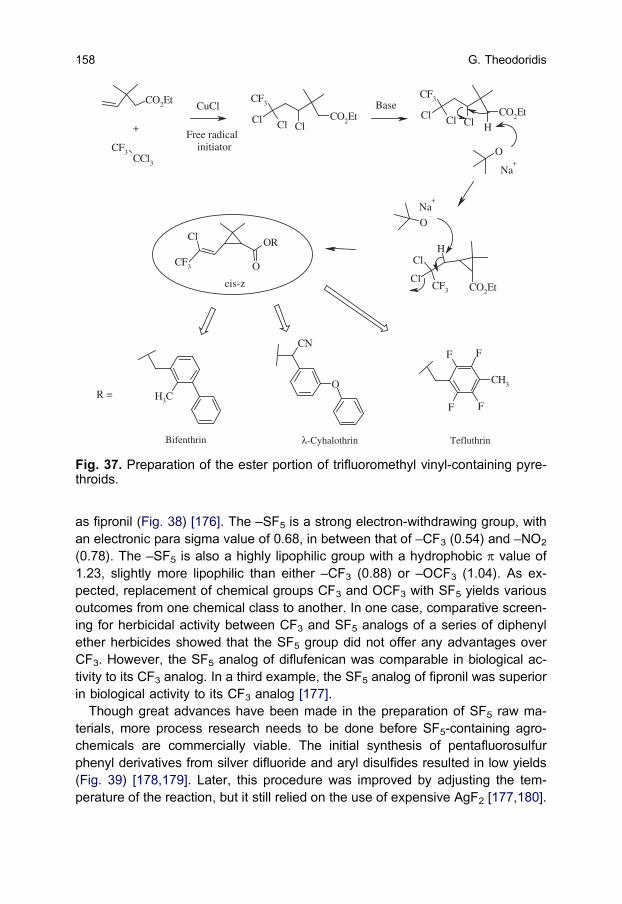
as fipronil (Fig. 38) [176]. The –SF5 is a strong electron-withdrawing group, with
an electronic para sigma value of 0.68, in between that of –CF3 (0.54) and –NO2
(0.78). The –SF5 is also a highly lipophilic group with a hydrophobic p value of
1.23, slightly more lipophilic than either –CF3 (0.88) or –OCF3 (1.04). As ex-
pected, replacement of chemical groups CF3 and OCF3 with SF5 yields various
outcomes from one chemical class to another. In one case, comparative screen-
ing for herbicidal activity between CF3 and SF5 analogs of a series of diphenyl
ether herbicides showed that the SF5 group did not offer any advantages over
CF3. However, the SF5 analog of diflufenican was comparable in biological ac-
tivity to its CF3 analog. In a third example, the SF5 analog of fipronil was superior
in biological activity to its CF3 analog [177].
Though great advances have been made in the preparation of SF5 raw ma-
terials, more process research needs to be done before SF5-containing agro-
chemicals are commercially viable. The initial synthesis of pentafluorosulfur
phenyl derivatives from silver difluoride and aryl disulfides resulted in low yields
(Fig. 39) [178,179]. Later, this procedure was improved by adjusting the tem-
perature of the reaction, but it still relied on the use of expensive AgF2 [177,180].
CO2Et
CCl3
CF3 O
Na+
O
Na+
CF3
Cl
O
OR
Cl
CF3
Cl
H
CO2Et
CH3
O
CNF F
CH3
FF
Cl
CF3
ClCl CO2Et
CF3
ClCl CO2Et
HCl+
Free radical initiator
BaseCuCl
cis-z
R =
Bifenthrin λ-Cyhalothrin Tefluthrin
Fig. 37. Preparation of the ester portion of trifluoromethyl vinyl-containing pyre-throids.
G. Theodoridis158

An alternative method of preparing the SF5 group was developed in the 1990s
using elemental fluorine and an arylthiol. In this process, elemental fluorine is
used both as an oxidant and a fluorinating agent. Despite the fact that in the final
fluorination, the conversion of SF3 to SF5 is difficult and results in a number of by-
products from ring fluorination side reactions, it provides a more realistic route to
the preparation of many pentafluorosulfur phenyl derivatives (Fig. 40) [181].
3.1. Herbicides
Two phytoene desaturase herbicides have been introduced since 2000: picolina-
fen (Picos) [182], introduced in 2001 by BASF, and beflubutamid [183], intro-
duced in 2003 by Ube Industries. The primary mode of action of picolinafen and
beflutamid is interference of carotenoid biosynthesis at the phytoene desaturation
level, causing bleaching of the plant affected. As in previously developed
phytoene desaturase herbicides, a meta-substituted trifluoromethylphenyl group
is key for activity in this class of herbicides, pointing to the need for a lipophilic
and electron-withdrawing group at this position of the molecule.
SS
O2N
NO2SF3
NO2
SF5
NO2
AgF2 AgF2
Freon60°C 120° C
Fig. 39. Synthesis of pentafluorosulfur phenyl derivatives with AgF2.
NHO
N
O
SFFF
FF
F
F
SF5 analog of herbicide diflufenican
NN
SCF3
Cl
Cl
S
ONH2
CN
F
F
F
FF
S O
Cl
F
FFF
FNO2
ONH
SO2CH3
SF5 analog of diphenyl ether herbicides SF5 analog of fipronil
Fig. 38. SF5 analogs of known CF3-containing herbicidal and insecticidal agro-chemicals.
Fluorine-Containing Agrochemicals 159

CF3
ON O
NH
F
F
CF3
O O
NH
Picolinafen Beflubutamid
Metamifop (Pizeros) [184] is a new arylphenoxypropionic acid experimental
postemergence herbicide for the selective control of grasses such as barnyard
grass in rice.
N
OCl
O O
CH3
H
O
NCH3
FMetamifop
A number of recent herbicide entries include bencarbazone [185], pyrasulfotole
[186], and pyrimisulfan [187]. Bencarbazone, whose ISO common name was
approved in 2005, has all the features associated with Protox herbicides, par-
ticularly that of the Protox herbicide sulfentrazone. Pyrasulfotole is a newly de-
veloped herbicide from Bayer CropScience for use on cereals. Pyrimisulfan, a
difluoromethylsulfonamide-containing, herbicide, is a new ALS herbicide for the
control of perennial weeds.
N
F
N
N
OCH3
CF3
S
NH2NH
SO
O
Bencarbazone
SF5O2N
SHO2N SO2N S NO2
SF3O2N
2
F2 / N2
HF+
F2 / N2
F2 / N2
Fig. 40. Preparation of SF5 phenyl derivatives with elemental fluorine.
G. Theodoridis160

O
NN
OH
CH3
S
CF3
O
O
CH3
N
NOHO
O
NH
S
O
F
F
CH3
CH3
O
O
Pyrasulfotole Pyrimisulfan
Flucetosulfuron [188,189] is a sulfonylurea experimental postemergence her-
bicide for controlling grasses such as barnyard grass in rice and broadleaf weeds
such as Galium aparine in cereals. It shares with previously introduced sulfonyl-
urea herbicides a common mode of action, inhibition of the ALS enzyme, a key
enzyme in the biosynthesis of branched amino acids, such as leucine, isoleucine,
and valine [76].
N
OO
OCH3
F
CH3
NH
O
NH
N
NO
O CH3
CH3
S
O
O
Flucetosulfuron
3.2. Insecticides
Three decades after the first IGRs were introduced in the mid-1970s, new chitin
biosynthesis inhibitors, such as noviflumuron (Recruit IIIs) [190], were devel-
oped. Noviflumuron is particularly effective for the control of ants, termites, cock-
roaches, and fleas.
Amidoflumet is a highly effective experimental miticide for the control of
Tyrophagus putrescientae, Dermatophagoides farinae, and chelatid mites.
F
FO
NH N
H
O
O
Cl
Cl
CF2CHFCF3F
OO
NH
SCl
O
O
CF3
Noviflumuron Amidoflumet
Flufenerim [191], an insecticide that acts by inhibition of the mitochondrial
electron transport of complex I, is under development by Ube Industries. Flu-
fenerim, which is chemically related to pyrimidifen, is reported to control aphids
and whiteflies.
Fluorine-Containing Agrochemicals 161
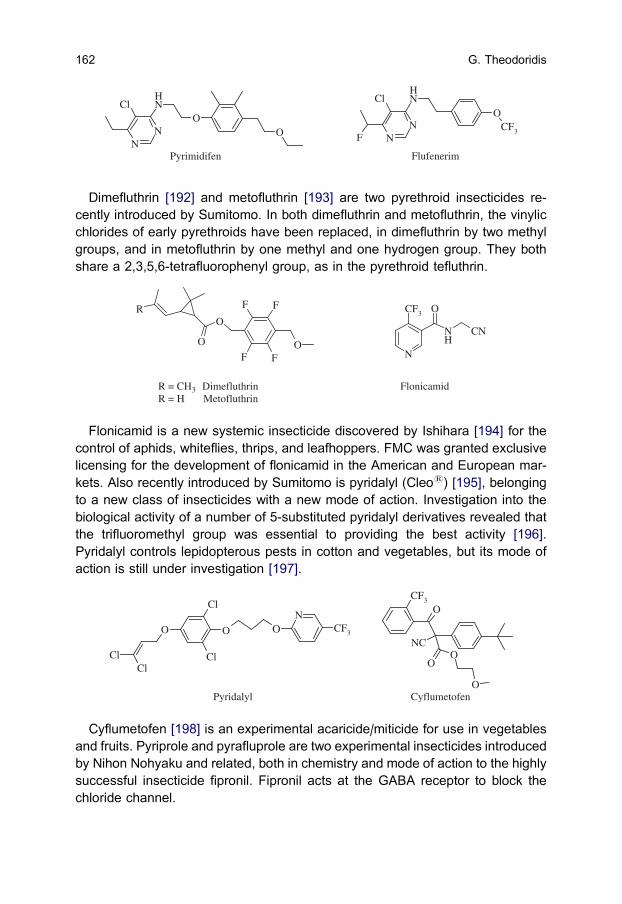
NN
NH
Cl
F
OCF3
NN
NH
ClO
O
Pyrimidifen Flufenerim
Dimefluthrin [192] and metofluthrin [193] are two pyrethroid insecticides re-
cently introduced by Sumitomo. In both dimefluthrin and metofluthrin, the vinylic
chlorides of early pyrethroids have been replaced, in dimefluthrin by two methyl
groups, and in metofluthrin by one methyl and one hydrogen group. They both
share a 2,3,5,6-tetrafluorophenyl group, as in the pyrethroid tefluthrin.
N
CF3
NH
O
CN
F F
FFO
R
O
O
R = CH3 Dimefluthrin FlonicamidR = H Metofluthrin
Flonicamid is a new systemic insecticide discovered by Ishihara [194] for the
control of aphids, whiteflies, thrips, and leafhoppers. FMC was granted exclusive
licensing for the development of flonicamid in the American and European mar-
kets. Also recently introduced by Sumitomo is pyridalyl (Cleos) [195], belonging
to a new class of insecticides with a new mode of action. Investigation into the
biological activity of a number of 5-substituted pyridalyl derivatives revealed that
the trifluoromethyl group was essential to providing the best activity [196].
Pyridalyl controls lepidopterous pests in cotton and vegetables, but its mode of
action is still under investigation [197].
OCF3
OO
NC
O
O
Cl
Cl
O
ClCl
ON
CF3
Pyridalyl Cyflumetofen
Cyflumetofen [198] is an experimental acaricide/miticide for use in vegetables
and fruits. Pyriprole and pyrafluprole are two experimental insecticides introduced
by Nihon Nohyaku and related, both in chemistry and mode of action to the highly
successful insecticide fipronil. Fipronil acts at the GABA receptor to block the
chloride channel.
G. Theodoridis162

N
N
Cl
Cl
CF3N
NHS
CN
CHF2
N
N
N
Cl
Cl
CF3N
NHS
CN
CH2F
Pyriprole Pyrafluprole
A new development in the field of agrochemicals is the use of the heptafluoroi-
sopropyl group in the aromatic ring of the active molecule flubendiamide
[199,200]. Flubendiamide is an insecticide discovered by Nihon Nohyaku, and co-
developed with Bayer CropScience [201,202], that belongs to a new chemistry
class – the benzenedicarboxamides, or phthalic acid diamides, as they are also
known – with a novel mode of action. Flubendiamide activates ryanodine-sen-
sitive intracellular calcium release channels, ryanodine receptors, RyR, in insects
[203]. Flubendiamide is prepared in several steps involving 3-iodophthalic anhy-
dride and the key intermediate 4-heptafluoroisopropyl-2-methylaniline, which is
prepared from 2-toluidine and heptafluoroisopropyl iodide, in the presence of
sodium dithionite and sodium hydrogen carbonate (Fig. 41) [204]. With flubendi-
amide moving into development, it is clear that whatever the costs added by the
incorporation of this exotic group, they are more than compensated by the in-
secticide’s increased biological activity, and the resulting lower application rate.
IO
NH
S
NH
CH3
CF3
F
CF3
O
O
O
CH3
NH2
ICF3
CF3
F
CH3
NH2
CF3
CF3
F
O
I N S
O
IO
NH
S
NH
CH3
CF3
F
CF3
O
Na2S2O4
NaHCO3
30% H2O2
CH3CO2H
Flubendiamide
Fig. 41. Synthesis of the insecticide flubendiamide.
Fluorine-Containing Agrochemicals 163
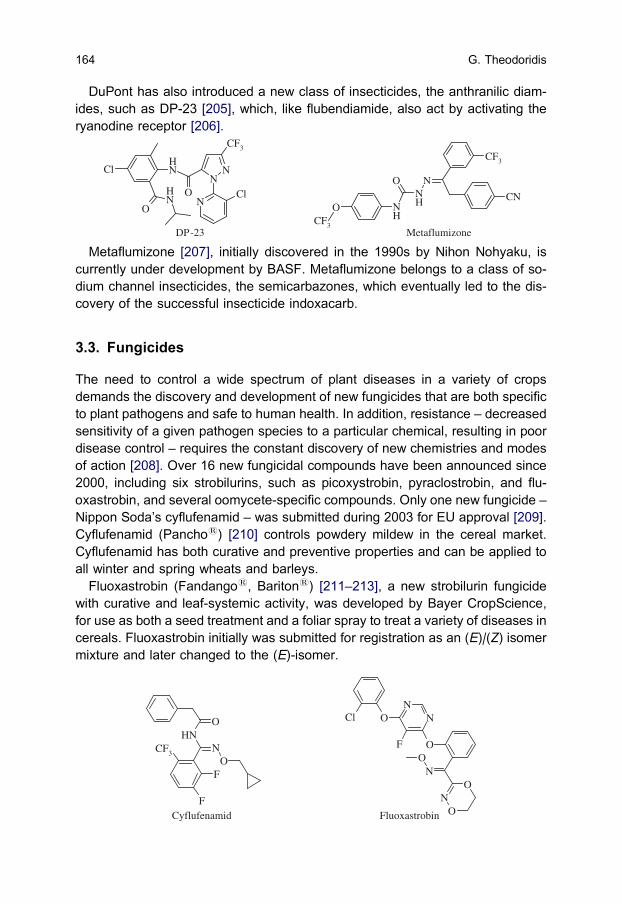
DuPont has also introduced a new class of insecticides, the anthranilic diam-
ides, such as DP-23 [205], which, like flubendiamide, also act by activating the
ryanodine receptor [206].
O NHCF3
NH
O N
CF3
CN
NN
CF3
NClO
ONH
Cl NH
DP-23 Metaflumizone
Metaflumizone [207], initially discovered in the 1990s by Nihon Nohyaku, is
currently under development by BASF. Metaflumizone belongs to a class of so-
dium channel insecticides, the semicarbazones, which eventually led to the dis-
covery of the successful insecticide indoxacarb.
3.3. Fungicides
The need to control a wide spectrum of plant diseases in a variety of crops
demands the discovery and development of new fungicides that are both specific
to plant pathogens and safe to human health. In addition, resistance – decreased
sensitivity of a given pathogen species to a particular chemical, resulting in poor
disease control – requires the constant discovery of new chemistries and modes
of action [208]. Over 16 new fungicidal compounds have been announced since
2000, including six strobilurins, such as picoxystrobin, pyraclostrobin, and flu-
oxastrobin, and several oomycete-specific compounds. Only one new fungicide –
Nippon Soda’s cyflufenamid – was submitted during 2003 for EU approval [209].
Cyflufenamid (Panchos) [210] controls powdery mildew in the cereal market.
Cyflufenamid has both curative and preventive properties and can be applied to
all winter and spring wheats and barleys.
Fluoxastrobin (Fandangos, Baritons) [211–213], a new strobilurin fungicide
with curative and leaf-systemic activity, was developed by Bayer CropScience,
for use as both a seed treatment and a foliar spray to treat a variety of diseases in
cereals. Fluoxastrobin initially was submitted for registration as an (E)/(Z) isomer
mixture and later changed to the (E)-isomer.
ONH
NO
F
F
CF3
NNO
O
Cl
F
NO
NO
O
Cyflufenamid Fluoxastrobin
G. Theodoridis164

Flumorph [214] is a new systemic fungicide discovered in 1994 at Shenyang
Research Institute of Chemical Industry. Flumorph provides good control at
100–200mg /L of oomycetes such as cucumber downy mildew, cabbage downy
mildew, grape downy mildew, and tomato late blight. Oomycetes are a large
group of important species that include both saprophytes and significant para-
sites of animals, insects, and plants (Pythium, Phytophthora, white rusts, and
downy mildews). Flumorph also has proven to be highly active against both
metalaxyl-sensitive and resistant isolates of Pseudoperonospora cubensis.
N
O
O
O
F
O
O
F
NO
O
O
(E)-Isomer (Z)-Isomer
Flumorph
Amisulbrom [215] is a new fungicide from Nissan Chemical Industries that has
been reported to control clubroot disease, Plasmodiophora brassicae, in Chinese
cabbage [216].
N
Br
FSO
O N N
N
S NO O
Amisulbrom
Fluopicolide [217] is a Bayer CropScience fungicide for the control of oomycete
diseases such as downy mildew, damping-off, and late blight in vegetables, cu-
cumber, tomatoes, cereals, and coffee.
Penthiopyrad [218,219] is a new carboxamide fungicide under development by
Mitsui Chemicals that shows good activity against Botrytis, powdery mildew, and
apple scab.
Cl
ClNH
O
N
Cl
CF3
NN
CF3
NH
O
S
Fluopicolide Penthiopyrad
Fluorine-Containing Agrochemicals 165

Benthiavalicarb-isopropyl (Mamorottos) [220] is a new fungicide from Kumiai
Chemical Industries that is active against the oomycete fungal plant pathogen
Plasmopara viticola, which causes downy mildew in grapevines. Benthiavalicarb-
isopropyl has demonstrated good prophylactic and local activity in intact plants
and detached leaves and low translaminar activity [221]. With two asymmetric
centers, of the four possible optical enantiomers of benthiavalicarb-isopropyl, only
one is biologically active, that of isopropyl [(S)-1-{(R)-1-(6-fluorobenzothiazol-2-
yl)ethylcarbamoyl}-2-methylpropyl}carbamate. The bulk agricultural form of bent-
hiavalicarb-isopropyl contains the active (S,R)-benthiavalicarb-isopropyl and
traces of [(S)-1-[(S)-1-(6-fluorobenzothiazol-2-yl)ethylcarbamoyl]-2-methylpropyl]
carbamate, and neither of the two remaining isomers [222].
N
SFNH
O
NH
CH3
O
O
N
SFNH
O
NH
CH3
O
O
(S,R)-Isomer (S,S)-Isomer
Benthiavalicarb-isopropyl
4. SUMMARY
It was recently stated that the field of fluorine chemistry is experiencing a ren-
aissance [223]. The pivotal role of fluorine in the development of new agro-
chemicals in the past two decades is likely to intensify in the future as
improvements continue to be made in the industrial preparation of key fluorinated
materials. The higher cost of fluorinated building blocks remains a factor that
limits their wider use. Certain fluorinating approaches, such as Halex, the hal-
ogen-exchange reaction, are inherently wasteful, both from a cost and an en-
vironmental point of view, due to the need to introduce and then remove chlorine
as a means of introducing fluorine [224]. Electrophilic fluorinating agents
[143,225], such as those described in Section 2.3 on aromatic fluorination, offer
clear advantages in that fluorine can be introduced later in the synthesis of a
molecule, resulting in potentially lower costs and environmentally cleaner proc-
esses [145].
With the increased number of new commercial fluorine-containing agrochem-
icals introduced over the past decade, there is a growing need to continue to
understand the environmental fate of these materials, particularly perfluoroalkyl
substituents, such as the trifluoromethyl group [226]. Given the strong car-
bon–fluorine bond of fluorine-containing molecules, the likelihood of fluorine be-
ing released into the environment in the form of hydrogen fluoride is negligible.
This is an important point given the ongoing investigations into the risks to
G. Theodoridis166

animals and plants of hydrogen fluoride that is released into the environment from
fluorinated water effluents and from certain fluoride-generating industries such as
coal and ceramics [227,228].2
Although the introduction of fluorine often has a dramatic impact on the bio-
logical activity of many agrochemicals, it is not always predictable. Improvements
in activity with any of the various available fluorinated groups depends on the
specific molecule, its mode of action, its physical chemical properties, and ap-
plication method, among other factors. Part of the difficulty of predicting the
outcome of the use of fluorinated groups is the fact that molecular substitution
can impact biological activity at different stages: the molecular level, where a
molecule interacts with a binding site; transport of a molecule through plant or
insect barriers; metabolism by the target organism; and photostability. A better
understanding of quantitative structure–activity relationships for different classes
of agrochemicals as they are affected by these different factors would go a long
way toward promoting the rational design of biologically active molecules.
REFERENCES
[1] H.Martin, C.R.Worthing (Eds.), The Pesticide Manual5th edition, BCPC, Croydon,England, 1977.
[2] C.D.S.Tomlin (Ed.), The Pesticide Manual13th edition, BCPC, Alton, Hampshire,2003.
[3] G.T. Newbold, Organofluorine chemicals and their industrial applications, in:R.E. Banks, (Ed.), Society of Chemical Industry, Ellis Horwood LTD, Chichester,England, 1979, pp. 169–187.
[4] P. Jeschke, The unique role of fluorine in the design of active ingredients for moderncrop protection, ChemBioChem. 5 (2004) 570–589.
[5] A. Haas, Fluorine modified compounds: synthesis and biological activities, L’actu-alite0 Chimique 5 (1987) 183–188.
[6] F. Leroux, P. Jeschke, M. Schlosser, a-Fluorinated ethers, thioethers, and amines:anomerically biased species, Chem. Rev. 105 (2005) 827–856.
[7] P. Maienfisch, R.G. Hall, The importance of fluorine in the life science industry,Chimia 58 (3) (2004) 93–99.
[8] C. Hansch, T. Fujita (Eds.), Classical and Three-Dimensional QSAR in Agrochem-istry, ACS Symp. Ser. 606, Washington, DC, 1995.
[9] R.E.Banks, B.E.Smart, J.C.Tatlow (Eds.), Organofluorine Chemistry: Principles andCommercial Applications, Plenum Press, New York, 1994.
[10] M. Hudlicky, A.E. Pavlath (Eds.), Chemistry of Organic Fluorine Compounds II, ACritical Review, ACS Monogr. 187, 1995, Washington, DC
[11] P.H. Olesen, The use of bioisosteric groups in lead optimization, Curr. Opin. DrugDisc. Dev. 4 (2001) 471–478.
[12] B. Langlois, Organofluorine Chemistry: Principles and Commercial Applications, in:R.E. Banks, B.E. Smart, J.C. Tatlow (Eds.), Plenum Press, New York, 1994,pp. 221–235.
2 [Note of the Editor: The effects of fluoro-organics on plants and organisms are presented in details
in this series by A. W. Davison and L. H. Weinstein.]
Fluorine-Containing Agrochemicals 167

[13] R.J. Alberts, E.C. Kooymann, Halogenation of aromatics. IX. Vapor-phase chlorin-ation and bromination of benzotrifluoride, Recl. Trav. Chim. Pays-Bas. 83 (8) (1964)930–936.
[14] N. Ishikawa, Aromatic fluorine compounds as intermediates for pharmaceuticals,agrochemicals and dyes, Senryo to Yakuhin 26 (6) (1981) 106–113.
[15] C.L. Coon, M.E. Hill, US Patent 3,714,272, 1973.[16] M.B. Green, G.S. Hartley, T.F. West, Chemicals for Crop Protection and Pest Con-
trol, 3rd edition, Pergamon Press, Oxford, 1987.[17] G.W. Probst, W.H. Wright, Herbicides, Chemistry, Degradation, and Mode of Action,
P.C. Kearney, D.D. Kaufman, (Eds.), Marcel Dekker, New York, 1975, p. 453.[18] G.T. Newbold, Organofluorine chemicals and their industrial applications, in:
R.E. Banks, (Ed.), Society of Chemical Industry, Ellis Horwood LTD, Chichester,England, 1979, p. 173.
[19] E. Kuhle, E. Klauke, Fluorinated isocyanates and their derivatives as intermediatesfor biologically active compounds, Angew. Chem., Int. Ed. Engl. 16 (1977) 735.
[20] M. Matringe, J.M. Camadro, R. Labbe, R. Scalla, Protoporphyrinogen oxidase as amolecular target for diphenyl ether herbicides, Biochem. J. 260 (1989) 231–235.
[21] F.E. Dayan, S.O. Duke, Herbicide Activity: Toxicology, Biochemistry and MolecularBiology, R.M. Roe, J.D. Burton, R.J. Kuhr (Eds.), IOS Press, Amsterdam, 1997,pp. 11–35.
[22] H.F. Wilson, D.H. McRae, US Patent 3,080,225, 1963.[23] R.J. Theissen, US Patent 3,652,645, 1972.[24] R.Y. Yih, C. Swithenbank, New potent diphenyl ether herbicides, J. Agric. Food
Chem. 23 (3) (1975) 592–593.[25] W.O. Johnson, G.E. Kollman, C. Swithenbank, R.Y. Yih, RH-6201 (Blazer): a new
broad spectrum herbicide for postemergence use in soybeans, J. Agric. Food Chem.26 (1) (1978) 285–286.
[26] H.O. Bayer, R.Y. Yih, US Patent 3,928, 416, 1975.[27] H.O. Bayer, R.Y. Yih, US Patent 3,798, 276, 1974.[28] R.D. Clark, Porphyric Pesticides: Chemistry, Toxicology, and Pharmaceutical Ap-
plications, S.O. Duke, C.A. Rebeiz (Eds.), ACS Symp. Ser. 559, Washington, DC,1994, pp. 34–47.
[29] W.O. Johnson, US Patent 4,031,131, 1997.[30] G. Sandman, P. Boger, in: R.M. Roe, J.D. Burton, R.J. Kuhr (Eds.), Herbicide Ac-
tivity: Toxicology, Biochemistry and Molecular Biology, IOS Press, Amsterdam,1997, pp. 1–10.
[31] G.Sandman, P.Boger (Eds.), Target Sites of Herbicide Action, CRC Press,Boca Raton, FL, 1989.
[32] E.G. Teach, US Patent 4,069,038, 1978.[33] F.X. Woolard, Synthesis and Chemistry of Agrochemicals III, D.R. Baker,
J.G. Fenyes, J.J. Steffens (Eds.), ACS Symp. Ser 504, Washington, DC, 1992,pp. 81–90.
[34] C.F.A. Kyndt, M.T.F. Turner, J. Rognon, Proc. Br. Prot. Conf. Weeds 1 (1985)29–34.
[35] F. Reicheneder, R. Kropp, A. Fischer, US Patent 3,697,522, 1972.[36] C.E. Ward, US Patent 4,568,376, 1986.[37] D.D. Rogers, B.W. Kirby, J.C. Hulbert, M.E. Bledsoe, L.V. Hill, A. Omid, C.E. Ward,
Proc. Br. Prot. Conf. Weeds 1 (1987) 69–75.[38] C.E. Ward, W.C. Lo, P.B. Pomidor, F.E. Tisdell, A.W.W. Ho, C.-L. Chiu, D.M. Tuck,
C.B. Bernardo, P.J. Fong, A. Omid, K.A. Buteau, Synthesis and Chemistry of Agro-chemicals, D.R. Baker, J.G. Fenyes, W.K. Moberg, B. Cross (Eds.), ACS Symp.Ser. 355, Washington, DC, 1987, pp. 65–73.
[39] B.M. Luscombe, K.E. Pallet, P. Loubiere, J.C. Millet, J. Melgarejo, T.E. Vrabel, Proc.Br. Prot. Conf. Weeds 1 (1995) 35.
G. Theodoridis168

[40] K.E. Pallet, S.M. Cramp, J.P. Little, P. Veerasekaran, A.J. Crudace, A.E. Slater,Isoxaflutole: the background of its discovery and the basis of its herbicidal prop-erties, Pest Manage. Sci. 57 (2) (2001) 133.
[41] F. Colliot, K.A. Kukorowski, D.W. Hawkins, D.A. Roberts, BCPC Conf. Pests Dis. 1(1992) 29.
[42] J.R. Bloomquist, Ion channels as targets for insecticides, Annu. Rev. Entomol. 41(1996) 163–190.
[43] M. Casado, L-R. Pierre, V. Pevere, EP 668,269, 1995.[44] K.K. Ngim, S.A. Mabury, D.G. Crosby, Elucidation of fipronil photodegradation
pathways, J. Agric. Food Chem. 48 (2000) 4661–4665.[45] K.A. Hassall, The Chemistry of Pesticides, Macmillan, London, 1982, p. 164.[46] W. Mass, R. van Hes, A.C. Grosscurt, D.H. Deul, in: R. Wedler, (Ed.), Chemie der
Pfalnzenschutz- und Schadlingsbekampfungsmittel, Band 6, Springer, Berlin, 1981,p. 424.
[47] J.J. van Daalen, J. Meltzer, R. Mulder, K. Wellinga, Selective insecticide with a novelmode of action, Naturwissenschaften 59 (7) (1972) 312–313.
[48] M. Anderson, EP 161,019, 1985.[49] J.H. Kim, Y.W. Shin, J.N. Heo, E.D. Kim, J.S. Park, H.S. Song, WO 98/00394, 1998.[50] D. Cartwright, D.J. Collins, EP 3,416, 1979.[51] E. Sugden, K. Williams, D. Sammataro, Fluvalinate – use it right or lose it, Bee
Culture 123 (2) (1995) 80–81.[52] J.A. Frank, P.L. Sanders, BCPC Conf. Pests Dis. 2 (1994) 871–876.[53] P. Margot, F. Huggenberger, J. Amrein, B. Weiss, BCPC Conf. Pests Dis. 2 (1998)
375–382.[54] P.A. Worthington, Synthesis and Chemistry of Agrochemicals, D.R. Baker,
J.G. Fenyes, W.K. Moberg, B. Cross (Eds.), ACS Symp. ser. 355, Washington,DC, 1987, pp. 302–317.
[55] A. Nakata, Proc. 5th Cong. Pest. Chem. Abs. No. 116-9, Kyoto, 1982.[56] K. Ikura, K. Katsuura, A. Nakada, M. Mizuno, US Patent 4,208,411, 1980.[57] K.H. Buchel, F. Grewe, H. Kaspers, British Patent 1,237,509, 1971.[58] M. Wilcox, I.Y. Chen, P.C. Kennedy, Y.Y. Li, L.R. Kincaid, N.T. Helseth, Proc. Plant
Growth Regul. Working Group 4 (1997) 194.[59] M. Wilcox, US Patent 4,169,721, 1979.[60] D.J. Bowler, I.D. Entwistle, A.J. Porter, BCPC Conf. Pests Dis. 2 (1984) 397.[61] B.A. Dreikorn, G.O.P. O’Doherty, A.J. Clinton, K.E. Kramer, BCPC Conf. Pests Dis.
2 (1979) 491.[62] B.A. Dreikorn, G.O.P. O’Doherty, in: P.S. Magee, G.K. Kohn, J.J. Menn (Eds.),
Pesticide Synthesis Through Rational Approaches, American Chemical Society,Washington, DC, 1983, pp. 45–63.
[63] D.E. Burton, A.J. Lambie, J.C.L. Ludgate, G.T. Newbold, A. Percival, D.T. Saggers,2-Trifluoromethylbenzimidazoles: a new class of herbicidal compounds, Nature 208(5016) (1965) 1166–1169.
[64] R.K. Pfeiffer, 2nd Symp. New Herbicides, European Weed Research Council, 1965,pp. 19–28.
[65] G.O.P. Doherty, German Patent DE 2,165,021, 1972.[66] H.F.W. Rochling, K-H. Buchel, F.W.A. Korte, US Patent 3,459,759, 1969.[67] K.-H. Buchel, F.W.A. Korte, R.B. Beechey, Uncoupling of the oxidative phosphor-
ylation in mitochondria by NH-acidic benzimidazoles, Angew. Chem., Int. Ed. Engl. 4(1965) 788–789.
[68] R.B. Beechey, The uncoupling of respiratory-chain phosphorylation by 4,5,6,7-tet-rachloro-2-trifluoromethylbenzimidazole, Biochem. J. 98 (1) (1966) 284–289.
[69] S.O. Duke, C.A. Rebeiz (Eds.), Porphyric Pesticides: Chemistry, Toxicology,and Pharmaceutical Applications, in ACS Symp. Ser. 559, Washington, DC,1994.
Fluorine-Containing Agrochemicals 169
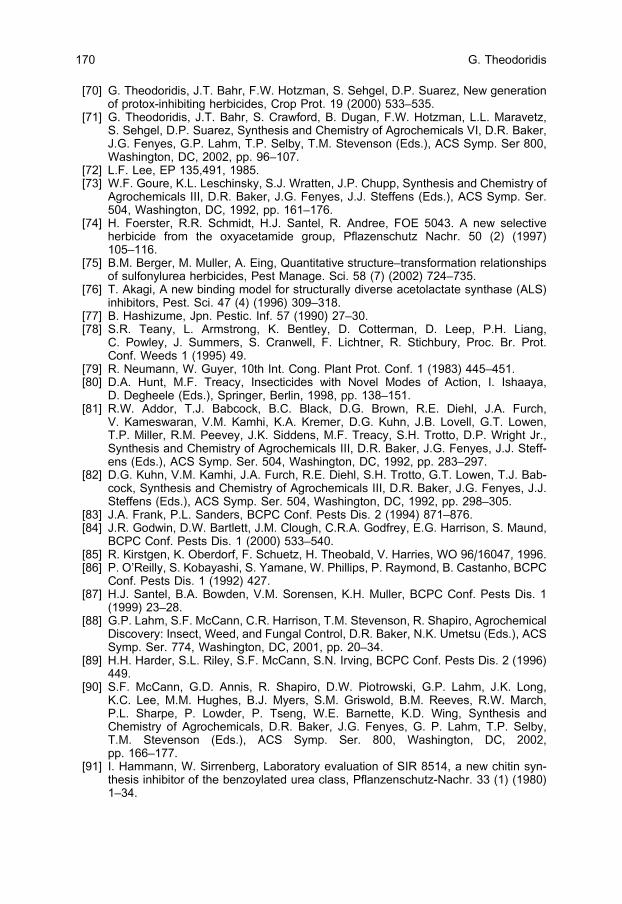
[70] G. Theodoridis, J.T. Bahr, F.W. Hotzman, S. Sehgel, D.P. Suarez, New generationof protox-inhibiting herbicides, Crop Prot. 19 (2000) 533–535.
[71] G. Theodoridis, J.T. Bahr, S. Crawford, B. Dugan, F.W. Hotzman, L.L. Maravetz,S. Sehgel, D.P. Suarez, Synthesis and Chemistry of Agrochemicals VI, D.R. Baker,J.G. Fenyes, G.P. Lahm, T.P. Selby, T.M. Stevenson (Eds.), ACS Symp. Ser 800,Washington, DC, 2002, pp. 96–107.
[72] L.F. Lee, EP 135,491, 1985.[73] W.F. Goure, K.L. Leschinsky, S.J. Wratten, J.P. Chupp, Synthesis and Chemistry of
Agrochemicals III, D.R. Baker, J.G. Fenyes, J.J. Steffens (Eds.), ACS Symp. Ser.504, Washington, DC, 1992, pp. 161–176.
[74] H. Foerster, R.R. Schmidt, H.J. Santel, R. Andree, FOE 5043. A new selectiveherbicide from the oxyacetamide group, Pflazenschutz Nachr. 50 (2) (1997)105–116.
[75] B.M. Berger, M. Muller, A. Eing, Quantitative structure–transformation relationshipsof sulfonylurea herbicides, Pest Manage. Sci. 58 (7) (2002) 724–735.
[76] T. Akagi, A new binding model for structurally diverse acetolactate synthase (ALS)inhibitors, Pest. Sci. 47 (4) (1996) 309–318.
[77] B. Hashizume, Jpn. Pestic. Inf. 57 (1990) 27–30.[78] S.R. Teany, L. Armstrong, K. Bentley, D. Cotterman, D. Leep, P.H. Liang,
C. Powley, J. Summers, S. Cranwell, F. Lichtner, R. Stichbury, Proc. Br. Prot.Conf. Weeds 1 (1995) 49.
[79] R. Neumann, W. Guyer, 10th Int. Cong. Plant Prot. Conf. 1 (1983) 445–451.[80] D.A. Hunt, M.F. Treacy, Insecticides with Novel Modes of Action, I. Ishaaya,
D. Degheele (Eds.), Springer, Berlin, 1998, pp. 138–151.[81] R.W. Addor, T.J. Babcock, B.C. Black, D.G. Brown, R.E. Diehl, J.A. Furch,
V. Kameswaran, V.M. Kamhi, K.A. Kremer, D.G. Kuhn, J.B. Lovell, G.T. Lowen,T.P. Miller, R.M. Peevey, J.K. Siddens, M.F. Treacy, S.H. Trotto, D.P. Wright Jr.,Synthesis and Chemistry of Agrochemicals III, D.R. Baker, J.G. Fenyes, J.J. Steff-ens (Eds.), ACS Symp. Ser. 504, Washington, DC, 1992, pp. 283–297.
[82] D.G. Kuhn, V.M. Kamhi, J.A. Furch, R.E. Diehl, S.H. Trotto, G.T. Lowen, T.J. Bab-cock, Synthesis and Chemistry of Agrochemicals III, D.R. Baker, J.G. Fenyes, J.J.Steffens (Eds.), ACS Symp. Ser. 504, Washington, DC, 1992, pp. 298–305.
[83] J.A. Frank, P.L. Sanders, BCPC Conf. Pests Dis. 2 (1994) 871–876.[84] J.R. Godwin, D.W. Bartlett, J.M. Clough, C.R.A. Godfrey, E.G. Harrison, S. Maund,
BCPC Conf. Pests Dis. 1 (2000) 533–540.[85] R. Kirstgen, K. Oberdorf, F. Schuetz, H. Theobald, V. Harries, WO 96/16047, 1996.[86] P. O’Reilly, S. Kobayashi, S. Yamane, W. Phillips, P. Raymond, B. Castanho, BCPC
Conf. Pests Dis. 1 (1992) 427.[87] H.J. Santel, B.A. Bowden, V.M. Sorensen, K.H. Muller, BCPC Conf. Pests Dis. 1
(1999) 23–28.[88] G.P. Lahm, S.F. McCann, C.R. Harrison, T.M. Stevenson, R. Shapiro, Agrochemical
Discovery: Insect, Weed, and Fungal Control, D.R. Baker, N.K. Umetsu (Eds.), ACSSymp. Ser. 774, Washington, DC, 2001, pp. 20–34.
[89] H.H. Harder, S.L. Riley, S.F. McCann, S.N. Irving, BCPC Conf. Pests Dis. 2 (1996)449.
[90] S.F. McCann, G.D. Annis, R. Shapiro, D.W. Piotrowski, G.P. Lahm, J.K. Long,K.C. Lee, M.M. Hughes, B.J. Myers, S.M. Griswold, B.M. Reeves, R.W. March,P.L. Sharpe, P. Lowder, P. Tseng, W.E. Barnette, K.D. Wing, Synthesis andChemistry of Agrochemicals, D.R. Baker, J.G. Fenyes, G. P. Lahm, T.P. Selby,T.M. Stevenson (Eds.), ACS Symp. Ser. 800, Washington, DC, 2002,pp. 166–177.
[91] I. Hammann, W. Sirrenberg, Laboratory evaluation of SIR 8514, a new chitin syn-thesis inhibitor of the benzoylated urea class, Pflanzenschutz-Nachr. 33 (1) (1980)1–34.
G. Theodoridis170
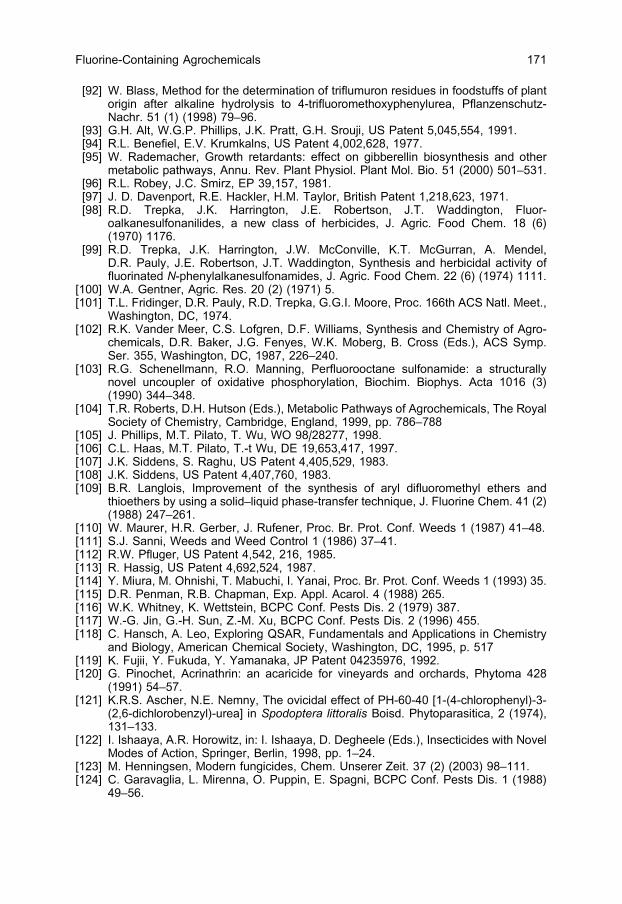
[92] W. Blass, Method for the determination of triflumuron residues in foodstuffs of plantorigin after alkaline hydrolysis to 4-trifluoromethoxyphenylurea, Pflanzenschutz-Nachr. 51 (1) (1998) 79–96.
[93] G.H. Alt, W.G.P. Phillips, J.K. Pratt, G.H. Srouji, US Patent 5,045,554, 1991.[94] R.L. Benefiel, E.V. Krumkalns, US Patent 4,002,628, 1977.[95] W. Rademacher, Growth retardants: effect on gibberellin biosynthesis and other
metabolic pathways, Annu. Rev. Plant Physiol. Plant Mol. Bio. 51 (2000) 501–531.[96] R.L. Robey, J.C. Smirz, EP 39,157, 1981.[97] J. D. Davenport, R.E. Hackler, H.M. Taylor, British Patent 1,218,623, 1971.[98] R.D. Trepka, J.K. Harrington, J.E. Robertson, J.T. Waddington, Fluor-
oalkanesulfonanilides, a new class of herbicides, J. Agric. Food Chem. 18 (6)(1970) 1176.
[99] R.D. Trepka, J.K. Harrington, J.W. McConville, K.T. McGurran, A. Mendel,D.R. Pauly, J.E. Robertson, J.T. Waddington, Synthesis and herbicidal activity offluorinated N-phenylalkanesulfonamides, J. Agric. Food Chem. 22 (6) (1974) 1111.
[100] W.A. Gentner, Agric. Res. 20 (2) (1971) 5.[101] T.L. Fridinger, D.R. Pauly, R.D. Trepka, G.G.I. Moore, Proc. 166th ACS Natl. Meet.,
Washington, DC, 1974.[102] R.K. Vander Meer, C.S. Lofgren, D.F. Williams, Synthesis and Chemistry of Agro-
chemicals, D.R. Baker, J.G. Fenyes, W.K. Moberg, B. Cross (Eds.), ACS Symp.Ser. 355, Washington, DC, 1987, 226–240.
[103] R.G. Schenellmann, R.O. Manning, Perfluorooctane sulfonamide: a structurallynovel uncoupler of oxidative phosphorylation, Biochim. Biophys. Acta 1016 (3)(1990) 344–348.
[104] T.R. Roberts, D.H. Hutson (Eds.), Metabolic Pathways of Agrochemicals, The RoyalSociety of Chemistry, Cambridge, England, 1999, pp. 786–788
[105] J. Phillips, M.T. Pilato, T. Wu, WO 98/28277, 1998.[106] C.L. Haas, M.T. Pilato, T.-t Wu, DE 19,653,417, 1997.[107] J.K. Siddens, S. Raghu, US Patent 4,405,529, 1983.[108] J.K. Siddens, US Patent 4,407,760, 1983.[109] B.R. Langlois, Improvement of the synthesis of aryl difluoromethyl ethers and
thioethers by using a solid–liquid phase-transfer technique, J. Fluorine Chem. 41 (2)(1988) 247–261.
[110] W. Maurer, H.R. Gerber, J. Rufener, Proc. Br. Prot. Conf. Weeds 1 (1987) 41–48.[111] S.J. Sanni, Weeds and Weed Control 1 (1986) 37–41.[112] R.W. Pfluger, US Patent 4,542, 216, 1985.[113] R. Hassig, US Patent 4,692,524, 1987.[114] Y. Miura, M. Ohnishi, T. Mabuchi, I. Yanai, Proc. Br. Prot. Conf. Weeds 1 (1993) 35.[115] D.R. Penman, R.B. Chapman, Exp. Appl. Acarol. 4 (1988) 265.[116] W.K. Whitney, K. Wettstein, BCPC Conf. Pests Dis. 2 (1979) 387.[117] W.-G. Jin, G.-H. Sun, Z.-M. Xu, BCPC Conf. Pests Dis. 2 (1996) 455.[118] C. Hansch, A. Leo, Exploring QSAR, Fundamentals and Applications in Chemistry
and Biology, American Chemical Society, Washington, DC, 1995, p. 517[119] K. Fujii, Y. Fukuda, Y. Yamanaka, JP Patent 04235976, 1992.[120] G. Pinochet, Acrinathrin: an acaricide for vineyards and orchards, Phytoma 428
(1991) 54–57.[121] K.R.S. Ascher, N.E. Nemny, The ovicidal effect of PH-60-40 [1-(4-chlorophenyl)-3-
(2,6-dichlorobenzyl)-urea] in Spodoptera littoralis Boisd. Phytoparasitica, 2 (1974),131–133.
[122] I. Ishaaya, A.R. Horowitz, in: I. Ishaaya, D. Degheele (Eds.), Insecticides with NovelModes of Action, Springer, Berlin, 1998, pp. 1–24.
[123] M. Henningsen, Modern fungicides, Chem. Unserer Zeit. 37 (2) (2003) 98–111.[124] C. Garavaglia, L. Mirenna, O. Puppin, E. Spagni, BCPC Conf. Pests Dis. 1 (1988)
49–56.
Fluorine-Containing Agrochemicals 171

[125] D.C. England, L.R. Melby, M.A. Dietrich, R.V. Lindsey, Nucleophilic reactions offluoroolefins, J. Am. Chem. Soc. 82 (19) (1960) 5116–5122.
[126] K. Gehmann, R. Nyfeler, A.J. Leadbeater, D. Nevill, D. Sossi, BCPC Conf. PestsDis. 2 (1990) 399.
[127] K. Arima, H. Imanaka, M. Kousaka, A. Fukuda, G. Tamura, Pyrrolnitrin, a newantibiotic. I. Isolation and properties of pyrrolnitrin, J. Antibiot., Ser. A 18 (5) (1965)201–204.
[128] P. Ackermann, H.-R. Kanel, B. Schaub, US Patent 5,514,816, 1996.[129] R. Nyfeler, P. Ackermann, Synthesis and Chemistry of Agrochemicals III,
D.R. Baker, J.G. Fenyes, J.J. Steffens (Eds.), ACS Symp. Ser. 504, Washington,DC, 1992, pp. 395–404.
[130] G. Theodoridis, US Patent 4,818,275, 1989.[131] W.A. Van Saun, J.T. Bahr, G.A. Crosby, Z.A. Fore, H.L. Guscar, W.N. Harnish,
R.S. Hooten, M.S. Marquez, D.S. Parrish, G. Theodoridis, J.M. Tymonko, K.R.Wilson, M.J. Wyle, Proc. Br. Prot. Conf. Weeds 1 (1991) 77.
[132] W.A. Van Saun, J.T. Bahr, L.J. Bourdouxhe, F.J. Gargantiel, F.W. Hotzman,S.W. Shires, N.A. Sladen, S.F. Tutt, K.R. Wilson, Proc. Br. Prot. Conf. Weeds 1(1993) 19.
[133] G. Theodoridis, J.S. Baum, F.W. Hotzman, M.C. Manfredi, L.L. Maravetz,J.W. Lyga, J.M. Tymonko, K.R. Wilson, K.M. Poss, M.J. Wyle, Synthesis andChemistry of Agrochemicals III, D.R. Baker, J.G. Fenyes, J.J. Steffens (Eds.), ACSSymp. Ser. 504, Washington, DC, 1992, pp. 134–146.
[134] H.J. Scholl, E. Klauke, F. Grewe, I. Hamman, British Patent 1,326,853, 1970.[135] P.H. Ogden, R.A. Mitsch, Isomerization of perfluoro-alpha, omega-bisazomethines,
J. Am. Chem. Soc. 89 (19) (1967) 5007–5011.[136] J.S. Moilliet, in: R.E. Banks, B.E. Smart, J.C. Tatlow (Eds.), Organofluorine Chem-
istry: Principles and Commercial Applications, Plenum Press, New York, 1994,pp. 195–219.
[137] G. Balz, G. Schiemann, Aromatic fluorine compounds. I. A new method for theirpreparation, Chem. Ber. 60 (1927) 1186.
[138] H. Suschitzky, The Balz–Schiemann reaction, Advances in Fluorine Chemistry 4(1965) 1–27.
[139] P. Osswald, O. Scherer, DE 600,706, 1934.[140] A.K. Barbour, L.J. Belf, M.W. Buxton, in: M. Stacey, J.C. Tatlow, A.G. Sharpe (Eds.),
Advances in Fluorine Chemistry, Butterworths, London, 1963, pp. 181–270.[141] L. Dolby-Glover, Halogen exchange – ‘new ions for old’, Chem. Ind. 15 (1986)
518–523.[142] G. Fuller, DE 2,902,877, 1979.[143] G.S. Lal, G.P. Pez, R.G. Syvret, Electrophilic NF fluorinating agents, Chem. Rev. 96
(5) (1996) 1737–1756.[144] J.S. Goudar, US Patent 6,218,545, 2001.[145] R.G. Syvret, W.J. Casteel Jr., G.S. Lal, J.S. Goudar, Selective fluorination of an aryl
triazolinone herbicide intermediate, J. Fluorine Chem. 125 (2004) 33–35.[146] H. Trozelli, Fluroxypyr – a new herbicide in cereals, Weeds and Weed Control 27 (1)
(1986) 65–75.[147] L.H. McKendry, US Patent 4,108,629, 1979.[148] S. Bowe, M. Landes, J. Best, G. Schmitz, M. Graben, Proc. Br. Prot. Conf. Weeds 1
(1999) 35–40.[149] K. Grossmann, Chemistry of Crop Protection, G. Voss, G. Ramos (Eds.), Wiley-
VCH, Weinheim, 2003, pp. 131–142.[150] G. Theodoridis, J.T. Bahr, B.L. Davidson, S.E. Hart, F.W. Hotzman, K.M. Poss,
S.F. Tutt, Synthesis and Chemistry of Agrochemicals IV, D.R. Baker, J.G. Fenyes,G.S. Basarab (Eds.), ACS Symp. Ser. 584, Washington, DC, 1995, pp. 90–99.
[151] A.R. Thomson, Proc. Br. Prot. Conf. Weeds 1 (1999) 73.
G. Theodoridis172

[152] W.A. Kleschick, C.M. Carson, M.J. Costales, J.J. Doney, B.C. Gerwick, J.B.Holtwick, R.W. Meikle, W.T. Monte, J.C. Little, N.R. Pearson, S.W. Snider,M.V. Subramanian, J.C. VanHeertum, A.P. Vinogradoff, Synthesis and Chemistryof Agrochemicals III, D.R. Baker, J.G. Fenyes, J.J. Steffens (Eds.), ACS Symp. Ser.504, Washington, DC, 1992, pp.17–25.
[153] A.C. Grosscurt, BCPC Conf. Pests Dis. 1 (1977) 141–147.[154] A. Verloop, C.D. Ferrell, Pesticide Chemistry in the 20th Century, J.R. Plimmer
(Ed.), ACS Symp. Ser. 37, Washington, DC, 1977, pp. 237–275.[155] S. Miyamoto, J. Suzuki, Y. Kikuchi, K. Toda, Y. Itoh, T. Ikeda, T. Ishida, Y. Hariya,
Y. Tsukidate, US Patent 5,141,948, 1992.[156] J. Suzuki, T. Ishida, Y. Kikuchi, Y. Ito, C. Morikawa, Y. Tsukidate, I. Tanji, Y. Ota,
K. Toda, Nihon Noyaku Gakkaishi, Synthesis and activity of novel acaricidal/insec-ticidal 2,4-diphenyl-1,3-oxazolines, J. Pest. Sci. 27 (1992) 1–8.
[157] M.A. Dekeyser, Acaricide mode of action, Pest Manage. Sci. 61 (2) (2005) 103–110.[158] W. Behrenz, A. Elbert, R. Fuchs, Cyfluthrin (FCR 1272) a new pyrethroid with long-
lasting activity for the control of public health and stored-product pests, Pflanzensc-hutz-Nachr. 36 (2) (1983) 127–176.
[159] K. Naumann, in: W.S. Bowers, W. Ebing, D. Martin, R. Wegeler (Eds.), Chemistry ofPlant Protection 4, Synthetic Pyrethroid Insecticides, Springer, Berlin, 1990, p. 43.
[160] R.J. Gouger, A.J. Neville, A.R. Jutsum, BCPC Conf. Pests Dis. 3 (1986) 1143–1150.[161] G.A. Meier, T.G. Cullen, S. McN. Sieburth, K.A. Boyler, S. Sehgel, D.P. Suarez,
A. Fritz, Synthesis and Chemistry of Agrochemicals IV, D.R. Baker, J.G. Fenyes,G.S. Basarab (Eds.), ACS Symp. Ser. 584, Washington, DC, 1995, pp. 236–244.
[162] S. McN. Sieburth, US Patent 4,709,068, 1989.[163] S. McN. Sieburth, C.N. Langevine, D.M. Dardaris, Organosilane insecticides. Part II:
chemistry and structure–activity relationships, Pest. Sci. 28 (1990) 309–319.[164] T.M. Fort, W.K. Moberg, BCPC Conf. Pests Dis. 2 (1984) 413.[165] M. Tsuda, H. Itoh, S. Kato, Systemic activity of simeconazole and its derivatives in
plants, Pest. Manage. Sci. 60 (2004) 881–886.[166] P.A. Worthington, Synthesis of 1,2,4-triazole compounds related to the fungicides
flutriafol and hexaconazole, Pest. Sci. 31 (4) (1991) 457–498.[167] E. Ammermann, F. Loecher, G. Lorenz, B. Janssen, S. Karbach, N. Meyer, BCPC
Conf. Pests Dis. 2 (1990) 407–414.[168] P.E. Russell, A. Percival, P.M. Coltman, D.E. Green, BCPC Conf. Pests Dis. 1
(1992) 411–418.[169] J.D. Davenport, R.E. Hackler, H.M. Taylor, British Patent 1,218,623, 1971.[170] D.W. Hollomon, I.E. Wheeler, K. Dixon, C. Longhurst, G. Skylalakis, Defining the
resistance risk of the new powdery mildew fungicide quinoxyfen, Pest. Sci. 51 (3)(1997) 347–351.
[171] M.J. Robson, R. Cheetham, D.J. Fettes, J. Crosby, BCPC Conf. Pests Dis. 3 (1984)853–857.
[172] H.J.H. Doel, A.R. Crossman, L.A. Bourdouxhe, Meded. Fac. Landbouwwet. Univ.Gent. 49 (1984) 929–937.
[173] R.K. Huff, British Patent, 2,000,764, 1980.[174] P.D. Bentley, R. Cheetham, R.K. Huff, R. Pascoe, J.D. Sayle, Fluorinated analogs of
chrysanthemic acid, Pest. Sci. 11 (2) (1980) 156–164.[175] R.F.S. Gordon, R. Pascoe, T. Enoyoshi, BCPC Conf. Pests Dis. 1 (1992) 81.[176] R. Salmon, WO 93/06089, 1993.[177] P.J. Crowley, G. Mitchell, R. Salmon, P.A. Worthington, Synthesis of some arylsulfur
pentafluoride pesticides and their relative activities compared to the trifluoromethylanalogues, Chimia 58 (3) (2004) 138–142.
[178] W.A. Sheppard, Arylsulfur trifluorides and pentafluorides, J. Am. Chem. Soc. 82(1960) 4751–4752.
[179] W.A. Sheppard, Arylsulfur pentafluorides, J. Am. Chem. Soc. 84 (1962) 3064.
Fluorine-Containing Agrochemicals 173

[180] A.G. Williams and N.R. Foster, WO 94/22817, 1994.[181] F.M. Carlini, S. Miteni, Aryl-sulfur pentafluorides: a new building-block generation for
life sciences applications, Chim. Oggi 21 (3/4) (2003) 14–16.[182] R.H. White, W.S. Clayton, Proc. Br. Prot. Conf. Weeds 1 (1999) 47–52.[183] S. Takamura, T. Okada, S. Fukuda, Y. Akiyoshi, F. Hoshide, E. Funaki, S. Sakai,
Proc. Br. Prot. Conf. Weeds 1 (1999) 41–46.[184] D.W. Kim, H.S. Chang, Y.K. Ko, J.W. Ryu, J.C. Woo, D.W. Koo, J.S. Kim, WO 2000/
05956, 2000.[185] H.-J. Wroblowsky, R. Thomas, WO 97/33876, 1997.[186] M. Schmitt, A. Van Almsick, R. Preuss, L. Willms, T. Auler, H. Bieringer,
F. Thuerwaechter, WO 2001/074785, 2001.[187] I. Yoshimura, M. Miyazaki, S. Suzuki, M. Nakaya, M. Tamaru, Y. Ono, T. Ida,
K. Yanagisawa, H. Sadohara, JP 11060562, 1999.[188] S.-J. Koo, J.-H. Cho, J.-S. Kim, S.-H. Kang, K.-G. Kang, D.-W. Kim, H.-S. Chang,
Y.-K. Ko, J.-W. Ryu, WO 02/30921, 2002.[189] D.S. Kim, S.J. Koo, J.N. Lee, K.H. Hwang, T.Y. Kim, K.G. Kang, K.S. Hwang,
G.H. Joe, J.H. Cho, D.W. Kim, Flucetosulfuron: a new sulfonylurea herbicide, BCPCInt. Cong.: Crop Sci. Technol., Glasgow 1 (2003) 87–92.
[190] R.J. Sbragis, G.W. Johnson, L.L. Karr, J.M. Edwards, B.M. Schneider, WO 98/19542, 1988.
[191] F. Obata, K. Fujii, A. Oaka, Y. Yamanaka, EP 665,225, 1995.[192] T. Mori, EP 1,004,569, 2000.[193] K. Ujihara, T. Iwasaki, EP 939,073, 1999.[194] T. Tadaaki, T. Koyanagi, M. Morita, T. Yoneda, C. Kagimoto, H. Okada, US Patent
5,360,806, 1994.[195] S. Saito, S. Isayama, N. Sakamoto, K. Umeda, K. Kasamatsu, BCPC Conf. Pests
Dis. 1 (2002) 33–38.[196] N. Sakamoto, S. Saito, T. Hirose, M. Suzuki, S. Matsuo, K. Izumi, T. Nagatomi,
H. Ikegami, K. Umeda, K. Tsushima, N. Matsuo, The discovery of pyridalyl: a novelinsecticidal agent for controlling lepidopterous pests, Pest Manage. Sci. 60 (1)(2004) 25.
[197] S. Isayama, S. Saito, K. Kuruda, K. Umeda, K. Kasamatsu, Pyridalyl, a novel in-secticide: potency and insecticidal selectivity, Arch. Insect Biochem. Physiol. 58 (4)(2005) 226–233.
[198] N. Takahashi, S. Gotoda, N. Ishil, Y. Sasama, US Patent 6,899,886, 2005.[199] M. Tohnishi, H. Nakao, E. Kohno, T. Nishida, T. Furuya, T. Shimizu, A. Seo,
K. Sakata, S. Fujioka, H. Kanno, EP 1,006,107, 1999.[200] M. Tohnishi, H. Nakao, T. Furuya, A. Seo, H. Kodama, K. Tsubata, S. Fujioka,
T. Hirooka, T. Nishimatsu, DC AGRO-9, Abstr. Pap., 230th ACS Natl. Meet.,Washington, DC, 2005.
[201] W. Andersch, D. Stubler, R. Fischer, U. Heinemann, W. Kramer, J. Konze,U. Wachendorff-Neumann, M. Jautelat, DE 10310906, 2004.
[202] J. Konze, W. Andersch, D. Stubler, R. Fischer, DE 10248257, 2004.[203] P. Lummen, U. Ebbinghaus-Kintscher, N. Lobitz, T. Schulte, C. Funke, R. Fische,
AGRO-25, Abstr. Pap., 230th ACS Natl Meet., Washington, DC, 2005.[204] M. Onishi, A. Yoshiura, E. Kohno, K. Tsubata, EP 1,006,102, 1999.[205] G.P. Lahm, T.P. Selby, J.H. Freudenberger, T.M. Stevenson, B.J. Myers,
G. Seburyamo, B.K. Smith, L. Flexner, C.E. Clark, D. Cordova, Insecticidal ant-hranilic diamides: a new class of potent ryanodine receptor activators, Bioorg. Med.Chem. Lett. 15 (22) (2005) 4898–4906.
[206] D. Cordoba, E.A. Benner, M.D. Sacher, J.J. Rauh, J.S. Sopa, G.P. Lahm,T.P. Selby, T.M. Stevenson, L. Flexner, S. Gutteridge, D.F. Rhades, L. Wu,R.M. Sith, Y. Tao, AGRO (late addition, paper not included in Abstracts), 230th ACSNatl. Meet., Washington, DC, 2005.
G. Theodoridis174

[207] K. Takagi, T. Ohtani, T. Nishida, H. Hamaguchi, T. Nishimatsu, A. Kanaoka, EP462,456, 1991.
[208] M.J. Henry, G.D. Gustafson, in: G. Voss, G. Ramos (Eds.), Chemistry of CropProtection, Wiley-VCH, Weinheim, 2003, pp. 89–98.
[209] Agro Reports 2004, New Developments in Fungicides.[210] I. Kasahara, H. Ooka, S. Sano, H. Hosokawa, H. Yamanaka, US Patent 5,847,005,
1998.[211] U. Heinemann, H. Gayer, P. Gerdes, B.-W. Kruger, B. Gallenkamp, U. Stelzer,
A. Marhold, R. Tiemann, S. Dutzmann, G. Hanssler, K. Stenzel, WO 97/27189,1997.
[212] U. Heinemann, H. Gayer, P. Gerdes, B.-W. Kruger, B. Gallenkamp, U. Stelzer,A. Marhold, R. Tiemann, S. Dutzmann, G. Hanssler, K. Stenzel, US Patent6,103,717, 2000.
[213] S. Dutzmann, A. Maulet-Machnik, F. Kerz-Mohlendick, J. Applegate, U. Heinemann,BCPC Conf. Pests Dis. 1 (2002) 365.
[214] C.H.L. Liu, W.C.H. Liu, Z.C.H. Li, BCPC Conf. Pests Dis. 2 (2000) 549–556.[215] T. Hamada, T. Takeyama, JP 187786, 2001.[216] H. Suzuki, M. Hasunuma, JP 2005082479, 2005.[217] B.A. Moloney, D. Hardy, E.A. Saville-Stones, WO 99/42447, 1999.[218] H. Katsuta, S. Ishii, K. Tomiya, K. Kodaka, US Patent 6,239,282, 2001.[219] K. Tomiya, Y. Yanase, BCPC Int. Cong.: Crop Sci. Technol., Glasgow, 1 (2003)
99–104.[220] Y. Miyake, J. Sakai, I. Miura and K. Nagayama, BCPC Int. Cong.: Crop Sci. Tech-
nol., Glasgow, 1 (2003) 105–112.[221] M. Reuveni, Activity of the new fungicide benthiavalicarb against Plasmopara
viticola and its efficacy in controlling downy mildew in grapevines, Eur. J. PlantPathol. 109 (3) (2003) 243–251.
[222] H. Mizutani, J. Suzuki, Y. Saito, M. Ikeda, A. Yagi, Residue analysis of the fungicidebenthiavalicarb-isopropyl and its degradation products in upland field soil, J. Pest.Sci. 29 (2004) 87–95.
[223] W.R. Dolbier, Fluorine chemistry at the millennium, J. Fluorine Chem. 126 (2005)157–163.
[224] S.J. Tavener, J.H. Clark, Can fluorine chemistry be green chemistry? J. FluorineChem. 123 (2003) 31–36.
[225] P.T. Nyffeler, S.G. Duron, M.D. Burkart, S.P. Vincent, C.-H. Wong, Selectfluor:mechanistic insight and applications, Angew. Chem., Int. Ed. Engl. 44 (2005)192–212.
[226] B.D. Key, R.D. Howell, C.S. Criddle, Fluorinated organics in the biosphere, Environ.Sci. Technol. 31 (9) (1997) 2445–2454.
[227] L.H. Weinstein, A.W. Davison (Eds.), Fluorides in the Environment: Effects onPlants and Animals, CABI Publishing, Wallingford, UK, 2004.
[228] T.F.X. Collins, R.L. Sprando, Fluoride-toxic and pathologic aspects: review of cur-rent literature on some aspects of fluoride toxicity, Rev. Food Nutr. Toxicity 4 (2005)105–141.
Fluorine-Containing Agrochemicals 175

This page intentionally left blank
176

CHAPTER 5
Fluorine: Friend or Foe? A Green Chemist’sPerspective
Stewart J. Tavener,� and James H. Clark
Clean Technology Centre, Department of Chemistry, University of York, Heslington, York
YO10 5DD, UK
Contents
1. Introduction 177
2. The fluorosphere 178
3. The role of fluorine compounds in clean synthesis 187
3.1. Fluorous separation technologies 187
3.2. The use of fluorinated groups in supercritical CO2 191
3.3. Safe fluorination with F2 using microreactor technology 193
3.4. Comparison of synthetic routes to fluoroaromatics 194
4. Fluorochemicals facilitate miniaturisation of end-products 197
5. Conclusions 199
Acknowledgements 199
References 199
AbstractThe contribution of fluorine chemistry to the field of clean chemical technology is reviewed.
The roles of fluorochemicals in the environment and the ways in which they may be
involved in inherently ‘greener’ processes are discussed.
1. INTRODUCTION
A great deal has been written in recent years about clean chemical technology or
green chemistry, and the role of the ‘green’ chemist is to find workable and
economically attainable solutions for the chemical industry with the minimum
impact on our environment. An important axiom of green chemistry is that an
inherently efficient process is greatly preferable to treatment or recycling of waste
[1]. A ‘green’ process should have the smallest possible burden on the environ-
ment and, in general, this means using renewable resources where possible,
ensuring that the atom economy of the process is high – i.e. as much of the
substrate and reagents as possible find their way into the final product – and that
�Corresponding author. Email: [email protected];
FLUORINE AND THE ENVIRONMENT, VOLUME 2
ISSN 1872-0358 DOI: 10.1016/S1872-0358(06)02005-7
r 2006 Elsevier B.V.All rights reserved
177

the use of auxiliary compounds such as solvents and promoters is minimised or
eliminated. Frequently, the conclusions are the same as those that would be
reached from an economic point of view: less substrate, fewer reagents, less
solvent and a consequent reduction in energy requirement will all contribute to
financial savings. Fluorine chemistry has an important role to play in clean tech-
nology, in catalyst, solvent and manufacturing technologies, as well as several
other areas [2]. Fluorine is a very light element with extreme electronic properties,
and provides excellent value in terms of activity-per-gram. It is also recognised
that fluorochemicals are frequently more effective and are required in smaller
quantities than non-fluorinated compounds – in the case of fluorine, ‘small is
beautiful’. High effect, low dosage fluorinated formulations allow reductions in the
use of materials and energy all along the production and supply chain: fewer non-
renewable feedstocks are consumed, transport and packaging are reduced, and
the quantity of post-consumer waste is minimised. However, fluorochemicals
have also been involved in some of the more negative aspects of the chemical
industry. In this review, we consider the effects of fluorine and fluorochemicals in
the environment, their position in industry, and describe some of the ways in
which they are involved in clean chemical technology.
2. THE FLUOROSPHERE
Readers of this volume may already be more aware than many of the extent to
which we are surrounded by the element fluorine. It is present in the air we
breathe, the water we drink and the rocks beneath us, as well as in numerous
synthetic polymers, pharmaceuticals, agrochemicals and other formulations.
Fluorine in the atmosphere, oceans, biosphere and crust might be grouped
together as the fluorosphere (Fig. 1), and, in order to understand the effects of
human activities on the environment, it is worthwhile briefly considering the res-
ervoirs and flux of fluorine compounds, both natural and anthropogenic, which
occur around us [3,4].1
Fluorine is the 13th most abundant element on the planet, and is found in
significant quantities in the oceans, atmosphere and in the Earth’s crust (Table 1).
Human beings are fluorine-enriched organisms, with a concentration of 37 ppm,
significantly higher than that of seawater. This equates to 2.6 g for an average
70 kg person, which implies that the human race, with a population of 6000
million, is currently carrying a mass of 15,600 tonne of fluorine.2 The distribution
of fluorine is significantly affected by human activity, and organofluorine
1 The role of fluorine in the environment has been reviewed in detail elsewhere – see Ref. [3].2 One observer has commented that the average fluorine chemist may contain considerably more
than this value! Population data from U.S. Census, for the year 1999.
Stewart J. Tavener and James H. Clark178
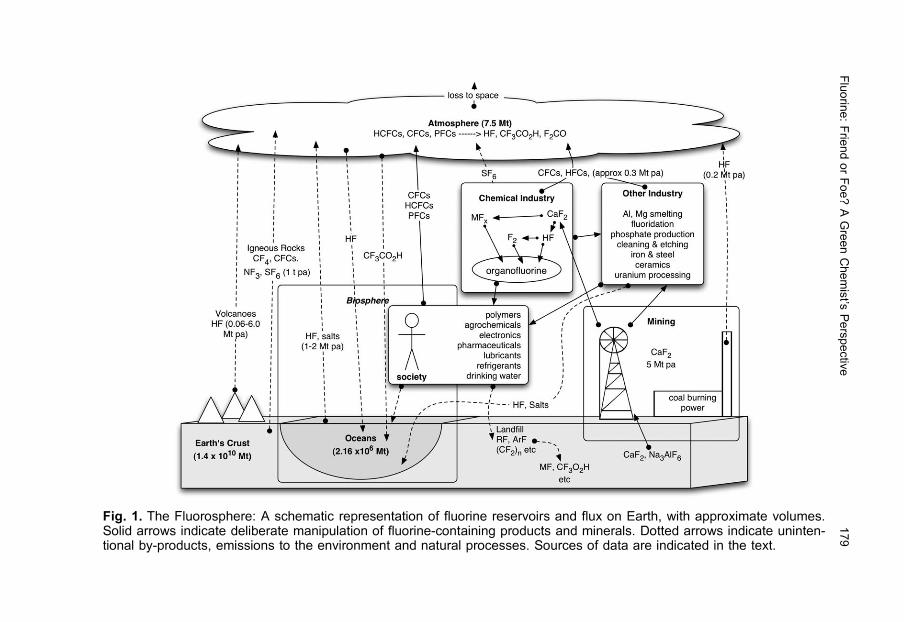
Fig. 1. The Fluorosphere: A schematic representation of fluorine reservoirs and flux on Earth, with approximate volumes.Solid arrows indicate deliberate manipulation of fluorine-containing products and minerals. Dotted arrows indicate uninten-tional by-products, emissions to the environment and natural processes. Sources of data are indicated in the text.
Fluorin
e:Frie
ndorFoe?AGreenChemist’s
Perspective
179
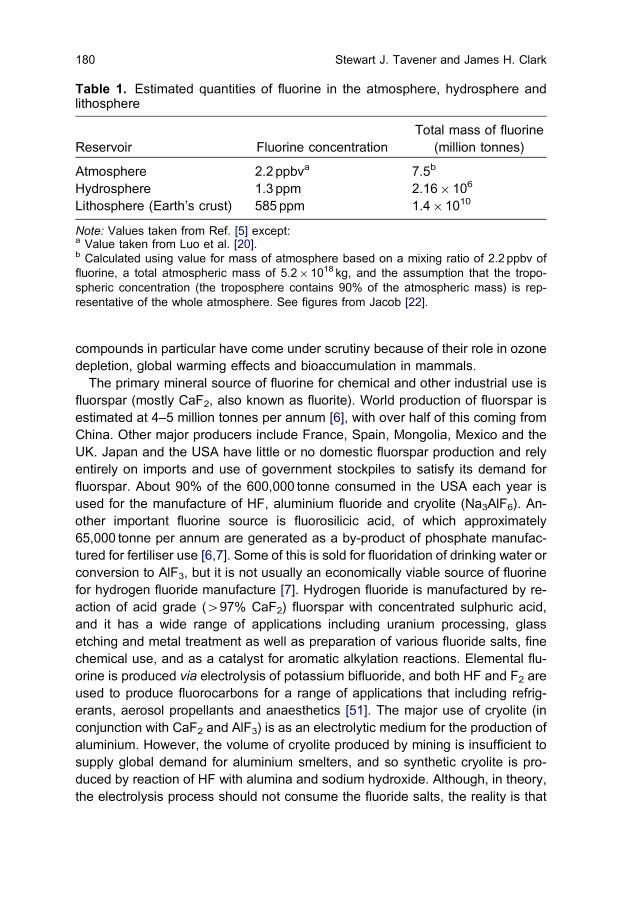
compounds in particular have come under scrutiny because of their role in ozone
depletion, global warming effects and bioaccumulation in mammals.
The primary mineral source of fluorine for chemical and other industrial use is
fluorspar (mostly CaF2, also known as fluorite). World production of fluorspar is
estimated at 4–5 million tonnes per annum [6], with over half of this coming from
China. Other major producers include France, Spain, Mongolia, Mexico and the
UK. Japan and the USA have little or no domestic fluorspar production and rely
entirely on imports and use of government stockpiles to satisfy its demand for
fluorspar. About 90% of the 600,000 tonne consumed in the USA each year is
used for the manufacture of HF, aluminium fluoride and cryolite (Na3AlF6). An-
other important fluorine source is fluorosilicic acid, of which approximately
65,000 tonne per annum are generated as a by-product of phosphate manufac-
tured for fertiliser use [6,7]. Some of this is sold for fluoridation of drinking water or
conversion to AlF3, but it is not usually an economically viable source of fluorine
for hydrogen fluoride manufacture [7]. Hydrogen fluoride is manufactured by re-
action of acid grade (497% CaF2) fluorspar with concentrated sulphuric acid,
and it has a wide range of applications including uranium processing, glass
etching and metal treatment as well as preparation of various fluoride salts, fine
chemical use, and as a catalyst for aromatic alkylation reactions. Elemental flu-
orine is produced via electrolysis of potassium bifluoride, and both HF and F2 are
used to produce fluorocarbons for a range of applications that including refrig-
erants, aerosol propellants and anaesthetics [51]. The major use of cryolite (in
conjunction with CaF2 and AlF3) is as an electrolytic medium for the production of
aluminium. However, the volume of cryolite produced by mining is insufficient to
supply global demand for aluminium smelters, and so synthetic cryolite is pro-
duced by reaction of HF with alumina and sodium hydroxide. Although, in theory,
the electrolysis process should not consume the fluoride salts, the reality is that
Table 1. Estimated quantities of fluorine in the atmosphere, hydrosphere andlithosphere
Reservoir Fluorine concentration
Total mass of fluorine
(million tonnes)
Atmosphere 2.2 ppbva 7.5b
Hydrosphere 1.3 ppm 2.16� 106
Lithosphere (Earth’s crust) 585 ppm 1.4�1010
Note: Values taken from Ref. [5] except:a Value taken from Luo et al. [20].b Calculated using value for mass of atmosphere based on a mixing ratio of 2.2 ppbv of
fluorine, a total atmospheric mass of 5.2� 1018 kg, and the assumption that the tropo-
spheric concentration (the troposphere contains 90% of the atmospheric mass) is rep-
resentative of the whole atmosphere. See figures from Jacob [22].
Stewart J. Tavener and James H. Clark180

the fluoride reacts with the carbon electrodes to form perfluorocarbons (CF4
and C2F6), and this is a significant source of PFC emissions [8,9]. On average,
about 21 kg of fluoride salts are consumed for every tonne of aluminium metal
produced. Recent advances in the efficiency of smelters should improve this
situation; older equipment requires 40 kg/tonne, while newer smelters may re-
quire as little as 10 kg/tonne of aluminium metal, although the time lag in replacing
plants means that the effect of the change on environmental burden will be
slow [6,7].
Fluorinated compounds are utilised in other metallurgical processes. CaF2 is
used directly as a flux to lower the melting point of slag in iron production [6].
Sulphur hexafluoride is used as a blanket gas during magnesium smelting to
ensure that reoxidation does not occur. However, it is one of the most potent
greenhouse gases known, with a global warming potential (GWP) of 23,900 times
that of CO2 [8], and is therefore now being replaced with HFCs and PFCs in this
application. Draft EU regulations will ban the use of SF6 in magnesium casting
industry where the annual consumption is greater than 850 kg. SF6 is also used
as an electrical insulator in switch gear, with an estimated 500 tonne currently
in use in the UK [10]. SF5CF3 is also used for this purpose. Emissions from
this source are expected to rise as existing equipment is decommissioned. Re-
cent data on industrial applications of inorganic fluorides can be found in
Ref. [85].
An important area of the chemical industry that has been subject to major
change in recent years is the manufacture of halogenated organic molecules.
Chlorofluorocarbons (CFCs), which were identified as having a significant con-
tribution to the destruction of stratospheric ozone, through liberation of chlorine
radicals via photolysis, were phased out as a result of the 1987 Montreal Protocol
[11]. HCFCs were introduced as interim replacements for CFCs in refrigeration
and blowing agent applications, and these have in turn been replaced by hydro-
fluorocarbons (HFCs). Importantly, HFCs are chlorine-free and are believed to
have no significant contribution to ozone destruction [12], although they may still
act as greenhouse gases. Table 2 gives GWPs for some fluorine-containing
compounds currently in use [8,13]. Of course, production of these chlorine-free
replacements require larger quantities of fluorine than their predecessors, and
manufacture of HFCs, HCFCs, fluoropolymers and other fluorocarbon com-
pounds is one of the largest uses of HF [6,7].
HFCs and perfluorocarbons have themselves come under scrutiny because of
their large GWPs (it has even been suggested that the correct mixture of fluor-
inated gases could be used to warm Mars sufficiently to make it inhabitable by
humans! [14]). HFCs in general, and HFC134a in particular, have been used
since the early 1990s as drop-in replacements for CFCs in vehicle air conditioning
units, and emissions from these systems are projected to contribute the equiv-
alent of 50 million tonnes of CO2 per annum by 2010. The EU Environment
Fluorine: Friend or Foe? A Green Chemist’s Perspective 181

Commission is considering legislation to tackle this in the near future, although
it is not yet clear what alternatives are available at acceptable cost [15]. A com-
plete phase-out of volatile HFCs and PFCs is anticipated and already being
discussed in legislative circles [16], which could be counter-productive, impeding
the growth of fluorous-phase chemistry and supercritical solvent systems which
have great potential as clean methods for chemical synthesis – some of these
methods are discussed further below. There is political pressure to phase out
fluorinated gases with GWP greater than 150 CO2 equivalents in motor vehicle
manufacture, which will restrict use of HFC 134a (GWP ¼ 1300) but will still allow
HFC152a (GWP ¼ 140) [17]. CO2 air conditioning units seem to be the most
promising replacements for this, and carry the advantage that the compressible
gas does not need to be recovered and recycled at the end of the unit’s life.
These units are already in use in some vehicles in Japan, although there are still
some doubts about the energy efficiency of the CO2-based systems, which must,
of course, be considered when assessing their effectiveness in reducing envi-
ronmental impact. HFC emissions from refrigeration and air conditioning units in
vehicles in the UK were found to increase by 40% in 2004, indicating that leakage
from these units is significant. Although recycling and recovery of CFCs from
older refrigerators is now mandatory in the developed world, there is concern over
the efficiency of this process, with a national survey suggesting that only 64%
of the gases are actually recovered [18]. Overall levels of CFCs in the atmos-
phere appear to be falling, but HCFC and HFC levels are estimated to be rising by
3–7% and 12–17%, respectively, and HFC emissions may triple by 2015 [19].
Table 2. Global warming potentials (GWP) for some representative organoflu-orine compounds [8,13]. A range of values is given where sources differ
Compound GWP (CO2 equivalents) Residence time (years)
CO2 1 (defined)
CH4 23 10
HCF3 (HFC-23) 12,000–13,000 243
CH2CF2 (HFC-32) 550–710 5.6
CHF2CF3 (HFC-125) 3400–3600 32.6
CH2FCF3 (HFC-134a) 1300 13.6
CF3CH2CF3 (HFC-236fa) 6300–8400 226
CF4 5700 50,000
C2F6 9200 10,000
C6F14 9000 3200
CFC-11 4500 45
CFC-12 10,600 100
NF3 10,800 740
SF6 23,900 3200
Stewart J. Tavener and James H. Clark182

It should be remembered that despite their high GWPs, fluorinated gases make
a relatively minor contribution (ca. 1%) to the total GWP of mankind’s emis-
sions (see in this series, the chapters of R. Tuckett and A. Sekiya et al. devoted
to the green house effect of SF5CF3 and to CFCs and HCFCs substitutes,
respectively).
Stratospheric HF is believed to be the dominant stable reservoir of free fluorine
atoms released from photolysis of CFCs and HCFCs [20]. The only route for
removal of HF from the stratosphere is diffusion down to the troposphere where it
may be rained out: HF therefore has a long stratospheric lifetime. Concentrations
of tropospheric fluorine have increased in recent decades, showing a rise from
below 0.5 ppbv in 1970 to over 2.0 ppbv in 1995, although there is evidence from
satellite studies of the mesosphere of a slowdown in the rate of increase of
atmospheric fluorine [21]. The total atmospheric reservoir thus contains approx-
imately 7.5 million tonnes of fluorine [22].
Many HCFCs and HFCs (including HCFC-123 and HFC-134a) contain triflu-
oromethyl groups, which are resistant to degradation in the environment; HFCs
may have lifetimes in the atmosphere from 15 to 400 years [12]. The final deg-
radation product of CF3-containing compounds is trifluoroacetate (TFA), which is
eventually rained out of the atmosphere as trifluoroacetic acid and accumulates in
surface water. TFA has no known loss mechanisms in the environment, but is not
believed to be highly toxic to plants or animals [12,23]; it is not metabolised by
humans, and has a half-life in the human body of 16 h [24]. Rain and snow
in Switzerland have recently been found to contain an average of 151 ng L�1
trifluoroacetic acid, which translates to 230 g km�2 year�1, of which 150 g finds
its way into soil and groundwater, and the rest is removed in river water [25].
Similar measurements in Canada found a lower level of 21 ng L�1 trifluoroacetic
acid in rainwater [12]. With a global surface area of 5.10� 108 km2, these figures
suggest that somewhere between 10,000 and 117,000 tonne of trifluoroacetic
acid may be rained out of the atmosphere each year.3 Another published
estimate based on global average rainfall puts this value at 42,000 tonne per
annum [24].
As well as atmospheric sources, pyrolysis of fluorine-containing polymers,
which may occur in engine oil additives, non-stick cookware or incinerated med-
ical equipment (i.e. syringes) and household waste, may also produce TFA. This
process may also produce perfluorinated alkanes and cycloalkanes, which have
significant GWP, and have estimated tropospheric half-lives of more than 2000
years. Trifluoroacetate may also be produced by metabolism of trifluoromethyl-
containing drugs such as Prozac, and anaesthetics including halothane and iso-
fluorane [4].
3 Calculation based on global surface area, not an average rainfall. Surface area figure from CRC
handbook of Chemistry and Physics.
Fluorine: Friend or Foe? A Green Chemist’s Perspective 183

Burning of coal also contributes to atmospheric fluorine, with an estimated
100mg of fluorine per kg of coal [26]. How much of this is released to the
atmosphere depends upon both the efficiency of burning and the treatment of
exhaust gases: for China alone this has been conservatively estimated at
65,000 tonne of fluorine per annum. If this figure is representative of global
trends, then burning of coal may contribute more than 270,000 tonne of fluorine to
the atmosphere per annum,4 although a lower estimate of 180,000 tonne has
been reported elsewhere [27].
In addition to anthropogenic sources, there are natural sources of atmospheric
fluorine-containing compounds. Perhaps, the largest of these are volcanoes,
which are estimated to produce somewhere between 60,000 and 6 million tonnes
of fluorine per annum, mostly in the form of hydrogen fluoride and fluorosilicates
[27]. Emissions will vary greatly from year to year, depending upon volcanic
activity. For example, eruption of the Baitoushan volcano in China in 969AD
produced a calculated 42711 megatonnes of volatile fluorine [28], in prehistoric
times Mt Roza in Washington, USA liberated 1780 megatonnes of HF over a ten-
year period [29], and much more recently Mt Erebus in Antarctica was found to be
a significant source of halogens, emitting from 3000 to 6000 tonne per annum of
HF [30](see also in this series the chapter of C. Oppenheimer and G. Sawyer
devoted to fluorine emissions from volcanoes). Some eruptions produce severe
fluoride contamination of surrounding grazing land: the 1970 eruption of Hekla in
Iceland led to the death of about 7500 sheep, both through fluoride poisoning and
through brittle teeth syndrome (also known as ‘tephra teeth’), in which high con-
centrations of fluoride damage the teeth of livestock and prevent them from
grazing. Volcanic gases have also been found to contain up to 160 ppb of ha-
locarbon gases, including CFCl3, CF2Cl2 and HCFCl2 [31]. Igneous and meta-
morphic rocks are now recognised as significant sources of CF4, CF2Cl2, CFCl3,
NF3 and SF6, with CF4 being the most important. These compounds have been
found in samples of fluorite, granite and other rocks from around the world, with
an annual flux into the atmosphere of approximately 0.1–1.0 tonne [32]. With a
lifetime in the environment of 4200,000 years, this is sufficient to account for the
background level of 6� 105 tonne of CF4 in the atmosphere. This could also be a
source of trifluoroacetic acid, and, by slowly building up over geological time,
could account for the high levels found in seawater, which exceed those expected
from purely anthropogenic sources [33].
Several fluorochemicals have recently come under scrutiny for their persist-
ence in the environment, the most notable being perfluorooctylsuflonate (PFOS),
which was withdrawn from sale by manufacturers 3M in 2000 because of con-
cerns over its bioaccumulation in organisms [34]. This compound has been found
4 Based on global coal consumption reported in BP Statistical Review of World Energy, June 2002,
BP p.l.c., London.
Stewart J. Tavener and James H. Clark184

to be a widespread global contaminant and has been detected at significant
levels in the fat, tissue and blood of humans and other mammals, birds, fish,
reptiles and amphibians [35], and there is some evidence that this alters the
properties of cell membranes [36]. PFOS and related compounds were used
extensively as waterproofing agents and stain-repellent coatings. The UK gov-
ernment has since announced restrictions on the use of PFOS with the aim of
phasing out its use completely, and a European ban is anticipated. Substitution of
this compound in the short term is likely to be by shorter chain length per-
fluoroalkylsulphonates (e.g. perfluorobutane sulphonate) which are reported to
show lower toxicity and do not bioaccumulate. Use of perfluoralkyl alcohols (flu-
orotelomer alcohols) has also been suggested, although these are suspected
sources of perfluorooctanoic acid in the environment and, while less bioaccu-
mulative than PFOS, are also known carcinogens and widespread environmental
pollutants [37]. PFOS also has applications in fire fighting, chrome plating, hy-
draulic fluids for aircraft and in the semiconductor industry for photoresists and
control of optical effects [38]. Current use in the EU is estimated at 12,250 tonne
per annum, with the majority being consumed by electroplating.
Aromatic molecules with fluorine or fluorine-containing substituents frequently
have high bioactivity [39] and are therefore used for medical and agrochemical
applications, in which they are deliberately introduced to organisms and/or the
environment (Fig. 2). They are typically less bioaccumulative and less environ-
mentally persistent than saturated fluorocarbons, and may be degraded oxidativ-
ely under aerobic conditions, where defluorination may or may not occur.5 The
world market for fluoroaromatics was estimated at 10,000 tonne per annum in
F3C
NO2
NO2
CH2CH2CH3
CH2CH2CH3
O
NO
N
F
F H
Diflubenzuron, insecticide Trifluralin, herbicide
O CHCH2CH2NHCH3.HClF3C
Prozac, antidepressant
HO
CF3
NO2
TNP, lampricide
N
CIH
Fig. 2. Representative bioactive fluorinated aromatics.
5 Biotransformation of fluorinated molecules in the environment is beyond the scope of this review
but is covered in depth. See Ref. [40].
Fluorine: Friend or Foe? A Green Chemist’s Perspective 185

1994 [4], and global capacity for production of these compounds was
35,000 tonne per annum in 2000 [41]. Compounds-containing aromatic F–C
bonds may also be degraded by nucleophilic attack, but trifluoromethyl functions
are generally resistant to defluorination and it is likely that the final sink for fluorine
atoms will, in these cases, be trifluoroacetate. This has been shown to be in the
case of 3-trifluoromethyl-4-nitrophenol (TNP), which is used to control the sea
lamprey: TNP breaks down under photolysis in water to produce trifluoroacetic
acid [42].
Organofluorine compounds are often perceived as being entirely man-made.
This is not, in fact, the case, and there are several biogenic sources of fluorinated
natural products. When grown in fluoride-rich soil, several species of plants pro-
duce and accumulate fluoroacetate, which acts as a defence mechanism as it is
extremely toxic to animals. However, animals that graze in regions where these
plants are common have evolved with an increased tolerance to fluoroacetate,
and this resistance has been found to extend further up the food chain. For
example, falcons and owls which prey on rodents in areas rich in fluoroacetate-
accumulating plants also have resistance to its toxic effects [43]. Sodium fluoro-
acetate poisoning in humans causes coma-like symptoms and respiratory failure,
but if the subject survives, complete recovery may occur within a few days [44].
To date, only about 12-fluorinated natural products have been identified, which
include fluoroacetate, fluorocitrate, fluoroacetone and 4-fluorothreonone, as well
as fluorinated fatty acids (Fig. 3).6 Considering the abundance of fluorine in the
oceans and crust, it is perhaps surprising that there are not more naturally oc-
curring organofluorine compounds, and there may be several that are, as yet,
undiscovered. It is not clear what contribution biogenic organofluorine com-
pounds make to atmospheric fluorine burden, although, as most of these com-
pounds are reactive and are expected to have relatively short atmospheric
lifetimes, it is likely that their effect is insignificant.
F O
O
fluoroacetate
F
O
fluoroacetone
HO2C CO2HHO CO2H
F
fluorocitrate
F
OH
CO2
NH3
4-fluorothreonine
Fig. 3. Fluorine-containing natural products.
6 For reviews of fluorine-containing natural products, see Ref. [45].
Stewart J. Tavener and James H. Clark186

3. THE ROLE OF FLUORINE COMPOUNDS IN CLEAN SYNTHESIS
3.1. Fluorous separation technologies
Although the spectre of legislation is looming over many halogenated com-
pounds, it would be unfortunate if organofluorine compounds were to become the
subject of the wide-reaching restrictions that now affect chlorine- and bromine-
containing compounds, as the unique properties of fluorine could have an im-
portant role to play in the advancement of clean chemical synthesis. In particular,
the immiscibility of compounds containing perfluoroalkyl groups with some hy-
drocarbons and most polar organic solvents has led to the development of flu-
orous biphasic chemistry and other fluorous solvent technologies, in which the
ease of separation of product or catalyst is greatly improved. The reason for this
low miscibility has been debated and a ‘special’ attraction within the fluorous
phase is occasionally proposed, but consideration of the cohesive pressures
(perfluoroheptane ¼ 136MPa, hexane ¼ 225MPa and water ¼ 2300MPa) make
it probable that the very weak interactions between highly fluorinated alkanes and
the non-fluorous molecules are insufficient to pay back, thermodynamically, the
free energy required to disrupt the non-fluorous phase [46]. Fig. 4 shows how
fluorous liquids may be utilised in a biphasic system to facilitate recycling of a
catalyst and solvent: at low temperatures the phases are immiscible, but on
heating become a single phase allowing reaction to proceed at useful rates.
Cooling leads to separation of the two phases and allows ready recovery of
solvent, catalyst and product from the mixture. This gives improved efficiency and
reduces waste.
The use of small-molecule sources of oxygen, including O2, H2O2 and NaOCl
(with an additional catalyst if required), is preferable on both economic and en-
vironmental grounds to stoichiometric, metal-based oxidants such as KMnO4 and
K2Cr2O7 [1,47]. As oxidations will typically give products of greater polarity than
Fig. 4. Schematic diagram of a fluorous biphase process in which a fluoroussolvent and fluorous catalyst are recycled together.
Fluorine: Friend or Foe? A Green Chemist’s Perspective 187

the substrates, these reactions are very suitable candidates for fluorous biphasic
processes. For example, if an alkene is oxidised to a more polar product (e.g. an
epoxide or diol) in a fluorous biphase, the product should be less soluble in the
fluorous phase than the substrate, and this will lead to the product being ‘ejected’
from the fluorous phase giving improved separation. Their low cohesive pres-
sures allow perfluorinated solvents to dissolve extremely high quantities of ox-
ygen (and other gases) (Table 3) and so the fluorous biphase is an ideal system
in which to conduct oxidation reactions using elemental oxygen.
Although ideally suited to reactions involving gases, the fluorous approach to
oxidations is not limited to use of elemental oxygen. A fluorous analogue of
DMSO has been used to perform Swern reactions [48], a widely used method of
oxidising an alcohol to an aldehyde which is unsatisfactory from the environ-
mental point of view due to its production of stoichiometric quantities of dimethyl
sulphide. Using fluorous biphase methodology, this stoichiometric reaction may
be made pseudo-catalytic (Fig. 5). After reaction, the sulphide is extracted into
perfluorohexane and recycled.
Heterogeneous reactions lend themselves to continuous flow reactors, which
are desirable as they minimise the reacting volume. This reduces operation risks,
and allows smaller, more efficient plants to be built. Flow reactors designed for
fluorous reactions with both liquid and gaseous substrates have been demon-
strated to be effective, at least on a bench scale [49]. Fluorous solvents have also
recently found applications as liquid membranes to control the rate of addition of
reagents and so control exothermic reactions such as alkene bromination (Fig.
6), and demethylation of anisoles by reaction with boron tribromide [50]. This has
potential as a clean route as the kinetic control gives improved selectivity.
Fluorous biphase reactions have been reviewed extensively in the past few
years, and most important types of reaction may now be conducted under flu-
orous conditions [46,51]. However, partitioning of catalysts and reagents into the
fluorous phase is seldom perfect – even a loss of 1–2% of an expensive catalyst
may be unacceptable. Solubility and partitioning between phases relies on a
complex balance of properties and interactions, and rather than simply adding
more fluorocarbon chains to a catalyst (which is a common approach to the
problem of leaching of catalyst from the fluorous phase), studies have indicated
that the partition coefficients of fluorous compounds may better be optimised by
Table 3. Solubility of oxygen in selected perfluorinated solvents [46]
Solvent Solubility of O2 in ml per 100ml solvent
n-Perfluorooctane C8F18 52.1
Perfluorotributylamine (C4F9)3N 38.4
Perfluorooctyl bromide C8F17Br 52.7
Stewart J. Tavener and James H. Clark188

careful adjustment of the composition of the solvent phases [52]. The polarity of a
liquid perfluorocarbon may be increased by addition of perfluoroalkyl ethers,
while the polar organic phase becomes more fluorophobic on addition of small
amounts of water. While the principle is an interesting and potentially useful one,
the solvent systems reported unfortunately involved the use of DMF, which is
toxic and a known carcinogen. Fluorine-containing groups benefit other alterna-
tive reaction solvents: fluorine is increasingly found in the cations of ionic liquids
where it is used to fine-tune the viscosity, density, conductivity, miscibility and
other important properties of the liquid [53], and is present in the near-ubiquitous
BF4� and PF6
� anions. Silica gel, which is normally a very polar surface [54], may
be made compatible with fluorous reagents and solvents by grafting a per-
fluoroalkyl group to the surface using a silane reagent [55] – a fluorous tech-
nology which requires no perfluorinated solvent. The resultant solids, know as
OH
C4F9S
O
C4F9S
C6F14
C4F9I
O
NaBH4Me2S2
H2O2, MeOH
CH2Cl2 or toluene
Fig. 5. A Swern oxidation under fluorous conditions allows reuse of the suph-oxide reagent.
Fig. 6. Alkene bromination using a fluorous liquid membrane to control diffusionrates.
Fluorine: Friend or Foe? A Green Chemist’s Perspective 189

fluorous reverse phase silica gel (FRPSG), have very low surface energies and
so should only be wetted by liquids with correspondingly low surface tensions, i.e.
highly fluorinated compounds. The FRPSGs may thus be used as a chromatog-
raphy support for separation and purification of fluorous reagents, or as a tool for
preferentially adsorbing them from a reaction mixture. In a chromatographic sys-
tem, compounds without fluorous groups are first eluted using a polar solvent (in
which the fluorous compounds have little solubility), and then a less polar solvent
is used to elute the fluorous compound. Whereas effective partitioning into a
fluorous liquid phase generally requires two or three perfluoroalkyl groups to be
attached, FRPSG techniques require much lower fluorine content for separation
to be effective. This approach has been applied to separation of chiral mappicines
[56], and to isolate and reuse Lewis acid and metal catalysts with fluorous ligands
[57]. It may also be used to recover fluorous amides from reaction mixtures via
solid-phase extraction without recourse to additional purification steps, giving a
cleaner overall synthesis [58]. A recent, and ingenious, example of the use of
heterogeneous fluorinated systems to recover homogeneous catalysts has in-
volved the use of Teflon tape as the immobilisation phase [59]: a thermomorphic
rhodium catalyst containing perfluorinated-phosphine ligands was found to be
efficiently recovered by cooling the mixture in the presence of the tape. Here, the
authors recognise an additional potential advantage: the required quantity of
catalyst may be delivered by cutting lengths of the tape, rather than by accurate
weighing of small amounts. It is worth noting here that other workers have studied
the diffusion properties of fluorinated and non-fluorinated aromatics at Teflon
surfaces and suggest that these systems do not act in a truly ‘fluorous’ manner,
but are closer to supported-liquid membranes in their behaviour [60].
As discussed in Section 2, a major problem restricting the implementation of
these fluorous technologies is the high GWP of volatile fluorinated compounds,
although a switch to perfluoroalkyl ethers, which break down faster in the en-
vironment, may overcome this hurdle. Despite the environmental problems and
anticipated legislative controls of perfluorinated solvents and reagents, research
into fluorous technologies has continued undeterred, with reports of increasingly
sophisticated multi-phasic systems involving, for example, fluorous, organic and
aqueous-liquid phases [61]. A survey of use of the word ‘fluorous’ in titles of
publications in the Web of Knowledge database [62] reveals 451 articles, in-
creasing rapidly in frequency between 1995 and 2002 (Fig. 7). The number of
publications has since levelled, which may indicate that the technology is at the
peak of its popularity, at least in academic circles. Despite the market presence of
a company dedicated to fluorous products, the uptake of this technology by
industry has not yet reached the potential that seemed possible five years ago,
and the relatively high prices and environmental concerns over highly fluorinated
reagents may ultimately limit their use to specialist applications.
Stewart J. Tavener and James H. Clark190

3.2. The use of fluorinated groups in supercritical CO2
Supercritical CO2 is considered to be close to zero in its environmental impact as
it is normally condensed from, and returned to, the atmosphere (although the
energy involved in its use must be accounted for). For this reason supercritical
CO2 is finding many applications as a solvent in clean synthesis and extraction,
and it has the addition advantages of being non-toxic and may be completely
removed from the reaction product simply by releasing the reactor pressure [46].
However, it is not a particularly powerful solvent and does not, by itself, dissolve
many compounds. Fluorous compounds find applications in these systems be-
cause of their solubility, and ability to act as ligands and surfactants to bring other
compounds into the supercritical phase [63]. Once again it is the weakness of the
intermolecular forces between fluorous molecules that makes this possible. De-
spite studies using a range of spectroscopic techniques, the exact cause of this
compatibility with supercritical CO2 is not well understood, and there is some
disagreement in the literature over whether or not specific interactions between
Fig. 7. Yearly publications of journal articles containing the word ‘fluorous’ in thetitle.
Fluorine: Friend or Foe? A Green Chemist’s Perspective 191

the fluid and the fluorous group occur [64]. What is certain is that the combination
of supercritical CO2 and fluorous modifier is a very powerful, tuneable and po-
tentially clean reaction medium.
Hydrogen peroxide, which produces only water and O2 as by-products and is
generally considered to be a clean oxidant, may be generated in scCO2. The
anthraquinone (or AQ) process, in which an alkyl anthraquinone is first hydro-
genated and then oxidised, is used to supply almost all of the global demand for
H2O2 [65]. The AQ process may be successfully performed in scCO2 if the ant-
hraquinone catalyst is made compatible with the fluid phase by functionalisation
with perfluorinated chains [66]. Moreover, the H2O2 produced in this way may be
utilised in the same reactor (i.e. a one-pot process), for the epoxidation of alkenes
(Fig. 8). The compatibility of fluorinated compounds with supercritical CO2 has
facilitated the replacement of CFCs as a medium for polymerisation of Teflon and
other fluoropolymers on an industrial scale. DuPont recently built a $275 million
plant capable of making 1000 tonne of polymer per year. The plant uses carbon
dioxide technology in a process that generates less waste during manufacture,
and produces a grade of polymer that the manufacturer claims has enhanced
performance and processing capabilities [67]. It is expected to begin commercial
production in 2006.
Fig. 8. Generation of H2O2 in supercritical CO2 using a fluorous anthraquinonecatalyst, and in situ use as an oxidant.
Stewart J. Tavener and James H. Clark192

3.3. Safe fluorination with F2 using microreactor technology
Where electrophilic fluorination is required, it has been commonplace to utilise
the so-called ‘F+’ reagents in which the electrophilic fluorine is bound to an
organic nitrogen centre [68]. While these reagents are effective, they have the
drawbacks of being expensive, requiring use of elemental fluorine in their man-
ufacture, and of course the atoms in the organic amine carrier have no role in the
final product – essentially those atoms are wasted and the process has a poor
atom economy. There is no fundamental reason why elemental fluorine itself
should not be viewed as a suitable reagent for clean synthesis. Generally, F2 is
used to replace a C–H bond with a C–F function, producing HF as a by-product,
and if the HF is recycled the atom economy may be very high indeed. Because of
its reactivity, fluorination with F2 proceeds without the need for catalysts, and may
be performed in the gas phase without solvent. However, this supreme reactivity
is itself a problem because of the large quantity of heat liberated during the
reaction, which can lead to increased reaction rates, reduced selectivity and, in
the worst case scenario, a runaway reaction. While this must be avoided on
safety grounds, the loss of selectivity is also of concern from a green chemistry of
view. Fluorinations may be made significantly more selective simply by dilution of
F2 in an inert carrier gas (usually nitrogen) [69]. One potential method for scale up
of reactions simply by running many tiny microreactors, often as small as a few
microlitres volume, in parallel, which could, in the future, intensify processes and
reduce the size of chemical plants [70]. Microreactor systems are already show-
ing great potential for selective reactions using elemental fluorine and the ex-
tremely small volume contributes greatly to the safe running of these systems by
ensuring that only small quantities of F2 are present in the reactor. Also, heat may
be removed from the reaction much more efficiently, moderating the exotherm
and thus giving much greater control – which is ideal for selective introduction of
fluorine. For example, the fluorination of ethyl acetoacetate, using 10% F2 in N2,
in a microreactor gave 73% selectivity at 99% conversion for the monofluorinated
product, as shown in Fig. 9 [71], which compares very favourably with 85%
selectivity at only 15% conversion observed in a similar bulk reactor [72]. Se-
lective fluorination of toluene and other aromatics in microreactors have also
been reported [73]. Reactors with as many as 30 parallel channels are already in
10% F2 in N2
99% conversion73% selectivityOEt
O
OEt
F
O O O
Fig. 9. Fluorination of ethyl acetoacetate with elemental fluorine using a micro-reactor.
Fluorine: Friend or Foe? A Green Chemist’s Perspective 193

use which, despite very low flow rates and capacities, may produce 100 g of
product overnight [74].
3.4. Comparison of synthetic routes to fluoroaromatics
Fluoroaromatics are an important class of chemicals with applications that in-
clude pharmaceuticals (see Section 2), agricultural chemicals, polymers and liq-
uid crystals [75]. As well as direct fluorination by HF, there are several other
methods for preparation of fluoroaromatics, and four of the most important –
Halex, Balz–Schiemann, direct fluorination and a recently reported route involv-
ing CuF2 (Fig. 10) – are compared here in terms of their inherent hazards and
efficiency. An ideal synthesis for fluoroaromatics should involve a good fluor-
inating agent in terms of reactivity, cost, ease of handling and safety, and would
give high yields with low levels of by-products.
The oxidative fluorination route has high atom efficiency, incorporating all of the
fluorine into the aromatic, and producing only water as a by-product [76]. Be-
Fig. 10. Summary of four routes for preparing fluoroaromatics (see also Table 4).*Indicates the modified Schiemann reaction which may be performed in anhy-drous HF or HF-pyridine. The salt intermediate in this case is a diazoniumfluoride.
Stewart J. Tavener and James H. Clark194

cause it replaces an aromatic hydrogen directly with fluorine, no precursor group
is required. Copper(II) fluoride, used as the fluorinating agent, was selected on
the basis of examination of metal redox potentials. The metal must be sufficiently
oxidising that it reacts with the C–H bond, yet not so oxidising that it is impossible
to regenerate. This system gives moderate yields (5–35% conversion in a single
pass through the reactor), very good selectivity (495%) towards the monofluor-
inated-aromatic product, requires no solvent, and, appears to be very promising
as a clean, atom efficient route to fluoroaromatics. However, very high temper-
atures are required for both the reaction (400–5501C) and regeneration (4001C)
steps. The high temperatures mean that while this may well be a suitable method
for the fluorination of benzene and simple alkylbenzenes, many functional groups
would not survive these conditions. In addition, the energy required to heat the
reactor makes a substantial contribution to the process cost and any advantages
gained in terms of atom efficiency must be offset against this.
Direct fluorination is potentially very efficient in terms of utilisation of reagents,
requiring no existing functional group: the C–H is replaced directly with C–F. The
drawbacks are that the reaction is frequently unselective, giving polysubstituted
products (although see the discussion on direct fluorination, above), energy is
required to cool the system, and acid HF waste is produced which must be
neutralised and disposed of. Unlike chlorination and bromination reactions, it is
not possible to oxidise the HF back to F2 by in situ use of H2O2 – the oxidation
potential for F2 is too high. The Halex, or halogen exchange, route to fluoroar-
omatics starts with a chloroaromatic substrate (or nitro group in analogous fluo-
rodenitration reactions), which is inherently wasteful from an atom efficiency
perspective, as the chlorine will not appear in the final product. A fluoride salt,
usually KF, and quaternary ammonium or phosphonium salt catalyst are also
required. Halex reactions work best in polar aprotic solvents, which are frequently
toxic and tend to break down under reaction conditions. The quaternary salt is
generally not reusable, and high temperatures are required. The Balz–Schie-
mann route involves two steps, and requires treatment with HCl, NaNO2 and
HBF4, although the nitrogen, chlorine and boron that appear in these reagents
are not found in the final fluorinated product. An improvement on this route is the
modified Schiemann reaction which eliminates the need for BF3 but must be
performed in anhydrous HF or HF-pyridine. The aniline substrate may already
have produced substantial waste during its manufacture via nitration and sub-
sequent reduction. These methods are, however, applicable to a wider range of
substrates than some of the other methods, and remain popular methods for
fluoroaromatic manufacture.
There are many factors that contribute to the ‘greenness’ of a chemical re-
action, and there is no clear preferred route, although the two systems that
replace C–H directly are, on paper at least, cleaner than those that require func-
tional group exchange. These reactions are summarised in Table 4.
Fluorine: Friend or Foe? A Green Chemist’s Perspective 195

Table 4. Overall evaluation of manufacturing methods for fluoroaromatics
Route Waste RiskEnergy andmaterials Cost Simplicity
Maximum atomefficiencya
Oxidativefluorination
Water only HF Very hightemperatures
Energy HFhandling
One step withrecycling offluoride
80%
Special reactors
Halex Salt Corrosion Hightemperature
Activatedaromatics;expensivesolvents,catalyst
One step(omitting Ar-Xmanufacture)
o86% (omittingAr-Xmanufacture)
Lost ordecomposedsolvent
Decompositionof (toxic)solvent
Direct fluorination Salt (neutralisedHF)
F2, HF Cooling F2 generationand handling
One step 70%
Special reactors
Balz–Schiemann Salt UnstableintermediateHF, BF3
Cooling Anilines Two steps(omittinganilinemanufacture)
44% (omittinganilinemanufacture)
Lost solvent BF3 Special reactors
Modifiedschiemann
Salt UnstableintermediateHF handling
Cooling Specialreactors
Anilines Two steps(omittinganilinemanufacture)
48% (omittinganilinemanufacture)
Lost solvent
a At 100% yield, assumes aromatic group is C6H5.
StewartJ.TavenerandJamesH.Clark
196

4. FLUOROCHEMICALS FACILITATE MINIATURISATION OF END-PRODUCTS
Employment of fluorine technology may contribute to clean chemistry by virtue of
its unique atomic properties. Fluorine’s small size and superior electronegativity
allow manipulation of dielectric properties of molecules (specifically, the dielectric
anisotropy), making it an essential building block for liquid crystal engineering
[77]. This has led to rapid advances in visual display unit and thin film transistor
(TFT) flat screens are replacing conventional cathode ray tube devices. The
computer display market is estimated at US$ 100,000 million per year, and flat
screen technology has rapidly penetrated the market, rising from just 5% of the
market share in 1999 to 70% in 2005; it is predicted to reach 94% by 2008 [78].
TFT visual display screens, which use significantly less energy than conventional
cathode ray tube (CRT) screens, rely on fluorine-containing compounds that be-
have as twisted nematic liquid crystals (Fig. 11).
These flat screens have allowed miniaturisation of the whole computer screen
assembly, and substantially less plastic, glass and electrical components are
required. In addition, transport and packaging are reduced, and the enormous
volume of these products means that even small improvements may have major
environmental benefits. Ongoing work at York University has discovered that
these liquid crystal molecules may be effectively recovered from TFT screens via
a supercritical extraction process, giving the potential for reuse of these useful
high value fluorinated compounds [79].
Fluorine plays another important role in display screen technology, albeit re-
placing another type of fluorine technology. F2 is often considered to be a dan-
gerous harmful chemical (indeed it has been referred to as the Tyrannosaurus
Rex of the elements [80]). However, its very reactivity ensures that it cannot
persist in the environment, although its by-products may. The major hazards
F
FR
F
OCF3R
F
F
R
Fig. 11. Examples of fluorinated-liquid crystals used in TFT display screens(R ¼ alkyl group).
Fluorine: Friend or Foe? A Green Chemist’s Perspective 197

associated with use of F2 are transport and storage of quantities of the reactive
gas. Advances in electrochemical fluorine gas production have led to the devel-
opment of on-demand F2 generators that may be installed on location at the
manufacturing site [81]. Cleaning of TFT screen and silicon chip manufacturing
equipment requires removal of deposits formed during electrochemical vapour
deposition, and this is normally performed using fluorine radicals generated from
CF4, NF3, C2F6 and other related compounds by microwave-plasma methods.
Use of locally generated F2 gas as a source of the F radicals avoids the use of
these environmentally persistent greenhouse gases.
The unique properties of fluorine – its small size, high electronegativity, and the
hydrophobicity/lipophilicity imparted by introduction of small fluorinated groups
(CF3, OCF3, SCF3, etc.) – allow careful tuning of the biological properties of the
molecule, and the use of fluorine in medicines and agrochemicals has become
widespread [82]. Incorporation of fluorine or a small fluorocarbon group can im-
part several benefits, all of which may improve the bioavailibility of the drug and
allow lower doses to be used. This may reduce waste and energy requirements
along the entire supply chain. Three major effects of using fluorine in medicines
are [81,83]
(i) Blocking of metabolically labile C–H sites by replacement with fluorine atoms
often leads to molecules with increased metabolic stability.
(ii) Control of the basicity and lipohilicity of the molecule can improve the ability
of the drug to permeate through cell membranes.
(iii) Binding constants are normally increased by the introduction of fluorinated
groups.
Fluoroquinolines (Fig. 12), for example, are highly active antibacterial agents
with binding affinities up to 17-fold higher, and cell penetration increased by up to
70-fold, compared to non-fluorinated counterparts. Mankind has a long tradi-
tion of utilising natural products as medicines, and the discovery and recent
understanding of the biosynthesis of natural organofluorine compounds may al-
low development of new families of fluorinated medicines to be developed using
biosynthetic pathways [84].
N
O
F
NN
O
O
H
H
Fig. 12. Example of a fluoroquinoline antibacterial agent.
Stewart J. Tavener and James H. Clark198

5. CONCLUSIONS
From a green chemist’s point of view, an ideal product, be it a recyclable solvent,
a car or a laptop computer, is one that is designed to be robust during use, have a
long-working lifetime, yet may easily be recycled at the end of its life and will, if
released into the environment, break down rapidly into benign components. This
is clearly not an easily achievable goal as durability and biodegradation do not
necessarily go hand-in-hand. Because of the tendency of fluorine to form very
strong bonds with other elements, fluorochemicals generally perform well in
terms of durability (e.g. Teflon), and the unique properties of fluorous solvents
and reagents facilitate recycling. However, some of the environmental problems
associated with organofluorine compounds are direct results of their inherent
durability, and many highly fluorinated species have few decomposition mech-
anisms, long environmental lifetimes and may accumulate to dangerous levels in
organisms. Recognition of these problems allows for design of better chemical
products with lower environmental impact.
Fluorine-containing compounds are found widely in the environment, and al-
though some of these may be attributed to the activities of human beings in
general, and the chemical industry in particular, there are also many natural
processes that contribute to fluorine reservoirs. Although certain fluorine-con-
taining compounds have been identified as being involved in ozone depletion,
global warming effects and health concerns, legislative measures have been, or
are being, put in place where necessary to reduce this impact. Fluorine-contain-
ing compounds have a great potential for clean synthesis, and utilisation of the
high activity that fluorinated groups can impart may help to produce smaller, more
effective, and therefore greener chemical products.
ACKNOWLEDGEMENTS
We thank Prof. John Goodby and Dr Avtar Matharu of the University of York for
discussions about the use of fluorine in liquid crystal devices, and Prof. Alan
Davison of the University of Newcastle and Dr Archie McCulloch of Marbury
Technical Consulting for helpful suggestions regarding fluorochemicals in the
environment.
REFERENCES
[1] J.H. Clark, Chem. Brit. October 34 (10) (1998) 43; J.H. Clark, Green Chem. 1 (1999)1; M. Lancaster, Green Chemistry: An Introductory Text, RSC, Cambridge, 2002.
[2] T. Kitazume, J. Fluorine Chem. 105 (2000) 265; S.J. Tavener, J.H. Clark, J. FluorineChem. 123 (2003) 31–36.
Fluorine: Friend or Foe? A Green Chemist’s Perspective 199

[3] A. McCulloch, J. Fluorine Chem. 123 (2003) 21; J. Lucas, J. Fluorine Chem. 41 (1988)1; The Handbook of Environmental Chemistry, Vol. 3, Part N: Organofluorines,A.H. Neilson (Ed.), Springer, Berlin, 2002; J.P. Friend, Natural Chlorine and Fluorinein the Atmosphere, Water and Precipitation, Scientific Assessment of StratosphericOzone, in World Meterological Organisation Global Ozone Project Report, 1989 No.20,Vol. 2, p. 429.
[4] B.D. Key, R.D. Howell, C.S. Criddle, Environ. Sci. Technol. 31 (1997) 2445.[5] CRC Handbook of Chemistry and Physics, 76th Edition, CRC Press, Boca Raton,
1995.[6] M.M. Miller, U.S. Geological Survey Minerals Yearbook 2003: Flourspar Report,
2003; ibid., 2001, ibid., 1998; Mineral Profile: Flurorspar, British Geological Society,Nottingham, July 2003.
[7] M.M. Miller, U.S. Geological Survey Minerals Commodities Summaries, U.S. Geo-logical Survey, Reston, VA, USA, January 2002 and February 1997.
[8] Inventory of U.S. Greenhouse Gas Emission and Sink 1990–2000, U.S. Enviorn-mental Protection Agency, Washington, 2002; Inventory of U.S. Greenhouse GasEmission and Sinks 1990–2003; U.S. Enviornmental Protection Agency, Washington,2005; Internation Panel on Climate Change, Third Assessment Report – ClimateChange 2001, Cambridge University Press, Cambridge, 2001, Chapter 4.
[9] T.E. Norgate, W.J. Rankin, Proc.Int. Symp. Greenhouse Gases in the MetalurgicalIndustries, Toronto, 2000.
[10] Environmental Data Service, ENDS Rep. 329 (2002) 8.[11] A. McCulloch, J. Fluorine Chem. 100 (1999) 163.[12] A.R. Ravishankara, A.A. Turnipseed, N.R. Jensen, S. Barone, M. Mills, C.J. Howard,
S. Soloman, Science 263 (1999) 71.[13] T.J. Wallington, O.J. Nielson, Handbook of Environmental Chemistry, Vol. 3,
Springer, Berlin, 2002, Chapter 3, Part N.[14] M.F. Gerstell, J.S. Francisco, Y.L. Yungm, C. Boxe, E.T. Aaltonee, Proc. Natl. Acad.
Sci. USA 98 (2001) 2154.[15] Environmental Data Service, ENDS Rep. 337 (2003) 46.[16] Environmental Data Service, ENDS Rep. 328 (2002) 50.[17] Environmental Data Service, ENDS Rep. 355 (2004) 30.[18] Environmental Data Service, ENDS Rep. 360 (2005) 16.[19] Environmental Data Service, ENDS Rep. 358 (2004) 11; ibid., 363 (2005) 9.[20] M. Luo, R.J. Cicerone, J.M. Russell III, T.Y.W. Huang, J. Geophys. Res. 99 (1994)
16691.[21] G. Considine, L. Deaver, E. Fremsberg, J.M. Russell III, Geophys. Res. Lett. 24
(1997) 3217.[22] D.L. Jacob, Introduction to Atmospheric Chemistry, Princeton University Press,
Princeton, 1999.[23] D.A. Ellis, S.A. Mabury, J.W. Martin, D.C.G. Muir, Nature 412 (2001) 321.[24] K.R. Solomon, X. Tang, S.R. Wilson, P. Zanis, A.D. Bais, Photochem. Photobiol. Sci.
2 (2003) 62; X. Tang, S. Madronich, T. Wallington, D. Calamari, J. Photochem.Photobiol. B: Biol. 46 (1998) 83.
[25] M. Berg, S.R. Muuller, J. Muthlemann, A. Wiedmer, R.P. Schwartzenbach, Environ.Sci. Technol. 34 (2000) 2675.
[26] K.L. Luo, L.R. Xu, R.B. Li., L.H. Xiang, Chin. Sci. Bull. 47 (2002) 1347.[27] R.B. Symonds, W.I. Rose, M.H. Reed, Nature 334 (1988) 415; R.D. Cadle, Rev.
Geophys. Space Phys. 18 (1980) 746.[28] S. Horn, H.U. Schmincke, Bull. Vulcanol. 61 (2000) 537.[29] Th. Thordarson, S. Self, J. Vulcanol. Geotherm. Res. 74 (1996) 49.[30] G. Zreda-Gostynska, P.R. Kyle, D.L. Finnegan, Geophys. Res. Lett. 20 (1993)
1959–1962.[31] V.A. Isidorov, I.G. Zenkevich, B.V. Ioffe, J. Atmos. Chem. 10 (1990) 329.
Stewart J. Tavener and James H. Clark200

[32] J. Harnisch, M. Frische, R. Bochers, A. Eisenhauer, A. Jordan, Geophys. Res. Lett.27 (2000) 1883.
[33] A. McCulloch, J. Fluorine Chem. 123 (2003) 21.[34] Environmental Data Service, ENDS Rep. 354 (2004) 28.[35] K. Kannan, S. Corsolini, J. Falandysz, G. Fillman, K. Senthil Kumar,
B.G. Loganathan, M. Ali Mohd, J. Olivero, N. Van Wouwe, J. Ho Yang, K.M.Aldous, Environ. Sci. Technol. 38 (2004) 4489; J.P. Giesy, K. Kannan, Environ. Sci.Technol. 35 (2001) 1339.
[36] W.Y. Hu, P.D. Jones, W. DeCoen, L. King, P. Fraker, J. Newsted, J.P. Giesey, Comp.Biochem. Physiol. Part C 135 (2003) 77.
[37] N.L. Stock, F.K. Lau, D.A. Ellis, J.W. Martin, D.C.G. Muir, S.A. Mabury, Environ. Sci.Technol. 38 (2004) 991; D.A. Ellis, J.W. Martin, A.O. De Silva, S.A. Mabury,M.D. Hurley, M.P. Sulbaek Anderson, T.J. Wallington, Environ. Sci. Technol. 38(2004) 3316.
[38] Environmental Data Service, ENDS Rep. 355 (2004) 42; ibid., 358 (2004) 55.[39] D. O’Hagan, H.S. Rzepa, Chem. Commun. (1997) 645. J.C. Biffinger, H.W. Kim,
S.G. DiMagno, Chem. Bio. Chem. 5 (2004) 622.[40] B.D. Key, R.D. Howell, C.S. Criddle, Environ. Sci. Technol. 31 (1997) 2445;
A.H. Neilson, A.-S. Allard, The Handbook of Environmental Chemistry, Vol. 3, Part N:Organofluorines, A.H. Neilson, (Ed.), Springer, Berlin, 2002, Chapter 6.
[41] R. Bryant, Pharmaceutical Fine Chemicals Global Perspectives, Informa ChemicalsIndustry Report, Kent, UK, 2000.
[42] D.A. Ellis, S.A. Mabury, Environ. Sci. Technol. 34 (2000) 632.[43] G.R. Martin, L.E. Twigg, Wildlife Res. 29 (2002) 75.[44] R.F. Robinson, J.R. Griffith, W.R. Woolwich, M.C. Nahata, Vet. Human Toxicol. 44
(2002) 93.[45] D. O’Hagan, D.B. Harper, J. Fluorine Chem. 100 (1999) 127; D.B. Harper,
D. O’Hagan, Nat. Prod. Rep. 11 (1994) 123; G.W. Gribble, Handbook of Environ-mental Chemistry, Vol. 3, Springer, Berlin, 2002, Part N, Chapter 5.
[46] D.J. Adams, P.J. Dyson, S.J. Tavener, Chemistry in Alternative Reaction Media,Wiley, Chichester, 2003.
[47] R.A. Sheldon, J. Chem. Tech. Biotechnol. 68 (1997) 381.[48] D. Crich, S. Neelamkavil, J. Am. Chem. Soc. 123 (2001) 7449; D. Crich, S. Ne-
elamkavil, Tetrahedron 58 (2002) 3865.[49] E. Perperi, Y. Huang, P. Angeli, G. Manos, C.R. Mathison, D.J. Cole-Hamilton,
D.J. Adams, E.G. Hope, Chem. Eng. Sci. 59 (2004) 4983; A. Yoshida, X.H. Hao,J. Nishikido, Green Chem. 5 (2003) 554; E. Perperi, Y. Huang, P. Angeli, G. Manos,C.R. Mathison, D.J. Cole-Hamilton, D.J. Adams, E.G. Hope, Dalton Trans. (14)(2004) 2026.
[50] I. Ryu, H. Matsubara, S. Yasuda, H. Nakamura, D.P. Curran, J. Am. Chem. Soc. 124(2002) 12946.
[51] A.P. Dobbs, M.R. Kimberley, J. Fluorine Chem. 118 (2003) 3; E.G. Hope, A.M. Stuart,J. Fluorine Chem. 100 (1999) 75; E. de Wolf, G. van Koten, B.J. Deelman, Chem.Soc. Rev. 28 (1999) 37.
[52] M.S. Yu, D.P. Curran, T. Nagashima, Org. Lett. 7 (2005) 3677.[53] H. Xue, Jean’ne Shreeve, Eur. J. Inorg. Chem. (13) (2005) 2573.[54] S.J. Tavener, J.H. Clark, G.W. Gray, P.A. Heath, D.J. Macquarrie, Chem. Commun.
(1997) 1147.[55] D.P. Curran, Synlett 9 (2001) 1488.[56] D.P. Curran, Z. Lee, Green Chem. 3 (2001) G3.[57] B. Croxtall, E.G. Hope, A.M. Stuart, FBC7 in Abstracts of the RSC Annual Confer-
ence 2001. O. Yamazaki, X. Hao, A. Yoshida, J. Nishikido, Tetrahedron. Lett. 44(2003) 8791.
[58] T. Nagashimi, Y. Lu, M.J. Petro, W. Zhang, Tetrahedron Lett. 46 (2005) 6585.
Fluorine: Friend or Foe? A Green Chemist’s Perspective 201

[59] L.V. Dinh, J.A. Gladysz, Angew. Chem. Int. Ed. 44 (2005) 4095.[60] H. Zhao, K. Ismail, S.G. Weber, J. Am. Chem. Soc. 126 (2004) 13184.[61] S. Shirakawa, Y. Tanaka, K. Maruoka, Org. Lett. 6 (2004) 1429.[62] ISI web of knowledge, http://wok.mimas.ac.uk, Survey conducted on 3rd January 2006.[63] J. Eastoe, S. Gold, Phys. Chem. Chem. Phys. 7 (2005) 1352.[64] A. Dardin, J.B. Cain, J.M. DeSimone, C.S. Johnson, E.T. Sanulski, Macromolecules
30 (1997) 3592; E.J. Beckman, Chem. Commun. (2004) 18. C.R. Yonker, B.J. Palm-er, J. Phys. Chem. A 105 (2001) 8; J.T. Gerig, J. Am. Chem. Soc. 127 (2005) 277.
[65] W.R. Sanderson in Handbook of Green Chemistry and Technology, J.H. Clark,D.J. Macquarrie (Eds.), Blackwell, Oxford, England, 2002, p. 256.
[66] D. Hancu, J. Green, E.J. Beckman, Acc. Chem. Res. 35 (2002) 757.[67] M. McCoy, Business 77 (1999) 11; M. McCoy, Chem. Eng. News June (1999) 11;
Unattributed article, Chem. Week, 27 March (2002)[68] G.S. Lal, G.P. Pez, R.G. Syvret, Chem. Rev. 96 (1996) 1737.[69] G. Sandford, Tetrahedron 59 (2003) 437.[70] P.D.I. Fletcher, S.J. Haswell, E. Pompo-Villar, B.H. Warrington, P. Watts,
S.Y.F. Yong, X. Zhang, Tetrahedron 58 (2002) 4735; S.J. Haswell, R.J. Middleton,B. O’.Sullivan, V. Skelton, P. Watts, P. Styring, Chem. Commun. (2001) 391.
[71] R.D. Chambers, R.C.H. Spink, Chem. Commun. (1999) 833. R.D. Chambers,D. Holling, R.C.H. Spink, G. Sandford, Lab on a Chip 1 (2001) 132.
[72] R.D. Chambers, M.P. Greenhall, J. Hutchinson, Tetrahedron 52 (1996) 1.[73] N. de Mas, A. Gunther, M.A. Schmidt, K.F. Jensen, Ind. Eng. Chem. Res. 42 (2003) 698.[74] S.K. Ritter, C&EN, 14th February (2005) 35. R.D. Chambers, M.A. Fox, D. Holling,
T. Nakano, T. Okazoe, G. Sandford, Lab on a Chip 5 (2005) 191.[75] J.H. Clark, D. Wails, T.W. Bastock, Aromatic Fluorination, CRC Press, Boca Raton, 1996.[76] M.A. Subramanian, L.E. Manzer, Science 297 (2002) 1665; M.A. Subramanian,
T.G. Calvarese, Fluorine and the Environment: Agrochemicals, Archaeology, GreenChemistry and Water, Advances in Fluorine Science, Chapter 6.
[77] G.W. Gray, M. Hird, D. Lacey, K.J. Toyne, Perkin Trans. 2 (1989) 2041; G.W. Gray,M. Hird, K.J. Toyne, Mol. Cryst. Liquid Cryst. 195 (1991) 221; A.S. Matharu,D.J. Byron, R.C. Wilson, Liquid Cryst. 19 (1995) 39.
[78] N. Bardsley, Display search, Survival of the fittest, talk given at USDC investor’sconference, New York, March 15th 2005.
[79] J.W. Goodby, A.S. Matharu, University of York, personal communication.[80] J. Holloway, Lecture given at University College, London, January 2005.[81] G. Hodson, B.O.C Edwards, On site fluorine generation in the electronics industry,
talk given at ‘Fluorum’ Fluorine technology Bureau Meeting, Manchester, 9th De-cember 2005.
[82] H.-J. Bohm, D. Banner, S. Bendels, M. Kansy, B. Kuhn, U. Obst-Sander, M. Stahl,Chem. Bio. Chem. 5 (2004) 637.
[83] P. Jeschke, Chem. Bio. Chem. 5 (2004) 570.[84] G.W. Gribble, J. Chem. Ed. 81 (2004) 1441.[85] D. Meshri, Industrial applications of inorganic fluorides, Advances Inorganic
Fluorides, T. Nakajima, B. Zemva, A. Tressaud (Eds.), Elsevier, 2000, Chapter 20,pp. 661–682.
Note from the Editor
See also in this series the chapters by R. Tuckett and A. Sekiya et al. devoted to the
green house effect of SF5CF3 and to CFCs and HCFCs substitutes, respectively.
See also in this series the chapter of C. Oppenheimer and G. Sawyer devoted
to fluorine emissions from volcanoes.
Stewart J. Tavener and James H. Clark202

CHAPTER 6
Emerging ‘‘Greener’’ Synthetic Routes toHydrofluorocarbons: Metal Fluoride-
Mediated Oxyfluorination
M.A. Subramanian,� and T.G. Calvarese
DuPont Central Research and Development, Experimental Station, Wilmington, DE19880-0328, USA
Contents
1. Introduction 204
1.1. Fluoroaliphatics 204
1.2. Fluoroaromatics 205
2. Aliphatic fluorination 205
2.1. Current catalytic routes to HCFCs and HFCs 205
2.2. HCl waste issue 206
2.3. Oxy(chloro)fluorination and oxyfluorination 207
2.4. Oxyfluorination of aliphatics through inorganic fluorides 208
3. Aromatic fluorination 210
3.1. Aromatic oxyfluorination using HF recyclable inorganic fluorides 211
4. Conclusions 213
Acknowledgments 214
References 214
AbstractCurrent technologies used in the manufacture of aliphatic and aromatic hydrofluorocar-
bons (HCFs) generate large quantities of waste, particularly hydrochloric acid, which is
under severe environmental scrutiny and needs to be eliminated. Although highly desir-
able, direct and selective conversion of a C–H bond to a C–F bond using HF is not feasible
due to the thermodynamic considerations. An environmentally ‘‘greener’’ process for the
synthesis of fluorocarbons can be envisioned through an intermediate inorganic metal
fluoride that is capable of fluorinating a C–H bond of a desirable hydrocarbon and could be
regenerated to the appropriate oxidized metal fluoride with oxygen and HF. This process,
when successfully implemented, will eliminate H2O as the only by-product. In this chapter,
we review on our research efforts to achieve oxyfluorination of a C–H bond to C–F bond
using HF recyclable inorganic metal fluorides (e.g. CuF2, AgF) to form many industrially
important aliphatic and aromatic hydrofluorocarbons used in the manufacture of refriger-
ants, etching agents, industrial polymers, pharmaceuticals and agrochemicals.
�Corresponding author.;
E-mail: [email protected]
FLUORINE AND THE ENVIRONMENT, VOLUME 2
ISSN 1872-0358 DOI: 10.1016/S1872-0358(06)02006-9
r 2006 Elsevier B.V.All rights reserved
203

1. INTRODUCTION
Green chemistry is defined as ‘‘The utilization of a set of principles that reduces or
eliminates the use or generation of hazardous substances in the design, man-
ufacture and application of chemical products’’ [1]. The tools of green chemistry
are alternative feedstocks, solvents and reagents and zero-waste stoichiometric
processes. Future environmentally benign chemical technologies should focus on
the redesign, at the atomic and molecular level, of manufacturing processes with
the aim of reducing or eliminating the generation of hazardous wastes. In this
regard, one area receiving much attention in recent years is the industrial scale
production of fluorinated aliphatic and aromatic hydrocarbons as they broadly
fulfill many important societal needs such as health care, agricultural production,
climate control and food storage, to name a few. In this chapter, we will review
some of the current fluoroorganics manufacturing technologies, the environmen-
tal issues associated with their process chemistries, and emerging greener routes
for achieving the ultimate goal of zero-waste processes.
1.1. Fluoroaliphatics
The first commercial catalytic system, SbCl5, for the production of aliphatic
chlorofluorocarbons (CFCs) was based on the pioneering work of Swartz [2]
during the 1890s. DuPont developed and commercialized CFCs during the
1930s. Since then, these marvelously stable, nontoxic and nonflammable com-
pounds have found their way into many aspects of modern lifestyle [3]. Refrig-
eration, air conditioning, energy-conserving foams, cleaning of electronic circuit
boards and firefighting are just a few of the applications of CFCs. A landmark
paper [4] published by Molina and Rowland in 1974 showed that CFCs are
probably responsible for the destruction of ozone layer through chlorine atom
catalyzed reaction cycle in the stratosphere [4]. During the 1980s, the incredible
stability of CFCs was scientifically linked to the depletion of the earth’s ozone
layer by the NASA Ozone Trends Panel. The Montreal Protocol, an international
United Nations agreement, signed by many nations of the world in 1987, called
for the phase out of CFCs [3]. This created a major challenge for industrial
catalytic scientists and engineers to identify, develop and commercialize an en-
tirely new family of products that were environmentally safer yet still satisfied the
needs of society.
The CFC replacements need to be nontoxic, nonflammable and have signifi-
cantly lower, or zero ozone depletion potentials. Many organic- and aqueous-
based systems, that do not contain chlorine or fluorine, have been developed for
some applications while others use hydrochlorofluorocarbons (HCFCs) and hy-
drofluorocarbons (HFCs). Unlike hydrocarbon catalysis, the presence of hydro-
gen, chlorine and fluorine in the same molecule creates a very large number of
M.A. Subramanian and T.G. Calvarese204

isomeric possibilities. As a result of many years of careful study, the early list of
4800 potential candidates has been narrowed down to less than a dozen viable
molecules and their blends and azeotropes [5]. Many of these are now being
commercially manufactured by DuPont and other chemical companies (Table 1).
1.2. Fluoroaromatics
Fluorinated aromatics are widely used in the synthesis of pharmaceuticals and
agrochemicals with a volume exceeding 5000 tons per year. The efficacy of
pharmaceuticals and agrochemicals can be improved by the incorporation of
fluorine in the structure. Figure 1 shows the chemical structure of Sustivas, an
AIDS drug and Nustars, a fungicide based on fluoroaromatics, developed by
DuPont. The reagents used as starting material for the industrial scale manu-
facture of many fungicides and drugs are fluorinated derivatives of benzenes.
The manufacturing steps of many complex fluoroaromatics still involve classical
fluorination chemistries [6,7] that generate wastes and need to be addressed.
2. ALIPHATIC FLUORINATION
2.1. Current catalytic routes to HCFCs and HFCs
In this section, we briefly summarize current synthetic methods to CFC alterna-
tives. More comprehensive reviews with many examples have been published
Table 1. Some important HFC substitutes for CFCs
Market Phased out CFC CFC alternative
Refrigerants CFC-12 (CF2Cl2) HFC-134a (CF3CFH2)
HCFC-22 (CHF2Cl)
HFC-32 (CH2F2)
HFC-125 (CF3CF2H)
HCFC-124 (CF3CHFCl)
HFC-152a (CH3CHF2)
(Blends)
Blowing agents CFC-11 (CFCl3) HCFC-141b (CH3CFCl2)
HCFC-123 (CF3CHCl2)
HCFC-22 (CHF2Cl)
(Blends)
Cleaning agents CFC-113 (CF2ClCFCl2) Blends/azeotropes
Hydrocarbons
Emerging ‘‘Greener’’ Synthetic Routes to Hydrofluorocarbons 205

elsewhere [8–10]. Current technology for the manufacture of HCFCs and HFCs
involves stepwise formation of a C–Cl bond from a C–H bond followed by halogen
exchange with HF to give a C–F bond. This can be done in one step using vapor
phase chlorofluorination catalysis or in multiple steps involving separate chlorin-
ation followed by fluorine exchange. Once the desired starting material is selected,
the carbon–fluorine bonds can be increased or rearranged by a variety of trans-
formations through heterogeneous catalysis. Some of the reaction mechanisms
used are addition of HF across the double bond, halogen exchange, isomerization,
disproportionation, conproportionation, hydrodehalogenations, dehydrohalogena-
tion and coupling reactions [8–10]. When an olefin or chloro-olefin is the starting
material, the initial step is HF addition to the double bond. In many cases this is
followed by halogen exchange to make highly fluorinated analogues.
2.2. HCl waste issue
Although highly desirable, direct and selective conversion of a C–H bond to a C–F
bond using HF (with elimination of H2) is not feasible due to the thermodynamic
considerations based on relative bonds strengths [11] of H–F (565 kJmol�1) and
C–H (411 kJmol�1) in the reactant side, C–F (485 kJmol�1) and H–H
(432 kJmol�1) in the hypothetical product side. Hence, fluorocarbon catalysis is
still largely dominated by halogen exchange reactions involving initial formation of
a C–Cl bond and halogen exchange with HF [8–10]. These reactions generate
very large quantities of HCl as a by-product, which is under severe environmental
scrutiny and needs to be disposed of after neutralizing with alkali or else recycled.
For every mole of C–F bond produced from C–H bond, two moles of HCl are
generated (equations (1) and (2)).
C2Hþ Cl2 ! C2Clþ HCl (1)
C2Clþ HF ! C2Fþ HCl (2)
Fig. 1. Structures showing fluoroaromatic molecules used in pharmaceutical andagriculture applications.
M.A. Subramanian and T.G. Calvarese206

For example, the production of CF3–CFH2 (134a) from ethylene eliminates 10
moles of HCl for every mole of CF3–CFH2 (134a) as shown below.
CH2 ¼ CH2 þ 4Cl2 ! CCl2 ¼ CCl2 þ 4HCl (3a)
CCl2 ¼ CCl2 þ 4HFþ Cl2 ! CF32CFCl2 þ 4HCl (3b)
CF32CFCl2 þ 2H2 ! CF32CFH2 þ 2HCl (3c)
CH2 ¼ CH2 þ 5Cl2 þ 4HFþ 2H2 ! CF32CFH2 þ 10HCl ðNetÞ (3d)
Because the supply exceeds demand, the HCl generated often cannot be sold
or reused even after purification. Although electrochemical fluorinations have
been practiced commercially for many years, the main products of the reactions
are typically perfluorocarbons since C–H bonds rarely survive. New methods,
which avoid the need to feed chlorine and disposal of HCl are needed to prepare
HCFCs and HFCs are obviously desirable.
2.3. Oxy(chloro)fluorination and oxyfluorination
Although the direct synthesis of C–F bonds from C–H bonds using HF is ther-
modynamically unfavorable, C–F bond formation can take place in the absence of
chlorine under oxidative conditions. This can be achieved by the presence of
oxygen in the reactants and subsequent formation of water providing a thermo-
dynamic driving force for the oxy(chloro)fluorination (equation (4)) or oxyfluori-
nation (equation (5)) reactions to proceed. In equation (4), HCl is believed to be
oxidized in situ to Cl2, which is then followed by chlorination and HF exchange.
Handling of Cl2 is eliminated and the HCl disposal is significantly reduced. It has
been shown that methane can be converted into CCl2F2 using oxy(chloro)fluor-
ination with conversion and selectivity greater than 90% [12].
2C2Hþ 2HClþ 2HFþO2 ! 2C2Fþ 2H2Oþ 2HCl (4)
2C2HþO2 þ 2HF ! 2C2Fþ 2H2O (5)
The successful implementation of oxyfluorination technology (equation (5))
could have significant environmental and economic impacts as this reaction
scheme eliminates handling of Cl2 and HCl disposal and produces H2O as the
only by-product. Earlier work at DuPont [13] on the reaction of HF/toluene/PbO2
to F2CHC6H5 and FCH2C6H5 is further evidence that metal oxides and HF (or
metal fluorides) are capable of fluorinating hydrocarbons. An intriguing reaction
was reported many years ago [14] involving the oxidative fluorination of ethylene
to vinyl fluoride using Pd–Cu catalysts. Yet, there are only very few reported
examples which make C–F bonds directly from hydrocarbons without going
through a chlorinated intermediate.
Emerging ‘‘Greener’’ Synthetic Routes to Hydrofluorocarbons 207

2.4. Oxyfluorination of aliphatics through inorganic fluorides
An environmentally ‘‘greener’’ process for the synthesis of HFCs can be envi-
sioned through an intermediate inorganic metal fluoride that is capable of fluor-
inating a C–H bond of a desirable hydrocarbon and could be regenerated to the
appropriate oxidized metal fluoride with oxygen and HF. The general synthetic
approach is shown in equations (6a) and (6b) and the net reaction is shown in
equation (6c).
C2HþM2Fx ! M2Fx�2 þ C2Fþ HF ðFluorine carrier reactionÞ (6a)
M2Fx�2 þ 2HFþ 1=2O2 ! M2Fx þ H2O ðMetal fluoride regenerationÞ (6b)
2C2Hþ 2HFþO2 ! 2C2Fþ 2H2O ðNetÞ (6c)
Key to the economic success of the above process is finding a metal fluoride
that is capable of oxidizing a C–H bond to C–F bond and could be regenerated to
the appropriate oxidized metal fluoride with oxygen and HF. A survey of oxida-
tion–reduction potentials of some of the selected metals is shown in Table 2. The
metal fluorides with E41 are strong oxidizing agents and can only be regen-
erated with elemental fluorine (e.g. CoF3, AgF2). This process is not economically
viable because of high cost of elemental fluorine. Those metal fluorides with Eo0
are easy to prepare from HF and O2, but are not strong enough to oxidize a C–H
bond (e.g. ZnF2, CoF2). The most attractive candidates are the ones with re-
duction potential in the range 1oE40. Copper(II) fluoride and silver(I) fluorides
provide an excellent platform for this chemistry [15].
Reactions of methane and ethane with HF recyclable metal fluorides to give
fluorocarbons have been reported briefly in the patent and journal literature
[16–18]. Reaction of methane with hydrogen fluoride in the presence of oxygen
and the salt or oxide of a variable valency metal as catalyst yielded small
amounts of fluoromethane and difluoromethane at temperatures above 5001C.
Olsen et al. [17] reacted copper(II) fluoride with methane at high temperatures
(46001C) and found products that always included copper metal, hydrogen flu-
oride, fluoromethane and carbon. Although activity was first detected around
Table 2. Oxidation–reduction potential for metals in various oxidation states
E041 14E040 E0o1
Co3++e�3Co2+ Cu2++2e�3Cu0 Zn2++2e�3Zn0
Ag2++e�3Ag1+ Ag1++e�3Ag0 Mg2++2e�3Mg0
Pb4++2e�3Pb2+ Te4+4e�3Te0 Al3++3e�3Al0
Ce4++e�3Ce2+ Hg2++2e�3Hg0 Co2++2e�3Co0
Note: E0, reduction potential ¼ 0.0 for 2H++2e�3H2.
M.A. Subramanian and T.G. Calvarese208

6001C, appreciable yields of products were not produced until 7501C. Reaction of
ethylene with pure CuF2 or CuF2 dissolved in a eutectic melt of alkali and alkaline
earth fluorides between 4501C and 7001C yielded vinyl fluoride and HF and Cu
metal. A similar reaction with propylene at 4001C yielded 2-fluoropropene [19].
The reaction cycle is shown in equations (7a) and (7b) and the net reaction
scheme is shown in equation (7c).
C2Hþ CuF2 ! C2Fþ HFþ Cu (7a)
CuþO2 þ 2HF ! CuF2 þ 2H2O (7b)
2C2HþO2 þ 2HF ! 2C2Fþ 2H2O ðNetÞ (7c)
Copper metal powder formed is oxidized at 4001C by air and reacted with
hydrogen fluoride at 3501C to regenerate CuF2. This can be achieved either
sequentially or in one step. It has been shown that regenerated CuF2 reacted with
hydrocarbons with identical yields of the HFCs demonstrating that the reaction
cycle may be carried out without loss of activity [18]. The above observation is a
proof of concept for oxyfluorination reaction using HF recyclable inorganic flu-
orides. Although the CuF2-based reactions yielded HFCs with good selectivity,
the yields are very low (2–5%) at moderate temperatures (p6001C) making it
difficult to implement in commercial production.
Recent work at DuPont [19] has shown that when ethylene gas is reacted with
AgF at 260 1C, selective formation of vinyl fluoride (CH2 ¼ CHF) is formed. Dur-
ing the course of the reaction AgF is simultaneously converted into an interesting
solid silver cluster compound with a molecular formula, Ag10F8C2 and Ag metal.
The crystal structure of Ag10F8C2 (along ac plane) is shown in Fig. 2. The com-
pound crystallizes in a tetragonal structure with a ¼ 7.474(1) and c ¼ 10.348(1) A
(space group P4/n) [19–21]. In this structure, Ag9 atoms form corners of a cage
with short Ag–Ag distances and the 10th Ag atom is located outside the cage
forming a ‘chandelier-like’ arrangement. A single chandelier unit with bridging
fluorine atoms is also shown in Fig. 2. The C2 groups are located inside the Ag9cages with a C–C distance close to 1.22 A [19–21] indicating a carbon–carbon
triple bond. Neutron and synchrotron X-ray diffraction crystal structure refine-
ments pointed out that there is a large degree of dynamic and static disorder in
carbon and fluorine sites at room temperature. Variable temperature 13C and 19F
magic-angle spinning NMR showed evidence for crystallographic phase transition
in the range 240–260K and above, the transition C2 units undergo rapid
re-orientational motion and F� ions migrate from site to site in an ion-diffusion
process. The above results indicate that Ag10F8C2 is a metastable phase.
Ag10F8C2 compound is stable in air at room temperature. Remarkably, this
phase is decomposed at 3501C in N2 yielding stoichiometric amounts of CF3–CF3
(FC-116), AgF and Ag. Alternatively, further reaction of Ag10F8C2 with ethylene at
Emerging ‘‘Greener’’ Synthetic Routes to Hydrofluorocarbons 209

3301C produced commercially important HFCs: CH2F–CF3 (HFC-134a),
CHF2–CF3 (HFC-125), CF3–CF3 (FC-116), and CH2 ¼ CF2 (HFC-1132a) [19].
This shows that the Ag10F8C2 is a better fluorinating agent than the starting AgF.
The AgF–ethylene reaction cycle is shown in Fig. 3. The solid leftover in the
reactor after the completion of the reaction cycle is Ag metal and the conversion
is stoichiometric. The reaction cycle could be repeated without loss of activity
during the regeneration step.
3. AROMATIC FLUORINATION
Aromatic fluorination chemistry has a remarkably long history, and the first
successful synthesis of aryl C–F bonds was reported in 1870 [22]. Significant
developments in the area in the early part of the 20th century included the dis-
covery of Balz–Schiemann reaction [23,24] involving diazotization of an aromatic
amine in the presence of tetrafluoroboric acid and the reaction scheme is shown
in Fig. 4. The above reaction produces large quantities of waste (such as NaBF4,
Fig. 2. Crystal structure of Ag10F8C2. The Ag atoms are shown in blue, fluorineatoms are in green and carbon atoms are in black.
M.A. Subramanian and T.G. Calvarese210

NaCl) and is typical of the poor atom economy associated with fine chemical
manufacturing. Recent industrial advances [25] use HF in place of the fluoroboric
acid, however, stoichiometric amounts of NaF and NH4F salts are produced as
waste with the fluorobenzene. Other approaches using HF exchange of chloro-
benzene also generate HCl as a waste [7].
3.1. Aromatic oxyfluorination using HF recyclable inorganicfluorides
Recently, Subramanian [15,26] has shown that vapor-phase reaction of benzene
over CuF2 formed fluorobenzene selectively with conversion efficiencies as high
as 35% for a single pass. This can be achieved at relatively low temperatures
when compared with fluorination of aliphatics with CuF2 as discussed earlier. The
reaction scheme is shown in Fig. 5. In a typical experiment, an Inconel reactor is
charged with 25g of copper oxide, heated to 4001C in a flow of HF to generate the
CuF2. After 3 h, a stream of vaporized benzene with N2 as carrier gas is passed
over the catalyst. On-line GCmass spectrometer is used to follow the course of the
reaction. We find the reaction to be very specific (selectivity to fluorobenzene is
495%) and the conversion is temperature dependent. At 4001C, the conversion
rate is 10% and rising to 35% at 5501C. X-ray diffraction analysis (Fig. 6) of CuF2
H2O
10Ag0
HF + O2
10AgF
CH2=CH2
Ag10F8C2
CH2=CH2
CH2=CHF
260°C350°Cin N2
CF3-CF3
CH2=CF2 FluoromonomerCH2F-CF3 (HFC-134a) Refrig. BlendCF3-CF3 (FC-116) Refrig. BlendCHF2-CF3 (HFC-125) Refrig. Blend
330°C
Fig. 3. AgF–ethylene reaction scheme showing the conditions of reactions andthe HFCs isolated. The by-product of the reaction cycle is H2O.
NH2 N2+BF4
-F1. HCl, NaNO2
2. HBF4
∆
Fig. 4. Balz–Schiemann aromatic fluorination reaction.
Emerging ‘‘Greener’’ Synthetic Routes to Hydrofluorocarbons 211

after exposing to benzene vapor for 5 and 15min at 5501C showed the progressive
formation of copper metal during the reaction, and the reaction is stoichiometric.
When the conversion begins to fall, the benzene feed is switched off and an HF/O2
CuF2 +
F
+ HF + Cu0
1/2 O2 (400°C)
450-550°C
HFH2O
Fig. 5. CuF2–benzene reaction cycle to form fluorobenzene. The by-product ofthe reaction is H2O.
Fig. 6. Powder X-ray diffraction plots for CuF2 after reaction with benzene: 5min(top) and 15min (bottom) at 5001C.
M.A. Subramanian and T.G. Calvarese212

stream is passed over the catalyst for 3 h at 4001C to regenerate CuF2. The
reaction cycle can be repeated without a loss of activity during the fluorination step.
X-ray profile chemical analysis scan across a particle of CuF2 (�25mm) exposed
to benzene vapor for 15min at 5501C is shown in Fig. 7. The inset shows the
cross-section SEM image of the same particle. As the reaction progressed, the
particle gets covered with copper metal and the eventual drop in the reaction rate
is due to the inaccessibility of inner core CuF2 for the reaction. This showed that
the fluorobenzene conversion not only depends on the temperature, but also on
the surface area of the CuF2. We have found that AlF3 is an excellent support for
CuF2, since it is stable to HF and not oxidized with air to the oxide. Depending on
the surface area of the AlF3, it is possible to disperse the CuF2 and gain higher
conversions. Reaction of AgF with benzene yielded stoichiometric amounts of
fluorobenzene at 3001C and mixture of mono- and di-fluorobenzene at 350–4001C.
4. CONCLUSIONS
Heterogeneous catalysis has played a key role in the synthesis of CFC alterna-
tives. However, for the process to be environmentally safer, the HCl must be
recycled or disposed of safely. The ‘‘greener’’ processes discussed in this chapter,
although intriguing, are still in the conceptual state and need to be optimized for
large-scale production. Although HFCs do not destroy stratospheric ozone, there
are growing concerns about their widespread usage as they are powerful green-
house gases. For instance, HFC-134a is 1300 times more harmful than CO2, ac-
cording to the International Panel on Climate Change. In addition to safer processes
for HFC production, much work is in progress in industrial and government lab-
oratories to develop environmentally safer, ‘‘third generation’’ CFC alternatives.
Note of the Editor: see also in this series the chapter by A. Sekiya et al. devoted
to CFCs and HCFCs substitutes [27].
Fig. 7. X-ray chemical analysis scan for CuF2 particle exposed to benzene at5501C showing fluorine depletion on the surface (grey line).
Emerging ‘‘Greener’’ Synthetic Routes to Hydrofluorocarbons 213

ACKNOWLEDGMENTS
We thank L.E. Manzer, V.N.M. Rao, A.E. Feiring and B.E. Smart for many helpful
discussions during the course of this work. We also thank A.J. Vega and
R.L. Harlow for NMR and X-ray diffraction studies of Ag10F8C2, respectively.
REFERENCES
[1] P.T. Anastas, J. Warner, Green Chemistry Theory and Practice, Oxford UniversityPress, Oxford, 1998.
[2] F. Swartz, Bul. Acad. R. Belg. 24 (1892) 309; 35 (1898) 301.[3] M. Molina, R.S. Rowland, Nature 249 (1974) 810.[4] L.E. Manzer, Science 249 (1990) 31.[5] M.O. McLinden, D.A. Didion, Quest for alternatives–a molecular approach; inevitable
in seeking refrigerants, ASHRAE J. (1987) December 3.[6] R.E.Banks, B.E.Smart, J.C.Tatlow (Eds.), Organofluorine Chemistry: Principles and
Commercial Applications, Plenum, New York, 1994.[7] J.H. Clark, D. Wails, T.W. Bastock, Aromatic Fluorination, CRC Press, Boca Raton,
FL, 1996.[8] V.N.M. Rao, L.E. Manzer, Adv. Catal. 39 (1993) 329.[9] Z. Ainbinder, L.E. Manzer, M.J. Nappa, Catalytic routes to hydro (chloro) fluorocar-
bons, Environ. Catal. (1999) 197–212.[10] L.E. Manzer, M.J. Nappa, Appl. Catal. 221 (2001) 267.[11] J.E. Huheey, Inorganic Chemistry: Principles of Structure and Reactivity, 3rd edition,
Harper & Row, New York, 1983.[12] W.J.M. Pieters, E.J. Carlson, Patent US 4,039,596, 1977.[13] A.E. Feiring, Patent US 4,051,168, 1977.[14] T. Kuroda, Y. Takamitsu, Patent JP 52-122,310, 1977.[15] M.A. Subramanian, L.E. Manzer, Science 297 (2002) 1665.[16] G.M. Whitman, Patent US 2,578,913, 1951.[17] D.H. Olsen, Patent US 3,398,203, 1968.[18] J.H. Moss, R. Ottie, J.B. Wilford, J. Fluorine Chem. 6 (1975) 393.[19] M.A. Subramanian, Patent 6,096,932, 2000.[20] M.A. Subramanian, R.L. Harlow, A. Vega, unpublished results.[21] G.C. Guo, G. Zhou, Q. Wang, T.C.W. Mak, Angew. Chem. 37 (1998) 630.[22] R. Schmitt, H. Von Gehren, J. Prakt. Chem. 1 (1870) 394.[23] G. Balz, G. Schiemann, Chem. Ber. 60 (1927) 1186.[24] C.D. Hewitt, M.J. Silvester, Aldrichim. Acta 21 (1988) 3.[25] M. Krackov, Patent EP 330420, 1988.[26] M.A. Subramanian, Patent US 6,166,273, 2000.[27] A. Sekiya, M. Yamabe, K. Tokuhashi, Y. Hibino, R. Imasu, H. Okamoto, Evaluation
and Selection of CFC Alternatives, in: A. Tressaud, (Ed.), Advances in Fluorine Sci-ence, Vol. 1, Elsevier, 2006, pp. 33–88.
M.A. Subramanian and T.G. Calvarese214

CHAPTER 7
Fluorine Analysis by Ion Beam Techniquesfor Dating Applications
M. Dobeli,1,� A.A.-M. Gaschen,2 and U. Krahenbuhl2
1Paul Scherrer Institute, c/o ETH Zurich, HPK H32, CH-8093 Zurich, Switzerland2Laboratory for Radio- and Environmental Chemistry, University of Berne, Freiestrasse 3,
3012 Berne, Switzerland
Contents
1. Introduction 216
2. Analysis techniques 217
2.1. Nuclear reaction analysis 217
2.1.1. Basics 218
2.1.2. Thick target yields 218
2.1.3. Depth profiling 220
2.1.4. Sensitivity 224
2.1.5. Accuracy 225
2.1.6. Imaging 226
2.1.7. Charged particle activation 226
2.2. Elastic scattering 226
2.3. PIXE 227
3. Applications 227
3.1. Fluorine diffusion in Antarctic meteorites 228
3.2. Diffusion profiling in archaeological bones and teeth 230
3.2.1. Introduction 230
3.2.2. History and related investigations 231
3.2.3. Diffusion theory and methods of analysis 233
3.2.4. Micromapping with PIGE, PIXE and NRA 235
3.2.5. Profile evaluation by error function-fitting 237
3.2.6. Artificial fluorine enrichment 239
3.2.7. The effect of the material itself 241
3.2.8. Tooth as an alternative matrix 242
3.2.9. The reconstruction of the change of D during time 244
4. Summary 246
Acknowledgements 247
Appendix:.
Acronyms and glossary 247
References 247
�Corresponding author. Tel.: +41-44-633-2045; Fax: +41-44-633-1067;
FLUORINE AND THE ENVIRONMENT, VOLUME 2
ISSN 1872-0358 DOI: 10.1016/S1872-0358(06)02007-0
r 2006 Elsevier B.V.All rights reserved
215

AbstractMegaelectron volt (MeV) ion beam techniques offer a number of non-destructive analysis
methods that allow to measure depth profiles of elemental concentrations in material
surfaces. Elements are identified by elastic scattering, by specific nuclear reaction prod-
ucts or by emission of characteristic X-rays. With nuclear microprobes raster images of
the material composition at the surface can be obtained. Particle-induced gamma-ray
emission (PIGE) is especially suited for fluorine detection down to the ppm concentration
level.
The technical aspects of fluorine detection by nuclear reactions as well as its appli-
cations to fluorine analysis in geological and archaeological objects are reviewed. Special
attention is given to the determination of exposure ages of meteorites on the Antarctic ice
shield and burial durations of archaeological bones and teeth. This information can be
acquired by evaluation of the shape and penetration depth of the diffusion profile of fluorine
that was incorporated by the sample from the environment. For a quantitative assessment
of the data, several factors like ambient conditions and diagenetic state of the material
have to be taken into account.
1. INTRODUCTION
Many investigations about fluorine uptake are reported in literature. The goal of
these examinations is to unravel the exposure duration of different materials to
various environmental conditions. Here, the application of ion beam analysis in
studies on terrestrial contamination of meteorites from Antarctica and diffusion
profiles in bones from archaeological burial sites is presented.
Fluorine detection by nuclear methods is a well-established experimental tech-
nique. More than 200 publications on the subject can be found in the literature. In
the 1960s, it was recognized that the thorough and precise knowledge on nuclear
scattering and reactions offered a very valuable means for accurate elemental
analysis of materials. The main reason for the high accuracy of ion beam tech-
niques is the fact that the interaction of projectile and target particle takes place at
an energy range far above electronic binding energies and can be treated as the
encounter of two ‘‘naked’’ nuclei. Thus, no corrections for the atomic or molecular
electronic structure have to be taken into account and virtually no ‘‘matrix effect’’
exists. In addition, the techniques are virtually non-destructive and straightfor-
ward to perform. By these reasons, the field of Megaelectron volt (MeV) ion beam
physics evolved fast and found many applications for the compositional and
structural characterization of surfaces. It also made its way into research areas
such as geology, mineralogy, biology, medicine, environmental science and
archaeology. A comprehensive handbook on all techniques used in ion beam
analysis was published in 1977 [1] and 1995 [2].
Owing to a number of very suitable resonant nuclear reactions with high
cross-sections and relatively unambiguous reaction products that can be used
as ‘‘fingerprints’’, fluorine has become one of the popular chemical elements
M. Dobeli et al.216
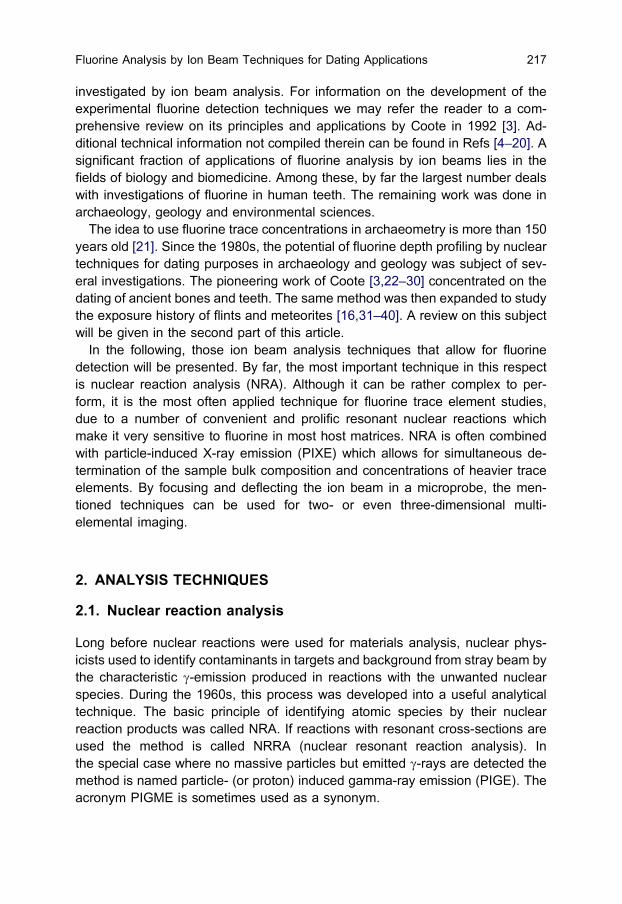
investigated by ion beam analysis. For information on the development of the
experimental fluorine detection techniques we may refer the reader to a com-
prehensive review on its principles and applications by Coote in 1992 [3]. Ad-
ditional technical information not compiled therein can be found in Refs [4–20]. A
significant fraction of applications of fluorine analysis by ion beams lies in the
fields of biology and biomedicine. Among these, by far the largest number deals
with investigations of fluorine in human teeth. The remaining work was done in
archaeology, geology and environmental sciences.
The idea to use fluorine trace concentrations in archaeometry is more than 150
years old [21]. Since the 1980s, the potential of fluorine depth profiling by nuclear
techniques for dating purposes in archaeology and geology was subject of sev-
eral investigations. The pioneering work of Coote [3,22–30] concentrated on the
dating of ancient bones and teeth. The same method was then expanded to study
the exposure history of flints and meteorites [16,31–40]. A review on this subject
will be given in the second part of this article.
In the following, those ion beam analysis techniques that allow for fluorine
detection will be presented. By far, the most important technique in this respect
is nuclear reaction analysis (NRA). Although it can be rather complex to per-
form, it is the most often applied technique for fluorine trace element studies,
due to a number of convenient and prolific resonant nuclear reactions which
make it very sensitive to fluorine in most host matrices. NRA is often combined
with particle-induced X-ray emission (PIXE) which allows for simultaneous de-
termination of the sample bulk composition and concentrations of heavier trace
elements. By focusing and deflecting the ion beam in a microprobe, the men-
tioned techniques can be used for two- or even three-dimensional multi-
elemental imaging.
2. ANALYSIS TECHNIQUES
2.1. Nuclear reaction analysis
Long before nuclear reactions were used for materials analysis, nuclear phys-
icists used to identify contaminants in targets and background from stray beam by
the characteristic g-emission produced in reactions with the unwanted nuclear
species. During the 1960s, this process was developed into a useful analytical
technique. The basic principle of identifying atomic species by their nuclear
reaction products was called NRA. If reactions with resonant cross-sections are
used the method is called NRRA (nuclear resonant reaction analysis). In
the special case where no massive particles but emitted g-rays are detected the
method is named particle- (or proton) induced gamma-ray emission (PIGE). The
acronym PIGME is sometimes used as a synonym.
Fluorine Analysis by Ion Beam Techniques for Dating Applications 217

2.1.1. Basics
In principle, light particles from protons to 4He can be used to excite nuclear re-
actions in fluorine. There has been some work on NRA by 19F(d,p)20F, 19F(d,a)17Oand 19F(a,p)22Ne (for details see Ref. [2]), but by far the most popular are the proton-
induced reactions leading to g-emission. They have the benefit that g-detectors can
be placed outside the vacuum chamber and there is no background from scattered
beam particles. Reactions with charged products are only of advantage for depth
profiling in energy regions exhibiting a plateau in the cross-section.
If protons of an energy up to a few MeV are used, two basically different
nuclear processes lead to g-ray emission from 19F. The first is inelastic scattering
of the type 19F(p,p0g)19F, which produces two intense low-energy g-lines at 110
and 197 keV.This radiation is detected best by a small Ge (Li) detector with a low
Compton background (see Fig. 1). Yield curves for the two lines have been
published by Stroobants et al. [41], Demortier et al. [42] and Grambole et al. [43].
The second reaction is 19F(p,ag)16O which has a Q-value of 8.114MeV and emits
a g-ray triplet with energies of 6.129, 6.917 and 7.117MeV. These high-energy g-rays are easily detected by Ge, NaI or bismuth germanium oxide (BGO) detectors
(see Fig. 1) and absorption in material surrounding the sample is not important
(1 cm of steel absorbs only 20% of g-rays in this energy range). The g-yield is not
strongly dependent on the angle to the incident beam [18] and detector positions
between 45 and 1351 have been used. Excitation curves for this reaction have
been measured among others by Dababneh et al. (1993) [13]. Their result is
displayed in Fig. 2. The excitation function exhibits a number of isolated, sharp
resonances, the most important being at 340, 668, 872, 935 and 1371 keV. The
872 keV resonance has the highest cross-section of 661mb. It is followed by the
1371 keV (300mb), 935 keV (180mb) and 340 keV (102mb) peaks. The strong-
est resonance at 872 keV has a width of 4.5 keV [2].
Owing to the high reaction cross-section, the intensive and sharp resonances,
and the relatively background-free high-energy g-lines the 19F(p,ag)16O reaction
has become the standard process used for fluorine NRA.
2.1.2. Thick target yields
When a bulk material is probed by a proton beam with an initial energy E0, the
protons are slowed down by the stopping force and thus pass along the excitation
Fig. 1. (Top): g-Ray energy spectrum of the reaction 19F(p,ag)16O measured by a3-inch NaI detector. Proton energy is 2.7MeV, sample material is fluorapatite.(Middle): g-Ray energy spectrum for the same reaction acquired by a high puritygermanium detector. The sample is meteoritic material. Low energy lines fromseveral other nuclear reactions can be identified. (Bottom): Low-energy g-rayspectrum from 19F(p,p0g)19F inelastic scattering recorded with a thin Ge(Li) de-tector. Reproduced with permission from Grambole and Noll [59].
M. Dobeli et al.218
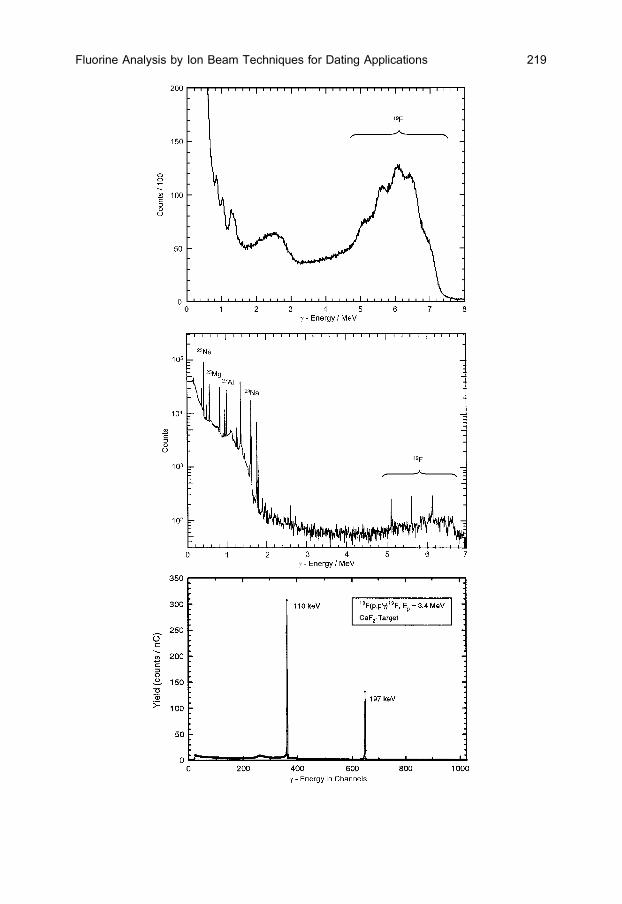
Fluorine Analysis by Ion Beam Techniques for Dating Applications 219
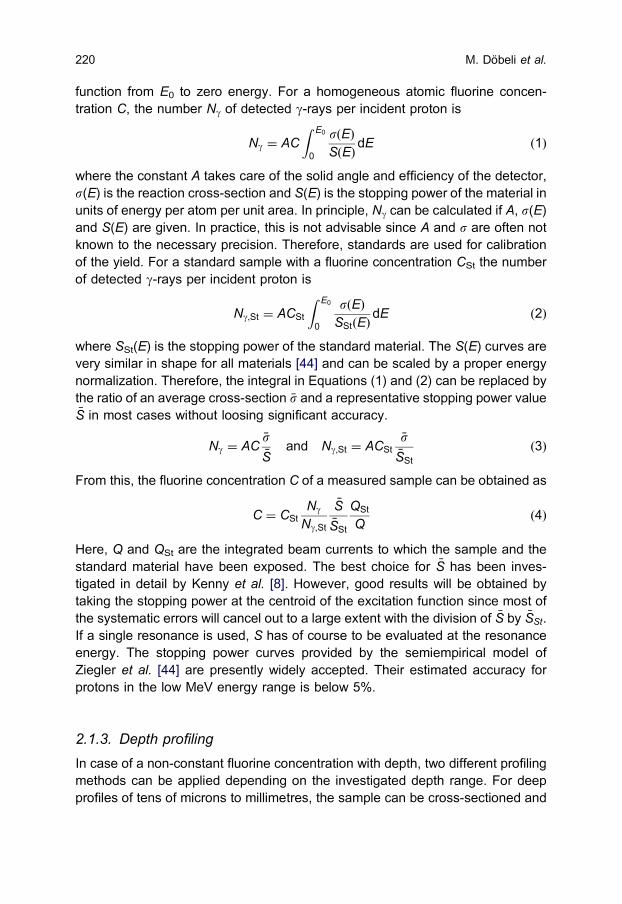
function from E0 to zero energy. For a homogeneous atomic fluorine concen-
tration C, the number Ng of detected g-rays per incident proton is
Ng ¼ AC
Z E0
0
sðEÞSðEÞ
dE ð1Þ
where the constant A takes care of the solid angle and efficiency of the detector,
s(E) is the reaction cross-section and S(E) is the stopping power of the material in
units of energy per atom per unit area. In principle, Ng can be calculated if A, s(E)and S(E) are given. In practice, this is not advisable since A and s are often not
known to the necessary precision. Therefore, standards are used for calibration
of the yield. For a standard sample with a fluorine concentration CSt the number
of detected g-rays per incident proton is
Ng;St ¼ ACSt
Z E0
0
sðEÞSStðEÞ
dE ð2Þ
where SSt(E) is the stopping power of the standard material. The S(E) curves are
very similar in shape for all materials [44] and can be scaled by a proper energy
normalization. Therefore, the integral in Equations (1) and (2) can be replaced by
the ratio of an average cross-section �s and a representative stopping power value�S in most cases without loosing significant accuracy.
Ng ¼ AC�s�S
and Ng;St ¼ ACSt
�s�SSt
ð3Þ
From this, the fluorine concentration C of a measured sample can be obtained as
C ¼ CSt
Ng
Ng;St
�S�SSt
QSt
Qð4Þ
Here, Q and QSt are the integrated beam currents to which the sample and the
standard material have been exposed. The best choice for �S has been inves-
tigated in detail by Kenny et al. [8]. However, good results will be obtained by
taking the stopping power at the centroid of the excitation function since most of
the systematic errors will cancel out to a large extent with the division of �S by �SSt.
If a single resonance is used, S has of course to be evaluated at the resonance
energy. The stopping power curves provided by the semiempirical model of
Ziegler et al. [44] are presently widely accepted. Their estimated accuracy for
protons in the low MeV energy range is below 5%.
2.1.3. Depth profiling
In case of a non-constant fluorine concentration with depth, two different profiling
methods can be applied depending on the investigated depth range. For deep
profiles of tens of microns to millimetres, the sample can be cross-sectioned and
M. Dobeli et al.220

Fig. 2. Overview of the 19F(p,ag)16O excitation curve from E ¼ 0.3–2.45MeV,including the narrow resonances (left) and the beginning of the continuum (right).Reproduced with permission from Dababneh et al. [13].
Fluorine Analysis by Ion Beam Techniques for Dating Applications 221

scanned by a focused beam. The depth resolution in this case is given by the
width of the beam spot. For shallow profiles, one of the sharp resonances can be
used to probe the sample at a well-defined depth. This technique had first been
published by Moller and Starfelt in 1967 [45]. The situation is depicted in Fig. 3.
The particle beam is entering the sample with an initial energy E0 which is usually
above a resonant energy ER. As the projectiles continuously lose energy on their
way through the material the probability for a reaction with fluorine follows the
excitation function from E0 to zero energy. At a depth dR below the surface, the
particles reach the resonant energy ER and the reaction will take place in a certain
depth interval until their energy falls below the resonant energy again. If there are
further resonances at lower energies ER, the process will repeat itself. In an
idealized situation with a single isolated resonance, the beam would probe the
fluorine concentration only at a well-defined depth dR given by
dR ¼ �
Z ER
E0
S�1ðEÞdE ð5Þ
In this idealized case, the profile can be obtained by varying the incident parti-
cle energy E0 stepwise within a certain interval. Yield calibration is done by a
standard in an analogous way as described in equation (4). Close to the surface
equation (5) can be simplified by the so-called surface approximation which con-
sists in replacing S(E) by S(E0), i.e. by the value of the energy loss at the surface.
The expression for the depth scale is then simply dR(E0) ¼ (E0�ER)/S(E0).
Fig. 3. Schematic illustration of nuclear resonance profiling. The sample surfaceis to the left. The particle energy continuously decreases from left to right as theprojectiles pass through the material. The resonance energy ER is reached at acertain depth dR where the reaction takes place.
M. Dobeli et al.222

The variation of E0 can be obtained either by changing the acceleration energy or,
within a smaller range, by applying a high voltage to the target.
While the simplified data analysis technique described above might lead to a
first estimate of the concentration profile in some cases, the situation is much
more complex in reality. First of all, there are virtually no usable single reso-
nances with the excitation function going to zero outside of the resonance peak.
This means that other resonances at lower energies and off-resonance contri-
butions have to be taken into account. Thus, the measured g-yield at a certain
beam energy is normally a complicated convolution between the fluorine con-
centration profile, the excitation function of the reaction and the stopping power in
the material. The composition of the sample might as well be depth-dependent
leading to a stopping power which is not only a function of energy but also of
depth. The problem has been extensively discussed in literature and several
algorithms and computer codes for profile deconvolution have been developed
[16,46–51]. One important consequence of off-resonance and low energy res-
onance contributions is the limitation of the dynamic range of detectable fluorine
concentrations within a profile, as there is always a background from reactions
taking place at larger depths. In fortunate cases of flat fluorine profiles, simple
subtraction of the resulting flat background leads to acceptable results.
Secondly, the situation is complicated by factors affecting the shape of the depth
window probed by a particular resonance. The width and shape of the layer in
which the particles are under resonance condition is not only given by the energy
width of the resonance peak but is also influenced by energy loss straggling which
is due to the stochastic nature of the slowing down process of ions in matter [2,44].
This effect becomes of growing importance with increasing depth. For measure-
ments close to the surface using narrow resonances, the initial energy spread of
the particle beam and Doppler broadening due to the thermal movement of atoms
have to be considered as well [52]. The depth resolution function is in general non-
Gaussian as the resonance peaks are better described by Lorenzians.
The depth resolution for resonance profiling at the sample surface where en-
ergy straggling can be neglected can be calculated in first order by dividing the
width of the resonance by the stopping power of the material. For the 19F(p,ag)16Oreaction this is generally a few tens of nanometres. For example, the stopping
power of protons in typical bone material is around 44 keV/mm at the 872 keV
resonance energy (SRIM [44]). The width of the resonance is 4.5 keV [2] which is
normally larger than the Doppler broadening and the energy spread of the proton
beam. This leads to a depth resolution of approximately 100 nm. If the low-energy
resonance at 340 keV with a width of 2.4 keV is used, the corresponding stopping
power is 78 keV/mm resulting in a depth resolution of about 30nm close to the
surface. Even with the narrowest resonances and taking advantage of glancing
incidence the achievable depth resolution has a lower limit of a few nanometres.
Fluorine Analysis by Ion Beam Techniques for Dating Applications 223

For resonance profiling, the accessible depth is given by the distance to the
next resonance peak at higher energy. For the 872 keV resonance the next
strong peak appears at 935 keV (disregarding the small resonance at 902 keV). In
our example of bone material this results in a maximum interference-free probing
depth of approximately 1.4 mm. If the 10 times weaker resonance at 668 keV is
used, the next interfering peak only appears at 832 keV, leaving an accessible
depth of more than 3 mm. However, as mentioned above, energy straggling and
off-resonance contributions lead to fast deterioration of the profile quality with
depth. A representative example of nuclear resonance profiling is provided by
Mandler et al. (1973) [53] who determined the fluorine concentration in tooth
enamel to a depth of more than 2 microns. More details on fluorine profiling by
this technique can be found in a number of publications [43,45,47,48,53–56].
Compilations of the energy, strength and width of 19F(p,ag)16O nuclear reso-
nances by which the experimental parameters for profiling can be optimized have
been provided, for example, by Dieumegard [57] and Dababneh [13]. A similar list
is reproduced in the ion beam analysis handbook of Tesmer et al. [2].
2.1.4. Sensitivity
The sensitivity of PIGE to fluorine is determined in a fairly complex way by the
sample composition, the specific reaction and the experimental set-up. The19F(p,ag)16O low-energy resonances have total cross-sections of the order of
100mb. Therefore, absolute count rates have to be taken into consideration for
an estimate of detection limits in the case of resonance profiling. Representative
examples are given for a typical set-up by Dieumegard et al. [57]. Following their
data, count rates of about 400 counts/mC can be expected from a CaF2 calibration
target for the 340 keV resonance. Thus, for samples with a fluorine concentration
lower than about 100 ppm the count rate will fall below 1/mC. Apart from off-
resonance contributions and background from reactions with other elements this
can become a severe restriction for trace-level detection. If thick target meas-
urements with proton energies above 2MeV are performed, the g-ray yield is
usually so high that counting statistics is not a sensitivity limiting factor. In Ref. [2],
thick target yields are given as a function of proton energy between 1 and 4MeV.
Following these values, count rates can rise well above 10 counts/mC under typ-
ical experimental conditions for a 1 ppm concentration. Therefore, measurements
in the ppm range should be possible within minutes with a reasonable statistical
error. In this case, background from other reactions become dominant. In the g-energy window between 4 and 7MeV contributions from the abundant elements
Al and Na have to be expected for low-resolution and high-efficiency detectors
such as BGO or NaI [58]. This flat background can be subtracted to a certain
extent by estimating the Al and Na contents in the sample by the low energy g-lines which are also present in the spectra (see Fig. 1). This subtraction technique
M. Dobeli et al.224

was established by Bird and Clayton [58] for background contributions of Al, Na,
Li, B, Cu, Fe, Zn, Mg, Si and Ta. It was applied by Noll et al. [38,59] for the
determination of low-level fluorine traces in meteorites.
If the low-energy g-lines at 110 and 197 keV from inelastic scattering19F(p,p0g)19F are used there exists a true interference with the same g-energiesfrom the 18O(p,g)19F reaction with ubiquitous oxygen. This has first been inves-
tigated by Stroobants et al. [41] and later by Grambole et al. [19].
If proper care is taken a fluorine detection limit of roughly 1ppm in thick targets can
be obtained with both the 19F(p,ag)16O and the 19F(p,p0g)19F reaction. As a general
rule of thumb it can be said that 0.1% of fluorine can usually be detected without
difficulties, while 1ppm can only be reached under optimized conditions. Additional
information on sensitivity can be found in literature (e.g. [1,2,41,60]). Although pub-
lished data can be of help in evaluating the appropriate analytical technique, it should
not be the substitute for a practical experimental test in the case of an unknown matrix.
2.1.5. Accuracy
As discussed in the previous paragraph, count rates are usually high enough to
determine the number of g-rays from a sample with a statistical error below a few
percent with ease. Thus, statistical precision is normally not a severe limitation.
The absolute accuracy of measured fluorine concentrations is more determined by
systematic errors. The precise solid angle and efficiency of a detector and the
absolute integrated beam current are difficult to measure to a satisfactory degree.
In addition, the differential reaction cross-section for a particular detection angle or
projectile energy might not be known well enough. Even if cross-section values are
published, the precise integration over a g-ray energy spectrum poses a severe
problem as handling of escape peaks, tails and Compton part has to be decided.
Therefore, continuous normalization to a standard is recommended rather than
absolute yield measurements. Following Equation (4), systematic errors can be
introduced by the accuracy of the standard material and by the calculation of the
stopping powers. As stated above, the accuracy of stopping powers is approx-
imately 3–5%. Depending on the integration or averaging procedure by which the
correction is performed, an additional contribution to the error has to be taken into
account. Often, the fluorine concentration and with it the count rate of the standard
material is significantly different from that of unknown samples. In this case, either
dead time and pile-up corrections have to be applied or the beam current has to be
adjusted to obtain similar count rates which necessitates a careful observation of
beam current integration and background events. For many applications, samples
are non-conductive which requires special precautions concerning the beam cur-
rent measurement. All in all, the total non-statistical error will usually amount to
5–10%. For measurements at the fluorine detection limit, accuracy is determined
by the background subtraction procedure.
Fluorine Analysis by Ion Beam Techniques for Dating Applications 225

2.1.6. Imaging
Nuclear microprobes allow to focus and raster scan the analysing ion beam across
the sample surface to obtain a line scan or a two-dimensional image of the fluorine
concentration. State-of-the-art microprobes have a lateral resolution of the order of
1mm [61,62]. At this focal size the beam current is usually below 1nA but increases
fast with increasing spot size. Thus, depending on the image resolution, one has to
accept a reduced sensitivity and statistical precision. If resonance profiling is per-
formed with a rastered beam, a true three-dimensional image of the fluorine con-
tent can be produced. However, this is often of limited use because the accessible
depth for profiling is normally by far smaller than the lateral size of the raster field.
Likewise, the depth resolution is much better than the lateral resolution, especially
close to the surface. An increasing number of nuclear microprobes is equipped with
an exit window to extract the ion beam into air [62,63]. This allows to analyse
objects that are not suited for transfer into a vacuum vessel.
2.1.7. Charged particle activation
In PIGE the g-emission is usually prompt. If very low amounts of trace elements
have to be detected it can be advantageous to use a delayed decay. In this case,
the technique is called charged particle activation (CPA) and is an analogue to
neutron activation analysis (NAA). It has the advantage that the prompt back-
ground from interfering reactions is completely removed as irradiation and anal-
ysis are completely separated in time. This also allows to remove external
contaminants in the short time between irradiation and measurement which fur-
ther improves detection limits. A comprehensive description of the technique can
be found in the ion beam analysis handbook [2]. For 19F CPA is conceivable in
special cases via the 19F(d,dn)18F reaction. However, we have found only one
application in the literature [64].
2.2. Elastic scattering
For the sake of completeness, fluorine detection by elastic scattering has to be
mentioned as well. Elastic scattering is experimentally the most simple and
therefore the most widespread ion beam analytical technique. It relies on the fact
that the energy of an MeV ion elastically scattered from a target material is a
function of the target atomic mass and the depth at which the scattering took
place. Both, the scattered projectile ion and the recoiling target atom, carry the
information on the elemental depth distribution of the sample. The corresponding
techniques are Rutherford backscattering spectrometry (RBS) and elastic recoil
detection analysis (ERDA), which are well described in the literature (e.g.
[2,65,66]). For fluorine analysis, ERDA is better suited than RBS and a sensitivity
M. Dobeli et al.226

of approximately 0.01–0.1% can be obtained by this method. No standards are
required since scattering cross-sections are well known. A complete concentra-
tion depth profile is obtained with a single measurement of a few minutes. Max-
imum depth of analysis is of the order of 1 mm. Although ERDA is a very fast and
quantitative analysis technique, only few applications to fluorine detection have
been published [67,68]. No work for dating purposes has been done so far.
2.3. PIXE
PIXE is the analogue to EDX/WDX (energy/wave dispersive analysis of X-rays)
done with electron microprobes. Elements in the sample are identified by the
characteristic X-rays emitted during MeV particle bombardment. PIXE is not
well suited for fluorine detection because of the low energy of the corresponding
X-rays. However, it is often performed simultaneously with other ion beam tech-
niques and gives very valuable information on the bulk composition and other
trace element concentrations in the sample.
3. APPLICATIONS
The time-dependant mutual effects of several elements with silicates and bones
found great attention in archaeological studies in the past. The enrichment of fluorine
by adsorption on the surface of silicates and their diffusion into the interior of minerals
were studied by several authors already in the first-half of the last century. Among
others, flintstones, meteorites and bones or teeth were the materials investigated
most often [33,69,70]. In some cases only the integral uptake of fluorine was re-
ported. From diffusion theory and studies it is quite evident that concentration profiles
are developed through time, when a material is in contact with a reservoir of different
concentration of the element under investigation. Therefore, the course of the formed
concentration profile contains much more information than an integral report only.
The development of the profile of interest is a function of the chemical potential
(a function itself of the chemical binding forces involved and the concentrations in
the investigated reservoirs). For bones it is important to understand alterations
induced by environmental factors of the burial site such as pH, humidity, pro-
longed draught periods or temperature. Furthermore, it is possible that distinct
changes of the exposure conditions occur throughout burial duration, e.g.
changes of the present concentration of fluoride ions through time (e.g. changes
in groundwater table). It is quite obvious that diagenetic processes may blur some
basic information stored in the investigated bone specimen.
To learn more about the influence of the discussed factors modern and
archaeological bones were doped with artificial fluoride solutions for different
Fluorine Analysis by Ion Beam Techniques for Dating Applications 227

durations and at different temperatures to evaluate realistic diffusion parameters.
With this parameter at hand it seems to be easier to unravel the archaeological
age of an unearthed bone specimen.
3.1. Fluorine diffusion in Antarctic meteorites
Concentration profiles of all halogens were investigated in meteorites by
Langenauer and Krahenbuhl [70,71]. Meteorite samples were tested for their re-
lease of halogens by leaching with water. After 5 days of contact with water less
than 4% of the F enrichment on the surface could be leached whereas for Cl the
respective value reached 15%. So, the diffusion profiles are best conserved for F
among all the halogens. Therefore, the interest was focused to the investigation of
contamination of meteorites by fluorine. The first analyses of fluorine on Antarctic
meteorites were performed on powders resulting from mechanical removal of thin
layers and measurement of their F concentrations. This was obtained by ion-
sensitive electrodes after expelling the halogens in presence of water vapour and
V2O5 at 10001C forming the respective hydrogen halides which were absorbed in
NaOH. By this technique, a depth resolution of 0.5mm could be obtained at best
[71]. It was therefore replaced by the NRA technique using protons, due to its
superior space resolution and ease of use. The proton irradiation profile presented
in Fig. 4 indicates the improved resolution compared to the earlier technique [38].
Since the contamination of fluorine on Antarctic meteorites only occurs when
they are lying on the ice, the contamination level is a measure for the duration of
the exposure to the Antarctic environment. Parallel to this higher contamination
on the surface the diffusion into the interior is proceeding for a longer period.
Therefore, the degree of contamination on the surface of the meteorite and the
depth to which the diffusion can be recognized is proportional and is given by the
diffusion laws. Such results are presented in Fig. 5. For a detailed discussion it is
necessary to make some assumptions regarding the reservoirs from which F
might have contaminated the meteorites in Antarctica. What are the sources for
the concentration of F resulting in the atmosphere and are these values con-
stant? Sea spray delivers an important fraction of the F in the atmosphere. But for
a given place in Antarctica the distance to the open sea (extension of the ice
shelf) may change with time. In addition, exhalations of volcanoes contribute an
essential fraction of the F budget over time.1
The terrestrial age of meteorites is based on the measurement of long-lived
radio nuclides such as 14C, 26Al, 36Cl, 53Mn and more recently of 41Ca, the half-
lives of which rank from 5730 years up to 3.7 million years. It is not possible
with such measurements to distinguish which fraction of the terrestrial age the
1 Note of the Editor: See also in this series the chapter of C. Oppenheimer and G. Sawyer devoted to
Fluorine Emissions from Volcanoes.
M. Dobeli et al.228

meteorite was lying enclosed in the ice or free to the atmosphere on top of the ice.
In contrast to the usual terrestrial ages Noll et al. [40] came up with exposure
ages (duration on the ice) based on F contamination levels compared to terres-
trial ages. These relations are presented in Table 1.
Obsidian and flints are natural glasses. Such samples show a uniform diffusion
in any direction. In contrast, the diffusion of F into meteorites must be a function
of the grain size of the material. The apparent diffusion is a mixture of volume
diffusion and grain-boundary diffusion. Grain-boundary diffusion is much faster
Fluorine excess vs. Depthof ALHA79025
Depth /nm 0.5 1.51.0 2.52.0 3.00
Nor
mal
ized
toin
terio
r co
ncen
trat
ion
35
25
30
15
20
5
10
0
NRA, calculated background
NRA, linear background
Previous method, layers
Previous method, mean values
Fig. 4. Profile of the normalized F concentration for the Antarctic MeteoriteALHA79025 by NRA compared to the earlier classical analysis of thin layers (seetext). Reproduced with permission from Noll et al. [38].
1.50 20.5 2.51Depth in nm
F-c
on
ten
t in
µg
/g
200
500
400
300
100
0
LEW86015
TIL82409
ALHA77294
Fig. 5. Concentration profiles for three Antarctic meteorites of different expositionduration on the ice sheet (see Table 1 for details). Reproduced with permissionfrom Noll [59].
Fluorine Analysis by Ion Beam Techniques for Dating Applications 229

than volume diffusion. Therefore, meteorites, for which almost no grains can
be discerned, demonstrate a diffusion rate that is more than 10 times lower
(comparison of H5 and H6 chondrites by Langenauer and Krahenbuhl [71]) (the
petrographic classification H3 means coarse grained, H6 very fine grained almost
no grain boundaries visible).
Weathering of meteorites influences the oxidation state of the material besides
an alteration of the composition of many elements. Since meteorite studies allow to
gain information on the early solar system not accessible by any other means it is
important to know which fraction of the solid meteorite under investigation has not
undergone any secondary alteration and therefore has preserved its pristine com-
position. This may be of essential interest for additional detailed investigations of
extraterrestrial material. For meteorites, weathering is proportional to the exposure
duration on the Antarctic ice shield which is given by the F contamination as
explained above and not by the terrestrial age of the observed meteorite.
3.2. Diffusion profiling in archaeological bones and teeth
3.2.1. Introduction
Archaeological fragments of bones and teeth take up fluorine from the surround-
ing soil and accumulate it in their mineral phase when they are exposed to a
humid environment. Geological time spans are needed for this process to reach
equilibrium and for the fluorine distribution to become uniform. In cortical parts of
long bone diaphysis, an initially U-shaped fluorine concentration profile can be
observed, which decreases from the outer surface and the marrow cavity towards
the inner parts of the bone and carries information on the exposure duration of the
buried object in its shape. The time dependence of the profile slope is usually
described in a simplified way by a diffusion model. The quantitative mathematical
evaluation of these profiles may provide information on the exposure duration and
the physical condition of the samples. Therefore, several attempts to use fluorine
profiling as a dating method have been undertaken [3,39]. The distribution of
Table 1. Comparison of terrestrial age and surface exposure for three Antarcticchondrites [110]
Sample location Signature
Exposure
duration on the
ice in years
Terrestrial age
in years Class
Lewis Cliff Lew86015 13,700 80,000750,000 H6
Thiel Mountains Til82409 9200 H5
Allan Hills ALHA77294 3100 10,000 H5
M. Dobeli et al.230

fluorine in an archaeological sample however is strongly influenced by the en-
vironmentally induced processes of bone diagenesis, i.e. the alteration in the
structure and composition of the mineral phase and degradation of organic com-
ponents of bone that may make the time information indistinct [72,73]. The pri-
mary chemical composition of bones can thus be superimposed by diagenesis
within tens, hundreds or thousands of years. This depends more on the tap-
honomic and diagenetic ambience than on the geological age.
The initial step of fluorine uptake is the percolation of ground water into the
pores and fissures. Hereupon, the fluorine ions are adsorbed onto the surface of
the matrix, where an ion exchange takes place via the recrystallization of hy-
droxyapatite (HAP), the main component of bone and tooth material, affording
chemically more stable fluorapatite (FAP), by which the hydroxyl groups are
replaced by fluorine ions. After recrystallization, the substitution in the bone ma-
terial proceeds both by grain-boundary diffusion and solid-state diffusion. Espe-
cially in specimens which have undergone diagenesis and where the number of
pores and fissures is high, percolation becomes more and more dominant as a
transport mechanism.
In a physiological context, the term ‘‘bone’’ describes a large variety of materials
with a complex physical and chemical structure, whose basic building block con-
sists of mineralized collagen fibres. Plate-shaped crystals of carbonated apatite
(‘‘dahllite’’, (Ca,Na,Mg)5(HPO4,PO4,CO3)3(OH,CO3) are formed within a collagen
framework during bone growth (‘‘biomineralization’’). Studies on the microcompo-
sition of modern bone have been done by Weiner et al. [74,75]. After the death of
the individual, the proportions of the major components of bone, protein
(20–30wt%, mainly collagen), poorly crystalline mineral (60–70wt%) and water
(10wt%), vary with the time elapsed since the bone material was deposited as it
goes through diagenesis. During burial time, the material is in contact with sedim-
ents, soils and interstitial water. These structural features and the preservation
state of the mineral and organic phase must be taken into consideration when
fluorine uptake and movement within the body of the fossil bone is described.
3.2.2. History and related investigations
First attempts to date archaeological remains by their fluorine content were un-
dertaken in Great Britain by J. Middleton in London and K.P. Oakley at the
University of Oxford [21,76], where especially Oakley became well known for his
work on the ‘‘Piltdown Man’’. By comparing the total fluorine content of a skull and
a mandible, which had deliberately been faked to simulate fossil specimens and
secretly placed in a ditch in Sussex, with original remains from the Lower
Pleistocene period found in the same ditch, he concluded that the questionable
specimens must have been significantly younger, as they contained less fluorine
[69]. The Piltdown Skull had widely been held as a crucial discovery of modern
Fluorine Analysis by Ion Beam Techniques for Dating Applications 231

palaeontologic research, being the missing link between man and ape. In this
particular case, it was possible to use total fluorine analysis as a relative dating
method, as the fluorine contents of the original specimens were very high and the
fraudulent samples deposited thousands of years later could be clearly identified.
But Oakley himself pointed out the aggravating circumstances of environmental
impact, which would influence the rate of fluorine uptake into the samples by
changing the ‘‘material’’, this is, the bone structure and its diffusion character-
istics. In later studies, the amount of fluorine acquired by a bone during fossil-
ization was found to be also a function of the ‘‘sample surroundings’’ like
sediment permeability and hydrology [77,78].
G. E. Coote was the first to doubt the homogeneous enrichment of fluorine in
bones and disbelieved the simple bulk analysis. He found out that a decrease in
concentration could be observed from the surface towards the inner parts of the
sample. Based on these facts he proposed the idea of examining the fluorine
diffusion profile of a sample cross-section to develop a dating method instead of
considering the total fluorine content only [23], although he was well conscious of
the difficulties of deriving valuable information out of so inhomogeneous and
variable material as bone. However, the profiling method was hardly seized in the
scientific community, and more than 15 years later studies were performed deal-
ing with dating by determination of the total fluorine content of a bone sample
[79].
Several studies have been made on fluorine uptake in archaeological bone
specimens for relative or absolute dating [39,80,81]. As bone represents an open
system with respect to many elements in soil, the uptake particularly of uranyl
ions from soil water is a fundamental problem while developing a dating method
for bone samples based on the decay series of uranium [82–84]. Even though
purely inorganic systems like meteorites, flintstone or obsidian, might show more
homogeneous physical structure, the process of diffusion ‘‘in vivo’’ is nowhere as
simple as previously thought. The presumption that their composition shows less
variation over time has proved to be a fallacy. So attempts at exposure dating by
fluorine depth profiling also exist for chipped flints [34], where the fluorination
depth is extremely shallow. The results of these investigations will be described
by Reiche in this compendium. As described above, the varying uptake of F, Cl,
Br and I into meteorites has been compared in Refs [40,70,71] and successfully
related to their sites of recovery. Attempts for quartz hydration dating have been
undertaken by Ericson et al. [85], where NRA methods were used to determine
the hydration front in the sample. This is a further development of the obsidian
hydration dating [86], where the diffusion fronts of water/hydrogen were deter-
mined by optical microscopy. Dating obsidian artefacts by determination of the
hydration diffusion fronts of H2O, which may interfere with regions of increased
fluorine content, similarly involves difficulties caused by the unknown environ-
mental context and the subsequently varying diffusion rate [87].
M. Dobeli et al.232

The spectrum of scientific literature dealing with bone diagenesis is in general
manifold and only an incomplete outline can be presented here including Refs
[72,88–90]. Special work on the decay and degradation of the organic matrix has
been done by several authors [91–93]. Changes in the mineral components are
described by Reiche et al. [94] and Trueman et al. [95]. Recent studies on bone
dissolution and recrystallization have shed light on the behaviour of bone in a
humid environment [74,96]. There has been interest in the uptake of Sr, Ba, Fe,
Mn, Zn or Cr by bone. These elements are either absorbed from the soil after
burial, thus carrying information on the palaeoenvironment or are part of metab-
olism during bone growth [97–99].
3.2.3. Diffusion theory and methods of analysis
In humid environments, hydroxyapatite (Ca5(PO4)3OH), the main component of
the inorganic bone and tooth matrix, is transformed into the more stable fluor-
apatite (Ca5(PO4)3F). In an idealized sample, fluorine uptake from the environ-
ment leads to a U-shaped concentration profile, which slowly develops into the
bulk from the outer surface and from the marrow cavity inwards according to
Fick’s second law
DDcð r!; tÞ ¼dcdt
ð r!
; tÞ
where D is the diffusion constant of the material; c the concentration of the
element, r the distance from the surface position; and t the time.
The shape of the profile alters with time, until it becomes completely flat and the
inner concentration of fluorine corresponds to the one measured on the periosteal
surface. This equation is used to describe diffusion processes if there is a con-
centration gradient only along one axis, i.e. if diffusion is one-dimensional. If
diffusion and environmental conditions are constant (e.g. a constant supply of
fluorine due to invariant soil humidity), the profile shape and its penetration depth
carry the information on exposure time t. The profile will be more developed if the
sample has been exposed to this environmental system for a longer time (Fig. 6).
This fact leads to the idea of a mathematical evaluation of the ‘‘diffusion length’’
Dt (the parameter that describes how far the diffusion front has penetrated into
the material), which allows the calculation of the burial time t, i.e. the age of the
archaeological sample, if the diffusion constant is known [80].
Of the many structural types of bone, only the ‘‘lamellar’’, plexiform bone in the
diaphysis compacta of long bones is of importance for fluorine dating, because
only this material is homogeneous enough for the development of a dominant
profile that starts from the periosteal surface. Especially in haversian bone (e.g.
human bone), profiles may be forming at a number of points in the bone and in a
number of different directions, stemming from surfaces within the bone (e.g.
Haversian canals) or from the medullary cavity. These profiles often hide the true
Fluorine Analysis by Ion Beam Techniques for Dating Applications 233

shape of the dominant profile, which is discussed in Ref. [81]. Even an intact long
bone becomes an open system to the environment; soon after burial due to the
degradation of soft tissues and due to the existence of foramina and various
minor nerve canals and blood vessels, water (containing fluorine) will always find
(a) (b)
(c)
Fig. 6. (a) Samples of the mid-sections of long bones are best suited for fluorineprofiling, as this skeletal position provides the most uniform conditions. All scanswere performed in the direction from the periosteal surface towards the marrowcavity. Two-dimensional maps were collected in some samples. (b) Fluorine wasanalysed by PIGE (proton-induced g-emission), while the distributions of Ca, Fe,Mn and Zn were detected by PIXE (proton-induced X-ray emission). C and Nwere analysed by NRA and emitted protons were detected in both cases. (c)Examples of ‘‘developed’’ and ‘‘non-developed’’ fluorine profiles in archaeologicalbone samples. The profile of an artificially fluorine enriched fresh bone sample isshown for comparison.
M. Dobeli et al.234

its way into the marrow cavity. So a diffusion front arising from the marrow cavity
can be observed in many cases.
In the diffusion model presented here, the value of the diffusion constant D
remains constant, which is not the case for natural bone systems. The problems
arising from bone diagenesis will be discussed in Section 3.2.7 and by Reiche in
this compendium.
3.2.4. Micromapping with PIGE, PIXE and NRA
In a large majority of cases [3,23,24,34,39,40,73,80,81,100–103,105], PIGE is
used for the determination of the fluorine concentration profiles. As the simul-
taneous processes of bone alteration and fluorine uptake and its diffusive trans-
port are complex, complementary analytical tools are needed to reveal the
interaction of diagenesis and diffusion and to gain information on the history of
fluorine profile development. During PIGE measurements in a nuclear micro-
probe, it is obvious to make a simultaneous assessment of the material com-
position by PIXE, i.e. by a simple analysis of the excited characteristic X-rays
[26]. Recently, Gaschen et al. have combined the analytical methods of PIGE/
PIXE/NRA and infrared spectroscopy with optical and electron microscopy to gain
additional information on the concentration and distribution of fluorine as a func-
tion of bone constitution and degradation [100–103]. An outline of the measure-
ment set-up is presented in Fig. 7.
PIGE is a fast and precise analytical technique for a non-destructive determi-
nation of the quantitative fluorine content and its distribution in cross-sections of
bone and tooth specimens. The g-rays from the nuclear reaction 19F(p,ag)16Owere used to quantify the fluorine concentration in the samples, and the simul-
taneous detection of the Ca-signal by PIXE provided additional information on the
sample topography, as cracks, alteration halos and the typical porosity occurring
in human bone samples are parameters which have direct influence on the flu-
orine uptake and transport during burial. The elements C and N were analysed by
NRA (12C(d,p0)13C and 14N(d,p5)15N reactions) to gain information on the dis-
tribution of organic material in the samples. Mapping was performed where re-
quired (Figs 8 and 9), otherwise the samples were scanned from the periosteal
surface towards the marrow cavity.
The major peculiarities for a diagenetically altered bone are an increase in
crystal size and a decrease in protein content [104], thus complementary infor-
mation on the state of degradation can be obtained by FT-IR (Fourier transform
infrared spectroscopy). The characteristic splitting of the double peak at
563–604 cm�1 corresponds to the phosphate vibrations n4 (PO4)3� indicating
mineral-phase modifications, e.g. changes in crystallinity. A low value for the
splitting factor ‘‘SF’’ indicates a high amount of amorphous material in the mineral
phase and was obtained as described in Ref. [105].
Fluorine Analysis by Ion Beam Techniques for Dating Applications 235

Fig. 7. Close-up of the Oxford vacuum chamber and the detectors at GNS (forabbreviations see body text): The incoming beam hits the samples at an angle of451. A small mirror and an optical microscope allowed the exact location of thebeam position on the sample. For NRA measurements a SBD detector wasadditionally mounted on the lid of the chamber close to the SiLi detector at aposition of 301 to the beam.
M. Dobeli et al.236

3.2.5. Profile evaluation by error function-fitting
To gain quantitative information on the profile characteristics, the profile shape
must be evaluated mathematically. The parameter Dt (D, diffusion constant; t,
exposure time) that describes the depth of the diffusion front that penetrated into
the sample was determined by fitting the data with an error function (erf). The
resulting curve describes the result of an undisturbed diffusion process. If the
exposure time t is known, e.g. by radiocarbon dating, the diffusion constant D, a
material constant, can be derived from this data.
The process of mathematical fitting is error-prone, and especially two different
issues have to be considered, the first one dealing with the boundary conditions of
the fitting procedure itself: A pure diffusion process is considered here as the only
transport mechanism for fluorine in the sample. A constant value for the diffusion
constant D, invariant soil temperatures and a constant supply of fluorine (e.g. a
constant soil humidity) are assumed, the latter effect theoretically resulting in a
constant surface fluorine concentration for samples collected at the same burial site.
In mathematical terms, Dt is influenced by the spatial resolution of the scanning
beam, the definition of the exact position of the bone surface, which usually coincides
with the maximum fluorine concentration, and by the original fluorine concentration in
the bulk of the object, which in most cases is still detectable. A detailed description on
Fig. 8. Fluorine scans obtained by PIGE: Fluorine-containing soil water entersthe tooth mainly through the nerve canal into the pulpa. The cementum alsoreadily takes up fluorine which slowly diffuses into the dentine, while the enamelcrown forms a barrier. Fluorine enters a long bone as well from the periostealsurface as from the marrow cavity. The thickness of the bone wall does notinfluence the shape of the diffusion front itself, but limits the time window whereage determination is possible, as the profile becomes flat much faster. (Humanmolar, Seeberg BE, Switzerland, �3750 BC, and human tibia, grave 132, Buren a.A. BE, Switzerland, medieval).
Fluorine Analysis by Ion Beam Techniques for Dating Applications 237

boundary conditions of fitting procedures has been written by Kottler et al.
[39], whereas situations in which the fitting procedure failed are described in Ref.
[103].
The evaluation of D by fitting an error function, which is based upon
an undisturbed diffusion model in a single component system, will not lead to
a proper description of the fluorine uptake in a natural multi-component
system.
Fig. 9. (a) In some archaeological samples a ‘‘patchy’’ preservation of materialcould be observed even by eyesight. (b) NRA- and FT-IR analyses revealed thatthese regions differ in their content of organic material (human femur, grave 438,Buren a. A., medieval). (c) SEM-pictures of the macro- and micro-fissures patternin a well-preserved archaeological bone (bos taurus, metatarsus, Seeberg,�3750 BC). (d) The porosity pattern and the interconnection of the pores influencethe resulting fluorine distribution in a buried bone sample, as fluorine ions mi-grating through the pores may reach certain regions of the bone far easier bypercolation than by solid-state diffusion. The samples were submerged in fuch-sine solution to visualize water percolation (human femur, grave 438, Buren a. A.,medieval, a similar sample than depicted in (a)).
M. Dobeli et al.238

3.2.6. Artificial fluorine enrichment
Modern and archaeological bone samples were artificially enriched with fluorine
to comprehend the uptake behaviour in a simplified environment [103]. Profiles
were generated by immersing samples of about 0.5 g into aqueous solutions of
NaF. These studies under controlled laboratory conditions (defined temperature,
water fluorine content and exposure time) revealed that in fresh bone material
which has not undergone alteration yet, solid-state and grain-boundary diffusion
is indeed one of the most relevant mechanisms of fluorine transport in the sam-
ple. This artificial enrichment of archaeological samples revealed that ‘‘pure’’
diffusion is superimposed to the effects of bone alteration. Thus, fluorine incor-
poration in archaeological specimens mainly occurs in regions where bone dia-
genesis has provided the space for water percolation.
Compared to fossil samples where fluorine penetrates inwards quite readily,
the transport seems to be impeded in fresh samples, which may be due to the
intimate cohesion of the organic and the inorganic matrix of fresh lamellar bone
[74,75]. A typical profile developed in a fresh bovine femur which was kept in a
NaF-solution is shown in Fig. 10 (bottom, artificial fluorine enrichment,
[F]solution ¼ 1000 mg/g, T ¼ 351C, t ¼ 14 d). Compared to human bones, bovine
bones have much smaller pores if any, and the fluorine distribution is smoother as
the formation of additional profiles becomes less important. The central parts of
the sample show the initial low fluorine concentration even after enrich-
ment, and so far it has not been possible to achieve thorough fluorine sat-
uration in fresh samples. The surface concentration is very high, reflecting the
strongly increased fluorine concentration in laboratory compared to natural soil
waters and soils (E0.1mg/g or up to several mg/g, respectively, depending on
geology).
Fluorine profiles generated under laboratory conditions show the expected
evolution with time [101,103]. The parameter Dt increases with time and with
increased temperature in the environment and the fluorine front penetrates fur-
ther in samples that have undergone diagenesis. While the diffusion constant D
was found to be time-independent in all cases, it was significantly increased in
archaeological material (medium values for artificial enrichment: D ¼ 2� 10�8
mm2/s for modern bone, D ¼ 20� 10�8mm2/s for well-preserved old material,
and D ¼ 90� 10�8mm2/s for highly degraded material).
Thus, the generation of profiles under laboratory conditions, i.e. the simulation
of the fluorine uptake, is possible. Furthermore, the fluorine profile reacts to
different parameters of a very simple artificial system provided in the laboratory.
Although it could be shown that in an undisturbed system under laboratory con-
ditions, diffusion indeed is the most important of many relevant mechanisms for
fluorine uptake into bone [103], in experimental work the above conditions are
unlikely to be fulfilled, limiting the practical realization of fluorine exposure dating
Fluorine Analysis by Ion Beam Techniques for Dating Applications 239

Fig. 10. Fluorine profiles in samples from three different locations within thesame burial place (Buren a. A., Switzerland). The exposure age was determinedby radiocarbon dating. The diffusion constants D were determined by evaluationof the left front of the fluorine profile. The values are calibrated. Samples from thesame burial place show qualitatively similar profile shapes. Differences can beexplained by material characteristics.
M. Dobeli et al.240

for archaeologists to a level of comparison of the total fluorine content and profile
shape for relative age classification.
3.2.7. The effect of the material itself
Even samples from the same burial site which were buried in close vicinity to each
other, show different values for their diffusion constant D, which by definition is an
invariant material parameter. However, the profile shape stays qualitatively similar
for sections of long bones originating from neighbouring skeletons (Fig. 10). Nev-
ertheless, a simple relation of this profile shape or the sample preservation state to
the geological age is not possible. In most cases, variation of profile shapes may
be explained by specific soil and material characteristics. This leads to the con-
clusion that future fluorine profile analyses should not be performed without si-
multaneous thorough sample characterization by microscopical and spectroscopic
methods. At least the simultaneous detection of the Ca signal is inevitable, as it is
of great importance when determining the exact position of the sample surfaces
during the mathematical fitting procedure. An analysis of the adherent soil is de-
sirable, unfortunately soil samples are rarely collected during excavations. It is
surely reasonable to limit the choice of sample materials to long bone compacta
only with a minimal wall thickness of 4mm, as the values for Dmay differ up to 30%
within a few centimetres [39], depending on the skeletal position.
The undisturbed organic and the inorganic matrix in a bone form a very stable
network which is the reason for the extreme stability of bone. So a mineralized
collagen can survive into the archaeological record under certain circumstances
and an intact collagen phase can prevent fluorine from penetrating into the sam-
ple (Fig. 9). A well-preserved bone may thus show a less-developed profile than a
far degraded sample of the same age.
The observation that moving water can increase pore diameters by inducing
material loss has been made [72,105]. An increased porosity will facilitate mi-
crobial attack and collagen degradation, which in turn will expose mineral com-
pounds to acidic decomposition. During diagenesis a bone’s internal surface area
decreases and its porosity increases [104]. These processes, which reinforce
each other will result in high values of the diffusion constant D, which would
influence dating. Studies on porosity changes in bones during diagenesis have
been published by Nielsen-Marsh and Hedges [106]. It is important to include
samples of both human and animal origin in studies on bone degradation. Bones
of human and animal origin can be clearly distinguished by their different porosity.
Pores in human bone compacta have a typical diameter of 60 mm [107], in con-
trast to animal bones, where the diameter of Haversian canals is much smaller
[108,109]. However, compact bone itself has a large porosity (0.35 cm3/g) and a
high internal surface area (85–170m2/g, [106]), so that water movement is pos-
sible and profile formation can be observed all the same in a very well-preserved
Fluorine Analysis by Ion Beam Techniques for Dating Applications 241

animal bone of high density. Besides the diameter and the number of the pores,
also their interconnection must be considered.
The skeletal age, which is not necessarily identical with the calendar age of the
individual, has an important impact on the fluorine uptake, because osteoporosis
is a process that fundamentally influences the bone structure. The disease pat-
tern becomes visible in material loss within both the trabecular and the compact
bone structure. Furthermore, the mineral density even in a healthy individual is
not uniform in compact bone, but is a function of bone stress at this skeletal
position and is increased at the point where muscles and tendons are fixed.
The collagen molecule (Type I) which occurs in vertebrates is a very ‘‘conserv-
ative’’ molecule, i.e. there is hardly any variation in its structure and composi-
tion. Differences between animal species mainly exist when the meso-structural
arrangement of the bone components is discussed. The fluorine ion penetrating
into a piece of bone encounters a different area, depending on the bone being
haversian (as in human individuals) or plexiform (as in animals that grow fast, e.g.
cattle). The remodelling during lifetime, which results in a transmutation of pri-
mary into secondary bone, also provides altering conditions for the penetrating
fluorine ions.
Once bone diagenesis introduces fissures and causes collagen degradation
and mineral recrystallization, these effects become indeed dominant over the
small impacts that variations in the bone meso-structure may have on the fluorine
uptake. But the initial bone structure steers and controls the specifications of the
early diagenesis. Therefore, small variations in the initial bone structure may
become very relevant within geological ages.
It has to be assumed that grain-boundary diffusion is not the only possible
transport mechanism of ions in a bone, but that a significant amount of aqueous
fluorine is transported through microfissures into a sample by capillary effects
(Fig. 9). Diagenetic parameters influencing the uptake of fluorine into archaeo-
logical bone are discussed in detail by Reiche in this compendium.
3.2.8. Tooth as an alternative matrix
Generally, dissolved fluorine enters a human tooth via the nerve canal during
alteration processes and adsorbs on the walls of the pulpa, from where it pen-
etrates into the dentine. The enamel cap protects the dentine from contact with
fluorine and does not incorporate any fluorine itself. Whereas this area of the
dentine is well protected from the environmental milieu, the roots are exposed to
microbial attack and all other factors of diagenesis. Sample damage also often
starts from the pulpa, especially when the teeth are separated from the protective
connection with the jawbone. During burial, a crack is formed between the den-
tine and the enamel crown. This is well known by anthropologists, and they report
that in old specimens the enamel easily falls off during handling.
M. Dobeli et al.242

The reason to extend the experiments to tooth material was the idea that the
matrix would have a less porous structure compared to human haversian bone and
be less exposed to diagenetic alteration. While the porosity in human bone is mainly
determined by a complicated network between the Haversian system and the Volk-
mann canals that are perpendicular to it, especially enamel is a far denser material
than human bone and its organic content is significantly less (2% of organic material
only). But in contrast to the enamel, dentine has a similar composition of the organic
and the inorganic matrix compared to bone, and it has a high microporosity due to
nerve canals that start from the pulpa and stop close to the enamel–dentine junction
(edj). However, these nerve canals have a smaller diameter than a haversian pore
(70mm) and the canals are orientated parallel and are not connected with each
other. So a fluorine ion cannot percolate from one pore to another, as it is the case in
a human bone, but it has to overcome the distance from one canal to the next one
by diffusion. So the permeability is low and this results in a smaller diffusion rate D.
Oakley [76] was already conscious about possible advantages of teeth relative
to bones, and intensive work on teeth was done by Coote and Nelson [80].
Unfortunately, the construction of animal teeth (especially those from horses,
sheep, goats, pigs or cattle, which are abundant in the archaeological record), is
far more complicated than that of a human molar, because the enamel is folded
during tooth growth and appears in several layers in the mature tooth.
The migration of water in teeth was tried to be visualized using fuchsine dye as
a colorant ([103], rosaniline hydrochloride C19H17N3 HCl). Fresh human molars
were immersed into a slightly acidic aqueous fuchsine solution. As was expected,
the water penetrated fast via the nerve canal into the pulpa and especially the
roots were dyed red from fuchsine migrating inwards as well from the sample
surface as from the nerve canal. After several days, it could be observed that
water had migrated into the gap between the enamel and the dentine (edj).
Generally the intensity of the colour increased with time, and the dentine took up
the colour more readily than the enamel.
Generally, the diffusion rates that were measured at similar points within the
same sample showed good consistency and also agreed well with known data.
The positions where fluorine profiling is possible have to be carefully selected in
tooth samples. The most clear diffusion fronts arise from the enamel–dentine
junction (edj), as this is a region of a minimal environmental impact and of max-
imum homogeneity of the sample matrix. Water penetrates into this fissure by
capillary effects, and a neat profile can develop. This process would be most
favoured in a milieu where water is in constant motion (e.g. annual dry and wet
cycles) and not in a waterlogged site. The major impediment restricting so far our
ability to apply fluorine profiling in teeth is the fact that our knowledge on the
formation of the gap between the enamel crown and the dentine is insufficient.
Especially, we cannot estimate the time duration needed for these cracks to
develop and how fast this occurs in different milieus.
Fluorine Analysis by Ion Beam Techniques for Dating Applications 243

Values for the diffusion rates of naturally grown fluorine profiles in teeth can be
seen in Fig. 11. As can be expected from the material properties, they are sig-
nificantly lower than those for human bone compacta. Artificial fluorine enrich-
ment of a modern human molar resulted in increased diffusion rates compared to
the naturally grown profiles as it was the case for artificial enriched bone samples,
too ([F]solution ¼ 360 mg/g, T ¼ 451C, t ¼ 36 h, D ¼ 8�10�9mm2/s for profiles
arising from the nerve canal in the root of a human molar).
3.2.9. The reconstruction of the change of D during time
In natural soils, environmental impacts are variously combined and assessed in
each individual case resulting in a great variety of material properties. However,
hydrological conditions may vary during the exposure time of the artefact in an
archaeological site.
The estimation of the exposure time of a bone sample by fluorine diffusion
profiling is based upon the knowledge of the diffusion constant D of the material.
Though the degree of bone conservation is highly variable and dependent on the
environment, as ‘‘bone’’ is not a static medium. Diffusion has been found to be
just one of the many relevant mechanisms for fluorine uptake in bone. Whatever
the mechanism of fluorine uptake in a specific sample is, the process is closely
related to others. The observed distribution of fluorine in an archaeological bone
sample is always the result of site-specific and sample-specific parameters which
strongly influence the evolution of the fluorine profile with time during the diffusion
process. The time frame where dating is possible is dependent on the diffusion
velocity in the medium. Unlike the concentration decrease of the 14C isotope used
for radiocarbon dating, the alteration of the bone matrix is not a constant process
during geological eras. Archaeological bone whose structure and composition is
modified during diagenesis, has turned out to be a complex system for diffusion
processes for many reasons, which may reinforce and entail each other in turn,
and a model based on the knowledge of the material constant D is a difficult
approach for the development of a dating technique. The factors influencing the
uptake of fluorine into bone can be summarized as follows:
(1) Structure of living bone: plexiform, haversian, osteoporotic;
(2) Funeral practices and conditions of burial: starting conditions of early dia-
genesis;
(3) Bone diagenesis: change of matrix during time;
(4) Soil pH and hydrology: fluorine availability;
(5) Transport mechanisms of fluorine and water: different rates of diffusion and
percolation.
Even if the present value of D can be determined, its value cannot be related to
a corresponding age, as the mechanism how the profile has developed, cannot
M. Dobeli et al.244

be retraced and is different for each bone specimen. We only know the ‘‘end-
state’’ of the sample. A constant increase of D is not plausible under natural
conditions. We assume that Dmay either stay constant for a certain time duration
or even decrease, e.g. during times of water shortage. Once the intimate cohe-
sion between organic and inorganic matrix is broken, the bone matrix undergoes
a rapid change during early diagenesis, until a stable crystal structure is formed
Fig. 11. Fluorine profiles in two tooth samples (Seeberg, Switzerland, �3750 BC,top, and Radfeld, Austria, 1200–750 BC). The clearest fluorine profiles arise fromthe enamel–dentine junctions (edj) and from the nerve canals (in human toothonly). The diffusion constants of these naturally grown profiles are similar in bothtooth samples, although their provenance and age is very different. But, thevalues differ significantly from those measured in human bone compacta (Fig. 9).
Fluorine Analysis by Ion Beam Techniques for Dating Applications 245

which does not undergo further alteration. Diagenesis therefore is referred to as a
self-limiting process.
It is not possible to reconstruct the remodelling of the bone matrix and the
subsequent changes of the diffusion constant D during bone history, so far. So the
preliminary conditions for grain-boundary diffusion vary and similarly the diffusion
constant D may alter for a given sample in function of time. In this case, a simple
diffusion model fails to describe the fluorine uptake. Therefore, this model was
proved to represent a good approximation for fluorine uptake in intact or slightly
altered bone matrices, but not for far degraded or very porous samples: here, other
processes than pure diffusion interfere once a critical degree of degradation has
been achieved, by which the fitting error becomes increasingly important. An age
determination based on the analysis of D becomes more and more uncertain.
It has to be considered that fluorine uptake is not a phenomenon occurring in a
bone that may simultaneously go through diagenesis, but that the formation of
FAP itself is one of many manifestations of bone diagenesis. But all efforts within
the scientific community to relate the state of preservation of an archaeological
sample to the exposure time rather than to the burial milieu have failed so far.
We would like to point out the distinct dependence of the diffusion constant D
on the physical bone appearance and the interaction of various parameters en-
tailing the resulting fluorine distribution in an archaeological bone sample. This
study brings up the paradox of the ‘‘altering constant’’ D and highlights the large
spectrum of uncertainties in a multi-variate system of bone, soil and time. One of
the main problems that remain to be solved is the possibility to deduce the time
duration during which a single influencing factor has been of relevance. Further
studies on fluorine dating should integrate the change of the diffusion constant D
over time into their model.
4. SUMMARY
Diffusion tends to equilibrate concentration differences between two reservoirs
upon contact; fluorine concentration profiles develop at the boundary of the two
compartments as a function of time. Studies of the distribution of this trace el-
ement in archaeological samples such as bones, teeth or flints allow to gain some
age information on the excavated objects of a burial site. The presented tech-
nique using beams of accelerated protons allows to measure fluorine diffusion
profiles with an excellent space resolution. The surface exposure duration was
deduced by the same method for Antarctic meteorites.
A severe limitation of the methods to unravel age information or dating
of objects is given by the time-dependent changes of the value of the
diffusion constant D as well as by all the transformations any material under-
goes through time.
M. Dobeli et al.246

ACKNOWLEDGEMENTS
The authors would like to thank Dr. S. Ulrich-Bochsler, Historical Anthropology,
University of Berne, and Dr. M. Nussbaumer, Natural History Museum, Berne, for
providing of archaeological samples. We thank Dr. K. Noll for the data he has
provided for this article.
APPENDIX:. ACRONYMS AND GLOSSARY
PIGE (or PIGME) particle-induced gamma-ray emission
NRA nuclear reaction analysis
PIXE particle-induced X-ray emission
NRRA nuclear resonant reaction analysis
BGO bismuth germanium oxide
CPA charged particle activation
RBS Rutherford backscattering spectrometry
ERDA elastic recoil detection analysis
EDX/WDX energy/wave dispersive analysis of X-rays
Chondrites rock of meteoric origin containing peculiar rounded
granulae of some mineral, which give the name of
chondrites
Diagenesis the physical, chemical or biological alteration of sediments
into sedimentary rocks, this term may also be used for
alteration phenomena occurring in bones and teeth and
any other archaeological material after deposition
HAP hydroxyapatite
FAP fluorapatite
erf error function
REFERENCES
[1] J.W.Mayer, E.Rimini (Eds.), Ion Beam Handbook for Material Analysis, AcademicPress, New York, 1977.
[2] J.R.Tesmer, M.Nastasi (Eds.), Handbook of Modern Ion Beam Materials Analysis,MRS, Pittsburgh, 1995.
[3] G.E. Coote, Ion-beam analysis of fluorine – its principles and applications, Nucl.Instr. Meth. B66 (1992) 191–204.
[4] F. Bodart, G. Demortier, Interferences of neutron-induced g-ray emission in Ge(Li)detectors in elemental analysis by proton-induced g-ray emission, Radiochem. Ra-dioanal. Lett. 31 (1977) 215–224.
Fluorine Analysis by Ion Beam Techniques for Dating Applications 247

[5] R.B. Bouiton, G.T. Ewan, Simultaneous analysis of light elements using promptnuclear reaction gamma rays, Anal. Chem. 49 (1977) 1297–1303.
[6] M. Kregar, J. Muller, P. Rupnik, F. Spiler, Concentration profile measurements usingmultiply resonant nuclear reactions, Fizika 9 (1977) 81.
[7] J.R. Bird, M.D. Scott, L.H. Russell, M.J. Kenny, Analysis using ion induced gammarays, Nucl. Instr. Meth. 149 (1978) 336.
[8] M.J. Kenny, J.R. Bird, E. Clayton, Proton induced gamma-ray yields, Nucl. Instr.Meth. 168 (1980) 115–120.
[9] M.J. Kenny, Thick target gamma yields from fluorine, Aust. J. Phys. 34 (1981)35–41.
[10] I. Khubeis, J.F. Ziegler, Microanalysis of fluorine using the 19F(p,ao)16O reaction,
Nucl. Instr. Meth. B24-B25 (1987) 691–694.[11] Zheng-Zhihao, Wang-Yongqiang, A simple simulation method for profiling elements,
Nucl. Tech. 13 (1990) 409–413.[12] H.E. Zschau, F. Plier, J. Vogt, G. Otto, H. Duschner, J. Arends, D. Grambole,
F. Herrmann, R. Klabes, R. Salomonovic, Z. Hulek, M. Setvak, Test of a new stand-ard for fluorine determination with PIGE, Nucl. Instr. Meth. B68 (1992) 158–160.
[13] S.O.F. Dababneh, K. Toukan, I. Khubeis, Excitation function of the nuclear reaction19F(p,ag)16O in the proton energy range 0.3–3.0MeV, Nucl. Instr. Meth. B83 (1993)319–324.
[14] C. Olivier, H.L. Van-Niekerk, On the use of LiF as non- and analyte spike for thedetermination of fluorine by PIGE, Nucl. Instr. Meth. B B85 (1994) 128–132.
[15] G. Demortier, Analysis of light elements with a nuclear microprobe – a review, Nucl.Instr. Meth. B104 (1995) 244–254.
[16] J. Jin, D.L. Weathers, J.P. Biscar, B.F. Hughes, J.L. Duggan, F.D. McDaniel,S. Matteson, Convolution fitting and deconvolution methods for fluorine depth pro-filing by resonant NRA, AIP Conf. Proc. 392 (1997) 681–684.
[17] J.D. Borgardt, M.D. Ashbaugh, L.C. McIntyre, J.O. Stoner, R.B. Gregory, M. Azrak,J. Wetzel, Detection and depth profiling of 19F using a resonance at 2313 keV in the19F(a ,p)22Ne nuclear reaction, Nucl. Instr. Meth. B136–B138 (1998) 528–532.
[18] A. Fessler, T.N. Massey, B.J. Micklich, D.L. Smith, Thick target photon yields andangular distributions for the 19F(p,ag)16O source reaction at incident proton energiesbetween 1.5 and 4.0MeV, Nucl. Instr. Meth. A450 (2000) 353–359.
[19] D. Grambole, C. Neelmeijer, K. Noll, F. Herrmann, 19F(p,p0g)19F and 18O(p,g)19Fgamma-ray interferences studied on liquids, Nucl. Instr. Meth. B161–B163 (2000)269–274.
[20] A.P. Jesus, B. Braizinha, J.P. Ribeiro, Excitation function and cross-sections of thereaction 19F(p,p0g)19F, Nucl. Instr. Meth. B161–B163 (2000) 186–190.
[21] J. Middleton, On the fluorine in bones, its source and its application to the deter-mination of the geological age of fossil bones, Geol. Soc. Lond. Proc. 4 (1944)431–433.
[22] G.E. Coote, N.E. Whitehead, G.J. McCallum, Rapid method of obsidian character-ization by inelastic-scattering of protons, J. Radioanal. Chem. 12 (1972) 491–496.
[23] G.E. Coote, R.J. Sparks, New Zealand J. Archaeol. 3 (21) (1981) 806–810.[24] G.E. Coote, R.J. Sparks, P. Blattner, Nuclear microprobe measurement of fluorine
concentration profiles, with application in archaeology and geology, Nucl. Instr.Meth. 197 (1982) 213–221.
[25] G.E. Coote, S. Holdaway, in: W. Ambrose, P. Duerden (Eds.), Archaeometry:An Australasian Perspective, Australian National University, Canberra, 1982,pp. 251–261.
[26] G.E. Coote, I.C. Vickridge, Application of a nuclear microprobe to the study ofcalcified tissues, Nucl. Instr. Meth. B30 (1988) 393–397.
[27] G.E. Coote, T. Molleson, Archaeometry: Australasian Studies, J. R. Prescott (Ed.),Physics Department, University of Adelaide, 1988, pp. 99–104.
M. Dobeli et al.248

[28] G.E. Coote, Fluorine as an indicator of changes in bones and teeth, Trace elementsin New Zealand: environmental, human and animal, Proc. New Zealand Trace El-ements Group Conf., 1989, pp. 183–188.
[29] G.E. Coote, W.J. Trompetter, Strontium and fluorine markings in shells of a mollusk(Paphies-Subtriangulata) with potential importance in biology and archaeology,Nucl. Instr. Meth. B77 (1993) 501–504.
[30] G.E. Coote, R.W. Gauldie, W.J. Trompetter, I.C. Vickridge, A. Markwitz, Twentyyears of proton microprobe research in biominerals: a tribute to Graeme ErnestCoote, 1935–1997, Nucl. Instr. Meth. B158 (1999) 1–5.
[31] R.E. Taylor, Fluorine diffusion: a new dating method for chipped lithic materials,World Archaeol. 7 (1975) 125–135.
[32] R.O. Allen, P.J. Clark, Fluorine in meteorites, Geochim. Cosmochim. Acta 41 (1977)581–585.
[33] P. Walter, M. Menu, I.C. Vickridge, Fluorine depth profiles as a relative datingmethod of chipped flints, Nucl. Instr. Meth. B45 (1990) 119–122.
[34] P. Walter, M. Menu, J.C. Dran, Dating of archaeological flints by fluorine depthprofiling – new insights into the mechanism of fluorine uptake, Nucl. Instr. Meth. B64(1992) 494–498.
[35] U. Krahenbuhl, K. Noll, M. Dobeli, D. Grambole, F. Herrmann, L. Tobler, Exposure ofALH84001 and other achondrites on the Antarctic ice, Meteor. Planet. Sci. 33 (1998)665–670.
[36] K. Noll, M. Dobeli, L. Tobler, D. Grambole, U. Krahenbuhl, Fluorine profiles in ac-hondrites and chondrites from Antarctica by nuclear reaction analysis (NRA), Me-teor. Planet. Sci. 32 (1997) ; A101.
[37] K. Noll, M. Dobeli, D. Grambole, F. Herrmann, U. Krahenbuhl, Fluorine enrichmenton the surface of Antarctic C30 and H chondrites by nuclear reaction analysis (NRA)and the sources of this terrestrial fluorine, Meteor. Planet. Sci. 33 (1998)A118–A119.
[38] K. Noll, M. Dobeli, U. Krahenbuhl, Fluorine profiles in Antarctic meteorites by nuclearreaction analysis, Fresenius J. Anal. Chem. 361 (1998) 713–715.
[39] C. Kottler, M. Dobeli, U. Krahenbuhl, M. Nussbaumer, Exposure age dating byfluorine diffusion, Nucl. Instr. Meth. B188 (2002) 61–66.
[40] K. Noll, M. Dobeli, U. Krahenbuhl, D. Grambole, F. Herrmann, C. Koeberl, Detectionof terrestrial fluorine by proton induced gamma emission (PIGE): a rapid quantifi-cation for Antarctic meteorites, Meteor. Planet. Sci. 38 (2003) 759–765.
[41] J. Stroobants, F. Bodart, G. Deconninck, G. Demortier, G. Nicolas, in: O. Meyer,C. Linker, F. Kappeler (Eds.), Ion Beam Surface Layer Analysis, Plenum, New York,1976, pp. 933–943.
[42] G. Demortier, J. Stroobants, G. Deconninck, F. Bodart, LARN Report, 724 (1983).[43] D. Grambole, C. Bauer, P. Gippner, C. Heiser, W. Rudolph, H.J. Thomas, Fluorine
determination in the near surface region of solids using the 19F(p,p0g)19F resonancereaction, J. Radioanal. Nucl. Chem. Articles 83 (1984) 107–115.
[44] J.F. Ziegler, J.P. Biersack, U. Littmark, The Stopping and Range of Ions inSolids, Pergamon Press, New York, 1985. Computer code available at http://www.srim.org.
[45] E. Moller, N. Starfelt, Microanalysis of fluorine in zircaloy by use of 19F(p,ag)16Oreaction, Nucl. Instr. Meth. 50 (1967) 225.
[46] D.J. Land, D.G. Simons, J.G. Brennan, M.D. Brown, in: O. Meyer, C. Linker,F. Kappeler (Eds.), Ion Beam Surface Layer Analysis, Plenum, New York, 1976,p. 851.
[47] B. Maurel, G. Amsel, J.P. Nadai, Depth profiling with narrow resonances of nuclearreactions: theory and experimental use, Nucl. Instr. Meth. 197 (1982) 1–13.
[48] G. Deconninck, B. Van-Oystaeyen, High resolution depth profiling of F, Ne and Na inmaterials, Nucl. Instr. Meth. 218 (1983) 165–170.
Fluorine Analysis by Ion Beam Techniques for Dating Applications 249
[49] P.J.M. Smulders, A deconvolution technique with smooth non-negative results,Nucl. Instr. Meth. B14 (1986) 234–239.
[50] I. Vickridge, G. Amsel, Spaces – a PC implementation of the stochastic-theory ofenergy-loss for narrow-resonance depth profiling, Nucl. Instr. Meth. B45 (1990)6–11.
[51] J. Rickards, Fluorine studies with a small accelerator, Nucl. Instr. Meth. B56–B57(1991) 812–815.
[52] G. Amsel, B. Maurel, High resolution techniques for nuclear reaction narrow res-onance width measurements and for shallow depth profiling, Nucl. Instr. Meth. 218(1983) 183–196.
[53] J.W. Mandler, R.B. Moler, E. Raisen, K.S. Rajan, Determination of fluoride con-centration profile in tooth enamel using a nuclear-resonance technique, Thin SolidFilms 19 (1973) 165–172.
[54] F. Bodart, G. Deconninck, Concentration depth profiling in fluorine implanted iron,Nucl. Instr. Meth. 197 (1982) 59–63.
[55] A.W. Crawford, W.J. Sampson, H.J. Debruin, Shallow fluorine depth profiles ofcementum in periodontal disease – a pilot-study, J. Dent. Res. 62 (1983) .
[56] J.D. Borgardt, M.D. Ashbaugh, L.C. McIntyre Jr., J.O. Stoner Jr., R.B. Gregory,M. Azrak, J. Wetzel, Detection and depth profiling of 19F using a resonance at2313 keV in the 19F(a,p)22Ne nuclear reaction, Nucl. Instr. Meth. B 136–138 (1998)528–532.
[57] D. Dieumegard, B. Maurel, G. Amsel, Microanalysis of fluorine by nuclear reactions.I. 19F(p,ao)
16O and 19F(p,ag)16O reactions, Nucl. Instr. Meth. 168 (1980) 93–103.[58] J.R. Bird, E. Clayton, The PIGME method for fluorine determination, Nucl. Instr.
Meth. 218 (1983) 525–528.[59] K. Noll, PhD Thesis, University of Berne, Switzerland, 1998.[60] R.A. Jarjis, On the determination of fluorine concentration profiles in magnesium
alloy scales using the 19F(p,ag)16O reaction, Nucl. Instr. Meth. B154 (1978)383–387.
[61] D.N. Jamieson, B. Rout, R. Szymanski, P. Spizzirri, A. Sakellariou, W. Belcher,C.G. Ryan, The new Melbourne nuclear microprobe system, Nucl. Instr. Meth. B190(2002) 54–59.
[62] G.W. Grime, M.H. Abraham, M.A. Marsh, The new external beam facility of theOxford scanning proton microprobe, Nucl. Instr. Meth. B181 (2001) 66–70.
[63] T. Calligaro, J.C. Dran, J. Salomon, P. Walter, Review of accelerator gadgets for artand archaeology, Nucl. Instr. Meth. B226 (2004) 29–37.
[64] Y.I. Bondarenko, V.S. Rudenko, Determination of fluorine by deuteron activation, J.Radioanal. Chem. 52 (1979) 127.
[65] W.K. Chu, J.W. Mayer, M.A. Nicolet, Backscattering Spectrometry, Academic Press,New York, 1978.
[66] J. Tirira, Forward Recoil Spectrometry, Plenum, New York, 1996.[67] E. Arai, A. Zounek, M. Sekino, K. Takemoto, O. Nittono, Depth profiling of porous
silicon surface by means of heavy-ion TOF ERDA, Nucl. Instr. Meth. B85 (1994)226–229.
[68] J. Paivasaari, M. Putkonen, L. Niinisto, A comparative study on lanthanide oxide thinfilms grown by atomic layer deposition, Thin Solid Films 472 (2005) 275–281.
[69] K.P. Oakley, C.R. Hoskins, New evidence on the antiquity of piltdown man, Nature4193 (1950) 379–382.
[70] M. Langenauer, U. Krahenbuhl, Halogen contamination in Antarctic H5 and H6chondrites and relation to sites of recovery, Earth Planet. Sci. Lett. 120 (1993)431–442.
[71] M. Langenauer, U. Krahenbuhl, Depth-profiles and surface enrichment of the hal-ogens in four Antarctic H5 chondrites and in two non-Antarctic chondrites, Mete-oritics 28 (1993) 98–104.
M. Dobeli et al.250

[72] C.M. Nielsen-Marsh, R.E.M. Hedges, Patterns of diagenesis in bone I: the effects ofsite environments, J. Archaeol. Sci. 27 (2000) 1139–1150.
[73] I. Reiche, C. Vignaud, L. Favre-Quattropani, L. Charlet, M. Menu, Diffusion in ar-chaeological bones, Defect and Diffusion Forum Vols. 194–199 (2001) 953–960.
[74] F. Berna, A. Matthews, S. Weiner, Solubilities of bone mineral from archaeologicalsites: the recrystallization window, J. Archaeol. Sci. 31 (2004) 867–882.
[75] S. Weiner, P.A. Price, Disaggregation of bone into crystals, Calcified Tissue Int. 39(1986) 365–375.
[76] K.P. Oakley, The fluorine-dating method, Yearbook of Physical Anthropology, Vol-ume 5, Wiley-Liss, New York, 1949, pp. 44–52.
[77] H. Toots, R.B. Parker, Factors affecting fluorine content of fossil bones and teeth,Contrib. Geol. University of Wyoming 18 (1979) 69–70.
[78] A.R. Millard, R.E.M. Hedges, The role of the environment in uranium uptake byburied bone, J. Archaeol. Sci. 22 (1995) 239–250.
[79] D. Chlubek, I. Nocen, E. Dabkowska, B. Zyluk, Z. Machoy, B. Kwiatkowska, Fluorideaccumulation in human skulls in relation to chronological age, Fluoride 29 (3) (1996)131–134.
[80] G.E. Coote, P. Nelson, Diffusion profiles of fluorine in archaeological bones andteeth: their measurement and application, in: G. Ward (Ed.), Archaeology at AN-ZAAS, Canberra Archaeological Society, Canberra, 1984, pp. 22–27.
[81] S. Holdaway, Fluorine Profiling: A New Method for the Relative Dating of Bone,Dissertation for BA, Anthropology Department, University of Otago, 1981.
[82] A.R. Millard, R.E.M. Hedges, A diffusion–adsorption model of uranium uptake byarchaeological bone, Geochim. Cosmochim. Acta 60 (12) (1996) 2139–2152.
[83] A.W.G. Pike, R.E.M. Hedges, P. Van Calsteren, U-series dating of bone using thediffusion–adsorption model, Geochem. Cosmochem. Acta 66 (2002) 4273–4286.
[84] A.M. Rae, R.E.M. Hedges, M. Ivanovich, Further studies for uranium-series dating offossil bone, Appl. Geochem. 4 (1989) 331–337.
[85] J.E. Ericson, O. Dersch, F. Rauch, Quartz hydration dating, J. Archaeol. Sci. 31(2004) 883.
[86] W.R. Ambrose, Obsidian hydration dating, in: D.R. Brothwell, A.M. Pollard (Eds.),Handbook of Archaeological Sciences, Wiley, New York, 2004, pp. 81–92.
[87] F. Leach, H. Naylor, Dating New Zealand obsidians by resonant nuclear reactions,New Zealand J. Archaeol. 3 (1981) 33–49.
[88] R.E.M. Hedges, Bone diagenesis: an overview of processes, Archaeometry 44 (3)(2002) 319–328.
[89] H. Piepenbrink, Examples of chemical changes during fossilisation, Appl. Geochem.4 (1989) 273–280.
[90] S. Weiner, O. Bar-Yosef, States of preservation of bones from prehistoric sites in thenear east: a survey, J. Archaeol. Sci. 17 (1990) 187–196.
[91] A.M. Child, Towards an understanding of the microbial decomposition of archae-ological bone in the burial environment, J. Archaeol. Sci. 22 (1995) 165–174.
[92] C.N. Trueman, D.M. Martill, The long-term survival of bone: the role of bioerosion,Archaeometry 44 (2002) 371–382.
[93] N. Tuross, Alterations in fossil collagen, Archaeometry 44 (2002) 427–434.[94] I. Reiche, C. Vignaud, M. Menu, The crystallinity of ancient bone and dentine: new
insights by transmission electron microscopy, Archaeometry 44 (2002) 447–459.[95] C.N.G. Trueman, A.K. Behrensmeyer, N. Tuross, S. Weiner, Mineralogical and
compositional changes in bones exposed on soil surfaces in Amboseli NationalPark, Kenya: diagenetic mechanisms and the role of sediment pore fluids, J. Arch-aeol. Sci. 31 (2004) 721–739.
[96] C.M. Nielsen-Marsh, R.E.M. Hedges, Dissolution experiments on modern and dia-genetically altered bone and the effect on the infrared splitting factor, Bull. de laSociete de Geologie de France 168 (1997) 485–490.
Fluorine Analysis by Ion Beam Techniques for Dating Applications 251

[97] St Jankuhn, T. Butz, R.-H. Flagmeyer, T. Reinert, J. Vogt, B. Barckhausen,J. Hammerl, R. Protsch von Zieten, D. Grambole, F. Herrmann, K. Bethge, Ionmicroprobe analyses of ancient human bone, Nucl. Instr. Meth. B136–B138 (1998)329–333.
[98] I. Reiche, L. Favre-Quattropani, T. Calligaro, J. Salomon, H. Bocherens, L. Charlet,M. Menu, Trace element composition of archaeological bones and post-mortemalteration in the burial environment, Nucl. Instr. Meth. B150 (1999) 656–662.
[99] C.N. Trueman, N. Tuross, Trace elements in recent and fossil bone apatite, Rev.Mineral. Geochem. 48 (2002) 489–521.
[100] A.A.-M. Gaschen, U. Krahenbuhl, M. Dobeli, A. Markwitz, B. Barry, Studies onfluorine diffusion in archaeological bones, Bull. de la Societe Suisse d’Anthropologie10 (1) (2004) 23–33.
[101] A.A.-M. Gaschen, U. Krahenbuhl, M. Dobeli, A. Markwitz, B. Barry, Artificial fluorineenrichment in bones: diagenesis as restricting factor for exposure age dating byfluorine diffusion, Proc. 34th Int. Symp. Archaeometry, Zaragoza, 2004.
[102] A.A.-M. Gaschen, U. Krahenbuhl, M. Dobeli, A. Markwitz, B. Barry, Fluorine andcalcium profiling by PIGE/PIXE for exposure age dating in archaeology, accepted,scheduled for a special issue of the International Journal of PIXE, 15, 1–2, 2005
[103] A.A.-M. Gaschen, Relevance of fluorine diffusion for exposure age dating in ar-chaeological bones and teeth, Unpublished PhD Thesis, University of Bern, 2005.
[104] R.E.M. Hedges, A.R. Millard, A.W.G. Pike, Measurements and relationships of dia-genetic alteration of bone from three archaeological sites, J. Archaeol. Sci. 22 (1995)201–209.
[105] I. Reiche, L. Favre-Quattropani, C. Vignaud, H. Bocherens, L. Charlet, M. Menu, Amulti-analytical study of bone diagenesis: the Neolithic site of Bercy (Paris, France),Meas. Sci. Technol. 14 (2003) 1608–1619.
[106] C.M. Nielsen-Marsh, R.E.M. Hedges, Bone porosity and the use of mercury intrusionporosimetry in bone diagenesis studies, Archaeometry 41 (1999) 165–174.
[107] L. Harsanyi, Differential diagnosis of human and animal bone, in: G. Grupe,A.N. Garland (Eds.), Histology of Ancient Bone: Methods and Diagnosis, Springer,Berlin, 1993, pp. 79–94.
[108] D.H. Enlow, S.O. Brown, A comparative histological study of fossil and recent bonetissues – part I, Tex. J. Sci. 8 (1956) 405–443.
[109] B. Herrmann, S. Hummel, H. Schutkowski, G. Grupe, H. Piepenbrink, PrahistorischeAnthropologie: Leitfaden der Feld- und Labormethoden, Springer, Berlin, 1990.
[110] K.C. Welten, L. Lindner, C. Alderliesten, K. van der Borg, Terrestrial ages of ordinarychondrites from the Lewis Cliff stranding area, East Antarctica, Meteor. Planet. Sci.34 (1999) 558–570.
M. Dobeli et al.252

CHAPTER 8
Fluorine and Its Relevance for ArchaeologicalStudies
Ina Reiche�
Laboratoire du Centre de Recherche et de Restauration des Musees de France, UMR 171
CNRS, Palais du Louvre – Porte des Lions, 14, Quai Franc-ois Mitterrand, 75 001 Paris,France
Contents
1. Introduction 254
2. Fluorine-containing ancient materials of archaeological interest 255
2.1. Bone material (bone, teeth, antler) 255
2.2. Flint 257
2.3. Obsidian 257
3. Description of the chemical composition and the structure of bone material and
flint 257
3.1. Characteristics of bone material 258
3.1.1. Chemical composition 258
3.1.2. Macrostructure and mesostructure of bone 258
3.1.3. Micro- and nanostructure of bone 258
3.2. Characteristics of teeth 259
3.3. Characteristics of antler 259
3.4. Characteristics of flint 259
4. Incorporation of Fluorine 260
4.1. Incorporation of F into bone 260
4.2. Incorporation of F into tooth 261
4.3. Incorporation of F into flint 261
5. Fluorine analysis of archaeological samples 261
5.1. Specific requirements for the analysis of archaeological artefacts 261
5.2. Analytical methods for F detection 262
5.2.1. Particle (or proton)-induced g-ray emission 262
5.2.2. Electron microprobe 264
5.2.3. Secondary ion mass spectrometry 264
5.2.4. Transmission electron or scanning electron microscopy coupled with
an energy-dispersive detector 266
5.2.5. Potentiometry 266
6. Examples of archaeological studies 266
�Corresponding author.;
E-mail: [email protected]
FLUORINE AND THE ENVIRONMENT, VOLUME 2
ISSN 1872-0358 DOI: 10.1016/S1872-0358(06)02008-2
r 2006 Elsevier B.V.All rights reserved
253

6.1. F dating of flints: the case of arrowheads from the Fort Harrouard prehistoric
site (Eure et Loir, France) 267
6.2. Bone diagenesis studies 268
6.2.1. Study sites and material 269
6.2.2. Average F concentrations of archaeological bones, dentine and antler 271
6.2.3. Fluorine enrichment measured on individual apatite crystals by TEM-
EDX 271
6.2.4. Fluorine concentration profiles on cross-sections 271
6.3. Odontolite: a turquoise bone material 276
7. Conclusions and future of fluorine studies in archaeology 279
Acknowledgements 279
References 280
AbstractThis paper represents a review of the importance of studying fluorine (F) in archaeological
artefacts. Fluorine is an element which is omnipresent in water and soil environments. Thus,
it is incorporated into archaeological artefacts as bones or flints in different ways during their
burial depending on the geochemical conditions and on the artefact conservation state. The
incorporation pathways of F lead to different F distribution patterns in the artefacts. There-
fore, these artefacts can be considered as geochemical archives for the reconstruction of
their burial history. Moreover, studies of F in ancient bone material or flints can give precious
information that are relevant for archaeological purposes as e.g. post-mortem diagenesis. In
some cases, relative dating or evidence for heat processes of artefacts is possible.
In the introduction, the paper gives a review of general questions in archaeology and
relevant examples where analytical studies can give answers to.
Then, ancient materials where F is found are presented. The study of F in archaeology
is particularly important for materials as bones and flints. Therefore, the majority of the
paper is dedicated to the study of these materials and the information deduced on the past.
The knowledge of the composition and structure of both types of material is necessary
for the understanding of the F incorporation, and is briefly reviewed. Furthermore, pos-
tulated incorporation mechanisms of the F uptake over time are reported.
In the next paragraph, the most commonly applied analytical methods for F detection in
archaeological artefacts are presented. Specific problems related with the analysis of
precious and unique artefacts are discussed.
Significant archaeological case studies are shown and discussed to highlight the impor-
tance of F studies in archaeological artefacts. However, these examples enable us to ev-
idence the limits of F relevance in archaeology and the precautions to take when using these
data for archaeological interpretations. Finally, conclusions and an outlook are presented.
1. INTRODUCTION
This paper reviews studies of fluorine in artefacts of cultural heritage and ar-
chaeology. F is an element which is omnipresent in water and soil environments.
It can be incorporated into archaeological artefacts such as bones or flints in
different ways during their burial, depending on geochemical conditions and ar-
tefact conservation states.
I. Reiche254

Generally, archaeological artefacts are studied in human sciences by a stylistic
approach, their burial context and by comparison of the material with written
sources. However, some relevant questions in archaeology also concern the
material origin, fabrication technologies and dating of the objects. Indeed, a part
of this information is recorded in the chemical composition or structure of the
artefacts at different levels. It can be assessed by analysing major, minor or trace
constituents or by investigating the specific signatures impregnated on the
macro-, micro- or even nanoscopic scale of the material. Therefore, the analysis
of objects of cultural heritage can be very helpful to gain complementary infor-
mation on past populations and their level of technological knowledge. The fields
of physico-chemical studies of archaeomaterials – often called archaeometry –
have developed several objectives as e.g. the determination of the exact nature
of materials, their provenance, chronology and the study of fabrication tech-
niques. It also includes the study of alteration phenomena in order to better
evaluate the informative potential of the archaeological artefacts and to develop
well suited conservation strategies. Biological, geological and remote sensing
studies also belong to the fields of archaeometry.
In this viewpoint, analytical studies of the F concentrations and distributions in
archaeological artefacts can also give information about their state of preservation
or inversely their post-mortem alteration processes (diagenesis) that have affected
the material composition and structure. In some special cases, relative dating of
the objects or evidence of technological knowledge of past populations is possible.
Indeed, the idea to use F uptake in bone material for dating purposes is not new
and was already proposed in the 19th century by Middleton and Carnot [1,2].
2. FLUORINE-CONTAINING ANCIENT MATERIALS OFARCHAEOLOGICAL INTEREST
The study of F in archaeological materials is mostly focussed on bone materials
or flints. Therefore, this paper is mainly dedicated to the study of these materials
and their potential for revealing information on the past; some applications of F
studies in obsidian and teeth are also mentioned. The following examples illus-
trate the importance of the chemical and isotopic analysis for archaeological
studies, in general. Prior to the presentation of F studies in archaeological bone
material and flint, it is important to review their main characteristics in order to be
able to adequately evaluate the output and limits of investigations.
2.1. Bone material (bone, teeth, antler)
Bones or objects made of bone material are an important part of the archaeo-
logical remains and can largely contribute to the understanding of ancient societies
Fluorine and Its Relevance for Archaeological Studies 255

as they give evidence of human or fauna occupation, climatic and environmental
conditions. They are used to identify the species, their age and sex, their relativity
degree, their sanitary state, to enumerate the individuals that lived at one ar-
chaeological site, to get information on their exploitation of animal herds and to
deduce the use of these materials as a function of their morphology or of traces
observed on the artefacts (mode of use, treating with primary materials, fabrication
techniques). Concerning prehistorical times, these objects are of particular im-
portance since there are no written sources and all information obtained on the
past have to be deduced from the material discovered and their spatial distribution
on an archaeological site. Basically, prehistoric remains are bone, stones, objects
made of these materials, pigments and later ceramics and wood. Therefore, it is
necessary to extract as much information as possible from these materials.
As a biomaterial, bone provides various information on diets and environmental
conditions during the life of the individual. It also records the age in its chemical
and isotopic composition. Generally, these researches on bone materials are
based on specific trace elements, isotopes or isotopic ratios and more recently
also on DNA studies. Namely for dating, the 14C/12C ratio and the U-Th disequi-
librium are used [3,4]. Some authors also proposed the use of F penetration for
dating purposes of bone [2,5–9], even if this dating method cannot be used
without precautions as can be seen later in this chapter. The study on palaeodiets
is based on the isotopic compositions d13C and d15N of bone. For instance, using
d15N and d13C data of remaining collagen from ancient bones, Bocherens (1997)
found that Neanderthal men from a Pleistocene site in Marillac (Charente,
France) were essentially carnivore species and effective predators [10].
Thanks to the analysis of trace element ratios Ba/Sr/Ca, the diets at the
Chalcolithic site of Pico Ramos, Basque Country, and Spain could be recon-
structed [11]. At this site, archaeologists observed a late introduction of Neolithic
habits suspecting a diet based on hunting or seafood because of the absence of
some indicators of Neolithic lifestyle like agriculture.
An interesting application of isotopic studies in bone and teeth is the compar-
ative analysis of Sr isotopes (87Sr/86Sr) for evidencing migration processes be-
tween childhood and adulthood. Indeed, the Sr isotopic ratio is characteristic of
the geological environment of the site. Therefore, this ratio is different in soil
water on the sites depending on the geological formation conditions of the rocks.
Because Sr can substitute for Ca, Sr is integrated into bone minerals of the
individuals. Comparing the Sr isotopic ratio in teeth and in bone allows the de-
termination of migration processes as – contrary to teeth reflecting childhood
living conditions – bone is continuously renewed and its composition thus reflects
the environment of the adulthood [12].
The morphology and structure of artefacts at different levels can also give pre-
cious insights into ancient diseases [13]. In addition, bone material was transformed
in tools or sometimes even works of art [14,15]. Bone also served as combustible;
I. Reiche256

thus, the evidence of a heat treatment is very important to understand the use of
primary material in the past and during the evolution of past populations [16–20].
It is important to understand the alteration phenomena of old artefacts, especially
for the conservation of objects of our cultural heritage. This understanding enables
a better evaluation of the reliability of the information that can be extracted from the
investigation and observation of the objects. Furthermore, it allows the establish-
ment of adequate conservation and restoration treatments. Therefore, many stud-
ies are devoted to the estimation of the state of preservation of archaeological
objects [21–34]. Among them, several studies treat the uptake of trace elements
including F in bone as an indicator of specific alteration processes [27–29,31–34].
2.2. Flint
Flints are materials largely used during prehistoric times, thanks to their hardness
and relative homogeneity on a macroscopic scale. Their structure – fine silica
grains at the microscopic scale – enables cutting which makes them perfect
primary materials for the fabrication of different kinds of tools. After the cut, a new
surface is created with a composition and structure corresponding principally to
the heart of the stone. The various uses of the flint object leave traces on this
surface depending on the kind of utilisation (use wear) and the burial environ-
ment. Often this surface alteration is accompanied by the transport or diffusion of
chemical elements. The advancement of this process depends on many param-
eters and mainly on the surface state of the chipped flint and on the burial time.
Therefore, some authors proposed to use – analogously to relative dating of bone
using F depth profiles – these F profiles for dating chipped flints [35].
2.3. Obsidian
Obsidian, a volcanic glass, is generally formed when volcanic lava comes in contact
with water. Often the lava pours into a lake or an ocean and is cooled quickly. This
process produces a glassy texture. Many studies are devoted to the determination of
source sites as it is a very widespread material in prehistory used for tools [36]. Coote
et al. [37] examined 120 specimens by means of proton-induced g-ray emission
(PIGE) and found that the F/Na ratio is well suited to distinguish between different
source sites. Melanesian obsidian was studied using the same method [38,67].
3. DESCRIPTION OF THE CHEMICAL COMPOSITION AND THESTRUCTURE OF BONE MATERIAL AND FLINT
The knowledge of the composition and structure of both types of material is
necessary to understand a possible F incorporation process. These features and
their use for archaeological purposes will be briefly reviewed below.
Fluorine and Its Relevance for Archaeological Studies 257
3.1. Characteristics of bone material
3.1.1. Chemical composition
Bone, dentine, ivory and antler are composite materials made of an organic and
inorganic fraction, which are intimately mixed on a nanometric scale. The organic
phase (20–30wt.%) is mainly composed of a collagen matrix. Collagen is a pro-
tein macromolecule whose formula can be resumed as (Gly-X-Y)33872, where
Gly is the amino acid glycine, and X and Y are other amino acids such as proline
and hydoxyproline. The inorganic phase (60–70wt.%) corresponds to a poorly
crystalline carbonate-hydroxyapatite (Ca10(PO4)6�x(CO3)x(OH)2+x, carb.HAP)
with a hexagonal crystal lattice (P63/m). In addition, bones contain about 10wt.%
of water. The dentine apatite phase is amorphous, whereas irregular nanometric
apatite crystals can be found in bone [17]. Antler shows more acicular crystals
[33]. Bone, dentine, ivory and antler can be considered having similar composite
chemical compositions, even if the structure of dentine or ivory is slightly more
complex than that of bone and antler due to a different arrangement of collagen
fibres [39,40].
The F content in recent bone or dentine apatite is normally less than 0.1wt.%.
For ancient specimen, F is known to diffuse during burial into bone material. Its
enrichment is generally a part of many complex diagenetic changes of bone and
tooth, which remains after their deposit. Fluorine can react with the bone and
dentine mineral phase to form calcium fluoride compounds. It usually substitutes
for hydroxyl ions in hydroxyapatite, leading to the less soluble fluorapatite com-
pound (Ca10(PO4)6(F)2, FAP).
3.1.2. Macrostructure and mesostructure of bone
Compact bone like long bones, most abundant among archaeological bone re-
mains, shows basically two different parts: a central one called diaphysis, mainly
composed of compact bone, and two extremities called epiphysis which are more
porous. It contains a fundamental substance – a mixture of the organic and
mineral phase – and cells that remodel continuously the bone material as well as
the so-called Haversian systems containing channels that provide the nutrition to
the bone cells as they accommodate blood vessels and nerves. The Haversian
channels exhibit diameters between 10 and 70 mm [26]. The periosteum closes
the bone at its outside and the medullar cavity at the inside accommodating the
bone marrow [40].
3.1.3. Micro- and nanostructure of bone
The key of the mechanical and physico-chemical properties of bone lies in its
micro- and nanostructure. The apatite crystals of the mineral phase are nano-
crystalline and irregular platelet shaped with dimensions in the range of
I. Reiche258

(25� 50� 2) nm. These crystals are embedded in the organic fraction, which
builds the bone’s fundamental structure. About 1000 amino acids form each of
the three protein chains (two a1 and one a2) that are arranged forming a triple
helix of 3000 A length and of a diameter of 15 A. These fibrils are staggered and
are more or less aligned with the fibril axis to form a three-dimensional framework
of the collagen fibres in which the crystals can, at least partly, be embedded as
proposed by the model of Hodge and Petruska (1963) [39]. The holes between
fibrils are continuous and form a channel or groove of a width of 680 A. Apatite
crystals can thus be located in the channels or gaps inside or outside the fibrils
[39]. These structural features are very important for the study of diffusion of
chemical species in archaeological bone and seem to have been neglected by
many authors when having determined the diffusion coefficients [5,41–47].
3.2. Characteristics of teeth
Teeth are composed of different parts: enamel at the outer surface, then mainly
dentine, cementum and pulp. Dentine has basically the same composition as
bone, in contrast to enamel, which is composed of 96wt.% of well crystalline
carb. HAP. The enamel crystals can reach up to 1 mm length.
3.3. Characteristics of antler
Antler is the outgrowth of bones of animal scalps. It is made of bone tissue
covered with velour during growth. This tissue is formed by porous bone in the
centre and compact bone outside [48]. Antler has the particularity that it is lost
and renewed every year. So, it is a very rapidly growing material. Antler has a
chemical composition very similar to bone and dentine. It also bears two different
components: an organic matrix made of collagen and an inorganic fraction ba-
sically composed of HAP. The weight fraction of the organic matrix is slightly
higher than in bone or dentine. This feature gives antler very elastic properties. In
addition, it contains an amorphous substance formed by glycoprotein and mu-
copolysaccharide [49]. This later substance permits the growth of antler. The
tissue has a lamellar structure that is crossed by longitudinal and circular vessels.
3.4. Characteristics of flint
Compared to bone material, the composition and structure of flint is much simpler.
Flint takes part in the big family of silicon-containing sedimentary rocks. It is
basically composed of homogeneous microcrystalline silica grains, which give it a
homogeneous macroscopic aspect. The name flint especially defines rocks where
the cortex is thin and the heart of the stone is characterised by the absence of
calcite. The majority of flint is found dispersed in sediments or as subcontinuous
Fluorine and Its Relevance for Archaeological Studies 259

chains. Very often flints also contain microfossils, quartz lepispheres and chal-
cedony, a water-rich form of silica, acting as an interstitial cementum [50].
4. INCORPORATION OF FLUORINE
4.1. Incorporation of F into bone
A diffusion theory and various methods of analysis of F in bone are described in
detail by M. Dobeli et al. in this volume. Therefore, only a brief summary of F
transport phenomena in archaeological bone material is given here. Quite a few
data are known and most without description of the supposed transport mech-
anism. Generally, the reported diffusion coefficients for bone at ambient temper-
ature are much higher than those of enamel. Differences of several orders of
magnitude ranging from 10�8 cm2/s in bone to 10�17 cm2/s in enamel crystals are
observed. Thus, the apatite structure is not an adequate model material to es-
tablish a reliable diffusion model for archaeological bones during the burial time.
These data show the importance of a pertinent diffusion theory that takes ad-
equately into account the effects of intrinsic material properties of bone-like ap-
atite crystal size, microstructure and porosity as well as the influence of
diagenetic modifications, especially the degradation of organic matter, and hy-
drological parameters of the burial environment.
Consequently, the following incorporation mechanism can be proposed: F is
taken up by bone due to the interactions of bone minerals with the pore water
transporting F. As the organic fraction is intimately mixed, at the nanometric
scale, with the mineral one, it has a protecting effect on the mineral phase.
Fluorine can only interact with the apatite phase if the organic fraction is, at least
partly, degraded and leave spaces in the bone structure. So the partial degra-
dation of the organic fraction should precede the adsorption and the subsequent
substitution of OH by F in the apatite matrix. As another consequence of the
degradation of the organic fraction, the bone porosity increases and more pore
water can interact with the bone mineral phase. Contrarily to what was formerly
presented [5], diffusion of F within the channels of the apatite structure does not
influence significantly the F uptake, since the apatite crystal size (smaller than
some 10 s of nm) is too small compared to its surface and this process may be
thus neglected. Fluorine is taken up by the bone mineral by a transport-reaction
mechanism, where F transport takes place at grain boundaries and through in-
terconnected bone pores and then reaction transforms partly or completely carb.
HAP into carb. FAP. Simultaneously, the pore water can also contribute to the
dissolution of bone hydroxyapatite and partial replacement by precipitation of
less-soluble fluorapatite. This mechanism can explain why bone is not enriched in
F under dry conditions and also why even old samples with a high content of
initial organic matter show a very low F content [51].
I. Reiche260

4.2. Incorporation of F into tooth
Because of the complex structure of teeth, simple F depth profiles from the out-
side to the inside of teeth cannot easily be used for dating or other archaeological
purposes. Former studies on F enrichment over time in tooth showed that F ions
in sediment water enter the tooth through the nerve channel and are deposited on
the pulp cavity before they diffuse outward through the dentine and may reach the
enamel. An undamaged tooth is well sealed from F, whereas dentine that was
exposed to F after the removal of enamel or cementum layer can as easily take up
F, as bone. Therefore, interior profiles on dentine were proposed for relative
dating of teeth. However, these studies did not give very conclusive results [5]. A
review of post-mortem uptake of F by teeth is given in Ref. [52].
4.3. Incorporation of F into flint
The F uptake of flint takes a much longer time than that for bone. Fluorine diffusion
into the depth of flint material is controlled by defect clusters. The diffusion coeffi-
cient determined by implanting a model compound (amorphous silica bombarded
with heavy ions and hydrated at 1001C) is 9.10�21 cm2/s at room temperature. The
corresponding penetration depth of F under ambient conditions in a 1000-year-old
artefact can be estimated via x ¼ (Dt)1/2 ¼ 0.17mm [50]. Thus, F accumulates only
in the first micrometre of the surface. The surface of ancient flint artefacts can be
altered by dissolution. The occurrence of this phenomenon is especially important
in basic media. However, in some cases, the thickness of the dissolved layer can
be neglected compared to the F penetration depth at low temperatures. Therefore,
Walter et al. [35] proposed relative dating of chipped flint by measuring the full width
at half maximum (FWHM) of F diffusion profiles in theses cases.
5. FLUORINE ANALYSIS OF ARCHAEOLOGICAL SAMPLES
5.1. Specific requirements for the analysis of archaeologicalartefacts
Generally, objects of our cultural heritage are not only characterised by their rare-
ness or precious nature, but they are often heterogeneous and complex materials.
Complementary analytical methods and examinations at different scales are nec-
essary to obtain reliable results. These investigations should be as non-invasive as
possible. Furthermore, databases established on the analysis of artefacts of
known origin and age are needed for comparison. The analytical strategy depends
on the archaeological issue, the object type, the quantity and complexity of ma-
terial, its degree of degradation and whether sampling is possible or not [53].
Fluorine and Its Relevance for Archaeological Studies 261

5.2. Analytical methods for F detection
In the following paragraph, the most commonly applied analytical methods for F
detection in archaeological artefacts are presented (Table 1). In art and archae-
ology, the method of choice for F analysis is without any doubt particle (or pro-
ton)-induced g-ray emission (PIGE, sometimes also called PIGME) [5].
Other analytical methods can also be applied for the detection of F in archae-
ological artefacts, especially when it is possible to take a sample or to perform
microdestructive analysis. These are namely the electron microprobe with a
wavelength-dispersive detector (WDX), secondary ion mass spectrometry
(SIMS), X-ray fluorescence analysis under vacuum (XRF), transmission electron
or scanning electron microscopy coupled with an energy-dispersive detector
equipped with an ultrathin window (TEM/SEM-EDX). Fluorine can also be meas-
ured by means of classical potentiometry using an ion-selective electrode or ion
chromatography.
5.2.1. Particle (or proton)-induced g-ray emission
PIGE is very sensitive (the limit of detection can be as low as 1 ppm) and
non-destructive. It allows analysis of bulk F, F-distribution within one sample
on cross-sections or depth profiles using resonant nuclear reaction analysis
(RNRA) [35]. The spatial resolution, even using a beam of some micrometres
size or RNRA, is however insufficient to detect F on individual bone crystals. The
RNRA method is reviewed in detail in the chapter of Dobeli et al. [6] in this
volume.
Two different nuclear reactions are currently used for PIGE; they are exten-
sively described in Ref. [6].
5.2.1.1. The AGLAE accelerator
PIGE and micro-PIGE have been performed simultaneously with proton-induced
X-ray emission (PIXE) at the external beamline of the particle accelerator AGLAE
at the Centre of Research and Restoration of the French Museums, Paris,
France. AGLAE is an electrostatic tandem 2MV accelerator (6SDH-2 2MV tan-
dem Pelletron NEC) [54]. At this beamline, 3MeV protons are extracted in an He
atmosphere through either a 10 mm Al, 2 mm Ti or 0.1 mm Si3N4 exit foil. Each
spectrum is obtained with a dose of 0.1–0.2 mC and a current of about 0.5 nA. The
extracted proton beam can be restricted to different beam diameters as a function
of the set-up and the exit foil. Using a 10 mm Al or 2mm Ti exit foil, a focussed
beam of ~150 mm diameter can be obtained (PIGE). The recent development of
the exit set-up with an Si3N4 exit foil allows the production of a microbeam with a
diameter of about 10–100 mm (micro-PIGE) [54]. The beam intensity is monitored
by detecting the protons backscattered from the exit foil or, in the case of the
I. Reiche262

Table 1. Characteristics of analytical techniques used for F detection
Analytical technique
Non-destructiveanalysis possible(conservation ofthe sample after
analysis)Sample quantity
requiredSample
preparation Analysis typeSpatial
resolutionLimit ofdetection
F electrode No 100mg Dilution inaqueoussolution
Surface or bulkanalysis as afunction ofsampling
– Some tens ofppm
Ion chromato-graphy
No A few mg Dilution inaqueoussolution
Surface or bulkanalysis as afunction ofsampling
– 200ppm
SEM/TEM-EDX Yes mm or mm sample Metallisation forSEM/ depositof powder onCu or Au gridor thin sectionfor TEM
Surface analysis/surface orbulk analysisas a functionof sampling
Somehundredsof nm/somehundredsof A
1wt.%
Electronmicroprobe WDX
Yes mm or mm sample Metallisation Surface analysis Somehundredsof nm
0.5wt.%
X-ray fluores-cence(XRF)
Yes mm or mm sample Not necessary Surface analysis Some tens ofmm in air,sub-mm invacuum
1wt.%
SIMS No mm or mm sample Flat surface foranalysis undervacuum
Surface analysis,depth profile
Some metrein depth
Some ppm
NRA (PIGE) Yes No samplingnecessary
Not necessarywhenanalysing inair
Surface analysis(ca. 50 mmanalysisdepth), depthprofile
Some mm inair
50 ppm
Fluorin
eandIts
RelevanceforArchaeologicalStudies
263
microbeam, by detecting the X-rays emitted by Si from the exit foil. Fluorine
content has been determined using the nuclear reactions induced by the incident
protons 19F(p,p’g)19F emitting g-rays of 110 and 197 keV (Fig. 1). The latter one
can also be a product of another nuclear reaction on oxygen-18 (18O(p,g)19F). ButCoote [5] showed that this interference has only a small influence on F concen-
tration measurement. Its contribution is far below 50 ppm, thus in the range of the
statistical error of the measurement. The g-rays at 6.13MeV produced by the
nuclear reaction 19F(p,ag)16O and its escape peaks could also be used for de-
termining the F concentration. Nevertheless, the detector efficiency is not high in
this energy region. The g-rays used for F quantification at 110 and 197 keV are
detected by an HPGe detector at about 5 cm from the sample and at an angle of
451 or 901 with the incident beam, depending on the sample size. The detector
resolution is 1.7 keV for 1.33MeV g-rays from Cobalt-60. A polished geological
FAP crystal from Durango is used as an F standard. Its F content (3.27wt.%) is
confirmed from potentiometric measurements using a specific electrode. The limit
of detection of this method is about 50 ppm [27,32].
For PIGE measurements, transverse bone sections are cut with a diamond
saw and polished with SiC paper, and then placed directly in front of the external
proton beam. It is not necessary to coat the sample surface with a conductive
layer as the charges are dissipated in air and helium. Step width of the concen-
tration profiles is determined by precisely recorded sample translation in front of
the beam. The above experimental conditions were used for F analysis in ar-
chaeological bone materials in the applications described in this chapter.
The measurements of F depth profiles in chipped flints have been realised
using the 4.7 keV wide 872 keV 19F(p,a1U2U3g)16O resonance. This reaction pro-
vides a good depth resolution (about 100 nm in SiO2). The 4–7.5MeV g-rays are
detected with a BGO (bismuth germanium oxide) detector at 01C with respect to
the incident beam. The flint artefacts can be settled in the vacuum chamber as
whole pieces without any sample preparation [35].
5.2.2. Electron microprobe
The electron microprobe provides an adequate tool to measure F. Even if its
sensitivity is less compared to that of PIGE and SIMS, it has the advantage to be
more easily accessible and to allow F analysis with a spatial resolution in the
micrometre range. For F analysis using the electron microprobe, BaF2 is often
used as reference sample, and a W/Si multilayer pseudocrystal is used for the
detection of the Ka line of light elements. The sensitivity reached with this method
is in the range of 0.5wt.% [55].
5.2.3. Secondary ion mass spectrometry
SIMS is a very powerful tool to analyse materials with a high depth and lat-
eral resolution in the nm or 10s of nm region, respectively [42]. It has a high
I. Reiche264
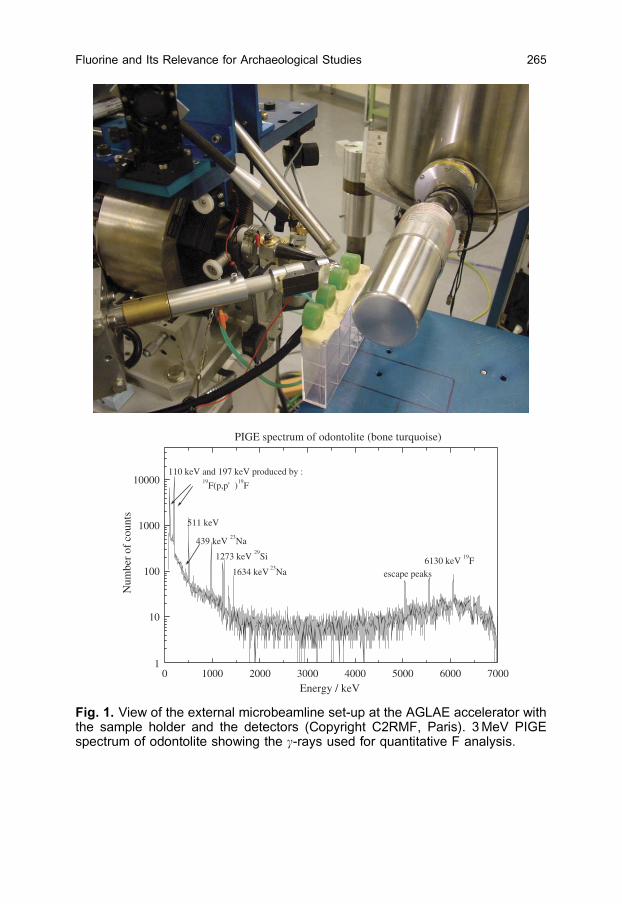
0 1000 2000 3000 4000 5000 6000 70001
10
100
1000
10000
1273 keV 29
Si
439 keV 23
Na
escape peaks6130 keV
19F
1634 keV 23
Na
511 keV
110 keV and 197 keV produced by :
19
F(p,p' )19
F
PIGE spectrum of odontolite (bone turquoise)
Num
ber
of c
ount
s
Energy / keV
Fig. 1. View of the external microbeamline set-up at the AGLAE accelerator withthe sample holder and the detectors (Copyright C2RMF, Paris). 3MeV PIGEspectrum of odontolite showing the g-rays used for quantitative F analysis.
Fluorine and Its Relevance for Archaeological Studies 265

elemental and molecular specificity and allows simultaneous analysis of elements
down to the ppm or even ppb range depending on the ionisation yield of the
material. However, SIMS requires a particular sample preparation for analysis
under vacuum conditions and parts of the sample are ablated during analysis
[42,56,57]. The sample is bombarded with a mono-energetic-focussed ion beam
with energy in the range of 0.2–30 keV. A collision cascade is generated in the
material initiating among other phenomena ionisation and emission of atomic or
molecular species that are separated by a mass spectrometer. Generally, SIMS
can be performed in a static or dynamic mode; the latter one penetrating slowly
the sample while analysing. This allows depth profiling and is, therefore, very
interesting for many applications in the field of cultural heritage, including the
analysis of F depth profiles in bone material or flint. In a study of human and shark
teeth, primary negative oxygen ions were used for F depth resolved analysis on
prepared cross-sections with sensitivity in the 10 ppm range [58].
5.2.4. Transmission electron or scanning electron microscopy coupledwith an energy-dispersive detector
The big advantage in using TEM-EDX for the determination of F in bone is that it
allows to measure the F concentration of individual nanocrystals [32–34]. For
TEM-EDX measurements, a microsample of bone is grounded manually, be-
cause of the problems during the preparation of TEM thin sections. Only 0.1mm3
of the sample powder are necessary. A suspension is deposited onto a carbon-
coated Au or Cu grid. Energy-dispersive X-ray (EDX) analysis can be performed
using an Si(Li) detector equipped with an ultrathin window providing the detection
of light elements as F with a detection limit of 1wt.%.
5.2.5. Potentiometry
An ion-specific electrode can also be used for classical measurement of F in a
sample solution. Its principle is the same as that of a pH electrode. A voltage
proportional to the F amount in the solution is measured that will be compared to a
calibration curve obtained by measuring standard solutions of known F concen-
tration. At least 0.1 g of bone is necessary for each analysis [59]. Fluorine gradients
were also measured in the past by stepwise grinding or etching and analysis of
successive surface layers. This method is sensitive down to about 50ppm F [57].
6. EXAMPLES OF ARCHAEOLOGICAL STUDIES
In this paragraph, studies concerning dating of flint by F diffusion profiles, investi-
gation of F in the frame of recording different bone diagenesis pathways de-
pending on the burial environment and effects of heat treatment on F uptake are
discussed. Finally, the analysis of a turquoise gemstone imitation mainly
I. Reiche266
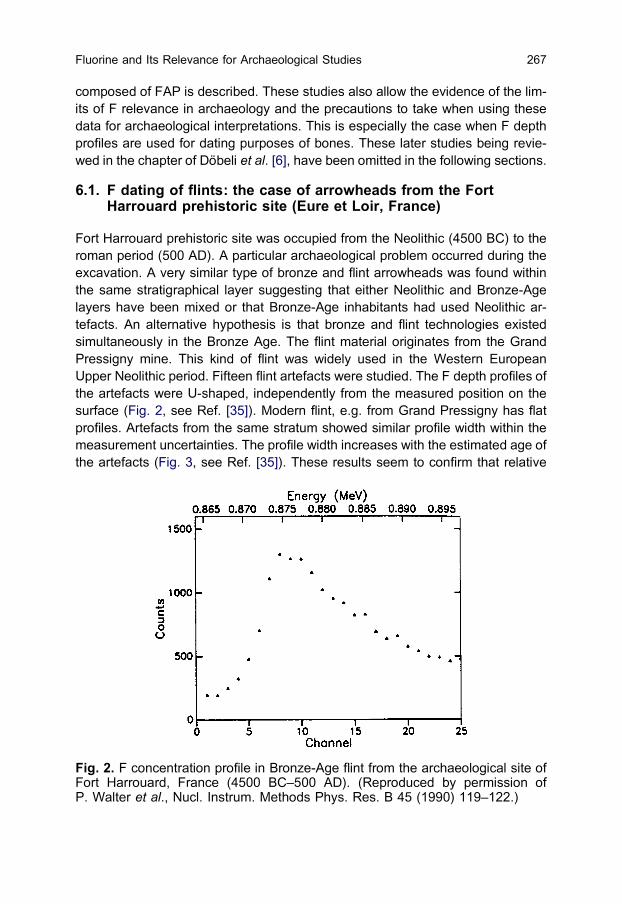
composed of FAP is described. These studies also allow the evidence of the lim-
its of F relevance in archaeology and the precautions to take when using these
data for archaeological interpretations. This is especially the case when F depth
profiles are used for dating purposes of bones. These later studies being revie-
wed in the chapter of Dobeli et al. [6], have been omitted in the following sections.
6.1. F dating of flints: the case of arrowheads from the FortHarrouard prehistoric site (Eure et Loir, France)
Fort Harrouard prehistoric site was occupied from the Neolithic (4500 BC) to the
roman period (500 AD). A particular archaeological problem occurred during the
excavation. A very similar type of bronze and flint arrowheads was found within
the same stratigraphical layer suggesting that either Neolithic and Bronze-Age
layers have been mixed or that Bronze-Age inhabitants had used Neolithic ar-
tefacts. An alternative hypothesis is that bronze and flint technologies existed
simultaneously in the Bronze Age. The flint material originates from the Grand
Pressigny mine. This kind of flint was widely used in the Western European
Upper Neolithic period. Fifteen flint artefacts were studied. The F depth profiles of
the artefacts were U-shaped, independently from the measured position on the
surface (Fig. 2, see Ref. [35]). Modern flint, e.g. from Grand Pressigny has flat
profiles. Artefacts from the same stratum showed similar profile width within the
measurement uncertainties. The profile width increases with the estimated age of
the artefacts (Fig. 3, see Ref. [35]). These results seem to confirm that relative
Fig. 2. F concentration profile in Bronze-Age flint from the archaeological site ofFort Harrouard, France (4500 BC–500 AD). (Reproduced by permission ofP. Walter et al., Nucl. Instrum. Methods Phys. Res. B 45 (1990) 119–122.)
Fluorine and Its Relevance for Archaeological Studies 267

dating of the arrowheads from this site using F depth profiles is possible. The data
obtained on flint arrowheads from Bronze-Age stratum evidence that they were
still manufactured during Bronze Age. Therefore, the hypothesis that bronze and
flint technologies existed simultaneously at this site could be confirmed [35].
6.2. Bone diagenesis studies
If archaeological material is buried, it is constantly in contact with sediments, soils
and interstitial water. The chemical composition and structure change conse-
quently by partial or complete dissolution, erosion and transport phenomena from
the environment into the artefact and vice versa. The resulting state of preser-
vation can be very variable, from well preserved to complete dissolution. It de-
pends largely on the direct environmental conditions (pH, Eh, chemical
composition of the soil and the interstitial water, pressure, biological factors,
particle transport depending on grain size and porosity). The modifications can
false the archaeological interpretations based on the elemental and isotopic
composition of bone and can also be a problem for the conservation of unique
artefacts. Thus, it is of utmost importance to understand the alteration processes
(diagenesis) in soils, especially the transport processes and the impact of the
environmental conditions on bone preservation. As these alteration mechanisms
are complex, the study of the state of preservation and of the diffusion processes
needs various complementary analytical tools that are also adequate to reveal
the particular structure and the modifications of the bone material.
Fig. 3. Correlation between FWMH of the F profile and age of the flint specimensfrom Fort Harouard site. (Reproduced by permission of P. Walter et al., Nucl.Instrum. Methods Phys. Res. B 45 (1990) 119–122.)
I. Reiche268

Chemical characterisation of F uptake in archaeological bone has already been
developed in the 19th century [1,2] and is now well established [60]. However,
relatively few studies use a combined multianalytical approach using trace el-
emental and microstructure analytical techniques (PIXE/PIGE, TEM-EDX) for
evidencing modifications on different microscopic and nanoscopic levels (Fourier
transform-infrared spectroscopy (FT-IR), X-ray diffraction (XRD), SEM, TEM) and
enabling an objective evaluation of the F uptake mechanisms [32–34,51].
Some examples of the study of F uptake in archaeological bone materials are
presented in this paragraph. These investigations are focussed on different tasks:
– F uptake in environments (lakeside/riverside sites) with constant hydrological
regime,
– F uptake depending on the conservation of the organic bone fraction,
– F uptake in burned bone,
– F uptake in bone, dentine and antler, and
– F uptake during very long-term fossilisation.
6.2.1. Study sites and material
Examples of bones, dentine and antler fragments from various archaeological
(Neolithic and Palaeolithic) and even palaeontological sites are grouped in Table
2. The chemical composition and structure of all samples were investigated. The
discussion of the results especially focuses on the F concentration profiles as a
function of the geochemistry of the site and of the state of bone material prior to
its abandon (e.g. burned bone).
Concerning the study of F uptake in bones in different environments, results
from archaeological lakeside sites dating from the Neolithic period at the lake of
Chalain (layer O, station 21, 2700–2600 BC, Jura, Eastern France) and at the
riverside site of Bercy (Paris, France, 4000 BC) are described in Ref. [17]. The
Bercy site has the specificity to provide two different hydrological zones within
one archaeological layer: an emerged zone corresponding to the ancient river-
bank (N sector) and an immersed zone of the ancient river channel (L sector).
The diagenetic pathways can thus be directly studied as a function of the hy-
drological burial conditions. The sample coming from the immersed zone of the
site of Bercy (AB3) is a good example to illustrate the influence of the preser-
vation of the organic matter on F enrichment. Differences of the F uptake phe-
nomena in burned and unburned bones can be observed on samples from the
mixed Neolithic layers HK in the lake dwellings (3030–2920 BC, station 19) sit-
uated right by the lake of Chalain that have been flooded from time to time
(CH19NB3 and CH19B3). To confirm the statements, results obtained on burned
bones from another Neolithic site of Gletterens (Gle81 6548 in Ref. [32]) located
at the lake of Neuchatel (3000 BC, Switzerland) are also shown. The F uptake in
Fluorine and Its Relevance for Archaeological Studies 269

Table 2. Types and names of bone, ivory and antler samples
Sample Provenance Sample name [32] Age
Modern sheep bone Unknown MB1 –
Modern elephant ivory Unknown MD –
Modern antler Unknown MA –
Undetermined Emerged Chalain lake site 19
(Jura, Eastern France)
CH19NB3 3030–2920 BC
Undetermined, burned bone Emerged Chalain lake site 19
(Jura, Eastern France)
CH19B3 3030–2920 BC
Ox bone Subaquatic Chalain lake site 21
(Jura, Eastern France)
CH21NB1 (AB1 in [17]) 3200 BC
Undetermined bone Subaquatic Chalain lake site 21
(Jura, Eastern France)
CH21NB2 3200 BC
Small vertebrate bone Gletterens subaquatic lake site
(Switzerland)
Gle81 6548 3000 BC
Ox bone (Bos taurus) Bercy, N sector, emerged area
(Paris, France)
BE (AB2 in [17]) 4000 BC
Aurochs bone (Bos primigenius) Bercy, L sector, immersed area
(Paris, France)
BI (AB3 in [17]) 4000 BC
Palaeolithic mammoth ivory Unknown PD 40,000 a
Palaeolithic antler Dordogne, France PA 12,000 a
Mastodon ivory (Zygolophodon
turicensis)
Rajegats
Gers, Southern France IVFO2 (FD in [17]) Middle miocene,
13–15Ma
Odontolite (heated mastodon
ivory)
Unknown O3 Unknown
I.Reiche
270

dentine and antler is illustrated, thanks to the analysis of F profiles in Palaeolithic
mammoth dentine (PD sample, 40,000 a, unknown provenance) and antler (Ma-
gdalenian period, Les Eyzies, France). Finally, long-term fossilisation processes
can be illustrated by studying palaeontological remains of mastodon dentine (FD)
found in the region of Simorre, Gers, Southern France dating from the middle
Miocene (13–16Ma). For comparison, a modern sheep bone (MB1), a fragment
of modern elephant dentine (MD) and of modern antler (MA) were analysed.
6.2.2. Average F concentrations of archaeological bones, dentine andantler
The F content of all the specimens was determined using PIGE and micro-PIGE.
All ancient specimens are enriched in F in comparison to modern bone material.
The detected concentrations vary from some hundreds of ppm in modern bone to
2.6–3.6wt.% in fossilised dentine (Table 3). The highest F content has been
found in fossilised Miocene dentine (FD), which is completely transformed into
FAP. Neolithic bones (AB2 and AB3, 4000 BC) can contain a relatively high F
amount at the border (about 1wt.%), whereas the older Palaeolithic samples (PD
and PA) only shows F traces. The mean F content is thus not directly related to
the age of the sample, but to the hydrological conditions of the corresponding site
and to the preservation of the organic fraction of the bone material.
6.2.3. Fluorine enrichment measured on individual apatite crystals byTEM-EDX
If the F concentration is high enough (41wt.%), it can be measured locally on
individual apatite crystals by TEM-EDX. This is the case for FD [32], the degraded
surface of one Neolithic bone sample (AB3), and the centre of a burned bone
from Chalain 19 (CH19B3) [32]. The other bone and dentine specimens do not
contain enough F to quantify or, as in the case of CH19NB3, CH21NB1 or AB1 in
Ref. [17], CH21NB2 and PD, to even detect the content. PIGE and micro-PIGE
are better suited for quantitative F analysis. In fossilised dentine (FD), 3.6wt.% of
F could be registered homogeneously on individual apatite crystals (Table 3).
This value is very close to that of stoichiometric fluorapatite (3.77wt.% of F).
6.2.4. Fluorine concentration profiles on cross-sections
The spatial distribution of F in bone material shows various characteristic pat-
terns. The different profiles can be divided into five groups: (i) type 1: flat profiles
with concentrations above or at the physiological level of recent bones, (ii) type 2:
U-shaped profiles with a concentration decreasing continuously from the per-
iosteum and from the endosteum, (iii) type 3: inverse U-shaped profiles, (iv) type
4: decreasing profiles where the F concentration is significantly higher at the
periosteum (outer border of the bone) than at the endosteum (inner border of long
Fluorine and Its Relevance for Archaeological Studies 271
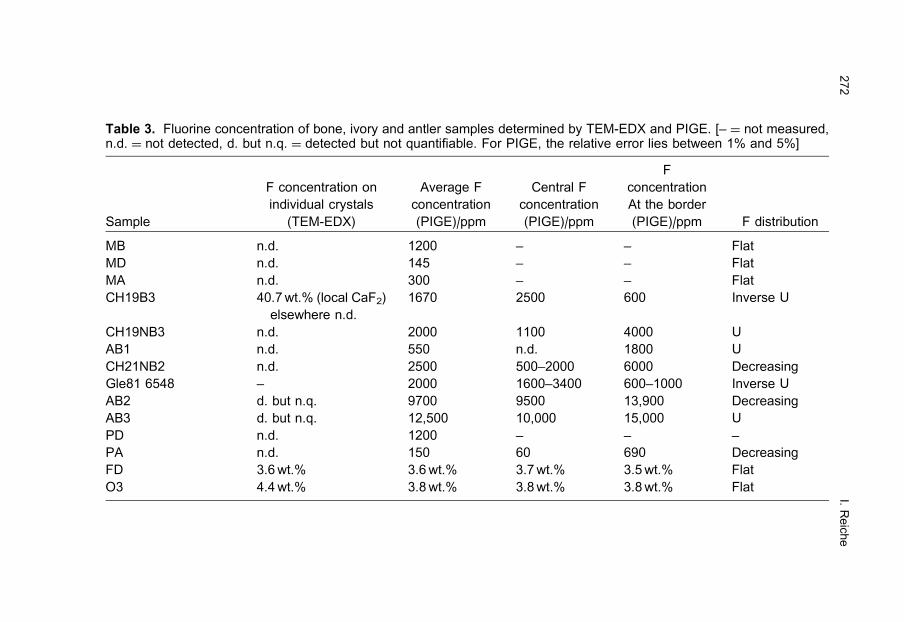
Table 3. Fluorine concentration of bone, ivory and antler samples determined by TEM-EDX and PIGE. [– ¼ not measured,n.d. ¼ not detected, d. but n.q. ¼ detected but not quantifiable. For PIGE, the relative error lies between 1% and 5%]
Sample
F concentration on
individual crystals
(TEM-EDX)
Average F
concentration
(PIGE)/ppm
Central F
concentration
(PIGE)/ppm
F
concentration
At the border
(PIGE)/ppm F distribution
MB n.d. 1200 – – Flat
MD n.d. 145 – – Flat
MA n.d. 300 – – Flat
CH19B3 40.7wt.% (local CaF2)
elsewhere n.d.
1670 2500 600 Inverse U
CH19NB3 n.d. 2000 1100 4000 U
AB1 n.d. 550 n.d. 1800 U
CH21NB2 n.d. 2500 500–2000 6000 Decreasing
Gle81 6548 – 2000 1600–3400 600–1000 Inverse U
AB2 d. but n.q. 9700 9500 13,900 Decreasing
AB3 d. but n.q. 12,500 10,000 15,000 U
PD n.d. 1200 – – –
PA n.d. 150 60 690 Decreasing
FD 3.6wt.% 3.6wt.% 3.7wt.% 3.5wt.% Flat
O3 4.4wt.% 3.8wt.% 3.8wt.% 3.8wt.% Flat
I.Reiche
272

bones, next to the medullary cavity) and the content is constantly decreasing from
the periosteum to the endosteum, and (v) type 5: irregular profiles.
Flat F profiles (type 1) were either found on extremely old samples as FD with a
homogeneous F content of 3.5wt.% next to the nominal F value of FAP (3.8wt.%),
or at trace levels on recent unaltered bone material (MB1, MA and MD). Long-term
fossilisation leads thus to a homogeneous F distribution in bone material.
Generally, the F distribution corresponds to a U-shaped profile (type 2). This
distribution was found in specimens that have experienced early diagenetic
changes. Examples are bones from the Neolithic lake sites 19 and 21 of Chalain
(for instance AB1, Fig. 4) as well as from the immersed zone of the Neolithic river
site of Bercy (AB3). In addition, the AB3 sample shows a slight loss of F in the
outer parts very close to the periosteum which can be explained by surface
erosion. When observing U-shaped profiles, F is only enriched in the bones at the
surface and the F saturation level is not reached. Especially in stable, water-
logged environments with a constant hydrological regime, transport reactions
control the F uptake and diffusive concentration profiles can be formed. A diffu-
sion coefficient in the order of magnitude of 10�12 cm2/s could be estimated from
the F concentration profile of AB3.
The measurements on AB3 are a good example of post-burial behaviour that
illustrates the influence of the remaining organic fraction on the uptake of F in
bone. An inverse correlation of N and F distribution profiles measured by means
0 21 3 4 5 6 7 8 9 10
0
200
400
600
800
1000
1200
1400
1600
1800
2000
inside(medullary cavity)
outside
conc
entr
atio
n / p
pm
distance / mm
F concentration profile in bone from constant hydrological regime
Fig. 4. U-shaped F concentration profile in a Neolithic bone AB1 from constanthydrological regime as in the subaquatic station 21 of the lake of Chalain, France.(Reproduced by permission of I. Reiche et al., J. Trace Microprobe Tech. 20 (2)(2002) 211–231.)
Fluorine and Its Relevance for Archaeological Studies 273

of an electron microprobe and PIGE was observed in this specimen. As the
organic fraction has disappeared at the border, it has no protecting effect on the
mineral phase anymore and F enrichment is favoured [51]. On the contrary, a
high amount of preserved organic matter (3.5wt.% of N corresponding to 80% of
modern bone) and a low F content have been observed in the centre of the bone
AB3. Fluorine is only present in high concentrations (about 1wt.%) at the bone
surfaces where nearly no nitrogen, i.e. collagen, is left (see N and F profiles in
Ref. [61]). The F transporting seems to be decelerated in this case.
Inverse U-shaped profiles (type 3) are only very rarely observed for exogenous
chemical species in ancient bone material. These profiles are characteristic for
elements that are present in modern bone, when they were partially leached out.
This type of F profile has been also observed in the case of burned bones (Fig. 5).
The proposed explanation of this distribution is that the heat process did not
transform homogeneously the bone structure. Higher temperatures are reached at
the sample surface compared to the bulk resulting first in the partial or complete
degradation of the organic matter, and secondly in differentiation of crystallinity at
the border and in the centre of the specimen. In addition, differential loss of
combustion products can limit the crystal growth in the inner bone parts, but the
increase in crystal size can proceed easily in the outer parts. Fluorine in the
interstitial water circulates in the porous bone material during burial and can be
mainly fixed by a reaction with small crystallites in the bone centre compared to
the larger crystals at the bone border. Small apatite crystals provide a larger
specific surface for F reaction. This statement was confirmed by TEM. It showed
0.0 0.2 0.4 0.6 0.8 1.0 1.2 1.4 1.60
500
1000
1500
2000
2500
3000
3500
4000
4500insideoutside
conc
entr
atio
n / p
pm
distance / cm
F concentration profile in burned bone
Fig. 5. Inverse enrichment F concentration profile in a Neolithic burned bone fromthe site of Gletterens, Switzerland. (Reproduced by permission of I. Reiche et al.,J. Trace Microprobe Tech. 20 (2) (2002) 211–231.)
I. Reiche274

higher crystal size and a polygonal apatite morphology at the bone surface of
burned bone that is different from the smaller crystal size with an irregular or
acicular morphology in the centre of the burned samples from Chalain 19 (Fig. 6)
[32]. In the bone surface region, the polygonal morphology corresponds to re-
crystallisation induced by a heat process [17]. In contrast, needle-shaped crystals
in the bone centre are characteristic of dissolution–recrystallisation phenomena.
That is why, such inverse U-shaped PIGE profiles correlated to the specific
Fig. 6. TEM micrographs of apatite crystals in burned bone (a) at the outsideshowing higher crystal size and a polygonal apatite morphology, (b) at the insideof the sample with smaller crystal size with an irregular or acicular morphology.Example: burned bone from HK layer, station 19 of Chalain lake. (Reproduced bypermission of I. Reiche et al., J. Trace Microprobe Tech. 20 (2) (2002) 211–231.)
Fluorine and Its Relevance for Archaeological Studies 275

shapes of apatite crystals observed by TEM could be used as an indicator of heat
transformations on ancient bone samples before burial which is crucial information
in archaeology, especially for very old sites evidencing first intentional use of fire.
Examples showing a decreasing profile (type 4) are the sample from the
emerged zone in the Neolithic riverside site of Bercy (AB2), one bone from Cha-
lain station 21 (CH21NB2) and the Palaeolithic antler [33] (Fig. 7). The F trans-
port-reaction mechanism should be the same as the one leading to the U-shaped
profile. However, either the morphology of the artefact is responsible for the
formation of this kind of profile or the cycling of the hydrological regime (suc-
cessive wet and dry periods) favours phenomena as dissolution, precipitation of
secondary minerals as well as lixiviation that can accelerate or decelerate the F
transporting and thus modify the general F U-shaped distribution.
Last but not least, irregular F concentration profiles (type 5) can be observed
indicating an inhomogeneous F distribution. Possible origins of these distribution
patterns could be the superimposition of several simultaneous phenomena as F
enrichment coupled with the loss of the apatite or the formation of secondary
phases as CaF2.
6.3. Odontolite: a turquoise bone material
A special bone material containing high amounts of F and its use as gemstone is
treated in this paragraph. In the Middle Ages, turquoise bone fragments (odon-
tolite) were used among other stones to adorn reliquary objects (Fig. 8). This gem
was not immediately recognised as being fossil bone material even if the property
of fossilised bone and ivory from Southern France to turn blue upon heating was
already known in the Middle Ages [62].
0 1000 2000 3000 4000 5000 6000 7000 8000
0.00
0.01
0.02
0.03
0.04
0.05
0.06
0.07
insideoutside
conc
entr
atio
n / p
pm
distance / µm
F concentration profile in Palaeolithic antler
Fig. 7. Decreasing F concentration profile measured on Palaeolithic antler fromNational Museum of Prehistory, Les Eyzies, Dordogne, France (unpublished data).
I. Reiche276

In 1715, the famous French naturalist Reaumur reported the existence of a
small industry in Southern France which produced turquoise from old bone re-
mains [63]. He observed that these bone artefacts could be transformed into a
turquoise-blue material by heating. He thought that the mineral turquoise, a
phosphate salt of aluminium and copper (CuAl6(OH)8(PO4)4.8H2O), was pro-
duced this way. However, his hypothesis was solely based on the resemblance
with precious turquoise. In 1823, Fischer recognised that odontolite and turquoise
mineral were different minerals [64]. Until very recently, the origin of odontolite has
remained the object of controversy. In order to shed new light on the nature of this
material, spectrochemical analyses were carried out on odontolites from different
collections of the National Museum of Natural History, the Louvre museum and
the National Museum of the Middle Ages. Furthermore, fossilised ivory fragments
Fig. 8. ‘‘Anneau de St. Denis’’, XIIIth c., France. Object of the Louvre museumcontaining as adorning stone an odontolite among other turquoises.
Fluorine and Its Relevance for Archaeological Studies 277
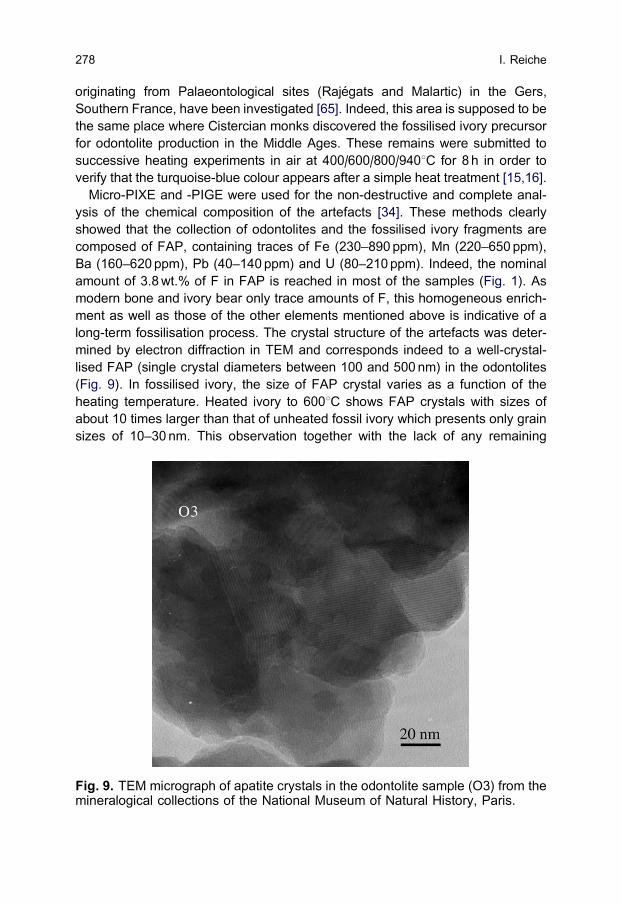
originating from Palaeontological sites (Rajegats and Malartic) in the Gers,
Southern France, have been investigated [65]. Indeed, this area is supposed to be
the same place where Cistercian monks discovered the fossilised ivory precursor
for odontolite production in the Middle Ages. These remains were submitted to
successive heating experiments in air at 400/600/800/9401C for 8 h in order to
verify that the turquoise-blue colour appears after a simple heat treatment [15,16].
Micro-PIXE and -PIGE were used for the non-destructive and complete anal-
ysis of the chemical composition of the artefacts [34]. These methods clearly
showed that the collection of odontolites and the fossilised ivory fragments are
composed of FAP, containing traces of Fe (230–890 ppm), Mn (220–650 ppm),
Ba (160–620ppm), Pb (40–140ppm) and U (80–210ppm). Indeed, the nominal
amount of 3.8wt.% of F in FAP is reached in most of the samples (Fig. 1). As
modern bone and ivory bear only trace amounts of F, this homogeneous enrich-
ment as well as those of the other elements mentioned above is indicative of a
long-term fossilisation process. The crystal structure of the artefacts was deter-
mined by electron diffraction in TEM and corresponds indeed to a well-crystal-
lised FAP (single crystal diameters between 100 and 500 nm) in the odontolites
(Fig. 9). In fossilised ivory, the size of FAP crystal varies as a function of the
heating temperature. Heated ivory to 6001C shows FAP crystals with sizes of
about 10 times larger than that of unheated fossil ivory which presents only grain
sizes of 10–30 nm. This observation together with the lack of any remaining
Fig. 9. TEM micrograph of apatite crystals in the odontolite sample (O3) from themineralogical collections of the National Museum of Natural History, Paris.
I. Reiche278
organic material is indicative for a heating process [17]. However, the elemental
and structural investigation did not provide a proof for the colour origin in the
principally FAP-containing bone remains. Therefore, other spectroscopic meth-
ods as time-resolved laser-induced luminescence spectroscopy (TR LIF) and
X-ray absorption fine structure analysis (XAFS) have to be used [15,66].
Thanks to these analytical methods, the nature of odontolite could be finally
clarified. Its formation involves two phenomena: (i) a long-term alteration (fos-
silisation) including the uptake of different ions as F and Mn followed by their
diffusion along grain boundaries, adsorption on apatite crystals and possibly their
incorporation in the apatite structure, and (ii) a deliberate heating process in air
above 6001C that oxidises Mn2+ into Mn5+ and induces simultaneously crystal
growth of apatite. Thus, odontolite is a material mainly composed of FAP that
owes its turquoise colour to an intense O2�-Mn5+ charge transfer [15]. It should
be noted that such a colouration process was also found in Mn5+-doped syn-
thetic fluorapatites [68].
7. CONCLUSIONS AND FUTURE OF FLUORINE STUDIES INARCHAEOLOGY
In this chapter, the contribution of F studies on archaeological bone materials
(bone, dentine, antler and teeth) and on chipped flints are reviewed. These
studies illustrate the information that can be deduced from F studies in ancient
material. The most well-known application of F distribution studies is the F dating
method. In a general manner, archaeologists and archaeometrists now agree that
F dating of bone and flint can only be considered under very special conditions
and when further indications permit to confirm the results obtained by F dating
studies. However, other interesting information can be obtained by the study of F
contents and profiles in archaeological objects, such as the determination of
modifications by different alteration phenomena depending on burial conditions or
heat treatments. In addition, a special turquoise bone material, odontolite, com-
posed of fluorapatite and formed by fossilisation including important F uptake and
by further deliberate heating is described and its use as a gemstone in medieval
reliquary objects is demonstrated.
In the future, detailed studies of fluorine in archaeology will help to better
assess modifications of ancient objects in soils and to develop adapted conser-
vation strategies for precious and unique archaeological materials.
ACKNOWLEDGEMENTS
H. Bocherens is thanked for providing samples from the Bercy site, P. Petrequin
for the samples from the Chalain lake sites, D. Ramseyer for the bones from the
Fluorine and Its Relevance for Archaeological Studies 279

Neolithic lakeside site Gletterens, Switzerland, C. Aballea for the Palaeolithic
antler samples from the National Museum of Prehistory in Les-Eyzies-le-Tayac,
and A. Casio from the Museum of National Antiquities, St.-Germain-en-Laye for
the Palaeolithic mammoth dentine. P.J. Chiappero, H.-J. Schubnel and P. Tassy
from the National Museum of Natural History, Paris, are acknowledged for pro-
viding odontolite and mastodon ivory samples as well as J. Durand, curator at the
Louvre Museum for placing the art and reliquary objects at our disposal.
Th. Calligaro and J. Salomon are gratefully acknowledged for their support during
experiments at AGLAE, F. Pillier for the preparation of the TEM grids and the help
during experimental and so are Y. Adda, L. Charlet, C. Chadefaux, M. Menu,
S. Merchel, C. Vignaud and L. Favre-Quattropani for fruitful discussions.
REFERENCES
[1] J. Middleton, On fluorine in bones, its source, and its application to the determinationof the geological age of fossil bones, Proc. Geol. Soc. (London) 4 (1844) 431–433.
[2] A. Carnot, Recherche sur la composition generale et la teneur en fluor des os mod-ernes et des os fossiles a differents ages, Ann. Mines 1 (1893) 155–195.
[3] R.E.M. Hedges, I.A. Law, The radiocarbon dating of bone, Appl. Geochem. 4 (1989)249.
[4] A.R. Millard, A.W.G. Pike, Uranium-series dating of the Tabun Neanderthal: a cau-tionary note, J. Hum. Evol. 36 (1999) 581–585.
[5] G.E. Coote, Ion beam analysis of fluorine: its principles and applications, NuclearInstrum. Methods Phys. Res. B 66 (1992) 191–204.
[6] M. Dobeli, A. Gaschen, U. Krahenbuhl, Fluorine analysis by ion beam techniques fordating applications, in: A. Tressaud, (Ed.), Advances in Fluorine Science: Fluorineand the Environment, Elsevier, Amsterdam, 2006.
[7] A. Haddy, A. Hanson, Research notes and application reports. Nitrogen and fluorinedating of Moundville skeletal samples, Archaeometry 24 (1) (1982) 37–44.
[8] G. E. Coote, S. Holdaway, Radial profiles of fluorine in archaeological bone and teeth:a review of recent developments, in: W. Ambrose, P. Duerden, (Eds.), Archaeometry :An Australian Perspective, Australian National University, Canberra ACT 2600, 1982,pp. 251–261.
[9] K. Johnsson, Chemical dating of bones based on diagenetic changes in bone apatite,J. Archaeol. Sci. 24 (1997) 431–437.
[10] H. Bocherens, Signatures isotopiques dans le collagene des os anciens, C. R. Soc.Biol. 191 (1997) 493–510.
[11] J.P. Baraybar, C.d.l. Rua, Reconstruction of diet with trace elements of bone at theChalcolithic site of Pico Ramos, Basque Country, Spain, J. Archaeol. Sci. 24 (1997)355–364.
[12] T. Douglas Price, R. Alexander Bentley, J. Luning, D. Gronenborn, J. Wahl, Prehis-toric human migration in the Linearbandkeramik of Central Europe, Antiquity 75 (289)(2001) 593–603.
[13] S. Blau, B.J. Kennedy, J.Y. Kim, An investigation of possible fluorosis in humandentition using synchrotron radiation, J. Archaeol. Sci. 29 (2002) 811–817.
[14] E. Schmid, Die altsteinzeitliche Elfenbeinstatuette aus der Hohle Stadel im Hohlen-stein bei Asselfingen, Alb-Donau-Kreis, Fundberichte aus Baden-Wurttemberg,Vol. 14, Stuttgart, 1989, pp. 31–96.
I. Reiche280

[15] I. Reiche, C. Vignaud, B. Champagnon, G. Panczer, C. Brouder, G. Morin, V.A. Sole,L. Charlet, M. Menu, From mastodon ivory to gemstone: the origin of turquoise colorin odontolite, Am. Mineral. 86 (2001) 1519–1524.
[16] I. Reiche, C. Vignaud, M. Menu, Heat induced transformation of fossil mastodon ivoryinto turquoise ‘‘odontolite’’. Structural and elemental characterisation, Solid State Sci.2 (2000) 625–636.
[17] I. Reiche, C. Vignaud, M. Menu, The crystallinity of ancient bone and dentine: newinsights by transmission electron microscopy, Archaeometry 44 (3) (2002) 447–459.
[18] M.C. Stiner, S.L. Kuhn, S. Weiner, Ofer Bar-Yosef differential burning, recrystallisa-tion, and fragmentation of archaeological bone, J. Archaeol. Sci. 22 (1995) 223–237.
[19] N.S. Baer, N. Indictor, J.H. Frantz, B. Appelbaum, The effect of high temperature onivory, Stud. Conserv. 16 (1971) 1–8.
[20] J.L. Bennett, Thermal alteration of buried bone, J. Archaeol. Sci. 26 (1999) 1–8.[21] R.E.M. Hedges, Bone diagenesis: an overview of processes, Archaeometry 44 (3)
(2002) 319–328.[22] M.M.E. Jans, H. Kars, C.M. Nielsen-Marsh, C.I. Smith, A.G. Nord, P. Arthur, N. Earl,
In situ preservation of archaeological bone: a histological study within a multidisci-plinary approach, Archaeometry 44 (2002) 343–352.
[23] A.M. Child, Towards the understanding of the microbial decomposition of archaeo-logical bone in the burial environment, J. Archaeol. Sci. 22 (1995) 165–174.
[24] M.J. Kohn, M.J. Schoeninger, W.W. Barker, Altered states: effects of diagenesis onfossil tooth chemistry, Geochim. Cosmochim. Acta 63 (18) (1999) 2737–2747.
[25] V. Michel, P. Ildefonse, G. Morin, Assessment of archaeological bone and dentinepreservation from Lazaret cave (Middle Pleistocene) in France, Palaeogeogr. Pal-aeoclimatol. Palaeoecol. 126 (1996) 109–119.
[26] C.M. Nielsen-March, R.E.M. Hedges, Bone porosity and the use of mercury intrusionporosimetry in bone diagenesis studies, Archaeometry 41 (1) (1999) 165–174.
[27] I. Reiche, L. Favre-Quattropani, T. Calligaro, J. Salomon, H. Bocherens, L. Charlet,M. Menu, Trace element composition of archaeological bones and post-mortem al-teration in the burial environment, Nucl. Instrum. Methods Phys. Res. B 150 (1999)656–662.
[28] C.A. Baud, Fluor et Strontium dans les os anciens, in Actes des 4eme JourneesAnthropologiques, Dossier de Documentation archeologique, 1989.
[29] N. Boscher-Barre, P. Trocellier, Nuclear microprobe study of a woman’s skeletonfrom the sixth century, Nucl. Instrum. Methods Phys. Res. B 73 (1993) 413–416.
[30] A.R. Millard, R.E.M. Hedges, Uranium uptake by buried bone, J. Archaeol. Sci. 22(1995) 239–250.
[31] L. Quattropani, L. Charlet, H. de Lumley, M. Menu, Early Palaeolithic bone diagenesisin the Arago cave at Tautavel, France, Mineral. Mag. 63 (6) (1999) 801–812.
[32] I. Reiche, C. Vignaud, L. Favre-Quattropani, M. Menu, Fluorine analysis in biogenicand geological apatite by analytical transmission electron microscopy and nuclearreaction analysis, J. Trace Microprobe Tech. 20 (2) (2002) 211–231.
[33] C. Chadefaux, C. Aballea, C. Vignaud, I. Reiche, Multianalytical study of Palaeolithicreindeer antler. Discovery of antler traces in Lascaux pigments, Archaeometry, sub-mitted.
[34] I. Reiche, C. Vignaud, T. Calligaro, J. Salomon, M. Menu, Comparative analysis ofodontolite, heated fossil ivory and blue fluorapatite by PIXE/PIGE and TEM, Nucl.Instrum. Methods Phys. Res. B 161-163 (2000) 737–742.
[35] P. Walter, M. Menu, I.C. Vickridge, Fluorine depth profiles as a relative dating methodof chipped flints, Nucl. Instrum. Methods Phys. Res. B 45 (1990) 119–122.
[36] L. Bellot-Gurlet, G. Poupeau, O. Dorighel, T.h. Calligaro, J.-C. Dran, J. Salomon, APIXE/fission-track dating approach to sourcing studies of obsidian artefacts inColombia and Ecuador, J. Archaeol. Sci. 26 (8) (1999) 855–860.
[37] G.E. Coote, N.E. Whitehead, G.J. McCallum, J. Radioanal. Chem. 12 (1972) 491.
Fluorine and Its Relevance for Archaeological Studies 281

[38] J.R. Bird, L.H. Russell, W.R. Ambrose, M.D. Scott, Obsidian characterized with el-emental analysis by proton induced g-ray emission, Anal. Chem. 50 (14) (1978)2082–2084.
[39] S. Weiner, W. Traub, Bone structure: from angstroms to microns, FASEB J. 6 (1992)879–885.
[40] X.W. Su, F.Z. Cui, Hierarchical structure of ivory: from nanometer to centimeter,Mater. Sci. Eng. C7 (1999) 19–29.
[41] G.J. Flim, Z. Kolar, J. Arends, Diffusion of fluorine ions in dental enamel at pH 7, J.Bioeng. 2 (1978) 95–102.
[42] P.M. Fischer, A.R.E. Lodding, J.G. Noren, Trace elements and dating studies of teethby secondary ion mass spectrometry (SIMS), in: Y. Maniatis, (Ed.), Archaeometry,Elsevier, Amsterdam, 1989, pp. 109–119.
[43] J. Arends, J. Schuthof, W.L. Jongeblood, Mineral properties of the outer tooth sur-face. Dental Plaque and Surface Interactons, 1979.
[44] K. Toyoda, M. Tokonami, Diffusion of rare-earth elements in fish teeth from deep-seasediments, Nature 345 (1990) 607–609.
[45] A.R. Millard, R.E.M. Hedges, A diffusion–adsorption model of uranium uptake byarchaeological bone, Geochim. Cosmochim. Acta 60 (12) (1996) 2139–2152.
[46] P. Anderson, S.E.P. Dowker, J.C. Elliott, C.R. Thomas, Synchrotron X-ray fluores-cence microprobe analysis in the study of dental mineralized tissues, J. Trace Mi-croprobe Tech. 14 (3) (1996) 541–560.
[47] C. Kottler, M. Dobeli, U. Krahenbuhl, M. Nussbaumer, Exposure age dating by flu-orine diffusion, Nucl. Instrum. Methods Phys. Res. B 188 (2002) 61–66.
[48] M.-H. Crigel, M. Balligand, E. Heinen, Les bois de cerf: revue de litterature sci-entifique, Ann. Med. Vet. 145 (2001) 25–38.
[49] B. Pozzi, Etude comparative entre differents traitements appliques a la conservationdes bois de cerfs gorges d’eau en vue d’un sechage, Haute ecole d’arts appliques ducanton de Neuchatel, 2002, p. 123.
[50] P. Walter, thesis: Etude du comportement du fluor lors des interactions silice-solu-tions aqueuses-applications archeologiques, in Geochimie, Universite Paul Sabatier,Toulouse, 1993, p. 219.
[51] I. Reiche, L. Favre-Quattropani, C. Vignaud, H. Bocherens, L. Charlet, M. Menu,Multi-analytical approach to bone diagenesis: example of the French Neolithic site ofBercy (Paris), Meas. Sci. Tech. 14 (2003) 1608–1609.
[52] T. Molleson, in: G. Grupe, B. Herrmann, (Eds.), Trace Elements in EnvironmentalHistory, Springer, Berlin, 1989, pp. 67–82.
[53] M. Regert, M.-F. Guerra, I. Reiche, Physico-chimie des materiaux du patrimoineculturel: objectifs, principes, methodes et exemples d’application, Techniques del’ingenieur Part 1: P3780 (2006) 1–35; Part 2: P3781 (2006) 1–20.
[54] T. Calligaro, J.-C. Dran, B. Moignard, L. Pichon, J. Salomon, P. Walter, Ion beamanalysis with external beams: recent set-up improvements, Nucl. Instrum. MethodsPhys. Res. B 188 (2002) 135–140.
[55] J.C. Stormer Jr., M.L. Pierson, R.C. Tacker, Variation of F and Cl X-ray intensity dueto anisotropic diffusion in apatite during electron microprobe analysis, Am. Mineral. 78(1993) 641–648.
[56] M. Dowsett, A. Adriaens, The role of SIMS in cultural heritage studies, Nucl. Instrum.Methods Phys. Res. B 226 (2004) 38–52.
[57] L.G. Petersson, G. Frostell, A. Lodding, Secondary ion microanalysis of fluorine inapatines of biological interest, Zeit. Naturforsch. 29c (1974) 417–420.
[58] P.W.O. Hoskin, SIMS determination of mgg�1-level fluorine in geological samples andits concentration in NIST SRM 610, Geostandards Newslett. 23 (1) (1999) 69–76.
[59] M.R. Schurr, Fluoride dating of prehistoric bones by ion selective electrode, J. Arch-aeol. Sci. 16 (1989) 265–270.
I. Reiche282

[60] G.E. Coote, I.C. Vickridge, Application of a nuclear microprobe to the study of cal-cified tissues, Nucl. Instrum. Methods Phys. Res. B 30 (1988) 393–397.
[61] I. Reiche, C. Vignaud, L. Favre-Quattropani, L. Charlet, M. Menu, Diffusion in ar-chaeological bone, Defect Diffus. Forum 194–199 (2001) 953–960.
[62] G. Astre, Mastodontes a Gimont (Turquoise de Planselve) et a Bedechan, Bull. Soc.Histoire naturelle de Toulouse 84 (1949) 147–150.
[63] R.A. Ferchault, d. Reaumur, Observations sur les Mines de Turquoises du Royaume;sur la nature de la Matiere qu’on y trouve; et sur la maniere dont on lui donne lacouleur, Memoires de l’ Academie Royale des Sciences, Academie Royale des Sci-ences, Paris, 1715, pp. 174–202.
[64] G.M. Fischer, Essai sur les turquoises, Ann. Mines VIII (1823) 326–327.[65] L. Ginsburg, P. Tassy, Les fouilles paleontologiques dans la region de Simorre, Bull.
Soc. Arch. Du Gers, Auch 4eme trimestre (1977) 443–466.[66] I. Reiche, G. Morin, C. Brouder, A. Sole, P.E. Petit, C. Vignaud, T. Calligaro,
M. Menu, Manganese accommodation in fossilised mastodon ivory and heat-inducedcolour transformation: evidence by EXAFS, Eur. J. Mineral. 14 (2002) 1069–1073.
[67] G.R. Summerhayes, J.R. Bird, R. Fullagar, C. Gosden, J. Pecht, R. Torrence, Ap-plication of PIXE-PIGME to archaeological analysis of changing patterns of obsidianuses, in M.S. Shackley (Ed.), Archaeological Obsidian Studies, Plenum Press, WestNew Britain, Papua, New Guinea, Chapter 6, 1998, pp. 129–158.
[68] K. Dardenne, D. Vivien, D. Huguenin, Color of Mn(V)-substituted apatitesA10(B,Mn)O4)6F2, J. Solid State Chem. 146 (1999) 464–472.
Fluorine and Its Relevance for Archaeological Studies 283

This page intentionally left blank
284

SUBJECT INDEX
Activated alumina, 60
Adsorption, 1–2, 4, 7–14, 16–33, 36–44,
60–61
Agrochemicals, 121–125, 135–136,
140, 145, 147–149, 157–159, 163,
166–167
Anthropogenic fluorine, 190
Apatite, 287
Archaeology, 241–248, 254–255, 262,
267, 274, 276, 279
Biological activity, 121–123, 128, 136, 141,
144–145, 154–155, 157–158, 162–163,
167
Biomineralization, 241
Blowing agent, 213
Bone, 223–224, 227–228, 230–235,
237–239, 241–247
Bone char, 2, 8, 10, 15–17, 30, 39–41, 43,
45
Bone material, 253–260, 264, 266,
268–269, 271, 273–274, 276, 279
Calixpyrroles, 85–86, 114, 116
CFCs, HFCs, HCFCs, 188–190, 203–204,
212, 214, 222
Clay, 2, 18–19, 22, 24, 40, 53–55
Clean chemistry, 183
Coagulation/precipitation, 2–3, 62
Complexation, 99
Concentration profiles, 254, 264, 269, 271,
273, 276
Conductometry, 95
Copper fluoride, 217
Dating, 227, 230, 232–233, 237, 239–241,
244, 246
Defluoridation, 1–2, 4, 7, 10, 15–21, 26,
30, 37–45, 53, 78
Diagenesis, 231, 233, 235, 239,
241–242, 244–247, 254–255,
266, 268
Diffusion, 225–233, 235, 237–246, 257,
259–261, 266,
268, 273, 279
Drinking water, 2–6, 8–10, 13, 15–16,
18–20, 26, 30, 39–45, 50–51, 53–56,
58–60, 70, 75
Drinking water defluoridation, 75
Electrodialysis, 2, 4, 6, 45, 62
Enzyme, 126
Exposure age, 226, 229, 240
F, 253–258, 260–269, 271–274, 276,
278–280
Flint, 253–255, 257, 259–261, 264,
266–268, 272, 279
Fluoride contamination, 86–87
Fluoride industry, 186
Fluoride Removal, 1, 5–6, 8, 10–11, 13,
16, 20, 23–25, 31–33, 36–38, 41, 53, 58,
78, 116
Fluorine, 1, 53, 84, 121–125, 131–132,
144, 147, 150, 154–155, 157, 159–160,
166–167, 177–181, 183–187, 189–190,
193–195, 197–199, 215–218, 220,
222–235, 237–246, 265
Fluoroaliphatics, 212
Fluoroaromatics, 177, 185, 194–196,
200–202, 213
Fluorobenzene, 211–213, 220–221
Fluorochemicals, 126, 177–178, 184, 197,
199
Fluorophosphates, 184
Fluorosphere, 184
Fluorosis, 2–3, 15, 38, 40, 49, 51–55
Fluorous separation, 177, 183, 187
Fungicide, 121–123, 131–133, 139–140,
142–143, 147–149, 155–156, 164–166
285

Geochemistry, 269
Global Warming Potential, 189
Green chemistry, 177, 183, 193, 204
Groundwaters, 8, 15–16
Heat treatment, 257, 266, 278–279
Herbicide, 121–123, 125–129, 135–138,
141, 143–146, 149–153, 157–161
Insecticide, 121–124, 129, 131, 138–139,
141–142, 144–145, 147, 149, 153–154,
156–157, 161–164
Ion exchange, 1, 4, 6–9, 11, 15, 17, 24–26,
32, 45
Lipophilicity, 127
Membranes, 4, 6, 62
Metal fluorides, 203, 207–208
Meteorites, 225, 227–230, 232, 246
Microreactor technology, 177, 193
Nanofiltration, 50, 53, 60, 76, 78
NMR, 92
Nuclear reaction analysis, 225–227,
247
Obsidian, 269
Odontolite, 254, 265, 270,
276–280, 288
Oxyfluorination, 203, 207–209,
211
Perfluorooctylsulfonate, 190–191
Perfluorinated solvents, 194
Pesticides, 126
PIGE, 224, 226, 234–235, 237, 247
Piltdown man, 242
Plant growth regulator, 121, 123, 133–134,
142–143
Refrigerants, 213
Relative dating, 254–255, 257, 261
Reverse osmosis, 2, 5, 45, 50–51, 60, 63,
76
Sensor, 117
Silver fluoride, 217–218
Supercritical, 177, 182, 191–192, 197
Supramolecular chemistry, 88–89
Thermodynamics, 81, 86, 95, 103,
109–110, 112, 115–116
Trifluoromethyl, 121, 123–128, 131–137,
139–140, 142, 156–158, 162, 166
Tooth, 253–256, 271, 273
Turquoise, 288
Uptake, 254–255, 257, 260–261, 266, 269,
273, 279
Water Defluoridation, 1–2, 53, 75
WHO, 3, 6, 9, 13, 16, 33, 43
Zeolite, 1–2, 4, 12, 24–33, 36, 44
Subject Index286