Fluoride Archives 1968-1998 · 11 Mullenix PJ, DenBesten PK, Schunior A, Keman WJ. Neurotodcity of...
79
Volume 29 Number 4 Pages 187-260 November 1996 FLUORIDE JOURNAL of the International Society for FI uoride Research
Transcript of Fluoride Archives 1968-1998 · 11 Mullenix PJ, DenBesten PK, Schunior A, Keman WJ. Neurotodcity of...

Volume 29 Number 4 Pages 187-260 November 1996
FLUORIDE JOURNAL
of the
International
Society for
FI uoride
Research

THE INTERNATIONAL SOCIETY FOR FLUORIDE RESEARCH
President Dr Miklos Bely National lnstlute of Rheumatology Budapest, Hungary
Secretary Prof Gene W Miller Biology Department Utah State University Logan UT 84322-5305, USA
Vice President Prof N B K Yoshitake Shiga Universrty of Medical Science Shiga-Ken, Japan
Treasurer Dr John Colquhoun 81A Landscape Road Mt Eden, Auckland 4 New Zealand
Dr D J Ballentyne University of Victoria Victoria BC, Canada
Prof Shouren Cao Chinese Academy of Preventive Medicine
Beijing, China
Dr John A Cooke Universrty of Natal Durban, South Africa
Dr G Embery University of Wales Medical College Cardiff, Wales UK
Prof G Neil Jenkins Newcastle upon Tyne England
Prof Jerzy Krechniak Medical university Gdansk, Poland
Dr John R Lee 9620 Bodega Hwy, Sebastopol CA, USA
Prof G W Miller Utah State University Logan, Utah USA
Dr B P Rajan Madras Dental College Madras, India
Prof A K Susheela All India Inst. of Medical Sciences New Delhi, India
Prof Zan-Dao Wei Guiyang Medical College Guizhou, China
Prof N B K Yoshitake Shiga University of Medical Science Shiga-Ken, Japan
EDITORIAL BOARD
Dr Miklos Bdly National Institute of Rheumatology Budapest, Hungary
Dr M Chikuma Osaka University of Pharmaceutical Sciences
Osaka, Japan
Dr Edward Czerwinski Kracow Academy of Medicine Kracow, Poland
Dr Richard G Foulkes Abbotsford BC Canada
Dr Y Kaneko Showa University School of Dentistry Tokyo, Japan
Dr K A V R Krishnamachari Andhra Pradesh Projects Office Hyderabad, India
Prof C James Lovelace Humbolt State University Arcata, California USA
Prof F Murray Murdoch University Murdoch WA, Australia
Dr Bruce Spittle University of Otago School of Medicine Dunedin, New Zealand
Prof S P S Teotia LLRM Medical College Meerut, India
Dr Sally W Wheeler Hawkesbury Agricultural Research Unit Richmond NSW, Australia
Prof Ming-Ho Yu Western Washington University Bellingharn, WA USA
Prof A W Burgstahler University of Kansas Lawrence KS, USA
Dr John Colquhoun Education Department University of Auckland
Auckland, New Zealand
Dr Mark Diesendorf Australian National University Canberra, Australia
Prof J Franke Medical Academy Erfut, Germany
Dr K Kono Osaka Medical College Osaka, Japan
Prof Lennart Krook Cornell Universrty lthaca NY, USA
Dr Zygmunt Machoy Pomeranian Medical Academy Szczecin, Poland
Dr James C Pushnik California State University Chico, California USA
Dr Jorg Spitz Dept. of Nuclear Medicine Wiesbaden, Germany
Prof H Tsunoda l a t e Medical University Morioka, Japan
Prof Y Yoshida Osaka Medical College Osaka, Japan

Vol. 29 No. 4 November 1996 Pages 187 - 260
FLUORIDE QUARTERLY JOURNAL OF
THE INTERNATIONAL SOCIETY FOR FLUORIDE RESEARCH Editor: Dr John Colquhoun
Co-Editors: Prof A W Burgstahler Prof G W Miller Dr Bruce Spittle
Auckland, New Zealand Lawrence, Kansas, USA Logan, Utah, USA Dunedin, New Zealand
CONTENTS
EDITORIALS A GROWING CONCERN ABOUT SAFETY Bruce Spittle ............................. 187-188 GUEST EDITORIAL: OPTIMAL INTAKE G Neil Jenkins ....................................... 189 NOTES FROM THE EDITOR / XXlst CONFERENCE .......................................... 189
RESEARCH REPORTS EFFECT OF A HIGH FLUORIDE WATER SUPPLY ON CHILDREN'S INTELLIGENCE
EFFECT OF PARBOILING ON FLUORIDE CONTENT OF RICE L B Zhao, G H Liang, D N Zhang and X R Wu, China ................................... 190-192
A Anasuya and P K Parajape, India ............................................................... 193-201
G X Teng, X H Zhao, Y F Shi, G Q Yu, L H Wang, Y F Shen and Y F Sun, China ...................................................... 202-206
Y Zhang and S R Cao, China ........................................................................ 207-211
A STUDY OF WATER-BORN ENDEMIC FLUOROSIS IN CHINA
COAL-BURNING INDUCED ENDEMIC FLUOROSIS IN CHINA
ASSESSMENT OF FLUORIDE REMOVAL FROM DRINKING WATER BY CALCIUM PHOSPHATE SYSTEMS
G L He and S R Cao, China ........................................................................... 212-216 AMELIORATIVE ROLE OF AMINOACIDS ON FLUORIDE-INDUCED ALTERATIONS IN UTERINE CARBOHYDRATE METABOLISM IN MICE
REVIEWS OUR STOLEN FUTURE by The0 Colbum, Dianne Dumanoski and John Peterson Myers
THE FLUORIDE CONNECTION
FLUORIDE EXPOSURE AND CHILDHOOD OSTEOSARCOMA Report in American Journal of Public Health December 1995
METHODS OF MONITORING SMELTER EMISSIONS
continued next page
N J Chinoy and D Patel, India ........................................................................ 217-226
Reviewed by Richard G Foulkes .................................................................... 227-229
Richard G Foulkes ......................................................................................... 230-236
Reviewed by John R Lee ............................................................................... 237-240
H Bunce, Canada .......................................................................................... 241-251

C 0 NTE NTS continued
ABSTRACTS FLUORIDE WPOSURE AND CHILDHOOD OSTEOSARCOMA - A CASE-CONTROL STUDY
K H Gelberg, E F Fitzgerald, S A Hwang and R Dubrow, USA ............................. 252 WATER FLUORIDATION, BONE DENSITY AND HIP FRACTURES: A REVIEW OF RECENT LITERATURE [Review]
PAlTERNS OF FRACTURE AMONG THE UNITED STATES ELDERLY: GEOGRAPHIC AND FLUORIDE EFFECTS
CIRCULATING TESTOSTERONE LEVELS IN SKELETAL FLUOROSIS PATIENTS
FLUORIDE ION TOXICITY IN HUMAN KIDNEY COLLECTING DUCT CELLS
EXPOSURE TO PARTICULATES AND FLUORIDES AND RESPIRATORY HEALTH OF WORKERS IN AN ALUMINUM PRODUCTION POTROOM WITH LIMITED CONTROL MEASURES
THE RISK OF FLUOROSIS IN STUDENTS EXPOSED TO A HIGHER THAN OPTIMAL CONCENTRATION OF FLUORIDE IN WELL WATER
J Raheb, Australia .......................................................................................... 252-253
M R Karagas, J A Baron, J A Barrett and S J Jacobsen, USA .............................. 253
A K Susheela and P Jethanandani, India .............................................................. 254
M L Cittanova. B Lelongt, M C Verpont et a / , France .................................... 254-255
F Akbarkhanzadeh, USA ....................................................................................... 255
A I lsmail and J G Messer, Canada ....................................................................... 256
CALL FOR PAPERS 2nd INTERNATIONAL WORKSHOP ON FLUOROSIS AND DEFLUORIDATION OF WATER
Addis Ababa, Ethiopia, November 19-22, 1997 .................................................... 256
AUTHOR INDEX 1996 ..................................................................................... 257-258 SUBJECT INDEX 1996 .................................................................................... 259-260
NEWS ITEM (below) Proceedings of the 1st International Workshop on Fluorosis and Defluoridation of Water, Tanzania, October 18-22 1995, has been published this year by the International Society for Fluoride Research. Nuoride subscribers who wish to receive a copy should add US$lO to their 1997 subscription, which remains the same as last year (see inside back cover).

tditonal ~ t l / Fluoride Vol. 29 No. 4 1996
A GROWING CONCERN ABOUT SAFETY On 14 October 1995, 21,964 residents of the Timaru District, New Zealand,
voted on whether the local water supplies should be fluoridated.’ The Southern Regional Health Authority provided $42,000 towards providing education on the value of fluoridation and the public meetings which were held were addressed by persons who had studied the subject in some depth, including the Deputy Director General of Public Health for New Zealand.2 Considerable correspondence was published in the local newspaper. The outcome was an “overwhelming ” 67% vote against fluoridation.’ Although it has previously been noted that referenda to initi- ate or retain fluoridation have been defeated more often than they have been won,” the result appears to reflect, at some level, a growing concern about the safety of fluoridation.
It might be considered that opposition to water fluoridation “defies rational understanding” because it is known to be “a safe and the most cost-effective form of preventive denti~try“.~ However, voters appear to becoming less accepting of reassurances about safety. Although the case might be made that “at one part per million dental fluorosis brings about the most beautiful looking teeth that anyone ever hadn5 or that mild forms of dental fluorosis can make the teeth appear “more attractive”,” deeper concern has accompanied questions about hip fractures and the bone cancer osteosarcoma in young men.B The suspicion appears to be arising that the underlying mechanism, such as enzyme inhibi t i~n,~ whereby these relatively visible adverse effects may be produced, may also be acting to produce other effects that are less visible but equally serious.
Thus the findings that fluoride toxicity decreased fertility in most animal species studied, and that in humans there was a decreasing total fertility rate with increasing fluoride levels lo have added to the concerns about safety. Attention has also been drawn to the potential for neurotoxicity with the report of behavioral changes in rats after the ingestion of fluoride,l l individual case reports of cognitive impairment with fluoride toxicity: and population studies suggesting that children with dental fluorosis may have a decreased mental acu i ty . l*~~~ Possible mechanisms have been identified whereby fluoride could affect brain function including influ- encing calcium currents, altering enzyme configuration by forming strong hydrogen bonds with amide groups, inhibiting cortical adenyl cyclase activity and increasing phosphoinositide hydrolyskQ Each of these areas of enquiry is in its infancy. Debate is only just beginning to emerge on details such as the date of appearance of rat hippocampal pyramidal c e l l ~ . ~ ~ ~ 1 5
Historically there has been a delay, often of several decades, between the recognition of the adverse effects of a substance, such as asbestos, and the reduc- tion of exposure to it in the environment. The concern is emerging that as increased knowledge is obtained about the more subtle effects of fluoride, it will be seen in a less favourable light than it is viewed in today. In his review and article on Our Stolen Future: Are we threatening our fertility, intelligence, and survival? A scientific detective story, by T Colborn, D Dumanoski, and J P Myers, Richard Foulkes draws attention to the view that not only hormone-disrupting chemicals, such as diethylstilbestrol, but also other substances, such as fluoride,

188 Editorial Fluoride 29 (4)
may be stealing our future as humans by lowering fertility and causing brain dysf~nction.l6.~7 He sees a need for clear, immediate and inclusive action on all the substances involved. This might involve an immediate ban on water fluori- dation and fluoride dental products. This viewpoint may not be shared by all. At least, however, it is clear that an alternative view, that after 50 years of water fluoridation it has been found to be “close to ideal public health action: vastly improving the health and quality of life for millions without their conscious effort and at a low cost, both monetary and social”,1a is not universally accepted.
Thus as the focus of the debate on the safety issues associated with fluoride continues to widen from the clearly visible effects originally studied, such as dental and skeletal fluorosis,19 to the occurrence in populations of hip fractures and bone tumours and the less visible areas of fertility and brain dysfunction, a growing concern with safety is beginning to emerge. Resolution of these matters will require both scientific objectivity and political courage.
Bruce Spittle
1 Alexander M. Big vote against fluoridation: “the people have spoken very clearly”. The Timaru Herald October 16 1995 p 1.
2 Alexander M. Lively fluoride meeting. The Timaru Herald September 27 1995 p 2. 3 Easley M W . The new antifluoridationists: who are they and how do they operate?
Journal of Public Health Dentistry 45 133-141 1985. 4 Grace M. A feeling of guilt [editorial]. British Dental Journal I79 43 1995. 5 Bull FA. Promotion and application of water fluoridation. Proceedings: fourth annual
cotljerence of State Dental Directors with The Public Health Service and The Children ‘s Bureau. US Public Health Service, Washington, D.C. 195 1 pp 9-22.
6 Ripa LW. A half-century of community water fluoridation in the United States: review and commentary. Journal of Public Health Dentistry 53 17-44 1993.
7 Lee JR. Fluoridation and hip fracture: according to the National Research Council Report: Health Effects of Ingested Fluoride. Fluoride 26 (4) 274-277 1993.
8 Yiamouyiannis JA. Fluoridation and cancer: the biology and epidemiology of bone and oral cancer related to fluoridation. Fluoride 26 (2) 83-96 1993.
9 Spittle BJ. Psychopharmacology of fluoride: a review. International Clinical Psycho- pharmacology 9 79-82 1994.
10 Freni SC. Exposure to high fluoride concentrations in drinking water is associated with decreased birth rates. Journal of Toxicology and Environmental Health 42
11 Mullenix PJ, DenBesten PK, Schunior A, Keman WJ. Neurotodcity of sodium fluoride in rats. Neurotoxicology and Teratology 17 169-177 1995.
12 Li XS, Zhi JL, Gao RO. Effect of fluoride exposure on intelligence in children. Fluoride 28 (4) 189-192 1995.
13 Zhao LB, Liang GH, Zhang DN, Wu X R . Effect of a high fluoride water supply on children’s intelligence. Fluoride 29 (4) 190-192 1996.
14 Ross JF, Daston GP. To the editor [letter]. Neurotoxicology and Teratology 17
15 Mullenix PJ, DenBesten PK, Schunior A, Keman WJ. Reply [letter]. Neurotoxico- logy and Teratology 17 687-688 1995.
16 Foulkes RG. Book review. Fluoride 29 (4) 227-229 1996. 17 Foulkes RG. The fluoride connection. Fluoride 29 (4) 230-236 1996. 18 Burt BA. Fifty years of water fluoridation. British Dental Jounial I79 49-50 1995. 19 Diesendorf M. How science can illuminate ethical debates: a case study on water
fluoridation. Flrcoride 28 87-104 1995.
References
109-121 1994.
685-686 1995.

November 1996 buesr mnonai IOY
A different view: OPTIMAL INTAKE
G Neil Jenkins Newcastle upon Tyne, England
In response to the Editor's invitation (Fluoride 29 page 130 August 1996) to discuss the continuing use of the term "optimal intake of fluoride" I offer the following comments.
While agreeing that the effects of fluoride on dental caries are mostly topical we cannot dismiss altogether the small systemic effects on the morphology of teeth and on the fluoride concentrations of teeth, saliva and gingival fluid. It is often said, rightly, that caries is a multi-factorial disease and I would add that fluoride provides a multi-factorial way of reducing it. Fluoride toothpastes are now the main source of fluoride in many countries and their effect is mainly local, especially in adults who normally spit out the toothpastes and may follow by rinsing the mouth with water (thereby reducing the effect of the fluoride - see Chesters et ul, Curies Research 26 299 1992). Drinks and even some fluoride- containing foods may have both topical effects (while eating and from residues left adhering to the teeth) and systemic effects (after swallowing).
I agree that "optimal intake" should refer only to systemic effects and this is not calculable being an unknown proportion of the total effects.
I agree with the guest editorial (Foulkes, Fluoride 29 129 1996) that the term "nutrient" is inappropriate for fluoride whose essentiality though sometimes suggested (Messer et d, Science 177 893 1972), has never been established. How- ever, I must contest the description of fluoride in food by the derogatory word "contaminant". Foods contain many substances that, like fluoride, seem not to be essential for life but which make useful contributions to health. Examples are the fibres of vegetables and the innumerable substances that give foods their flavours. The value of dietary fibre is well known and the flavours, by stimulating appetite and making eating pleasurable, contribute both to nutrient intake and general well-being.
I would suggest describing these many substances as "inessential food constitu- ents with beneficial effects".
8 Jesmond Dene Terrace Newcastle upon Tyne
NE2 2ET England
NOTES FROM THE EDITOR We are grateful to Professor Jenkins, a long-serving member of our Editorial
Board and of our Society, for contributing to the above discussion. Readers are invited to submit letters to the editor, commenting on the varying views expressed in the above and earlier editorials.
Our XXlst Conference, held August 2528 in Budapest, Hungary, was another memorable occasion in the history of our Society, and we are all grateful to our new President, Dr Mikl6s Bely, who organized it. It was decided to hold future conferences in Bellingham WA, USA, in 1998 and in Szuecin, Poland, in 2000. Further reports will appear in our next (February 1997) issue.
JC

190 Research Report Fluoride Vol. 29 No. 4 190-192
EFFECT OF A HIGH FLUORIDE WATER SUPPLY ON CHILDREN’S INTELLIGENCE
L B Zhao,a G H Liang,a D N Zhangb and X R Wu Lu-Liang, Shanxi, China
SUMMARY: In Shanxi Province, China, children living in the endemic fluoride village of Sima (water supply F = 4.1 2 mglL) located near Xiaoyi City had average IQ (97.69) significantly lower (p < 0.02) than children living to the north in the nonendemic village of Xinghua (F = 0.91 m&; average IQ = 105.21). These differences were not associated with gender, but the IQ scores were directly related to educational level of the parents. Key words: Intelligence; IQ; Parents’ education; Shanxi; Sima; Water fluoride; Xinghua.
Introduction It has been reported that fluoride can penetrate the fetal blood-brain barrier
and accumulate in cerebral tissue before birth,’ thereby apparently affecting children’s intelligence.2 In the present study, conducted in April 1993, this hypo- thesis was further investigated by comparing the performance on IQ tests adminis- tered to 320 randomly selected children, age 7 to 14, residing in central Shanxi Province, China, in two suburban villages with significantly different fluoride content in the drinking water.
Materials and Methods The two sites in Shanxi Province selected for study were Sima Village located
5 km northeast of Xiaoyi City and Xinghua Village situated 13 km northeast of Fenyang City which, in turn, is about 15 h north of Xiaoyi City. In Sima the average fluoride content of the drinking water is 4.12 mg/L, 86% of the population have clearly evident dental fluorosis, and 9% have clinically diagnosed skeletal fluorosis. In Xinghua the fluoride content of the drinking water is 0.91 mg/L, the dental fluorosis rate is 14%, and the bone fluorosis rate is 0%. The occupations, living standards, and social customs of the residents in the two villages are similar. Only children whose mothers lived in the survey location while pregnant were included for testing. A total of 160 children, age 7 to 14, half male and half female, were randomly selected from each village. Official intelligence quotient (IQ) tests lasting 40 minutes3 were taken by each child in groups of 20. Besides this common parameter, the educational level of the parents of each child was also recorded.
Results and Analysis 1 Average IQ of children in each village
In Sima, where the children were exposed to higher water-borne fluoride in embryo, the average IQ was 97.69, and in the lower fluoride village of Xinghua it was 105.21. This difference is statistically significant (p<O.Ol), but there was no significant difference between male and female IQ in the two areas. The details are recorded in Table 1.
a Lu-Liang Public Health Bureau, Shanxi 033000, China. Lu-Liang Epidemic Station.

November 1996 Effect of high F- water supply on children's intelligence 191
TABLE 1. IQ findings for children In Sima and Xinghua
IQ X*SD ("1 (rmle) male female mean
- Village Number
Sima 160 60-1 33 98.11 f13.21 97.32f12.93 97.69f13.00 Xinghua 160 69-141 105.81 f15.04 104.98f14.96 105.21 f14.99
2 As shown in Table 2, mast children in both Sima and Xinghua had IQ scores in
the normal range of 90-109 or above. At the low end, however, 6 children (3.75% of the total) in Sima had scores of 69 or below (low intelligence), whereas only one child (0.62%) in Xinghua was in this category. On the other hand, the number of children with IQ scores of 120 or higher (superior intelligence) was 27 (17%) in Xinghua but was only 20 (12%) in Sima.
Frequency distribution of lQ in each village
TABLE 2. IQ distribution of children in Sima and Xinghua
IQ Sima Xinghua male female total (%) male female total (%)
130 or higher 1 2 3 (1.88) 4 3 7 (4.38) 120-129 9 8 17 (10.62) 9 11 20 (12.50) 110-119 11 14 25 (15.62) 22 21 43 (26.88) 90-1 09 36 33 69 (43.12) 31 27 58 (36.25) 80- 89 10 11 21 (13.13) 10 13 23 (14.37) 70- 79 10 9 19 (11.88) 4 4 8 (5.00) 69 or lower 3 3 6 (3.75) 0 1 1 (0.62)
Total 80 80 160 (100) 80 80 160 (100)
3 As shown in Table 3, the average IQ of the children in each age group, 7 through
14 years, was lower in Sima than Xinghua. Although IQ increased with age, it did not go as high in Sima as in Xinghua.
Comparison of children's lQ by age in each village
Age 7 8 9
10 11 12 13 14
TABLE 3. Average IQ by age in Sima and Xinghua Sima Xinghua
89.47 f 10.62 90.92 f 12.04 92.34 f 13.17 98.28 f 12.46
100.08 f 1 1.77 100.99 f 12.31 103.36 f 11.82 105.83 f 10.98
95.26 f 12.31 100.47 f 15.01 102.90 f 12.34 104.34 f 14.18 105.99 f 13.97 108.03 f 14.22 111.19 f 13.36 113.28 f 10.44

192 Zhao et a/ Fluoride 29 (4) November 1996
4. Correlation between IQ of children and educational level of parents For this comparison, the children were divided into three groups according to
the educational level of their parents: primary school only, junior high school, and senior high school and above (Table 4). The results show that the IQ scores of the children are closely related to the educational level of their parents, irrespective of which village they lived in. Children of parents with higher education showed a statistically significant higher IQ than the other children (p < 0.01).
TABLE 4. Educational level of parents and children’s IQ Parents education Sima Xinghua
number I Q number IQ Primary school and below 23 89.97 f 11.42 27 92.43 f 10.89 Junior high school 99 98.11 f 9.63 87 104.37 f 11.44 Senior high school and above 38 105.93 f 10.54 46 110.32 f 10.02
Discussion The results of this study indicate that intake of high-fluoride drinking water
from before birth has a significant deleterious influence on children’s IQ in one of two similar villages. No real differences were found for gender. In the high- fluoride village of Sima the number of children with IQ of 69 or below was six times that in the healthier low-fluoride village of Xinghua. There were also fewer children (20) in Sima with superior IQ scores of 120 or higher than the number (27) in Xinghua. Moreover, the fact that the IQ scores increased more slowly with age in Sima than in Xinghua supports the view that exposure to high levels of fluoride in utero exerts a cumulative adverse effect that is not overcome with increasing age in a high-fluoride community.
As expected, and also found here, the educational level of the parents has a significant positive influence on the children’s IQ. However, other factors that might affect children’s IQ need to be considered as well, and further studies are therefore needed both to confirm the present findings and to elucidate the mechanism of fluoride involvement.
References 1 He H, Chen ZS, Liu XM. The effects of fluoride on the human embryo. Chinese
2 Cheng YX. IQ of children in areas of high fluorine content. Chinese Journal of
3 Wang Dong. Rui Fen Test Manual (Rural Edition). Tian-Jin Medical College 1989
Journal of Control of Endemic Diseases 4 ( 3 ) 136 -137 1989 [In Chinese].
Control of Endemic Diseases. Supplement 1991 [In Chinese].
[In Chinese].
Published by the International Society for Fluoride Research Editorial Office: 81A Landscape Road, Mount Eden, Auckland 4, New Zealand

Fluoride Vol. 29 No. 4 193-201 1996 Research Report 193
EFFECT OF PARBOILING ON FLUORIDE CONTENT OF RICE A Anasuya and P K Paranjape
Hyderabad, India SUMMARY: In several endemic fluorotic zones of rural India, home-made par- boiled rice is the main staple. Studies were therefore conducted to investigate whether any relationship exists between the concentration of fluoride in the water used for parboiling paddy, and in the parboiled rice.
Parboiled rice (PBR) was prepared in the laboratory using water from different origins (rivers, open wells, tube wells and ponds) collected from normal and fluorosis affected regions. The effect of (a) parboiling, (b) polishing, and (c) cooking, on the fluoride (F-) content of rice was studied, using two local varieties of paddy, namely, HANSA and SONA. Fluoride levels of PBR and raw rice collected from the local markets of Hyderabad city were also measured.
Results show that: 1) parboiling paddy using water containing fluoride - either added or present originally - resulted in a significant increase in the F- content of rice, irrespective of the source of water used; 2) this increase was directly proportional to the levels of F- in water (r = 0.96); 3) polishing PBR to 5% level reduced the F- content of rice by about 30%; 4) on cooking the PBR in the same source of water which was used for the parboiling, a cumulative 2- to 8-fold increase was observed in the F- content of the cooked PBR; and 5) even in the market samples, PBR had significantly more F’ than raw rice.
This study reveals the importance of using only water with permissible limits of F’ for parboiling and cooking. It also highlights the importance of food fluoride in the atiology and control of endemic fluorosis. Key Words: Fluoride intake; Food fluoride; Hyderabad; Paddy; Parboiled rice.
Introduction Rice (0ryz.a sativa) is a major dietary staple of nearly haif the world’s popula-
tion. About 95 per cent of this cereal is produced and consumed in South East Asian countries, including India. It is estimated that more than half the population of India subsists on rice.’
In India and other South East Asian countries, rice is normally consumed in two forms. One is the original raw rice, and the other, parboiled rice. Parboiling is a premilling conditioning of grain with husk intact. In this process, paddy (rice in the husk) is first soaked in water, followed by steaming and drying.
For centuries, parboiling of paddy has been a widely followed traditional prac- tice in the orient, particularly in India. Parboiled rice is also produced on a com- mercial scale in the USA, Italy and British Guiana.2 This premilling treatment is known to improve the yield during millings, as well as the storage and cooking qualities of rice. Besides, this process has been shown to reduce the loss of certain B-complex vitamins and minerals during milling. Thus parboiled rice is considered nutritionally superior to raw rice.3 It is reported that nearly 50% of the paddy produced in India is parboiled, and that the production of such rice is increasing.2
National Institute Of Nutrition, Indian Council of Medical Research, Jamai Osmania PO, Hyderabad-500 007, India.

194 Anasuya and Paranjape Fluoride 29 (4)
In India, parboiled rice is consumed extensively in the eastern, and parts of southern, central and northern, regions.* These include large areas where endemic fluorosis is rampant.
Several methods of parboiling are followed in different countries and in different regions of the same country. In India, this premilling process of paddy continues to be an unorganised sector, wherein the traditional practices are still being followed.4 In rural India, home made parboiled rice is consumed even in many villages where fluorosis is endemic. The economically backward people, who are the main victims of fluorosi~,~ resort to parboiling paddy at the house-hold level. For this purpose, invariably, they use the same source of locally available water which may have unsafe levels of fluoride. It seems possible that such a practice may enhance the fluoride concentration of rice.
Since rice is a major staple, and since foods also contribute significantly to the daily intake of fluoride,6 it is essential to know whether the fluoride content of rice is affected by the process of parboiling. Information on this important question is not available. Hence this laboratory investigation was undertaken with the follow- ing objectives: 1) to test whether parboiling of paddy affects the fluoride level of rice; 2) to investigate the relationship, if any, between the concentration of fluoride in
water used for parboiling, and that of the rice; and 3) to study the effect of cooking on the fluoride content of cooked parboiled rice.
Materials and Methods Adequate quantities of two varieties - HANSA and SONA - of good quality
paddy, and 10 samples each of raw and parboiled rice were purchased in bulk from the local markets of Hyderabad city. From this normal, city area, river water samples from public supply (n = 3), and tube-well water (n = 3) were collected. From a neighbouring fluorotic area of Nalgonda district, water samples from open wells (n = 3), tube-wells (n = 2) and a pond (n = 1) were collected. This collection was done around the same period of the year (December-January).
In the laboratory, the paddy was parboiled in different batches, under identical conditions using (a) glass distilled water, (b) surface water (river), and (c) ground- water from open and tube-wells. For this purpose, two experimental approaches were followed. In one, the fluoride concentration of water samples was raised to levels normally encountered in endemic fluorotic regions of India by adding graded quantities of sodium fluoride to them. In the second, water samples with different levels of naturally occurring fluoride, ranging from 0.2 to 20 ppm, obtained from normal and endemic fluorosis villages were used for parboiling.
Method of parboiling A traditional method of parb~iling,~ commonly followed by rural households of
some endemic fluorosis villages of India (as observed by the first author of this paper) was adapted in our laboratory. In this method hand-cleaned paddy was soaked in 5 volumes of water at room temperature for 18 hours. The soaked paddy

November 1996 Effect of parboiling on fluoride content of rice 195
was steamed (at 80-84°C) in a stainless steel vessel for one hour with occasional stirring. This processed paddy was blotted with filter paper and dried at 50°C in an oven for approximately 28 hours (in the traditional method, drying is done slowly in the sunlight). This dried parboiled paddy was dehusked in a rice mill (Satake Rice Machine, Stake Engineering Co Ltd, Tokyo). Part of this dehusked rice was polished at 5 per cent level using a Kett electric laboratory machine. The above milled and polished rice as well as the samples of raw and parboiled rice collected from the markets of Hyderabad city were powdered, using a cyclotee 1093 sample mill - Tecatar. These powdered samples were then used for the measurement of fluoride.
Effect of Polishing The fluoride content of part of the dehusked, unpolished parboiled rice
(n = 13) was estimated and compared to that of the corresponding, polished (at 5% level) samples (n = 13).
Effect of cooking Rice samples obtained from paddy which was parboiled by us using water
samples containing different levels of naturally occurring fluoride, were cooked in the same water sample in two ways (after washing the rice once in the respective samples of water). In one, which is known as the absorption method, just enough water (1:s w/v) was used. We observed that this amount of water was required, for the parboiled rice to be cooked completely. In the other, rice was cooked in an excess of water (1:15 w/v) and the gruel was drained off. The cooked rice was dried and processed as described above.
Fluoride estimation A method using an ion-selective electrode described by Villa8 was used. About
6 grams of the rice powder was accurately weighed in duplicate into polythene beakers. Thirty millilitres of 0.1 N perchloric acid (HClO,) was added and the contents of the beakers were mixed with a magnetic stirrer (low speed) for 20 minutes and left at room temperature for one hour. Later, the contents were stirred for an additional 10 minutes. The fluoride ion concentration was then measured using the fluoride ion specific electrode (Orion fluoride electrode 940900). To calculate the fluoride content of the samples, instead of using an equation given in the original procedure, a standard graph was constructed using different concentra- tions of fluoride (as NaF).
Analysis of standard reference material (NBS - SRM 2671 a)* using the above procedure gave a value of 5.6 pg fluoride per gram, as against the certified value of 5.5 pg per gram.
Statistical methods For evaluating the data on the effect of (a)parboiling, (b)polishing, and
(c) different methods of cooking (conducted in the laboratory) on fluoride content of rice, the paired ‘t’ test was utilised. Differences in fluoride content of raw and parboiled rice collected from local markets of Hyderabad city were tested by student ‘t’ test. * National Bureau of Standards - Standard Reference Material for fluoride.

196 Anasuya and Paranjape Fluoride 29 (4)
Results Effect of parboiling The process of parboiling in fluoride-containing water had a significant en-
hancing effect on the fluoride content of rice. This effect was observed with both river water and ground water (Table 1). As expected, parboiling in distilled water had no significant effect since this water contains only traces of fluoride. Increasing the fluoride concentration of water samples by the addition of sodium fluoride promptly increased the level of this element in the parboiled rice, irrespective of the source of water used (Table 1). This result provides unequivocal proof that the process of parboiling does increase the concentration of fluoride in rice. A similar effect has been observed when the paddy was parboiled with water samples con- taining different levels of naturally occurring fluoride (Tables 2 and 3). Both SONA and HANSA varieties of paddy exhibited such a change. However, this increase was greater in the SONA (Table 3) than in the HANSA variety (Table 2).
Effect of Polishing Polishing the parboiled rice (n = 13) at 5% level was found to reduce the
levels of fluoride by about 30%. The values (fluoride pg/g dry weight) were 3.1 (SE 0.66) and 2.2 (SE 0.51) respectively. The difference between these values is highly sigmficant (P < 0.001) as tested by paired ‘t’ test.
TABLE 1. Effect of parboiling paddy (HANSA variety) in different sources of water treated with sodium fluoride (NaF), on fluoride content of rice
Source of Original Increase after Raw Increase after water adding NaF parboiling
1. Glass 0.08 1.1 0.0 distilled 0.08 1.8 1.1 2.0 water 0.08 3.7 1.1 3.7
2. Glass 0.08 0.53 0.01 distilled 0.08 0.94 0.53 0.88 water 0.08 2.22 0.53 2.42
0.08 3.32 0.53 3.27 0.08 4.80 0.53 4.60
3. River 0.40 0.35 0.35 water 0.40 0.80 0.35 0.55
0.40 1.70 0.35 1.35 0.40 2.70 0.35 1.95 0.40 3.90 0.35 2.75
4. Ground 1.70 0.40 1 S O water 1.70 4.70 0.40 5.40 (Tube well) 1.70 8.30 0.40 6.80
1.70 10.30 0.40 8.10
Fluoride content of water pg/mL Fluoride content of rice pg/g dry wt

November 1996 Effect ot pamoiling on TIuonae comerit 01 I I L ~ I J ~
TABLE 2. Relation between fluoride levels (naturally occurring) of water and parboiled rice (HANSA variety) Fluoride content Fluoride content of rice
of water (PS/S dry wt (Pg/mL) Raw Parboiled Increase after
parboiling A. Normal area:
River 0.29 1.12 1.40 0.28 River 0.32 0.59 0.77 0.18 River 0.35 0.37 0.73 0.36 Tube well 1.64 0.59 I .54 0.95
Open well 7.13 0.41 8.41 8.00 Open well 8.40 0.41 6.44 6.03 Open well 2.50 0.41 1.93 1.52 Tube well 1.70 0.44 I .89 1.45 Tube well 3.80 0.41 2.20 1.79 Pond 19.20 0.41 18.20 17.79
Mean 4.5 0.5 4.4 3.8* SE 1.86 0.071 1.74 1.76
P .C 0.001 compared to raw rice, by ‘paired t‘ test
B. Fluorotic Area:
TABLE 3. Relation between naturally occurring fluoride levels of water and parboiled rice (SONA variety) Fluoride content Fluoride content of rice: increase of water (pg/mL) after parboiling (pg/g dry wt)
A: Normal area: 0.48 1.18 0.37 1.22 0.30 0.77
2.60 8.34 2.32 6.83 2.32 4.61 4.86 5.90 4.23 9.64 4.00 10.01 4.00 13.64 8.84 24.01 8.46 23.51 7.60 12.60 8.46 19.15
B: Fluorotic area:
No. 14 14 Mean 4.20 10.10* SE 0.82 2.07 Fluoride content of raw rice 0.2 pglg dry wt * Compared to raw rice P < 0.001; by ‘paired t’ test

198 Anasuya and Paranjape Fluoride 29 (4)
Relation between fluoride levels in water and parboiled rice A significant (P < 0.01) correlation (r = 0.96) between the levels of fluoride
present in the water used for parboiling, and the increase in the fluoride content of the parboiled rice was observed irrespective of the source of water used (Figure).
FIGURE. Relationship between fluoride levels in water and parboiled rice (HANSA VARIETY)
0 2 4 6 8 10 12 14 16 18 20
F- in water (mg Litre -1
Fluoride content in market samples of raw and parboiled rice Even in the samples collected from the markets of Hyderabad city, the con-
centration of fluoride (pg/g) was significantly more (P < 0.001) in parboiled rice (0.35; SE 0.018; n = 10) than in raw rice (0.22; SE 0.013; n = 10).
Fluoride content of parboiled and cooked rice (Table 4) Cooking parboiled rice in the same source of water in which the paddy was
parboiled resulted in further increase in fluoride concentration of rice. This increase was influenced by the method of cooking. Thus when the absorption method with 5 volumes of water was used, about a 4 to 8 fold increase (P < 0.01) in fluoride content was observed. By cooking in excess water (15 volumes) and discarding the excess gruel, this increase was smaller by about 50 per cent com- pared with the absorption method, but was significant (P < 0.01).
Based upon the data on the levels of fluoride in the water, and in the uncooked and cooked parboiled rice, the probable daily fluoride intake by adults in India

November 1996 Effect of parboiling on fluoride content of rice 199
through water and rice has been calculated. For this purpose, it has been assumed that for an adult, the average daily intake of rice is about 330 g (in states where the staple is rice): and that of water is about 2.5 litres. Some examples are illustrated (Table 5). These values indicate that while in normal areas about 2.2 mg of F- may be consumed, in fluorotic areas it could be as high as 21 to 36 mg. The contribution of cooked parboiled rice to this intake was about 40 per cent, irrespective of the level of fluoride in water. In absolute terms the amount of fluoride derived from cooked parboiled rice can be nearly 10 to 14 times greater in fluorotic regions.
TABLE 4. Effect of cooking on fluoride content of parboiled rice (SONA variety) Sample No. Fluoride
Parboiled rice uncooked 14 10.3i 2.07a pg/g dry weight
Parboiled rice cooked with: Enough water (15 WN) 14 (Absorption method) Excess water (1:15 WN) 14
43.9 f 10.09b
26.9i 6.57C For parboiling and cooking, water samples from normal and endemic areas with varying levels of fluoride (0.3 to 8.8 vg/mL) have been used. Values are mean f SEM. Different superscripts given to mean values indicate significant differences (P c 0.01) as tested by paired "test.
TABLE 5. Estimated intake of fluoride (F-) through water, and cooked parboiled rice (PBR) [HANSA variety]
Water F- (pg/mL) F' in PBR (pg/g dry weight) uncooked Cooked Water Cooked Total
(absorption method) PBR rice 0.5 0.5 2.8 1.3 0.94(43%) 2.2 4.9+ 3.4 26.7 12.3 8.94(42%) 21.2 8.8+ 9.1 41.6 22.0 13.9(399/0) 35.9
+ Water samples were collected from fluorotic region. Assumptions of daily intakes: water 2.5 L; rice 330 g for Indian adults when rice is the staple.9
PBR: Parboiled rice.
F- intake mg/day*
Discussion This study has both basic and practical value. This is the first report wherein
the ability of fluoride ion to enter rice during parboiling has been clearly demonstrated. About 25-40 per cent of fluoride present in water seems to enter the rice during the process of parboiling.
In view of the fact that, in many endemic fluorotic areas of India, parboiled rice is consumed extensively, these results of the study gain special importance. Quite often, in rural areas, paddy is parboiled at the household level using the locally available water. Such a practice, if followed in fluorosis-affected regions, is

200 Anasuya and Paranjape Fluoride 29 (4)
bound to increase the fluoride burden of people several fold. Hence, it is important to advise the householders in endemic zones to use safe water, not only for drinking, but also for cooking food and for parboiling paddy. The concerned governments and health agencies should try to provide the necessary infrastructure and assistance to undertake centralized, large-scale parboiling processes using water with safe limits of fluoride.
Despite the observations reported in this article, it may not be desirable to stop the practice of parboiling per se in endemic zones of fluorosis. In fact, the F A 0 International Commission appear to favour developments in the parboiling process as a means of increasing output and improving the quality of rice.10 Hence, what is important is to identify and popularise an effective household method of parboiling paddy by which the intake of fluoride can be minimised. This approach may be helpful when people have no other choice but to use water with high fluoride content.
Our observation that polishing the parboiled rice at the 5% level causes a significant decrease in its fluoride content is useful. In rural home set-ups for hulling paddy, primitive methods are still being used. The most commonly seen methods throughout the East are the use of wooden mortar and pestle operated by hand, foot or water power, and sometimes wooden hullers. Under these conditions, the level of polishing that can be achieved may be far less than 5%. Hence more fluoride may be retained in the hand pound grain. Considering this particular disadvantage, it is important to provide adequate milling facilities for the con- cerned households to reduce fluoride levels in rice to some extent.
Another finding of practical importance is that, when parboiled rice is cooked in excess of water and the gruel is discarded, the fluoride content of cooked rice is reduced to some extent. Hence, this method of cooking may be recommended to reduce the fluoride burden of people who are at risk of developing fluorosis. However, this alternative should be viewed with caution. The loss of other nutrients in rice through this mode of cooking where the gruel is discarded must be given due consideration.
It is important to note that whatever the method of cooking, i.e. the absorption method with adequate water, or with an excess of water, the fluoride content of cooked rice is bound to increase several fold, depending upon the level of fluoride in water. Hence, the intake of this element via cooked parboiled rice in an endemic fluorotic region can be substantial.
Our recent study showed that, where raw rice was a staple, the total intake of fluoride from water and cooked diets was about 2.2 and 15.5 mg per day in normal and fluorosis affected villages, respectively.* As the present investigation indi- cates, if locally prepared parboiled rice is used as the major staple, the ingestion of fluoride through water and cooked rice remains around 2.2 mg/day under normal conditions. In fluorotic villages this figure becomes much higher, i.e., about 21 to 36 mg/day. This point illustrates the importance of dietary practices in the aetiology of endemic fluorosis in certain population groups in India. In computing the data, in addition to parboiled rice, if other items of local diets are also considered, a further enhancement in the fluoride burden of the population can be expected.

November 1996 Effect of parboiling on fluonde conlenl OT nce LUI
For fluorosis control programmes to succeed, merely providing safe water for drinking is not enough. It is equally essential to reduce fluoride intake of the population through foods and diets.
1
2
3
4
5
6
7
8
9
10
References Araullo EV, Depadua DB, Michael G. Processing Methods. In: Araullo EV, Depadua DB, Michael G (Eds). Rice. Post-harvest Technology. International Development Research Centre, Ottawa, Canada 1976 pp 335-363. Mukheqee SK, Bose AN. Principle of Parboiling of Paddy. In: Chakraverty 4 De DS (Eds). Post-harvest Technology of Cereals and Pulses. Odord and IBH Publishing Co, New Delhi, Bombay, Calcutta 1981 pp 125-145. Grist DH. Parboiling processes. In: Grist DH (Ed). Rice. Longmans Green, London 1960 pp 340-347, Grist DH. Milling. In: Grist DH (Ed). Rice. Longmans Green and Co Ltd, London
Pandit CG, Raghavachari TNS, Rao DS, Krishnamurti V. Endemic fluorosis in South India. A study of factors involved in the production of mottled enamel in children and severe bone manifestations in adults. Indian Journal of Medical Research 28 533-558 1940. Anasuya 4 Bapu Rao S, Paranjape PK. Fluoride and silicon intake in normal and endemic fluorotic areas. (Communicated) 1995. Franco G. Parboiled Rice. In: Huston DF (Ed). Rice - Chemistry and Technology. American Association of Cereal Chemists, 1972 pp 358-380. Villa AE. Rapid method for determining fluoride in vegetation using an ion- selective electrode. Anabst 104 545-55 1 1979. Gopalan C, Balasubramanian SC, Rama Sastri BV, Rao KV. Consumption pattern ofvarious food stuffs. In: Gopalan C, Balasubramanian SC, Rama Sastri BV, Rao KV (Eds). Diet Atlas of India. National Institute of Nutrition, Indian Council of Medical Research, Hyderabad 1971 p 35. Report of the first session of the Food and Agriculture Organization. International Rice Commission, Bangkok, Thailand 1949.
1960 pp 303-326.
Published by the International Society for Fluoride Research Editorial Office: 81A Landscape Road, Mount Eden, Auckland 4, New Zealand

202 Research Report Fluoride Vol. 29 No. 4 202-206
A STUDY OF WATER-BORNE ENDEMIC FLUOROSIS IN CHINA
G X Teng, X H Zhao, Y X Shi, G Q Yu, L H Wang, Y F Shen and Y F Sun Harbin, China
SUMMARY: Survey results are presented from 34 sentinel sites in 18 counties in endemic water-borne fluorosis areas of China through the years of 1991 and 1992. The progress in improving water to control fluorosis was very slow. By the end of 1991, only 42.1% of the villages, and 39.3% of the population, in endemic fluorosis areas had improved water supplies. In 1992 this improvement increased by only 1%. Inspection of 987 water improvement projects to reduce fluoride showed that 82.7% were continuously used, 10.3% had interrupted use, and 7.0% had been stopped or destroyed. The projects resulted in 65.4% having a water fluoride content of less than 1 .O mglL, 21.3% had 1 .O-1.5 mglL, and 15.4% had more than 1.5 mg/L. In 34 sentinel sites, urinary fluoride content and dental fluorosis indices of 8-12 year old children decreased year by year, especially in the sites with longer water improvement and water fluoride content less than 1.0 mglL. Symptoms and signs of adult fluorosis also decreased, but not as significantly as the urinary fluoride content and dental fluorosis of children. Key words: Defluondation; Endemic fluorosis; Water fluoride.
Introduction In order to more accurately understand the status of water-borne fluorosis,
China has, since 1991, monitored both the changes of prevalence of endemic fluorosis and the status of water improvement for controlling fluoride in 34 sentinel sites of 18 counties of 14 provinces. This study is an analysis of the results in 1991 and 1992.
1. Eighteen counties, representative of a range of endemic types, prevalences and severity, geographical place, and water improvement progress and methods, were selected in areas of water-borne endemic fluorosis throughout the nation, viz. Zhaodong and Anda in Heilongjiang, Qian’an in Jilin, Wafangdian in Liaoning, Tuoketuo in Neimenggu, Jinghai in Tianjin, Gu’an in Hebei, Lushan in Henan, Hengtai in Shandong, Lingyi and Quwo in Shanxi, Yanchi in Ningxia, Qin’an in Gansu, Sihong, Tongshan and Donghai in Jiangsu, Fengshun in Guangdong and Dangshan in Anhui. The progress of projects for improving water to control fluoride was monitored in terms of management, use and water fluoride content. 2. One to three villages were chosen as sentinel sites in each selected county, the criteria being that water had been improved, population was at least 500, and there was no other pathogenic fluoride source. In each site, water fluoride, childrens’ urinary fluoride, childrens’ dental fluorosis, symptoms and signs of fluorosis in adults, and skeletal fluorosis of adults, were examined. Total number of sentinel sites was 34. They included 2 low concentration villages with water fluoride levels
Materials and Methods
Endemic Fluorosis Institute, Chinese Research Center for Endemic Disease Control, 157 Baojian Road, Harbin 150086, Peoples Republic of China. Presented to the XXth Conference of the International Society for Fluoride Research, Beijing, September 5-9, 1994.

November 1996 Water-borne enaemic Tluorosis in L I I I I I ~ LW
of 1.1 - 2.0 mg/L (Al-M), 11 moderate villages with levels of 2.1 - 4.0 mg/L (Bl- Bll) , and 21 severe villages with levels higher than 4.0 mg/L (Cl-C21). 3. In each sentinel site, water fluoride levels from 10 households were measured once a year, urinary fluoride levels from 50 children aged 8-12 years were measured once a year with 10 children in each age group, dental fluorosis in all 8- to 12-year old children was examined once a year, symptoms and signs of fluorosis from 80% of adults aged 16-65 years were examined once every two years, and skeletal fluorosis from 50 adults aged 16-65 years ( one age group of 5 men and 5 women for each 10 year age period) was examined once every five years. 4. Fluoride was determined by the electrode method.’ Dental fluorosis was diagnosed according to Dean.* Symptoms and signs of skeletal fluorosis classified by the four degrees and four types method.’ 5. Surveillance was carried out by a special technical team after training provided at the provincial level.
Results 1. Progress in improving water fluoride levels
There were 5090 villages and a population of 4.224 million at risk in endemic areas in 18 selected counties. By the end of 1991, 2145 villages (42.1%) had completed work for improving water and the benefited population had reached 1.660 million (39.3%). By the end of 1992, 2219 villages (43.6%) had completed work for improving water and the benefited population had reached 1.770 million (41.9%). Of 18 counties, only two had completed the entire work for improving water. Other counties had only partly completed work, with the following percent- ages: 2 counties: > 60%; 3 counties > 40%; 6 counties: > 20%; 4 counties > 20%; 1 county: > 1%. These results suggested that the proportion of villages that had completed work of improving water for fluoride control was lower, increment rate of improvement year by year was also lower, and different counties had different improvement proportions. 2. Status of projects of water improvement for fluoride control.
In 1991, 987 projects of improving water for fluoride control were inspected in 17 counties. Of these, the number of projects and their proportions with different water fluoride contents were as follows: < 1.0 mg/L: 645 projects, 65.3%; 1.0- 1.5 mg/L: 210 projects, 21.3%; 1.5-3 mg/L 103 projects, 10.4%; > 3.0 mg/L 29 projects, 3.0%. Of 987 projects, number of projects and their proportions in usage were as follows: continuous use: 817 projects, 82.7%; interrupted use: 101 projects, 10.3%; stopping use or destruction: 69 projects, 7.0%. About 90% of projects had managing personnel, and records. The results showed that although water fluoride in most of projects for water improvement to control fluoride had reached < 1.0 mg/L or come near (1.0-1.5 mg/L) the national health criteria of drinking-water fluoride content, a part of projects not only had not decreased the water fluoride content, but had increased it to higher levels. Some projects were not continued, even stopped use or were destroyed. 3.
urine in 34 sentinel sites are shown in Tables 1 and 2.
Content of fluoride in water and urine at sentinel sites. The surveillance results of fluoride content in drinking water and childrens

204 Tengetal Fluoride 29 (4)
From Tables 1 and 2, we recognise that fluoride content of waters from mild endemic villages had reached the levels of non-endemic areas; those of moderate endemic villages were near the levels of non-endemic areas, and those of severe endemic villages had markedly decreased. The data showed that the effects of improving water to control fluoride were good, but in some moderate and severe endemic villages the water fluoride content was still over national health criteria and urinary fluoride contents remained at the higher levels.
TABLE 1. Surveillance results of fluoride content (mg/L) in 1991 and 1992 Endemic Fluoride content of Fluoride content of
drinking water children’s urine 1991 1992 1991 1992
mild 0.31 0.33 1 S O 0.83 moderate 0.64 0.59 2.59 1.46 severe 1.16 1.35 2.88 2.42
TABLE 2. Surveillance results of water fluoride content (mg/L) at 34 sentinel sites in 1991 and 1992
Water fluoride content Sentinel Year of Before sites improvement improvement 1991 1992 A1 1986 1.80 0.36 0.25 A2 B l 82 83 84 85 B6 87 88 B9 B10 B11 C l c 2 c 3 c 4 c5 C6 c 7 C8 c 9 cio c11 c12 C13 C14 C15 C16 C17 C18 c19
1987 1984 1980 1985 1986 1986 1989 1990 1991 1991 1991 1979 1979 1981 1982 1982 1982 1982 1982 1983 1983 1983 1984 1985 1986 1987 1987 1987 1987 1990 1990
1.80 4.00 3.60 3.30 3.08 3.66 4.00 3.20 2.50 3.50 3.75 2.40
14.00 4.20 5.30 5.50 7.00 4.10 9.00 5.30 4.50 9.60 6.30 7.80
12.50 7.70
11.60 5.40 4.70 4.60 7.60
0.26 3.14 0.60 0.50 1 .oo 1.05 1.34 0.87 0.80 1.92 1.23 0.65 0.24 2.38 1.40 0.73 0.45 0.27 1.82 5.45 1.70 0.30 0.24 0.58 0.36 1 .oo 0.43 0.80 0.54 0.61 0.36
0.41 2.37 0.69 0.45 0.71 0.83 1.15 0.73 0.47 1.91 1.03 0.75 0.24 2.06 1.09 1.20 1 .oo 0.71 1.82 5.07 1.05 0.25 0.24 0.48 0.42 1 .oo 0.43 0.80 0.65 0.65 2.10
c20 1991 4.45 0.76 0.86 c21 1991 12.78 0.65 0.54

November 1996 Water-borne endemic fluorosis in China 205
4. Detectable rate of children’s dental fluorosis in the sentinel sites Data on dental fluorosis of 8-12 years old children in 34 sentinel sites are
shown in Tables 3 and 4. From Tables 2-4, we note that total detectable rate and index and detectable
rate of dental fluorosis in moderate and severe endemic areas were obviously decreased in 1992 compared to 1991. The lower the water fluoride content was before improving water, the lower the water fluoride content was after improving water. The greater number of years of improved water and the younger the age group, the more the described indicators above decreased.
TABLE 3. Surveillance results on dental fluorosis of 8- to 12-year-old children in 1991 and 1992
Sentinel Sample size Dental fluorosis Sample size Dental fluorosis sites in 1991 in 1991 in 1992 in 7992
N YO index N % index A1 A2 B l 82 63 84 B5 B6 87 88 B9 81 0 B l l c 1 c 2 c 3 c 4 c 5 C6 c 7 C8 c 9 c10 c11 c12 C13 C14 C15 C16 C17 C18 c19
56 92
171 70 55 81
227 64
123 81 33
132 115 1 06 120 38 93
184 173 369 71 60 72 58
128 135 68 44
100 145 79
131
3 15
7 44 27 29 25
164 39
101 50 26 42 65 46 61 16 47
112 22
359 68 45 50 55 99 78 60 41 96 80 49 88
5.4 16.3 84.2 38.6 52.7 30.9 72.2 60.9 82.1 61.7 78.8 31.8 56.5 45.3 50.8 42.1 50.5 60.9 12.7 97.3 95.8 75.0 69.4 94.8 77.3 57.8 88.2 93.2 96.0 55.2 62.0 67.2
0.14 0.40 2.49 0.81 2.21 0.67 1.47 1.20 2.35 1.49 1.89 0.62 1.19 1.08 0.98 1.01 0.89 1.32 0.27 2.62 2.61 1.66 2.27 2.28 2.04 1.25 1.97 2.81 2.47 1.37 1.37 1.55
62 73
193 69 57 67
206 57 82 78 41
177 119 45 52 45
141 153 187 425 68 62 60 40
167 93 97
160 143 133 133 124
7 13
149 20 28 17
105 31 57 47 32 98 68
5 22 6
72 74 18
190 56 38 37 24
123 75 51
132 118 85 85
115
11.3 17.8 77.2 29.0 49.1 25.4 51 .O 54.4 69.5 60.3 78.0 55.4 57.1 11.1 42.3 13.3 51 .l 48.4
9.6 44.7 82.4 61.3 61.7 60.0 73.7 80.6 52.6 82.5 82.5 63.9 63.9 92.7
1.70 91 80 87.9 c20 99 81 81.8 c21 63 60 95.2 3.20 191 128 67.0 2.03 TOTAL 3636 2343 64.4 1.60 3891 2206 56.7 1.32
0.23 0.45 2.28 0.57 1.07 0.54 0.83 1.06 2.15 1.47 1.70 1 .37 1.17 1.18 0.80 0.28 1.10 0.83 0.21 0.92 2.00 1.19 1.54 1.20 1.85 1.78 0.99 2.07 2.13 1.46 1.46 2.39 1.66
TABLE 4. Denbl Fluorosis Index of each aae arouD in 1991 and 1992 Year Dental Fluorosis Index of each age group
~
8 9 10 11 12 1991 1.08 1.42 1.59 1.75 2.02 1992 0.89 1.18 1.25 1.63 1.69

206 Tengetai Fluoride 29 (4) November 1996
5 . Symptoms and signs of adult fluorosis and X-ray examination results o f adult skeletal fluorosis at the sentinel sites.
In 1991, 15013 adults aged 16 - 65 years old were clinically examined. Affected patients were 2991 adults, 19.92%. Of the total affected of adults cases, the proportion of mild, moderate, severe and very severe fluorosis accounted for 14.13%, 4.69%, 0.91% and 0.0070/0, respectively. 2004 adults aged 16-65 years old were examined by X-ray. The number of detectable skeletal fluorosis was 728 (36.32%). Of the total detectable skeletal fluorosis, rates of very mild, mild, moderate and severe were 12.385%, 14.02%, 8.03% and 1.89%, respectively. The detectable rate was 39.26% in men and 32.95 % in women.
Discussion and Conclusions China has the most fluoride-endemic areas and the most severe risk of water-
borne fluorosis in the world. On the China mainland, except Shanghai City, water- borne fluorosis is prevalent in all 29 provinces (autonomous region, municipality). Endemic areas are distributed in 107,243 villages in 1,054 counties. The population at risk is approximately 70 million. Control efforts for many years, have achieved tremendous progress in water-borne fluorosis, but surveillance results from 18 selected counties where work for water-borne fluorosis control has been con- ducted successfully indicate that the task of controlling water-borne fluorosis is still very formidable in China. In China, 2/3 of the endemic villages need to improve water, and most of them are distributed in poor areas. In the villages where measures for improving water to control fluoride have been implemented, water fluoride content is still over National Health criteria in some villages, and improvement systems are not continuously used or have been destroyed. There is a need to repair and reconstruct. Therefore, the work for water-borne fluorosis control must be strengthened.
Surveillance results from 34 sentinel sites in 1991 and 1992 showed: 1) The present improvement measures are effective in China. Water fluoride content has reached or approached the National Health criteria, or decreased greatly; urinary fluoride content of children has approached the levels of non- endemic areas or decreased greatly year by year; detectable rate and index of childrens dental fluorosis show a decreased trend, and have reached the level of non-endemic areas in some sentinel sites. 2) The quality of projects for improving water to control fluoride needs to be improved further and the managing and repairing work needs to be strengthened. Some projects can not be continuously used, and some projects have stopped use or been destroyed. Water fluoride content has not in some projects decreased to the levels of non-endemic areas but has increased obviously in some projects. This jeopardises our efforts to control fluorosis.
References 1
2
Handbook for prevention and treatment of endemic fluorosis. Ministry of Health, Beijing 1991. Dean H T. Classification of mottled enamel diagnosis. JoumaZ of the American Dental Association 21 1421-1426 1934.
Published by the International Society for Fluoride Research Editorial Office: 81A Landscape Road, Mount Eden, Auckland 4, New Zealand

Fluoride Vol. 29 No. 4 207-21 I 1996 Research Report 207
COAL BURNING INDUCED ENDEMIC FLUOROSIS IN CHINA
Y Zhang and S R Cao Beijing, China
SUMMARY: Wide-spread coal-burning in China is caused by indoor combustion of high fluoride(F)-containing coal. The incidence of fluorosis increases with increase in the F content of coal. Indoor airborne F of fluorosis-afflicted areas exists mainly in a gaseous form (SiF, and HF) with some coexisting aerosol forms. Gaseous F contributes about 40-84% of total inorganic F emission. Total airborne inorganic F was in the range of 11-155 pg/m3, several times higher than the National Hygienic Standards. Total F intake by adults in disease areas was found to be about 10 mglday as compared to 0.8 mglday in non-disease areas. Key words: Air-borne fluoride; Coal-burning; Endemic fluorosis.
Introduction Coal-burning fluorosis, a specific endemic disease found in China at the end of
1970, is a general chronic fluorosis mainly affecting bones and teeth. The disease is distributed over 14 provinces, autonomous regions and municipalities of China, including Liaoning, Hebei, Beijing, Shanxi, Henan, Hubei, Hunan, Jiangxi, Yunnan, Guizhou, Sichuan, Guangxi, Zhejiang and Shaanxi. A growing number of studies on the skeletal and non-skeletal effects of F have been However, information is limited concerning the environmental factors contributing to fluorosis in coal-burning areas. We investigated, between 1986 and 1994, fluoride pollution in several main fluorosis areas in China, and found that coal- burning is the main cause.
Materials and Methods Five typical homes were selected at each site on the basis of geographical
position, distribution and house structure. Indoor and outdoor samples of gaseous and aerosol fluoride were collected with double filter constant temperature sample collectors, at a flow rate of 15L/min for 0.5 hr, 4 times/day for 5 consecutive days. The samples were analysed with the ion-selective electrode (ISE) method. (SiF, gas is converted to SiO, and H F through hydrolysis. When the gaseous form of F is collected and analyzed by the ISE method, the F being analysed is in the H F (F-) form. Inspirable particles (IP) were collected using KC-8301IP collectors equipped with polychloroethylene filters, run at a flow rate of 13L/min for 8 hr for 5 con- secutive days. The F in the IP was analysed with the ISE method after ultrasonic extraction with acid. Total F in coal and soil was determined by high temperature hydrolysis followed by ISE method, whereas that of vegetation was determined by the Ag2S04-H2S04 diffuse m e t h ~ d . ~
Samples for indoor air SO2 analysis were collected with a porous adsorption tube at a flow rate of 0.5Llmin and analysis was carried out by tetrachloro- mercurate-pararosaniline spectrophotometric m e t h ~ d . ~ Indoor air samples for CO analysis were collected with a polyethylene bag and the CO was determined using an Ecolyzer 2000 Carbon Monoxide Analyzer.
~~
Institute of Environmental Health and Engineering, Chinese Academy of Preventive Medicine, 29 Nan Wei Road, Beijing, China.
208 Zhang and Cao Fluoride 29 (4)
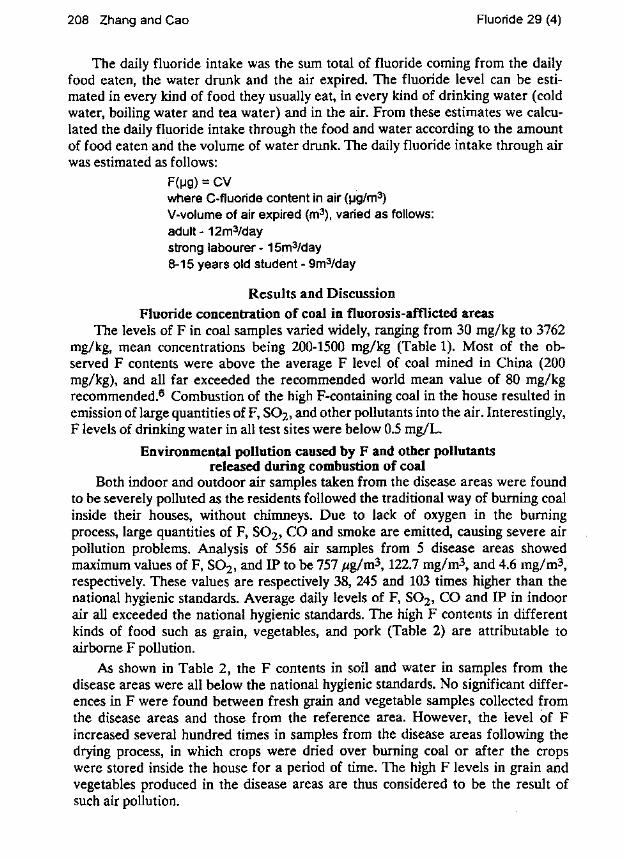
The daily fluoride intake was the sum total of fluoride coming from the daily food eaten, the water drunk and the air expired. The fluoride level can be esti- mated in every kind of food they usually eat, in every kind of drinking water (cold water, boiling water and tea water) and in the air. From these estimates we calcu- lated the daily fluoride intake through the food and water according to the amount of food eaten and the volume of water drunk. The daily fluoride intake through air was estimated as follows:
F(W) = cv where C-fluoride content in air (pg/m3) V-volume of air expired (m3), vaned as follows: adult - 12m3/day strong labourer - 1 5m3/day 8-1 5 years old student - 9m3/day
Results and Discussion Fluoride concentration of coal in fluorosis-afflicted areas
The levels of F in coal samples varied widely, ranging from 30 mg/kg to 3762 mg/kg, mean concentrations being 200-1500 mg/kg (Table 1). Most of the ob- served F contents were above the average F level of coal mined in China (200 mg/kg), and all far exceeded the recommended world mean value of 80 mg/kg recommended.6 Combustion of the high F-containing coal in the house resulted in emission of large quantities of F, S02, and other pollutants into the air. Interestingly, F levels of drinking water in all test sites were below 0.5 mg/L.
Environmental pollution caused by F and other pollutants released during combustion of coal
Both indoor and outdoor air samples taken from the disease areas were found to be severely polluted as the residents followed the traditional way of burning coal inside their houses, without chimneys. Due to lack of oxygen in the burning process, large quantities of F, SO2, CO and smoke are emitted, causing severe air pollution problems. Analysis of 556 air samples from 5 disease areas showed maximum values of F, SO2, and IP to be 757 pg/m3,122.7 mg/m3, and 4.6 mg/m3, respectively. These values are respectively 38, 245 and 103 times higher than the national hygienic standards. Average daily levels of F, S02, CO and IP in indoor air all exceeded the national hygienic standards. The high F contents in different kinds of food such as grain, vegetables, and pork (Table 2) are attributable to airborne F pollution.
As shown in Table 2, the F contents in soil and water in samples from the disease areas were all below the national hygienic standards. No significant differ- ences in F were found between fresh grain and vegetable samples collected from the disease areas and those from the reference area. However, the level of F increased several hundred times in samples from the disease areas following the drying process, in which crops were dried over burning coal or after the crops were stored inside the house for a period of time. The high F levels in grain and vegetables produced in the disease areas are thus considered to be the result of such air pollution.

November 1996 Coal-burning inaucea enaemic iiuorosis in uiiiia LUY
The F released from burning coal is predominantly in the gaseous form (SiF4 or HF), whereas the F from various other environmental samples is mainly water- soluble. Burning coal of high F can produce ionized F (F-). The F' ions cannot exist in the air alone. Rather, they readily react with other chemical species in the air
TABLE 1. Fluoride content of coal in fluorosis disease areas at different sites Sampling site F level (mg/kg)
(Province: County) N Mean Range Type of coal
Sichuan:
Hubei: Yunnan: Hebei:
Henan:
Hunan:
Beijing: Jiangxi:
G u a ng xi : Liaoning:
Wanxian, Qianjian, Wushan, Fengjie, Wulong, Yun yang , Wuxi Exizhou, Zigui Zhantong, Qujing Handan, Baoding. Shijiazhuang
Luoyang
Baojing, Lianyuan, Huaihua Nentougou, Fangshan Pingxiang, Yichun Hechun. Luoshan Benxi, Wafangdian
47
21 72 31
8
10
17 13
10 6
316
41 4 204 230
227
835
203 437
907 524
Shanxi: Ankano. Zivano 11 1513
68-1855
58-1 300 30 - 900 49- 355
57- 864
149 -2750
91-466 78 - 848
1 2 1 -21 00 170 -1 026 520-3762
bone coal* anthracite soft coal. idem anthracite soft coal anthracite soft coal bone coal soft coal anthracite anthracite son coal anthracite anthracite anthracite bone coal -. - -
* "Bone coal' is a kind of local coal, like 'stony coal', produced in disease areas
TABLE 2. Fluoride concentrations in air, vegetation, and soil samples at Zigui, Qianjian, Badong, and Pengshui
Water Air Corn Vegetable
Tap Tea In- Out- Air- washed Baked* Cooked Air- Baked*
n.20 n=15 n=200 n-200 n=250 door door dried dried
(mg/L) (mg/m3) (mg/kg) (msm) 0.01- 0.31- 0,019- 0.005- 0.55- 3.25- 0.99- 2.69- 0.31- 8.0- 0.50 5.03 0.757 0.029 0.029 5.48 103.0 33.80 9.25 52.0
Baked over burning coal
Soil Water- Total soluble
n.25
( m g W 0.63- 399- 14.6 2308
TABLE 3. Indoor fluoride concentrations in disease areas
Sampling site Fuel type F concentration (pg/m3) (county) Gaseous (%) Aerosol (%) Total
Badong, Chahgling bone coal 43.8 (59.0) 30.5 (41 .O) 74.3 Wushan, Jianping idem 62.5 (40.3) 92.4 (59.7) 154.9 Zigui, Moping anthracite 29.5 (47.9) 32.1 (52.1) 61.6 Wushan, Jianping idem 10.9 (72.7) 4.1 (27.3) 15.0 Pengshui, Luqing soft coal 49.7 (84.8) 9.0 (15.2) 58.7

210 Zhang and Cao Fluoride 29 (4)
forming such compounds as HF and SiF4. The latter can then be absorbed by con- stituents of coal smoke. F is an important factor in gaseous reactions. As shown in Tables 3 and 4, gaseous F accounted for about 40-85% of the total inorganic F in the air of the disease areas. Water-soluble F in grains accounts for about 74-94% of total F species (Table 4). The levels of gaseous and water-soluble F in the air, fly ash, and grains reveal that the F originate from the same source. Other air pollu- tants occurring in coal smoke, such as S@ and CO, and particulates with less than 5 pm in diameter, can also be inhaled. Inhalation of gaseous F can often lead to a higher prevalence rate of F disease than that of water-soluble F.
The mode and daily F intake for residents in the disease area Daily F intake via the respiratory tract was estimated at about 0.7 mg (Table 5).
A more important source of F intake is through ingestion of food highly con- taminated with F. Because of the cold and humid climate, residents in fluorosis- afflicted areas usually hang their newly harvested corn and vegetables indoors and dried them with the heat produced from burning coal. This practice results in crops with extremely high F contents. For example, the levels of F in dried corn and chili were found to be 18-87 mg/kg and 114-1109 mg/kg, respectively. In some areas, the F level in chili even reached as high as 1207 mg/kg. This is 37 times higher than
TABLE 4. Fluoride content of grains (average values, N=250)
Sampling site Grain type Water- Acid- Total F (county) soluble F (%) soluble F (%)
Badong (Changling) Rice 1.73 (73.9) 2.07 (26.1) 2.34 Corn 7.49 (76.1) 7.96 (23.9) 9.84
Pengshui (Luqing) Com 7.18 (94.6) 7.50 (5.4) 7.59
F concentration, pgkg
TABLE 5. Daily fluoride intake by residents in study areas
Times above standard intake
from from rate (%) digest. resp. of dental Study area counties
(Province) food water air total tract tract fluorosis Luqing, Pengshui (Sichuan) 8.86 0.10 0.67 9.65 2.6 7.9 98.0
Prevalence Fluoride intake (mg/day/person)
hoping, tiqui (Hebei) 4.12 1.45 0.55 6.12 1.6 6.5 85.0 Wenpan, Pingxiang (Jianqxi) 2.54 0.50 0.24 3.23 - a 2.9 57.4 Shuangche, Lianyuan (Hunan) 1.81 0.52 0.31 2.64 - 3.7 51 .o Taoyuan, Jingjing
Nandeng, Pingxiang
a Not exceeding standard intake
(Hebei) 1.86 0.42 0.15 2.43 - 1.7 44.4
(Jianqxi) 1.14 0.24 0.11 1.49 - 1.7 5.3
Reference areas

November 1996 Coal-burning induced endemic fluorosis in Gnina 21 1
that found in naturally dried food (31.2 mg/kg), and more than 3,000 times higher than that in fresh chili. Accumulation of F in food is increased with increase in baking time. Our results showed that six months after the corn had been dried with burning coal, the F content, less than 1 mg/kg in fresh sample, increased to 240 mg/kg. Because corn dried with firewood contained only 2.3 mg/kg F, the extremely high F level found in crops from the disease-afflicted areas is attributed to con- tamination by the smoke derived from burning coal. In addition, seeds and vege- tables absorb more F with increase in temperature, moisture, and airborne F levels.
As shown in Table 5, the daily total F intake by residents in moderate and severe disease areas was estimated at 6.12 mg and 9.65 mg per person, respectively. Both values are much higher than the daily intake standard of 2.0 mg per person, recommended by the World Health Organisation. It can be seen that the F intake through the respiratory tract is higher than that through the digestive tract.
Conclusion The widespread fluorosis in many provinces and areas in China was found to
result from intake of high levels of F emitted through combustion of high F- containing coal. Residents in fluorosis-afflicted areas were exposed to high air- borne F and foods contaminated with high F and other pollutants emitted from burning high F-containing coal without stoves or chimneys in the house. The F in the air was found to be mainly in gaseous and aerosol forms, whereas the F in grain was predominantly in water-soluble form. Total daily F intake by residents in the disease areas was about 10 mg per person, as compared to about 0.8 mg per person in non-disease areas. Results of our study strongly indicate that the high incidence of fluorosis in the disease areas is mainly due to intakes of large amounts of F through both respiratory and gastrointestinal tracts.
References 1 Li JX, Cao SR. Recent studies on endemic fluorosis in China. Fluoride 27 (3)125-128
1994. 2 Li J, Harus Nakagaki, Shinji Tsuboi el al. Fluoride profiles in different surfaces of
human permanent molar enamels from a naturally fluoridated and a non-fluoridated area. Archives of Oral Biology 39 (8) 727-73 1 1994.
3 Zang ZY, Fan JY, Yen W er al. The effect of nutrition on the development of endemic osteomalacia in patients with skeletal fluorosis. Fluoride 29 (1) 20-24 1996.
4 Cao SR. Indoor A i r Pollution and Method of Assessment. Environmental Science Press of China, Beijing 1989 [in Chinese].
5 Liang C, He Z, Cao H et al. The model test of coal burning fluorosis and the effect of SO, on fluorosis. J m m l of Hygiene Research 22 (3) 148-1 5 1 1993.
6 Zheng B. The study of fluoride content in Chinese coal. Chinese Journal of Control of Endemic Diseases 8 (2) 70-72 1988 [in Chinese].
Published by the International Society for Fluoride Research Editorial Office: 81A Landscape Road, Mount Eden, Auckland 4, New Zealand

212 Research Report Fluoride Vol. 29 No. 4 212-216
ASSESSMENT OF FLUORIDE REMOVAL FROM DRINKING WATER BY CALCIUM PHOSPHATE SYSTEMS
G L He and S R Cao Beijing, China
SUMMARY: Static defluoridation of high fluoride (10-12 ppm) water by sixteen different combinations of tricalcium phosphate (TCP), bone char (BC), hydroxy- apatite (HAP), and related substances has been investigated. Defluoridation of 100 mL of the water by 300 mg of relatively insoluble phosphates is only 60-70 percent complete. Defluoridation is 30 percent more efficient, however, when a more soluble phosphate is present, which suggests that defluoridation by TCP, BC, and HAP could be similarly improved. The combination of 300 mg BC plus 23 mg monocalcium phosphate (MCP) per 100 mL of high fluoride water appears to be the most efficient, reducing the fluoride concentration from 10.4 mglL to 0.6 mg/L by coprecipitation over 24 hr at pH 6.5-8.5. Key words: Bone Char; Calcium phosphates; Coprecipitation; Defluoridation; Hydroxy-
Introduction Bone charcoal or bone char (BC) is commonly used in developing countries for
defluoridation of drinking water. The principal active component of bone char is Ca3(P0&.1-3 Raw bone char, prepared from animal skeletons by calcination at 300-600°C is a mixture of three macroscopically different forms: black, grey, and white fragments, which exhibit considerable differences in their efficiency for defluoridation. Black BC, with a capacity of 11.4 mg.F-/g BC, is best, and white BC, with a capacity of less than 0.3 mg.F-/g BC, is ineffective for removal of f l~o r ide .~
However, black BC is formed at lower temperatures and it contains partly undecomposed organic matter, which may impart an unpleasant taste to the treated water. In addition, bone char is less effective when used alone in a batch method, a technique that is more appropriate where there is no reticulated (piped) water supply.'
To improve the efficiency of the BC method of water defluoridation, studies on various types of calcium phosphate have been described. Simple methods have been reported for home water treatment according to the principle of coprecipita- tion of fluoride with calcium and phosphate, forming fluorapatite and fluor- hydroxyapatite.5-7 However, no quantitative data were given for practical applica- tions, including experiments at different pH and temperature.
The present work sought to improve the efficiency of static defluoridation of 10-12 ppm fluoride in drinking water by examining and comparing relatively insoluble tricalcium phosphate (TCP), bone char (BC), and synthetic hydroxy- apatite (HAP) systems in sixteen different combinations with related substances.
apatite; Water fluoride.
Correspondence to: He Gongli, Institute of Environmental Health and Engineering, Chinese Academy of Preventive Medicine, 29 Nan Wei Road, Beijing 100050, China.

November 1996 Assessment of calcium phosphate defluoridation systems 213
Materials and Methods Chemicals and materials used in this study included:
BSH: Brushite CaHP04 Merck2146 MCP: Monocalcium phosphate Ca(H2P04)2 Merck C-8017 TCP-I: Tricalcium phosphate Ca3(P04)2 (made in China) A.R. TCP-11: Tricalcium phosphate Ca3(P04)2 (made in Germany) Merck 2 143 HAP-I: Hydroxyapatite (synthesized by our method) HAP-11: Hydroxyapatite (synthesized according to method reported by Li Xingyun 1990) CCL: Calcium chloride CaC12 A.R. CH: Calcium hydroxide Ca(0H)z A.R. CCB: BC: PDP: CL: FAP : Fluorhydroxyapatit e
Fluoride solutions with different concentrations were prepared by dissolving sodium fluoride (NaF, A.R.) in Beijing tap water containing 80-90 mg/L calcium. pH adjustment, if necessary, was done with 0.1 N HCl or NaOH. 1. Synthesis of hydroxyupatite (HAP-I)
Calcium hydroxide (20g) and dilute phosphoric acid (200 mL, 1 part 85% H3P0, and 5 parts H20) were allowed to react at 60-90°C in a water bath for 4-6 hr, followed by filtration through filter paper. The pH of the filtrate was adjusted to 12 with saturated NaOH with continuous stirring, producing a white flocculent precipitate that was boiled for an additional 20-40 min with stirring, filtered, washed with deionized water to neutrality, and dried at 100-110°C. A white powder product was obtained (HAP-I).
2. Synthesis of hydroxyuptite (HAP-II) Hydroxyapatite (HAP-II) was prepared according to the method reported by
Li X i n y ~ n . ~ A paste of Ca(OH)2 was dropped into the water of 60-90°C under moderate stirring conditions until a saturated solution of Ca(0Hh was formed, to which the phosphoric acid (15) was dropped under strong stirring to adjust the pH value of the solution to 10-12 when a white flocculent precipitation was obtained (HAP-II). 3. Defluoridation experiments
Various amounts of defluoridators (see Table 1) were suspended in 100 mL of fluoridecontaining water with continuous stimng. After mixing for 1-2 min, followed by static reaction at room temperature (18-28°C) for 24 hr, the super- natant was drawn off by suction for determination of pH, fluoride, and phosphate. The fluoride concentration and pH in the raw and treated water were determined by electrometric methods. (Total ionic strength and buffer (TISAB): prepared by dissolving 58 g NaCl (A.R.), 3.48 g sodium citrate (A.R.), and 57 mL acetic acid (A.R.)
Calcium carbonate CaC03 A. R. Bone char, black or grey, 80 mesh Potassium dihydrogen phosphate KHzPO4 A. R. Calcium lactate (CH3CHOHC00)2Ca A R

214 HeandCao Fluoride 29 (4)
in 800 mL of water. The pH value of the solution was adjusted to 5.0-5.5 by using 10% NaOH, and diluted to 1,000 mL with water.) The concentrations of phosphate were measured by a colorimetric techniq~e .~
Results and Discussion The main findings of the defluoridation systems examined are given in the
Table. When bone char (BC) was used alone at 300 mg per 100 mL, the fluoride concentration of the water decreased after 24 hr from 10.4 mg/L to 3.6 mg/L at pH 6.5-8.5 (Group A). Addition of calcium chloride (CCL) or calcium lactate (CL, providing calcium) and BC to the water under the same conditions, resulted in no significant improvement in fluoride removal (groups B and F). BC-BSH systems increased the amount of defluoridation by about 20% (groups C, D and G). The best combination system for removing fluoride from drinking water seems to be the BC-MCP system (group E), in which the extent of defluoridation increased about 30% compared with BC alone. Defluoridation by the BC-MCP system indi- cated that there were no appreciable differences when the pH of the raw water was 6.5-8.5. A disadvantage of the BC-MCP defluoridation system is that the residual phosphorus in the treated water is too high (10 mg/L) although the permissible level of phosphate in drinking water is not regulated.
Precipitating calcium phosphate, produced by the addition of MCP, CH, and CCL to the water, appeared to have acceptable efficiency of fluoride removal from acidic solution, but not from neutral and alkaline solutions (groups I and J). The present study has shown that tricalcium phosphate, by itself, is an efficient agent for removal of fluoride from drinking water at pH 5.0-9.0 in the batch procedure, with a low phosphorus concentration and an ability for controlling the pH levels of treated water tending to neutrality (groups K and L). When synthetic hydroxy- apatite (HAP-11) was used alone at 200 mg/100 mL, the efficiency of defluorida- tion is only 60-70% (Group N). If a suitable amount of soluble phosphate was added, together with HAP-11 to high fluoride water, fluoride removal approached 95% (Groups 0 and P). A similar efficiency has also been observed when BC and PDP were combined (Group H). These findings suggest that the defluoridation by insoluble calcium phosphates (TCP, HAP or BC) may be distinctly improved when suitable free phosphate exists in the solution.
It was also noted that the defluoridation efficiency of calcium phosphate system depended on the pH of the raw water, i.e. the lower the pH of the untreated water, the greater the amount of defluoridation (Group K). In a previous paper,'o we have suggested probable mechanisms for defluoridation of drinking water by tricalcium phosphate under various pH conditions, for which further study and demonstration are required. In most natural waters, the concentration of calcium is higher (20-90 mg/L), but the concentration of phosphate is lower. In this case, addition of calcium cannot improve the defluoridation efficiency of calcium phos- phate (groups B and F). Results of fluoride bio-metabolism indicate that phosphate, Mg, and A1 are more effective materials for reducing fluoride adsorption than is calcium.11 Quantitative relationships between pH, concentrations of calcium and phosphate in the raw water, and defluoridation efficiency by insoluble calcium phosphates are now being investigated.

November 1996 Assessment of calcium phosphate defluoridation systems 21 5
TABLE. Efficiency of different static defluoridation systems for 100 mL of water over 24 hr at room temperature.
Group Defluoridation Raw Water Treated Water systems and amounts (mg) F (mg/L) pH F (mg/L) Removal (%) P(mg/L) pH
A
B
C
D
E
F
G
H
I
J
K
L
M
N 0
P
Q
R
BC-300
BC-300+ CCL-12
BC-300+ BSH-50
BC-300+ B S H - 5 0 + CCL-12 BC-300+ MCP-23
BC-300+ CL-22
BC-300+ BSH-50+ CL-22 BC-300+ PDP-30 MCP-37.8 CH-22.2+ CCL-5.6+ HAP-1 0 MCP-56.7+ CH-35+ CCL-16 TCP-1-300
TCP-11-300
HAP-1-300
HAP-I 1-200 HAP-ll-200+ PDP-10 HAP-ll-200+ BSH-50 MCP-37.8+ CCB-35+ TCP-10 MCP-38.7+ CCB-35+ TCP-10+ CH-15
10.40 10.36 10.36 10.40 10.36 10.36 10.40 10.36 10.36 10.40 10.36 10.36 10.40 10.36 10.36 10.40 10.36 10.36 10.40 10.36 10.36 10.00
10.00 10.00
10.32 10.52 9.96
10.23 10.33 10.31 10.29 9.40
10.32 10.52 9.96
10.23 10.52 9.96
12.04 12.04
12.54
10.23
10.23
6.53 7.31 8.51 6.53 7.31 8.51 6.53 7.31 8.51 6.53 7.31 8.51 6.53 7.31 8.51 6.53 7.31 8.51 6.53 7.31 8.51 7.30
5.23 7.36
5.05 7.26 9.01 5.58 6.59 7.62 8.56 9.47 5.05 7.26 9.01 5.05 7.26 9.01 7.53 7.53
7.60
6.20
6.20
3.59 3.48 3.79 3.05 3.50 3.55 1.58 1.82 1.98 1.32 1.36 1.86 0.52 0.54 0.57 3.25 3.48 3.69 1.17 1.51 1.64 0.86
1.93 4.24
0.71 3.72 3.63 0.46 1 .oo 1.34 1.46 2.41 1.04 0.35 0.46 0.70 1.23 2.81 3.80 0.21
0.79
0.89
1.15
65.5 66.4 63.4 70.7 66.2 65.7 84.8 82.4 80.9 87.3 86.9 82.1 95.0 94.8 94.5 68.8 66.4 64.4 88.8 85.3 84.2 91.7
80.5 58.1
93.1 64.4 63.6 95.5 90.3 87.0 85.8 74.4 89.9 96.7 95.4 93.2 88.3 71.8 68.4 98.3
93.7
91.3
88.8
0.78 3.44 2.78 0.86 0.78 0.78 1.61 2.03 0.78 1.11 1.28 2.44 11.6 9.28 8.86 0.78 0.78 0.78 3.03 1.94 1.94 13.6
1.95 2.53
4.92 13.3 14.6 0.56 0.34 0.49 2.07 0.41 22.9 6.32 3.60 11 5.4 104.8 119.2
1.17
32.8
13.4
7.69 8.01 8.1 8 7.70 7.87 8.02 7.32 7.74 7.99 7.40 7.66 7.94 6.96 7.1 1 7.30 7.73 7.98 8.14 7.26 7.70 7.92 7.55
7.27 8.22
6.85 7.68 7.27 6.70 7.47 7.89 8.05 8.75 5.68 6.91 7.34 6.79 7.37 7.71 7.97 6.63
7.62
6.79
6.95

216 HeandCao Fluoride 29 (4)
Conclusions The defluoridation efficiency of relatively insoluble calcium phosphates was
TCP (87.0%) > HAP (68.0%) > BC (66.4%) when they were used singly in a batch procedure for 24 hours under routine conditions. When optimal amounts of free phosphate were added together with BC or HAP to high-fluoride water, the re- moval of fluoride reached 95%. The BC-MCP system seems to be the best com- bination for removal of fluoride from drinking water. With 300 mg BC + 23 mg MCP per 100 mL of water, fluoride was reduced over 24 hr from 10.4 mg/L to 0.6 mg/L by coprecipitation in the pH range 6.5-8.5. Addition of calcium does not improve the defluoridation efficiency of calcium phosphate.
Acknowledgement We thank Dr Euan Pearce in the Dental Research Unit, New Zealand Health
Research Council, for providing certain reagents and for valuable suggestions. This investigation was financially supported by WHO, Western Pacific Region.
1
2
3
4
5
6
7
8
9
10
1 1
References Larsen MJ, Pearce FIJ, Jensen SJ. Defluoridation of water at high pH with use of brushite, calcium hydroxide and bone char. Journal of Dental Research 72 (1 1)
Li Pin, Li Yinka, Li Junwen et aI. Study on the mechanism and equipment of defluoridation by bone char. Paper to XXth Conference of the International Society for Fluoride Research, Beijing, China, 1994. Lambert SD, Graham NJD. Removal of nonspecific dissolved organic matter from up- land potable water supplies. 1. Adsorption. Water Research 29 (10) 2421-2426 1995. Mwaniki DL. Fluoride sorption characteristics of difference grades of bone charcoal, based on batch tests. Jinimal of Dental Research 71 (6) 1310-1315, 1992. Pearce EIF, Larsen MJ. Defluoridation of drinking water by coprecipitation with apatite. Caries Research 27 378-386 1993. Bi Huayin, Xiong Yongmin, Yi Wei et al. Experimental study on removal of fluoride fromwaterbycalciumphosphateJoumal, Xi 'anMedicalUniversi~14(1)90-92 1993. Wang Liangfang, Sun Xinzhi, Chang Ling et al. Screening studies on defluoridation reagents of coagulative precipitation in non-aluminium compounds. Chinese JoumaI of Control of Endemic Diseases 8 (Supplement) 27-3 1 1993. Li Xinyun, Lu Qiqi. (Beijing Polytechnic University). Mimufacture and use of basic calcium phosphate. Famin Zhuanli Shenqin Gongkai Shoumingshu (Patent Office of China) No. CN 1,039,567 A (CL C01B25/32) February 14 1990. Chen PS, Toribara TY, Warner H. Microdetermination of phosphorus. AnaIyticaI Chemistry 28 1756-1718 1956. He Gongli, Ji Rongdi, Zhang Yan. Mechanisms of defluoridation of drinking water by tricalcium phosphate. Proceedings of the 1st International Workshop on Fluorosis and Dejluoriidation of Water. Ngurdoto, Tanzania, November 1995. International Society for Fluoride Research, Auckland 1996. Ekstrand J, Ehmebo M. Influence of milk products on fluoride bioavailability in man. European Journal of Clinical Pharmacology 16 2 1 1-2 1 5 1979.
1519-1525 1993.
Published by the International Society for Fluoride Research Editorial Office: 81A Landscape Road, Mount Eden, Auckland 4, New Zealand

AMELIORATIVE ROLE OF AMINO ACIDS ON FLUORIDE- INDUCED ALTERATIONS IN UTERINE CARBOHYDRATE
METABOLISM IN MICE Niloufer J Chinoy* and Dhruva Pate1
Ahmedabad, India SUMMARY: The effects on female mice of sodium fluoride (NaF) administration, at a dose of 5 mglkg body weight for varied durations (7, 15, 30, 45 and 60 days), were investigated in order to evaluate time-related changes in uterine carbo- hydrate metabolism. The therapeutic effects of simultaneous glycine andlor glutamine administration along with NaF, for 45 and 60 days, were also investi- gated. The results revealed that the NaF was effective from the 45th day of treatment, and was much more effective after 60 days. A significant decline in body weight and uterine weight was observed. Accumulation of glycogen in the uterus with a concomitant decrease in blood glucose could be correlated with inhibition of phosphorylase activity affecting uterine carbohydrate metabolism. The serum catecholamine concentrations were significantly enhanced, possibly due to stress induced by administration of fluoride. The elevated catecholamine levels may be one of the causative factors affecting carbohydrate metabolism, and would influence the hypothalamus gonadal axis. Decreased levels of protein in serum and uterus indicated altered uterine metabolism in the presence of fluoride. Administration of the amino acids glycine and glutamine, individually and in combination, along with NaF, helped to maintain the status quo of all parameters compared with controls. The results demonstrate that the amino acids glycine and glutamine have an ameliorative effect on NaF-treated animals. Hence it is suggested that a protein rich diet could mitigate the fluoride-induced health hazards in endemic areas the world over. Key words: Blood sugar; Carbohydrate; Catecholamines; Endemic fluorosis; Glutamine;
Introduction The clinical manifestations of fluorosis due to excessive ingestion of fluoride
are fairly well-documented. This fact makes it imperative for scientists to focus on the precise toxic effects of fluoride on various soft tissues, so that therapeutic agents can be effectively used. The toxicity of fluoride compounds administered orally differs from species to species. Every phase of metabolism could be affected critically by fluoride under certain conditions.
The non-essential role of fluoride in reproduction was observed by Tao and Suttie.l However, NaF treatment of mice, rats, rabbits, and guinea pigs caused significant alterations in the structure and function of testis, internal milieu of epididymis, vas deferens, and also affected the morphology and metabolism of spermatozoa.2-11 Human spermatozoa also lost their mobility after 20 minutes incubation in vitro with 250 mM NaF.12
Glycine; Glycogen; Non-skeletal effects; Phosphorylase; Protein; Uterus.
* Professor N J Chinoy, Director, School of Sciences and Head, Zoology Department, Gujarat University, Ahmedabad 380009, India.

218 Chinoy and Patel Fluoride 29 (4)
An epidemiological study of gynaecological problems in female workers in an organic fluorine chemistry plant showed direct evidence of fluoride effects on human pregnancies.13 Another report described decreased breeding efficiency when cows drank water containing over 5 ppm f l~0r ide . l~ Administration of 150- 300 mg F-/kg body weight blocked gonadotropin stimulation of rabbit 0 ~ a r y . l ~ The claim of Messer ef a116 that fluoride was essential for normal reproductive functions has been shown by Tao and Suttie’ to be incorrect. Reports from our laboratory17.18 have elucidated alterations in carbohydrate and oxidative meta- bolism, and altered functions of some vital and reproductive organs of the body, in NaF-treated female mice.
From the above conflicting data it is evident that, although F- may be essential for some physiological processes, sound evidence for its exact role in female reproduction is still lacking. The literature shows some sex and other variation in the extent of fluoride toxicity in human populations in endemic areas. The present study was an attempt to evaluate fluoride toxicity in female mice with special reference to uterine carbohydrate metabolism, and the possible role of amino acids (glycine and glutamine) in the amelioration of fluoride-induced toxicity, in the light of earlier data.
Materials and Methods Animals: Healthy, adult female mice (Mus musculus) of Swiss strain, weighing
between 25 and 35 gm obtained from the National Institute of Occupational Health (Ahmedabad) were used for the experiment. They were maintained on standard chow and water was given ad libitum. Thex were housed in an air conditioned animal house at a temperature of 26+2 C and exposed to 10 to 12 h of daylight.
Exposures: The experimental protocol is presented in Table 1. The animals were divided into five major groups. The first group of animals was provided standard diet and water.
All chemicals were dissolved in double distilled water. Sodium fluoride (Loba Chemie, Bombay, 99% purity) was administered (Group 11) orally to mice at a dose of 5 mg/kg body weight for 7, 15, 30, 45, and 60 days using a feeding tube attached to a hypodermic syringe. The dose of NaF was selected based on the LD, value of fluoride, i.e. 51.6 mg F-/kg body weight in female mice.2~3e19 Oral administration was preferred in view of water being the main source of fluoride among the human population in endemic areas.
As shown in the experimental protocol Table, to groups 111, IV and V animals, amino acids glycine (Loba Chemie, Bombay, purity 99.8%) and glutamine (Sisco Research Laboratories, Bombay, purity 99%) were administered each at a dose of 1 mg/animal/day alone and in combination along with NaF for 45 and 60 days to study any ameliorative/therapeutic effects. The dosages of glycine and glutamine were selected based on earlier work by Suttie et aL20

November 1996 Hrneiiorative i w i e UI aiiiiiiu O ~ I U ~ 1 u
TABLE 1. Experimental protocol Day of No. of animals autopsy used
with treated
Group Treatment and Dose Duration (days)
I Control, untreated Sacrificed 20
NaF (5 mg’kg body 7,15,30,45,60 8,16,31,46,61 20 Wmiceldavl I 1
- I
111 A,B NaF (as in Group II) + 45,60 46,61 20
IV A,B NaF (as in Group 11) + 45,60 46,61 20
glycine (1 mg/animal/day)
glutamine (1 mg/animal/day)
V A,B NaF (as in Group I I ) + 45,60 46,61 20 glycine + glutamine (dose same as in Group Ill and Iv)
Data collection: The control and treated groups of animals were weighed and sacrificed by cervical dislocation. The uterus was dissected out carefully, blotted free of blood, weighed on a torsion balance to the nearest milligram and used for carrying out biochemical tests as follows:
Biochemical Study: Protein of uterus and serum of control and all treated animals was estimated
by the method of Lowry et a1 21 at 540 nm on a Spectronic-88 Bausch and Lomb Spectrophotometer. Protein was expressed as mg/ 100 mg fresh tissue weight.
Phosphorylase activity in uterus of control and treated mice was assayed by the method of Con et a122 and the inorganic phosphate formed by the method of Fiske and Subba Row.23 The enzyme activity was expressed as pg phosphorus released/mg protein/ 15 minutes.
Glycogen concentrations in the uterus of control and treated mice was esti- mated by the method of Seifter et ~ ~ 1 . 2 ~ Glycogen is precipitated and converted to glucose which gives a green colour on boiling with anthrone reagent. The intensity of the green colour was measured on % transmittance scale. The levels were expressed as pg glycogen/100 mg fresh tissue weight.
Blood glucose levels in the normal and treated mice were estimated25 and expressed as mg glucose/100 mL blood.
Serum catecholamines (epinephrine and nor-epinephrine) concentrations in control and treated mice were determined by the method of Von Euler and Hamberg 26 and expressed as pg epinephrine or pg nor-epinephrine.
Statistical analysis: A minimum of 8-10 replicates for each assay were analysed and the data were subjected to Factorial Analysis of Variance (ANOVA) followed by Scheff ’s test.

220 Chinoy and Patel Fluoride 29 (4)
Results NaF administration at a dose of 5 mg/kg body weight for a duration of 7, 15, and
30 days did not reveal any marked alterations in all the parameters studied. Body weight of the NaF treated group of animals was decreased after 45 and 60
days of treatment. However, in groups administered amino acids alone and in combination, the body weight was almost normal (Table 2).
Organ weight (uterus) showed no change after NaF treatment for 45 days, but after 60 days decreased, compared to control, and on administration of glycine and/or glutamine (Groups UI, IV, and V) was within the normal range (Table 2).
Protein levels in uterus and serum, after 45 and 60 days of NaF treatment, declined significantly (p c 0.001) in group 11; increased uniformly in groups I11 (NaF + glycine) and IV (NaF + glutamine) compared to those of group 11, and in Group V (NaF + glycine + glutamine) were significantly increased and almost the same as in control mice (Table 3).
Phosphorylase activity in the uterus declined significantly (p < 0.001) after 45 and 60 days of NaF treatment, was significantly increased with NaF + glycine and/or glutamine, and was most effectively restored to normal levels when amino acids in combination with NaF were administered (Table 4).
Glycogen concentrations in the uterus accumulated significantly (p < 0.001) after NaF treatment (45 and 60 days), were significantly lower in Group I11 and IV (glycine or glutamine with NaF), almost the same as in the control. The decline was more pronounced and almost to normal level in Group V after 60 days feeding of glycine and glutamine in combination with NaF (Table 5).
Blood glucose levels were significantly lowered by NaF treatment, but after administration of glycine or glutamine were similar to control (Table 6).
Catecholamine serum levels (epinephrine and nor-epinephrine) were signifi- cantly increased after 45 and 60 days NaF treatment, but were the same as in control mice after administration of glycine and/or glutamine with NaF (Table 7).
TABLE 2. Body weights (gm) and organ weights (mg) of control and treated mice ~~
Duration of treatment (days)
7 15 30 45 60 Groups Parameter
I (Control, Organ wt. 180 f 4.6 186 f 6.3 untreated) Body wt. 34 f 1.0 32 f 0.9
1 1 (NaF) Organ wt. 182 f 3.9 190 f 6.9 162 f 2.9 142 f 4.3 140 * 6.9 Bodv wt. 32 f 1.2 32 f 1 .1 3 0 f l . O 2 5 i 1 . 0 2 5 i 0 . 9
I l l (NaF + Organ wt. 178 f 6.8 192 i 6 . 2 glycine) Body wt. 3 0 i 1 . 0 3 2 f 1 . 3
IV (NaF + Organ wt. 172 f 7.2 188 f 8.9 glutamine) Body wt. 30 f 0.6 32 f 0.9
V (NaF + Organ wt. 186 f 3.1 1 9 6 f 2.9 glycine + Body wt. 32 f 1.0 35 i 1.2 glutamine)
Values are Mean f S.E.

November 1996 Ameliorative role of amino acids 221
TABLE 3A. Protein levels (mg/l00 mg fresh tissue weight) in uterus and serum of control and treated groups
Duration of treatment (days) Groups Tissue 7 15 30 45 60 I (Control, Serum 30.46i 1.31 30.57 i 1.32 untreated) Uterus 14.04 i I .67 14.04 i 1.69
1 1 (Nag Serum 29.46i1.01 28.55i1.36 27.83i1.29 22.45i1.62 21.05i2.42 Uterus 13.54i1.51 14.25i2.27 12.96i1.25 9.09f2.01 9.26i2.21
Ill (NaF + Serum 29.11 i1.20 29.11 i3.20 glycine) Uterus 13.67 f 3.60 13.44 f 3.30
IV(NaF+ Serum 29.35i1.60 30.19i1.90 glutamine) Uterus 13.32i3.20 13.99 i3.10
V(NaF+ Serum 30.52 f 1.02 31.32i 1.31 glycine + Uterus 13.60 i I .03 14.03 i 1.24 glutamine)
Values are Mean f S.E.
TABLE 38. Uterine and serum protein ANOVA ~ ~
Source of variation ss DF MS F(Ca1) F(Tab) P value
Uterus: Between samples 119.38 11 10.85 10.24 2.0 < 0.001 Within samples 38.16 3 1.06 Serum: Between samples 308.74 11 28.07 22.08 2.0 < 0.001 Within samples 30.51 3 1.27
SS sum of squares DF degree of freedom MS mean of squares
TABLE 4A. Phosphorylase activity (pg/mg proteinll5 minutes) in uterus of control and treated groups of mice
Groups Duration of treatment (days)
7 15 30 45 60 I (Control, untreated) 3.89 f 0.84 4.07 i 0.52 II (NaF) 4.01 i 0.96 4.40 f 0.72 3.77 f 0.61 2.56 f 0.56 2.25 i 0.79 111 (NaF + glycine) 3.66 i 0.75 3.88 i 0.82 IV (NaF + glutamine) 3.87 i 0.63 4.09 i 0.23 V (NaF + glycine 4.50 i 0.71 4.08 f 0.45
+ glutamine)
Values are Mean i S.E.
TABLE 48. Uterine phosphorylase ANOVA
Source of variation ss DF MS F(Cal) F(Tab) P value
Between samples 25.70 11 2.34 11.33 2.0 < 0.001 Within samples 7.42 3 0.21
SS sum of squares DF degree of freedom MS mean of squares

222 Chinoy and Patel Fluoride 29 (4)
TABLE 5A. Glycogen concentrations (pg/IOO mg fresh tissue weight) in uterus of control and treated groups of mice
~ ~~~
Duration of treatment (days) Groups 7 15 30 45 60
I (Control, untreated) 155 f 10.2 143 f 9.8 I I (NaF) 142f8.7 160f11.3 204f2.6 236f20 281 f10.9 I l l (NaF + glycine) 210 f 18.2 167 f 7.6
IV (NaF + glutamine) 133 f 16.1 164 f 14.2 V (NaF + glycine 169 f 7.9 156 f 8.2
+ glutamine)
Values are Mean f S.E.
TABLE 58. Uterine glycogen ANOVA
Source of variation SS DF MS F(Cal) F(Tab) P value
Between samples 61912.78 11 5628.43 21.13 2.0 c 0.001 Within samples 9591.50 3 266.43
SS sum of squares DF degree of freedom MS mean of squares
TABLE 6A. Blood glucose levels (mg/l00 mL) in control and treated groups of mice Duration of treatment (days)
Groups 7 15 30 45 60
I (Control, untreated) 107 f 2.3 110f2.7 II (NaF) 108 f 3.6 106 f 3.0 99 f 4.0 77 f 2.6 68f2.4 Ill (NaF + glycine) 96 f 1.9 107f3.4 IV (NaF + glutamine) 99 f 1 .O 105f2.1 V (NaF + glycine 104 f 4.2 107f5.1
+ alutamine)
Values are Mean f S.E.
TABLE 6B. Blood glucose ANOVA Source of variation SS DF MS F(Cal) F(Tab) P value
Between samples 8205.23 11 745.93 9.55 2.0 . c 0.001 Within samples 281 1.25 3 78.09
SS sum of squares DF degree of freedom MS mean of squares

November 1996 Ameliorative role of amino acids 223
TABLE 7A. Serum catecholamine levels (Hg) in control and treated groups of mice
Duration of treatment (days)
Groups Parameter 7 15 30 45 60 I (Control, Epinephrine 68.25 f 2.6 69.76k2.4 untreated) Norepinephrine 54.75 32.1 55.82k3.9
I1 (NaF) Epinephrine 66.50k4.2 69.00k3.9 91 50k4.6 127.5022.9 158.00k6.9 Norepinephrine 59.70k4.1 63.50k4.2 72.50k5.9 125.60k8.2 133.75k4.6
111 (NaF+ Epinephrine 86.00k6.5 79.00k5.2 glycine) Norepinephrine - 66.70k6.4 80.75k4.2 IV (NaF+ Epinephrine 91.25k3.9 84.00k3.2 glutamine) Norepinephrine - 62.70 f3.6 54.00 k2.1 V (NaF + Epinephrine 82.75 k4.4 78.00 k4.6 glycine+ Norepinephrine - . 53.00k3.6 61.00k3.9 glutamine)
Values are Mean f S.E.
TABLE 78. Serum catecholamines ANOVA ~
Source of variation ss DF MS F(Ca1) F( Ta b) P value ~~~~~~~~ ~~ ~~~~~~ ~
EDineDhrine
Within samples 3132.44 3 87.01 Between samples 31832.06 1 1 2893.82 33.26 2.0 < 0.001
NOr-eDineDhnne Between samples 27805.04 1 1 2527.73 7.75 2.0 < 0.001 Within samDles 7829.30 3 326.22 SS sum of squares DF degree of freedom MS mean of squares
Discussion The aim of the present study was to investigate the effects of NaF and the
possible ameliorative role of glycine and/or glutamine on uterine carbohydrate metabolism, in the light of earlier data.
The results revealed that a low dose of NaF (5 mg/kg body weight) for periods of 7, 15, and 30 days did not produce any significant alterations in the total body weight, uterine weight, uterine glycogen, phosphorylase, serum catecholamines, blood glucose, and protein levels in serum and uterus.
Shashi et al found significant decline in acidic, basic, and total proteins in rabbits treated with NaF for 100 days.27 A decline in protein levels occurred in various soft tissues of rodents treated with different doses of NaF after 30 to 70 day~ .~ - ’ l$ ’~ The results of the present study corroborate the above data as a signifi- cant decline in the levels of total proteins in uterus and serum was obtained after

224 Chinoy and Patel Fluoride 29 (4)
45 and 60 days of treatment which was probably a reflection of changes in metabolism. However, testicular and epididymal protein profile of rats showed induction of some new proteins after fluoride treatment which were not present in the control animals.11 The decline observed in protein levels of uterus would affect the activities of its various enzymes therein as well as elsewhere in the body and may also affect the growth of the animal as observed in the present study. Similar results were found in rats and mice.28
Significant changes occurred in carbohydrate metabolism after fluoride inges- tion. Fluoride is known as an inhibitor of glycolysis either by enolase mediated inhibition20 or a decrease in isocitrate dehydrogenase. The present study revealed marked alteration in the glycolytic pathway with a significant accumulation in the levels of uterine glycogen which might be due to the decrease in glycogen turn- over.29 Similar enhancement in glycogen was reported in different soft tissues including reproductive tissues of rats and mi~e.5-10~17.~~ The increase in glycogen might also be related to the decrease in the activity of phosphorylase in the uterus of NaF treated mice. This might be the main causative factor which led to the accumulation of glycogen in the uterus as also reported earlier for other t i s ~ u e s . l ~ - ~ ~
Catecholamines are known to regulate the carbohydrate metabolism. Epineph- rine accelerates the breakdown of glycogen to glucose. The serum of fluoride- treated mice showed an enhancement in the levels of epinephrine and nor- epinephrine, which was also reported by Cheon and Distefano 30 and Chinoy and Narayana31. This increase could be attributed to increased catecholamine synthesis due to stress caused by fluoride intake. The enhanced catecholamine levels would have a stimulatory action on the sympathetic nervous system and might influence the hypothalamo-gonadal axis. However, the increased epinephrine level failed to accelerate the glycogen breakdown in uterus suggesting a probable alteration in hormone receptor interaction. Therefore, it is necessary to carry out receptor-level studies on fluoride-treated animals to find out the exact site of fluoride action.
As a result of decreased glycogen breakdown a significant decline was ob- served in the blood glucose levels of fluorotic mice which is similar to that reported earlier in chicks and
The present study thus shows that NaF brought about alterations in uterine carbohydrate metabolism. Since the structure and metabolism of the uterus is maintained by priming of estrogen and action of progesterone, it is necessary to study the levels of these hormones in the future.
The study also makes clear that supplementation of amino acids (glycine and/or glutamine) manifested amelioration in all NaF induced effects, which was more pronounced when their administration was combined.
Suttie er al reported that addition of various amino acids to the growth media in concentrations in excess of those present in the media, enhanced the growth of treated cells.2O Glycine and glutamine were found to be the most potent among them. Glycine acts as a conjugating agent to render toxic metabolites or chemicals more soluble and thus facilitates their excretion. Studies on fluoride levels in urine

are called for in the future. The conversion of glyoxylate to glycine by transamina- tion has been demonstrated in several systems34 which could be correlated with the amelioration of F- induced toxicity.
Glutamine is needed for the growth of mammalian cells in tissue culture in concentrations considerably higher than other amino acids.34
The present study supports epidemiological and experimental studies which have shown that dietary factors such as proteins, amino acids and vitamins could modify the toxic effects of fluoride. Hence, a protein supplemented diet would be beneficial while a protein deficient diet would aggravate fluoride toxicity. This aspect merits further detailed investigation, which is being undertaken at the present time.
Acknowledgements Part of the research work was supported by financial assistance of the Univer-
sity Grants Commission, New Delhi, under the Departmental Special Assistance Programme to the Department of Zoology.
References 1 Tao S, Suttie JW. Evidence for lack of an effect of dietary fluoride level on
reproduction in mice. Jounuzl of Nutrition 106 1 1 15-1 121 1976. 2 Chinoy NJ. Effects of fluoride on physiology of some animals and human beings.
Indian Journal of Environmental Toxicology I (1) 1 7-32 199 1 . 3 Chinoy NJ. Effects of fluoride on some organs of rats and their reversal. Pro-
ceedings of the Zoological Society, Calcutta 44 (1) 1 1 - 1 5. 199 1 . 4 Chinoy NJ, Sequeira E. Effects of fluoride on the histoarchitecture of reproductive
organs of male mouse. Reproductive Toxicology 33 (4) 261-268 1989. 5 Chinoy NJ, Sequeira E. Fluoride induced biochemical changes in reproductive
organs of male mice. Fluoride 22 ( 2 ) 78-85 1989, 6 Chinoy NJ, Sequeira E. Reversible fluoride induced fertility impairment in male
mice. Fluoride 25 (2) 71-76 1992. 7 Narayana MV, Chinoy NJ. Effects of fluoride on rat testicular steroidogenesis
Fluoride 27 (1) 7-12 1994. 8 Narayana MV, Chinoy NJ. Reversible effect of sodium fluoride ingestion in
spermatozoa of rat. Internatiotial Journal of Fertility 39 (6) 337-346 1994. 9 Chinoy NJ, Sequeira E, Narayana MV. Effects of vitamin C and calcium on the
reversibility of fluoride induced alterations in spermatozoa of rabbit. Fluoride 24 (1)
10 Chinoy NJ, Reddy VVPC, Michael M. Beneficial effects of ascorbic acid and cal- cium on the reproductive finctions of sodium fluoride treated prepubertal male rats. Fluoride 27 (2) 71-79 1994.
1 1 Chinoy NJ, Narayana MV, Dalal V et a/. Amelioration of fluoride toxicity in some accessory reproductive glands and spermatozoa of rat. Fluoride 28 (2) 75-86 1995.
12 Chinoy NJ, Narayana MV. In virro fluoride toxicity in human spermatozoa. Repro- ductive Toxicology 8 (2) 155- 159 1994.
13 Zhang ZY, Zhang GZ, Liu XI et al. Effects of organic fluorine exposure on the reproductive finction of female workers and the development of their offspring (XIXth ISFR Conference abstract). Fluoride 26 (3) 223-224 1993. Rensberg SWJ, Vos MH. Influence of excess of fluorine intake in the drinking water on the reproductive efficiency in bovines. Joumalof Veterinary Science 33 185-1 88 1996.
29-39 1991.
14

226 Chinoy and Patel Fluoride 29 (4) November 1996
15 Guercio F, Cazzola D. The mechanism of action of several hypophyseal hormones: influence of several poisons and of pancreatectomy on the gonadotropic and thyro- tropic hormones. Archives of Science and Biology 2 7 405-4 13 194 1 .
16 Messer HH, Armstrong WD, Singer L. Essentiality and hnction of fluoride. In: Hoekstra WG, Suttie JW, Ganther HE, Mertz W (Eds). Trace Element Metabolism in Animals. University Park Press, Baltimore 1974 pp 425-437.
17 Chinoy NJ, Walimbe AS, Vyas HA, Mangala P. Transient and reversible fluoride toxicity in some soft tissues of female mice. Fluoride 27 (4) 205-2 I4 1994.
18 Dhruva P, Milind VS, Narayana M V , Cbinoy NJ. Effects of sodium fluoride on physiology of female mice. and its reversal. Proceedings of the Academy of Environ- mental Biology 3 ( 2 ) 197-205 1994.
19 Pillai KS, Mathai AT, Deshmukh PB. Effect of subacute dosage of fluoride on male mice. Toxicology Letters 44 21-29 1988.
20 Suttie JW, Drescher MP, Quissell DO, Young KL. Effects of fluoride on the meta- bolism of cultured cells. In: Hoekstra WG, Suttie JW, Ganther HE, Mertz W (Eds). Trace Element Metabolism in Animals. University Park Press, Baltimore I974 pp
21 Lowry OH, Rosenbrough NJ, Farr AL, Randall RJ. Protein measurement with folin phenol reagent. Joiinial of Biochemistry 193 265-275 195 1 .
22 Con CF, Con GT, Green A. Crystalline muscle phosphorylase kinetics. Jozrmd of Biological Chemistry 151 39-55 1943.
23 Fiske CH, Subba Row Y. The colorimetric determination of phosphorus. Journal of Biologrcal Chemisoy 66 375-400 1925.
24 Seifter S, Dayton S , Novic B, Muntwyler E. The estimation of glycogen with the anthrone reagent. Archives of Biochemistry 25 19 1-200 1950.
25 Oser BL (Ed). Hawks Phy.siologicaZ Chemistry. 14th Edition. Tata McGraw Hill, Bombay and New Delhi 1965 pp 1054- 1055.
26 Von Euler Hamberg. In: Oser BL (Ed). Hawks Phy.siologicaZ Chemisny. 14th Edition. Tata McGraw Hill, Bombay 1949 pp 302-303.
27 Shashi A, Thapal SP, Singh JP. Effect of fluoride administration on organs of gastrointestinal tract. An experimental study on rabbits: effect on tissue proteins. Fluoride 20 (3) 183-188 1987.
28 Saralakumari D, Varadacharyulu N Ch, Ramakrishna Rao P. Effect of fluoride toxicity on growth and lipids in liver, kidney and serum in rats, Arogya, Journal of Health Science I4 24-29 1988.
29 Dousset JC. Rioufol C. Philibert C. Bourbon P. Effects of inhaled HF on cholesterol.
327-337.
carbohydrate and tricarboxylic acid metabolism in guinea pigs. FItroride 20 (3) 137: 141 1987.
30 Cheon YS, Distefano V. Effect of sodium fluoride on catecholamine concentrations in tissues from developing rats. Toxicology andAppliedPharmacoIogy 24 468-473 1973.
31 Chinoy NJ, Narayana M V . Studies on fluorosis in Mehsana District of North Gujarat. Proceedings ofthe Zoological SocieQ, Calcutta 4.5 (2) 157-161 1992.
32 Pillai KS, Mane UH. Effect of airborne fluoride on some haematological parameters of chick. Birlletin of Environmental Contamination and Toxicology 35 570-576 1985.
33 Bennis A, Kessabi M, Hamlin A, de La Farge F, Braun JP. Plasma biochemistry of adult goats with chronic fluoride poisoning in Morocco. Fliioride 26 (4) 241-246 1993.
34 Meister Alton. Intermediary metabolism of the amino acid. In: Biochemistry of the Amino Acids. Second Edition. Academic Press, New York 1965.
Published by the International Society for Fluoride Research Editorial Office: 81A Landscape Road, Mount Eden, Auckland 4, New Zealand

Fluoride Vol. 29 No. 4 227-229 1996 Book Review 227
OUR STOLEN FUTURE : Are we threatening our FeffiMy, Intelligence, and Survival? - A Scientific Detective Story, by The0 Colbom,
Dianne Dumanoski, and John Peterson Myers (Dutton, Penguin Books, 375 Hudson St, New York NY 10014, USA. xii + 306 pp U S $24.95)
Reviewed by Richard G Foulkes BA MD
Opening, as it does, with a compelling Foreword by US Vice-president A1 Gore, this book is obviously intended to provoke more than casual notice. Its three authors, environmental zoologists The0 Colburn and John Peterson Myers, and science journalist Dianne Dumanoski, are well qualified by education and experi- ence to write such an extremely timely and thought-provoking book that is far more that just “a scientific detective story”.
Although written with the general reader in mind, the book is also vitally important for scientists, since it encompasses an enormous amount of well-docu- mented information with an excellent index. It is a book that traces many unfore- seen and highly disturbing effects of the widespread use and global distribution of certain modem synthetic chemicals which, even in exceedingly small amounts, can seriously disrupt and impair normal hormone function. Hormones, as we know, are the vital chemical messengers in our bodies that orchestrate crucial stages of growth and development, from features of sexual differentiation to brain organiza- tion and maturation.
These synthetic chemicals include such familiar ones as chlordane, 2,4-D + 2,4,5-T (“Agent Orange”), DDT and DDE, diethylstilbestrol (DES), dioxins (especially 2,3,7,8-TCDD), and polychlorinated biphenyls (PCBs), plus less familiar ones like dieldrin, furans, lindane, pyrimidine carbinols, and vinclozolin. At relatively low levels of contamination, most of these chemicals have no observable effects on adults, but they can have devastating consequences to the unborn. In animals they cause disorientation of nesting and mating, and in humans they have been linked to low sperm counts and learning and behavioral disorders.
A prime example of what the authors call these synthetic “hand-me-down poisons” is diethylstilbestrol (DES), whose tragic consequences have “toppled the notion that birth defects have to be immediate and visible to be important.” Long prescribed with the mistaken idea that it would help prevent miscarriages, maternal exposure to DES at critical stages in pregnancy has been found to cause severe deformities and cancer in the reproductive tract of female offspring as well as other long-term after effects in males as well as females.
The authors also recount how the DES story illustrates how dangerous it is to overlook implications of earlier animal studies. Laboratory investigations at North- western University Medical School in the 1930s showed that estrogens administered to rats during pregnancy produced offspring with “disrupted sexual development.” The female pups exposed to extra natural or synthetic estrogen in the womb suffered structural defects of the uterus, vagina, and ovaries; males had stunted
Dr Richard G Foulkes, Box 278, Abbotsford BC, Canada V2S 4N9.

228 Book Review Fluoride 29 (4)
penises and other genital deformities.” But only years later was the widely-held belief that the placenta is “an impenetrable shield protecting the developing baby from harmful outside influences” finally and forever exploded by the thalidomide tragedy that came to light in 1962, just as Rachel Carson’s conscience-shaking book Silent Spring was being serialized before publication.
Moreover, even though large-scale double-blind studies showed that DES does not prevent miscarriages, i t continued to be prescribed for this purpose for a further 20 years! The US Food and Drug Administration took no action to curb such use, even though evidence of any provable benefit was lacking. Fear of litigation also made it difficult to obtain medical records of DES usage.
A further point the authors emphasize about DES is its “inverted U or “para- doxical dose response curve” discovered by Frederick vom Saal of the University of Missouri: administering high doses to animals fails to elicit many of the effects that show up at lower doses. Equally important is that timing of the dose is usually more critical than the amount of the dose in producing adverse effects. Recog- nising this fact, the authors offer the following as the “simple prescriptive message” of the book:
“. . . we must move beyond the cancer paradigm. Until we do, it will be impossible to grapple with the challenges of hormone-disrupting chemicals and the threat they pose to the human prospect.. . We need to bring new concepts to our consideration of toxic chemicals. The assumptions about toxicity and disease that have framed our thinking for the past three decades are inappropriate and act as obstacles to understanding a different kind of damage.”
In their effort to keep the book within the grasp of the general reader, the authors make good use of several excellent line drawings that illustrate and enhance key points in the text. Thus the figure on page 72 showing receptor effects of synthetic chemicals depicts the normal process by which a natural hormone locks into a receptor to produce the expected response. This situation is contrasted to two abnormal ones: the first when a synthetic (or a natural) “estrogen-like’’ chemical mimics the actions of a normal hormone to produce a response; the other when an “anti-androgen” chemical blocks the receptor to inhibit response. An impressive illustration of biomagnification of PCBs in Lake Ontario is given on page 27, while neat drawings on pages 104-105 show how a PCB molecule can work its way from its source in Alabama to the far reaches of the Arctic Ocean to affect reproduction in polar bears.
In addressing the question posed in the book‘s subtitle, the authors do not hesitate to consider the grave social consequences of lowered fertility and intelli- gence. They argue that mankind is gambling with its ability to reproduce over the long term and that “what we fear most immediately is not extinction, but the insidious erosion of the human species ... an invisible loss of human potential.” They are deeply worried about “the power of hormone-disrupting chemicals to undermine and alter the characteristics that make us uniquely human - our behavior, intelligence, and capacity for social organisation.” They go on to paint a very dark picture of what an average IQ drop of just five points would mean for society.

November 1996 Our Stolen Future 229
The problem that this reviewer has with this book is its limited definition of the term “chemical environment”. Although the authors refer to chlorofluorocarbons (CFCs) and their destructive effect on the protective upper ozone layer, they no- where mention fluoride as a ubiquitous environmental contaminant. Much of what they write concerning adverse effects of synthetic chemicals in regard to infertility and brain dysfunction also applies to systemic fluoride. The mechanism of inter- ference may be different, but the end results are similar. As a proven enzyme in- hibitor, fluoride interferes with the timely operation of such hormones as testo- sterone by impeding its synthesis in addition to blocking its end-organ response, thereby affecting both reproductive ability and brain function.
Our Stolen Future, like Rachel Carson’s Silent Spring, is focused entirely on an “Administration-acceptable” cause of major environmental pollution and human afflictions, i.e. manufactured (synthetic) chemicals. Without question the issues raised in this book must be addressed. At the same time, one has to ask: “Is this a diversionary tactic to draw attention away from the embarrassing questions that must be asked regarding the effects of introducing fluoride into our drinking water over the past fifty years, as well as the consequences of continued fluoride pollu- tion by industries?”
In today’s climate, is it possible that a similar book about fluoride, including an endorsement by the vice president, would be published? If the US Administration is gearing up to tackle problems created by the dispersal of synthetic hormone-dis- rupting chemicals into the environment, and is endorsing Our Stolen Future to assist in making that decision, why does it not, finally, also include the introduction of fluoride into drinking water?. Now rejected by most European health authori- ties, water fluoridation has remained unjustifiably accepted as “revealed truth” by every US Administration since that of President Harry Truman.
Hopefully, publication of this book will spur a closer look at the “fluoride connection”, i.e. the possible role of ingested fluoride in decreasing fertility and impaired brain function and to shift from the kancer paradigm” to investigating possible paradoxical effects of small doses of fluoride delivered in utero to the fetus.

230 Review Article Fluoride Vol. 29 No. 4 230-236
THE FLUORIDE CONNECTION Richard G Foulkes
Abbotsford BC, Canada Fluoride and the Placental Barrier
Kaj Roholm, in his extensive investigation of fluoride intoxication in Danish cryolite workers published in 1937,’ stated that he did not think that fluoride crossed the placental barrier. This opinion was based, primarily, on his failure to see fluorosis in the deciduous teeth of offspring. However, he was convinced that sufficient fluoride was passed through the milk of contaminated female workers to cause fluorosis of the anterior permanent teeth in their children.
W R Cox, in 1953, published his personal account of multiple problems in a commercially valuable, fur-producing chinchilla ranch that were traced to the high fluoride content of commercial animal feed.2 In 1951, when the probable cause was first identified, the research physician and the chemist consulted from the University of Oregon Medical School did not hesitate to state that fluoride penetrated the placental bamer in these animals.
Fluoride and Fertility One of the major problems encountered in the chinchillas concerned fertility.
After changing to a diet low in fluoride there were increases in the number of offspring born, the number of litters, and the numbers born alive. The adult mortality rate decreased from 14.6% in 1951 to 3.3% in 1952. However, a number of abnormalities associated with the fluoride-contaminated feed were passed on through multiple generations.
It is of more than passing interest that although Cox found more than 1400 studies that demonstrated adverse effects of fluoride in animals, both wild and domestic, there was a profound lack of knowledge and interest in these findings and their implications for humans. This was especially true for possible soft tissue damage. Cox, a layman, was shocked by the fact that those professionals exhibiting this lack of knowledge and disinterest were, at that time, spearheading the campaign to fluoridate public water supplies.
Freni, in a 1994 review,3 noted decreased fertility in most animals studied. High doses (i.e. 430 ppm dietary fluoride in rats) showed anestrus with cumulative generational effects, This phenomenon, according to Freni’s research, was first noted in 1933 and confirmed in 1984.
His paper presents multiple examples that led him to state, without equivoca- tion, that fluoride “easily crosses the placenta.”
Freni participated in the 1991 US Public Health Service review of the toxicity of fluoride4 and in the National Toxicology Program study that emphasised the “cancer paradigm” discussed in Our Stolen Future5*. He was concerned about the implications of reproductive problems that were encountered. As a result, in 1991 he searched for reproductive studies that involved humans, but he found none.
Dr R G Foulkes, Box 278, Abbotsford BC, Canada V2S 4N9. Reviewed on pages 227-229.

November 1996 The fluoride connection 231
It may come as a surprise that, after 46 years of fluoridation of drinking water, no appropriate study had taken place on the effect of fluoride on the developing fetus or on the possible effect on human fertility.
Freni, in a complicated study, compared the total fertility rate (TFR) in US counties having at least one water system with 3 ppm or more fluoride. He found a negative TFR/fluoride association that fitted the toxicity data on animals. He presented several theories to account for the lowered TFFt one, that fluoride lowers protein synthesis in osteoblasts; the other, that fluoride inhibits the adenylyl cyclase system in human spermatozoa.
Narayana and Chinoy referred in a 1994 paper6 to “the wide prevalence of infertility in the fluorosis-afflicted human population in India and other parts of the globe.” In their study, mature rats were treated with sodium fluoride (10 mg/kg daily for 50 days). They found that fluoride interferes with androgenesis and adversely impaired the target organ structures. They suggested that the effect of fluoride may be on receptor sites, i.e. that fluoride may alter the concentration or configuration of the receptor, thereby inhibiting the action of testosterone. The similarity of this action to that of the hormone-disrupting chemicals, described in Our Stolen Future, is obvious.
Fluoride and the Brain The 1991 review Fluoride Benefits and Risks, published by the USPHS,4 states
that there is “relative impermeability of the blood-brain barrier to fluoride.” No reference was made to studies concerning fluoride effects on the brain.
In their 1978 book Fluoridation, the Great Dilemma, Waldbott, Burgstahler and McKinney7 describe the findings of Soviet physicians that 79% of patients with occupational fluorosis demonstrate “dysfunction of subcortical axial non- specific structures of the brain.”
Recent studies from China8s9 on the relationship between residence in endemic fluorosis areas in that country and IQ contain references and discussions dating to the 1980s. These Chinese studies indicate that the influence of a high fluoride environment on intelligence may occur early in development such as during the stages of embryonic life or infancy when differentiation and growth are more rapid. Ultramicroscopic study of embryonic brain tissue obtained from termination of pregnancy operations in endemic fluorosis areas showed “differentiation of brain nerve cells was poor, and brain development was de l a~ed .”~
The studies of Li et a18 (coal soot fluorosis) and Zhao et a19 (water supply fluorosis) compare the IQ status of children living in high-fluoride areas with that of children in low-fluoride areas whose mothers also resided in the same areas during gestation. A graph constructed from Li’s data shows, in the high fluoride population, a flattening of the normal “Bell Curve” distribution of the IQ and a shift of the curve toward the low IQ (< 70 IQ) end compared to those in the low fluoride population (Figure 1). Data from Zhao’s study shows the same IQ shift (Figure 3). Both studies demonstrate that IQ is lower in all age groups in the high- fluoride population compared to the low-fluoride population (Figures 2 and 4). This finding suggests neurological damage in early development, i.e. in utero.

232 Foulkes Fluoride Vol. 29 No. 4
60
50
40
30
Severe fluorosis area 0
Non-fluorosis area 0
/ / \ \ / ' 1 0 1 / \\
I I
I
MeanlQ 70 75 80 90 95 1 0 0 105 1 1 0 1 1 5 1 2 0 1 2 5 130+
FIGURE 1. Distribution of child IQ scores [Li XS et a/. Nuofide 28 (4) 189-192 1995 Table 31 Note: In the 'severe and medium' fluorosis areas high-fluoride coal is used as a domestic fuel for cooking. heating and drying grain. In the "slight or no" fluorosis areas there is no such custom. Dean DF Index was 3.2 in the 'severe. area and ~ 0 . 4 in the non-fluorosis area. From 230 to 224 children were studied in each area.
IQ 1 2 0
1 1 5
1 1 0
105
95
90
85
80
Severe fluorosis area 0
Non-fluorosis area 0
Age(yfi) 7 5 70 I 7 8 9 1 0 11 1 2 1 3 1 4
FIGURE 2. IQ of children of different ages in areas with high and low fluoride exposure [ Li XS et a/. Fluoride 28 (4) 189-1 92 1995 Table 41

November 1996
60
50
40
The fluoride connection 233
Severe fluorosis area
A
Mean IQ 70 75 8
. \ Non-fluorosis area 0
~~~
0 90 95 1 0 0 1 0 5 1 1 0 1 1 5 1 2 0 1 2 5 130+
FIGURE 3. Distribution of child IQ scores [Zhao et a/. Fluoride 29 (4) 190-192 1996 Table 21 Note: Study compares two villages: Sirna with 4.12 rngFL and Xinghua with 0.91 rngFlL in their water supplies.
IQ 1 2 0
1 1 5
110
1 0 5
100
95
50
85
80
75
High water fluoride (4.12 mglL) area
Low water fluoride (0.91 mglL) area 0
7 0 I Age (YE) 7 8 9 10 11 1 2 1 3 1 4
FIGURE 4. IQ of children of different ages in areas with high and low fluoride exposure [ Zhao et a/. Fluoride 29 (4) 190-1 92 1996 Table 31

234 Foulkes Fluoride Vol. 29 No. 4
Other causes of lowered IQ appear to have been ruled out. These include: iodine deficiency; other congenital and acquired diseases; and cultural and ethnic differences. Dietary differences, which are known to play an important role in dental and skeletal fluorosis, were not specifically accounted for, although the authors mention “similar circumstances of material life.”
These studies present evidence that, as with infertility, brain dysfunction is prevalent in endemic fluorosis areas in countries outside those that practise deliberate fluoridation of drinking water. But when the rising prevalence of dental fluorosis and the high dietary intakes of fluoride in fluoridated areas are considered, it may be said that large areas of endemic fluorosis have now been created in Canada, the US, and other fluoridated countries pursuant to the policies of their respective governments. How much responsibility can be attributed to fluoride for the infertility and behavioral problems addressed by the authors of Our Stolen Future?
Are fluoridated countries seriously looking for possible associations?. It has already been noted that appropriate research into the association between fluoride and human reproductive problems was not undertaken until 1991, 46 years after the start of fluoridation. What is the status with regard to possible links with the signs and symptoms of brain dysfunction?
In 1995, the 50th anniversary of fluoridation in the US and Canada, Mullenix et a1 published a study of the neurotoxicity of sodium fluoride in rats.1° They state “This is the first laboratory study to demonstrate that CNS functional output is vulnerable to fluoride, that the effects on behavior depend on the age at exposure and that fluoride accumulates in brain tissue.” The authors state further the “Experience with other developmental neurotoxins prompts expectations that changes in behavioral function will be comparable across species, especially humans and rats.”
This study demonstrated generic behavioral pattern disruption that the authors point to as indicative of a potential for motor dysfunction, IQ deficits, and learning disabilities in humans. They also note that the plasma fluoride levels (0.059 to 0.640 ppm) in their rat model are similar to those reported in humans exposed to high levels of fluoride. In addition, they cite early Chinese studies and point out that high levels of fluoride in drinking water (i.e. 3 to 11 ppm) affect the nervous system directly without first causing physical deformities from skeletal fluorosis, currently used as the ultimate indicator of fluoride intoxication in discussions by proponents of fluoridation.
“Still unexplained,” Mullenix et a1 continue, “is the possibility that fluoride exposure is linked to subtle brain dysfunction.”
The characteristics of the latter and the implications for society are well described in Our Stolen Future, even though the causative agents named there are the hormone-disrupting chemicals.

November 1996 The fluoride connection 235
Fluoride and “the Paradoxical Effect“ As already noted, Our Stolen Future emphasises the importance of the
“paradoxical effect” in establishing the biological effects of toxins and, more particularly, the hormone-disrupting artificial chemicals. The authors credit Frederick vom Saal‘s investigations, which began in 1976, with the demonstration of a “U-shaped response curve for DES. This illustrates the “paradoxical response”; that is, the response increases for a time and then diminishes with even higher doses.
This phenomenon, in which a high dose may paradoxically cause less damage that a lower dose, was described in a 1964 article by Schatz, Schalscha and Schatz.” These authors showed that paradoxical effects are not isolated phenomena but are broadly operative and of widespread importance in the biochemistry and physi- ology of many living systems under many different conditions.
Schatz et a1 mention the different terms that investigators have used when they encountered this phenomenon. They describe the way in which conditioning leads investigators to think only in linear dose relationships, thereby leading them to attribute deviations to experimental error or experimental variability. Their paper illustrates that paradoxical effects are real, not artifacts. In their words, “Paradoxical effects have been produced by radiation, temperature, mutagenic and carcinogenic chemicals, fluoride, steroid hormones, dextran, detergents, trace metals, herbicides, fungicides, insecticides, germicides, antibiotics, drugs, and a host of other agents.”
It is noteworthy that fluoride is included in their list of chemicals that may produce a paradoxical effect. They show, as an example, the curve of inhibition of human prostatic acid phosphatase. “As the fluoride concentration is increased over a thousand-fold range, the extent of inhibition rises, attains a maximum that may approach loo%, and subsequently falls.” In a recent paper,12 Schatz compared low- level fluoridation with low-level radiation: “The occurrence of paradoxical effects with low-level fluoridation and low-level radiation shows that there is no threshold level below which fluoride and radiation are harmless.”
Recognition of the importance of the paradoxical effect and the way in which research may be blinded by continued pursuit of the “linear dose relationship” and the “cancer paradigm” is essential if we are to determine the nature of all the elements that conspire to steal our future.
Conclusion The similarities between the DES story, so well told in Our Stolen Future, and
the story of the fluoridation of drinking water is striking. In both, numerous animal studies have been declared to be irrelevant. Both DES and fluoridation of water supplies have been shown to be without effect for the purposes claimed - the

236 Foulkes Fluoride Vol. 29 No. 4 November 1996
prevention of miscamage in the case of DES and of tooth decay in the case of fluoridation. DES continued to be prescribed for several decades after it had been discredited; fluoridation is being pushed now as hard as ever with the full support of governments, their public health services and professional organisations representing dentistry and medicine, especially pediatrics. The failure of the US Food and Drug Administration to act on DES is described in Our Stolen Future. This failure to act is repeated in the case of the human consumption of fluoride.
Is OUT future being stolen? Yes. There are many medical problems that can be attributed to the hormone-disrupting chemicals and other substances, including fluoride. Lowered fertility and increased brain dysfunction are two of these for which there is mounting evidence.
The message is clear. Action is required immediately. However, such action must be inclusive, not selective, as suggested in Our Stolen Future.
References 1 Roholm K. Fluoride Intoxication - a Clinical-Hygienic Study. HK Lewis, London
1937 p 277. 2 Cox WR. Hello Test Animals ... Chinchillas or You and Your Grandchildren. Olsen
Publishing, Milwaukee WI 1953. 3 Freni SC. Exposure to high fluoride concentrations in drinking water is associated
with decreased birth rates. Journal of Toxicology and Environmental Health 42
4 Fluoride Benejts and Risks. Department of Health and Human Services USA Public Health Service, February 1991.
5 Colborn T, Dumanoski D, Myers JP. Our Stolen Future: Are we threatening a i r fertility, intelligence, and survival? A scientific detective story. Little Brown, London 1996.
6 Narayana MV, Chinoy NJ. Effect of fluoride on rat testicular steroidogenesis. Fluoride 27 (1) 7-12 1994.
7 Waldbott GL, Burgstahler AW, McKinney HL. Fluoriciation, the Great Dilemma. Coronado Press, Lawrence KS 1978 p 161.
8 Li XS, Zhi JL, Gao RO. Effect of fluoride exposure on intelligence of children. Fluoride 28 (4) 189-192 1995.
9 Zhao LB, Liang GH, Zhang DN, Wu X R . Effect of a high fluoride water supply on children’s intelligence. Fluori& 29 (4) 190-192 1996.
10 Mullenix PJ, Denbesten PK, Schunior A, Kernan WJ. Neurotoxicity of sodium fluoride in rats. Neurotoxicology and Teratology 17 ( 2 ) 169-177 1995 (Cf Editorial: Neurotoxicity of Fluoride. Fluoride 29 (2) 57-58 1996).
11 Schatz A, Schalscha EB, Schatz V. The occurrence and importance of paradoxical concentration effects in biological systems. Compost Science 5 22-30 1964.
12 Schatz A. Low-Level Fluoridation and Low-Level Radiation - Two Case Histories of Misconduct in Science. Published by A Schatz PhD (6907 Sherman Street, Philadelphia PA 19 1 19, USA) 1996.
109-121 1994.
Published by the International Society for Fluoride Research Editorial Office: 81A Landscape Road, Mount Eden, Auckland 4, New Zealand

Fluoride Vol. 29 No. 4 237-240 1996 Review of report 237
FLUORIDE EXPOSURE AND CHILDHOOD OSTEOSARCOMA A CaSe-COntfOl study (A report by K H Gelberg, E F Fitzgerald, S Hwang and R Dubrow of the New York State Department of Health, in The American
Journal of Public Health Vol. 85 pages 1678-1683 December 1995)*
Reviewed by John R Lee MD Sebastopol CA, USA
Does fluoride increase the risk of osteosarcoma in young men? This case- control study by the New York Department of Health tested this hypothesis by comparing the estimated fluoride intake of 130 osteosarcoma victims with that of an equal number of presumed healthy sex- and age-matched surrogates. The authors report finding little difference, and concluded that fluoride does not increase the risk, and may even be protective. Differing conclusions are not uncommon in science, and especially in medical science since underlying causes are often exceedingly complex, subtle and heterogeneous. It is important, therefore, to examine this report’s results, its test design, and the assumptions on which the test and the conclusions are based.
Several lines of investigation suggest that fluoride intake increases the risk of cancer in general and, in particular, the incidence of osteosarcoma in males. As the authors admit, in vivo studies show fluoride to be mutagenic, inducing chromosome aberrations, sister chromatid exchanges, cytotoxicity, and neoplastic transformation in cultured mammalian cells. The authors also agree that fluoride accumulates primarily in bones; and that children, who are actively forming bone, have a higher uptake of fluoride into bone than adults. Further, bone in knees, ankles, shoulders, and wrists, where childhood osteosarcoma most often occurs, shows a high response to fluoride.’
In 1990, a two-year carcinogenicity study by the National Toxicology Program (NTF’) found a statistically significant, dose-related increase of osteosarcoma rates in male rats, but not in mice.* That the so-called peer review members at the time quixotically chose to call this fluoride/osteosarcoma correlation “equivocal” (as reported by the authors of this present study) does not change the facts. This same study revealed a strong correlation of fluoride intake with nasal and oral cancer and precancerous lesions in test rats and mice. A coincidental Proctor and Gamble study reported an increased incidence of cancer in rats but this was discounted later on the basis of a concomitant viral contamination in the test rodents3 Time trends for bone and joint cancer and osteosarcoma derived from the Surveillance, Epidemiology and End Results (SEER) data of the National Cancer Institute (NCI) revealed a positive association of osteosarcoma incidence and water fluoridation among males under 20 years of age.4 In 1993, an ecological study performed by the New Jersey Department of Health found a strong statistical association between fluoridation and osteosarcoma among young men? It would appear that the fluoride/osteosarcoma hypothesis is credible and convincing, if not yet “conclusive” to fluoridation proponents.
Dr John R Lee, 9620 Bodega Hwy, Sebastopol, CA 95472, USA. See Abstract on page 252. *

238 Review of report Fluoride 29 (4)
Testing for the fluoride/osteosarcoma link is a daunting prospect. Osteo- sarcoma is quite rare, the incidence being only 2.9 cases per million people in the US. Test design always follows from assumptions made. The susceptibility of a cell to be cancer-prone may stem from a variety of subtle influences. In the case of xenobiotics (petrochemical compounds such as pesticides and various plastics), it is now known that exposure during embryonic tissue differentiation is far more toxic than later in life; yet the effects show up much later in life as an increased suscepti- bility to cancer of urogenital tissues such as the vagina, cervix, ovary, or testes6
Fluoride readily crosses the placenta. Maternal fluoride intake determines whether baby’s bones are fully fluoridated or not. It is likely that fluoride intake later in life will be more toxic to the child whose bones are already fully fluoridated than to one whose bones are not so fluoridated. Thus, one might well assume that exposure to fluoride during embryo life could be a factor in developing bone cancer later in life, regardless of whatever other factors may also play a role. Oncology researchers often make the distinction between cancer initiators and cancer promoters. Whether fluoride is considered a cancer initiator or a promoter, one’s test design must include the fluoride intake by the mother prior and during the time of her pregnancy. This factor is missing in this present study.
In testing the fiuoride/osteosarcoma link, one must be able to calculate total fluoride intake at various stages of life preceding the onset of the cancer. This is more difficult than it might at first seem. In calculating total fluoride intake, the study included fluoride tablets used, mouth rinses, toothpaste used, dental treat- ments, and water fluoridation levels. Missing from this list are calculations of differences in water actually consumed based on differences in ambient tempera- ture, individual work or athletic exercise that greatly increases water consumption, and dietary habits such as processed beverages versus “plain” water. It is not difficult to understand that commercially processed beverages made from fluori- dated water are sold in unfluoridated communities. Likewise, it is not difficult to understand that some children drink more processed beverages than water from the tap. Thus, knowing the fluoride concentration of the tap water is not the same as knowing the fluoride intake from one’s drinking of fluids.
Further, it is well established that much of our US diet choices are canned or processed foods rather than fresh, unprocessed foods. Community water fluorida- tion adds fluoride not only to one’s drinking water but to foods processed with the fluoridated water. It is for this reason that processed foods of different brands can differ greatly in their fluoride content, and this difference is not recognized when making food purchase choices. It is likely that one family will routinely choose one brand while the next family always uses another brand. Estimating averages does not help since the “average” does not exist; one brand will be fluoridated and the other is not. Fluoride from processed foods comprise a major portion of one’s total

November 1996 Review of report 239
fluoride intake, often equalling or exceeding that obtained from tap water.7 This calculation, too, is missing from the fluoride exposure variables listed in this study.
In the present study, something is odd about the case subjects. While it is routinely found that osteosarcoma is more common in young men than in young women, this study’s list of 130 cases included only 42 males, or 32% of the total. Thus, the osteosarcoma cases used were not typical of the disease in question. Did the males go elsewhere for treatment? Did some male cases of osteosarcoma slip through undetected in the study’s case selection method? Did the young women with osteosarcorna drink more fluoridated beverages and less unfluoridated water than the young men? From the information given, no clue is found. The authors seem unconcerned over this discrepancy.
Finally, one must question the case-control method of the study. In the case- control method, patients with the disease in question are compared to similar appearing, same-age people without the disease. In effect, patients susceptible to osteosarcoma were selected controls, i.e. those without evident osteosarcoma. Given the rarity of osteosarcoma, and the fact that the sources of fluoride exposure are so ubiquitous, it would be no problem to find an equal group of healthy people living in the same communities and using the same toothpaste as those with osteosarcoma.
The fact that the two groups’ drinking water and toothpaste choices are the same does not invalidate the conclusion that fluoride was a factor in the develop- ment of osteosarcoma. The study’s authors apparently assume that osteosarcoma victims require higher fluoride exposure than those without the disease. An equally plausible assumption is that variable individual susceptibility exists such that equal fluoride exposure will affect only those with the requisite susceptibility. Given the rarity of the disease, this seems more probable. The susceptibility for osteosarcoma may stem from early prenatal fluoride exposure or from factors not yet known. The later occurrence of the cancer may require only the level of fluoride exposure common to fluoridated communities. If this assumption was correct, as case-control study such as this comparing only post-natal fluoride exposure between osteo- sarcoma victims and controls would find no difference.
When polio “epidemics” were common, it was clear that only a small per- centage of children in any given community developed clinically apparent polio- myelitis while well over 90% of the children showed an equal rise in polio antibodies. That is, despite equal exposure, only a few children were sufficiently susceptible to be stricken with polio. A similar scenario might well apply to the osteosarcoma problem. Since we often do not know all the factors that “cause” or “promote” a given cancer, we do not know what factors are important in selecting comparison groups. Case-control study designs are not appropriate for all illnesses and this, one might suspect, is one of them.

240 Review of report Fluoride 29 (4) November 1996
Conclusion This present study, while being used to cast doubt on the relationship of
fluoride to osteosarcoma, is flawed by: 1) disregard of prenatal fluoride exposure; 2) inadequate calculation of postnatal total fluoride intake; and 3) inappropriate choice of study design. Thus, the study carries little weight in negating ?he fluoridel osteoporosis connection or in any consideration of continuing fluoridation as a public policy.
References 1 Gelberg KH, Fitzgerald, EF, Hwang S , Dubrow R. Fluoride exposure and childhood
osteosarcoma: a case control study. American Journal of Public Health 85 1678- 1683 1995.
2 Maurer JK, Cheng MC, Boysen BG, Anderson RI. Two-year carcinogenicity study of sodium fluoride in rats. Jounml, National Cancer Institute 8 2 1 1 1 8- 1 126 1990.
3 As presented at the NTP peer review conference at Research Triangle Park, North Carolina, 1990, attended by the author.
4 Hoover RN, Devesa S S , Cantor KP, Lubin JH, Fraumeni JF Jr. Time trends for bone and joint cancers and osteosarcomas in the Surveillance, Epidemiology and End Results (SEER) Program, National Cancer Institute. In: Review of Fluoride: Benefits and Risks, Report of the Ad Hoe Committee OF? Fluoride of the Committee to Coordinate Environmental Health and Related Programs US Public Health Sewice 199 1 pp F 1 -F7.
5 Cohn PD. A brief report on the association of drinking water fluoridation and the incidence of osteosarcoma among young males. New Jersey Department of Health, Trenton NJ November 8 1992.
6 Colborn T, vom Saal FS, Soto AM. Developmental effects of endocrine-disrupting chemical in wildlife and humans. Environmental Health Perspectives I01 378-384 1993.
7 Lee JR. Optimal fluoridation - the concept and its application to municipal water fluoridation. Western Jour~ial of Medicine 122 43 1-436
Published by the International Society for Fluoride Research Editorial Office: 81A Landscape Road, Mount Eden, Auckland 4, New Zealand

riuuiiuc VUI. LJ IIU. 9 LV I - L J I 1\G5GU1blI l \ T V l T l . L-l I
METHODS OF MONITORING SMELTER EMISSION EFFECTS ON A TEMPERATE RAIN FOREST
Hubert W F Bunce Vancouver, British Colombia, Canada
SUMMARY: Environmental effects of airborne emissions including fluoride from an aluminium smelter on a coniferous temperate rain forest in North America have been monitored since establishment of the smelter in 1954. Various methods used in measuring the effects of the emissions are described, along with summaries of the results as reported elsewhere. Key words: Airborne emissions; Aluminium smelter; British Columbia; Environmental
Introduction This paper presents the methods used in a study of the effects of airborne
emissions from an aluminium smelter on the adjacent forest. The objective has been to measure, evaluate, and track the impact of the emissions on the forest year-by-year. Effects have been measured in old growth and second growth stands by using permanent sample plots. Dr Len Weinstein of the Boyce-Thompson Institute in Ithaca, New York has conducted two parts of the study, the visual impact and the gladiola survey, and he has been influential in many other aspects. The laboratory analyses have been conducted by Alcan in their environmental laboratories in Kitimat, BC and Chicoutimi, PQ. Additional commentaries have been obtained from the provincial and federal environmental and forest ministries.
The forests that surrounded the smelter when it began operation were “old growth”. They contained hemlock, cedar, balsam, spruce and cottonwood, ranging in age from 100 to 600 years. These trees were alive but their annual growth in diameter was small and almost nothing in height.
In 1954, an aluminium smeloter began opzrating on the north coast of British Columbia. It was located at 128 40’W and 54 O’N at the head of a coastal inlet in an area of dense natural old growth coniferous forest. Emissions were anticipated to contain significant quantities of fluoride. Fluoride is a known atmospheric pollutant that can have a dramatic effect on plants even at low concentration.
impacts; Monitoring methods; Temperate coniferous forest.
Methods of Monitoring A survey of the forest was made in 1953 to establish baseline levels of the
fluoride content in the foliage of the coniferous and deciduous trees. Foliage samples have been collected and assayed ever since to profile a continuous record of the quantity of fluoride in the foliage. The method of assessment is as follows: 1. Fluoride Content of Foliage
Fluoride in the smelter emissions occurs as gas and particulate and is carried by the wind into the forest. The forest vegetation absorbs fluoride through the sto- mata, the small openings in the surfaces of the leaves through which plants breathe. Inside the leaf, the fluoride dissolves in the leaf cell fluids and is camed toward the
Dr Hubert W F Bunce, Simons Reid Collins, Forest Resource Consultants, Suite 400, 11 1 Dunsmuir Street, Vancouver BC V6B 5W3 Canada.

242 Bunce Fluoride 29 (4)
edges of leaves of deciduous trees and to the tips of the needles of the conifers. When the quantity of fluoride at the point of concentration reaches a limit, specific to each species, the leaf tissue dies and blackens. It is said to be necrotic.
The quantity of fluoride that the leaf takes up is related to the quantity of fluoride in the air, the rate of gaseous exchange, and to the effect that the pollutant will have on the leaf, the plant, and its growth. This quantity may be measured by collecting foliage samples according to a standard procedure. The foliage can then be assayed for its fluoride content in the laboratory.
The uptake of fluoride by the plant from the air depends not only on the concentration of fluoride in the air but also on the level of biological activity of the plant. An actively growing plant will acquire fluoride much more rapidly in spring than a resting plant in mid-winter. Fluctuations in growth, related to the sun, cloudiness, and available moisture (i.e. rain and ground water), will also cause the rate of absorption to vary. These factors control stomata diffusion. The strength and direction of the wind in carrying the fluoride to the forest are also variables. For these reasons, the fluoride content of the foliage will vary, especially during the first part of the growing season. It is therefore preferable to collect foliage samples in September or October after the summer activity of the plant has slowed down.
Remote collections were used to identify the limits of the spread of the fume. The tree, western hemlock Tsuga heterophylla, was chosen as the standard species to sample because it is found consistently throughout the forest and is an important timber species.
The record of fluoride content of the foliage reflects a combination of the level of aluminium production at the smelter and the efficiency of the emission control devices.
The method is to collect a sample of the current year’s foliage at each of a set of standard sampling locations distributed across the fume path of the smelter. The samples are collected from all sides and levels of randomly selected trees at the sample location. The foliage is then stored in brown paper, lunch-size bags, with collector, sample number and date marked on the bag. Foliage sample size is approximately 0.5 litre. The method of chemical analysis is described elsewhere,’ and information on the method is available from the Alcan laboratory in Kitimat, BC.
The fluoride distribution in foliage is displayed as a computerized three dimen- sional terrain model (Figure 1). The fluoride content of the foliage provides the vertical “Z” axis equivalent to the elevation on a topographic map.
The fluoride values form five series of collections (Tables 1 and 2) recorded by year of collection and location: 1. Annual fall collections, 1953 onwards. 2. Permanent sample strip collections in old growth timber 1974, 1979 and 1984. 3. Permanent sample strip collections in second growth timber 1982, 1984, 1986
and 1988. 4. Various minor collections associated with lichens, etc. 1976, 1978 and 1980. 5. Special series 1987,1988.

FIGURE 1. DISTRIBUTION BY CONCENTRATION OF FLUORIDE IN HEMLOCK FOLIAGE
2. Growth and Value of Old Growth Forest A preliminary estimate of the area (fume path) thought to be affected by fluoride
was made. This was assisted by observation of the visible plume of steam from a pulp mill located to the north of the smelter and in the path of the prevailing southerly winds. The direction and persistence of the winds in the growing season were from the south 83% of the time. During the winter, cold outflow winds from the north predominate and carry the fume down the inlet. The record of the fluoride content of the foliage discussed previously added to the definition of the fume path, as did consideration of the topography and the occurrence, frequency, and health of epiphytic lichens.

244 Bunce Fluoride 29 (4)
A grid pattern, with grid lines 1.6 km apart in the north-south axis and 0.8 km apart on the east-west axis, was overlaid on the estimated area of the fume path. At all locations where a grid line intersection fell in mature "old growth" forest, a permanent sample plot was established. The 48 plots in the fume path were allocated to three strata: high, medium and low exposure. Two groups of eight plots each were located on the east side of the valley remote from the fume path. Ample growth of epiphytic lichens in this eastern area indicated very low fluoride exposure, which was confirmed by analysis of foliage samples. Standard forest mensurational data were collected, including tree species, height and diameter for each permanently marked and numbered tree. Plot conditions and vegetation detail were noted and foliage samples for analysis were collected. To accurately estimate tree diameter growth, increment cores were drilled. These cores were subjected to a measurement process using X-ray photography and a densitometer to produce a computer record of ring width (annual growth) and density. This process is described by Parker et aZ.*
Forest cover types within the fume path were assessed by conventional forest inventory procedures. Local market stumpage prices (timber market prices) were obtained for each year from 1953 for valuation estimates. These values were adjusted for inflation to constant dollar values using the implicit price indices of gross national expenditure.
The diameter increment obtained from the X-ray densitometry was used to assess the growth rates in three strata of exposure. Estimates of predicted growth against actual growth were adjusted for climate and other extraneous factors. The net reduction in yield assignable to the pollutants was thereby determined. This growth reduction, on a per hectare basis €or the permanent sample plots, was extended on an area basis using the forest inventory record and total value found according to the stumpage rates expressed in constant dollars. It was possible to adjust the growth rate reduction by comparison of the 30-year pre-1953 period with the post-smelter start up 30-year period of exposure and also with the growth rates of the control plots and those in the fume path. This two-way comparison allowed for the removal of cyclic weather patterns. An example of the net result of this methodology is given in Table 3.
These permanent plots were re-measured twice, five and ten years after their establishment. This provided a monitor on change in growth rates of the trees with changing emissions. It also provided a measure of tree mortality rates in the fume path compared to the normal rates in the control area (Table 4).
3. Growth and Value of Second Growth Forests In 1981, a study was designed for the second growth to parallel that in the old
growth. In this design, the samples consisted of randomly located one-hundred- metre long east-west lines in the second growth. Along these lines, at approximately ten-metre intervals, individual dominant sample trees were flagged, permanently numbered and measured as to height, including the previous year's height. Diameter was also recorded with other standard descriptive records. Adjacent to, but well clear of each line, a dominant tree similar to the sample trees was cut and its age determined by counting its annual growth rings. The vegetation along the

November 1996 Monitoring smelter emission ettects on torest 245
line was recorded in three, two metre by two metre (four square metre) sub-plots, one sub-plot at each end and one in the middle of the line. The vegetation in these sub-plots was recorded by species and percent of plot covered by the species in four horizontal strata: lichen and mosses, herbs, shrubs and trees. Hemlock tree foliage samples were collected for fluoride analysis. These permanent sample strips, twenty each, were located in the levels of exposure: high, medium and low, within the fume path and twenty in a remote, fluoride-free control area. This provided eighty locations with ten sample trees per location of 800 trees in total. These were re-measured at two year intervals three times following their establishment in 1982. Additional sample trees were added to provide a balanced sample of hemlock, the leading species in the forest. The analysis of the growth records concentrated on the effect of fluoride on height growth (Table 5) and timber value, converting this to change in total net growth and value as was done with the old growth forest. 4. Biodiversity of Vegetation
Fluoride may be present in sufficient quantity to be detrimental to the plant life. Measures of biodiversity, species richness, abundance, and percentage cover can identify and measure the influence of the smelter emissions. The control series of permanent sample plots (strips) and their sub-plots allows a separate identi- fication of the succession following logging compared to the influences of the emis- sions. These differences were explored along the gradient of low, medium, and high levels of exposures to fluoride. The species abundance distributions (Table 6 ) were investigated using Detrended Correspondence Analysis (DECORANA) with multiple regression and matrix algebra. 5. Biomass of Vegetation
The total biomass of a plant community of ecosystem is a measure of its success or efficiency. Measures of the total biomass of the three strata or levels of exposure to fluoride identified in this study were compared to the biomass of the control strata to test for any effects of external influences.
A means of calculating biomass has become available as a result of recent work in Alaska by the University of Alaska and the United States Department of Agriculture, Forest Service. John Yarie of the Forest Soils Laboratory, University of Alaska, Fairbanks, and Bert Mead of the Forestry Sciences Laboratory, USDA, Forest Service, Anchorage, have developed a set of biomass regression coefficients for some plant species in several vegetation types in southeast A l a ~ k a . ~ They have developed a single regression equation to define the relationship between percent cover and biomass for each species. The equation is y = a C, where:
y = measured biomass (in kg/ha) of the leaves and twigs in the layer of vegetation; C = estimated cover (in percent); and a = regression coefficient. Their coefficients are designed to apply in 10 cm layers, 0-10, 11-20,21-30, etc.
The field data collected for this study were for four distinct layers: the ground layer (mosses and lichens), herbs, shrubs, and trees without specified vertical dimensions. A “multiplier” approach has been used to give each layer equal representation. The ‘multipliers” are the number of 10 cm layers in which the plant group is dominant.

246 Bunce Fluoride 29 (4)
6. Biennial Assessment of Visual Impacts Vegetation foliage was examined between 1971 and 1991 for fluoride emission
damage at sites located mostly downwind, to the north and northwest, of the Alcan smelter. For comparative purposes, the same sites were examined each successive time when possible. Variations in location and intensity of surveys between years accrued because of season of survey, weather variability, site accessibility, and the constitution of the survey group. Documentation of the foliage condition was qualitative and was concentrated on native species such as Sitka spruce, western hemlock, black cottonwood, Scouler willow, red alder, thimbleberry, elderberry, and fireweed. A rating scale was developed to compare each site based on the average extent of foliar damage to all species examined. Data were summarized in tabular form (Table 7) and in a bar graph for each year of study. 7. Necrosis of Gladiola Leaves
A quick, simple method of monitoring the distribution and change in quantity of fluoride in the ambient air during the growing season in residential areas is to survey gladiola leaf tip burn. This has been done by visual survey estimating the maximum length of tip burn or necrosis of the gladiola leaves in residential gardens. Gladiola bulbs are commonly planted by North American gardeners. A random selection of the local city streets was made and the gardens inspected for gladiola. The length of maximum bum, if present, on observed plants was recorded (Table 8). A tip bum index was calculated as the sum of the lengths of all the maximum tip bum seen in a given area and divided by the total number of observations in the same area. The value so obtained is an index of exposure of the area surveyed. Indices from successive years show changes of level of exposure during the growing season. 8. Survey of Lichen Frequency and Cover
Lichen surveys were conducted in the Permanent Sample Plots in the fume path and control areas using the method of LeBlanc and DeSloover.4 From the largest live trees in each plot, five mature hemlock were selected and examined systematically for lichens from ground level to a height of six feet. Lichen specimens were collected and assigned a sample number in the field. Specimens were identified using reproductive structures as far as possible. Unidentified specimens were assigned a number and specimen comparison methods allowed the surveyor to assess the distribution of all species. At each sampling location, the extent of coverage and the frequency of occurrence of each lichen species were estimated and assigned a numerical value (f) according to the following arbitrary scale used by LeBlanc and DeSloover 3:
*a lichen that was very frequent and had a high degree of coverage on most trees; five; * a species that was frequent or had a high degree of coverage on some trees; four; * a species that was infrequent or had a medium degree of coverage on some trees; three; * a species that was very infrequent or had a low degree of coverage; two; and * a species that was very rare and had a very low degree of coverage; one.

November 1996 Monitoring smelter emission effects on forest 247
The ecological index (Q) of each lichen species was established by adding together the number of other species of epiphytic lichens accompanying it at a sampling location and averaging the sums for all the locations where the species was encountered. For each location, the value of the index of air purity (IAP) was calculated by combining the coverage and frequency rating with the ecological index, using the formula:
v IAP= C (Qxf )
f = l
IAP values may be meaningfully compared only between two populations sampled at different times, when the two populations are from complete sets of paired data. Unmatched plot results affect the ecological index (Q), changing all the IAP values in their set (Table 9). 9. Small Mammals Survey
The monitoring of the fluoride uptake in small mammals was achieved using live traps. These were set on a grid sampling design to establish population existence, distribution and expected numbers in a control area distant from the smelter and in a test area directly on the central axis of the fume path about a mile north of the smelter fence. Live traps were then set at regular intervals along a ninety mile transect running north from the smelter. The traps were checked frequently, usually twice a day. The samples were dissected for their femurs which were analysed for fluoride content in the laboratory. The sampling system was repeated for several seasons. In addition, bone samples chiefly of marten, but also of moose, beaver, weasel and otter were obtained from a local commercial trapper and analyzed for their fluoride content.
10. Aerial Survey of the Condition of the Forest Cover A fixed-wing plane carrying two wing-tip mounted cameras to take 70 mm
stereopairs of infrared photographs was utilised in three successive years. Careful control and standardisation of the processing is essential in the production of the infrared transparencies in order to obtain maximum consistency.
The interpretation of the stereopairs was done by an experienced aerial photo- graphic interpreter using two folding stereoscopes (Abram’s Model) and a light table. For each plot that had a record in the previous year, the location on the photography was found and the plot outline marked on an overlay film. Because of changes in scale, different flying heights, and some variation in the exact location of the flight path, it was not always possible to relocate the plots or at least the whole of the plot. The individual trees were identified and numbered. Each tree was then classified according to damage classes. This method of photographic interpretation of infrared photography for fluoride damage and the method of statistical testing of this by probit analysis should be viewed with caution until further experience and critical review endorse them. It is recommended therefore that while the method does appear to have utility, its requirements are demanding of the photography and of the interpreter. Further application, if required, is quite possible but should consider this proviso.

248 Bunce Fluoride 29 (4)
Results and Discussion To illustrate the types of results obtained and the utility of the methods used,
some examples are given in tabular format. The results have been presented in greater detail in other publications and reports from 1979 through 1993, which the interested readers may wish to
TABLE 1. Comparative levels of fluoride in second growth and old growth (ppm fluoride dry weight)
Period Second Growth Old growth Baseline
1982-86 1974-78 1979-83 1953 ~~ ~~
Number of samples 240 60 63 65 High 52 Inner 132 73 Medium 30 Outer 79 24 Low 16 Surround 51 18 Control 4 Control 10 8 3
TABLE 2. Fluoride content by second growth hemlock foliage by stratum and year (ppm fluoride)
Year 1982 1984 1986 1982-86 Number of samples 80 80 80 240 Stratum YO YO YO YO
High 74 loo* 39 53 42 57 52 70 Medium 39 53 27 36 24 32 30 41 Low 21 28 12 16 16 22 16 22 Total Fume Path 45 61 26 35 27 36 33 44 Control 4 5 2 3 6 8 4 5
(average) 21 15 18 18 A lan Series
* For purposes of comparison, the high stratum (1982 value) is sset at 100% as a baseline
TABLE 3. Volume, area and value reductions - Inner zone. 1954-1983 Value of
Volume Rate of Area Average volume No. of reduction reduction affected stumpage reduction
Period years m3 m%yr ha Rate $/m3 1984 $
1954-73 20 56000 2 800 7 000 2.74 $153,400 1974-78 5 4 600 920 1 400 1.96 9,000 1979-83 5 3 800 760 1 200 3.62 13,750 1954-83 30 64400 - - 176.150
The results of the effect of the fluoride emissions on the old growth trees are given in Table 3 in terms of wood volume reduction, area affected and dollar value at the time of reporting. The numbers are the end product of a somewhat complex process in which many factors were considered and applied. Full comprehension of their deriva- tion requires study of the original reports.

November 19% Monitoring smelter emission effects on forest 249
TABLE 4. Tree mortality, non-catastrophic, by strata and measurement period Number of Trees died
Strata No of Plots 1974-78 1979-83 1974-83 Inner 3 7 3 Outer 14 33 20 Surround - 13 - 21 23 Total Fume path 30 61 46 Control 8 20 20
10 53 44 107 40
TABLE 5. Growth rates by species, by level of exposure, and by period (cm/year) 1982 + 1983 1984 + 1985 1982 + 1985
Hemlock Control
Cedar Control
Balsam Control
Spruce Control
All species Control
Fume path
Fume path
Fume path
Fume path
Fume path
34.0 34.0 47.0 39.5 27.0 30.0 36.5 20.0 34.5 35.5
43.5 42.0 47.5 37.0 30.5 30.0 47.0 42.0 42.0 39.5
38.75 38.00 47.25 38.25 28.75 30.00 41.75 31 .OO 38.25 37.50
TABLE 6. Number of species discovered by species group, stratum and sampling year High Medium Low Control
1982 4 4 5 4 1984 5 3 4 5 1986 3 4 5 4 Woodv shrubs 1982 12
16 12
16 16 17
16 16 16
12 15 15
1984 1986 Herbs 1982 1984 1986
23 29 25
25 36 32
23 34 30
25 34 31
Lichens 1982 1
8 9
4 9
12
6 13 13
10 23 17
1984 1986 Mosses 1982 1984 1986
11 23 21
14 25 22
14 22 21
14 26 25
All species 1982 51
81 70
63 89 87
64 89 85
65 103 92
1984 1986

250 Bunce Fluoride 29 (4)
TABLE 7. Summary of average foliar damage ratings at survev sites in the Kitimat area - 1971-85
Average no. of species studied Date of
Survey Der site Average rating of foliage conditions per site
\L Site:- 1 2 3 4 5 6 7 8 9 10 11 12 13 14 15 16 17 18 Total’ \L I 9 7 l G VP VP P F P F F VP F G G 12 9
1974 G VP VP P P V P P G G P 10 11
1976 G F P P VP P G F G G 12 5
1977 G VP F F F F P G F F F G F 13 7
1981 G G G G G 5 7
1983 G G G G G F G G G G G 11 9
July 7-9
July 22-25
OCt 27-20
Aug 30-Sep 1
Aug 1979 27-29 G P F G G G F G G G F G G G G 15 10
Aug 18-19
AUg 23-24
1985 G F G F G P G G G G G G G 13 11 Aug 20-22
Rating Scale: VP Very Poor Condition (severe damage symptoms) P Poor Condition (moderate damage symptoms) F Fair Condition (mild damage symptoms) G Good Condition (little or no damage symptoms)
TABLE 8. Summary of leaf tip necrosis damage to gladioli plants 1971-85 Occurrence of Average
Number damaged sites length Date of of sites of tip survey surveyed Frequency % necrosis (cm) 1971 July 7-9 29 13 45 3.8 1977 Aug 30-Sept 1 32 31 97 7.9 I979 AUg 27-29 93 80 86 6.3 1983 AUg 23-24 64 43 67 4.3 1985 Aug 20-22 75 19 25 3.9
TABLE 9. Index of air purity: Lichen Surveys - Comparison between 1976 and 1979 Plot No. IAP IAP Reduction of 1979 IAP
1976 1979 as % of 1976 IAP Fume path 28-1 268 3- 1 95 3A-1 112 7-1 57 10-1 43
65 22 17 0
18
76 77 85
100 58
11-1 17 0 100 Average 99 20 80 Control 21-1 243 110 55 21-2 21 3 111 48 21-3 317 92 71 Average 258 104 60

November 1996 Monitoring smelter emission effects on forest 251
This monitoring of the effects of the aluminium smelter’s airborne emissions on the adjacent forest began in 1953 and continues. In summary: ten methods of assess- ment have been used. These have addressed the forest trees, the lesser vegetation and the small animals. They have measured the chemical content of the foliage and ani- mal bones, the growth rates of the old growth and the second growth trees, the biodiversity and biomass of the vegetation, the damage to gladiola leaves, changes in the visual effects on all vegetation, the effects on the lichens, the impact on the forest cover measured by low-level large scale aerial photography, and the small mammal populations. These methods have each contributed to the estimation of the impact of the emissions on the ecosystems surrounding the aluminium smelter. Each method used, excepting the infrared photography, has contributed to increased knowledge and understanding of the effect of the smelter emissions on the forest and com- plemented the other methods. Recommendations for the selection of which of these methods might be best used in future studies depend on the nature of the existing exposed vegetation and the concern of the monitors. It is recommended that sample locations be made permanent and that measurements be repeated at regular intervals to reveal trends. Sampling design is critical and may need refining in subsequent surveys. Consideration of all variables, while the design is being developed, is very beneficial. Review of existing studies and consultation with other researchers can be most useful.
Acknowledgements This research was camed out by Simons Reid Collins, a division of H A Simons Ltd, of
Vancouver BC, Canada, on behalf of the Aluminium Company of Canada Limited (Alcan). Their permission to publish this report is gratehlly acknowledged.
References 1 Fluoride in Hemlock Foliage: Kitimat Valley, 1953-1989. Report to the Aluminium
Company of Canada Limited. Reid Collins, Vancouver BC 1991. 2 Parker ML, Bunce HWF, Smith JHG. The use of X-ray densitometry to measure the
effects of air pollution of tree growth near Kitimat, British Columbia. Paper presented at International Conference of Air Pollution and Forestry, Marianske Lame (Marian- bad), Czechoslovakia, October 1974.
3 Yarie J, Mead BR Biomass regression equations for determination of vertical structure of major understory species of Southeast Alaska. Northwest Science 63 ( 5 ) 221-23 1 1989.
4 LeBlanc F, DeSloover D. Relation between industrialisation and the distribution and growth of epiphytic lichens and mosses in Montreal. Canadian Journal of Botany 48
5 Bunce H. Fluoride Emissions and Forest Growth. Air Polltition Control Association Journal 29 (6) 642-643 1979.
6 Bunce H. Fluoride emissions and forest survival, growth and regeneration Journal of Environmental Pollution (Series A ) 35 169-1 88 1984.
7 Bunce H. Apparent stimulation of tree growth by low ambient levels of fluoride in the atmosphere. Journal of Air Pollution Control Association 35 (1) 46-48 1985.
8 Bunce H. Fluoride in air, grass and cattle. Journal of Dairy Science 68 1706- 1 7 1 1 1985. 9 Bunce H. The continuing effects of aluminium smelter emissions on coniferous forest
growth. Forestry 62 ( 3 ) 223-23 1 1989. 10 Bunce H. Empirical estimates of losses of value in a second growth coniferous forest
related to changes in fluoride emissions. Forestry Chronicle 69 (1) 1993.
(7) 1485-1496 1970.
Published by the International Society for Fluoride Research Editorial Office: 81A Landscape Road, Mount Eden, Auckland 4, New Zealand

252 Abstracts (Effects on bone) Fluoride 29 (4)
FLUORIDE EXPOSURE AND CHILDHOOD OSTEOSARCOMA
K H Gelberg, E F Fitzgerald, S A Hwang and R Dubrow Albany, New York, USA
Abstract from American Journal of Public Health 85 (12) 1678-1683 1995 Objectives: This study tests the hypothesis that fluoride exposure in a nonoccupa- tional setting is a risk factor for childhood osteosarcoma. Methods: A population based case-control study was conducted among residents of New York State excluding New York City. case subjects (n = 130) were diagnosed with osteo- sarcoma between 1978 and 1988 at age 24 years or younger. Control subjects were matched to case subjects on year of birth and sex. Exposure information was ob- tained by a telephone interview with the subject, parent, or both. Results: Based on the parents responses, total lifetime fluoride exposure was not significantly associ- ated with osteosarcoma among all subjects combined or among females. However, a significant protective trend was observed among males. Protective trends were observed for fluoridated toothpaste, fluoride tablets, and dental fluoride treat- ments among all subjects and among males. Based on the subjects’ responses no sig- nificant associations between fluoride exposure and osteosarcoma were observed. Conclusions: Fluoride exposure does not increase the risk of osteosarcoma and may be protective in males. The protective effect may not be directly due to fluoride exposure but to other factors associated with good dental hygiene. There is also biologic plausibility for a protective effect. Key words: Fluoride intake; Osteosarcoma. Reprints: K H Gelberg, New York State Department of Health, Bureau of Occupational
A CASE-CONTROL STUDY*
Health, 2 University Place, Room 155, Albany NY 12203 USA.
WATER FLUORIDATION, BONE DENSITY AND HIP FRACTURES: A REVIEW OF RECENT LITERATURE [Review]
J Raheb Como, Western Australia, Australia
Abstract from Community Dentistry and Oral Epidemiology 23 ( 5 ) 309-316 1995 A review of recent scientific reports that investigated an association between
exposure to fluoride in drinking water and the incidence of hip fractures in the aged found inconsistent results. Although some studies suggest that exposure to fluoridated water is associated with an increased risk of hip fracture, others found no association or a decreased risk of hip fracture associated with exposure to fluoridated water. The inconsistent findings could in part be attributed to the limitations of the ecological study design used in many of the studies. This design is useful for formulating hypotheses but, to test these hypotheses, analytical studies conducted among individuals are required. Recent studies conducted on individuals found that exposure to high fluoride levels (3.5-4.0 mg/L) in the drinking water was associated with reduced radial bone mass. Few individuals studies included communities with low fluoride levels in their drinking water, so the effects on
Critique on pages 237-240

NovemDer I Y Y ~ MU5LI d L L 3 ( = I ICLl3 UI I UUI IC] LJJ
bone from exposure to optimum levels of fluoride (ca. 1.0 mg/L) could not be determined. The number of reported hip fractures in several studies was too small to enable conclusions to be drawn about hip fracture risk. Osteoporosis is a major contributor to fractures in the aged, so it is important in hip fracture studies to collect data about the known risk factors for osteoporosis as well as history of exposure to fluoride. This enables control of the effects of confounding factors in the statistical analyses. Further research to determine a cause and effect relation- ship between fluoridation and hip fracture incidence is warranted. Key words: Bone density; Fluoridation; Hip fractures. Reprints: J Raheb, Health Department of Western Australia, Dental Service, PO Box 50,
[The “ecological” studies which reported an association between fluoridated water and hip fractures were mostly of much larger populations. The authors of the Utah study of 5000 persons residing in fluoridated and nonfluondated communities answered the argument that “ecological“ studies did not record exposure of individuals to fluoridated water by pointing out that their fluoridated population “had a net migration of 0.2%, the lowest in Utah. For this reason, we doubt that migration confounded our data.” (Journal of the American Medical Association 268 6 747 August 12 1992). Editor J
Como, WA 6152, Australia.
PATTERNS OF FRACTURE AMONG THE UNITED STATES ELDERLY: GEOGRAPHIC AND FLUORIDE EFFECTS
M R Karagas, J A Baron, J A Barrett and S J Jacobsen Hanover, New Hampshire, USA
Abstract from Annals of Epidemiology 6 (3) 209-216 1996 The purpose of this study was to examine whether geographic area or water
fluoride were related to the occurrence of fractures among the elderly in the United States. We used a 5% sample of the white U.S. Medicare population, aged 65 to 89 years during the period 1986-1990, to identify fractures of the hip, proximal humerus, distal forearm, and ankle. The association of geographic region and fluoridation status with fracture rates was assessed using Poisson regression. We found that rates of hip fracture were generally lower in the northern regions of the United States and higher in the southern regions. For fractures of the distal forearm and proximal humerus, lower rates were found in the Western states, and higher rates in the East. No discernible geographic pattern was found for ankle fractures. Adjustment for water fluoridation did not influence these results. Independent of geographic effects, men in fluoridated areas had modestly higher rates of fractures of the distal forearm and proximal humerus than did men in nonfluoridated areas; no such differences were observed among women, nor for fractures of the hip or ankle among either men or women. In conclusion, our data suggest that fractures of the distal forearm and proximal humerus have etiologic determinants distinct from those of fractures of the hip or ankle. Key words: Fluoridation; Fractures; Geography. Reprints: M R Karagas, Dartmouth College School of Medicine, Department of Com- munity and Family Medicine, Hanover NH 03755 USA.

254 Abstracts (Non-skeletal effects) Fluoride 29 (4)
CIRCULATING TESTOSTERONE LEVELS IN SKELETAL FLUOROSIS PATIENTS
A K Susheela and P Jethanandani New Delhi, India
Abstract from Journal of Toxicology - Clinical Toxicology 34 (2) 183-189 1996 Objective: The present study focuses on serum testosterone concentrations in patients with skeletal fluorosis, in’ order to assess the hormonal status in fluoride toxicity. Methods: Serum testosterones were compared for patients afflicted with skeletal fluorosis (n = 30) and healthy males consuming water containing less than 1 ppm fluoride (Control 1, n = 26) and a second category of controls (Control 2, n = 16): individuals living in the same house as the patients and consuming same water as patients but not exhibiting clinical manifestations of skeletal fluorosis. Results: Circulating serum testosterones in skeletal fluorosis patients were signifi- cantly lower than those of Control at p < 0.02. Testosterone concentrations of Control 2 were also lower than those of Control 1 at p < 0.05 but were higher than those of the patient group. Conclusion: Decreased testosterone concentrations in skeletal fluorosis patients and in males drinking the same water as the patients but with no clinical manifestations of the disease compared with those of normal, healthy males living in areas nonendemic for fluorosis suggest that fluoride toxicity may cause adverse effects on the reproductive system of males living in fluorosis endemic areas. Key words: Endemic fluorosis; Fertility; Reproduction; Skeletal fluorosis; Testosterone. Reprints: A K Susheela, M India Institute of Medical Sciences, Department of Anatomy,
Fluoride and Fluorosis Research Laboratories, New Delhi 110029, India.
FLUORIDE ION TOXICITY IN HUMAN KIDNEY COLLECTING DUCT CELLS
M-L Cittanova, B Lelongt, M-C Verpont, M Ghiteau-Legendre, F WahbC, D PriC, P Coriat and P M Ronco
Paris, France Abstract from Anesthesiology 84 (2) 428-435 1996
&ckground: Several halogenated anesthetics induce a urinary concentrating defect, partly related to fluoride ion toxicity in collecting duct cells. The aim of this study was to investigate the effects of fluoride ion in human kidney cells. Methods: Immortalized human collecting duct cells were used. In a first set of experiments, the toxicity threshold concentration was determined by exposing cell cultures for 24 h to increasing concentrations of fluoride ion in the medium: 0, 1,5, and 10 mM. The second set of experiments was a time-effect study in which cells were exposed to 5 mM fluoride for 2,6, and 24 h. Assessment of toxicity was based on several endpoints: cell number, protein content, 3H-leucine incorporation in newly synthesized proteins, extracellularly released lactate dehydrogenase, Na-K- ATPase pump activity, and electron microscope studies. Results: After 24 h of exposure, fluoride ion decreased cell number (-23%, P < 0.05), total protein content (-30%, P < 0.05), and 3H-leucine incorporation (-43%, P < 0.05) and increased lactate dehydrogenase release (+236%, P < 0.05) at a threshold concentration of 5 mM. Fluoride ion also inhibited Na-K-ATPase

November 1996 Abstracts (Non-skeletal ettectsl lndustnai ttuorosis) 235
activity at 5 mM (-5896, P < 0.05). Major morphologic alterations of mitochondria, including crystal formation, were detected from 1 mM fluoride concentration. Time-effect studies showed that, after only 6 h of exposure at 5 mM, fluoride decreased cell number (-13%, P c 0.05), 3H-leucine incorporation (-48%, P < 0.05), and Na-K-ATPase activity (-20%, P c 0.05) and increased lactate dehydrogenase release (+ 145%, p < 0.05). Crystal deposits in mitochondria again were a more sensitive marker of cell injury, detectable after only 2 h of exposure. Conclusions: These results suggest that the mitochondrion is a target of fluoride toxicity in human collecting duct cells, and its alteration is partly responsible for the sodium and water disturbances observed in patients. Key words: Collecting duct; Fluoride ions; Kidney; Mitochondria. Reprints: Dr M-L Cittanova, Departement d’hesthesie, Groupe hospitalier Pitie-
SalpCtriere, 47 Boulevard de l’Hbpital, 75651 Paris 13, France.
EXPOSURE TO PARTICULATES AND FLUORIDES AND RESPIRATORY HEALTH OF WORKERS IN AN ALUMINUM PRODUCTION
POTROOM WITH LIMITED CONTROL MEASURES F Akbarkhanzadeh Toledo, Ohio, USA
Abstract from American Industrial Hygiene Association Journal 56 ( 10) 1008- 10 15 1995 Occupational exposure to air pollutants and health status of potroom workers of
an aluminum reduction plant in a developing country were studied and compared with those in developed countries. In this plant, the pots were constructed and installed without recommended gas collecting hoods or segmented side doors, and the workers did not use any respiratory protection. These conditions, combined with manual material handling and poor housekeeping, gave rise to fugitive air pollution generation. All 213 male potroom workers and 148 male control subjects were studied using air sampling, urinary fluoride measurement, ventilatory function testing, and a questionnaire on respiratory symptoms. On average, breathing zone respirable and total particulates in the potroom were 0.98 and 1.82 mg/m3, respectively. Stationary air sampling showed 0.93 mg/m3 of total fluoride, 2.09 mg/m3 of respirable particulates, and 7.59 mg/m3 of total particulates. During an 8- hr shift, the average increase of urinary fluoride in the potroom workers (2.73 mg/L) was significantly higher than that in the control group (0.39 mg/L). Workers in the potroom reported significantly higher frequency of respiratory symptoms than the control group. Potroom workers, especially nonsmokers, showed signifi- cantly greater decrease in their ventilatory function parameters during the shift than those of the control group; however, there was no difference between the basic ventilatory function of the two groups. The exposure to airborne particulates and the consequent respiratory symptoms as well as the daily increase of urinary fluoride values were generally higher in this plant than in similar operations in developed countries. This may be attributable to the fact that both process flow and machinery are often imported and assembled without the application of adequate engineering controls or complete understanding of proper safe work practices. Key words: Aluminum; Developing countries; Industrial fluorosis. Reprints: F Akbarkhanzadeh, Medical College of Ohio, Department of Occupational
Health, Toledo OH 43614 USA.

256 Abstract (Dental)/Call for papers Fluoride 29 (4) November 1996
THE RISK OF FLUOROSIS IN STUDENTS EXPOSED TO A HIGHER THAN OPTIMAL CONCENTRATION OF FLUORIDE IN WELL WATER
A I Ismail and J G Messer Halifax, Nova Scotia, Canada
Abstract fiom Journal of Public Health Dentistry 56 (1) 22-27 1996 Objectives: In December 1991 the residents of the community of Rigolet, Labrador, Canada, discovered that they were exposed to higher than 2.0 ppm fluoride in the drinking water from the new town well, which became operational in December 1983. In 1993 an investigation of the occurrence of fluorosis in children exposed to the high-fluoride water during different ages of life was carried out. Methods: A dental examination for fluorosis was conducted using Pendrys’ Fluorosis Risk Index. Out of 84 students in Rigolet, 74 were examined and the parents of 60 students agreed to be interviewed. Out of the 60 students, 48 lived all of their first six years of life in Rigolet. Results: Of the 48 children with life-long residence, the odds ratio of fluorosis on enamel zones that began forming during the first year oflife was 8.3 1 (95%C1= 1.84,38.59)for children exposed since birth or during the first year of life relative to those exposed after 1 year of age. The odds that a child had a maxillary central incisor with fluorosis were 5.69 (95% C1=1.34, 24.15) times higher if exposure occurred during the first year of life compared with exposure after 1 year of age. Only those exposed to the high-fluoride water during the first year of life developed fluorosis on the mandibular central incisors. Conclusions: Within the limitations of this small population study, age relative to the date when the new water well became operational was a significant risk factor in development of fluorosis. The first year of life was a significant period for developing fluorosis on the mandibular and maxillary central incisors. Key words: Dental fluorosis; Fluoridation; Preventive dentistry. RepMts: A I Ismail, Dalhousie University, Faculty of Dentistry, Halifax NS B3H 3J5 Canada.
CALL FOR PAPERS Scientists and practitioners working in the field of endemic fluorosis and defluoridation of water are invited to present papers and to participate in the
2ND INTERNATIONAL WORKSHOP ON FLUOROSIS AND DEFLUORIDATION OF WATER
Addis Ababa, Ethiopia, November 19-22, 1997 arranged by the Technical University of Denmark and University of Addis Ababa in collaboration with the International Society for Fluoride Research, UNICEF and UNDP. Provisional titles and 100-word abstracts for scientific and discussion papers should be submitted before March 31, 1997. A Selection Committee will review submissions and send guidelines for paper preparation to those accepted. Typed papers, preferably with disks, must be received before August 15, 1997. Send offers of papers, and requests for further information, to the International Organizing Committee. Registration fee US$200 (US$150 for authors). Authors of acceptable papers may apply for financial support to cover direct costs in connection with the workshop. Chairperson of International Chairperson of Local Organizing Organizing Committee: Eli Dahi Committee: Redda Tekle Haimanot Technical University of Denmark University of Addis Ababa Building 208, DK-2800 Lyngby PO Box 4147, Addis Ababa DENMARK ETHIOPIA Phone: +45 45 255 929 Phone: +251 1 150 497 Fax: +45 45 255 922 Fax: +251 1 613 633 E-mail: [email protected] E-mail: [email protected]

Fluoride Vol. 29 No. 4 IYYO Humor I I I U ~ X L ~ I
Abebe W 182 Carlsson P 52 Forbes WF 101 ImaiT 111 Adamshuet B 38 Cauley JA 112 Foulkes RG 129-130, Inaba D 121-122 Aiouaz L 13-19 Cavenasio J 111 227-229 Ismail A1 256 Akbarkhanzadeh F 255 Chan JT 147-150 Fratzl P 108-109 Iwami Y 118-119 AkiniwaK 95-96 Alakuijala P 4445 AUainP 184 Amcs MJ 102,182 AmmanP 111 Anasuya A 193-201 AnderssenK 52 AndoM 104 Angmar-Mansson B 52 AobaT 118 Apparao BV 151-155
A k u r a S 45-46 Atherton SE 50 AtkinsonSA 181 AtWood C 47-48 Bader SM 112 Bakoula C 124 BalmerMF 102 Barmes DE 53 Baron JA 253 Barot W 63-71 BarrRD 181 Barren JA 253 BassS 42 BassonNJ 54 Baylink DJ 41,107 Beaumont JJ 103 BeUesRP 39-40 BeUNH 112 BCly M 180 BennammouS 181 Berais A 13-19 Berg JH 120 Bergendal T 125-126 BermannKE 127
AmndsJ 49, 121-122
186 Czarnowski W 163-165 Dabkowska E 131-134 Damen JJM 117 Dang LX 106 Dantas ESK 1 4 - 1 6 Dadva MD 179 Declercq C 185 Demeis L 56 Denbesten PK 51 Dequeker J 108 DomingosM 179 Downer MC 4748
Chen C 7-12 Fredj M 181 Chen PZ 25-28,29-32 Froslie A 177 ChenYX 7-12 Fu KW 59-62 ChengPT 112 Gabelova A 184 Chmoy NJ 63-71,217- 226 Gamble CL 40
Choubisa SL 110 Chow WL 182 Christoffersen J 49 Christoffersen MR 49 Mniteau-Legendre M
ChujouK 95 Gentleman JF 101 Cittanova M-L 254-255 Geraets WG 116-117 Collins TFX 102,182 Geusens F 108 Colquhoun J 57-58, Gharzouli A 13-19 %,99-100 Gharzouli K 13-19
Conzen PF 46 GiambroNJ 51 Cooke JA 128 GibbsCD 50 Coote GE 122,156-162, Green RS 103
Coriat P 254-255 Grobler SR 54
Cutress TW 51,156-162, 117
Gambacciani M 112
Garcia-Gcdoy F 120 Gauchard F 184 Gelberg KH 252
Chubek D 131-134 254-255
186 Grewal MS 166-174
CornerJEA 106 G I U ~ ~ ~ U ~ S C X I RJ 116-
GrynpasMD 112 Guha-Chowdhurv N
BcFgmann RL 127 BianJY 126-127 Droller MJ 101-102 Black TN 102,182 Blinkhorn AS 474,124 Duckworth RM 50 BOC J 104-105 DulyEB 106 BohlerF 109 Dunipace AJ 39,183 BonjourJP 111 Duperon DF 55 BoultonIC 128 Duresmith BA 107 BoultonS 47 Duschner H 121-122 Bowen W H 120-121 Dutoit IJ 54
Breitfellner G 109 Edwardsson S 48 BrettLHR 97-98 Ekstrand J 99-100 Brizendine EJ 43- ELLingsen JE 110
BroenP 104-105 Everhadani P 185 Bnezinska B 163-165 Facanha AR 56 BuhariAM 112 FanJY 20-24 Bu& MJ 117 Fang SL 139-143 BUUCC H 241-251 Farley JR 107 Burgener D 111 Farley SM 107 Burgstahler AW 57-58 Fejerskov 0 99-100 B W B A 99-100 Feskcns E 52 Cao SR 207-211212- Fitzgerald EF 252
Dnscoll WS 47
Dubrow R 252
Bratthall D 53 DUUG 38-39
44,183 Etty EJ 116-117
216 Flaitz CM 120
Jackson RD 47 Jacobsen SJ 253 Jauhianen M 44-45 Jedrychowski JR 55 JenkinsGN 189 Jethanandani P 254 Jia M 139-143 Jiang Y 108 Johannessen F 38-39 JohnsonMS 128 Johnston DW 49 JonesSG 123 Jongebloed W 121-122 Kafrawy AH 183 KannoM 45-46 Karagas MR 253 Karthikeyan G 151-155 Katz BP 43-44,47,183 Kelly SA 47 KidroniG 185 KierdorfH 177 Kierdorf U 177 Kingman A 47 Kiritsy MC 54,113 Klaushofer K 108-109
118-119 Klumpp A 179 Guhachowdhury N 54 Klumpp G 179 GuoYQ 59-62 KO MKW 176
HainesTA 179 Kohout FJ 54,113 HallockMF 103 Kong J 55 Hallonsten AL 125-126 Konczerud J 104-105
HaddadA 181 Kmh G 48,125-126
HaltonJM 181 Hamaguchi F 43 HamiltonSJ 179 Hammond SK 103 HasegawaK 39 Hautala EL 5.5 HawU 52 Hawley GM 124 He GL 212-216 HeZL 7-12 Heilman JR 54,113 Henson HA 147-150 HicksMJ 120 HiguchiH 45-46 HinesCJ 103 HiranoS 104 Hoelscher GL 127 HolopainenJK 55 Holt RD 4748 Hotta N 95 HuangHB 128 HuangS 186 HudsonMC 127 Hugoson A 125-126 HullJR 47 Hunt J 47 HuntRJ 115 HuntingtonE 50 Hwang SA 252
Korgonen A 44-45 KotzeTJV 54 KranN 184 Krasowska A 183-184 Krechniak J 163-165
KuangYH 128 Kuhad MS 166-174 Kumar A 166-174 Kurol J 48 KuronenM 44-45 Lafage MH 108-109 LahtiSM 52 LanCF 112 LarsenMJ 122 LauKHW 41
Leidig G 180 Lelongt B 254-255 Lennon MA 47 Leonardsen FS 49 LessardS 101 Leupolt T 46 Levy SM 54,113,115 Lewis DW 49 Li DS 156-162 Li HX 25-28 Li MJ 77-78 Li QC 82-88
C o o k L 135-138
Lee JR 36-37,237-240

258 1996 Author Index continued Fluoride Vol. 29 No. 4
Li XX 20-24 Peter K 46 Li Y 39,434,126-127 Peterson RD 38 Liang CK 43-44 PeterssonLG 48 Liang GH 190-192 Pires MAF 144-146 Lilleng P 104-105 Pius A 151-155 L m I F 112 P i a k V 38 Lin MQ 7-12 PoindexterJR 38 Linkhart SG 107 Ponti P 185 Liu BK 33-35 Pri& D 254-255 Liu GF 79-81 ProstakK 51 Liu YQ 7-12 Qin YP 25-28 LoddingA 48 Raheb J 252-253 LuneySR 106 RaoHV 39-40 Luoma H 44-45,52 Redmo-Emanuelsson LynchRJM 50 IM 52 Machoy Z 131-134 Reynolds EC 115-116 MacleodKM 182 Rhomberg 109 MarquisRE 119 RileyTJ 112 Mathiesen AT 122-123 Robinson C 186 Matsudo Y 43 Rodan G 108-109 McFarlane DJ 181 Rodriguez JM 176 Melotte A 46 RoUa G 122-123 Meng XC 25-28,29-32 Ron M 185 Messer JG 256 Ronco PM 254-255 Michael M 63-71 RoneJI 182 MikiY 95 Roschger P 108-109 Miller LL 183 RouseUe JF 185 Min D 7-12 RugglesDI 102 M m e H W 180 RuppovaK 184 Minor RR 135-138 Saada V 103-104 Morita I 186 SaiagP 103-104 MorseDE 114 Sakhaee K 38,112 MosekildeL 180 SalapataGJ 124 MrabetA 181 SansS 103-104 Mullenix PJ 57-58 SatoA 118
Mura-GaleUi MJ 118 Schenker MB 103 Murphy PA 112 Schreiber 108-109 Murray JM 106 Schwartz W 180 Nadanovsky P 124 Sedlacek F 177 NakagakiH 186 Seeman E 42 Nakamura Y 72-76 Selwitz RH 47 Narita A 72-76 Shackelford ME 102 Navia JM 126-127 SheihamA 124 Nevalainen T 4445 Shen YF 202-206 Nocenl 131-134 Shigematsu A 72-76 Nowjack-Raymer RE 47 Shimada T 118 NunnJH 123 Shimonovitz S 185 Nuscheler M 46 Shrivastav R 89-94 OMullane DM 53,125 Shrivastav S 89-94 Odelius H 121-122 Shu M 186 Ogaard B 122-123 Silva M 115-116 OkumuraH 186 Singer L 185 OleaRA 175-176 SissonsCH 51 Olei.;kN 102 Sjogren K 50 Pak CYC 38,112 Skotowski MC 115 Pang= 59-62 Slamenova D 184 Parajape PK 193-201 Slotte C 125-126 PatarinM 103-104 SogaardCH 180 Pate1 D 217-226 Someya T 43
Pearce ELF 51,118-119, Spinetti A 112 122,156-162,186,186 Spittle B 187-188
PearceG 42 Sprando RL 102,182 Pendrys DG 114,114 Stolarska K 163-165
M h t a CS 144-146 Satoh T 45-46
P a h D 185 Soy~eth V 104-105
Stookey GK 43-44,47, Wong L 51 183 WoskieSR 103
StrongM 186 Wright C 47-48 Stuvc G 177,178,178- Wsolova L 184
SumitaS 45-46 Xantheas SS 106 Sun YF 59-62202-206 Susheela AK 254 Sutton PRN 99-100 SwanSH 103 Yen W 20-24
Takada J 41 Yuan ME3 79-81 Takagi 0 121-122 Zacut D 185 TakahashiK 95 Zang ZY 20-24 Takahashi M 43 ZhangCL 128 Takamatsu F 45-46 Tanaka Y 43 TangRQ 59-62 Zhang Y 207-211 TangSZ 77-78 Zhao J 108 TaponecoF 112 ZhaoLB 190-192 Taya Y 118
Thorstensson B 125-126 Ziegler R 180 Thorstensson H 125-126 Zyluk B 131-134 Tian JY 20-24 ToUefsen I 38-39 TounsiH 181 TrinickTR 106 TrompTK 176 Tronet V 185 Tsalamandris C 42 TsutsuiT 43 Tuomilehto J 52 Turner CH 39,3940 Uehama A 43 Ukta lo U 52 Vanaken H 46 Vanaudekercke R 108 Verhaegen M 46 VermaR 110 Verpont M-C 254-255 Vikoren T 177,178,178-
VithA 109 Vonbehren J 103 Wahbt F 254-255 Wang CY 82-88 Wang EL 20-24 Wang JG 20-24 Wang LH 202-206 WangSJ 112 Warembourg D 185 Warren DP 147-150 Warrick JM 183 Webber C 181 Weber LP 182 Wefel JS 54,113 Welsh JJ 102 WenML 82-88 WhitfordGM 39-40 Wilson CA 183 Wilson M 39,183
Woltgens JH 116-117
179 WU JS 139-143 Sumikura H 45-46 WUXR 190-192
Xiao YD 7-12 Yamada T 118-119 Yamamoto H 43
SEND 176 YU MH 3-6,7-12,72-76
Zhang DN 190-192 Zhang W 39,183
Zhao ZP 79-81 TencateJM 117 Zhu P 59-62
179
WlOstOWski T 183-184

Fluoride Vol. 29 No. 4 1996 Subject Index 259
[2-14C]thymidine 72-76 Calcium deficiency 107 Dental fluorosis 7-12, 2.4,5-T 227-229 Calcium phosphates 51,54,96,97-98,113-
Accident 1 10 Calcium 178,256 Acidulated phosphate supplementation 107 Dental plaque 48,50,51
fluoride 49.120 Cancer 41,95,101-102, Dental services 124-
Agent Orange 227-229 Capreolus 177,178 Dentin (Dentine) 121- Air pollution, Airborne Carbohydrate 217-226 122,186
104-105,128,179,207- CAT scan (see CT scan) Developing countries 21 1 Catecholamines 217- 255
Abortion 103 21 2-21 6 116,151-155,177,
Adolescence 122-123 237-240,252 126
fluoride 7-12,89-94, Carbon 77-78 DES 187,227-229
Alms 177,178, 226 ' Diabetes 182,183 Alendronate 108-109 Cervids 177 Dieldrin 227-229 Alluvial plains 166-174 Cervus 177,178 Diet 20-24,4445,193-
56,101,111,179,184, China 20-24,2528.29- Diethylstilbestrol 187, Aluminum (Aluminium) CFCs 176 201
185,255 32,3345,5942, 77-78, 227-229
251 143,190-1 92,202-206, 184 Aluminum smelter 241- 79-81,8248, 128,139- Digestive absorption
Alveolar macrophages 212-216 Dioxins 227-229 104 Chlorination 101-102 DNA 72-76.104
Alzheimer's Disease Chlorofluorocarbons Down's Syndrome 95
Amelogenisis (see Cholesterol 4445 Electroanalysis 82-88 Dental enamel) Chromatography 82-88 Electron imaging 108-
Amino acids 55,217- Chromosome 109 226 aberrations. 43 Enamel (see Dental
Anesthetics 45-46.46, Coal-burning 33-35, Enamel defects 4748 105.254-255 207-21 1 (see also Dental
101 176 Egg 178-179
Anesthesia, Clastogenicity 43 enamel)
Apatiie 118-119 Apoptosis 104 Aqueous fluoride
solvation 106 Arsenic 95,156-162 Articular cartilage 180 Autoradiography 72-76 Bacterial glycolysis
Banaskantha 59-62 Bankvole 184 Barley 55 Biocompatibility 109 Birds 178-179 Black tip disorder 128 Bladder cancer 101-
Blood sugar 217-226 Bone, Bone density,
118-1 19,119
102
Bone fluoride 20-24, 25-28,29-32,3642,79- 81,107-1 12,131-134, 135-138,177-1 81,252- 253,253
Bone char 212-216 Brain 57-58,101,187-
Brazil 179 Brick tea 139-142 Bronchial provocation
188.1 90-1 92,227-229, 230-236
104-105
Coffee 147-150 fluorosis) Collecting duct 254-255 Enamel hypoplasia Combined effects 156- 126-127
157 Endemic fluorosis 20-
Computer contouring 142,151-1 55,202-206,
Comparative study 24,2528,2942,5942, 139-142 77-78,79-81,109,139-
166-1 74.1 75-1 76 207-21 1.217-226.254. Computerized 256
tomography 29-32,181 Endemic osteomalacia Genitourinary tract
216 Environment 101-102, Genotoxicity 4344 Cord serum 185 176-179,241-251 Geography 253 Crania 131-134 Enzymes 59-62 Geophysics 166-174, CT scan 29-32,181 Eosinophils 104-105 175-176 Cytotoxicity 104,184 Epidemiology 20-24, Germinal epithelium Czech Republic 177 4748,104-105,125126 183-184 DDE 227-229 Fertility 102,182,187- Glutamine 217-226 DDT 227-229 188,227-236. 254 Glycine 217-226 Deer 177 Fluorapatite 49 Glycogen 217-226 Defluoridation 25-28, Fluorhydroxyapatite Glycol ethers 103
Dementia 101 Fluoridated water (see Gramine 55 Demineralization 50, Fluoridation and Water) Growth 3 4
Dental calculus 186 97-98,99-100,101-102, Hair 163-165 Dental care 125-126 114,186.187-188, 252- Havana. India 166-174 Dental caries 47-53, 253,253.256 Hip fracture 36-37,38,
95-96,97-98,99-100, Fluoride analysis 82- 96,252-253,253 116-127 88,106.144-146,163- Histochemistry 5962
Dental effects 47-53, 165.186 Honey 54 95-100.113-127, Fluoride contamination Human blood
Coprecipitation 212- 20-24 101-102
202-206,212-216,256 118-1 19 Glycolysis 118-119,119
116-118,121-122 Fluoridation 4748,96. H+-ATPase 56
Fluoride content (see Fluoride analysis)
Fluoride determination (see Fluoride analysis)
Fluoride emissions 101-102.103-104, 109.128,163-165, 176- 179.185, 241-251
52,54,113,147-150, 189, 193-201,252
Fluoride intake 7-12,
Fluoride ions 254-255 Fluoride mouthrinse 95 Fluoride pollution 7-12,
89-94, 104-1 05,128, 129-1 30.1 77,179,207- 21 1
114,123,181 Fluoride supplements
Fluoride therapy 36-
Fluoride toothpaste
Fluoride uptake 3940 Fluoride-water
interactions 106 Fluorine-containing
plastics 109 Fluoroaluminate 56 Foetal development
Food fluoride (see Diet) Forests 179,241 -251 Fractures 36-37,38,38-
39,3940,40.42,96,181,
Furans 227-229 G-proteins 182 Gene mutations 184
37,38,38-39-40.42, 107,112,180,184
48,50,1l3-115,124
102
252-253,253
Brown mottling 135-138 186,256 7-12,89-94, 104-105, lymphocytes 4344 Calcium 20-24,3649, Dental enamel 49-51, 128,129-130,177,179, Human diploid
49,54 117,118,122,186 207-21 1 fibroblasts 43

260 1996 Subject Index continued Fluoride Vol. 29 No. 4
Human skulls 131-134 Hyderabad 193-201 Hydrofluoric acid 103-
Hydroxyapatite 49,212-
In vitro adsorbance
Industrial fluorosis
104
216
135-138
103,103-104,109,128.
255 163-1651 77-1 79.1 85,
Infant intake 113.116 Intelligence 57-58,101,
229,230-236 Ion selective anode,
electrode 106 (see also Fluoride analysis)
IQ (see Intelligence) Ireland 53 lsoflurane 45-46 Japanese Society for
Fluoride Research 95-96
187-188,190-192, 227-
Muscle 59-62 NaF (see sodium
Nails 163-165 Native trees 179 Neonate 185 Nephrotoxicity 45-46,
Neurotoxicity 57-58,
Non-skeletal effects
fluoride)
46,105
101,187-188.1 90-192, 227-229,230-236
4346,57-58.59-62, 63- 71,95.101-105, 182- 185,217-226.253-255
Norethindrone 41 Nutrient, Nutrition 20-
Optimal intake 113,
Oral bacteria 118-119 Oral hygiene 122-123 Osteoblast reDlication
24,126127,129-130
130.189
Preventive dentistry Streptococcus mutans
Protein 20-24.21.7-226 Stress 103 Proton probe 122 Sugar fluoridation 51- Pulmonary changes 53,120-121
Pyrimidine carbinols Sulphur 77-78
Radicle elongation 3-6 122-123 Rat 13-19,39,44-45,102, Tamil Nadu, India 151-
Remineralization 50, Testes 183-184
Renal (see Kidney) TFA 176 Reproduction 102,182. Thermodynamic
analysis 89-94 Rice 193-201 Tibet 139-142 Root caries 121-122 Titanium implants 110 Safety 187-188 Topical fluoride 49,95,
Saliva 1 16-1 17 Total fluoride intake Salmon 179 [see Fluoride intake)
256 11 8-1 19,127
33-35 Sugar intake 52
227-229 Sweet consumption
104,156-162,180,182- 1 55 184 Tea infusions 144-146
116-118 Testosterone 254
254 (see also Fertility)
Salicylic acid 13-1 9 120
111 (see also Bone) Salt fluoridation 127 Thfluoroacetate 176 Osteofluorosis (see Seasonal wetlands 176 Triglycerides 44-45
Kidney, Kidney function Skeletal fluorosis) Selenium 59-62.77-78 Tvrosine 45-46,46.105.254-255
176 Kriging 166-174,175-
Larus 178-179 Leukemia 181 Lindane 227-229 Lipid peroxidation 183-
Lipoprotein 44-45 Liver 183-184 Los angeles 55 Macromolecular
synthesis 184 Magnesium 4445 Maize 56 Mammalian cells 184 Mammoth 135-1 38 Mango 128 Mapping 166174,175-
Marble deterioration
Maternal serum 185 Mauritius 52 Mehsana 59-62 Mental impairment
(see Intelligence) Mesenteric artery 182 Microprobe analysis
Microradiography 122 Mineralization 50.1 16-
184
176
89-94
186
1 18.121 -1 22
162 Postmenopausal Spectral analysis 82-88 Mineralized tissue 156- Podland cement 89-94
Minipigs 108-109 osteoporosis 3637, Spermatogenesis 182 Miscarriage 103 38,3&39,40 Spinal cord Mitochondria 254-255 Potential difference 13- compression 181 Mung bean seedling 19 Stomach 13-19
174
3-6.72-76
Osteogenic 41 (see Semiconductor phosphorylation 11 1 also Bone) manufacturing 103 Ultrastructure 51,5962
Osteomalacia 20-24 Serum 44-45.106 Umbilical fluoride 185 (see also Bone) Sevoflurane 45-46.46, Urine, Urinary fluoride
Osteopenia 181 (see 105 163-165,185 also Bone) Shanxi 190-192 Uterus 217-226
Osteoporosis 36-37, Silica 101 Vasoconstriction 182 38.38-39,40.42.107, Sima 190-192 Vasopressin 45-46 109,112,180 Sister chromatid Vertebrae, Vertebral
Osteosarcoma 41.95, exchange 4344 canal 29-32.180,181, 237-240,252 Skeletal change 25-28 253
Osteosclerosis 36-37 Skeletal fluorosis 20- Wgna radiata 3-6 (see also Bone) 24,25-28.33-35,38-39, Vinclorolin 227-229
Paddy 193-201 109.1 10.151-1 55, Vitamin C 20-24 Paradoxical effect 227- 178,180-181,254 Water fluoride 4344,
229,230-236 Skeletal muscle 59-62 54,55,59-62.102,106, Parboiled rice 193-201 Skin necrosis 103-104 113.151-155,190-192,
190-1 92 Slow-release NaF 36- Water-soluble soil PCBS 227-229 37,38 fluorine 166-174 pH 13-19,101,184 SO2 7-12 Wild life 177-179 Pharmacokinetic model Social factors 124,125 Wild mammals 128
3940 Sodium fluoride 13-19, X-ray 7941,108-109, Phosphate fertilizer 36-37,38,3&39.43,102, 110
workers 163-165 108,108-109,182, 184 Xinghua 190-1 92 Phospholipids 44-45 Sodium hypochlorite XXlst Conference 1-2 Phosphorus 54 121-122 Zinc 183-184 Phosphorylase 217-226 Soft tissue function 59- Photcqxriod 183-184 62 Plasma fluoride 102 Soil fluoride 166-174 Polychlorinated Soluble sugars 3-6
biphenyls 227-229 Solvation energy 106 Polysaccharides 180 Spatial variability 166-
Parents' education Skulls 131-134 202-206,212-216

FLUORIDE, official journal of the International Society for Fluoride Research (ISFR), publishes quarterly reports on biological, chemical, ecological, industrial, toxicological and clinical aspects of inorganic and organic fluoride compounds. The International Standard Serial Number (ISSN) is 0015-4725.
SUBSCRIPTION: US$50 (or equivalent) per year in advance. Send to the Treasurer, ISFR, 81A Landscape Road, Mt Eden, Auckland 4, New Zealand.
MANUSCRIPTS, including papers presented at ISFR conferences, are accepted for publication after appropriate evaluation and recommendation by qualified reviewers. Send to Editor, Fluoride, 81A Landscape Road, Mt Eden, Auckland 4, New Zealand.
COPIES of articles in FLUORIDE are available from: University Microfilms International, Box 91, Ann Arbor, MI 481 06, USA. Institute for Scientific Information, 3501 Market St., Philadelphia, PA 191 04, USA.
INSTRUCTIONS TO AUTHORS
1.
2.
3.
4.
5.
6.
7.
8.
9.
10.
11
General. The submitted paper, with a copy, should be written concisely in English. Either American or British spelling is accepted. Measures should be in metric system. Double space with generous margins. A computer disk con- taining the text is much appreciated.
Title. A concise but informative title should be followed by the name(s) of the author(s). The address where the research was carried out should appear at the bottom of the first page.
Summary. Begin with a brief factual summary.
Key words. List the major themes or subjects.
Introduction. State the reason for the work with a brief review of previous work on the subject.
Materials and Methods. Condense. However, if the methodology is new or developed by the author(s) it can be more detailed.
Results. List the direct conclusions of the work.
Discussion. Deal with general conclusions, referring to other work on the subject. In short papers Results and Discussion may be combined.
Abbreviations or Acronyms. Define, either in brackets or in footnotes, when they first appear.
Acknowledgements. Keep brief. They may include funding source, technical assistance, text editing and useful comments.
References. See current issues of journal for usual style, which identifies references by superscripted numbers in the order in which references first occur. Other styles may be accepted, provided they are accurate and consistent.
MEMBERSHIP. Researchers are invited to join ISFR. Applications for membership should be sent to the Secretary, Professor Gene W Miller, Biology Department, Utah State University, Logan, Utah 84322-5305, USA. Application forms are available from either the Secretary or Treasurer. The membership fee is US$40 a year, and includes subscription to the journal. This reduced subscription rate is also available, on appli- cation to the Treasurer, to individuals who support the Society's aims.