Fluorescence spectroscopy of tissue: recovery of intrinsic fluorescence from measured fluorescence
13
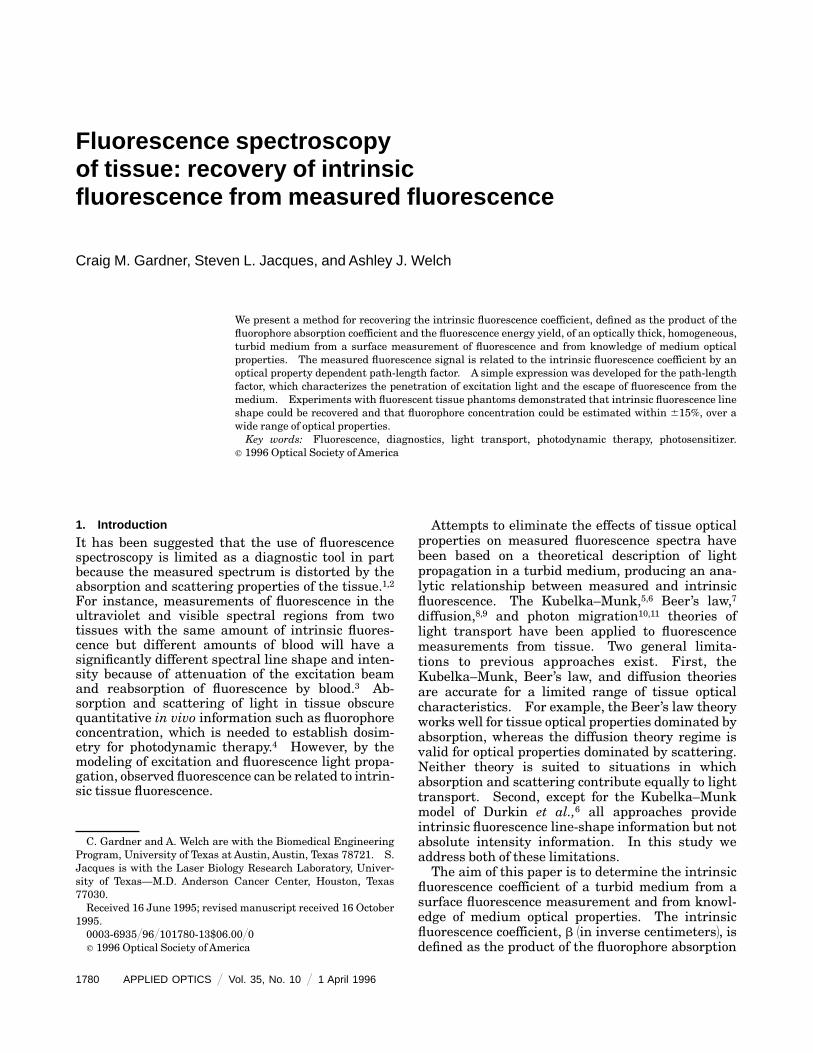
Fluorescence spectroscopy of tissue: recovery of intrinsic fluorescence from measured fluorescence Craig M. Gardner, Steven L. Jacques, and Ashley J. Welch We present a method for recovering the intrinsic fluorescence coefficient, defined as the product of the fluorophore absorption coefficient and the fluorescence energy yield, of an optically thick, homogeneous, turbid medium from a surface measurement of fluorescence and from knowledge of medium optical properties. The measured fluorescence signal is related to the intrinsic fluorescence coefficient by an optical property dependent path-length factor. A simple expression was developed for the path-length factor, which characterizes the penetration of excitation light and the escape of fluorescence from the medium. Experiments with fluorescent tissue phantoms demonstrated that intrinsic fluorescence line shape could be recovered and that fluorophore concentration could be estimated within 615%, over a wide range of optical properties. Key words: Fluorescence, diagnostics, light transport, photodynamic therapy, photosensitizer. r 1996 Optical Society of America 1. Introduction It has been suggested that the use of fluorescence spectroscopy is limited as a diagnostic tool in part because the measured spectrum is distorted by the absorption and scattering properties of the tissue. 1,2 For instance, measurements of fluorescence in the ultraviolet and visible spectral regions from two tissues with the same amount of intrinsic fluores- cence but different amounts of blood will have a significantly different spectral line shape and inten- sity because of attenuation of the excitation beam and reabsorption of fluorescence by blood. 3 Ab- sorption and scattering of light in tissue obscure quantitative in vivo information such as fluorophore concentration, which is needed to establish dosim- etry for photodynamic therapy. 4 However, by the modeling of excitation and fluorescence light propa- gation, observed fluorescence can be related to intrin- sic tissue fluorescence. Attempts to eliminate the effects of tissue optical properties on measured fluorescence spectra have been based on a theoretical description of light propagation in a turbid medium, producing an ana- lytic relationship between measured and intrinsic fluorescence. The Kubelka–Munk, 5,6 Beer’s law, 7 diffusion, 8,9 and photon migration 10,11 theories of light transport have been applied to fluorescence measurements from tissue. Two general limita- tions to previous approaches exist. First, the Kubelka–Munk, Beer’s law, and diffusion theories are accurate for a limited range of tissue optical characteristics. For example, the Beer’s law theory works well for tissue optical properties dominated by absorption, whereas the diffusion theory regime is valid for optical properties dominated by scattering. Neither theory is suited to situations in which absorption and scattering contribute equally to light transport. Second, except for the Kubelka–Munk model of Durkin et al., 6 all approaches provide intrinsic fluorescence line-shape information but not absolute intensity information. In this study we address both of these limitations. The aim of this paper is to determine the intrinsic fluorescence coefficient of a turbid medium from a surface fluorescence measurement and from knowl- edge of medium optical properties. The intrinsic fluorescence coefficient, b 1in inverse centimeters2, is defined as the product of the fluorophore absorption C. Gardner and A. Welch are with the Biomedical Engineering Program, University of Texas at Austin, Austin, Texas 78721. S. Jacques is with the Laser Biology Research Laboratory, Univer- sity of Texas—M.D. Anderson Cancer Center, Houston, Texas 77030. Received 16 June 1995; revised manuscript received 16 October 1995. 0003-6935@96@101780-13$06.00@0 r 1996 Optical Society of America 1780 APPLIED OPTICS @ Vol. 35, No. 10 @ 1 April 1996
Transcript of Fluorescence spectroscopy of tissue: recovery of intrinsic fluorescence from measured fluorescence
Fluorescence spectroscopyof tissue: recovery of intrinsicfluorescence from measured fluorescence
Craig M. Gardner, Steven L. Jacques, and Ashley J. Welch
We present a method for recovering the intrinsic fluorescence coefficient, defined as the product of thefluorophore absorption coefficient and the fluorescence energy yield, of an optically thick, homogeneous,turbid medium from a surface measurement of fluorescence and from knowledge of medium opticalproperties. The measured fluorescence signal is related to the intrinsic fluorescence coefficient by anoptical property dependent path-length factor. A simple expression was developed for the path-lengthfactor, which characterizes the penetration of excitation light and the escape of fluorescence from themedium. Experiments with fluorescent tissue phantoms demonstrated that intrinsic fluorescence lineshape could be recovered and that fluorophore concentration could be estimated within 615%, over awide range of optical properties.Key words: Fluorescence, diagnostics, light transport, photodynamic therapy, photosensitizer.
r 1996 Optical Society of America
1. Introduction
It has been suggested that the use of fluorescencespectroscopy is limited as a diagnostic tool in partbecause the measured spectrum is distorted by theabsorption and scattering properties of the tissue.1,2For instance, measurements of fluorescence in theultraviolet and visible spectral regions from twotissues with the same amount of intrinsic fluores-cence but different amounts of blood will have asignificantly different spectral line shape and inten-sity because of attenuation of the excitation beamand reabsorption of fluorescence by blood.3 Ab-sorption and scattering of light in tissue obscurequantitative in vivo information such as fluorophoreconcentration, which is needed to establish dosim-etry for photodynamic therapy.4 However, by themodeling of excitation and fluorescence light propa-gation, observed fluorescence can be related to intrin-sic tissue fluorescence.
C. Gardner and A. Welch are with the Biomedical EngineeringProgram, University of Texas at Austin, Austin, Texas 78721. S.Jacques is with the Laser Biology Research Laboratory, Univer-sity of Texas—M.D. Anderson Cancer Center, Houston, Texas77030.Received 16 June 1995; revised manuscript received 16 October
1995.0003-6935@96@101780-13$06.00@0r 1996 Optical Society of America
1780 APPLIED OPTICS @ Vol. 35, No. 10 @ 1 April 1996
Attempts to eliminate the effects of tissue opticalproperties on measured fluorescence spectra havebeen based on a theoretical description of lightpropagation in a turbid medium, producing an ana-lytic relationship between measured and intrinsicfluorescence. The Kubelka–Munk,5,6 Beer’s law,7diffusion,8,9 and photon migration10,11 theories oflight transport have been applied to fluorescencemeasurements from tissue. Two general limita-tions to previous approaches exist. First, theKubelka–Munk, Beer’s law, and diffusion theoriesare accurate for a limited range of tissue opticalcharacteristics. For example, the Beer’s law theoryworks well for tissue optical properties dominated byabsorption, whereas the diffusion theory regime isvalid for optical properties dominated by scattering.Neither theory is suited to situations in whichabsorption and scattering contribute equally to lighttransport. Second, except for the Kubelka–Munkmodel of Durkin et al.,6 all approaches provideintrinsic fluorescence line-shape information but notabsolute intensity information. In this study weaddress both of these limitations.The aim of this paper is to determine the intrinsic
fluorescence coefficient of a turbid medium from asurface fluorescence measurement and from knowl-edge of medium optical properties. The intrinsicfluorescence coefficient, b 1in inverse centimeters2, isdefined as the product of the fluorophore absorption
coefficient, µa,fl 1in inverse centimeters2, at the excita-tion wavelength 1lex2 with the dimensionless spectralfluorescence energy yield, Fl, at the emission wave-length 1lem2:
b1lex, lem2 ; µa,fl1lex2Fl1lem2. 112
The subscript fl distinguishes the fluorophore absorp-tion coefficient from the total absorption coefficient ofthe medium, which is often much larger than µa,fl.Note that the above definition is amenable to mea-surements of a fluorescence spectrum. The spectralfluorescence energy yield specifies the fraction oftotal fluorescence that is emitted at emission wave-length lem within a small spectral band Dl. It is adifferential form of the fluorescence energy yield.The absorption coefficient is the product of fluoro-
phore concentration, Cfl 1in molar concentration2,with the molar extinction coefficient, efl 1inversecentimeters times inverse molar concentration2,which is a spectroscopic quantity defined such thatthe transmission through a path length L is T 5102eCL. Intrinsic fluorescence is therefore linearlyproportional to concentration:
b1lex, lem2 5 ln1102efl1lex2CflFl1lem2. 122
Note that, if the goal of a fluorescence measurementis to determine fluorophore concentration, the identi-fication of the intrinsic fluorescence coefficient is justone step in a process; the molar absorption andenergy yield of the fluorophore must also be known.Here we present an analytic method, originating
from radiative transport theory, for recovering anintrinsic fluorescence spectrum. In addition to themeasured fluorescence spectrum, a measurement ofreflectance specifies model parameters related totissue optical properties. The recovered spectrumprovides both accurate line shape and absolute inten-sity information about the fluorophores. The expres-sion used to recover intrinsic fluorescence is de-scribed and includes a detector collection efficiencyfactor for a well-defined measurement geometry.Experiments performed on fluorescent tissue phan-toms are used to verify the proposed theory.
2. Theory
Here a model relating fluorescence escape powerfrom a semi-infinite, homogeneous, turbid mediumto the medium’s intrinsic fluorescence coefficient isdescribed. A second expression is introduced forcomputing the fraction of fluorescence escape powerintercepted by a small, distant detector. The combi-nation of these two expressions provides a methodfor recovering the intrinsic fluorescence coefficientfrom surface measurements of fluorescence and opti-cal properties.
A. Theory of Fluorescence Escape
The pattern of fluorescence escape from a tissuesurface can be described by its radiance, L 1W cm22
sr212, which is a radiometric unit defined as the
fluorescence power 1d2P2 escaping from a small sur-face area dA into a small solid angle dV:
L1r; lex, lem2 5d2P1r; lex, lem2
dAproj1r2dV1r2. 132
Vector r describes the position and exit angle offluorescence on the tissue surface; dAproj is the ele-ment area dA1r2 projected in the direction denoted bythe solid angle dV1r2.The fluorescence radiance can be found for arbi-
trary tissue and light delivery geometries by inte-gration of the amount of light reaching a surfaceposition r from a tissue position r8 over the entiretissue volume:
L1r; lex, lem2
5 evolume
b1r8; lex, lem2f1r8; lex2GL1r, r8; lem2dr8, 142
where b 1in inverse centimeters2 is the intrinsicfluorescence coefficient and f 1in watts times inversesquare centimeters2 is the fluence rate of excitationlight. Product bf 1in watts times inverse cubiccentimeters2 therefore represents the local rate offluorescence generation within the tissue. Here GL
1in inverse square centimeters times inverse steradi-ans2 is a Green’s function that describes the radianceof fluorescence at r on the surface caused by anisotropic fluorescent source, bfdV 1in watts2, at r8
within the tissue.For an infinitely wide, slab tissue geometry and a
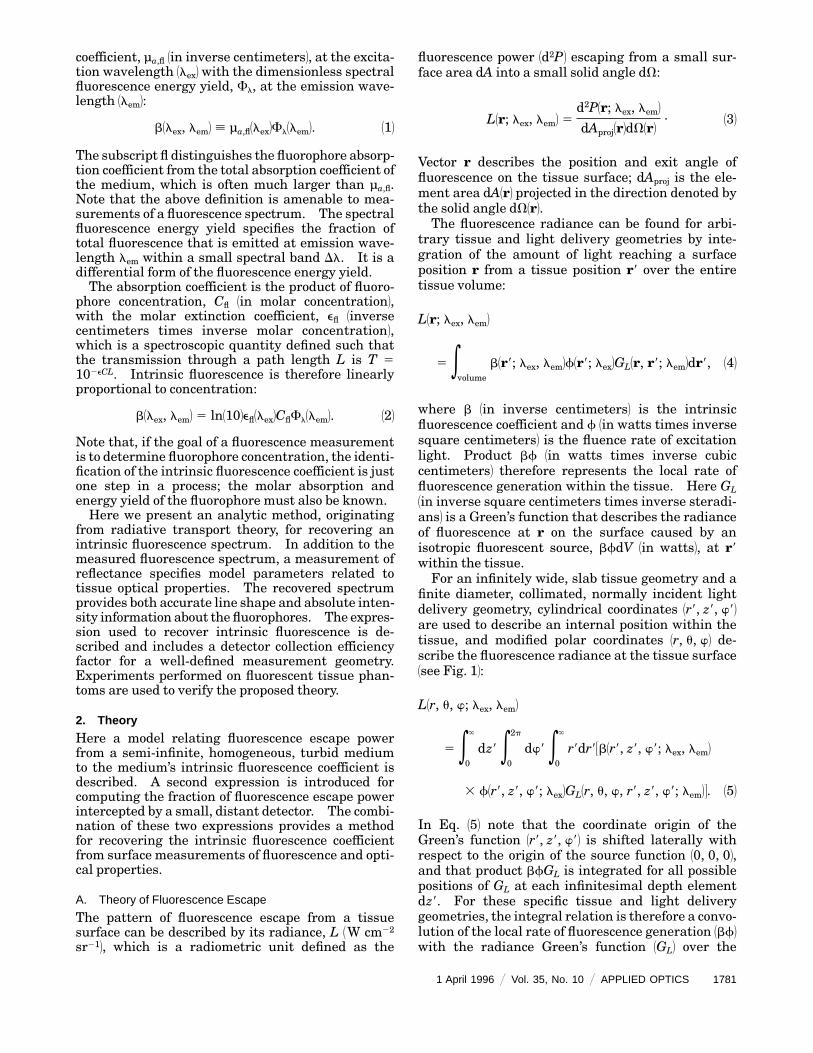
finite diameter, collimated, normally incident lightdelivery geometry, cylindrical coordinates 1r8, z8, w82are used to describe an internal position within thetissue, and modified polar coordinates 1r, u, w2 de-scribe the fluorescence radiance at the tissue surface1see Fig. 12:
L1r, u, w; lex, lem2
5 e0
`
dz8 e0
2p
dw8 e0
`
r8dr83b1r8, z8, w8; lex, lem2
3 f1r8, z8, w8; lex2GL1r, u, w, r8, z8, w8; lem24. 152
In Eq. 152 note that the coordinate origin of theGreen’s function 1r8, z8, w82 is shifted laterally withrespect to the origin of the source function 10, 0, 02,and that product bfGL is integrated for all possiblepositions of GL at each infinitesimal depth elementdz8. For these specific tissue and light deliverygeometries, the integral relation is therefore a convo-lution of the local rate of fluorescence generation 1bf2with the radiance Green’s function 1GL2 over the
1 April 1996 @ Vol. 35, No. 10 @ APPLIED OPTICS 1781
radial and angular tissue coordinates3:
L1r, u, w; lex, lem2 5 e0
`
dz81bf pp GL2. 162
The total fluorescence power escaping from thetissue, P 1in watts2, is calculated by integration of theradiance over the surface coordinates. For a slabgeometry, the area element projected in the directionspecified by u is dAproj 5 dA cos u 5 rdrdw cos u:
P1lex, lem2 5 e0
2p
dw e0
p@2
du
3 e0
`
dr3r cos uL1r, u, w; lex, lem24,
5 2p e0
`
dz8 e0
p@2
du e0
`
dr3r cos u1bf pp GL24.
172
As written above, one can compute the total fluores-cence escape power by 1a2 convolving the excitationfluence rate with the radiance Green’s function forfluorescence, 1b2 integrating the fluorescence radi-
Fig. 1. Theory of fluorescence escape. Excitation light is deliv-ered normal to the surface and defines the cylindrical coordinateorigin. Fluorescence is generated at 1r8, z8, w82 with strengthbf. A fraction bfGL escapes from the tissue surface at 1r, u, w2.Angle u is defined with respect to the surface normal, and w 1notshown2 is defined in the plane of the tissue surface by the lineconnecting the origin and the position of escape.
1782 APPLIED OPTICS @ Vol. 35, No. 10 @ 1 April 1996
ance over the surface area and all exit solid angles,and 1c2 integrating over tissue depth.Amuch simpler method of computing fluorescence
escape power can be accomplished by the use ofone-dimensional quantities that describe the distri-bution of excitation light power, fP 1in watts2, andescape function, GP 1dimensionless2. The fluores-cence escape power from a semi-infinite, homoge-neous turbid medium caused by a normally incident,finite excitation beam is
P1lex, lem2 5 b1lex, lem2 e0
`
dz83fP1z8; lex2GP1z8; lem24,
182
where
fP1z8; lex2 5 C11lex2exp32k11lex2z8@d1lex24
2 C21lex2exp32k21lex2z8@d1lex24, 192
GP1z8; lem2 5 C31lem2exp32k31lem2z8@d1lem24. 1102
Expressions contained in Eqs. 192 and 1102 weredeveloped from Monte Carlo simulations and havebeen discussed in detail previously 1see Table 1 forcoefficient values2.12 The expression for total fluores-cence escape power is simplified because fP and GPvary only as a function of depth, but they stillaccurately describe the total fluorescence escapepower, independent of exit position. With the use ofEqs. 172 and 182, the one-dimensional quantities arerelated to their three-dimensional counterparts bythe relation
fP1z8; lex2GP1z8; lem2
5 2p e0
p@2
du e0
`
dr3r cos u1f pp GL24. 1112
The expressions for fP and GP require reasonableestimates of the effective penetration depth anddiffuse reflectance at the excitation and emissionwavelengths.12 When these expressions 3Eqs. 192and 11024 are used to represent the integral relation inEq. 182 for an incident excitation beam with power P0,the total fluorescence escape is related to the intrin-
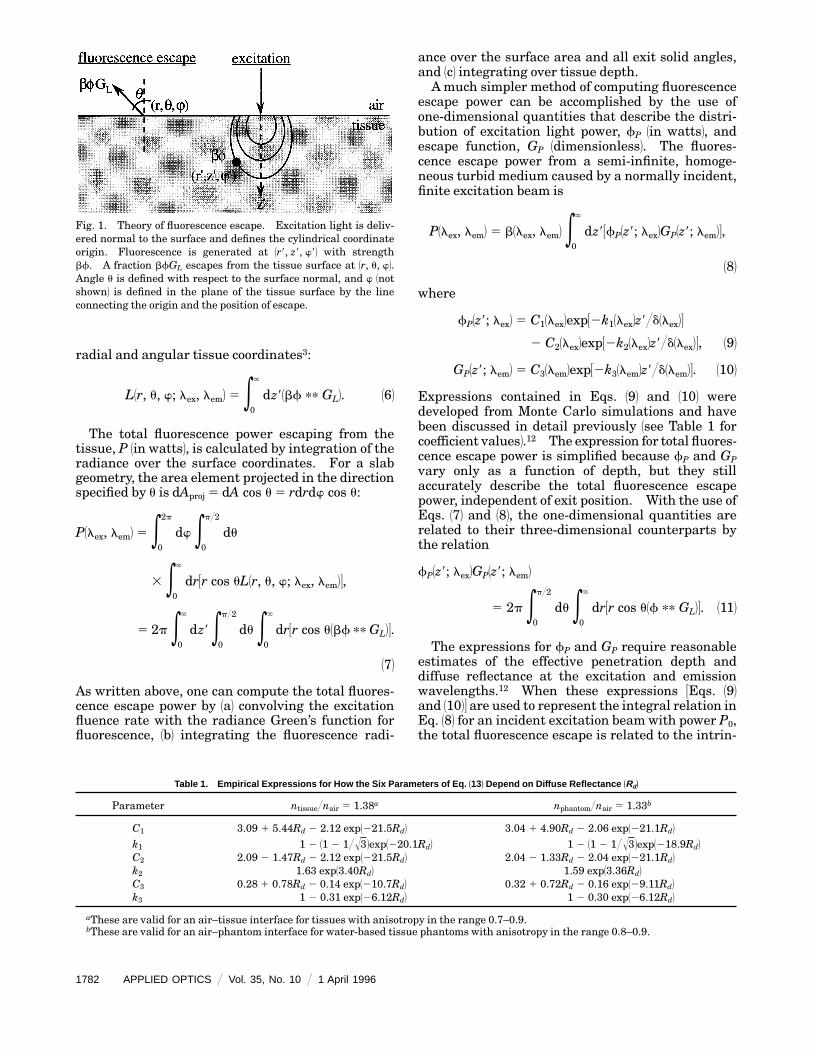
Table 1. Empirical Expressions for How the Six Parameters of Eq. A13B Depend on Diffuse Reflectance ARdB
Parameter ntissue@nair 5 1.38a nphantom@nair 5 1.33b
C1 3.09 1 5.44Rd 2 2.12 exp1221.5Rd2 3.04 1 4.90Rd 2 2.06 exp1221.1Rd2
k1 1 2 11 2 1@Œ32exp1220.1Rd2 1 2 11 2 1@Œ32exp1218.9Rd2C2 2.09 2 1.47Rd 2 2.12 exp1221.5Rd2 2.04 2 1.33Rd 2 2.04 exp1221.1Rd2k2 1.63 exp13.40Rd2 1.59 exp13.36Rd2C3 0.28 1 0.78Rd 2 0.14 exp1210.7Rd2 0.32 1 0.72Rd 2 0.16 exp129.11Rd2k3 1 2 0.31 exp126.12Rd2 1 2 0.30 exp126.12Rd2
aThese are valid for an air–tissue interface for tissues with anisotropy in the range 0.7–0.9.bThese are valid for an air–phantom interface for water-based tissue phantoms with anisotropy in the range 0.8–0.9.

sic fluorescence coefficient by the expression
P1lex, lem2 5 b1lex, lem2P01lex2X1D1lex, lem2, 1122
where
X1D1lex, lem2 5C11lex2C31lem2
k11lex2@d1lex2 1 k31lem2@d1lem2
2C21lex2C31lem2
k21lex2@d1lex2 1 k31lem2@d1lem2. 1132
The term defined in Eq. 1132 will be referred to as theone-dimensional path-length factor, X1D 1in centime-ters2, which characterizes the effective path lengthduring the penetration of excitation light into tissueand the escape of fluorescence from tissue. HereX1D contains four parameters 1C1, k1, C2, and k22 thatare functions of the diffuse reflectance at the excita-tion wavelength, and two parameters 1C3 and k32 thatare functions of reflectance at the emission wave-length. We have shown that the C and k param-eters are solely functions of the diffuse reflectanceover the limited range of scattering anisotropy asso-ciated with human tissue 1Table 12.12Here X1D is also a function of the effective penetra-
tion depth at the two wavelengths. Effective pen-etration depth describes the exponential attenuationof light with depth in a one-dimensional geometry.When scattering is much larger than absorptionsuch that the diffusion approximation represents thelight propagation, then the effective penetrationdepth is
d 51
53µa3µa 1 µs11 2 g2461@2, 1142
where µa is the absorption coefficient, µs is thescattering coefficient, and g is the scattering anisot-ropy. Although the effective penetration depth isbased on diffusion theory, which is not accurate formoderately absorbing media, we have shown thatmodification of d by multiplicative factors k1, k2, andk3 permit an accurate description of light penetra-tion and escape even for moderately and stronglyabsorbing media.12 To recover the intrinsic fluores-cence coefficient from ameasurement of total fluores-cence escape by the use of this method, one mustdetermine the total diffuse reflectance and effectivepenetration depth at both the excitation and emis-sion wavelengths. If quantitative information isrequired, one must also identify the fraction of totalfluorescence escape that is detected by the measure-ment device.
B. Measurement of Fluorescence Escape
If optical fibers are used to collect fluorescence it isimpossible to measure the total fluorescence escap-ing the surface of a medium, because fluorescenceexits at all angles relative to the surface normal10–90°2, whereas most optical fibers have an accep-tance cone angle of 20° or less. It is therefore
important to understand the relationship of themeasured fluorescence signal to the total fluores-cence escape and thus the intrinsic fluorescencecoefficient.The fluorescence power reaching a detector above
the surface of a slab geometry tissue is computed by1a2 finding the amount of fluorescence reaching thedetector in a small solid angle from a small surfacearea, 1b2 integrating over the solid angle of thedetector, and finally 1c2 integrating over the entiresurface. The amount of light reaching a smallsurface area of the detector in a solid angle dV from asmall surface area dA is found by the use of Eq. 132:
d2Pdet 5 LdAprojdV
5 L1dA cos u2dV, 1152
where u is the angle between the surface normal atthe area element position 1r, u, w2 and the detectorposition. The amount of light reaching the entiredetector from dA is found by integration over thesolid angle that covers the entire detector surfacearea:
dPdet 5 eVdet
dV1LdA cos u2. 1162
Finally, the total fluorescence power reaching thedetector is found by integration over the surfacearea:
Pdet 5 eA
dA eVdet
dV1L cos u2. 1172
Note that Vdet, dV, and u in general are each afunction of the location of the surface area element,dA1r, w2. Also, fluorescence radiance L can be afunction of exit angle as well as surface position.For a small detector located far away from a small
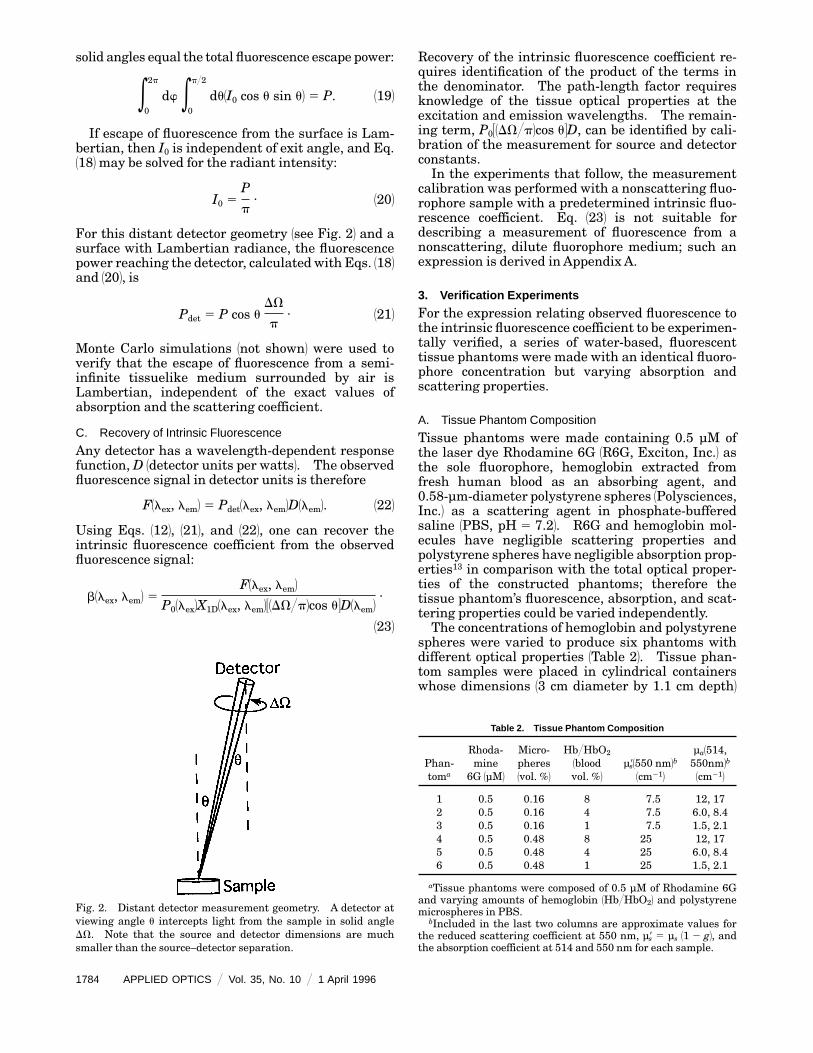
surface area of radiance, the calculation of detectedpower is greatly simplified. In this case, the dimen-sion of the area over which fluorescence is emittedand the detector surface area are assumed muchsmaller than the tissue–detector separation distance.Therefore, the angle that fluorescence travels toreach the detector is approximately independent ofits surface position, and the total power reaching thedetector from an effective total surface area, Aeff, iscalculated by integration of the radiance over theeffective surface area of fluorescence escape:
Pdet 5 1eAeff
dAL2cos uDV,
5 I0 cos uDV, 1182
where I0 cos u is the radiant intensity emitted fromthe effective surface area. Its value may be calcu-lated by the requirement that its integral over all
1 April 1996 @ Vol. 35, No. 10 @ APPLIED OPTICS 1783
solid angles equal the total fluorescence escape power:
e0
2p
dw e0
p@2
du1I0 cos u sin u2 5 P. 1192
If escape of fluorescence from the surface is Lam-bertian, then I0 is independent of exit angle, and Eq.1182may be solved for the radiant intensity:
I0 5P
p. 1202
For this distant detector geometry 1see Fig. 22 and asurface with Lambertian radiance, the fluorescencepower reaching the detector, calculated with Eqs. 1182and 1202, is
Pdet 5 P cos uDV
p. 1212
Monte Carlo simulations 1not shown2 were used toverify that the escape of fluorescence from a semi-infinite tissuelike medium surrounded by air isLambertian, independent of the exact values ofabsorption and the scattering coefficient.
C. Recovery of Intrinsic Fluorescence
Any detector has a wavelength-dependent responsefunction,D 1detector units per watts2. The observedfluorescence signal in detector units is therefore
F1lex, lem2 5 Pdet1lex, lem2D1lem2. 1222
Using Eqs. 1122, 1212, and 1222, one can recover theintrinsic fluorescence coefficient from the observedfluorescence signal:
b1lex, lem2 5F1lex, lem2
P01lex2X1D1lex, lem231DV@p2cos u4D1lem2.
1232
Fig. 2. Distant detector measurement geometry. A detector atviewing angle u intercepts light from the sample in solid angleDV. Note that the source and detector dimensions are muchsmaller than the source–detector separation.
1784 APPLIED OPTICS @ Vol. 35, No. 10 @ 1 April 1996
Recovery of the intrinsic fluorescence coefficient re-quires identification of the product of the terms inthe denominator. The path-length factor requiresknowledge of the tissue optical properties at theexcitation and emission wavelengths. The remain-ing term, P031DV@p2cos u4D, can be identified by cali-bration of the measurement for source and detectorconstants.In the experiments that follow, the measurement
calibration was performed with a nonscattering fluo-rophore sample with a predetermined intrinsic fluo-rescence coefficient. Eq. 1232 is not suitable fordescribing a measurement of fluorescence from anonscattering, dilute fluorophore medium; such anexpression is derived inAppendixA.
3. Verification Experiments
For the expression relating observed fluorescence tothe intrinsic fluorescence coefficient to be experimen-tally verified, a series of water-based, fluorescenttissue phantoms were made with an identical fluoro-phore concentration but varying absorption andscattering properties.
A. Tissue Phantom Composition
Tissue phantoms were made containing 0.5 µM ofthe laser dye Rhodamine 6G 1R6G, Exciton, Inc.2 asthe sole fluorophore, hemoglobin extracted fromfresh human blood as an absorbing agent, and0.58-µm-diameter polystyrene spheres 1Polysciences,Inc.2 as a scattering agent in phosphate-bufferedsaline 1PBS, pH 5 7.22. R6G and hemoglobin mol-ecules have negligible scattering properties andpolystyrene spheres have negligible absorption prop-erties13 in comparison with the total optical proper-ties of the constructed phantoms; therefore thetissue phantom’s fluorescence, absorption, and scat-tering properties could be varied independently.The concentrations of hemoglobin and polystyrene
spheres were varied to produce six phantoms withdifferent optical properties 1Table 22. Tissue phan-tom samples were placed in cylindrical containerswhose dimensions 13 cm diameter by 1.1 cm depth2
Table 2. Tissue Phantom Composition
Phan-toma
Rhoda-mine
6G 1µM2
Micro-pheres1vol. %2
Hb@HbO2
1bloodvol. %2
µ8s1550 nm2b
1cm212
µa1514,550nm2b
1cm212
1 0.5 0.16 8 7.5 12, 172 0.5 0.16 4 7.5 6.0, 8.43 0.5 0.16 1 7.5 1.5, 2.14 0.5 0.48 8 25 12, 175 0.5 0.48 4 25 6.0, 8.46 0.5 0.48 1 25 1.5, 2.1
aTissue phantoms were composed of 0.5 µM of Rhodamine 6Gand varying amounts of hemoglobin 1Hb@HbO22 and polystyrenemicrospheres in PBS.
bIncluded in the last two columns are approximate values forthe reduced scattering coefficient at 550 nm, µ8s 5 µs 11 2 g2, andthe absorption coefficient at 514 and 550 nm for each sample.
were large enough for the turbid media to be consid-ered semi-infinite.Nonscattering fluorophore solutions were made
containing 0.5 µM R6G in three different solvents.The first solution contained ethanol as a solvent andwas used to calibrate the measurement system,using Eq. 1A52 of Appendix A. The second and thirdnonscattering solutions were mixed in PBS and 2.5%bovine serum albumin–PBS, respectively, and theywere used as standards against which fluorescencemeasurements from the turbid phantoms could becompared, usingEq. 1A62 of AppendixA. Nonscatter-ing samples were placed in identical cylindricalcontainers whose bottom and sides were coated withnonglossy black paint to absorb light. This backingeliminated multiple reflections of excitation andemission light. The concentration of R6Gwas smallenough such that the nonscattering samples could beconsidered optically dilute 1sum of absorbance atexcitation and emission wavelengths ,0.12 in acontainer with a 1.1-cm path length. In addition,albumin is optically dilute in the 500–700-nm wave-length region at the concentration and path lengthused in this experiment.
B. Fluorescence Measurements
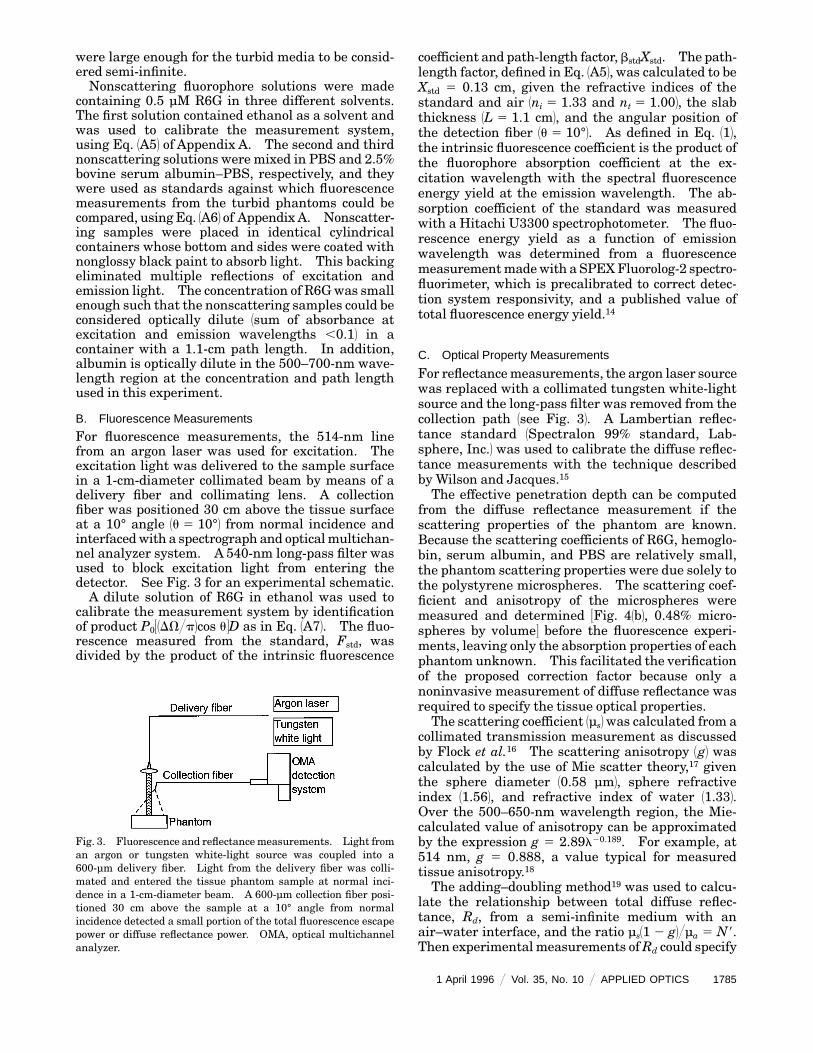
For fluorescence measurements, the 514-nm linefrom an argon laser was used for excitation. Theexcitation light was delivered to the sample surfacein a 1-cm-diameter collimated beam by means of adelivery fiber and collimating lens. A collectionfiber was positioned 30 cm above the tissue surfaceat a 10° angle 1u 5 10°2 from normal incidence andinterfacedwith a spectrograph and opticalmultichan-nel analyzer system. A 540-nm long-pass filter wasused to block excitation light from entering thedetector. See Fig. 3 for an experimental schematic.A dilute solution of R6G in ethanol was used to
calibrate the measurement system by identificationof product P031DV@p2cos u4D as in Eq. 1A72. The fluo-rescence measured from the standard, Fstd, wasdivided by the product of the intrinsic fluorescence
Fig. 3. Fluorescence and reflectancemeasurements. Light froman argon or tungsten white-light source was coupled into a600-µm delivery fiber. Light from the delivery fiber was colli-mated and entered the tissue phantom sample at normal inci-dence in a 1-cm-diameter beam. A 600-µm collection fiber posi-tioned 30 cm above the sample at a 10° angle from normalincidence detected a small portion of the total fluorescence escapepower or diffuse reflectance power. OMA, optical multichannelanalyzer.
coefficient and path-length factor,bstdXstd. The path-length factor, defined in Eq. 1A52, was calculated to beXstd 5 0.13 cm, given the refractive indices of thestandard and air 1ni 5 1.33 and nt 5 1.002, the slabthickness 1L 5 1.1 cm2, and the angular position ofthe detection fiber 1u 5 10°2. As defined in Eq. 112,the intrinsic fluorescence coefficient is the product ofthe fluorophore absorption coefficient at the ex-citation wavelength with the spectral fluorescenceenergy yield at the emission wavelength. The ab-sorption coefficient of the standard was measuredwith a Hitachi U3300 spectrophotometer. The fluo-rescence energy yield as a function of emissionwavelength was determined from a fluorescencemeasurementmadewith a SPEXFluorolog-2 spectro-fluorimeter, which is precalibrated to correct detec-tion system responsivity, and a published value oftotal fluorescence energy yield.14
C. Optical Property Measurements
For reflectancemeasurements, the argon laser sourcewas replaced with a collimated tungsten white-lightsource and the long-pass filter was removed from thecollection path 1see Fig. 32. A Lambertian reflec-tance standard 1Spectralon 99% standard, Lab-sphere, Inc.2 was used to calibrate the diffuse reflec-tance measurements with the technique describedby Wilson and Jacques.15The effective penetration depth can be computed
from the diffuse reflectance measurement if thescattering properties of the phantom are known.Because the scattering coefficients of R6G, hemoglo-bin, serum albumin, and PBS are relatively small,the phantom scattering properties were due solely tothe polystyrene microspheres. The scattering coef-ficient and anisotropy of the microspheres weremeasured and determined 3Fig. 41b2, 0.48% micro-spheres by volume4 before the fluorescence experi-ments, leaving only the absorption properties of eachphantom unknown. This facilitated the verificationof the proposed correction factor because only anoninvasive measurement of diffuse reflectance wasrequired to specify the tissue optical properties.The scattering coefficient 1µs2was calculated from a
collimated transmission measurement as discussedby Flock et al.16 The scattering anisotropy 1g2 wascalculated by the use of Mie scatter theory,17 giventhe sphere diameter 10.58 µm2, sphere refractiveindex 11.562, and refractive index of water 11.332.Over the 500–650-nm wavelength region, the Mie-calculated value of anisotropy can be approximatedby the expression g 5 2.89l20.189. For example, at514 nm, g 5 0.888, a value typical for measuredtissue anisotropy.18The adding–doubling method19 was used to calcu-
late the relationship between total diffuse reflec-tance, Rd, from a semi-infinite medium with anair–water interface, and the ratio µs11 2 g2@µa 5 N8.Then experimentalmeasurements ofRd could specify
1 April 1996 @ Vol. 35, No. 10 @ APPLIED OPTICS 1785

N8. Rearranging the expression for effective pen-etration depth 3see Eq. 11424 by the use ofN8 yields theexpression
d 5N8
µs11 2 g2331N8 1 1241@2. 1242
D. Results
The fluorescence spectra of R6G in a series of tissuephantoms with varied optical properties were mea-sured and then corrected for the optical properties,detector geometry, and detector responsivity by theuse of Eq. 1232 to yield the intrinsic fluorescencecoefficient, b.A summary of the steps followed to determine the
intrinsic fluorescence coefficient are presented inFig. 4 for phantom 5. The experimental verificationof the correction factor required threemeasurements:one measurement of the fluorescence 1Fig. 4A2 andtwo measurements to determine the diffuse reflec-tance 1Fig. 4A2 and penetration depth 1Fig. 4B2. Thepenetration depth was calculated from the combina-tion of the reflectance measurement and the sepa-rate calculation of polystyrene sphere reduced scat-tering coefficient 1Fig. 4B2. Once the spectra for Rdand d were established, the path-length factor spec-
1786 APPLIED OPTICS @ Vol. 35, No. 10 @ 1 April 1996
trum, X1D, was calculated by the use of the expres-sions in Eq. 1132 and Table 1 Fig. 41C2. Finally, theintrinsic fluorescence coefficient was calculated bythe use of Eq. 1232 1Fig. 4D2.A summary of the intrinsic fluorescence coefficient
recovery from all phantoms is presented in Fig. 5.The measured fluorescence spectra 1Fig. 5A2 weredistorted by the effects of the tissue optical properties.The fluorescence spectrameasured from tissue phan-toms include an increased signal at wavelengthsbelow 520 nm. This was due to excitation lightdiffusely reflected from the turbid sample, partiallytransmitted through the long-pass filter, and dis-persed over the array detector in a narrow-wave-length band centered on 514 nm. Application of therecovery method, however, permitted determinationof the intrinsic fluorescence coefficient 1Fig. 5B2.For comparison in Fig. 5B, the intrinsic fluorescencecoefficients of R6G in PBS and albumin–PBS areplotted. The intrinsic fluorescence spectra of thedilute solutions were calculated by the use of Eq. 1A62of AppendixA.The range of tissue optical properties used in this
study was extensive. The values of diffuse reflec-tance from the four phantoms covered the range0.04–0.4 at the excitation wavelengths, and 0.02–0.8over the emission wavelengths 1Fig. 62.
Fig. 4. Summary of measurements and calculations used to determine the intrinsic fluorescence coefficient for phantom 5: A,measurements of fluorescence and diffuse reflectance spectra; B, predetermined reduced scattering coefficient spectrum 10.48%microspheres by volume2 and effective penetration depth spectrum calculated with Eq. 1242; C, correction factor spectrum calculated withEq. 1122 and Table 1; D, intrinsic fluorescence coefficient spectra using Eq. 1232, compared with the line shape of measured fluorescence.

4. Discussion
A. Path-Length Factor Sensitivity
As expressed in Section 2, the one-dimensional path-length factor for optical properties is a function offour variables: the diffuse reflectance and effectivepenetration depth at both the excitation and emis-sion wavelengths. Each of these optical parametersmust be measured or estimated in order to recoverintrinsic fluorescence from measured fluorescence;therefore, one can expectmeasurement or approxima-tion errors in the values of tissue optical parameters.A sensitivity analysis was undertaken to estimatethe error in the recovered intrinsic fluorescencecoefficient caused by errors in the optical param-eters.The analysis involved computing the relative error
in the intrinsic fluorescence coefficient caused by anerror in one, two, or all four of the optical parameters:
Fig. 5. Summary of intrinsic fluorescence recovery from the sixtissue phantoms 1see Table 2 for phantom compositions2 and thetwo dilute R6G solutions: A, measured, uncorrected fluorescencespectra, F; B, corrected spectra, displayed as the intrinsic fluores-cence coefficient, b.
Rd1lex2, Rd1lem2, d1lex2, and d1lex2. Values were chosenfor the true optical parameter sets, and then twoerroneous optical parameter sets were computedwith a positive or negative relative error. The path-length factor, X, was calculated for each set of opticalparameters, and the relative error in the intrinsicfluorescence coefficient was calculated as Db@b 5Xtrue@Xerr
21. An example of this error analysis isgiven in Table 3. The intrinsic fluorescence coeffi-
Fig. 6. Diffuse reflectance spectra of the six tissue phantoms.The excitation wavelength used in these experiments 1514 nm2 ismarked by the vertical arrow. These spectra were used to correctfluorescence spectra from the phantoms using Eq. 1232 and Table 1.
Table 3. Sensitivity Analysis of the Calculated Intrinsic FluorescenceCoefficient, b, to Errors in Optical Parameters
Error in Optical Parametera
Error inIntrinsic
Fluorescenceb
DRd1lex2
Rd1lex2
Dd1lex2
d1lex2
DRd1lem2
Rd1lem2
Dd 1lem2
d1lem2
Db
b
10.1 0 0 0 20.0320.1 0 0 0 0.030 10.1 0 0 20.050 20.1 0 0 0.060 0 10.1 0 20.040 0 20.1 0 0.040 0 0 10.1 20.040 0 0 20.1 0.05
10.1 0 10.1 0 20.0720.1 0 20.1 0 0.080 10.1 0 10.1 20.090 20.1 0 20.1 0.11
10.1 10.1 10.1 10.1 20.1520.1 20.1 20.1 20.1 0.20
aRelative errors in one, two, or all four optical parameters wereused to calculate errors in the one-dimensional correction factor,using the relationship in Eq. 1132.
bPath-length factor errors were used to calculate errors in therecovered value of the intrinsic fluorescence coefficient. For thisset of error analyses, the true optical properties wereRd1lex2 5 0.1,d1lex2 5 0.03 cm, Rd1lem2 5 0.2, and d1lem2 5 0.05 cm.
1 April 1996 @ Vol. 35, No. 10 @ APPLIED OPTICS 1787
cient error was studied as a function of 1a2 differentcombinations of optical parameter values, and 1b2 thesign and magnitude of the relative error in opticalparameter, ranging from 610% to 630% of truevalue.The results of this analysis may be summarized as
follows. First, an overestimate in any or all opticalparameters leads to an underestimate in the intrin-sic fluorescence coefficient and vice versa. Second,the intrinsic fluorescence recovery is more sensitiveto underestimation of any or all optical parametersthan overestimation. Finally, the intrinsic fluores-cence error is approximately 50% of the fractionalerror in optical parameters if only one variable iserroneous, approximately 100% of the fractionalerror in optical parameters if either Rd1lex2 andRd1lem2 or d1lex2 and d1lex2 are faulty, and approxi-mately 200% of the fractional error in optical param-eters if all four optical properties are incorrect. Forexample, there is only a 25% error in the recoveredintrinsic fluorescence coefficient if the diffuse reflec-tance at the excitation wavelength is 110% of thetrue value; there is a 220% intrinsic fluorescenceerror if diffuse reflectance and penetration depth atboth wavelengths are overestimated by 10% of theirtrue values.
B. Discussion of Experiment Results
As seen in Fig. 4A, tissue optical properties affect theamount of fluorescence escaping a tissue in twoways: 1a2 the fluorescence line shape is distorted,especially by reabsorption of emitted light by chromo-phores such as hemoglobin, and 1b2 the fluorescenceintensity is highly variable, being both greater andless than the intensity measured from a nonscatter-ing dilute fluorophore medium. These two factorshave made in vivo fluorescence spectroscopy difficultto quantify.The shape and absolute intensity of observed
fluorescence spectra from tissue phantom pairs 11, 42,12, 52 and 13, 62 are very similar 1Fig. 5A2. Phantomsin each pair have equal concentrations of hemoglo-bin but different concentrations of polystyrenespheres 1Table 22. One can therefore conclude thatthe escape of fluorescence from a tissue is relativelyinsensitive to the scattering properties when fluores-cence is collected with a distant detector. Durkin etal.6 found that a fluorescence escape model based onthe Kubelka–Munk method was also insensitive toscattering.Application of the path-length factor for tissue
optical properties, X1D, to the measured fluorescencespectra effectively removed the line-shape distor-tions, and when combined with a well defined,calibrated measurement system, allowed recovery ofthe intrinsic fluorescence properties from the tissuephantoms. The magnitude of the recovered intrin-sic fluorescence spectra nearly matches the spectrafrom R6G in albumin–PBS but is significantly lessthan the intrinsic fluorescence coefficient measuredfrom the R6G in PBS solution. This suggests that
1788 APPLIED OPTICS @ Vol. 35, No. 10 @ 1 April 1996
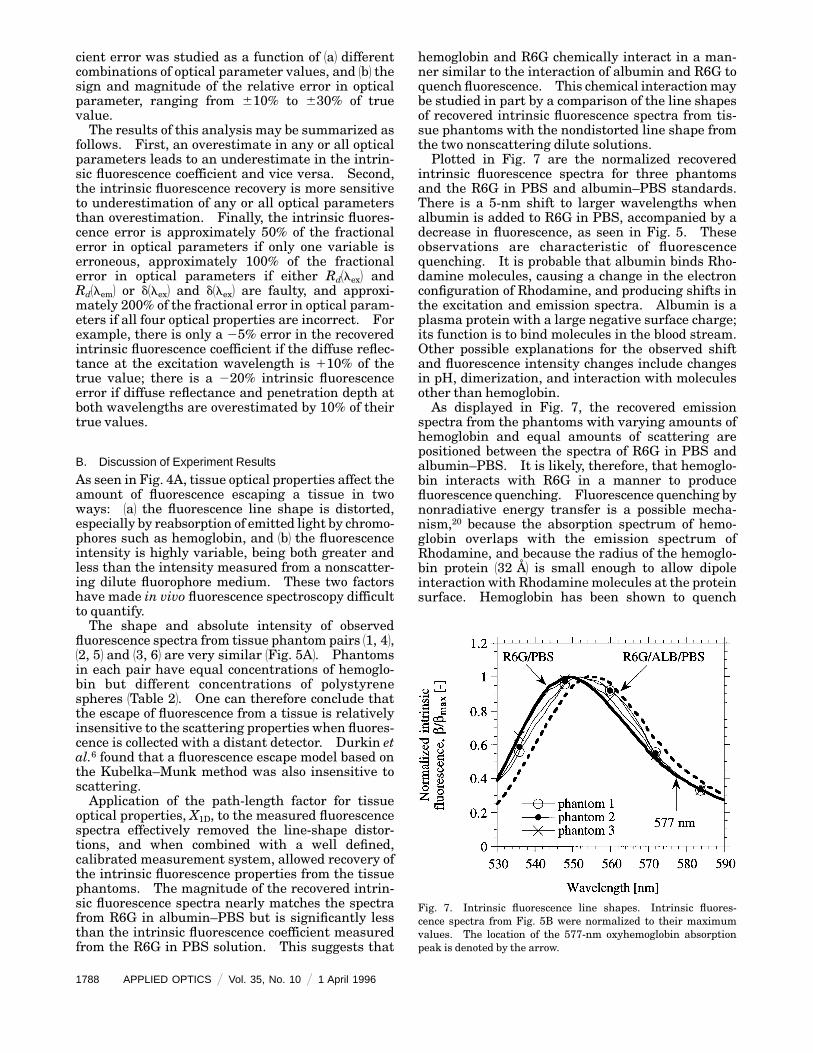
hemoglobin and R6G chemically interact in a man-ner similar to the interaction of albumin and R6G toquench fluorescence. This chemical interactionmaybe studied in part by a comparison of the line shapesof recovered intrinsic fluorescence spectra from tis-sue phantoms with the nondistorted line shape fromthe two nonscattering dilute solutions.Plotted in Fig. 7 are the normalized recovered
intrinsic fluorescence spectra for three phantomsand the R6G in PBS and albumin–PBS standards.There is a 5-nm shift to larger wavelengths whenalbumin is added to R6G in PBS, accompanied by adecrease in fluorescence, as seen in Fig. 5. Theseobservations are characteristic of fluorescencequenching. It is probable that albumin binds Rho-damine molecules, causing a change in the electronconfiguration of Rhodamine, and producing shifts inthe excitation and emission spectra. Albumin is aplasma protein with a large negative surface charge;its function is to bind molecules in the blood stream.Other possible explanations for the observed shiftand fluorescence intensity changes include changesin pH, dimerization, and interaction with moleculesother than hemoglobin.As displayed in Fig. 7, the recovered emission
spectra from the phantoms with varying amounts ofhemoglobin and equal amounts of scattering arepositioned between the spectra of R6G in PBS andalbumin–PBS. It is likely, therefore, that hemoglo-bin interacts with R6G in a manner to producefluorescence quenching. Fluorescence quenching bynonradiative energy transfer is a possible mecha-nism,20 because the absorption spectrum of hemo-globin overlaps with the emission spectrum ofRhodamine, and because the radius of the hemoglo-bin protein 132 Å2 is small enough to allow dipoleinteraction with Rhodaminemolecules at the proteinsurface. Hemoglobin has been shown to quench
Fig. 7. Intrinsic fluorescence line shapes. Intrinsic fluores-cence spectra from Fig. 5B were normalized to their maximumvalues. The location of the 577-nm oxyhemoglobin absorptionpeak is denoted by the arrow.

fluorescence of cell membrane fluorescent probesthrough an energy transfermechanism.21 Note thatthe intrinsic fluorescence line shapes of the phan-toms closely match the line shapes of the nonscatter-ing standards, even in the wavelength region of anoxyhemoglobin absorption maximum, centered on577 nm. This implies that the method used tocorrect for optical property effects was effective.
C. Estimation of Fluorophore Concentration
If the intrinsic fluorescence properties of Rhodaminephantoms used in the experiments are similar to theintrinsic fluorescence of the R6G in the albumin–PBS solution, it is possible to estimate fluorophoreconcentration. A least-squares curve fit was used toestimate the fluorophore concentration of a phantomby comparison of the phantom intrinsic fluorescencecoefficient spectrum, b, to the spectrum of the 0.5-µMR6G in albumin–PBS solution, bdil. Spectral datain the 530–650-nm region were used in the fit, andthe ratio of the phantom fluorophore concentrationto a known concentration of the R6G in albumin–PBS was the free parameter. The phantom concen-tration was calculated by minimization of thechi-squared value,
x2 5 oli5530
650
3b1li2 2C
Cdilbdil1li24
2. 1252
The results of the estimations of the phantomfluorophore concentration are listed in Table 4. Theerror in the predicted fluorophore concentrationranged from 222% to 116%, with a normalizedstandard deviation of 15% from the true concentra-tion of 0.5 µM. By comparing the estimates of dyeconcentrations in Table 4 to the optical properties ofeach phantom in Table 2, we note that there is nocorrelation between the sign or magnitude of theprediction error and the phantom optical properties.The variation of the intrinsic fluorescence coeffi-
cient with the fluorophore environment encounteredin the experiment illustrates an obstacle if the goalof the fluorescence measurement is to quantify fluo-rophore concentration. Once the intrinsic fluores-cence coefficient is recovered, the fluorophore concen-tration may be determined only with additional
Table 4. Results of Least-Squares Estimationof Fluorophore Concentration a
Phantomb Calculated Concentration 1µM2 Error 1%2
1 0.46 282 0.42 2163 0.39 2224 0.51 125 0.49 226 0.58 116
aA least-squares regression was performed on intrinsic fluores-cence coefficient data between 530 and 650 nm, with fluorophoreconcentration as the free parameter 3Eq. 12524.
bEach phantom contained 0.5 µM of Rhodamine 6G.
information about the extinction coefficient and fluo-rescence energy yield. In some cases, these param-eters may be known a priori. In other cases, addi-tional measurements are required to determineconcentration. The assumption that the extinctioncoefficient and fluorescence energy yield of R6G inthe six phantoms and in the albumin–PBS solutionare similarwas not proved by additional experiments.The least-squares estimation method presented inthis subsection should therefore be used only as anillustration of how one might quantify fluorophoreconcentration from recovered intrinsic fluorescencecoefficient spectra.
D. Fluorescence Measurement Calibration
If quantitative fluorescence information is desired,the calibration of fluorescence measurements is re-quired to calculate the detector collection efficiency,defined as the fraction of fluorescence escape powerreaching the detector, and the spectral responsivityof the detection system. One common approach isto use a fluorescence standard with known absorp-tion and fluorescence properties, as performed in theexperiments described above. However, the collec-tion efficiency of the detection system for turbidmedia such as tissue, and nonscattering, opticallydilute media such as a fluorescence standard may bedifferent.For the distant detector geometry used here, the
collection efficiency is determined by the angularpattern of fluorescence escape. The angular pat-tern of escape from a typical optically thick tissue isLambertian; that is, the angular intensity of remit-ted light is proportional to the cosine of the escapeangle. The angular escape pattern from a nonscat-tering, dilute solution differs from a Lambertianpattern 3see Eq. 1A324. The differences in collectionefficiency must be determined to calibrate the mea-surement system successfully.
E. Range of Model Validity
The intrinsic fluorescence recovery method pre-sented here worked equally well for absorption-dominant 1Rd , 0.052, comparable absorption andscattering 1Rd < 0.12, and scattering-dominant1Rd . 0.22 tissue optical characteristics 1Fig. 62. Therange of optical properties for which the describedmodel of fluorescence escape is valid represents animprovement over models based on Beer’s law,Kubelka–Munk, or diffusion theories.
F. Measurement of Tissue Optical Properties
The correction factor for tissue optical propertyeffects presented here is a heuristic expression basedon radiative transport theory; its parameters havebeen determined by the use of extensiveMonte Carlosimulations. The form of the expression depends onlight distribution quantities that are easily mea-sured noninvasively. Diffuse reflectance may bemeasured with a fiber-optic device by placement ofthe collection fiber above the illuminated area, and
1 April 1996 @ Vol. 35, No. 10 @ APPLIED OPTICS 1789

the measurement may be calibrated by the use of areflectance standard. The effective penetrationdepth is a measure of not only the light attenuationinto the tissue but also the radial attenuation of lightaway from a thin delivery beam on the tissue sur-face.22 A second collection fiber placed above thetissue but to the side of the illuminated area may becalibrated by the use of tissue phantoms with knownoptical properties to determine the effective penetra-tion depth.A more challenging problem is the application of
this correction theory in the clinical setting, wherethe measurement geometry used in this paper mayoften be impractical. The light delivery and mea-surement device may be a small diameter fiber-opticcatheter placed in contact with the target tissue.Recent approaches that use photon migrationtheory10,11 have allowed identification of intrinsicfluorescence relative to the tissue absorption coeffi-cient at the excitation wavelength, b1lex, lem2@µa1lex2,for optical fiber probe geometries. This quantitydoes provide accurate line-shape information, butthe absolute intensity is still coupled to the tissueabsorption coefficient. Therefore measurementsfrom two tissues with the same amount of fluoro-phore but different amounts of absorption will havethe same shape, but there may be a significantdifference in the calculated fluorescence intensity.
5. Conclusion
The recovery method presented here successfullyidentified the intrinsic fluorescence coefficient ofturbid tissue phantoms from measurements of fluo-rescence and tissue optical properties. However, itwas shown that the interaction of fluorophore mol-ecules with the hemoglobin protein produced fluores-cence quenching, thereby limiting the ability topredict fluorophore concentration with certainty.With the assumption that the intrinsic fluorescenceproperties of Rhodaminemixed with hemoglobin andpolystyrene spheres and of Rhodamine 6G mixedwith albumin were identical, fluorophore concentra-tions of the turbid solutions were predicted to within15% of the true concentration.The intrinsic fluorescence recovery method pre-
sented in this paper will be helpful in the de-velopment of quantitative in vivo fluorescencespectroscopy. Fluorophore concentration can be de-termined if the fluorescence energy yield and molarextinction coefficient are known. Alternatively, ifthe absorption coefficient of the fluorophore is known,the fluorescence energy yield can be calculated. Invivo determination of the intrinsic fluorescence coef-ficient can be used to study chemical characteristicsof fluorescent molecules, such as local environment,interaction with other molecules, and aggregation.The technique used to calculate the intrinsic fluores-cence coefficient may be extended to media in whichthere exist several fluorophores with overlappingabsorption and emission spectra by the use of multi-component analysis techniques.
1790 APPLIED OPTICS @ Vol. 35, No. 10 @ 1 April 1996
An expression has been presented that describesthe escape of fluorescence from a slab geometrytissue because of collimated surface excitation. Themanipulation of this expression permits the elimina-tion of absorption and scattering effects on flu-orescence measurements. Furthermore, with awell-defined measurement geometry and calibrateddetection system, the intrinsic fluorescence coeffi-cient of a homogeneous tissue can be determined fora wide range of tissue optical characteristics, rang-ing from absorption-dominant to scattering-domi-nant light interactions with tissue. The successfulapplication of the theory requires knowledge of thetissue optical properties at both the excitation andemission wavelengths. This may be accomplishedby noninvasive measurements of the diffuse reflec-tance and effective penetration depth.
Appendix A. Fluorescence Escape from aNonscattering, Optically Thin Slab
The escape of fluorescence from a nonscattering,dilute fluorophore medium can be computed byconsideration of the following: 1a2 the exponentialattenuation of excitation and emission light; 1b2 theisotropic nature of emission; and 1c2 reflections atboundaries where there is a refractive index mis-match. The following description of fluorescenceescape assumes an infinitely wide slab of thicknessL, with a refractive index matched bottom boundaryand a top boundary interfaced with air. Thematched bottom boundary eliminatesmultiple reflec-tions of excitation and emission light that wouldcontribute to the observed fluorescence. The refrac-tive index of the slab, ni, is assumed to have a higherrefractive index than air, nt 5 1.00, so that fluores-cence reaching the top surface may experience totalinternal reflection. The slab medium has absorp-tion coefficients of µa1lex2 and µa1lem2 1cm212 at theexcitation and emission wavelengths, respectively.A rigorous expression for the fluorescence escape
as a function of exit angle, here termed the radiantintensity 1W sr212, was derived in another publica-tion.23 The intensity for fluorescence escaping thetop surface of the slab at an angle ut with respect tothe surface normal caused by a normally incident,collimated, finite diameter excitation beam is
I1ut; lex, lem2 5b1lex, lem2P0
4p
31 2 exp321µa1lex2 1 µa1lem2@cos ui2L4
µax 1 µam@cos ui
3 11 2 R0211 2 R2nt2 cos ut
ni2 cos ui
, 1A12
where ui is the angle of fluorescence escape withinthe slab, related to ut by Snell’s law,R0 is the specularreflection coefficient for normal incidence, and R isthe Fresnel reflection coefficient for unpolarized

light at 1ui, ut2:
R 5 R1ui, ut2
5 5R0 5
1ni 2 nt22
1ni 1 nt22ui 5 0
1
2 3sin21ui 2 ut2
sin21ui 1 ut21tan21ui 2 ut2
tan21ui 1 ut24 0 , ui , uc
1 ui $ uc
,
1A22
where uc is the critical angle for total internalreflection, uc 5 sin211nt@ni2. For an air–water inter-face, the specular reflection for normal incidence is2%, and the critical angle within the slab is 49°.Equation 1A12 may be simplified for an optically
dilute solution. If the condition for an opticallydilute solution is met, i.e., 1µa1lex2 1 µa1lex2@cos ui2L91, then the exponential term may be expanded in aTaylor series with only the first two terms retained.Fluorescence escape intensity from an optically di-lute medium is therefore
Idil1ut; lex, lem2 5b1lex, lem2P0
4pL11 2 R0211 2 R2
3nt2 cos ut
ni2 cos ui
. 1A32
Using the geometry described in Section 2, one canfind the power detected by a small, distant detectorby multiplying the intensity of the fluorescenceescaping from the slab in the direction of the detector1specified by u 5 10° in the experiments2 by the solidangle intercepted by the detector. Including theresponsivity of the detection system, D 1detectorunits per watts2, the measured fluorescence in detec-tor units is
Fdil1lex, lem2 5 Idil1u; lex, lem2DVD1lem2
5 b1lex, lem2P0Xdil
DV
pD1lem2, 1A42
where
Xdil1lex, lem2 5L
411 2 R0211 2 R2
nt2 cos u
ni2 cos ui
, 1A52
and Xdil represents a path-length factor for thenonscattering, dilute medium. For a 10° exit angleand a slab thickness of 1 cm, Xdil 5 0.13 cm.Rearranging Eq. 1A42, we find that the intrinsicfluorescence coefficient is
bdil1lex, lem2 5Fdil1lex, lem2
P01lex2Xdil1lex, lem21DV@p2D1lem2. 1A62
This method of intrinsic fluorescence recovery from a
nonscattering, optically dilute solution is used in theverification experiments described in Section 3.Alternatively, Eq. 1A62may be solved for P01DV@p2D
to calibrate the measurement system if the intrinsicfluorescence coefficient from a standard solution isknown:
P01lex2DV
pD1lem2 5
Fstd1lex, lem2
bstd1lex, lem2Xstd1lex, lem2. 1A72
This calibration method is used in the verificationexperiments used for this study.
The authors thank L. Wang and A. Durkin fordiscussions on the theory of fluorescence escape fromturbid media, and J. Schwartz and R. Richards-Kortum for assistance with and use of the opticalmultichannel analyzer detection system. This re-search was supported by the National Institutes ofHealth 1R29-HL450452, Department of Energy 1DE-FG05-91ER6172262, Office of Naval Research Medi-cal Free Electron Laser Program 1N00015-91-J-13542, and anAmerican Society for Lasers inMedicineand Surgery student research grant.
References1. R. Richards-Kortum, A. Mehta, G. Hayes, R. Cothren, T.
Kolubayev, C. Kittrell, N. B. Ratliff, J. R. Kramer, and M. S.Feld, ‘‘Spectral diagnosis of atherosclerosis using an opticalfiber laser catheter,’’Am. Heart J. 118, 381–391 119892.
2. K. T. Schomacker, J. K. Frisoli, C. C. Compton, T. J. Flotte,J. M. Richter, N. S. Nishioka, and T. F. Deutsch, ‘‘Ultravioletlaser-induced fluorescence of colonic tissue: basic biologyand diagnostic potential,’’ Lasers Surg. Med. 12, 63–78 119922.
3. M. Keijzer, R. Richards-Kortum, S. Jacques, and M. Feld,‘‘Fluorescence spectroscopy of turbid media: autofluores-cence of the human aorta,’’Appl. Opt. 28, 4286–4292 119892.
4. S. R. Brown and D. I. Vernon, ‘‘The quantitative determina-tion of porphyrins in tissues and body fluids: applications instudies of photodynamic therapy,’’ in Photodynamic Therapyof Neoplastic Disease, D. Kessel, ed. 1CRC, Ann Arbor, Mich.,19902 Vol. 1, pp. 109–128.
5. G. H. M. Gijsbers, D. Breederveld, M. J. C. van Gemert, T. A.Boon, J. Langelaar, and R. P. H. Rettschnick, ‘‘In vivofluorescence excitation and emission spectra of hematoporphy-rin derivative,’’ Lasers Life Sci. 1, 29–48 119862.
6. A. J. Durkin, S. Jaikumar, N. Ramanujam, and R. Richards-Kortum, ‘‘Relation between fluorescence spectra of dilute andturbid samples,’’Appl. Opt. 33, 414–423 119942.
7. R. Richards-Kortum, R. P. Rava, M. Fitzmaurice, L. L. Tong,N. B. Ratliff, J. R. Kramer, and M. S. Feld, ‘‘A one-layer modelof laser-induced fluorescence for diagnosis of disease inhuman tissue: applications to atherosclerosis,’’ IEEE Trans.Biomed. Eng. 36, 1222–1231 119892.
8. W. R. Potter and T. S. Mang, ‘‘Photofrin II levels by in vivofluorescence photometry,’’ inPorphyrin Localization andTreat-ment of Tumors, C. Gomer and D. Doiron, eds. 1Liss, NewYork, 19842, pp. 177–186.
9. A. E. Profio, S. Xie, and K.-H. Shu, ‘‘Diagnosis of tumors byfluorescence: quantification of photosensitizer concentra-tion,’’ inPhotodynamic Therapy: Mechanisms II, T. J. Dough-erty, ed., Proc. Soc. Photo-Opt. Instrum. Eng. 1203, 12–18119902.
10. J. Wu, M. S. Feld, and R. P. Rava, ‘‘Analytic model forextracting intrinsic fluorescence in turbid media,’’ Appl. Opt.32, 3585–3595 119932.
1 April 1996 @ Vol. 35, No. 10 @ APPLIED OPTICS 1791

11. M. S. Patterson and B. W. Pogue, ‘‘Mathematical model fortime-resolved and frequency-domain fluorescence spectros-copy in biological tissues,’’Appl. Opt. 33, 1963–1974 119942.
12. C. M. Gardner, S. L. Jacques, and A. J. Welch, ‘‘Lighttransport in tissue: accurate expressions for one-dimen-sional fluence rate and escape function based upon MonteCarlo simulation,’’ Lasers Surg. Med. 18122, 129–138 119962.
13. A. J. Durkin, S. Jaikumar, and R. Richards-Kortum, ‘‘Opti-cally dilute, absorbing, and turbid phantoms for fluorescencespectroscopy of homogeneous and inhomogeneous samples,’’Appl. Spectrosc. 47, 2114–2121 119932.
14. R. F. Kubin andA. N. Fletcher, ‘‘Fluorescence quantum yieldsof some rhodamine dyes,’’ J. Lumin. 27, 445–462 119822.
15. B. C. Wilson and S. L. Jacques, ‘‘Optical reflectance andtransmittance of tissues: principles and applications,’’ IEEEJ. Quantum Electron. 26, 2186–2198 119902.
16. S. T. Flock, S. L. Jacques, B. C. Wilson, W. M. Star, andM. J. C. van Gemert, ‘‘Optical properties of Intralipid: aphantommedium for light propagation studies,’’ Lasers Surg.Med. 12, 510–519 119922.
1792 APPLIED OPTICS @ Vol. 35, No. 10 @ 1 April 1996
17. C. F. Bohren and D. R. Huffman, Absorption and Scattering ofLight by Small Particles 1Wiley, NewYork, 19832.
18. W.-F. Cheong, S. A. Prahl, and A. J. Welch, ‘‘A review of theoptical properties of biological tissue,’’ IEEE J. QuantumElectron. 26, 2166–2185 119902.
19. S. A. Prahl, M. J. C. van Gemert, and A. J. Welch, ‘‘Determin-ing the optical properties of turbid media by using theadding–doubling method,’’Appl. Opt. 32, 559–568 119932.
20. J. Lakowicz, Principles of Fluorescence Spectroscopy 1Plenum,NewYork, 19832.
21. N. Shaklai, J. Yguerabide, and H. M. Ranney, ‘‘Interaction ofhemoglobin with red blood cell membranes as shown by afluorescent chromophore,’’Biochemistry 16, 5585–5592 119772.
22. T. J. Farrell, M. S. Patterson, and B. C. Wilson, ‘‘A diffusiontheory model of spatially resolved, steady-state diffuse reflec-tance for the noninvasive determination of tissue opticalproperties in vivo,’’ Med. Phys. 19, 879–888 119922.
23. C. M. Gardner, ‘‘Modeling fluorescence escape from tissuephantoms,’’ Ph.D. dissertation 1University of Texas at Austin,Austin, Tex., 19952.