Fluorescence lifetime imaging ophthalmoscopy in type 2 ... · Fluorescence lifetime imaging...
14
Fluorescence lifetime imaging ophthalmoscopy in type 2 diabetic patients who have no signs of diabetic retinopathy Dietrich Schweitzer Lydia Deutsch Matthias Klemm Susanne Jentsch Martin Hammer Sven Peters Jens Haueisen Ulrich A. Müller Jens Dawczynski Downloaded From: https://www.spiedigitallibrary.org/journals/Journal-of-Biomedical-Optics on 18 May 2020 Terms of Use: https://www.spiedigitallibrary.org/terms-of-use
Transcript of Fluorescence lifetime imaging ophthalmoscopy in type 2 ... · Fluorescence lifetime imaging...

Fluorescence lifetime imagingophthalmoscopy in type 2 diabeticpatients who have no signs of diabeticretinopathy
Dietrich SchweitzerLydia DeutschMatthias KlemmSusanne JentschMartin HammerSven PetersJens HaueisenUlrich A. MüllerJens Dawczynski
Downloaded From: https://www.spiedigitallibrary.org/journals/Journal-of-Biomedical-Optics on 18 May 2020Terms of Use: https://www.spiedigitallibrary.org/terms-of-use

Fluorescence lifetime imaging ophthalmoscopy intype 2 diabetic patients who have no signs ofdiabetic retinopathy
Dietrich Schweitzer,a,* Lydia Deutsch,a Matthias Klemm,b Susanne Jentsch,a Martin Hammer,a Sven Peters,aJens Haueisen,b Ulrich A. Müller,c and Jens DawczynskidaUniversity Hospital Jena, Experimental Ophthalmology, Bachstrasse 18, D-07743 Jena, GermanybIlmenau University of Technology, Institute of Biomedical Engineering and Informatics, P.O. Box 100565, D-9868 Ilmenau, GermanycUniversity Hospital Jena, Clinic of Internal Medicine III, Erlanger Allee 101, D-07740 Jena, GermanydUniversity Hospital Leipzig, Department of Ophthalmology, Liebigstr.10–14, D-04103 Leipzig, Germany
Abstract. The time-resolved autofluorescence of the eye is used for the detection of metabolic alteration indiabetic patients who have no signs of diabetic retinopathy. One eye from 37 phakic and 11 pseudophakicpatients with type 2 diabetes, and one eye from 25 phakic and 23 pseudophakic healthy subjects were includedin the study. After a three-exponential fit of the decay of autofluorescence, histograms of lifetimes τi , amplitudesαi , and relative contributionsQi were statistically compared between corresponding groups in two spectral chan-nels (490 < ch1 < 560 nm, 560 < ch2 < 700 nm). The change in single fluorophores was estimated by applyingthe Holm–Bonferroni method and by calculating differences in the sum histograms of lifetimes. Median andmeanof the histograms of τ2, τ3, and α3 in ch1 show the greatest differences between phakic diabetic patients andage-matched controls (p < 0.000004). The lack of pixels with a τ2 of ∼360 ps, the increased number of pixelswith τ2 > 450 ps, and the shift of τ3 from ∼3000 to 3700 ps in ch1 of diabetic patients when compared withhealthy subjects indicate an increased production of free flavin adenine dinucleotide, accumulation of advancedglycation end products (AGE), and, probably, a change from free to protein-bound reduced nicotinamide adeninedinucleotide at the fundus. AGE also accumulated in the crystalline lens. © The Authors. Published by SPIE under a Creative
Commons Attribution 3.0 Unported License. Distribution or reproduction of this work in whole or in part requires full attribution of the original publication,
including its DOI. [DOI: 10.1117/1.JBO.20.6.061106]
Keywords: fluorescence lifetime imaging ophthalmoscopy; diabetes; metabolism; flavin adenine dinucleotide; reduced nicotinamideadenine dinucleotide; advanced glycation end products.
Paper 140774SSPR received Nov. 22, 2014; accepted for publication Feb. 16, 2015; published online Mar. 13, 2015.
1 IntroductionDetection of the earliest signs of diabetic retinopathy (DR)increases the probability of reducing further pathologicaldevelopments, provided that an appropriate therapy will beadministered.1,2
Apoptosis of vascular and neural cells has been reported forthe early onset of DR.3 Furthermore, in diabetes, neuronaldegeneration due to apoptosis in the inner retina has beenfound to be 10-fold higher than that in vascular cells.4,5
Barber et al.3 found that apoptosis of neural cells is an earliermarker than is damage of vascular cells. No change in concen-tration of reduced nicotinamide adenine dinucleotide (NADH)was found between excited retina of diabetic rats and controls.6
Further studies were performed on excited retinas of rats undereuglycemic and hyperglycemic conditions as well as in vivo ondiabetic rats.7 In these studies, no elevated cytosolic NADH/NAD ratio was found under hypoglycemic conditions nor indiabetes, both in vitro and in vivo. But they found an increasedpolyol synthesis and metabolites upstream of glucose like thesorbitol pathway, which decreases NADPH.
Increased oxidation of sorbitol results in the generation ofcytosolic NADH, which in early diabetes leads to metabolicimbalance as well as neural and vascular damage.8
In diabetic rats that were provided with a low dose ofinsulin, the thicknesses of the inner nuclear and plexiformlayers were significantly reduced after 7.5 months. The densityof ganglion cells was also reduced. These neurodegenerativechanges were observed in the absence of morphologic vascularchanges.9
Spectral domain optical coherence tomography showed thatthe total thickness of the retinal layer, particularly the retinalnerve fiber layer, was significantly thinner in diabetic OtsukaLong-Evans Tokushima fatty rats after 28 weeks than in non-diabetic Long-Evans Tokushima Otsuka rats. Additionally, adecreased number of ganglion cells and an increased frequencyof apoptosis have been found by histological investigations.10
Isolated retinal capillary cells showed typical signs of mito-chondrial dysfunction, including an increased release ofcytochrome c into the cytosol and an accumulation of the proa-poptotic protein Bax in mitochondria cells when incubated in20 mM glucose. However, these changes were inhibited inthe presence of superoxide dismutase.11
In diabetic patients, first metabolic alterations were found byField et al.12 They excited the fundus using flashes of 467 nmlight in a 3-deg field and detected the autofluorescence at 535 nm.
*Address all correspondence to: Dietrich Schweitzer, E-mail: [email protected]
Journal of Biomedical Optics 061106-1 June 2015 • Vol. 20(6)
Journal of Biomedical Optics 20(6), 061106 (June 2015)
Downloaded From: https://www.spiedigitallibrary.org/journals/Journal-of-Biomedical-Optics on 18 May 2020Terms of Use: https://www.spiedigitallibrary.org/terms-of-use

Increased fluorescence intensity and a wider distribution ofintensity of all pixels in the excited field were found in diabeticpatients in relation to controls. These results were interpreted asthe result of an impaired electron transport by energy-generatingenzymes in the respiratory chain. Because of the specific exci-tation and emission wavelengths, an increased contribution offlavin adenine dinucleotide (FAD) was assumed.
The problem of in vivo fluorescence measurement is that thecrystalline lens and the fundus layers are simultaneously excited.An exact interpretation of the spectrally resolved fundus fluo-rescence is possible only in eyes with artificial intraocular lenses(IOL) or when the fluorescence of the crystalline lens is sepa-rately detected and subtracted from the fluorescence of thewhole eye.13,14
In clinical practice, the classification of DR is based onvascular changes according to the Early Treatment DiabeticRetinopathy Study Research Group.15
Using the highly accurate spectral domain optical coherencetomography, it was demonstrated that the thicknesses of theretinal nerve fiber layer, the ganglion cell layer, and the innerplexiform layer were reduced in patients with minimal signs ofDR in the pericentral macular area compared with those in thecontrols. Moreover, in the peripheral macular area, the retinalnerve fiber layer and the inner plexiform layer were found tobe thinner than in the controls. The DR status was the only sig-nificant explanatory variable for this reduced thickness.16
Measurements of the time-resolved fluorescence of endog-enous fluorophores have the potential to detect metabolic alter-ations in the human fundus.17 The redox pairs of oxidized andreduced NAD-NADH and FAD-FADH2 act as electron carriersin the basic processes of energy metabolism (citrate acid cycle,respiratory chain). Additional fluorophores, such as lipofucincomponents, advanced glycation end products (AGE), colla-gens, elastin, products of the visual cycle (retinol), or compo-nents of heme synthesis (protoporphyrin IX), contribute tothe autofluorescence of the fundus. In principle, these fluoro-phores can be discriminated by measuring specific excitationand emission spectra. Due to the transmission of the ocularmedia, however, excitation of endogenous fluorophores isonly possible for wavelengths longer than 400 nm. Becausethe excitation maxima of most of these fluorophores are at wave-lengths shorter than this value, any discrimination based on exci-tation spectra is difficult. The decay of fluorescence intensity(lifetime) after pulse excitation permits the differentiation offluorophores with overlapping emission spectra. The free orprotein-bound status of a fluorophore can also be distinguishedif the emission spectrum is equal in both cases.
The excitation and emission spectra and the lifetimes of theexpected fundus fluorophores and of the anatomical structuresof porcine eyes have been reported.18
The purpose of this study was to determine whether meta-bolic changes in the time-resolved autofluorescence of thefundus are detectable in diabetic patients who have no signsof DR.
2 Participants and Methods
2.1 Participants
The patients were recruited from the outpatient Clinic of InternalMedicine III of the Jena University Hospital. Inclusion criteriawere a diagnosis of type 2 diabetes, no signs of DR, and no orminimal cataracts. No subject was suffering from posterior
capsule opacification. The DR stage was blindly evaluatedfrom color fundus images by a retina specialist. The subjectsin the control group were volunteers or patients from the EyeClinic of the Jena University Hospital and did not have diabetesmellitus. They had no ocular disease and had clear media or amild cataract (nuclear or cortical stadium 1).19 Subjects sufferingfrom systemic diseases that could influence ocular metabolismwere not included. Because the fluorescence decay depends onage,20,21 the only subjects who were included in the age-matchedcomparison between diabetic patients who have no signs of DRand healthy subjects were older than 40 years. The investigationwas performed predominantly on subjects with a crystallinelens. For comparison, small groups of pseudophakic (IOL) dia-betic patients and healthy subjects were investigated.
All subjects provided written consent to participate in thestudy. All research procedures were performed according tothe Declaration of Helsinki. Approval for the study was obtainedfrom the ethics committee of the Jena University Hospital.
HbA1c was measured using high-performance liquid chro-matography (official normal range 4.4% to 5.9%; mean 5.2;TOSOH-Glykohämoglobin-Analyzer-HLC-723-GHbV; Tosoh,Tokyo, Japan). The mean normal range measured in 1079 non-diabetic patients in 2009 was 5.65%� 0.38%.22 Therefore, weadjusted the HbA1c according to the mean normal value ofhealthy people to the value of 5.05% (32 mmol∕mol) that wasfound in the Diabetes Control and Complication Trial ResearchGroup (DCCT).23 Blood pressure was measured immediatelybefore the autofluorescence measurement. Table 1 shows thedata of the subjects who were included in the study. Values aregiven as the mean� standard deviation.
The albumin/creatinine ratio in the urine indicates thatsome diabetic patients were suffering from microalbuminuria,and some were partly already suffering from macroalbuminuria.Microalbuminuria is assumed for albumin/creatinine ratios of30 to 300 mg∕g, and macroalbuminuria is present for ratios>300 mg∕g.
2.2 Measuring System
The time-resolved autofluorescence of the fundus was measuredusing a modified confocal scanning laser ophthalmoscope(HRA II, Heidelberg Engineering GmbH, Heidelberg, Germany).The optomechanical unit of an HRA II was modified at the EyeClinic of the University of Jena, Germany, for fundus excitationby a pulsed laser (BDL-440-SMC, Becker&Hickl GmbH, Berlin,Germany), which emitted 75-ps pulses at 448 nm at an 80 MHzrepetition rate.18 The fluorescence was detected in two spectralchannels (ch1: 490 to 560 nm, ch2: 560 to 700 nm) using multi-channel plate photomultipliers (Ham-R 3809U-50, Hamamatsu,Herrsching, Germany). The fluorescence decay was detectedusing time-correlated single photon counting (TCSPC) by anSPC 150 board (Becker&Hickl GmbH). An HRT 41 router(Becker&Hickl GmbH) separated the photons from the two spec-tral channels. Fluorescence decay images were recorded froma 30-deg field with a resolution of ∼40 × 40 μm2. The excitationpower was 100 μW in the cornea plane. Simultaneously with theexcitation laser, the fundus was illuminated with an infrared laser(820 nm), which provided contrast-rich fundus images for auto-matic image registration in both spectral channels. This devicewas the forerunner model of the demonstrator developed byHeidelberg Engineering.21
Journal of Biomedical Optics 061106-2 June 2015 • Vol. 20(6)
Schweitzer et al.: Fluorescence lifetime imaging ophthalmoscopy in type 2 diabetic patients. . .
Downloaded From: https://www.spiedigitallibrary.org/journals/Journal-of-Biomedical-Optics on 18 May 2020Terms of Use: https://www.spiedigitallibrary.org/terms-of-use

2.3 Fitting of the Fluorescence Decay
The software SPCImage3.6 (Becker&Hickl GmbH) was used toevaluate the time-resolved autofluorescence images. To obtain asufficient number of photons, a binning factor B ¼ 2 was used,which increased the number of photons at a single pixel bya factor of 25. The fluorescence decay was approximated bythe three-exponential model function given in Eq. (1):
IðtÞ ¼ IRF ×X3
i¼1
ai · e− tτi þ b; (1)
where IðtÞ is the number of photons at time t, IRF is the instru-ment response function, ai is the amplitude or pre-exponentialfactor, τi is the lifetime of exponent i, and b is the background.
To avoid the influence of the stepped slope of fluorescenceintensity which is caused by the fluorescence of the crystallinelens, a tailfit was employed.
The criterion for an optimal approximation was the minimi-zation of χ2r [Eq. (2)]:
χ2r ¼1
n − q·Xn
j¼1
½NðtjÞ − NcðtjÞ�2NðtjÞ
; (2)
where n represents the time channels (1024 applied here), q rep-resents the free parameters (αi, τi, and b), NðtjÞ represents thedetected photons in time channel j, and NcðtjÞ represents thephotons from the convolution of the model function with the IRF.
Assuming that the detection of photons is a Poisson process,the limiting value in Eq. (2) is 1.
In addition to all of the individual amplitudes and lifetimes,the mean lifetime τm and the relative contribution Qi parametersare important for evaluating fluorescence lifetime imaging oph-thalmoscopy (FLIO) measurements. Here, the mean lifetime isdefined as
τm ¼Pp
i¼1 αi · τiPpi¼1 αi
: (3)
The relative contribution Qi of the component i correspondsto its respective area under the decay curve.
Qi ¼αi · τiPpi¼1 αi · τi
: (4)
Pixel-by-pixel fitting of the measured fluorescence decay toa three-exponential model [Eq. (1)] results in images of the life-times τ1, τ2, and τ3, and the amplitudes α1, α2, and α3 for thefundus of each subject in both channels. Images of τm and of Qican be calculated from the lifetimes and amplitudes.
Because the system did not contain an internal fixation target,the 30-deg field was not exactly at the same position at the fun-dus for all subjects. Thus, the comparison of the FLIO parameterof the complete images was not appropriate. Therefore, afterapproximation of the fluorescence decay of each pixel of thewhole image, a region of interest (RoI) of 71 × 101 pixels,which was located in the superior temporal quadrant that
Table 1 Characterization of the subjects included in the study.
Diabetes type 2 Healthy subjects
Crystalline lens IOL Crystalline lens IOL
Probands 37 11 25 23
Age (years) 60.5� 15.3 61.1� 14.7 61.9� 17.3 65.3� 14.7
Gender 22 M, 15 F 8 M, 3 F 14 M, 11 F 10 M, 13 F
BMI (kg∕m2) 29.8� 6.1 30� 6 26.6� 4.2 26.7� 4
Systolic blood pressure (mmHg) 138.9� 15.4 136.4� 16.5 134.8� 12.2 135.1� 12.4
Diastolic blood pressure (mmHg) 82.3� 10.8 81.5� 10 78.9� 8.8 78.1� 9
Antihypertonic drugs 81 100 28 39
Statins (%) 43 70 8 13
Time since diagnosis of diabetes (years) 14.7� 9.8 16.4� 10.7
Oral antihyperglycemic agents (%) 30 20
Treatment with insulin 57 60
Diet (%) 13 20
HbA1C DCCT adjusted (mmol∕mol; %) 49.9� 13.9; 7.1� 1.4 46.3� 7.6; 6.8� 0.7
Neuropathy (%) 24 20
Albumin/creatinine in urine (mg∕g) 76� 233 154� 198
Albumin/creatinine in urine >20 mg∕g (% patients) 27 30
Note: IOL, intraocular artificial lens.
Journal of Biomedical Optics 061106-3 June 2015 • Vol. 20(6)
Schweitzer et al.: Fluorescence lifetime imaging ophthalmoscopy in type 2 diabetic patients. . .
Downloaded From: https://www.spiedigitallibrary.org/journals/Journal-of-Biomedical-Optics on 18 May 2020Terms of Use: https://www.spiedigitallibrary.org/terms-of-use

included the macula, was selected for further calculations in allmeasurements. This region was contained in all images.
2.4 Evaluation of Fitting Results
In our study, we calculated the fitting results for each pixelwithin the RoI (71 × 101 pixels) and determined how frequentlyeach value was determined for each lifetime τi, amplitudes αi,and Qi. In this way, one histogram of each τi, αi, and Qi wascalculated in both spectral channels for each subject. The histo-grams of phakic diabetic patients and healthy subjects werecompared in two steps.
First, the derived quantities’ mode, mean, and median fromthese histograms were compared for each individual betweenthe two groups. The statistical comparison was performed usingSPSS 21 (IBM Deutschland GmbH, Ehningen, Germany). Thetwo-tailed t test was used if the error probability in theKolmogorov-Smirnov test was >0.2 (normal distribution).Equality of variances was assumed if the error probability inthe Levene-test was also >0.2. The Mann-Whitney U testwas used if the parameters were not normally distributed.Significant differences in the fitting parameters were assumedfor p < 0.05. The area under curve of the receiver operatingcharacteristics (ROC) was calculated. The ideal value is 1,while a value of 0.5 indicates that the separation between groupsis only stochastic. Sensitivity and specificity were given forROC > 0.72. These results are global because each lifetimeτi and amplitude αi results from the sum of the contributionsfrom several fluorophores.
In a second step, changes in the single fluorophores wereestimated. For this process, the Holm–Bonferroni method24
was applied using the software program FLIMX, which wasdeveloped at the University of Ilmenau.25,26
Here, the distribution of each fit parameter was divided into nintervals. The lifetimes in such intervals are, to a certain degree,determined by specific fluorophores. Differences between thefitting parameters in single intervals are considered significantif the error probability p is lower than the significance level αdivided by the number n of intervals. The Wilcoxon test wasperformed for statistical comparison of the fit parameters ofdiabetic patients and healthy subjects in each interval.
The crystalline lens has a long fluorescence lifetime whichinfluences the FLIO parameters, especially in channel 1. In con-trast, an artificial IOL exhibits no fluorescence.
For that reason, the range of fit parameters was different forsubjects with crystalline lens and for pseudophakic subjects.The size of the intervals was iteratively determined until thesum of the sensitivity and of specificity as well as ROC wasmaximal. The ranges and the size of the intervals for the fittingparameters are given in Table 2 for phakic subjects and inTable 3 for pseudophakic subjects.
3 ResultsThe decay of the fluorescence intensity was fitted by the three-exponential model function of Eq. (1) for each pixel in bothspectral channels. As demonstrated in Fig. 1, the model functionsufficiently approximates the measured decay.
After the fitting, images of the lifetimes, amplitudes, and rel-ative contributions were calculated for both spectral channels.Figure 2 shows these images in the short-wavelength channelfor a healthy subject and for a patient with diabetes but nosigns of DR. The bluer color in the images of the patient withdiabetes indicates a prolongation of the lifetimes.
Table 2 Range of fitting parameters for phakic subjects.
Parameter Interval size Range ch1 Range ch2
α1 in % 2 74 to 92 60 to 88
α2 in % 1 8 to 19 14 to 34
α1 in % 0.5 1 to 6.5 1.5 to 5
τ1 in ps 5 35 to 105 45 to 105
τ2 in ps 10 330 to 690 300 to 590
τ3 in ps 50 2500 to 4600 1800 to 3500
τm in ps 10 120 to 370 150 to 360
Q1 in % 2 12 to 36 9 to 35
Q2 in % 1 13 to 37 30 to 47
Q3 in % 2 26 to 74 20 to 50
Table 3 Range of fitting parameters for pseudophakic subjects.
Parameter Interval size Range ch1 Range ch2
α1 in % 2 72 to 90 60 to 80
α2 in % 1 10 to 24 18 to 29
α1 in % 0.5 0.5 to 5 2 to 6
τ1 in ps 5 45 to 85 45 to 85
τ2 in ps 10 330 to 460 330 to 460
τ3 in ps 50 2000 to 3000 1800 to 2300
τm in ps 10 100 to 250 160 to 270
Q1 in % 2 19 to 41 12 to 34
Q2 in % 1 28 to 45 38 to 49
Q3 in % 2 22 to 46 22 to 46
Fig. 1 Tailfit of a paramacular pixel by a three-exponential modelfunction. The fit parameters are α1 ¼ 82.3%, α2 ¼ 11.3%, α3 ¼ 6.4%,τ1 ¼ 105 ps, τ2 ¼ 639.8 ps, τ3 ¼ 4294.4 ps, and χ2r ¼ 1.14.
Journal of Biomedical Optics 061106-4 June 2015 • Vol. 20(6)
Schweitzer et al.: Fluorescence lifetime imaging ophthalmoscopy in type 2 diabetic patients. . .
Downloaded From: https://www.spiedigitallibrary.org/journals/Journal-of-Biomedical-Optics on 18 May 2020Terms of Use: https://www.spiedigitallibrary.org/terms-of-use
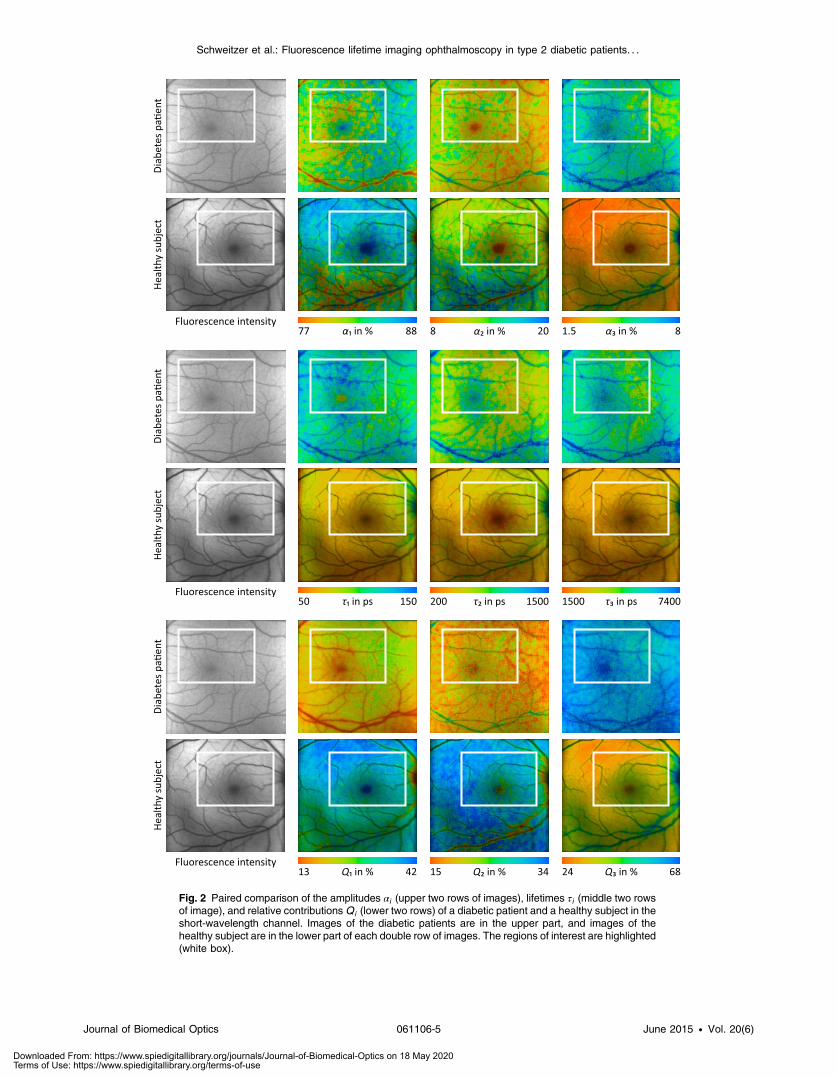
Fig. 2 Paired comparison of the amplitudes αi (upper two rows of images), lifetimes τi (middle two rowsof image), and relative contributions Qi (lower two rows) of a diabetic patient and a healthy subject in theshort-wavelength channel. Images of the diabetic patients are in the upper part, and images of thehealthy subject are in the lower part of each double row of images. The regions of interest are highlighted(white box).
Journal of Biomedical Optics 061106-5 June 2015 • Vol. 20(6)
Schweitzer et al.: Fluorescence lifetime imaging ophthalmoscopy in type 2 diabetic patients. . .
Downloaded From: https://www.spiedigitallibrary.org/journals/Journal-of-Biomedical-Optics on 18 May 2020Terms of Use: https://www.spiedigitallibrary.org/terms-of-use

The size and the position of the ROIs selected for quantitativecomparison of the histograms of FLIO parameters are alsoshown in Fig. 2.
Generally, each histogram shows how often the same valueof each parameter (lifetime, amplitude, and relative contribu-tion) was determined in the analyzed field of a subject.
Figure 3, as an example, depicts the histogram of the lifetimeτ2 of a diabetic patient in ch1 and ch2. The differences in thedistribution of the lifetime τ2 in the two spectral channels indi-cate that the fluorescence results from different substances.Furthermore, this difference was detected equally in both thediabetic patients and the healthy subjects. From these distribu-tions, statistical parameters were extracted for each subject.
The results of the statistical comparison are given for subjectswith a crystalline lens in Table 4 for channel 1 (490 to 560 nm)and in Table 5 for channel 2 (560 to 700 nm).
In the short-wavelength channel, the best discriminationbetween healthy subjects and diabetic patients who have nosigns of DR was achieved for the median and mean parametersin the distributions of α3, τ2, τ3, τm, Q1, Q2, and Q3. The stat-istical values of skewness and kurtosis mostly did not reachsignificance. The highest ROC value (0.875) with 83.8% sensi-tivity and 76% specificity was found for the median of τ2 in ch1with an error probability p ¼ 0.000001. Good discriminationwas also achieved for the medians of α3 and τ3 in the short-wavelength channel with error probabilities of p ¼ 0.000005.
No significant difference between the two groups wasobtained for the amplitude α2. In contrast, the difference inthe lifetime τ2 between the two groups is highly significant, sup-porting the assumption that the composition of the fluorescentsubstances changes.
The best discrimination was obtained in the long-wavelengthchannel (560 to 700 nm) using the median and mean of thedistributions of τ2, τ3, Q1, Q2, and Q3 in the selected RoIs atthe fundus (Table 5).
The statistical comparison was also performed for pseudo-phakic patients and controls (Table 6). Only 10 subjects wereincluded in the diabetic group; thus, the value of the statisticalcomparison is limited. The median and mean were only signifi-cantly different for τ2 in the short-wavelength channel, but on amuch lower level than in phakic eyes. Surprisingly, the best dis-crimination was possible for the kurtosis of the amplitude α3. Inthe long-wavelength channel, the differences for the median andmean reached significance for τ1 and τ3.
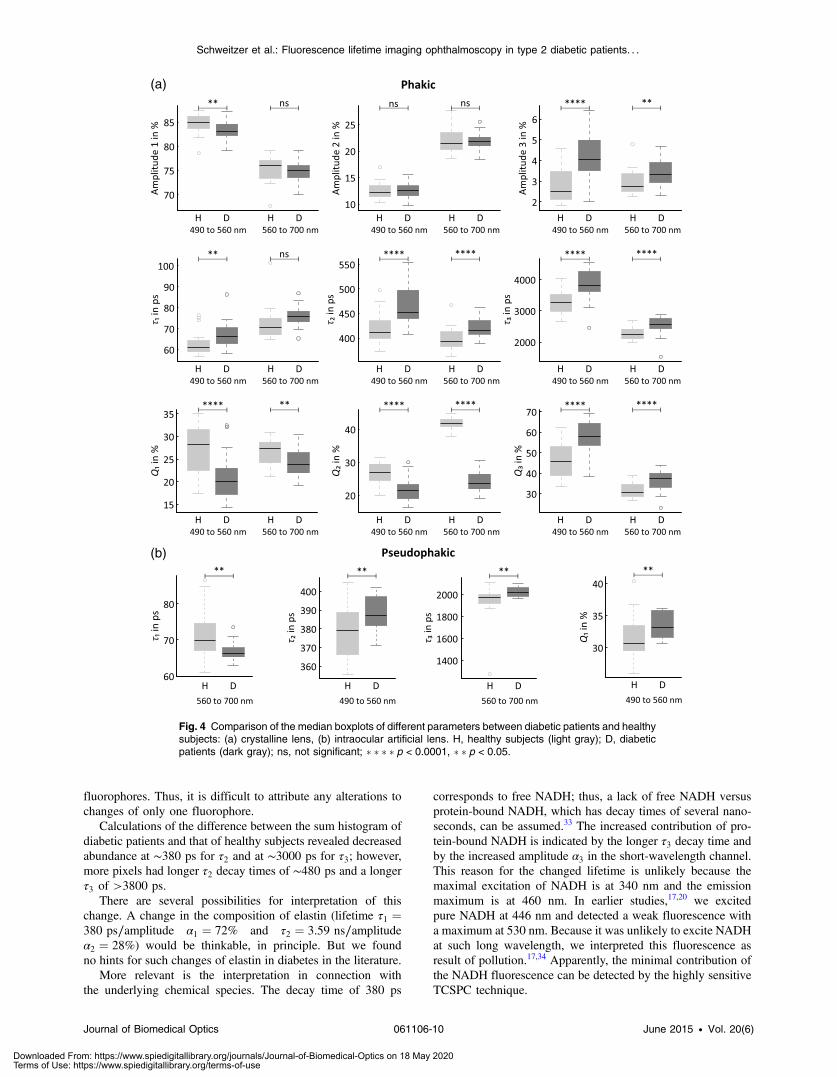
Figure 4 shows median boxplots for all FLIO parameters inch1 and ch2 for phakic subjects. For pseudophakic subjects,only significantly different parameters are given.
To obtain more information about the substance-specificchanges in the eyes of diabetic patients as an early sign ofmetabolic alterations before the signs of DR are visible, theHolm–Bonferroni test was applied. Many fluorophores areexcited in the eye. Thus, each lifetime τi in a three-exponentialapproximation includes lifetimes from different fluorophores.Thus, the histograms that are created from the fitting parametersfor all of the RoI pixels reflect the contributions of severalfluorophores.
Therefore, similar to each approximated τi, the contributionof individual fluorophores with slightly different lifetimes canbe estimated if the range of τi is divided into intervals. Ineach interval, the difference in each fitting parameter was testedbetween the distributions corresponding to healthy subjects anddiabetic patients. The discriminations between the groups areindependent of the intervals; thus, the results of intervalswith high sensitivity and high specificity can be combined toobtain the best separation. Table 7 summarizes the results ofthe Holm–Bonferroni test for phakic diabetic patients andhealthy subjects.
The best discrimination between healthy subjects and dia-betic patients who have no signs of DR was obtained for thelifetime τ2 in ch1 (490 to 560 nm) in the interval of 400 to410 ps (ROC ¼ 86%, sensitivity ¼ 83.8%, specificity ¼ 84%),τ3 for 3050 ps in the interval 2800–3100 ps (ROC ¼ 84%,sensitivity ¼ 75.7%, specificity ¼ 86%), and Q2 for 29%(ROC ¼ 85%, sensitivity ¼ 89.2%, specificity ¼ 72%).
In the long-wavelength channel, the best separations werefound for τ3 at 2100 ps (ROC ¼ 85%, sensitivity ¼ 89.2%,specificity ¼ 80%) and for Q2 at 43% (ROC ¼ 87%,sensitivity ¼ 75.7%, specificity ¼ 96%).
In the comparison between the controls and the diabeticpatients with an artificial IOL, significance in the Holm–Bonferroni test was only reached for τ1 at 65 ps (ROC ¼81%, sensitivity ¼ 80%, specificity ¼ 69.6%) in ch1 (Table 8).The intervals of the fitting parameters are given for the param-eters whose ROC values are at least 0.7. We speculate that thelow number of diabetic patients with an artificial IOL led tothe lower number of significant parameters compared with theresults in Table 7. On the other hand, these results point atthe considerable influence of changes in the fluorescence ofdiabetic lenses.
Graphical analysis of the histograms is a further step in theinterpretation of metabolic alterations at the fundus of diabeticpatients. The sum and difference histograms of τ2 in ch1 fordiabetic patients and for healthy subjects with a crystallinelens are given in Fig. 5.
We observe a shift in the sum histograms for τ2 to longerfluorescence decay times in the fundus of diabetic patientswho show no signs of DR compared with those for the controls.The curve in the difference histogram of τ2 in Fig. 5 clearlyshows that in the RoI of diabetic patients, the number of pixelswith a decay time of ∼380 ps is reduced, whereas more pixelswith fluorescence decay times longer than ∼450 ps are presentcompared with those in the controls.
As demonstrated in Fig. 6, there is also a shift in the sumhistograms of τ3 to longer fluorescence decay times in thefundus of diabetic patients who show no signs of DR whencompared with the controls.
Fig. 3 Histograms of lifetime τ2 of 7171 pixels in channels 1 and 2.The statistical parameters in picoseconds are as follows: forch1: mode ¼ 470, median ¼ 549, mean ¼ 528, standard deviation ¼134; for ch 2: mode ¼ 420, median ¼ 442, mean ¼ 435, standarddeviation ¼ 36.4.
Journal of Biomedical Optics 061106-6 June 2015 • Vol. 20(6)
Schweitzer et al.: Fluorescence lifetime imaging ophthalmoscopy in type 2 diabetic patients. . .
Downloaded From: https://www.spiedigitallibrary.org/journals/Journal-of-Biomedical-Optics on 18 May 2020Terms of Use: https://www.spiedigitallibrary.org/terms-of-use
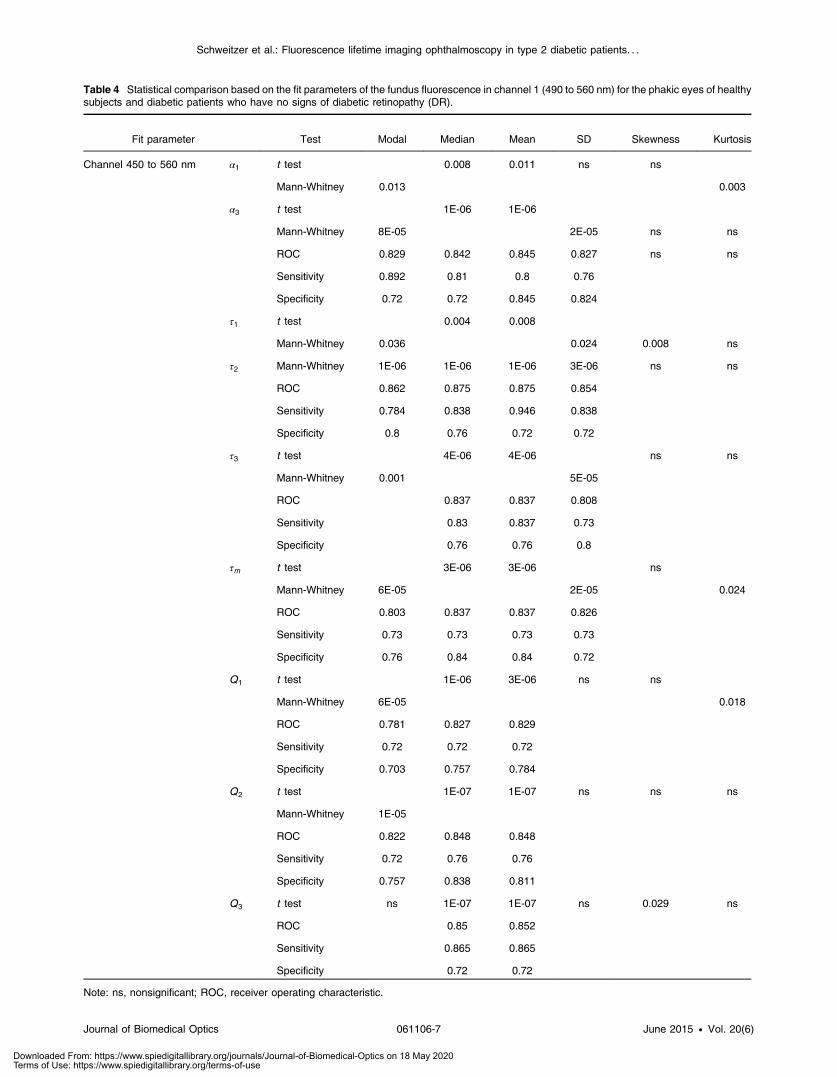
Table 4 Statistical comparison based on the fit parameters of the fundus fluorescence in channel 1 (490 to 560 nm) for the phakic eyes of healthysubjects and diabetic patients who have no signs of diabetic retinopathy (DR).
Fit parameter Test Modal Median Mean SD Skewness Kurtosis
Channel 450 to 560 nm α1 t test 0.008 0.011 ns ns
Mann-Whitney 0.013 0.003
α3 t test 1E-06 1E-06
Mann-Whitney 8E-05 2E-05 ns ns
ROC 0.829 0.842 0.845 0.827 ns ns
Sensitivity 0.892 0.81 0.8 0.76
Specificity 0.72 0.72 0.845 0.824
τ1 t test 0.004 0.008
Mann-Whitney 0.036 0.024 0.008 ns
τ2 Mann-Whitney 1E-06 1E-06 1E-06 3E-06 ns ns
ROC 0.862 0.875 0.875 0.854
Sensitivity 0.784 0.838 0.946 0.838
Specificity 0.8 0.76 0.72 0.72
τ3 t test 4E-06 4E-06 ns ns
Mann-Whitney 0.001 5E-05
ROC 0.837 0.837 0.808
Sensitivity 0.83 0.837 0.73
Specificity 0.76 0.76 0.8
τm t test 3E-06 3E-06 ns
Mann-Whitney 6E-05 2E-05 0.024
ROC 0.803 0.837 0.837 0.826
Sensitivity 0.73 0.73 0.73 0.73
Specificity 0.76 0.84 0.84 0.72
Q1 t test 1E-06 3E-06 ns ns
Mann-Whitney 6E-05 0.018
ROC 0.781 0.827 0.829
Sensitivity 0.72 0.72 0.72
Specificity 0.703 0.757 0.784
Q2 t test 1E-07 1E-07 ns ns ns
Mann-Whitney 1E-05
ROC 0.822 0.848 0.848
Sensitivity 0.72 0.76 0.76
Specificity 0.757 0.838 0.811
Q3 t test ns 1E-07 1E-07 ns 0.029 ns
ROC 0.85 0.852
Sensitivity 0.865 0.865
Specificity 0.72 0.72
Note: ns, nonsignificant; ROC, receiver operating characteristic.
Journal of Biomedical Optics 061106-7 June 2015 • Vol. 20(6)
Schweitzer et al.: Fluorescence lifetime imaging ophthalmoscopy in type 2 diabetic patients. . .
Downloaded From: https://www.spiedigitallibrary.org/journals/Journal-of-Biomedical-Optics on 18 May 2020Terms of Use: https://www.spiedigitallibrary.org/terms-of-use
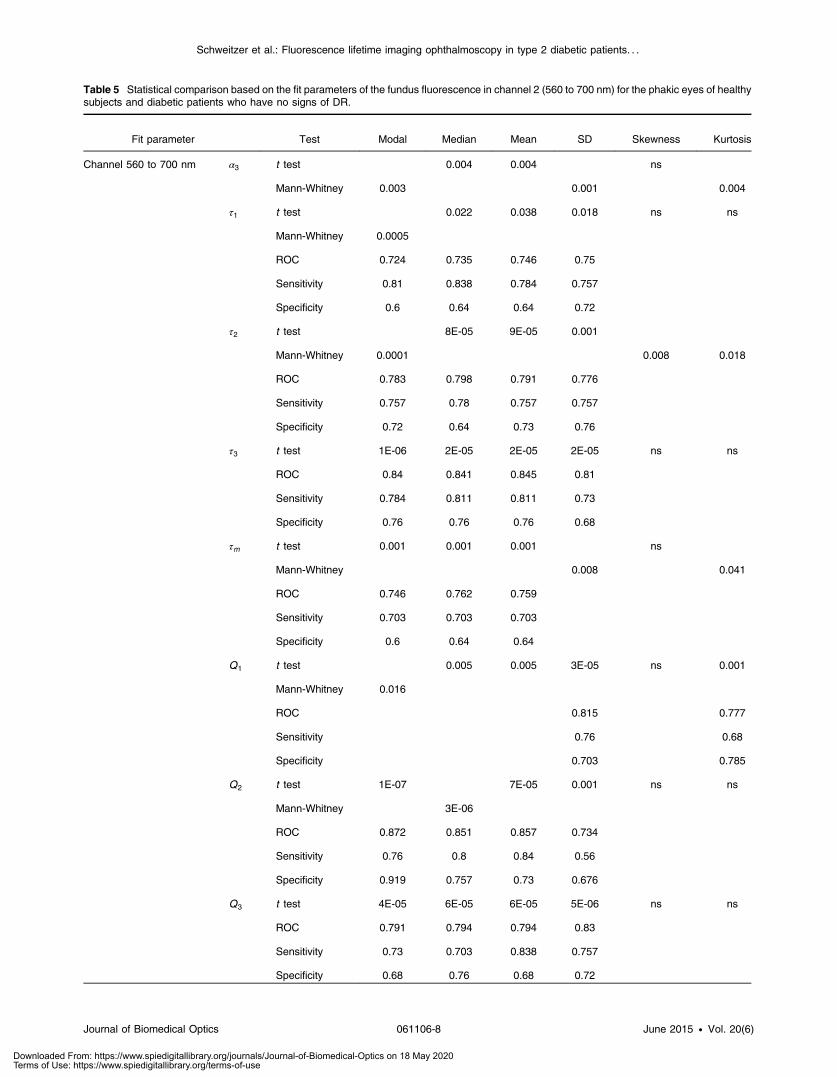
Table 5 Statistical comparison based on the fit parameters of the fundus fluorescence in channel 2 (560 to 700 nm) for the phakic eyes of healthysubjects and diabetic patients who have no signs of DR.
Fit parameter Test Modal Median Mean SD Skewness Kurtosis
Channel 560 to 700 nm α3 t test 0.004 0.004 ns
Mann-Whitney 0.003 0.001 0.004
τ1 t test 0.022 0.038 0.018 ns ns
Mann-Whitney 0.0005
ROC 0.724 0.735 0.746 0.75
Sensitivity 0.81 0.838 0.784 0.757
Specificity 0.6 0.64 0.64 0.72
τ2 t test 8E-05 9E-05 0.001
Mann-Whitney 0.0001 0.008 0.018
ROC 0.783 0.798 0.791 0.776
Sensitivity 0.757 0.78 0.757 0.757
Specificity 0.72 0.64 0.73 0.76
τ3 t test 1E-06 2E-05 2E-05 2E-05 ns ns
ROC 0.84 0.841 0.845 0.81
Sensitivity 0.784 0.811 0.811 0.73
Specificity 0.76 0.76 0.76 0.68
τm t test 0.001 0.001 0.001 ns
Mann-Whitney 0.008 0.041
ROC 0.746 0.762 0.759
Sensitivity 0.703 0.703 0.703
Specificity 0.6 0.64 0.64
Q1 t test 0.005 0.005 3E-05 ns 0.001
Mann-Whitney 0.016
ROC 0.815 0.777
Sensitivity 0.76 0.68
Specificity 0.703 0.785
Q2 t test 1E-07 7E-05 0.001 ns ns
Mann-Whitney 3E-06
ROC 0.872 0.851 0.857 0.734
Sensitivity 0.76 0.8 0.84 0.56
Specificity 0.919 0.757 0.73 0.676
Q3 t test 4E-05 6E-05 6E-05 5E-06 ns ns
ROC 0.791 0.794 0.794 0.83
Sensitivity 0.73 0.703 0.838 0.757
Specificity 0.68 0.76 0.68 0.72
Journal of Biomedical Optics 061106-8 June 2015 • Vol. 20(6)
Schweitzer et al.: Fluorescence lifetime imaging ophthalmoscopy in type 2 diabetic patients. . .
Downloaded From: https://www.spiedigitallibrary.org/journals/Journal-of-Biomedical-Optics on 18 May 2020Terms of Use: https://www.spiedigitallibrary.org/terms-of-use

Likewise, considering the difference histogram for the decaytime τ3 in Fig. 6, fewer pixels with a lifetime of ∼3000 ps arepresent in diabetes, and more pixels with longer decay times of∼3900 ps are present in the selected RoIs.
Longer decay times for τ2 and τ3 in the short-wavelengthchannel as well as higher values of α3 were observed in thediabetic patients versus controls.
4 DiscussionThe detection of early metabolic changes in the fundus is impor-tant for the development of a specific treatment for DR. Firstin vivo spectral measurements of metabolic alterations at thefundus of diabetic patients were published by Field et al.12
It is assumed that alterations in the retinal vessel system3 orthinning of fundus layers16 are most likely consequences ofmetabolic malfunction.
The new technique of FLIO permits the discrimination offluorophores according to the decay of fluorescence afterpulse excitation and, to a certain degree, according to the emis-sion spectra. Based on spectral and time-resolved in vitro mea-surements of autofluorescence on isolated structures27of porcineeyes and of fundi in toto28 as well as of human fundus struc-tures,29 we assume a relation between FLIO parameters andfundus layers. Additionally, cross-sections in FLIO images alsoshow a relation between anatomical structures and lifetimes aswell as amplitudes.30
Thus, the amplitude α1 and the decay time τ1 might corre-spond to some extent with the retinal pigment epithelium, α2 andτ2 likely correspond to the neuronal retina, and α3 and τ3 likelydemonstrate the influence of connective tissue and of the lens.
The decay times and the amplitudes in the short-wavelengthchannel (490 to 560 nm) differ from those in the long-
wavelength channel (560 to 700 nm); thus, different substancescontribute to the total fluorescence in the two channels.
In particular, the long fluorescence decay of the crystallinelens is present in the short-wavelength channel, where the τ3 ismuch longer than the τ3 in the long-wavelength channel. Thiscontribution is confirmed because the τ3 in the short-wavelengthchannel in pseudophakic eyes is much shorter than that in eyeswith a crystalline lens.
To investigate such metabolic alterations, diabetic patientswho have no signs of DR and age-matched healthy subjectswere investigated by FLIO. Although the mean duration ofdiabetes mellitus was 15 years, the mean HbA1c value was7.1� 1.4%, which is in the 6.5 to 7.5% range recommendedby the EASD/ADA31 and by the National German Guideline.32
In contrast to optical coherence tomography measurements ofthe fundus layers and visible changes in the retinal vessel system,FLIO measurements detect functional metabolic changes.
Considering amplitudes and lifetimes after a three-exponen-tial fit of fluorescence decay in fields of 71 × 101 pixels, thebest discriminating parameters were the median and mean inhistograms of τ2. Because τ2 presumably corresponds to theneuronal retina, metabolic alterations in this anatomical struc-ture might be assumed to occur in the fundus of diabetic patientsbefore DR is detectable in color fundus photographs. Earlyalterations in the vessel system are detectable by fluoresceinangiography. As this is an invasive test, it was not applied forethical reasons in people who have had no visual complaints.
In addition to the statistical evaluation of the distribution ofindividual FLIO parameters, the sum of the individual histo-grams of the amplitudes, decay times, and relative contributionswas considered for both groups. Similar to each individual histo-gram, the sum histograms contain the fluorescence of several
Table 6 Statistical comparison based on the fit parameters of the fundus fluorescence of the pseudophakic eyes of healthy subjects and diabeticpatients who have no signs of DR.
Fit parameter Test Modal Median Mean SD Skewness Kurtosis
Channel 490 to 560 nm α3 Mann-Whitney ns ns ns ns ns 0.007
ROC 0.796
Sensitivity 0.739
Specificity 0.7
τ2 t test ns 0.042 0.031 ns ns ns
τ3 t test 0.031 ns ns ns 0.047 ns
τm t test 0.035 ns ns ns ns
Mann-Whitney 0.028
Q3 t test ns ns ns 0.036 ns
Mann-Whitney 0.04
Channel 560 to 700 nm α3 Mann-Whitney ns ns ns ns ns 0.042
τ1 t test ns 0.017 0.014 ns ns ns
τ3 Mann-Whitney ns 0.038 0.028 ns ns ns
Q2 Mann-Whitney ns ns ns ns ns 0.02
Journal of Biomedical Optics 061106-9 June 2015 • Vol. 20(6)
Schweitzer et al.: Fluorescence lifetime imaging ophthalmoscopy in type 2 diabetic patients. . .
Downloaded From: https://www.spiedigitallibrary.org/journals/Journal-of-Biomedical-Optics on 18 May 2020Terms of Use: https://www.spiedigitallibrary.org/terms-of-use
fluorophores. Thus, it is difficult to attribute any alterations tochanges of only one fluorophore.
Calculations of the difference between the sum histogram ofdiabetic patients and that of healthy subjects revealed decreasedabundance at ∼380 ps for τ2 and at ∼3000 ps for τ3; however,more pixels had longer τ2 decay times of ∼480 ps and a longerτ3 of >3800 ps.
There are several possibilities for interpretation of thischange. A change in the composition of elastin (lifetime τ1 ¼380 ps∕amplitude α1 ¼ 72% and τ2 ¼ 3.59 ns∕amplitude
α2 ¼ 28%) would be thinkable, in principle. But we foundno hints for such changes of elastin in diabetes in the literature.
More relevant is the interpretation in connection withthe underlying chemical species. The decay time of 380 ps
corresponds to free NADH; thus, a lack of free NADH versusprotein-bound NADH, which has decay times of several nano-seconds, can be assumed.33 The increased contribution of pro-tein-bound NADH is indicated by the longer τ3 decay time andby the increased amplitude α3 in the short-wavelength channel.This reason for the changed lifetime is unlikely because themaximal excitation of NADH is at 340 nm and the emissionmaximum is at 460 nm. In earlier studies,17,20 we excitedpure NADH at 446 nm and detected a weak fluorescence witha maximum at 530 nm. Because it was unlikely to excite NADHat such long wavelength, we interpreted this fluorescence asresult of pollution.17,34 Apparently, the minimal contribution ofthe NADH fluorescence can be detected by the highly sensitiveTCSPC technique.
Fig. 4 Comparison of the median boxplots of different parameters between diabetic patients and healthysubjects: (a) crystalline lens, (b) intraocular artificial lens. H, healthy subjects (light gray); D, diabeticpatients (dark gray); ns, not significant; � � � � p < 0.0001, � � p < 0.05.
Journal of Biomedical Optics 061106-10 June 2015 • Vol. 20(6)
Schweitzer et al.: Fluorescence lifetime imaging ophthalmoscopy in type 2 diabetic patients. . .
Downloaded From: https://www.spiedigitallibrary.org/journals/Journal-of-Biomedical-Optics on 18 May 2020Terms of Use: https://www.spiedigitallibrary.org/terms-of-use

Table 7 Results of the Holm–Bonferroni test for diabetic patients who have no signs of DR and for healthy subjects.
Fit parameter Significance ROC Sensitivity Specificity Best separation Further separation intervals
Channel 490 to 560 nm α1 ns 0.7 0.622 0.8 82
α3 0.001 0.73 0.946 0.52 1.5 1.5, 5.5
τ1 0.001 0.8 0.811 0.64 70
τ2 0.001 0.86 0.838 0.84 400 400, 410, 480 to 580
τ3 0.001 0.84 0.757 0.84 3050 2800 to 3100, 4400
τm 0.01 0.77 0.838 0.64 150 140 to 160, 270, 330 to 360
Q1 0.001 0.77 0.891 0.64 34 34 to 36
Q2 0.001 0.85 0.892 0.72 29 21, 28 to 31
Q3 0.001 0.78 0.838 0.72 40 38 to 40
Channel 560 to 700 nm α1 ns 0.65 0.649 0.68 74
α2 ns 0.63 0.757 0.64 23
α3 0.05 0.71 0.568 0.84 4.5 4 to 5
τ1 0.01 0.77 0.676 0.76 65 65, 80
τ2 0.01 0.79 0.676 0.8 450 37 to 380, 430 to 460
τ3 0.001 0.85 0.892 0.8 2100 2050 to 2150, 2650 to 2900
τm 0.01 0.73 0.913 0.56 160 160
Q1 0.05 0.7 0.541 0.88 18 18, 20
Q2 0.001 0.87 0.757 0.96 43 35 to 39, 43 to 45
Q3 0.01 0.76 0.757 0.76 40 40 to 44
Table 8 Results of the Holm-Bonferroni test for pseudophakic diabetic patients who have no signs of DR and for healthy subjects.
Fit parameter Significance ROC Sensitivity Specificity Separation interval
Channel 490 to 560 nm α2 ns 0.7 0.7 0.696 15
τ1 0.05 0.81 0.8 0.696 65
τ2 ns 0.73 0.7 0.652 410
τ3 ns 0.76 0.7 0.739 2500
τm ns 0.72 0.6 0.739 140
Q3 ns 0.8 0.7 0.826 26
Channel 560 to 700 nm τ1 ns 0.71 0.9 0.565 85
τ2 ns 0.72 0.8 0.652 410
τ3 ns 0.79 0.9 0.652 2100
Q3 ns 0.72 0.8 0.652 28
Journal of Biomedical Optics 061106-11 June 2015 • Vol. 20(6)
Schweitzer et al.: Fluorescence lifetime imaging ophthalmoscopy in type 2 diabetic patients. . .
Downloaded From: https://www.spiedigitallibrary.org/journals/Journal-of-Biomedical-Optics on 18 May 2020Terms of Use: https://www.spiedigitallibrary.org/terms-of-use

A shift of NADH from the free to the protein-bound stateresults from an increased contribution of glycolysis to energyproduction.35
The elongated fluorescence lifetime τ2 in diabetic subjects,especially in the short-wavelengths channel, is most likely inter-pretable as an increased contribution of free FAD. Field et al.12
published an increased fluorescence intensity of FAD in diabeticeyes. The applied excitation wavelength and emission range areoptimally suited for detection of FAD. In our own measure-ments, we found the lifetimes of free FAD using a biexponentialfit to be τ1 ¼ 330 ps with α1 ¼ 18% and τ2 ¼ 2810 ps withα2 ¼ 82%.17 The lifetime of protein-bound FAD is 100 ps.36
Though the number of subjects with an artificial lens is low,the results of these groups demonstrate the influence of the fluo-rescence of the crystalline lens. This fluorescence contributes tothe fluorescence that is detected from the eye. The confocaldetection principle only reduces the contribution of the fluores-cence of the lens, but does not avoid it completely.37 As theexcited volume of the lens is much higher in fundus cameras,using the principle of aperture separation, the contribution offluorescence of the lens cannot be neglected in fluorescencemeasurements of the eye. Thus, diabetic metabolic changescan be assumed, which accumulate in the crystalline lens,too. As mitochondria are missing in the lens, the accumulationof AGEs can be assumed in the lens. In in-house measurements,AGEs were excited at 446 nm and emit with a maximum at520 nm. The corresponding lifetimes using a biexponential
fit were τ1 ¼ 865 ps with α1 ¼ 62% and τ2 ¼ 4170 ps withα2 ¼ 28%.17
Considering all these aspects, the detected changes in thetime-resolved autofluorescence in type 2 diabetes are the resultof several metabolic alterations, most probably the accumulationof AGEs in the lens and the production of free FAD andaccumulation of AGEs in the neuronal retina at the fundus.A change from free to protein-bound NADH cannot completelybe excluded.
In conclusion, FLIO is a promising new method for inves-tigation of the metabolism of the eye based on fluorescence life-time of endogenous fluorophores. To get information about thefundus fluorescence alone, the fluorescence decay of the lensshould be measured separately and be used in the fit of thefluorescence decay, detected from the whole eye. To specifythe interpretation of metabolic alterations, techniques should bedeveloped, permitting FLIO measurements in single funduslayers of the living human eye.
AcknowledgmentsThis research was supported by the German Federal Ministry ofEducation and Research (Grant No. 03IPT605A) and theGerman Research Council (DFG HA 2899/19-1).
References1. Y. Ohkubo et al., “Intensive insulin therapy prevents the progression of
diabetic microvascular complications in Japanese patients with non-insulin dependent diabetes mellitus: a randomized prospective 5-yearstudy,” Diab. Res. Clin. Pract. 28, 103–117 (1995).
2. UK Prospektive Diabetes Study (UKPDS) Group, “Intensive blood-glu-cose control with sulfonyl ureas or insulin compared with conventionaltreatment and risk of complications in patients with type 2 diabetes(UKPDS 33),” Lancet 352, 837–853 (1998).
3. A. J. Barber, T. W. Gardner, and S. F. Abcouwer, “The significance ofvascular and neural apoptosis to the pathology of diabetic retinopathy,”Invest. Ophthalmol. Vis. Sci. 52, 1156–1162 (2011).
4. A. J. Barber et al., “Neural apoptosis in the retina during experimentaland human diabetes: early onset and effect of insulin,” J. Clin. Invest.102, 783–791 (1998).
5. A. B. El-Remessy et al., “Neuroprotective and blood-retinal barrier-preserving effect of cannabitol in experimental diabetes,” Am. J. Pathol.168, 235–244 (2006).
6. R. M. H. Diederen et al., “Reexamining the hyperglycemic pseudohy-poxia hypothesis of diabetic oculopathy,” Invest. Ophthalmol. Vis. Sci.47, 2726–2731 (2006).
7. M. S. Ola et al., “Analysis of glucose metabolism in diabetic rat retinas,”Am. J. Physiol. Endocrinol. Metab. 290, E1057–E1067 (2006).
8. Y. Ido et al., “Early neural and vascular dysfunction in diabetic ratsare largely sequelae of increased sorbitol oxidation,” Antioxid. RedoxSignal. 12, 39–51 (2010).
9. E. Lieth et al., “Retinal neurodegeneration: early pathology in diabetes,”Clin. Exp. Ophthalmol. 28, 3–8 (2000).
10. J. H. Yang et al., “Retinal neurodegeneration in type II diabetic OtsukaLong-Evans Tokusshima fatty rats,” Invest. Ophthalmol. Vis. Sci. 54,3844–3851 (2013).
11. R. U. Kowluru and S. N. Abbas, “Diabetes-induced mitochondrialdysfunction in the retina,” Invest. Ophthalmol. Vis. Sci. 44, 5327–5334(2003).
12. M. G. Field et al., “Rapid, noninvasive detection of diabetes-inducedretinal metabolic stress,” Arch. Ophthalmol. 126(7), 934–938 (2008).
13. F. C. Delori et al., “In vivo fluorescence of the ocular fundusexhibits retinal pigment epithelium lipofuscin characteristics,” Invest.Ophthalmol. Vis. Sci. 36(3), 718–729 (1995).
14. D. Schweitzer, “Ophthalmic applications of FLIM,” Chapter 20 inFluorescence Lifetime Spectroscopy and Imaging, L. Marcu, P. M. W.French, and D. S. Elson, Eds., pp. 423–447, CRC Press, Boca Raton,FL (2014).
Fig. 5 Sum and difference histograms of lifetime τ2 in the short-wave-length channel (490 to 560 nm).
Fig. 6 Sum and difference histograms of lifetime τ3 in the short-wave-length channel (490 to 560 nm).
Journal of Biomedical Optics 061106-12 June 2015 • Vol. 20(6)
Schweitzer et al.: Fluorescence lifetime imaging ophthalmoscopy in type 2 diabetic patients. . .
Downloaded From: https://www.spiedigitallibrary.org/journals/Journal-of-Biomedical-Optics on 18 May 2020Terms of Use: https://www.spiedigitallibrary.org/terms-of-use

15. Early Treatment Diabetic Retinopathy Study Research Group.,“Grading diabetic retinopathy from stereoscopic color fundus photo-graphs—an extension of the modified Airlie House classification.ETDRS report number 10,” Ophthalmology 98, 786–806 (1991).
16. H. W. van Dijk et al., “Early neurodegeneration in the retina of type 2diabetic patients,” Invest. Ophthalmol. Vis. Sci. 53, 2715–2719 (2012).
17. D. Schweitzer et al., “Towards metabolic mapping of the human retina,”Microsc. Res. Tech. 70, 410–419 (2007).
18. D. Schweitzer, “Quantifying fundus autofluorescence,” Chapter 8 inFundus Autofluorescence, N. Lois and J. V. Forrester, Eds., pp. 78–95,Wolters Kluwer Lippincott Williams &Wilkins, Philadelphia, PA (2009).
19. E. Y. Chew et al., “Evaluation of the age-related eye disease studyclinical lens grading system AREDS report no. 31,” Ophthalmology117, 2112–2119 (2010).
20. L. Deutsch, “Evaluierung des Fluorescence Lifetime Imaging vomAugenhintergrund bei Patienten mit Diabetes mellitus,” MDDissertation, FSU Jena, Germany (2012).
21. C. Dysli et al., “Quantitative analysis of fluorescence lifetime mea-surements of the macula using the fluorescence lifetime imagingophthalmoscope in healthy subjects,” Invest. Ophthalmol. Vis. Sci.55, 2106–2113 (2014).
22. C. Kloos et al., “Unnoticed shift in the normal range of glycated HbA1cwith TOSOH high performance liquid chromatography,” Diabetologia54(Suppl. 1), 401 (2011).
23. Diabetes Control and Complication Trial Research Group, “The effectof intensive treatment of diabetes on the development and progressionof long-term complications in insulin-dependent diabetes mellitus,”N. Engl. J. Med. 329, 977–986 (1993).
24. S. Holm, “A simple sequentially rejective multiple test procedure,”Scand. J. Stat. 6, 65–70 (1979).
25. M. Klemm, private communication, University of Technology, Instituteof Biomedical Engineering and Informatics, Ilmenau, Germany (2010).
26. M. Klemm et al., “Repeatability of autofluorescence lifetime imaging atthe human fundus in healthy volunteers,” Curr. Eye Res. 38, 793–801(2013).
27. D. Schweitzer et al., “Spectral and time-resolved studies on ocularstructures,” Proc. SPIE 6628, 662807 (2007).
28. S. Peters, M. Hammer, and D. Schweitzer, “Two-photon excited fluo-rescence microscopy application for ex vivo investigation of ocularfundus samples,” Proc. SPIE 8086, 808605 (2011).
29. D. Schweitzer et al., “Time-resolved autofluorescence imaging ofhuman donor retina tissue from donors with significant extramaculardrusen,” Invest. Ophthalmol. Vis. Sci. 53, 3376–3386 (2012).
30. D. Schweitzer et al., “Detection of early metabolic alterations in theocular fundus of diabetic patients by time-resolved autofluorescenceof endogenous fluorophores,” Proc. SPIE 8087, 80871G (2011).
31. S. E. Inzucchi et al., “Management of hyperglycemia in type 2 diabetes:a patient-centered approach: position statement of the AmericanDiabetes Association (ADA) and the European Association for theStudy of Diabetes (EASD),” Diabetes Care 35, 1364–1379 (2012).
32. H. H. Abholz et al., “Nationale Versorgungs Leitlinie Therapie des Typ-2 diabetes,” Dtsch. Arztebl. 110(40), A-1875/B-1655/C-1623 (2013).
33. H. D. Vishwasrao et al., “Conformational dependence of intracellularNADH on metabolic state revealed by associated fluorescence anisotro-phy,” J. Biol. Chem. 280, 25119–25126 (2005).
34. D. Schweitzer, “Metabolic mapping,” Chapter 10 in Medical Retina,F. G. Holz and R. F. Spaide, Eds., pp. 107–123, Springer, BerlinHeidelberg (2010).
35. V. Jyothikumar, Y. Sun, and A. Periasamy, “Investigation of trypto-phan–NADH interactions in live human cells using three-photonfluorescence lifetime imaging and Förster resonance energy transfermicroscopy,” J. Biomed. Opt. 18, 060501 (2013).
36. M. C. Skala et al., “In vivo multiphoton microscopy of NADH andFAD redox states, fluorescence lifetimes, and cellular morphology inprecancerous epithelia,” PNAS 104(49) 19494–19499 (2007).
37. D. Schweitzer, M. Hammer, and F. Schweitzer, “Limitations of the con-focal laser scanning technique in measurements of time-resolved auto-fluorescence of the ocular fundus,” Biomed. Tech. (Berl.) 50, 263–267(2005).
Dietrich Schweitzer received his Dipl.-Ing. in 1967, Dr.-Ing. in 1976,and the habilitation degree in 1990 from the Technical University ofIlmenau, Germany. From 1979, he was with the University of Jena,Germany, and was the head of experimental ophthalmology (EO)until his retirement in 2008. In 1995, he was appointed to a docentof EO. He developed a method for measuring the oxygen saturation,the optical density of xanthophyll, and was the founder of FLIO.
Lydia Deutsch: Biography is not available.
Matthias Klemm received his master’s degree in biomedical engi-neering from the Technische Universität Ilmenau. He is currentlyinvolved in the development of new methods for the analysis oftime-resolved fluorescence data from the human eye. Present inter-ests also include electrical current stimulation of the human eye anddynamic vessel analysis.
Susanne Jentsch has worked as a scientist in the Jena UniversityHospital, Department of Ophthalmology, since 2007. After receivinga graduate degree of optometry and vision science in 2007 at theERNST-ABBE-University of Applied Science in Jena, she workedon clinical-experimental studies with focus on macular pigment den-sity in age-dependent macular degeneration (AMD) as well as fluores-cence lifetime imaging in AMD, glaucoma and Alzheimer ’s disease.
Martin Hammer studied physics at the University of Jena andreceived his diploma degree in 1983 and his PhD in 1998. From1983 to 1990, he was with Carl Zeiss Jena. Since 1990, he hasbeen with the University of Jena, Department of Ophthalmology.Currently, he is head of the experimental ophthalmology group. Hisrecent research interests are functional imaging of the ocular fundus,retinal blood flow and oximetry, as well as autofluorescence lifetimeimaging.
Sven Peters studied biochemistry at the University of Jena andreceived his diploma in 2005. Since he started his PhD he hasbeen fascinated working with fluorescence lifetime imaging. Usingthis technique he investigated protein-protein interactions on micro-arrays at the Institute of Photonic Technology Jena. In 2010 he joinedthe experimental ophthalmology group at the University HospitalJena and focuses now on early diagnostics of retinal disorders,using autofluorescence lifetime and anisotropy imaging.
Jens Haueisen received his MS in 1992 and his PhD in 1996 in elec-trical engineering from the Technical University Ilmenau. From 1998to 2005, he was the head of the Biomagnetic Center, Friedrich-Schiller-University, Jena, Germany. Since 2005, he has been a pro-fessor of biomedical engineering and directs the Institute ofBiomedical Engineering and Informatics at the Technical UniversityIlmenau. His research interests include the investigation of activeand passive bioelectric and biomagnetic phenomena and medicaltechnology for ophthalmology.
Ulrich A. Müller studied medicine from 1974 to 1980 at the Universityof Jena. He graduated in 1982 with a degree in pathological anatomy,in 1995 as Doctor habilitatus in diabetology, and in 1993 with a Masterof Science in clinical biochemistry from the University of Aberdeen. In2002, he was professor of internal medicine, and in 2003 head of theDepartment of Endocrinology and Metabolic Diseases at UniversityHospital Jena, Germany. He has done studies on diabetes health caredelivery, diabetic late complication, insulin therapy, patient education.
Jens Dawczynski studied medicine from 1990 to 2001 at theUniversity of Jena. He received his MD in 2001 and habilitationdegree and postdoctoral lecture qualification in ophthalmology in2008. In 2011, he was appointed as professor of fundus imaging atUniversity of Leipzig, Department of Ophthalmology. He has been theassociate director and senior physician in this department. He leadsstudies on diabetic retinopathy, retinal vessel occlusion, and age-related macular degeneration.
Journal of Biomedical Optics 061106-13 June 2015 • Vol. 20(6)
Schweitzer et al.: Fluorescence lifetime imaging ophthalmoscopy in type 2 diabetic patients. . .
Downloaded From: https://www.spiedigitallibrary.org/journals/Journal-of-Biomedical-Optics on 18 May 2020Terms of Use: https://www.spiedigitallibrary.org/terms-of-use