FLUOR DANIEL GTI - TREATABILITY STUDY TO ... Phase I Conclusion ..... 7 3.0 PHASE II MICROBIAL...
184
FLUOR DANIEL GTI • - 000G ' L / 2 ^? TREATABILJTY STUDY TO EVALUATE AEROBIC BIOREMEDIATION OF CONTAMINATED SITE GROUNDWATER WAUKEGAN MANUFACTURED GAS AND COKE PLANT SITE WAUKEGAN, ILLINOIS April 29,1998 Prepared for: North Shore Gas Company and General Motors Corporation Prepared by: Dr. Richard Brown David Arnold, C.P.G. Dr. Bruce Rittmann Dr. Charles Gantzer Mark Deady, P.E. P \projects\waukegan\treatstb chg 23937 Research Drive / Farmmgton Hills, Mi 48335 USA (248) 473-0720
Transcript of FLUOR DANIEL GTI - TREATABILITY STUDY TO ... Phase I Conclusion ..... 7 3.0 PHASE II MICROBIAL...

FLUOR DANIEL GTI • - 000G ' L/ 2 ^?
TREATABILJTY STUDYTO EVALUATE AEROBIC BIOREMEDIATION OF
CONTAMINATED SITE GROUNDWATERWAUKEGAN MANUFACTURED GAS AND COKE PLANT SITE
WAUKEGAN, ILLINOIS
April 29,1998
Prepared for:
North Shore Gas Companyand
General Motors Corporation
Prepared by:
Dr. Richard BrownDavid Arnold, C.P.G.Dr. Bruce RittmannDr. Charles GantzerMark Deady, P.E.
P \projects\waukegan\treatstb chg
23937 Research Drive / Farmmgton Hills, Mi 48335 USA (248) 473-0720

Treatabilrty Study to Evaluate Aerobic Bioremediation of Contaminated Site Groundwater iiWaukegan Manufactured Gas and Coke Plant Site. Waukegan. Illinois________________________April 29,1998
EXECUTIVE SUMMARY
The Waukegan Manufactured Gas and Coke Plant Site Technical Committee conducted a laboratorytreatability study to determine the applicability of in-situ aerobic biodegradation as a remedial alternativefor compounds of concern (COCs) present in Site groundwater.
The Treatability Study was conducted in three phases. Phase I, using deionized water withconcentrations of compounds of concern (COCs) similar to Site groundwater, was designed to confirmthe biodegradability of mixtures of phenol and ammonia and to finalize the experimental protocol.Phase II, using Site groundwater, was designed to confirm the viability of biodegradation and todetermine the relative level of dilution needed to achieve biodegradation of the COCs. Phase III, usingboth synthetic and Site groundwater, was designed to provide an understanding of the biodegradationprocesses by measuring contaminant loss and determining the degradation kinetics. All three phasesused an inoculum of ammonia and phenol degraders to provide sufficient levels of bacteria toaccelerate the study so that data could be obtained in a reasonable period of time.
Results of the treatability study indicate the following:
1. The MW-7D Site groundwater, undiluted, does not support any biological activity.
2. Phenol degradation is unimpeded when the MW-7D groundwater is diluted at a ratio of 2:1(MW13S:MW7D) or greater, for which the rate of phenol degradation is independent of thedegree of dilution. Phenol degradation also is uninhibited by ammonia or thiocyanate at levelsrelevant to the Site.
3. Thiocyanate degradation occurs when the MW-7D groundwater is diluted at a ratio of 2:1(MW13S:MW7D) or greater. Unlike phenol, thiocyanate kinetics continue to increase as theMW-7D groundwater is diluted to lower strengths. This finding indicates that components in thegroundwater matrix are inhibitory to thiocyanate-degrading bacteria.
4. Ammonia was nitrified when MW-7D groundwater was diluted at a ratio of 2:1 (MW13S:MW7D)or greater, provided that nitrifying bacteria were present and that inhibition from phenol,thiocyanate, and components in the groundwater matrix was reduced by dilution or aerobicbiodegradation. The inhibitory effect on nitrification could be explained by an accelerateddie-off of the nitrifiers.
5. Once biodegradation was able to begin, the kinetics for each of the three compounds ofconcern was consistent with previously published work.
6. Active phenol- and thiocyanate-degrading bacteria were present in the Site soil.
P \projects\waukegan\t/catstb chg
FLUOR DANIEL GTI

Treatability Study to Evaluate Aerobic Bioremediation of Contaminated Site Groundwater iiiWaukegan Manufactured Gas and Coke Plant Site, Waukegan, Illinois________________________April 29,1996
In summary, the results of the laboratory treatability study support a conclusion that aerobicbiodegradation of phenol and thiocyanate may be feasible at the Site provided the Site groundwater issufficiently diluted or properly mixed prior to treatment. The results also suggest that nitrification ofammonia is possible, as long as nitrifying bacteria are present when toxicity from phenol, thiocyanate,and matrix components is relieved by a combination of aerobic biodegradation and dilution.
P \fxojects\waukegan\treatstb chg
FLUOR DANIEL GTI ZB
O

Treatability Study to Evaluate Aerobic BioremediaUon of Contaminated Site Groundwater ivWaukegan Manufactured Gas and Coke Plant Site. Waukegan, Illinois________________________April 29,1998
CONTENTS
1.0 INTRODUCTION . . . . . . . . . . . . . . . . . . . . . . . . . . . . . . . . . . . . . . . . . . . . . . . . . . . . . . . . . . . . . . 11.1 Study Purpose and Objectives . . . . . . . . . . . . . . . . . . . . . . . . . . . . . . . . . . . . . . . . . . . . 11.2 Literature Review of Treatment of Coal Conversion Wastewater . . . . . . . . . . . . . . . . . 11.3 Overview of Treatability Study Program . . . . . . . . . . . . . . . . . . . . . . . . . . . . . . . . . . . . . 4
2.0 PHASE I GROUNDWATER CHARACTERIZATION AND INOCULA SCREENING . . . . . . . . . 52.1 Initial Groundwater Characterization . . . . . . . . . . . . . . . . . . . . . . . . . . . . . . . . . . . . . . . . 52.2 Microbial Inocula Screening . . . . . . . . . . . . . . . . . . . . . . . . . . . . . . . . . . . . . . . . . . . . . . . 5
2.2.1 Experimental Protocol . . . . . . . . . . . . . . . . . . . . . . . . . . . . . . . . . . . . . . . . . . . . 62.2.2 Discussion of Results . . . . . . . . . . . . . . . . . . . . . . . . . . . . . . . . . . . . . . . . . . . . . 6
2.3 Phase I Conclusion . . . . . . . . . . . . . . . . . . . . . . . . . . . . . . . . . . . . . . . . . . . . . . . . . . . . . 7
3.0 PHASE II MICROBIAL INHIBITION TESTS USING SITE GROUNDWATER . . . . . . . . . . . . . . 83.1 Experimental Procedures . . . . . . . . . . . . . . . . . . . . . . . . . . . . . . . . . . . . . . . . . . . . . . . . 8
3.1.1 Experiment to Verify Activity of the Nitrifier Culture . . . . . . . . . . . . . . . . . . . . . . 93.1.2 Phase lib - Modification of Protocol . . . . . . . . . . . . . . . . . . . . . . . . . . . . . . . . . . 9
3.2 Discussion of Results . . . . . . . . . . . . . . . . . . . . . . . . . . . . . . . . . . . . . . . . . . . . . . . . . . . . 93.3 Conclusions . . . . . . . . . . . . . . . . . . . . . . . . . . . . . . . . . . . . . . . . . . . . . . . . . . . . . . . . . . 10
4.0 PHASE III - PHENOL AND AMMONIA BIODEGRADATION STUDY . . . . . . . . . . . . . . . . . . . . 104.1 General Experimental Methods . . . . . . . . . . . . . . . . . . . . . . . . . . . . . . . . . . . . . . . . . . 11
4.1.1 Sample Receipt . . . . . . . . . . . . . . . . . . . . . . . . . . . . . . . . . . . . . . . . . . . . . . . . 114.1.2 Nitrifier Inocula Calibration Test . . . . . . . . . . . . . . . . . . . . . . . . . . . . . . . . . . . . 114.1.3 Analytical Methods . . . . . . . . . . . . . . . . . . . . . . . . . . . . . . . . . . . . . . . . . . . . . . 114.1.4 Experimental Setup . . . . . . . . . . . . . . . . . . . . . . . . . . . . . . . . . . . . . . . . . . . . . 11
4.2 Phase III Short Term Study . . . . . . . . . . . . . . . . . . . . . . . . . . . . . . . . . . . . . . . . . . . . . . 124.2.1 Initial Short-Term Study Protocol . . . . . . . . . . . . . . . . . . . . . . . . . . . . . . . . . . . 124.2.2 Phase III Short-Term Test Extension . . . . . . . . . . . . . . . . . . . . . . . . . . . . . . . . 12
4.3 Phase III Long-Term Study . . . . . . . . . . . . . . . . . . . . . . . . . . . . . . . . . . . . . . . . . . . . . . 124.3.1 Initial Long-Term Study Protocol . . . . . . . . . . . . . . . . . . . . . . . . . . . . . . . . . . . 134.3.2 Long-TermTest Extension Protocol . . . . . . . . . . . . . . . . . . . . . . . . . . . . . . . 13
4.4 Nitrosomonas Die-Off in the Presence of Phenol and Thiocyanate . . . . . . . . . . . . . . 134.5 Results and Discussion . . . . . . . . . . . . . . . . . . . . . . . . . . . . . . . . . . . . . . . . . . . . . . . . . 14
4.5.1 Pure Compound/Deionized Water Studies . . . . . . . . . . . . . . . . . . . . . . . . . . . 144.5.1.1 Ammonia, Phenol and Thiocyanate . . . . . . . . . . . . . . . . . . . . . . . . . . 144.5.1.2 General Parameters . . . . . . . . . . . . . . . . . . . . . . . . . . . . . . . . . . . . . . 14
4.5.2 Site Groundwater Studies . . . . . . . . . . . . . . . . . . . . . . . . . . . . . . . . . . . . . . . . 154.5.2.1 Ammonia, Phenol and Thiocyanate . . . . . . . . . . . . . . . . . . . . . . . . . . 164.5.2.2 General Parameters . . . . . . . . . . . . . . . . . . . . . . . . . . . . . . . . . . . . . . 16
5.0 INTERPRETATION OF RESULTS . . . . . . . . . . . . . . . . . . . . . . . . . . . . . . . . . . . . . . . . . . . . . . . 185.1 Introduction . . . . . . . . . . . . . . . . . . . . . . . . . . . . . . . . . . . . . . . . . . . . . . . . . . . . . . . . . . . 185.2 Phenol Biodegradation Kinetics . . . . . . . . . . . . . . . . . . . . . . . . . . . . . . . . . . . . . . . . . . . 195.3 Thiocyanate Biodegradation Kinetics . . . . . . . . . . . . . . . . . . . . . . . . . . . . . . . . . . . . . . 195.4 Ammonia Biodegradation Kinetics . . . . . . . . . . . . . . . . . . . . . . . . . . . . . . . . . . . . . . . . 205.5 Indigenous Microorganisms . . . . . . . . . . . . . . . . . . . . . . . . . . . . . . . . . . . . . . . . . . . . . . 215.6 Conclusions . . . . . . . . . . . . . . . . . . . . . . . . . . . . . . . . . . . . . . . . . . . . . . . . . . . . . . . . . 22
P \projects\waukegan\treatstt chg
FlUOR DANIEL GTI
o

Treatability Study to Evaluate Aerobic Btoremediation of Contaminated Site GroundwaterWaukegan Manufactured Gas and Coke Plant Site. Waukegan. Illinois_________ April 29, 1998
6.0 TREATABILITY TEST SUMMARY AND CONCLUSIONS . . . . . . . . . . . . . . . . . . . . . . . . . . . . 226.1 Phenol Degradation . . . . . . . . . . . . . . . . . . . . . . . . . . . . . . . . . . . . . . . . . . . . . . . . . . . . 226.2 Thiocyanate Degradation . . . . . . . . . . . . . . . . . . . . . . . . . . . . . . . . . . . . . . . . . . . . . . . . 236.3 Ammonia Degradation . . . . . . . . . . . . . . . . . . . . . . . . . . . . . . . . . . . . . . . . . . . . . . . . . 246.4 Other Parameters . . . . . . . . . . . . . . . . . . . . . . . . . . . . . . . . . . . . . . . . . . . . . . . . . . . . . 256.5 Groundwater Matrix Effect . . . . . . . . . . . . . . . . . . . . . . . . . . . . . . . . . . . . . . . . . . . . . . . 266.6 Summary . . . . . . . . . . . . . . . . . . . . . . . . . . . . . . . . . . . . . . . . . . . . . . . . . . . . . . . . . . . . 26
FIGURES
Figure 2-1Figure 2-2Figure 2-3Figure 4-1Figure 4-2Figure 4-3Figure 4-4Figure 4-5Figure 4-6Figure 4-7Figure 5-1Figure 5-2Figure 5-3Figure 5-4Figure 5-5Figure 5-6Figure 5-7
TABLES
Table 2.1Table 2.2Table 2.3Table 2.4Table 3.1Table 3.2Table 3.3Table 3.4Table 4.1Table 4.2Table 4.3Table 4.4Table 4.5Table 4.6Table 4.7Table 4.8Table 4.9Table 4.10Table 4.11Table 5.1
Ammonia DegradationPhenol DegradationNitrite & Nitrate ProductionNH3 Removal, DaysSCN Removal, DaysPhenol Removal, DaysNH3 Removal, DaysPhenol Removal, DaysSCN Removal, DaysIIILT-1 3:1 MW13s:MW-7DComparison of Specific Growth RatesObserved Decay RatesComparison of Predicted and Observed Decay CurvesComparison of Predicted and Observed Thiocyanate Decay CurvesMatrix Time FactorsAmmonia Decay CurvesComparison of Predicted and Observed Decay Curves
Waukegan Phase I Groundwater Analytical Results (mg/L)Waukegan Phase I Analytical Results in mg/LWaukegan Phase I Analytical Results in mg/LWaukegan Phase I Analytical Results in mg/LAmmonia Results with Ion Selective ElectrodeConfirmation of Ammonia Degradation, Phase II.Waukegan Phase II Preliminary Results in (mg/L)Waukegan Phase lib Results (mg/L)Parameters and Analytical Methods for Sample AnalysisPhase III Short Term Study SetPhase III Short Term Test ExtensionPhase III Long Term Study Set UpPhase III Long Term Modification StudyPhase III Long Term Extension Study Set UpSampling and Analysis Protocol for Phase III Long Term Modification StudyPure Compound, Dl Water StudiesSite Groundwater StudiesNitrogen Balance, Pure Compound Dl Water StudiesNitrogen Balance, Site Groundwater StudiesComparison of the Smi)( Values for Phenol, thiocyanate and Ammonia
P \projects\waukegan\lreatstb chg
FlUOR DANIEL GTI

Treatability Study to Evaluate Aerobic Bioremediation of Contaminated SKe Groundwaler viWaukegan Manufactured Gas and Coke Plant SKe, Waukegan, Illinois________________________April 29,1998
Table 5.2 First Order Biomass Loss Rate Coefficients
APPENDIXES
Appendix A - Phase III - Biodegradation Study Experimental MethodsAppendix B - Analytical ResultsAppendix C - Biokinetic Evaluation of Individual Phase III Batch Tests
P \p«>i«cts^wauk«ganVtreatstb chg
F1UOR DANIEL GTI

Treatability Study to Evaluate Aerobic Bioremediation of Contaminated Site Groundwater 1Waukegan Manufactured Gas and Coke Plant Site, Waukegan, Illinois________________________April 29,1998
1.0 INTRODUCTION
1.1 Study Purpose and Objectives
The lower portion of the shallow aquifer at the Waukegan Manufactured Gas and Coke Plant(WMGCP) Site has a chemical composition resembling that of coal conversion or coal gasificationwastewaters. Three major groundwater compounds of concern (COC) at the Site are phenol,thiocyanate, and ammonia. The literature describing the aerobic biological treatment of coalconversion wastewaters suggests that these three COCs are biodegradable under the appropriateenvironmental conditions. The literature also indicates that the three COCs are self-inhibitory at highconcentrations and that the interactions among the three compounds can adversely affect the rate atwhich specific compounds are biodegraded. The success of engineered systems in treating coalconversion wastewaters suggests that a properly designed aerobic biological treatment process shouldbe an effective means of addressing these three COCs.
To determine if aerobic bioremediation is a viable remedy for the Site's aquifer, a laboratory treatabilitystudy was conducted to examine the aerobic biodegradation of these three COCs under simulated Siteconditions. The major objectives of the biotreatability study were to evaluate the aerobic biodegradationof phenol, thiocyanate, and ammonia, and to assess the fate of other COCs. The biotreatability studyprogressed in three phases from tests using simulated groundwater (i.e., spiked deionized water) toactual Site groundwater. The biotreatability study was designed to answer the following questions:
1. Are phenol, thiocyanate, and ammonia biodegradable when present together? In particular,what concentrations, singularly or in combination, are inhibitory to biodegradation?
2. Is there a matrix effect from Site groundwater that inhibits biodegradation?
3. What are the kinetic expressions and parameters that represent the kinetics of biodegradationfor the three major COCs, including inhibitory interactions?
4. Does the Site soil contain bacteria capable of biodegrading the major COCs under aerobicconditions?
1.2 Literature Review of Treatment of Coal Conversion Wastewater
The deep groundwater at the Site closely resembles wastewater generated during coal conversion orcoal gasification processes. The source of the deep groundwater contamination appears to have beenthe treatment ponds that received wastewater from the coal gasification and coking processes thatwere conducted on site.
P \projects\waukegan\tteatstb chg
FLUOR DANIEL GTI JP
o

Treatability Study to Evaluate Aerobic Btoremediation of Contaminated Site Groundwater 2Waukegan Manufactured Gas and Coke Plant Site, Waukegan, Illinois _______________________ April 29, 1998
A review of literature that discusses the biological treatment of coal conversion wastewaters wasconducted to assist in the interpretation of data generated from this treatability study and to providepossible explanations for the difficulties encountered in the treatability test. The paragraphs belowsummarize findings from the literature pertaining to the biological treatment of coal conversionwastewaters. The literature reviewed focuses on biological processes for relatively high-strength coalconversion wastewaters.
The activated sludge process is the most widely used technology for the treatment of coal conversionwastewaters. This treatment process generally results in good reductions in COD and thiocyanate andvery low effluent levels of phenols. However, long hydraulic detention times are usually necessary foradequate treatment.
Kostenbader and Flecksteiner (1969) conducted a treatability study on weak ammonia liquor (WAL)produced at the Bethlehem Steel Plant using the activated sludge process. A full scale activatedsludge plant received an average of 1 12,000 gallons per day (gpd) of WAL at an average hydraulicdetention time of 2-3 days. The average phenol concentrations was 1 ,400 mg/1 and the phenol load tothe plant was 1 ,300 Ib/day. The phenol concentration in the clarifier effluent remained under 0.1 mg/land BOD removal efficiency ranged from 85 to 95 percent during 2.5 years of operation. Thiocyanateoxidation ranged from 20 to 99 percent efficiency and averaged 70 percent during the same timeperiod.
Barker and Thompson (1973) presented the results of a one-year pilot plant study that examined thebiological removal of carbon and nitrogen compounds from coke plant wastes. The pilot plantconsisted of two completely mixed activated sludge units in series. The first tank was used for organiccarbon removal, while the second unit was for nitrification. A one-day hydraulic detention time wasused for each unit, and the flow rate to the system was set at 1 gpm. The treatment system wasoperated for 40 days. During this period, the influent COD, phenol, and thiocyanate concentrationswere 3,000 mg/l, 570 mg/l, and 310 mg/l, respectively, and associated removal efficiencies were 76,99, and 10 percent, respectively. The second stage nitrification tank was fed a mixture of diluted firststage effluent and a supplemental ammonia solution. Under these conditions, 75 to 90 percent of theammonia was nitrified. System upsets and the short term of operation of the process prevented thedevelopment of cultures capable of effective cyanide and thiocyanate oxidation.
Ganczarczyk and Elion (1978) examined the ability of an extended aeration activated sludge process totreat the coke plant effluent at Dominion Foundries and Steel Limited (DOFASCO) facility in Hamilton,Ontario. After equalization and stripping for ammonia reduction, the wastewater was fed to a single-stage activated sludge treatment plant. Phenol removal averaged 99 percent for influent phenolconcentrations ranging between 2.9 and 288 mg/l and an aeration detention time of 13.8 hours. Theactivated sludge system was operated at a sludge age of 41 .4 days with solids wasting over the effluentweir. Upon doubling the aeration detention time, the phenol removal efficiency increased to 99.3percent, with the sludge age remaining essentially constant at 41 .3 days. Thiocyanate removal was
P \pfoj«cts\waukegan\treatstt> chg
FLUOR DANIEL GTI
o

Treatability Study to Evaluate Aerobic Bkxemediation of Contaminated Site Groundwater 3Waukegan Manufactured Gas and Coke Plant Site, Waukegan, Illinois________________________April 29,1998
roughly 50 percent. In spite of the high sludge age and elevated reactor temperature, nitrification of theunstripped portion of the influent ammonia did not occur.
Adams et al. (1974) conducted laboratory studies examining the biological treatment of two coke plantwastes. The wastewater contained a BOD5 concentration of 4,140 mg/l, ammonia of 143 mg/l, phenolof 1,160 mg/l, and cyanide of 4.5 mg/l. Three identical activated sludge units were operated usinghydraulic detention times of 6.6 days, 2.6 days, and 1.8 days, respectively. The mixed liquorsuspended solids were maintained at roughly 2,500 mg/l in each of the three aeration tanks. Removalefficiencies for BOD, ammonia, phenol, and cyanide were 96.7, -3.5, 85.7, and 82.6 percent,respectively, for the 6.6 day hydraulic detention time unit. The 2.6 day hydraulic detention time unityielded removal efficiencies for the above parameters of 97.6,10.5, 84.6, and 79.8 percent,respectively, while a detention time of 1.8 days resulted in removal efficiencies of 88.9, 21.7, 76.8, and70.9 percent, respectively. A second wastewater containing BOD5 levels of 2,050 mg/l, ammonia of110 mg/l, phenol of 430 mg/l, and cyanide of 3 mg/l was treated in two activated sludge units usinghydraulic detention times of 4.1 and 2.2 days. A mixed liquor suspended solids concentration of2,400 mg/l was maintained in each unit. Removal efficiencies for BOD, ammonia, phenol, and cyanidefor the plant operated at a 4.1 day hydraulic detention time were 96.5, -101.8, >99.9, and 80.3 percent,respectively. Slightly lower removal efficiencies were observed for the plant operated at a hydraulicdetention time of 2.2 days. Removal efficiencies for BOD, ammonia, phenol, and cyanide in this plantwere 93.7, -60.0, 99.9, and 78.7 percent, respectively. The increase in ammonia concentrations aftertreatment could be attributed to the ammonia formed as an end product of the oxidation of thiocyanateand cyanide.
Luthy and Jones (1980) reported on the biological oxidation of an undiluted coke plant effluent. TheCOD, phenol, ammonia, cyanide, and thiocyanate concentrations of the waste ranged from 3,880-4,600 mg/l, 750-1,010 mg/l, 35-92 mg/l, 3.2-4.4 mg/l, and 280-554 mg/l, respectively. Seven identicalreactors were operated at sludge ages ranging from 10 to 40 days and hydraulic detention times of 2.7to 9.2 days. Phenol removal efficiencies were consistently greater than 99 percent for all systems,while thiocyanate removal efficiencies ranged from 90 to 99 percent. Cyanide, on the other hand, wasonly slightly removed. Nitrification occurred only in the reactor operated at a 40 day sludge age and a9.2 day hydraulic retention time. The authors concluded that a well managed activated sludgetreatment plant operated at a 40 day sludge age and a 9.2 day hydraulic detention time could treat anundiluted coke plant waste and produce an effluent that approaches best available technology (BAT).
Luthy and Tallon (1978) evaluated the biological treatability of HYGAS coal gasification processcondensate at full strength and at a 50 percent dilution. This study demonstrated that at hydraulicdetention times of 2 and 3 days and sludge ages ranging between 10 and 40 days, it was possible toremove 80 percent of the COD, 99 percent of the phenol, and 85 percent of the thiocyanate from the50 percent diluted waste. However, the full-strength wastewater inhibited biological treatment.
P ^O}«c1s\waukegan\tre4tstb chg
FLUOR DANIEL GTI VJ
o

Treatability Study to Evaluate Aerobic Bioremediation of Contaminated Site Groundwater 4Waukegan Manufactured Gas and Coke Plant Site, Waukegan, Illinois________________________April 29,1996
Luthy et al. (1980) conducted activated sludge treatability studies examining the biological treatment ofeffluent from a slagging fixed-bed coal gasification pilot plant operated by the Grand Forks EnergyTechnology Center of the Department of Energy. Their findings reinforced previous work in whichammonia-stripped wastewater was processed reliably at 33 percent strength. It should be pointed out,however, that even at this dilution the organic content of the wastewater, which averaged 8,380 mg/lCOD, was the highest reported for this type of wastewater. In a continuing study, Luthy and coworkers(1983) evaluated the treatability of the same wastewater after that water had been pretreated. Phenolswere removed by solvent extraction with methylisobutyl ketone and the ammonia was steam stripped.The pretreated wastewater was treated with activated sludge and powdered activated carbon-activatedsludge using aeration times of 12.6 and 11.7 days and sludge ages of 30 and 20 days, respectively.This study revealed that the solvent extracted and ammonia-stripped wastewater did not require dilutionprior to biological treatment. Also, solvent extraction resulted in lower COD, TOC and color for both ofthe systems.
The relatively unstable operation reported for activated sludge systems during the treatment of coalconversion wastewaters can be explained by the presence of certain organic and inorganic compoundsin the wastewater. Thiocyanate, cyanide, ammonia and phenol are all usually found in coal conversionwastewater at various concentrations. All of these compounds exhibit toxic effects above certainconcentrations and may cause severe inhibition of the activated sludge process. Juntgen and Klein(1977) presented data on the co-inhibition of phenol, thiocyanate and ammonia during the aerobictreatment of coke oven and coal gasification wastewaters. Phenol degradation was inhibited byconcentrations of ammonia, thiocyanate and sulfide in excess of 1,700, 250, and 25 mg/l, respectively.Thiocyanate degradation was completely halted at ammonia, thiosulfate, and phenol levels of 1,000,100, and 25 mg/l, respectively. Nitrification, on the other hand, was inhibited at levels of phenol,thiocyanate, and cyanide as low as 50,10, and 10 mg/l, respectively.
In conclusion, the biological treatment of relatively high-strength coal conversion wastewaters isachievable under controlled treatment processes. Organic constituents, such as phenol, were relativelyeasily degraded, yet degradation of other constituents such as ammonia, thiocyanate, and cyanide issignificantly more difficult. Nitrification was possible in a single-stage reactor, but only under extremelylong hydraulic and solids retention times or in a second-stage reactor devoted to nitrification. Therelative unstable performance of the evaluated treatment processes in treating coal conversionwastewaters can be attributed to the presence of certain inhibitory organic and inorganic compounds.
1.3 Overview of Treatability Study Program
The Treatability Study was conducted in three phases. Phase I, using simulated groundwater(deionized water plus mineral nutrients) was designed to confirm the biodegradation of mixtures ofphenol and ammonia in deionized water and to finalize experimental procedures. Phase II, using Sitegroundwater, was designed to determine the relative level of dilution required to achieve biodegradationin site groundwater. Phase III, using both simulated and Site groundwater, was designed to provide a
P \protects\waukeganUreatstb chg
FLUOR DANIEL GTI
o

Treatabilrty Study to Evaluate Aerobic Bioremediatkxi of Contaminated Site Groundwater 5Waukegan Manufactured Gas and Coke Plant Site. Waukegan. Illinois_______________________April 29,1998
quantitative comparison of ammonia removal for different levels of dilution by tracking and measuringcontaminant loss in reactors containing either spiked deionized water or actual Site groundwater. Allthree phases used an inoculum of ammonia and phenol degraders. The purpose of the inoculum wasto provide sufficient levels of bacteria so that data could be obtained in a reasonable period of time. Adescription of each phase follows in Sections 2, 3, and 4 of this report.
2.0 PHASE I GROUNDWATER CHARACTERIZATION AND INOCULA SCREENING
Phase I consisted of two parts. The first part was an initial characterization of Site groundwatersamples to determine maximum ammonia and phenol levels. This analysis was the basis for the levelsof dilution used in the subsequent inoculum tests. The second part was a microbial inoculationscreening to determine effective ammonia and phenol degrader inoculum levels.
2.1 Initial Groundwater Characterization
Two Site groundwater samples were collected and submitted to Fluor Daniel GTI's, RemediationTechnology Testing Facility, Concord, California on July 18 and 19, 1996. One sample (MW-13S) wascollected from the shallow groundwater, and a second sample (MW-7D) was collected from the deepgroundwater. A total of three 2.5-gallon bottles of groundwater labeled MW-7D and three 2.5-gallonbottles labeled 13-S were collected. Sample aliquots from each 2.5-gallon bottle were composited toobtain an individual well composite sample. Samples were collected and submitted to CH2M HillAnalytical Services for chemical analyses. The results of the analyses are shown in Table 2.1.
In general, the deep groundwater contained high levels of phenol (480 mg/l), ammonia (620 mg/l), andcresols (446 mg/l) and moderate levels of dissolved arsenic (19 mg/l). Benzene concentration wasfairly low (0.66 mg/l). Thiocyanate was not analyzed. The shallow groundwater contained low levels ofammonia (3.4 mg/I) and arsenic (0.15 mg/l), and contained no phenol or cresols. With the exceptionof cyanide, all the COCs were 3 to 5 orders of magnitude lower in the shallow groundwater than in thedeep aquifer.
2.2 Microbial Inocula Screening
The microbial screening test was designed to determine the microbial inoculum size required to ensuremeasurable phenol and ammonia oxidation within a desirable time frame. Three sets of three tubeseach were set up at three dilution levels. The first set was "undiluted", with phenol and ammoniaconcentrations set at what was present in MW-7D. The second set "diluted" these concentrations by afactor of 3; and the last set diluted these concentrations by a factor of 10. All three were made up byadding ammonia and phenol to mineral salt medium (i.e., inorganic nutrient medium without a carbonsource). Inocula (phenol and ammonia degraders) was added to each set of tubes at three levels(104, 105, 106 colony forming units (CFU/ml). Both types of microbial inocula were obtained fromNALCO Chemical Company (Chicago, IL). The ammonia degrading culture (INOC 8166 Plus) was
P \fxoj*cts\waukeganttreatstb chg
FLUOR DANIEL GTI

Treatability Study to Evaluate Aerobic Bkxemediation of Contaminated Site Grourxlwater 6Waukegan Manufactured Gas and Coke Plant Site, Waukegan, Illinois______________________April 29,1998
supplied in liquid suspension. The phenol degrading culture (INOC 7161) was supplied as a drypowder mixed with a bran carrier. A poisoned control tube was run based on the 105 inoculum size and10:1 dilution level.
2.2.1 Experimental ProtocolThe Phase I microbial inoculation screening study consisted of a series 10-day long batch tests. Thebatch tests contained high, medium, or low concentrations of two COCs, and either an estimated 104,10s, or 106 CFU/mL inocula of each phenol-degrading bacteria and of ammonia-oxidizing bacteria. Thebatch tests performed with deionized water spiked the low concentration of COCs initially contained 305mg/L of ammonia and 90 mg/L of phenol. The medium concentration reactors initially contained 366mg/L of ammonia and 250 mg/L of phenol, while the high concentration reactors had 1220 mg/Lammonia and 750 mg/L phenol. In addition to the added phenol, ammonia, phenol-degrading inocula,and the nitrifying inocula, the reactor media also contained various inorganic nutrients and a phosphatebuffer. The initial pH of all systems was adjusted to between 7.5 and 8.0. The headspace of each testbottle was flushed with pure oxygen to increase the availability of oxygen for microbial activity.
The bottle reactors were equipped with septum caps and incubated on a reciprocating shaker table atroom temperature. Individual bottle reactors from the experimental system (e.g., high concentration ofCOCs with the inocula consisting of 104 CFU/mL of phenol-degrading bacteria and thel 0* CPU/ ofammonia-oxidizing bacteria) were sacrificed for analysis of the remaining phenol and ammoniaconcentrations and for analysis of the produced concentrations of nitrite and nitrate. Bottle reactorswere sacrificed three times a week during the course of the 10-day long batch tests.
HACH test kits were utilized for measuring ammonia-nitrogen, nitrate-nitrogen, nitrite-nitrogen, and totalphenolic concentrations. These kits use a colorimetric procedure with a low detection range todetermine compound concentrations. While the kits have the advantage that only small samplevolumes are required, they do have the disadvantage that samples containing high concentration of theanalyzed compound must be diluted to fall within the calibrated range. Also, the results weredetermined by visual comparison with a color wheel. Any coloration of the water can interfere with theresults. The ranges for the test kits were ammonia-nitrogen (0 to 1.0 mg/L), nitrite-nitrogen (0 to 0.5mg/L), nitrate-nitrogen (0 to 50 mg/L), and total phenolics (0 to 5.0 mg/L).
2.2.2 Discussion of ResultsAs illustrated in Tables 2.2, 2.3, and 2.4, and Figures 2-1,2-2, and 2-3, the extent of phenol andammonia degradation during the 10-day long batch tests was affected by the concentration of COCs(high, medium, or low) and the level of bacterial inoculation. Because of an unexplainable loss ofammonia from the control bottle reactors (Figure 2-1) and presumably from the other bottle reactors,the extent of nitrification was quantified only in terms of nitrite and nitrate production and not in terms ofammonia disappearance. With no significant loss of phenol from the control reactors, the extent ofphenol biodegradation was quantified in terms of phenol disappearance.
P \protectstwaukegan\treatetb chg
FLUOR DANIEL GTI

Treatability Study to Evaluate Aerobic BJoremediation of Contaminated Site Groundwater 7Waukegan Manufactured Gas and Coke Plant Site, Waukegan. Illinois________________________April 29,1998
The batch tests performed with the low initial concentrations of COCs (80 mg/L phenol and 305 mg/Lammonia nitrogen) showed complete phenol removal and significant nitrification. Regardless of inoculasize, the 80 mg/L of phenol was removed within 1 day. Based on the accumulation of nitrite and nitrate,the extent of nitrification in the 104 CFU/mL bottles was 216 mg NH3-N/L, in the 10s CFU/mL bottles was130 mg NHj-N/L, and in the 106 CFU/mL bottles was 220 mg NH3-N/L
The batch tests performed with the medium initial concentrations of COCs (250 mg/L phenol and 366mg/L ammonia nitrogen) still showed complete phenol removal within 10 days, but showed virtually nonitrification. The time required for the complete removal of phenol decreased with increasing inoculasize. For example, phenol removal occurred within 10 days for an initial inocula of 104 CFU/mL ofphenol-degrading bacteria, while phenol removal occurred within 3 days with an initial inocula of 106
CFU/mL. The coal conversion wastewater literature indicated that phenol inhibits nitrification. Becausethe phenol persisted longer in the medium-concentration batch tests than the low-concentration batchtests, less nitrification was expected. This was the observed result. Because the difference in initialammonia concentrations is small between the low- and medium-concentration batch tests (305 and366 mg N/L, respectively), the lack of nitrification in the medium concentration batch tests is probablydue to phenol inhibition rather than an increased intensity of self-inhibition.
The high-concentration batch tests (750 mg/L phenol and 1220 mg/L ammonia) showed incompletephenol removal and no nitrification. Higher initial concentrations of phenol-degrading bacteria resultedin greater extents of phenol removal during the 10-day long batch tests. The 104 CFU/mL inoculashowed no phenol removal, the 105 CFU/mL inocula showed a 25 percent reduction in phenolconcentration, and the 106 CFU/mL inocula showed a 36 percent reduction. The presence of phenolduring the entire 10-day long high-concentration batch tests precludes any nitrification, because of thereported inhibition of nitrification by phenol.
2.3 Phase I Conclusion
The 10-day long Phase I batch tests showed a reduction in the extent of phenol removal and nitrificationwith increasing initial concentrations of phenol and ammonia. The decreased removal of phenol withincreasing initial phenol concentrations is consistent with the known self-inhibition of phenolbiodegradation (i.e., phenol inhibits its own biodegradation at higher concentrations). The reduction inthe extent of nitrification with increased initial phenol and ammonia concentrations is primarily due toinhibition by phenol. However, a fraction of the observed reduction in nitrification could also be due toammonia self-inhibition.
The Phase I batch test results suggest that at least a 105 CFU/mL of phenol-degrading bacteria and a105 CFU/mL of ammonia-oxidizing bacteria are required to achieve complete phenol and ammoniaremoval within 10 days. Higher inocula sizes would be required for concentrations above those used inthe low-concentration batch tests.
P \pro)«cts WaukeganUreatstb chg
F1UOR DANIEL CTI
o

Treatability Study to Evaluate Aerobic Bioremediation of Contaminated Site Groundwater 8Waukegan Manufactured Gas and Coke Plant Site, Waukegan, Illinois________________________April 29.1998
3.0 PHASE II MICROBIAL INHIBITION TESTS USING SITE GROUNDWATER
The purpose of Phase II was to determine if microorganisms could grow and could utilize phenol andammonia in groundwater from the lower portion of the shallow aquifer at the WMGCP Site. Whilephenol and ammonia are amenable to aerobic biological treatment as demonstrated in Phase I, thehigh concentrations of these and other chemicals found in the deep groundwater could be inhibitory ortoxic to the required types of microorganisms. The specific objective of the Phase II study was todetermine the degree of dilution required to ensure the growth of the phenol and ammonia degraderswhen exposed to deep groundwater. Dilution was accomplished by adding appropriate proportions ofthe shallow groundwater to the deep groundwater.
Phase II was run in two parts. The first part, using four levels of dilution, did not yield any ammoniaresults due to the interference of the site groundwater with ammonia test kits and ion selectiveelectrodes. In the second part, site groundwater and deionized water amended with mineral salt, andspiked with ammonia were tested to determine if ammonia degradation was measurable by thedistillation method.
3.1 Experimental Procedures
Four systems were used to determine the degree of dilution required to ensure the viability of nitrifyingand phenol-degrading microorganisms in groundwater from the deep aquifer. The systems wereundiluted MW-7D (deep groundwater) and 1:1,1:2, and 1:5 dilutions of MW- 7D with MW-13S.Inorganic nutrients (in the form of a mineral salts solution supplying manganese, calcium, magnesiumand iron ions for growth) without ammonia and phosphate buffer were added. All systems wereinoculated to microbial populations of 105 CFU/ml with ammonia and phenol oxidizing bacteria. The50 ml head space was flushed with pure oxygen at times Day 0, Day 4, and Day 6. Multiple reactorswere used for each condition. Individual reactors were then sacrificed at the appropriate time point forthe analyses of phenol, ammonia, nitrate, and nitrite.
The ammonia analytical procedure had to be modified during the test due to the groundwater colorinterference with the HACH test kit. The groundwater was too dark in color to allow for accuratereadings from the test kits. Samples from the four systems were sent to Sequoia Analytical Lab(Walnut Creek, California) to be analyzed for ammonia (using selective ion electrode), nitrate, andnitrite. The results, shown in Table 3.1, were higher than expected. After receiving the results fromSequoia Lab, the MW-7D composite was sent to be analyzed for ammonia by EPA 350.1 (distillation).The ammonia concentration was 410 mg/L, closer to what had been previously analyzed. Theseresults indicated that the Site groundwater caused an interference to the ion selective electrode andthat a distillation method was the only reliable method for determining the ammonia concentration inSite groundwater.
P \proj0cts\waukegan\treatstb chg
FLUOR DANIEL GTI

Treatability Study to Evaluate Aerobic Bkxemediation of Contaminated Site Groundwater 9Waukegan Manufactured Gas and Coke Plant Site, Waukegan. Illinois________________________April 29,1998
3.1.1 Experiment to Verify Activity of the Nitrifier CultureThe initial Phase II results showed a high degree of variability in the ammonia results. Little nitrate ornitrite was observed, which suggested a possibility that the nitrifier culture was not viable. To determineif the high degree of variability in the Phase II ammonia degradation results was an analytical problemand not a biological problem (i.e., an inactive nitrifier culture), two systems were set up in two separateone-liter bottles. Each bottle contained 150 ml of deionized water spiked with 200 mg/L ammonia.Minerals salt were added to support the microbial activity. One system was inoculated with 107 CFU/mlnitrifier bacteria. The second system, the control, was not inoculated. The pH was adjusted to 8.1 forboth systems. The headspace for both systems was flushed with pure oxygen, sealed, and put on areciprocating shaker table overnight. The results of this test are presented in Table 3.2. The testconfirmed the viability of the nitrifier inoculum.
3.1.2 Phase lib • Modification of ProtocolA second set of batch tests were performed to determine if ammonia degradation was measurable bythe distillation method. Two 2.5-liter bottles were set up with 1.5 L of water. One used groundwater ata 2:1 dilution (MW-13S: MW-7D). Assuming that the MW-7D ammonia concentration was 410 mg/L,based on the distillation analysis, ammonia was added to make up the ammonia-nitrogen concentrationrepresentative of MW-7D (i.e., 600 mg/L). This sample was then diluted with MW-13S water to result ina target ammonia concentration of 200 mg/L. The second bottle used deionized water amended withmineral salt (without ammonia). The deionized water system was used as the control and was spikedwith 200 mg/L ammonia. Both systems were inoculated with 106 CFU/ml of phenol degrading andnitrifying bacteria. The headspace for both systems was flushed with pure oxygen, and the pH wasadjusted to 7.7 with Tris (hydroxymethlyl) aminomethane, or Tris buffer. Tris buffer was added to thecontrol system, but not the Site groundwater system. Both bottles were sealed and put on a shaker.Dissolved oxygen was checked and recorded daily, and headspace was flushed with pure oxygen daily.
3.2 Discussion of Results
The phenol results (Table 3.3) showed substantial activity, which was dependent on the level of dilution.After 14 days, the phenol loss observed was 0%, 25%, 97%, and 100% for dilution levels of 0:1,1:1,2:1, and 5:1 (MW-13S: MW-7D). The phenol degradation at the 1:1 dilution appeared to stop after 9days, indicating questionable or marginal activity. However, at dilution levels of 2:1 and 5:1, phenoldegradation was virtually complete within 14 days.
The ammonia results for the initial Phase II experiments (Table 3.3) are not interpretable due to colorinterference between the groundwater and the test kits. However, none of the systems showed anysignificant production of nitrite or nitrate (as measured using HACH test kits), indicating that littleammonia oxidation was occurring at any dilution. There did, however, appear to be some appreciablelevels of nitrate at the 5:1 dilution, and the dissolved oxygen (DO) concentrations were depressed,suggesting that some nitrifying activity may have occurred.
P \pfOjects\waukeganUreatstb chg
FLUOR DANIEL GTI
o

Treatability Study to Evaluate Aerobic Bioremediation of Contaminated Site Groundwater 10Waukegan Manufactured Gas and Coke Plant Site, Waukegan. Illinois_______________________April 29,1998
The Phase lib results, Table 3.4, indicate that a 2:1 dilution of Site groundwater gave no nitrification.The ammonia concentration did not drop, and production of nitrate or nitrite was not evident. Thedeionized water control, however, showed loss of ammonia and, more significantly, the production ofnitrate and nitrite. This difference in nitrate and nitrite products between the experimental and controlbatch tests suggests the inhibition of nitrification by the chemicals found in the Site groundwater.
3.3 Conclusions
The Phase II batch tests indicate that dilution of the MW-7D groundwater is required before phenolbiodegradation will occur. The 14-day long Phase II batch tests performed with undiluted deep-aquifergroundwater (MW-7D) showed no phenol removal and no accumulation of nitrification products. Thissuggests that the undiluted deep-aquifer groundwater will not support the aerobic biodegradation ofphenol and ammonia. However, dilution ratios of 2:1 and 5:1 (MW13S:MW-7D both) showed virtuallycomplete phenol removal within 14 days. Thus, a certain amount of dilution of the MW-7D groundwateris required for aerobic phenol biodegradation to occur.
Unlike phenol, the dilution of the MW-7D groundwater from a 100 percent solution down to a 5:1dilution (MW13S:MW7D) had no apparent effect on nitrification. None of the dilutions resulted in acontinual accumulation of nitrite and nitrate. Although nitrate could have been consumed viadenitrification due to the sometimes low dissolved oxygen concentrations, the lack of a continuousaccumulation of nitrite and nitrate suggests a lack of nitrification. This lack of nitrification could be dueto combination of three factors: (1) ammonia self-inhibition was a likely minor component, (2) inhibitionof nitrification by phenol was a likely important component, and (3) inhibition of nitrification by othercompounds found in the MW-7D groundwater was a likely component.
The Phase II batch tests indicate that any subsequent batch tests performed with actual sitegroundwater should use the distillation method. Also, the batch tests should be longer than 2 weeksand be inoculated with concentrations of bacteria greater than 1O5 CFU/mL in order to assess theaerobic biodegradation of COCs in the groundwater.
4.0 PHASE III - PHENOL AND AMMONIA BIODEGRADATION STUDY
The Phase III experiments consisted of two parts - a short-term study and a long-term study. ThePhase III short-term study was intended to develop rate kinetics for the comparison of the effects ofammonia, phenol, and thiocyanate concentrations on biodegradation, specifically nitrification. ThePhase III long-term study was intended to provide data to investigate the selective loss of phenol,ammonia, thiocyanate, organic nitrogen, and other contaminants, to verify the time frames necessaryfor significant contaminant concentration reduction, and to establish preliminary limits on potentialtreatment end points.
P \proj«cts\wauk«ganUreatstb chg
FLUOR DANIEL GTI

Treatability Study to Evaluate Aerobic Bioremediation of Contaminated Site Groundwater 11Waukegan Manufactured Gas and Coke Plant Site, Waukegan, Illinois_______________________April 29,1998
The Phase III protocol is based on the 'Phenol and Ammonia Biodegradation Study" presented in theJune 28,1996, "Treatability Study Work Plan". The protocol was modified to incorporate the results ofPhases I, II, and lib. The short and long term studies were conducted in two parts, the original protocoland a test extension. Short-term and the long-term parts of the Phase III study were extended becausenitrification was slow or not measurable in many of the test bottles. The studies were extended inlength and/or the bottles were reinoculated with heterotrophs and nitrifying bacteria.
Because of the extensions, there were a total of four parts to the Phase III study: 1) initial short termstudy, 2) short term test extension, 3) initial long term study, and 4) long term study extension and re-inoculation test.
4.1 General Experimental Methods
4.1.1 Sample ReceiptApproximately 15 gallons of groundwater from monitoring well MW-13S and 10 gallons of water frommonitoring well MW-7D were received by Fluor Daniel GTI, Remediation Technology Testing Facility,Trenton, New Jersey, in February, 1997 for use in the short and long term studies. Unused MW-7Dwater was frozen, and unused MW-13S water was refrigerated to minimize loss of COCs.
4.1.2 Nitrifier Inocula Calibration TestBecause nitrifiers do not respond to routine plate count methods, ammonia degradation rates wereused to estimate the quantity of nitrifiers in the inoculum. The calibration procedure is described inAppendix A. A known concentration of ammonia was added to buffered deionized water. The rate ofammonia loss was measured and used to estimate the quantity of nitrifiers in the inocula. Thisprocedure was used to calibrate the nitrifier inocula used during the various Phase III batch tests.
4.1.3 Analytical MethodsThe analytical methods and the minimum detection limits of the analyses that were used for the PhaseIII Study are listed in Table 4.1.
4.1.4 Experimental SetupTwenty liter glass bottles were used for all experiments in Phase III. Each bottle was filled with six litersof test solution. The test solution, depending on the particular experiment, was either spiked deionizedwater or a mixture of Site groundwater from monitoring wells MW-7D and MW-13S. Buffer and inoculawere added as described in Tables 4.2, 4.4 and 4.6 and Appendix A. All experiments using deionizedwater were spiked with ammonia, phenol, and thiocyanate as specified in Tables 4.2, 4.4 and 4.6. Theheadspace of each bottle was periodically flushed with a stream of oxygen gas. All bottles werecontinuously stirred and covered with aluminum foil for the duration of the test to avoid light penetration,photochemical oxidation, and photosynthesis.
P Vpro|ects\waukeg»nVUeatstb chg
FLUOR DANIEL CTI

Treatability Study to Evaluate Aerobic Bioremediation of Contaminated Site Groundwater 12Waukegan Manufactured Gas and Coke Plant Site, Waukegan, Illinois_______________________April 29,1998
4.2 Phase III Short Term Study
The Phase III short term study was performed to provide data on the rate kinetics for biodegradation ofcontaminants and specifically nitrification, and to determine and verify the interaction among ammonia,phenol, and thiocyanate concentrations during the aerobic biodegradation process.
4.2.1 Initial Short-Term Study ProtocolSix testing bottles, identified as IIIST-1 through IIIST-6, were used for the short-term batch tests. BottlesIIIST-1 through IIIST-3 used spiked deionized water. Bottles IIIST-4 through IIIST-6 used Sitegroundwater. The experimental setup and purpose of the six short-term studies are summarized inTable 4.2 and described in detail in Appendix A.
The bottles were sampled twice weekly and analyzed for ammonia nitrogen (NH3-N), thiocyanate(SCN~), nitrate nitrogen (NO3-N), nitrite nitrogen (N02 -N), total Kjeldahl nitrogen (TKN), phenol,alkalinity, chemical oxygen demand (COD), and dissolved organic carbon (DOC). Thiocyanate andphenol were analyzed twice weekly until the concentrations were at or below detection limits. The pHand DO were monitored and recorded during every sampling interval. All samples for chemicalanalysis were sent to CH2M Hill Analytical Services.
4.2.2 Phase III Short-Term Test ExtensionThe short term study bottles using site groundwater (IIIST-4, IIIST-5, and IIIST-6) did not showappreciable ammonia removal at the end of 4VS weeks. Because of this, the study was extended.There were three modifications to the experimental protocol. First, all the test bottles with Sitegroundwater were continued. Second, test bottle IIIST-5, the 9:1 dilution (MW-13 to MW-7), was split,and one split was reinoculated. Third, two new short term studies using deionized water, IIIST-7 andIIIST-8, were set up and run to confirm the nitrification kinetics and an active nitrified inocula. The testprotocol changes are summarized in Table 4.3 and discussed in more detail in Appendix A.
4.3 Phase III Long-Term Study
The Phase III Long Term Study was conducted to investigate the fate of phenol, ammonia,thiocyanate, total nitrogen, and other contaminants over a 12-week test period in Site groundwater.This testing was designed to determine the time frames necessary for significant contaminantdegradation, determine if there were matrix inhibition effects in the Site groundwater, and establishpreliminary performance limits and potential treatment endpoints. The initial experimental setup,including volumes of Site groundwater from MW7-D and MW13-S used, are summarized in Table 4.4and discussed in more detail in Appendix A.
P \proiectsWaukegan\lreatstb chfl
FLUOR DANIEL GTI
o

Treatability Study to Evaluate Aerobic Btoremediatkxi of Contaminated Site Groundwater 13Waukeqan Manufactured Gas and Coke Plant Site. Waukegan. Illinois________________________April 29,1998
4.3.1 Initial Long-Term Study ProtocolSeven test bottles were used. IIILT-1 through HILT-3 and IIILT-6 examined the effect of dilution andused dilutions ranging from 2:1 (MW-13S to MW-7D) to 9:1. Test bottle HILT-4 was undiluted MW-7Dwater. Test bottle HILT-5 used Site soil as an inoculum. Test bottle IIILT-7 was a poisoned control.
4.3.2 Long-TermTest Extension ProtocolThe six active test bottles were reinoculated or split and reinoculated. None of the long-term testbottles showed any nitrification after 85 days. IIILT-7(poisoned control) was not reinoculated. Severalof the bottles (HILT 5, 6 and 9) were split or diluted to a new level. A 600 mL sample aliquot waswithdrawn from test bottle IIILT-1 and diluted with 2400 ml of stored MW 13-S groundwater to make a19:1 dilution test bottle. This bottle was designated HILT-9i. The contents of test bottle IIILT-6 were splitinto two equal volumes (IIILT-6i and IIILT-6n).
Two new test bottles using deionized water, IIILT-8 and IIILT-10, were set up to confirm the ammoniabiodegradation baseline kinetics and the concentration of active nitrifiers in the inocula. The samplingfrequency for both test bottles IIILT-8 and HILT-10 was three times a week.
A duplicate of test bottle IIIST-3, identified as IIIST-3D, was also run to reconfirm the synergisticinhibition of nitrification by phenol and thiocyanate.
The revised analytical procedure for the long term test extension are listed in Table 4.7.
4.4 Nitrosomonas Die-Off in the Presence of Phenol and Thiocyanate
An examination of the data from the short and long term studies indicated that inhibition of nitrificationcould possibly be explained by an initial biomass die-off of the Nitrosomonas, which occurs during thetime when both phenol and thiocyanate were present. After the phenol was degraded, ammoniadegradation occurred and followed the uninhibited nitrification kinetics with the viable, but reducednitrifier population that remained after the initial die off. The lag time for nitrification observed was dueto the regrowth of the nitrifying bacteria. A comparison of deionized water studies spiked with phenoland thiocyanate indicated that a matrix inhibition could also exist after phenol and thiocyanate havebeen degraded.
An experiment was conducted to verify that a die-off of the nitrifiers had occurred. Thirty mL aliquotswere withdrawn from test bottles IIIST-3D, IIILT-2J, and IIILT-3J, and the biomass present wasconcentrated, washed, and resuspended in 50 mL ammonia assay buffer solution (0.955 g/L NH4CI;0.46 g/L KH2PO4; 3.7 g/L K2HPO4; and 0.35 g/L NaHCOJ. The reason for the washing was to removeany toxic or inhibitory compounds. Three aliquots were taken from each bottle for assay at timeintervals of 1, 3, and 6 hours. Nitrate and nitrite concentrations were measured using HACH test kits.Ammonia concentration was measured using an ammonium ion specific electrode. The nitrite andnitrate production data and ammonia degradation data obtained from these assays was analyzed using
P \<xoj«ctsVwauk«gan\treatstb chg
FLUOR DANIEL GTI

Treatability Study to Evaluate Aerobic Bioremediation of Contaminated Site Groundwater 14Waukegan Manufactured Gas and Coke Plant Site. Waukegan, Illinois______________________ April 29,1998
standard mechanistic growth models to determine the growth of active Nitrosomonas biomass in eachassay flask.
4.5 Results and Discussion
The analytical and monitoring results from the Short-Term and Long-Term Studies are presented inAppendix A and summarized in Tables 4.8 and 4.9, which present the number of days required for theremoval of the key groundwater constituents, ammonia (NH3-N), phenol, and thiocyanate (SCN~).Discussion of the results is divided between pure compound/deionized water studies and Sitegroundwater studies.
4.5.1 Pure Compound/Deionized Water StudiesA series of studies was conducted using deionized water amended with ammonia, phenol, andthiocyanate. These pure compound studies were designed to examine the effect, individually and incombination, of these constituents on biodegradation processes. The following discussion will firstexamine the degradation of the primary COCs, ammonia, phenol, and thiocyanate. Second it willexamine changes in the general water quality parameters during the biodegradation process.
4.5.1.1 Ammonia, Phenol and Thiocyanate A parameter that can be used to assessbiodegradation is the length of time, in days, that it took for complete removal of a constituent. Thetime required for complete ammonia, thiocyanate and phenol degradation for the deionized waterstudies are summarized in Table 4.8 and depicted in Figures 4-1, 4-2, and 4-3. There are severalobservations that can be drawn from this data. See Appendix B for the complete data tabulations.
1. All three constituents were aerobicalty biodegradable.2. Phenol degradation was uninhibited by either ammonia or by thiocyanate. (Table 4.8, compare
No. 5 and 7; Figure 4-3).3. Ammonia degradation was inhibited by the presence of either phenol (Table 4.8, compare No. 1&2
with 5) or thiocyanate, (Table 4.8, compare No. 1&2 with 6). Phenol was a stronger inhibitor ofnitrification than was thiocyanate. (Table 4.8, compare No. 5 and 6).
4. There was a synergistic inhibition of ammonia degradation when phenol and thiocyanate werepresent together (Table 4.8, compare No. 5&6 with 7; Figure 4.-1).
5. When all three were present, the order of complete degradation was phenol followed bythiocyanate then ammonia. (Table 4.8, No. 7).
6. The bacterial population level shortens the observed lag times (Table 4.8, compare No. 1&2 with3&4) in roughly a first order manner.
4.5.1.2 General Parameters A number of other parameters were monitored in addition to the loss ofammonia, phenol, and thiocyanate. Several of these show apparent response to biodegradation. Thefollowing summarizes the observations of these parameters. See Appendix B.
P \projectsVwaukftgan\treatstb chg
FLUOR DANIEL GTI
w

Treatability Study to Evaluate Aerobic Bioremediation of Contaminated Site Groundwater 15Waukegan Manufactured Gas and Coke Plant Site, Waukegan, Illinois________________________April 29,1996
Nitrite/Nitrate - When ammonia oxidation occurred, nitrite levels increased first. After the ammoniawas gone, the nitrite was converted to nitrate. The oxidation of ammonia in these pure compoundstudies was sequential: NH3 - NO2~ - NO3", which is consistent with the fact that two different microbialpopulations are necessary to carry out the two steps.
TKN - Total Kjeldahl nitrogen is a measurement of free NH3-N plus organic nitrogen. It slowlydecreased in these studies which is a reflection of the ammonia oxidation.
Alkalinity - pH decreases or loss of alkalinity was evident during active nitrification. To compensate forthe loss of alkalinity and corresponding decrease in pH, NaOH was added. Therefore, total alkalinityremained relatively constant throughout the test period due to the addition of base to maintain optimumpH levels for nitrification.
DOC - Dissolved organic carbon concentrations were variable during the study. It increased sometimesand decreased other times. There doesn't appear to be any obvious correlation to any processes.
COD - Chemical oxygen demand gradually decreased during the course of the studies, most likely dueto the bio-oxidation of the major organic constituents. Phenol removal had the greatest impact on CODreduction. The COD was highest when phenol was present, and dropped rapidly when the phenol wasremoved.
DO - Dissolved oxygen was very sensitive to the degradation processes. The general pattern that wasobserved when oxidation occurred was an initial drop in DO while phenol was degraded, followed by anincrease when the phenol was depleted, (due to oxygen flushing) and then a second drop as theammonia was oxidized. The ammonia oxidation caused the greatest reduction in DO.
Nitrogen Balance -A total nitrogen balance was conducted on the pure compound/deionized studytest bottles and the results are presented in Table 4.10. The sum of the TKN-nitrogen, nitrate-nitrogen,nitrite-nitrogen, and thiocyanate-nitrogen concentrations was calculated at two sampling points,specifically the initial sampling event and a sampling event near the end of the test. Changes inconcentration due to the addition of acid or base and/or microbial inoculum was not accounted for inthe calculation. With the exception of test bottle IIILT-8, the total nitrogen concentrations stayedrelatively constant for the duration of the study indicating that the analytical as well as the experimentalprocedures were technically sound.
4.5.2 Site Groundwater StudiesSite groundwater was used to study the interaction among ammonia, phenol and thiocyanate and todetermine if there was a matrix effect due to other constituents in the Site groundwater. Theexperiments were set up by diluting water from MW-7D with water from MW-13S. The MW-7D waterwas highly contaminated, while MW-13S was slightly contaminated. The level of dilution ranged fromnone to 20 fold. For a number of experiments, multiple inoculations were used to counteract apparent
P \proj«cts\wauk«flanUreatstb chg
FLUOR DANIEL CTI

Treatability Study to Evaluate Aerobic Bkxemediation of Contaminated Site Groundwater 16Waukegan Manufactured Gas and Coke Plant Site. Waukegan, Illinois______________________April 29,1998
toxicity and to maintain a high level of bacteria. The following discussion will first examine thedegradation of the primary contaminants - ammonia, phenol, and thiocyanate. Second it will examinechanges in the general water quality parameters during the biodegradation process. See Appendix Bfor tables of data collected during Phase III.
4.5.2.1 Ammonia, Phenol and Thiocyanate The key parameter that was tracked was the length oftime in days that was required for the complete removal of ammonia, thiocyanate, and phenol. Theresults are summarized in Table 4.9 and depicted in Figures 4-4, 4-5, and 4-6.
Several observations about the oxidation of ammonia, phenol and thiocyanate can be made from thesedata:
1. The MW-7D Site groundwater, undiluted, did not support any aerobic biological activity . (Table4.9 no. 13).
2. With a single inoculation, ammonia oxidation did not occur at less than a dilution level of 9Parts MW-13S: 1 part MW-7D. (Table 4.9 compare nos. 3, 9, and 10; Figure 4.4) .
3. With multiple inoculations, ammonia oxidation occurred at up to a 2:1 dilution (MW13S:MW7D). Ammonia degradation increased as dilution increased. (Table 4.9 nos. 8, 10, and 12;Figure 4.4).
4. Phenol degradation was unimpeded at a 2:1 dilution (MW13S:MW7D) and was independent ofthe dilution level for greater dilutions. (Table 4.9 nos. 10,11, and 12; Figure 4.5). Phenoldegradation appears to have been uninhibited by either ammonia levels or thiocyanate levels.
5. Thiocyanate degradation occurred at dilution levels of 2:1 (MW13S:MW7D), and thedegradation rate increased with greater dilutions. (Table 4.9 nos. 6, 9, 10, and 12; Figure 4.6).
6. When all three compounds were present, the order of complete degradation was phenolfollowed by thiocyanate and then ammonia. (Figure 4.7).
7. Active phenol and thiocyanate degraders were present in the Site soil. (Table 4.9 no. 7).
8. The degradation rates for ammonia and thiocyanate were slower in the Site groundwater thanthey were in Dl water. This suggests an inhibitory matrix effect. (Compare Tables 4.8 and 4.9).
4.5.2.2 General Parameters A number of other parameters were monitored in addition to the loss ofammonia, phenol, and thiocyanate. Several of these show apparent response to biodegradation. Thefollowing summarizes the observations of these parameters.
P \proiects\waukegan\Jreatstb chg
F1UOR DANIEL GTI

Treatability Study to Evaluate Aerobic Bioremediation of Contaminated Site Groundwater 17Waukegan Manufactured Gas and Coke Plant Site. Waukegan, Illinois_______________________April 29,1998
Nitrite/Nitrate - The production of nitrate and nitrite appeared to be affected by the dilution level. Athigh dilutions, the oxidation of ammonia in these pure compound studies was sequential: NH3 - NO2~ -NO3". When ammonia oxidation occurred, the nitrite levels generally increased first. After the ammoniawas gone, the nitrite was then converted to nitrate. At low dilutions, accumulation of nitrite was small,and ammonia was more quickly oxidized to nitrate.
TKN - Total Kjeldahl nitrogen is a measurement of NH3-N as well as organic nitrogen, such asbiomass. It slowly decreased in these studies, a reflection of the ammonia oxidation. The drop in TKNwas much slower in the Site groundwater than in the Dl water studies. This may be due to thepresence of organic molecules that contain nitrogenous species and are poorly degraded.
Alkalinity - pH decreases or loss of alkalinity was evident during active nitrification. To compensate forthe loss of alkalinity and control pH, NaOH was added. Therefore, total alkalinity remained relativelyconstant throughout the test period due to the addition of base to maintain optimum pH levels fornitrification.
DOC - the most common pattern for dissolved organic carbon during the study was an initial increasefollowed by a period of "stability" and then a final decrease. This may reflect partial oxidation ofgroundwater constituents. The control showed a more random behavior.
COD - Chemical oxygen demand gradually decreased during the course of the studies, mainly due tothe bio-oxidation of the major organic constituents. The degradation of phenol had the greatest impacton COD reduction. The COD was highest when phenol was present and dropped rapidly when thephenol was removed. However, as compared to the Dl water studies, there was a residual COD afterthe primary constituents were removed. This may be due to the production of biomass or intermediatesthat are eventually oxidized, but at a slower rate than the primary constituents or, it may reflect somerefractory or recalcitrant organic matter. The control also showed a drop in COD.
BOD - Biological oxygen demand generally decreased during the course of the study.
DO - Dissolved oxygen was very sensitive to the degradation processes. The general pattern that wasobserved when oxidation occurred was an initial drop in DO while phenol was degraded. After thephenol was removed DO increased (due to oxygen flushing). When ammonia degradation startedthere was a second drop in DO as the ammonia was oxidized. The ammonia oxidation caused thegreatest reduction in DO. This is parallel to the observation made in the Dl water studies.
Arsenic, Cyanide, Iron -The concentrations of these inorganic components were essentiallyunchanged during the studies.
Nitrogen Balance - A total nitrogen balance was conducted on the Site groundwater study test bottlesand the results are presented in Table 4.11. The sum of the TKN-nitrogen, nitrate-nitrogen, nitrite-
P \projects\waukegan\treatstb chg
FLUOR DANIEL GTI
o

Treatabllity Study to Evaluate Aerobic Bkxemediation of Contaminated Site Groundwater 1 8Waukegan Manufactured Gas and Coke Plant Site, Waukegan, Illinois _______________________ April 29, 1998
nitrogen, and thiocyanate-nitrogen concentrations was calculated at two sampling points, specificallythe initial sampling event and a sampling event near the end of the test. Changes in concentration dueto the addition of acid or base and/or microbial inoculum was not accounted for in the calculation. Withthe exception of test bottles IIIST-5i, IIILT-6n, and HILT-7, the total nitrogen concentrations stayedrelatively constant (+ 20%) for the duration of the study, indicating that the analytical as well as theexperimental procedures were technically sound. Approximately one-half of the test bottlesexperienced an increase in the total nitrogen concentration from the beginning to the end of the study.Matrix interferences for certain analytical methods may also have contributed to the differencesbetween the initial and final total nitrogen concentrations.
5.0 INTERPRETATION OF RESULTS
5.1 Introduction
The previous sections of this report describe the results of the biotreatability tests in terms of lag timesand the time required for the complete removal of a substrate. This section interprets the Phase IIIexperimental results in terms of a mechanistic microbial growth model. The development andcalibration of the model is described in Appendix C. The calibrated model explicitly accounts for theinhibitory and toxic effects associated with the aerobic biodegradation of the phenol, thiocyanate, andthe ammonium cation (hereafter referred to as ammonia or ammonia nitrogen) found in the Sitegroundwater.
As microbial substrates, phenol, thiocyanate, and ammonia are reported to be self-inhibitory whensubject to aerobic biodegradation, (i.e., the biomass-specific rate of aerobic biodegradation slows asthe contaminant concentration increases beyond an inhibitory threshold concentration). Haldanekinetics can be used to describe the relationship between self-inhibitory substrate concentration and theresulting biodegradation rates. Based on Haldane kinetics, the calibrated mechanistic growth modelsuggests that rates of phenol, thiocyanate, and ammonia nitrogen will start to decrease aboveconcentrations of 9, 39, and 79 mg/L, respectively. As illustrated in Figure 5-1 , the maximum specificgrowth rates for the thiocyanate degraders and ammonia oxidizers are about a factor of 1 0 slower thanthe maximum growth rate for the phenol degraders. Thus, based solely on the self-inhibition kinetics ofthe three substrates, the expected pattern of complete substrate removal from batch tests containing allthree substrates would be phenol first, followed by thiocyanate or ammonia.
In addition to an inhibitory threshold concentration, Haldane kinetics allows calculation of the maximumsteady-state substrate concentration that will support a population of capable microorganisms (Smax).Theoretically, the determination of the Smix value for phenol, thiocyanate, and ammonia degradingmicroorganisms allows a quick determination of whether a particular concentration of substrate can bebiodegraded. For example, if the concentration of phenol in the undiluted groundwater from monitoringwell MW-7D is 1200 mg/L and the S^, for the heterotrophic inocula for a Phase III batch test is 6800mg/L, then the Haldane kinetic model suggests that the phenol should be biodegradable. If this is not
P \praj«cts*waukegan\lreatstt) chg
FLUOR DANIEL GTI
o

Treatabilrty Study to Evaluate Aerobic Bkxemediation of Contaminated Site Groundwater 19Waukegan Manufactured Gas and Coke Plant Site. Waukegan, Illinois _______________________April 29, 1998
the observed experimental result, then additional factors such as interaction between substrates andgroundwater matrix toxicity can be precluding phenol biodegradation.
A comparison of the calculated S^ values to the substrate concentrations measured in the undilutedgroundwater from monitoring well MW-7D suggests that phenol, thiocyanate, and ammonia should bebiodegradable in the undiluted groundwater. As shown in Table 5.1, the observed substrateconcentrations in the MW-7D groundwater are at least a factor of 3 below the calculated respective S,^values. This suggests that if the biodegradation of phenol, thiocyanate, and ammonia were only subjectto self-inhibition, then the biological removal of phenol, thiocyanate, and ammonia from the undilutedMW-7D groundwater is expected. However, Figure 5-2 indicates no phenol, thiocyanate, and ammoniaremoval during the IIILT-4 batch test, which contained undiluted MW-7D groundwater. Thus, theaerobic biodegradation of phenol, thiocyanate, and ammonia in MW-7D groundwater is not solelydefined by substrate self-inhibition. Additional factors such as substrate interaction and groundwatermatrix toxicity are involved. One objective of this section is to quantify the interactions among phenol,thiocyanate, and nitrification, and to assess the groundwater matrix effects on the aerobicbiodegradation of the target substrates. Another objective is to determine the concentration ofindigenous microorganisms in an aquifer soil sample capable of biodegrading the target substrates.
5.2 Phenol Biodegradation Kinetics
Of the three evaluated substrates, the biokinetic evaluation of phenol biodegradation was the moststraightforward. Besides being a self-inhibitory substrate (Figure 5-1), phenol is reported to be weaklyinhibited by thiocyanate. The aerobic biodegradation of phenol was insensitive to the presence ofgroundwater from monitoring well MW-7D, in that groundwater dilutions of up to 2:1 (MW-13S:MW-7D)had little impact on phenol removal beyond those impacts predicted by phenol self-inhibition. Theaerobic biodegradation of phenol is a rapid and robust process at MW13S:MW-7D dilutions of 2:1 orgreater. If phenol was just subject to self-inhibition, then its removal should have occurred in theundiluted MW-7D groundwater (Table 5.1). Because there was no observed phenol removal in theIIILT-4 (undiluted) batch test (Figure 5-2), this suggests that the MW-7D groundwater is inhibitory tophenol-degrading bacteria at some concentration greater than a 2:1 dilution.
5.3 Thiocyanate Biodegradation Kinetics
The aerobic biodegradation of thiocyanate results in the release of ammonia nitrogen. As with phenol,the complete removal of thiocyanate was observed in all Phase III batch tests containing MW-7Dgroundwater, except during the IIILT-4 batch test which contained undiluted MW-7D groundwater.Figure 5-3 illustrates that the calibrated mechanistic model is able to predict the thiocyanate decaycurve at low concentrations of MW-7D groundwater. However, Figure 5-4 suggests that, at MW-7Dgroundwater dilutions of 3:1 (MW-13S:MW-7D) and greater, thiocyanate is being removed at ratesslower than expected based on Haldane kinetics. This observation suggests that additional factors,
P \pro]«cts\waukeganUreatstb chg
FLUOR DANIEL GTI

Treadability Study to Evaluate Aerobic Bioremediatkxi of Contaminated Site Groundwater 20Waukegan Manufactured Gas and Coke Plant Site, Waukegan. Illinois______________________April 29,1996
such as groundwater matrix inhibition, is responsible for the slower than expected rates of thiocyanateremoval at the higher concentrations of MW-7D groundwater.
5.4 Ammonia Biodegradation Kinetics
The oxidation of ammonia to nitrite by Nitrosomonas was adversely influenced by several mechanismsduring the Phase III batch tests. These mechanisms may include the following:
1. Self-inhibition, although the self-inhibitory effect is weak until ammonia concentrations are wellabove 1000 mg N/L.
2. Reversible inhibition of nitrification by phenol, which acts as a strong non-competitive inhibitor.Once the phenol is removed by heterotrophic activity, nitrification appears to occur at itsuninhibited rate.
3. Accelerated loss of active Nitrosomonas biomass when phenol and thiocyanate are presenttogether.
4. Accelerated loss of active Nitrosomonas biomass upon initial exposure to all dilutions ofWMGCP Site groundwater obtained from monitoring well MW-7D.
Because of these inhibitory and toxic interactions, the modeling of nitrification in the WMGCP Sitegroundwater requires the simultaneous tracking of ammonia, phenol, and thiocyanate concentrations.
To account for variations in toxicity among the different dilutions of MW-7D groundwater, a matrix timefactor was determined. The concept is that an unknown toxic agent in the MW-7D groundwater exertsits toxic effect for a length of time called the matrix time factor. The matrix time factor depends on theMW-7D groundwater concentration and the length of time the MW-7D groundwater had been subjectedto aerobic treatment prior to inoculation with Nitrosomonas. As illustrated in Figure 5-5, higher MW-7Dgroundwater concentrations increased the matrix time factor, while longer periods of aerobic treatmentprior to inoculation with Nitrosomonas reduced the matrix time factor. The latter observationdemonstrates that the initial toxicity of the MW-7D groundwater to Nitrosomonas can be reduced byaerobic treatment.
The Phase III studies were able to define a constant first-order biomass loss rate coefficient (bN) for thevarious environmental conditions at which the batch tests were run. A detailed description of how thevarious bN values were determined is presented in Appendix C. As provided in Table 5.2, the value ofbN for active Nitrosomonas biomass varied from 0.1 to 2.42 1/day depending on environmentalconditions. The largest bN value corresponds to a 50 percent reduction in active Nitrosomonas biomassconcentration every 7.2 hours, a condition corresponding to the presence of phenol and thiocyanate inany concentration of untreated MW-7D groundwater.
P Vprot«cts\waukeganU/e4tstb chg
FLUOR DANIEL GTI
o

Treatability Study to Evaluate Aerobic Bkxemediation of Contaminated Site Groundwater 21Waukegan Manufactured Gas and Coke Plant Site. Waukegan. Illinois________________________April 29, 1998
The relative impacts of the various inhibitory and toxic effects on ammonia decay curves are illustratedin Figure 5-6. The four plotted ammonia decay curves were generated by the mechanistic model basedon the initial substrate and biomass concentrations for the IIIST-6 (19:1 dilution) batch test. Completeammonia removal occurred within 56 days during the IIIST-6 batch test. The model indicated thatcomplete ammonia removal would require 8 days based solely on Haldane kinetics. When theinhibition of nitrification by phenol was added to the model, complete removal required 9 days. The timerequired for complete ammonia removal increased to 15 days when the model considered Haldanekinetics, inhibition by phenol, and the phenol/thiocyanate toxic effect. When a matrix time factor of 18days was added to the model, the time required for complete ammonia removal jumped to 55 days.Thus, these simulations of a batch test containing a 19:1 dilution of MW-7D groundwater indicate thatthe most important factor in determining the time requirements for ammonia removal is the toxicity ofthe MW-7D groundwater toward Nitrosomonas.
In summary, the Phase III batch test results suggest that nitrification is sensitive to several factorsrelated to the WMGCP Site groundwater. These factors include phenol inhibition, the loss of activebiomass when phenol and thiocyanate are present together, and the toxicity of the MW-7D groundwatertoward Nitrosomonas. Of these factors, the modeling results suggest that the undefined toxicity of thegroundwater is the most limiting. Aerobic treatment of the groundwater may be required to protectunacclimated indigenous populations of Nitrosomonas during the bioremediation of the aquifer.
5.5 Indigenous Microorganisms
The IIILT-5 (5:1 dilution MW-13S:MW-7D) batch test was initially inoculated with 100 grams of aquifersoil obtained from the WMGCP Site near the water table. Complete phenol removal occurredsometime within the first 13 days of the batch test. Thiocyanate removal required about 41 days. Nonitrification was observed. The thiocyanate decay curve allows the back calculation of the thiocyanatebiomass concentrations associated with soil inoculum. The rapid removal of the phenol and the 2weeks between sampling points precludes the back calculation of the initial concentration of phenol-degrading microorganisms. Instead, the mechanistic model was used to determine if the rapid removalof phenol could be due to biomass concentrations typically associated with sandy aquifer materials.The reported range of total bacterial cells associated with natural groundwater environments is from105 to 107 cells per gram of dry soil.
Development of a predicted phenol decay curve for the IIILT-5 (5:1 dilution) batch test assumes that the100 grams of aquifer sand contained 10* CPU/gram of phenol-degrading bacteria. This assumed soilinoculum corresponds to an initial phenol-degrading biomass concentration of 1.7-103 CFU/mL in the 6-liter batch reactor. Figure 5-7 indicates that this initial concentration of phenol-degradingmicroorganisms can account for the observed disappearance of phenol within 13 days of inoculation.
Atrial-and-error approach was taken to calculate the initial population of thiocyanate-degradingmicroorganisms that were associated with the 100 gram of soil inoculum. As shown in Figure 5-7, an
P \pfoj«cts\waukegan\t/eatstb chg
FlUOR DANIEL GTI

Treatability Study to Evaluate Aerobic BJoremediatton of Contaminated Site Groundwater 22Waukegan Manufactured Gas and Coke Plant Site, Waukegan, Illinois________________________April 29,1996
initial water-phase concentration of thiocyanate-degraders equal to 5-102 CFU/mL allowed themechanistic model to describe the observed thiocyanate decay curve. This water-phase concentrationcorresponds to a soil concentration of 3«1O4 CFU/gram soil.
In summary, the observed removal of phenol from the HILT-5 (5:1 dilution) batch test within 13 days ofinoculation with soil can be accomplished when the inoculum is assumed to contain a number ofbacterial cells typically found in groundwater soils. The observed thiocyanate decay curve can bedescribed by the model when the soil is assumed to contain 3-104 CFU/gram soil. The two sets ofcalculations suggest that a good number of indigenous microorganisms that are capable ofbiodegrading phenol and thiocyanate are associated with the sandy WMGCP aquifer near the watertable.
5.6 Conclusions
In conclusion, the biokinetic evaluation of the Phase III batch tests suggests that contaminants ofconcern in the WMGCP aquifer (i.e., phenol, thiocyanate, and ammonia) are biodegradable underaerobic conditions provided that sufficient dilution of the MW-7D groundwater is achieved to preventcomplete inhibition of the respective microorganisms. The Phase III batch tests did not determine themaximal concentration of MW-7D groundwater that can support the biodegradation of phenol andthiocyanate, but the phenol and thiocyanate were completely removed from a 2:1 dilution (MW-13S:MW-7D) of MW-7D groundwater within 90 days. Nitrification was more sensitive to the adverseeffects associated with the groundwater matrix than was the biodegradation of phenol and thiocyanate,but prior aerobic treatment of the groundwater appeared to reduce the intensity of the adverse effect.As with the biological treatment of coal gasification waste waters, the aerobic biological treatment of theWMGCP groundwater appears possible provided that the various chemical and biological interactionsare considered in process design and operation.
6.0 TREATABILITY TEST SUMMARY AND CONCLUSIONS
The three primary parameters that were monitored in the treatability study were ammonia, phenol, andthiocyanate. In addition, several other constituents and several general groundwater parameters werealso monitored. These included cyanide, arsenic, BTEX, alkalinity, TKN (Total Kjeldahl Nitrogen),BODS (five day biological oxygen demand), COD (chemical oxygen demand), DOC (Dissolved OrganicCarbon), iron, phosphorous, nitrate, nitrite, and pH. The following summarizes the results for theprimary constituents, the minor constituents, and the general groundwater parameters.
6.1 Phenol Degradation
Phenol degradation was observed in virtually all studies (Phases I through III) except the one usingundiluted deep Site groundwater (MW-7D). The undiluted deep groundwater was devoid of biological
P \proiects\waukegan\t/eatstb chg
FLUOR DANIEL CTI

Treatability Study to Evaluate Aerobic Btoremediation of Contaminated Site Groundwater 23Waukegan Manufactured Gas and Coke Plant Site. Waukegan, Illinois_______________________April 29,1998
activity. Phenol degradation was also observed in the experiment using Site soil as an inoculum,indicating the viable phenol degraders are present on Site.
Phenol degradation was rapid and complete at 2:1 dilution (MW-13S:MW-7D) and greater dilutions ofMW-7D groundwater. Within the accuracy of measurement, there was no difference in phenoldegradation in deionized water versus Site groundwater. It was the first primary constituent removed.Its degradation did not appear to be affected by the presence of other constituents or by thegroundwater matrix. Once sufficient dilution was applied, phenol degradation occurred at the samerate for all experimental conditions. The time observed was generally a function of the samplinginterval. The phenol degraded within the first sampling period. For the HIST (short term) experiments,which had a short (2 day) sampling interval, phenol degradation occured between day 4 and day 6.For the MILT (long term) experiments, which had a 14 day sampling interval, phenol degradationoccured between day 0 and day 14.
The aerobic biodegradation of phenol is a rapid and robust process up to MW13S:MW-7D dilutions of2:1. Besides being a self-inhibitory substrate (Figure 5-1), phenol is reported to be weakly inhibited bythiocyanate. The aerobic biodegradation of phenol was insensitive to the presence of groundwater frommonitoring well MW-7D, in that groundwater dilutions of up to 2:1 (MW-13S:MW-7D) had little impacton phenol removal beyond those impacts predicted by phenol self-inhibition.
The key conclusions are:
1. No phenol degradation occurs in undiluted deep groundwater sample (i.e. 100% MW-7D).2. Phenol degradation is consistently observed at 2:1 dilutions or greater of MW-13S: MW-7D).3. Site soil contained phenol degraders.4. Phenol degradation rates were quantitatively consistent with literature values at all successful
dilutions.
6.2 Thiocyanate Degradation
Thiocyanate degradation was also observed in virtually all studies except undiluted deep Sitegroundwater (MW-7D). The undiluted deep groundwater was devoid of biological activity. Thiocyanatewas not added in the Phase I studies and was not monitored in the Phase II studies. In Phase III studiesat dilution levels of 3:1 (MW-13S:MW-7D) or greater, thiocyanate degradation was observed. Alsothiocyanate degradation was observed in the Phase III experiment using Site soil as an inoculum,indicating that viable thiocyanate degraders are present on Site.
In the Phase III experiments where all three primary constituents were present, thiocyanate was thesecond constituent to degrade completely. It degraded slower than phenol, but faster than ammonia.The rate of thiocyanate degradation in Site groundwater was a function of dilution level. Generally the
P Vpfojec1s\waukegan\treatstb chg
FLUOR DANIEL GTI

Treatability Study to Evaluate Aerobic Bioremediation of Contaminated Site Groundwater 24Waukegan Manufactured Gas and Coke Plant Site, Waukegan. Illinois_______________________April 29.1998
more concentrated the Site groundwater the slower the rate of thiocyanate degradation. The time forcomplete removal varied from 51 days for a 3:1 dilution to 9 days for a 19:1 dilution.
The aerobic biodegradation of thiocyanate results in the release of ammonia nitrogen. As with phenol,the complete removal of thiocyanate was observed in all Phase III batch tests that contained less than33% MW-7D groundwater (2:1 MW13S:MW7D). Thiocyanate was removed at rates slower thanexpected based on Haldane kinetics. This observation suggests that additional factors, such asgroundwater matrix inhibition, is responsible for the slower than expected rates of thiocyanate removalat the higher concentrations of MW-7D groundwater.
The key conclusions are:
1. No thiocyanate degradation was observed in undiluted deep groundwater sample (i.e. 100%MW-7D).
2. Thiocyanate degradation was observed at 2:1 dilution MW-7D groundwater (2 parts MW-13S: 1part MW-7D) or more diluted.
3. Thiocyanate degradation rates were quantitatively consistent with literature values at allsuccessful dilutions greater than a 2:1 ratio of MW13S:MW7D. At less dilution, thiocyanatedegradation rates were reduced.
4. Ammonia-nitrogen is a thiocyanate degradation product (i.e., thiocyanate degradation releasesammonia-nitrogen). Thus, the oxidation of thiocyanate can increase the ammoniaconcentration.
6.3 Ammonia Degradation
Ammonia degradation, even in Dl water was quite complex. It was markedly inhibited by phenol and bythe combination of phenol and thiocyanate. Phenol, by itself, had a moderate inhibitory affect on thetime required for complete ammonia removal - 20 days for NH3 removal in the presence of phenolversus 11 to 13 days for pure ammonia. Thiocyanate, by itself, may have had a slight inhibitory affecton ammonia degradation -15 days for NH3 removal in the presence of thiocyanate versus 11 to 13days for pure ammonia. The combination of phenol and thiocyanate had the greatest inhibitory effect -34 days for NH3 removal in the presence of phenol and thiocyanate versus 11 to 13 days for pureammonia.
Ammonia degradation studies using Site groundwater were complicated by the observation thatbiological activity in the Site groundwater could result in an increase in ammonia due to the conversionof thiocyanate and/or other nitrogen containing species present in Site groundwater to ammonia. Thus,the fate of ammonia requires tracking of thiocyanate.
The Site groundwater studies of ammonia degradation had two primary variables - the level of dilutionand the number of inoculations. In general, the lag time associated with ammonia degradation
P:\pfojects\waukegan\treatstb chfl
FLUOR DANIEL GTI

Treatability Study to Evaluate Aerobic Btoremediatkxi of Contaminated Site Groundwater 25Waukegan Manufactured Gas and Coke Rant Site. Waukegan, Illinois________________________April 29,1998
decreased with increasing dilution and with a greater number of inoculations. With only 1 inoculation,only the 19:1 and 9:1 dilutions evidenced ammonia degradation. The 9:1 dilution requiredapproximately 3 times as much time as the 19:1 dilution for complete ammonia removal (158 daysversus 50 days).
The oxidation of ammonia to nitrite by Nitrosomonas was adversely influenced by several mechanismsduring the Phase III batch tests. These mechanisms may include self-inhibition, reversible inhibition ofnitrification by phenol, accelerated loss of active Nitrosomonas biomass when phenol and thiocyanateare present together, and accelerated loss of active Nitrosomonas biomass upon initial exposure to alldilutions of groundwater from monitoring well MW-7D.
The key conclusions were:
1. No ammonia-nitrogen conversion occurred in undiluted deep groundwater sample (i.e. 100%MW-7D).
2. Phenol was moderately inhibitory to ammonia-nitrogen conversion.3. Thiocyanate was weakly inhibitory to ammonia-nitrogen conversion.4. Phenol and thiocyanate were synergistically inhibitory to ammonia-nitrogen conversion.
Inhibition could be represented as ammonia degrader (nitrifiers) biomass loss.5. Ammonia-nitrogen conversion was dependent on two variables: 1) dilution of MW-7D
groundwater, and 2) pre-treatment time before ammonia conversion takes place.6. Ammonia conversion rates, when successful, were quantitatively consistent with literature
values.7. Ammonia-nitrogen is a thiocyanate degradation product (i.e., thiocyanate degradation releases
ammonia-nitrogen). The oxidation of thiocyanate can increase the apparent ammoniaconcentration.
6.4 Other Parameters
A number of other constituents and several general groundwater parameters were also monitored.These included cyanide, arsenic, BTEX, alkalinity, TKN (Total Kjeldahl Nitrogen), BOD5 (five daybiological oxygen demand), COD (chemical oxygen demand), DOC (Dissolved Organic Carbon), iron,phosphorous, nitrate, nitrite, and pH.
When oxidation occurred, there were observable changes in some of these parameters. Generally,during biodegradation, all reduced nitrogen species decreased, COD and BOD decreased, and DOwas consumed. Nitrate and nitrite increased in response to ammonia oxidation. There were nodiscernable changes in arsenic, iron, or cyanide levels during the studies. BTEX degraded completelyduring the studies. The pH dropped while oxidation occurred and was adjusted with base to remainbetween 7.0 and 8.0.
P \projects\waukaganUjeatstb chg
FLUOR DANIEL GTI

Treatability Study to Evaluate Aerobic Bkxemediation of Contaminated Site Groundwater 26Waukegan Manufactured Gas and Coke Plant Site, Waukegan. Illinois______________________April 29.1998
6.5 Groundwater Matrix Effect
There appeared to be a non-specific matrix inhibition caused by the Site groundwater. Higherconcentrations of MW-7D groundwater caused longer delays in the onset of ammonia conversion. Thismatrix inhibition was independent of the concentrations of major constituents.
The concept is that an unknown toxic agent in the MW-7D groundwater exerts its toxic effect for alength of time called the matrix time factor. The matrix time factor depends on the MW-7Dgroundwater concentration and the length of time the MW-7D groundwater had been subjected toaerobic treatment prior to inoculation with Nitrosomonas. Higher groundwater concentrations increasedthe matrix time factor, while longer periods of aerobic treatment prior to inoculation with Nitrosomonasreduced the matrix time factor. The latter observation demonstrates that the initial toxicrty of the MW-7D groundwater to Nitrosomonas can be reduced by aerobic treatment.
6.6 Summary
In summary, the results of the laboratory treatsbility study support the conclusion that aerobicbiodegradation of phenol and thiocyanate is feasible at this Site. The results for ammonia suggest thatnitrification also is possible, as long as nitrifying bacteria are present when toxicity from phenol,thiocyanate, and matrix components is relieved by a combination of biodegradation and dilution.
P \projects\waukeganUreatstb chg
FLUOR DANIEL GTI

FIGURES
P \projects\wauKeganUreatstb chg
FLUOR DANIEL GTI

(0e/>o
OE
Figure 2-1 Ammonia DegradationPhase), 10 Days
B Undiluted• 3:1 OilD10:1 Oil
10E4 10E5 10E6 Control
Inoculum Level, CFU/ml
FLUOR DANIEL GTI

(/)W
10080
3 eo5 40§ 20*• o
Figure 2-2 Phenol DegradationPhase I, 3 Days
• Undiluted• 3:1 OilD10:1 Oil
10E4 10E5 10E6 Control
Inoculum Level, CFU/ml
FLUOR DANIEL OTI

Figure 2-3 Nitrite & Nitrate ProductionPhase I, 10 Days
COO 150<* O) 100c^ •O
10E4 10E5 10E6 Control
Inoculum Level, CFU/ml
Undiluted3:1 Dll10:1 Oil
FLUOR DANIEL OTI

Figure 4-1 Days Required for Complete NH3 RemovalPhase in - D Water
Ammonia IIIST-1 Ammonia IIIST-7 Ammonia, Phenol Ammonia, SCN IIIST-8 Anrnonia, Phenol, Ammonia, Phenol,IIIST-2 SCN IIIST-3 SCN - Respiked IUST-
3D
FLUOR DANIEL GTI

Figure 4-2 Days Required for Complete SCN Removal
Phase III - Dl Water
Ammonia, SCN IIIST-8 Ammonia, Phenol, SCNIIIST-3
Ammonia, Phenol, SCN -Respiked IIIST-3D
FLUOR DANIEL GTI

Figure 4-3 Days required for complete phenol removalPhase III-Dl Water
Ammonia, Phenol IIIST-2 Ammonia, Phenol, SCN HIST- Ammonia, Phenol, SCN -3 Respiked IIIST-3D
FLUOR DANIEL GTI

180
Figure 4-4 Days Required for Complete NH3 RemovalPhase III -Site Groundwater
19:1 Ratio 9:1 Ratio 9:1 Ratio 9:1 Ratio 9:1 Ratio 5:1 Ratio 3:1 Ratio 2:1 RatioMW-13S: 1 Inoc 2 Inoc 2 Inoc 2 Inoc 3 inoc 3 Inoc 3 Inoc
MW-7D 1 IIILT-6n IIILT-6I IIIST-Si (Post IIILT-2ii HILT-1 ii IIILT-3HInoc MIST- Reinoc)
6 IIIST-Si
FLUOR DANIEL GTI

Figure 4-5 Days for Complete Phenol RemovalSite Ground water
19:1 Ratio 9:1 Ratio 9:1 Ratio 5:1 Ratio 3:1 Ratio 3:1 Ratio 2:1 RatioMW-13S: 1 Inoc 2 Inoc 3 inoc 1 Inoc 3 Inoc 3 InocMW-7D IIIST-5n IIIST-Si IIILT-2ii IIIST-4 IIILT-1ii IIILT-3ii
1 InocMIST-6
FLUOR DANIEL GTI

Figure 4-6 Days Required for Complete SCN RemovalSite Groundwater
19:1 Ratio 9:1 Ratio 9:1 Ratio 5:1 Ratio 3:1 Ratio 3:1 Ratio 2:1 RatioMW-13S: 1 Inoc 2 Inoc 3 inoc 1 Inoc 3 Inoc 3 InocMW-7D IIIST-5n IIILT-Gi IIILT-2ii IIIST-4 IIILT-li IIILT-3ii1 InocIIIST-6
FLUOR DANIEL GTI

Figure 4-7 IIILT-1 3:1 MW-13S:MW-7D
1000
900
800
QLQ.
» Ammonia— •> - Phenol- -B- - Thiocyanate
A Nitrite & Nitrate
Date
FLUOR DANIEL GTI

ifvi
£ "3
t,.o
8-
6-
4-
2-
0-
/"XS \ ' _I . ^"""""T"^"" *""""**' ' N \/' / 'X / \ \/f * ^^ N.
V
-l.UU
-0.80
-0.60
-0.40
-0.20
-0.00
e0)15•nS;•-£z5i_ '-<c ^ — •eZ w
33«3 W
(V I" ••• • ™*s?fae Z0^
siO w<Uacc
• Phenol
- SCN
_ NH3-N
10 100 1000Substrate Concentration (mg/L)
Figure 5-1. Comparison of specific growth rates as a function of substrate concentration.
FLUOR DANIEL CTI

§11•4-1e0)uoUQ2•*•»SC
sc/2
3000- B
_ m • • ^II • • " •
2000-.
1500--
lOOOy
A •
O ° oo °» O O °
, A A A * AA4 o A500-j A
ol 1 A A
I NH3-N (observed)
O Phenol (observed)
A Thiocyanate (observed)
0 20 40 60 80 100 120 140
Elapsed Time (days)
Figure 5-2. Observed decay curves for ammonia nitrogen, phenol, and thiocyanate duringthe HILT-4 (0:1 MW-13S:MW-7D) batch test The arrow represents the reinoculationof the batch test reactor with Nitrosomonas and heterotrophic microorganisms onday 85.
F1UOR DANIEL GTI

x— sM| i/inEIT 12°"o| 100-
| 80-
| 60|
2 40~•4-1
•f 20-
0C
——————————————————————— • ————————————— - —————————
M^B ••
-^ " ^ ^"
' ' " \
\• \5
k ib , 4A-^. , . , . , *
I 10 20 30 40 50 6(D
PrpriirtpH MH -NI It'Mlt'lt'U illlo li
"~ "" "" (1-107 CFU/mL)
Predicted Phenol' (5- 105 CFU/mL)
Predicted SCN" "~ (4'IG5 CFU/mL)
m NH3-N (observed)
O Phenol (observed)
A SCN (observed)
Elapsed Time (days)
Figure 5-3. Comparison of the predicted and observed decay curves for ammonia nitrogen,phenol, and thiocyanate during the IIIST-6 (19:1 MW-13S:MW-7D) batch test Theammonia decay curve assumes a matrix time factor of 18 days and includes thephenol/thiocyanate toxic effect
FLUOR DANIEL GTI

o
4)W
I
05C03
1000
800 \\ •
0-*-
O
A
predicted 0:1
predicted 2:1
predicted 3:1
observed 0:1
observed 2:1
observed 3:1
40 60 80 100 120
Elapsed Time (days)
Figure 5-4. Comparison of the predicted and observed thiocyanate decay curves as afunction of the MW-13S to MW-7D dilution ratio. The two outlier "0:1" data points atdays 105 and 132 are not plotted (they are plotted in Figure 5-2).
FLUOR DANIEL GTI

"V':
Figure 5-5. Matrix time factors as a function of MW-13S to MW-7D dilution ratio and thelength of aerobic treatment prior to the addition of an unacclimated Nitrosomonasinoculum.
FLUOR DANIEL GTI

o
\
I20
i30
i40
i50
Elapsed Time (days)
NH3 Alone
Phenol Inhibition
Phenol/ThiocyanateToxicity
18-day matrixtime factor
60
Figure 5-6. Ammonia decay curves predicted as a function of the inhibitory and toxicprocesses included in the model. Note that each plotted line also includes themechanisms located above its name in the legend. The concentration increase betweendays 6 and 12 is from the release of ammonia during thiocyanate biodegradtion.
FLUOR DANIEL GTI

600
£JO'•S2<uoo
1•*-*C^
3CO
500: - •_ • •
400-T ".
300-•
200-f
100--
0-
- -m— v.f^
\--O,— ,_, L _ A , . i , , A , . *|XX, | . p 1 f- 1 | ^ , . -f . , .
Predicted Phenol(U'K^CFU/mL)
Predicted SCN"" "" ~" (5.0« 1 02 CFU/mL)
B NH3-N (observed)
O Phenol (observed)
A SCN (observed)
0 10 20 30 40 50 60 70 80 90
Elapsed Time (days)
Figure 5-7. Comparison of the predicted and observed decay curves for phenol andthiocyanate during the IHLT-5 (5:1 MW-13S:MW-7D) batch test that was inoculatedwith 100 grams of aquifer soil.
FlUOR DANIEL GTI

TABLES
P \pfOJ«cts\waukeganUr»atstb chg
FLUOR DANIEL GTI
o

Table 2.1.Waukegan Phase I Groundwater Analytical Results (mg/L)
Phenol 480 <0.01
Ammonia 620 3.4
Total Arsenic 20 0.18
Dissolved Arsenic 19 0.15
Nitrate Nitrogen <5.0 0.06
Nitrite Nitrogen <5.0 <0.05
Cyanide <0.04 7.2
Creosol 446 <0.01
Benzene 0.66 <0.0005
Dissolved Oxygen 3.5 4.2
PH 8.8 7.2
1 The detection limit is used where the parameter is reported as not detected.
FLUOR DANIEL GTI

TABLE 2.2Waukegan Phase I Analytical Results in mg/LDeionized Water Spiked with Ammonia/Phenol
Undilutedi»he(!io£: IIift|Anii illl|llloxidizing culture
•;::th<x:ul«M*ii£S*:ffi?s:;:•:^m^immm:
104*
105'
106
105*poisoncontrol
|l||(ii|iii||| I
NH3
phenol
NO3
NO2
NH3
phenol
NO3
NO2
NH3
phenol
N03
NO2
NH3
phenol
NO3
NO2
: ;:i:; :;: : x;S;; |$|:;::: :j: :i:i: vtXxX-! •'. :••.•;-;•:•;•:¥:!:•:•:•;¥:•: •:-:-:-:'>:-:::->:-::: :
i:i:j:j:i:i:i:j: ^
1220
750
ND
ND
1220
750
ND
ND
1220
750
ND
ND
1220
750
ND
ND
•:•:•:•:•:•:•:':•:•:•: fjtSt\f- i-i't : •;-: • '-:• : •' •' •;-:•:-yfiJffi-'&M&ff??. jf: •:•:• *;•;•;: i •: •'• | : •: • :! : • : • iS^SS i iijt SJIS1: ^v:v:v:!::£W&9#£ff4K9fy SSiSivi
:':'>:::-:-:':':::'>:':::::::;x:::x:x;::x:::--> x-x-x-x-:^-t-mOX'KfW'I-K'XjXvHvX-X -XvXvX-
:::::::::::::::';::::::':-:'x -x-x-x ox-x-x • :• : • :• :• :• :':•:• '-:-:•:-:•:•>:•:-:•:•:•:-:•:;:•:;: ;>X; x ; XyX; x ; : ; : ; x • x-.- • •
976
875
0.09
0.03
976
750
ND
0.1
976
750
ND
0.27
1070
750
ND
ND
' i-:-: : :-:ii"'-::: :-:::-: :::yx' x::::::::::
mil;; ;*i«;:;«plsiss111
1220
750
ND
0.07
1220
750
ND
0.07
927
500
4.4
0.1
1220
750
ND
ND
mmi;EfcFfi&®®i®K
1025
750
ND
0.07
1074
625
4.4
0.1
1025
500
8.8
0.07
1220
750
ND
ND
976
800
ND
0.07
780
640
8.8
0.07
586
580
8.8
ND
1220
840
ND
ND
976
880
4.4
0.03
780
560
8.8
0.03
732
480
8.8
0.03
927
1200
ND
NDND = Not DetectedNumber indicates the concentration of colony-forming units/ml of commercial phenol and ammonia-oxidizing cultures in each bottle
FLUOR DANIEL GTI

TABLE 2. 3Waukegan Phase I Analytical Results in mg/LDeionized Water Spiked with Ammonia/Phenol
3:1 Dilution Simulation; ifiiii|ii|||lll|||Amrnonlaiojiltiiilng:;:< ulrijjiii: iijni:ill!«ii; i?!J;|iiilllB104*
105*
106
105*poisoncontrol
NH3
phenol
NO3
NO2
NH3
phenol
NO3
NO2
NH3
phenol
NO3
NO2
NH3
phenol
NO3
NO2
iiiiiiiii
366
250
ND
ND
366
250
ND
ND
366
250
ND
ND
366
250
ND
ND
Illlllll
.•;•:•:•:•:': •:•:•:•:':•:•:•:•:•:• :•:•:•:•:•:•:•:•:•:•:•:•:•:-:-:•:•:•; ;:•:•;•:•;•:• X'»> :•:•:•: v :•:-;•:.:•:•:•:•;-:
366
250
ND
0.03
366
250
ND
0.13
293
30
ND
0.03
366
275
ND
ND
liSalilli•:•;•:•:•:•:• L-ivx^.w x-x*M-x-x-x;?83&£g$li;l?|;s|;;|g|;:;:;|;;||
?: - :? :$:?:i:?:?s ?K":£:£££:££ : :£:££ :£:
342
190
ND
0.1
342
180
ND
0.1
293
ND
4.4
0.1
342
250
ND
ND
H342
275
ND
0.07
317
ND
4.4
0.07
268
ND
4.4
ND
366
300
ND
ND
244
5
ND
0.07
244
ND
ND
0.07
244
ND
8.8
0.07
366
225
ND
ND
244
ND
8.8
0.03
232
ND
8.8
0.03
146
ND
8.8
0.03
342
380
ND
NDND = Not Detected* Number indicates the concentration of colony-forming units/ml of commercial phenol and ammonia-oxidizing cultures ineach bottle
FLUOR DANIEL OTI

TABLE 2.4Waukegan Phase I Analytical Results in mg/LDeionized Water Spiked with Ammonia/Phenol
10:1 Dilution Simulation
Ainmtmla- oxidizingcSiiiitiiiiii!
104 NH
phenol
NO3
N0
305 244 244 183
80
<4.4 <4.4 <4.4 <4.4
<0.03 0.03 0.17 0.83
183
22
7.3
183
ND
178
38
105 NH
phenol
NO
NO
305 244 244 183
80
<4.4 13.2 35.2 88
<0.03 0.83 16.7 29
183
96.8
35.8
183
ND
110
20
10s NH3
phenol
NO
NO
305 232 232 159
80
<4.4 154 163 176
<0.03 2.8 37.6 45
171
154
41.6
151
ND
154
33
105 *poisoncontrol
NH
phenol
NO
NO
305 256 256 220
80 75 75 75
<4.4 <4.4 <4.4 <4.4
<0.03 <0.03 <0.03 <0.03
220
75
<4.4
<0.03
183
75
ND
NDND = Not Detected* Number indicates the concentration of colony-forming units/ml of commercial phenol and ammonia-oxidizing cultures ineach bottleNote: Additional ammonia was added through a nutrient salt solution - contributing to the elevated T-0 ammonia spikebottle.
FLUOR DANIEL OTI

Table 3.1. Ammonia Results with Ion Selective Electrode.
MW-7D 3000 ND ND1:1 (MW-7D:13S) 1400 ND ND1:2(MW-7D:13S) 860 ND ND1:5(MW-7D:13S) 580 ND ND
ND= Not Detected
Table 3.2: Confirmation of Ammonia Degradation, Phase II.
____Ammonia, mg/L____
Inoculated 1951 49 37
Control 1951 127 1271. The initial analyses for ammonia by HACH kit was 195 mg/L. The solution was checked the next day; ammonia was 195 mg/L.
FLUOR DANIEL GTI

TABLE 3.3Waukegan Phase II Preliminary Results in (mg/L)
i^^miW^MB.-.-. ,:.-r .•.:.>...:•: :•:•: . :.: : : :; •: : ' :;::••;.;:••.;y:;':;x:;:;:;v::x-;::;::;: ;-:-::--:-:-: :V:':::::':;:': : : :
Full concentrationMW-7D
1:1MW-13S:MW-7D
2:1MW-13S:MW-7D
5:1MW-13S:MW-7D
:;i|Siiiii |||l|||||
'^^^imMSffiMSi:Vtmmm~mmmm
NHj
phenol
NO,
NO,
DO
NHj
phenol
NO,
NO,
DO
NH,
phenol
NO,
NO,
DO
NH3
phenol
NOS
NO2
DO
loxoi x^x^Vxv'-i'/ivSivfe^Xv/:-^Efcsi -ff^-^-^-^-^: • wf fl jT:;:|V;:; iS:'i; ;•:•:«:•:•: j:j:;:|:;i;x>
yjj^/m^^^mm.:3jW. .>x<*x:x-::::X;::xi::>:;X::::;x-:
488
1400
ND
ND
NA
244
800
ND
ND
NA
162
500
4.4
ND
NA
98
270
ND
ND
NA
:;. ^W.Jp;:;!W;:::; |;|;:x|;|;|;:;;x;;|;;:|;:;;
195
1400
ND
ND
NA
244
800
ND
0.13
NA
293
480
8.8
0.2
NA
293
200
ND
0.07
NA
Hivtlili 111-:•:•:•:•:•:-.•:*•:•:•:-:•;•:•:•:•:•:•:•:;'.•:; :•:•:•:•:•:•:•:
146
1400
ND
ND
5.1
244
720
18
0.13
2.0
205/195
440/480
18/18
0.13/0.13
0.7
210
44
13
ND
1.0
'$&&$?&&*& ffi&ff&$K&• f\ *ki*M:' F lOHvX'K-X-X'X'X'K-OSylmmmmmm•I'X'T'XvS-X'X'X-X-X^-X-X-X-M-M'WX
>'j -*i'*lj:::':':::'X':-:':-:-:-:-:"X':':'>: :-
156/151
1400/1320
ND/ND
ND/ND
5.4
200
680
31
ND
5.5
268
440
31
ND
5.5
254
2.1
8.8
ND
5.2
156
1400
ND
ND
8.9
224
600
44
ND
6.2
215
240
ND
ND
1.1
259/254
1.1/1
ND/ND
0.2A3.13
2.6
146
1400
ND
ND
5.9
205
600
1.1
ND
6.7
215
14
30
0.17
2.6
273/250
1 .0/1 .0
19/11
ND/ND
3.7
M* :>^ ^ wi§
146
1400
ND
ND
5.3
'205
600
13
ND
5.3
216
13
31
ND
0.1
254/244
2.0/2.0
31/22
ND/ND
4.0ND = Not DetectedNA = Not Analyzed
FLUOR DANIEL GTI

TABLE 3.4Waukegan Phase lib Results (mg/L)
l plMfiliiiiiiiiiii - -zzMmim
Ammonia(ERA350.1)
280(5x
Dilution)
270(5x)
360(4x)
500(4x)
320(5x)
Nitrate(ERA353.1)
<5(100x
Dilution)
<5(100x)
<5(100x)
<5(100x)
<5(100x)
Nitrite(ERA353.1)
<5(100x)
<5(100x)
<5(100x)
<5(100x)
<5(100x)
<5(100x)
<5(100x)
<5(100x)
<5(100x)
<5(100x)
<5&<5(100x)
<5(100x)
Phenol(ERA8270B)
<48ug/L
Ammonia(ERA350.1)
180(5x)
230(5x)
240(4x)
290(4x)
480(5x)
310(5x)
290(5x)
300(5x)
280(5x)
110(5x)
250 & 300(5x)
110(5x)
Nitrate(ERA353.1)
<0.05 2.7 5.3 3.7 6.6 5.2 5.1 3.8 9.4 32 27&30 29
Nitrite(ERA353.1)
20 23 26 30 27 28 30 31 28 <0.05 <0.05&<0.05
<0.05
Phenol(ERA8270B)
<57ug/I
FLUOR DANIEL GTI

Table 4.1Parameters and Analytical Methods for Sample Analysis
.•: : :•: : :•:•:•: :':•:. :•: : : :•:•: : : : : : : ' :-:•: : :•:•:•:•:•:•: :•:•:•: :•:•:•:•:•:':•:•:•:•:•:•:•:•: vXvX-XvXvXvX'X-x-X'X'Xv:: : : : • : :•••: :•: ••'•••:•.•:•:•: : :•: :•: : ':•::•: ' : : :•:•:• :-:-XvXvXvXv:- :•:•:•:•:•:•: •XvX-x-x-x-xox-x-x-x-x-x-X'xx x X X :-x-x-x : ' X ' x : ••••••x-'- ' '•'Piiu'tiiuiiiif jlj'' '•'•'•'•'•'•'•'•'•'•' ••••••• ••••••••v-x.'.'.-.'.-.-.-.v.-.v•xx.:.x x:.: :,:x : :.:x X : x.:-x : ::::: ParWTHSTO i KSSBiSJS^S IffiSB
AlkalinityAmmonia-NTotal Kjedahl NitrogenNrtrate-NNitrite-NPhenolics (4AAP)Phenolics (GC)BOD, 5 DayCODDOCBTEXPhosphoms-P, TotalCyanide, DistilledThiocyanateArsenic,Arsenic, DissolvedIron, TotalTotal Hardness
ERA 31 0.1ERA 350.2 (w/distillatton)ERA 351 .3 (w/distillation)ERA 353.2ERA 353.2ERA 420.2ERA 8040ERA 405.1ERA 41 0.4ERA 41 5.2ERA SW-846 8020 (MOD)ERA 365.1ERA 335.2SM 4500-CNMEPA200.7/SW6010EPA200.7/SW6010EPA200.7/SW6010ERA 130.1
i!W»rei;D«t idH::t»if|iK;i!i;:i::li;!;l:;;il:K;;:;:li;llll
15mg/L10mg/L10mg/L10mg/L10mg/L20mg/L5mg/L50mg/L20 mg/L5 mg/L1 mg/L
0.5 mg/L1 mg/L10 mg/L0.1 mg/L0.1 mg/L0.1 mg/L1 5 mg/L
XXXXX
X
XX
X
XXXXXXXXXXXXXXXXXX
XXXXX
X
XX
X
Notes: ' All sampling intervals.' Initial and final sampling points.5 Intermediate sampling points.
FLUOR DANIEL GTI

TABLE 4.2Phase III Short Term Study Set Up
mmmm nil 101
IIIST-1 0.0 0.0 6.0 300 3.3 26.7 5.0 0.86 60 Develop baselineammonia kinetics
IIIST-2 0.0 0.0 6.0 300 250 3.3 26.7 5.0 0.86 60 Verify effects of phenol onnitrification
IIIST-3 0.0 0.0 6.0 300 250 180 3.3 26.7 5.0 0.86 60 Verify effects of phenoland SCN on nitrification
IIIST-4 1.0 3.0 0.0 2.2 17.8 0.0 0.57 Verify effects of matrix onnitrification
IIIST-5 0.4 3.6 0.0 2.2 17.8 0.0 0.57 High dilution to determineIf nitrification is achievablewith Site groundwater
IIIST-6 0.2 3.8 0.0 2.2 17.8 0.0 0.57 40 Higher dilution todetermine if nitrification isachievable with Sitegroundwater
TotalVolume
1.6 104 18.0
FLUOR DANIEL GTI

Table 4.3Phase ill Short Term Test Extension
IIIST-1
IIIST-2
IIIST-3
IIIST-4
IIIST-Si
IIIST-5n
IIIST-6
IIIST-7
IIIST-8
None, Test Completed.
None, Test Completed.
None, Test Completed
Continue test, maintain pH and D.O.; periodic sampling.
Split IIIST-5 for re-inoculation test; twice-weekly sampling.
Split IIIST-5 for re-inoculation test; twice-weekly sampling.
Continue test, maintain pH and D.O.; sample weekly.
New test bottle. Ammonia degradation kinetics baseline; twice-weekly sampling.
New test bottle. Ammonia / thiocyanate kinetics baseline; twice weekly sampling.
FLUOR DANIEL GTI

Table 4.4Phase III Long Term Study Set Up
Water Volumes
Bottle ID 11IIILT-1 1.5L 4.5 L 3.3 26.7 0.0 0.0 0.86 60 Medium dilution
IIILT-2 1.0L 5.0 L 3.3 26.7 0.0 0.0 0.86 60 High dilution
IIILT-3 2.0 L 4.0 L 3.3 26.7 0.0 0.0 0.86 60 Low dilution
IIILT-4 6.0 L 0.0 L 3.3 26.7 0.0 0.0 0.86 60 Undiluted groundwater sample
IIILT-5 1.0L 5.0 L 3.3 26.7 0.0 100 gm 0.0 High dilution with Site soil inoculum
IIILT-6 0.6 L 5.4 L 3.3 26.7 0.0 0.0 0.86 60 Higher dilution to confirm biotreatment possiblewith Site groundwater
IIILT-7 1.5L 4.5 L 3.3 26.7 1.2* 0.0 0.0 Medium dilution poison control
Total Volume 13.6L 28.4 L
' 1 2 gm HgCI2 added again after six weeks
FLUOR DANIEL GTI

Table 4.5Phase III Long Term Modification Study
MM^HiHILT-11
HILT-2
HILT-31
HILT-41
IIILT-Si
IIILT-6)
IIILT-6n
HILT-7
HILT-8
IIILT-9J
HILT-10
IIIST-3D
^^^•i R^^^^^^^^^^^^^^^^^KRe-inoculateRe-inoculate
Re-inoculateRe-inoculateRe-inoculate with Site soilSplit test bottle contents, re-inoculateSplit test bottle contents, no inoculationNoneNew test bottle. Ammonia degradation kinetics baseline (300 mg/L); daily sampling.
Dilution of HILT-1 aliquot to 5% solution and re-inoculate
New test bottle. Ammonia degradation kinetics baseline at a higher ammonia cone.(700 mg/L); daily sampling.
New test bottle. Duplicate of IIIST-3 run previously. 300 mg/L NH,-N, 250 mg/Lphenol, and 180 mg/L thiocyanate.
e_iin
o£

Table 4.6Phase III Long Term Extension Study Set Up
mm r , ,mm® :-:•:-:-:•;-:*>:•>:-*•:•:•:•:•:
ILT-11 3.94 110 39III LT-2I 4.58 128 46
I LT-3I 4.58 128 46III LT-4i 4.54 127 45III LT-5i 4.54 227.4
ILT-6I 2.34 66 23ILT-6n 2.34
III LT-7 4.45 0.91ILT-« 6.00 6.00 168 60 3.325 26.705 2.52 6.892LT-9I 3.00 0.60 2.40 84 30 1.33 10.679LT-10 6.00 6.00 168 60 3.305 26.72 5.892 16.120
I ST-3D 6.00 6.00 168 3.308 26.722 2-53 6.882 1.511 1.523
FLUOR DANIEL GTI

Table 4.7Sampling and Analysis Protocol for Phase III Long Term Modification Study
lBflllMILT-11 Once/2 weeks 6 weeks TuMILT-21 Once/2 weeks 6 weeks Tu
MILT-31 Once/2 weeks 8 weeks Tu
IIILT i Once/2 weeks 8 weeks Tu
HILT-51 Once/2 weeks 8 weeks Tu
IIILT-6J Once/2 weeks 4 weeks TuIIILT-6n Once/2 weeks 6 weeks Tu
IIILT-7 Once/2 weeks 8 weeks Tu
IIILT-8 Daily 1 week Mo, We, SaIIILT-91 Once/2 weeks 4 weeks Mo, ThMILT-10 Daily l WOOK Mo, We, Sa
IIIST-4 Once/2 weeks 8 weeks TuIMST-3D Once/week 4 weeks Tu
FLUOR DANIEL GTI

Table 4.8Pure Compound, Dl Water Studies
MIST-1, 300 PPM NH, 10' 13
IIIST-7, 300PPMNH, 10" 11
IIILT-7, 300 PPM NH, 10'
IIILT-10, 600PPMNH, 10'
MIST-2, 300 PPM NH,, 250 PPM Phenol 10' 20
IIIST-8, 300 PPM NH,, 180 PPM SCN' 10' 12 30'
IIIST-3,300 PPM NH,, 250 PPM Phenol180 PPM SCN"
10" 34 16
IIIST-3D, 300 PPM NH,,250 PPM Phenol180PPMSCN-
(Respiked & Reinoculated ST-3)
10' 14
Notes: 1 Estimated Actual day to removal not known. Experiment terminated after NH, disappearance. SCN" concentration essentially unchanged during entire test.
FLUOR DANIEL GTI

Table 4.9Site Groundwater Studies
^jjJMSMIS^^K^^^^^^:
:;f«|::Ni;;;:;
12
3
4
5
6
7
8
9
10
11
12
13
;.:;;••:•.::•.::•: :xx ::: :«xlfm: • >-<:W:^f<-y-:-y-yWf:-:--mm >5:S™: i:.:.•; :;s;xsx ; s;s3:;s : ssx:s:::os;:;::SE;:;:;.s::.;;:;f; JSSBSI ;v ; .;:?Si '3 |£11 l|||||i||tl Hi \
MIST-6
IIILT-9I'
IIIST-5n!
IIIST-5i
IIILT-6n '
IIILT-6i
IIILT-5 (Soil Inoculum)
IIILT-2H
IIIST-4
IIILT-1 ii
IIILT-7(Killed Control)
IIILT-3ii
IIILT-4
•:-i-:':-:-:':::-:':-:-:-:-:'>;::;:::::-:::-:;:::-:-:::-:::':-:;:;:;::::::;::-x:::x::::
:XxX::£:;:;:;;::;:£:::;:::::£:;:;X;XxX£:;:;::;;:::::;:::::::x':';i;:•x^ x-iox-x^oi ^vw' ' ;'.':*:;:1:-:-:1:':-:-:':':-'
H12
1
2
1
2
2
3
1
3
2
3
2
I IWssiillllii piii:::::::::::::::r:T !T'.v::::::::::::::::::
75
2nd -35
2nd -75
2nd -75
2nd -753rd -105
2nd -753rt-107
2^-80
2^-753rt-105
2nd -75
Illiil! :
lllliPiiisll ! !llljvliAiPl i :::::::::::::;;::::x-:-x;x;:-:;Xv:':'>:-:' • :•:;:•:;:•:•:•:->:;:•:;:•:->:;:•:•:•>>::::>::":::: ;
19:1
19:1 Dilutedfrom 3:1
9:1
9:1
9:1
9:1
5:1
5:1
3:1
3:1
3:1
2:1
0:1
x:::::::::::::::::::::i :::::::::::::::::----:;:::::;:::::::;:::;:::::::::::;::;
56
3(78)'
NL4
52
158
80
NL4
115
NL4
148
NL 4
135
NL4
2
(14)"None Present after Dilution
to 5%
6
6
14*
14'
14'
14'
6
14'
NL4
14"
NL 4
10
(88)'None Present after Dilution
to 5%
23
23
27
27
45
45
38
88
NL4
51
NL'
Notes: 1 . IIIUT-1 (25% MW-7D) was diluted to give 5% MW-7D after 78 days run time.2 IIIST-5 was split into two bottles after 35 days. One of the splits was inoculated (IIIST-5i) and one was not (IHST-5n)3 The phenol and thiocyanate degradation times are those for IIILT-1. When IIILT-9i was setup there was no phenol or thiocyanate present.4 ' NL* Indicates that no degradation or loss was observed over the course of the study.5 IIIIT-6 was split into two bottles after 75 days. One of the splits was Inoculated (IIILT-6i) and one was not (IIIUT-6n)6 The 14 days is reprted because of sampling schedule. Phenol degradation was probably faster.
FLUOR DANIEL GTI

Table 4.10Nitrogen Balance
Pure Compound, Dl Water Studies
Initial Nitrogen
III ST-1 281 280 0.996
III ST-2 322 276 0.857
IST-3 404 323 0.800
I ST-3D 467 439 0.940
III ST-7 299 279 0.933
III ST-8 367 397 1.082
LT-8 409 273 0.667
LT-10 839 650 0.775
Note: Total Nitrogen = TKN-N + NO3-N + NO2-N + SCN-N(TKN-N includes Ammonia)
FLUOR DANIEL GTI
1349003\58221-1/LAH

Table 4.11Nitrogen Balance
Site Groundwater Studies
Initial Nitrogen
III ST-4 811 958 1.181
III ST-5a 391 380 0.972
I ST-5i 391 300 0.767
IST-6 201 179 0.891
778 909 1.168
III LT-2H 518 597 1.152
III LT-3ii 1,076 1,041 0.967
LT-4 3,164 3,341 1.056
LT-5i 613 735 1.199
LT-6n 315 437 1.387
ILT-6J 315 279 0.886
LT-7 810 1,097 1.354
LT-9i 156 122 0.782
Note: Total Nitrogen = TKN-N + NO3-N + NO2-N + SCN-N(TKN-N includes Ammonia)
1349003\5822I-1/LAH
F1UOR DANIEL GTI

Table 5.1. Comparison of the Smmx values for phenol, thiocyanate, and ammoniato their measured concentrations in the undiluted groundwater
obtained from monitoring well MW-7D.
Concentration in Undiluted MW-S^ 7D Groundwater*
Substrate (mg/L) (mg/L)
Phenol
Thiocyanate
Ammonia
6,800
2,200
42,300
980
720
2,690
* = initial substrate concentrations in the IIILT-4 batch test
FLUOR DANIEL GTI
o

Table 5.2. First-order biomass loss rate coefficients for activeNitrosomonas biomass (bN) as a function of environmental conditions.
Value of bN(1/day) Characteristic or When Used by Model
0.1 endogenous decay coefficient with no toxicity
0.62 biomass loss coefficient while the toxicity of the MW-7D groundwaterremains, but phenol and thiocyanate are not present
1.9 biomass loss coefficient that describes the toxic effect created whenphenol and thiocyanate are present together in solution, but no MW-7D groundwater is present
2.42 biomass loss coefficient while the toxicity of the MW-7D groundwaterremains, and when phenol and thiocyanate are present together insolution
FLUOR DANIEL GTI
o

APPENDIX A
PHASE III - BIODEGRADATION STUDY EXPERIMENTAL METHODS
P \pfojects\waukegan\Ueatstb chg
FlUOR DANIEL GTI

Appendix APhase III Biodegradation Study
Experimental Methods
Sample Receipt
Approximately 15 gallons of water from monitoring well MW-13S and 10 gallons of water from monitoringwell MW-7D were received by Fluor Daniel GTI, Remediation Technology Testing Facility, Trenton, NewJersey, in February, 1997. Waters from monitoring well MW-7D that were not used in the initial set up of thisstudy were frozen to ensure no loss of contaminants during storage. Waters from monitoring well MW-13Sthere were not used in the initial set up of this study were refrigerated for later use..
Initial Nitrifier Inocula Calibration Test
Because nitrifiers do not respond to routine plate count methods. Ammonia degradation rates were used toestimate the quantity of nitrifiers in the inoculum. The calibration protocol consisted of preparing a 500 mltest bottle containing 200 mg/L NH3> a phosphate buffer, sodium bicarbonate, and an estimated inoculasize of 107 CFU/mL of nitrifiers. A control bottle was prepared with all the chemicals described above butwhich received no nitrifier inoculum. Both bottles were sealed and dissolved oxygen was maintained above5 mg/L in both bottles for the duration of the test. The pH was adjusted and maintained between 7.0 and8.0 in both bottles by adding either 6N HCI or 10N NaOH. Ammonia (NH3), nitrate (N03"), and nitrite (N02")were analyzed after one and two days from both bottles using HACH test kits. The rate of ammonia losswas then used to estimate the quantity of nitrifiers in the inocula.
Initial Phase III Short Term Study Protocol
The six 20 L glass testing bottles used for this study are identified IIIST-1 through IIIST-6. Bottles IIIST-1 toIIIST-3 used deionized (Dl) water. Bottles IIIST-4 to IIIST-6 used Site groundwater. NaHCO3was added tothe Dl water bottles as an inorganic carbon source for nitrification. The pH was adjusted in all bottles tobetween 7.0 and 8.0 with either 6N HCI or 10N NaOH. All bottles were then buffered to a pH ofapproximately 8.0 using phosphate buffers. All bottles were inoculated to approximately 10* CFU/mL eachof heterotroph and nitrifier concentrations as determined in the inocula calibration test. The pH wasmaintained between 7.0 and 8.0 in all bottles at all times by adding either standardized 6N HCI or 10NNaOH (calibrated). All bottles were continuously stirred, and covered with aluminum foil for the duration ofthe test to avoid light penetration, photochemical oxidation, and photosynthesis.
The headspace of each bottle was periodically flushed with a stream of oxygen gas (1.2 liter/minute) for 15minutes and then sealed. Dissolved oxygen was maintained above 5 mg/L in all bottles at all times, byreplenishing the headspace of the bottle with oxygen as needed. The sampling interval was twice weeklyfor ammonia (NH3-N), thiocyanate (SCN), nitrate (NO3-N), nitrite (N02-N ), total Kjeldahl nitrogen (TKN),phenol, alkalinity, COD, and DOC. Thiocyanate and phenol analyses were conducted until theconcentrations were at or below detection limits. The pH and DO were monitored and recorded duringevery sampling interval. The volume extracted for each sampling event for each test bottle was measured
F1UOR DANIEL GTI
o

and recorded. All samples for chemical analysis were sent to CH2M Hill Analytical Services (Montgomery,Alabama).
Phase III Short-Term Test Extension Protocol
Several observations were made during the short term study. First, thiocyanate appeared to increase theinhibition of nitrification. Second, the short term study bottles using Site groundwater did not showappreciable ammonia removal at the end of 4 % weeks. As a result of these observations, the study wasextended in three ways. First, incubation of all the Site groundwater bottles was continued. Second, the 9:1(MW-13 to MW-7) dilution, IIIST-5 was split and one split was reinoculated. Third, two new short termstudies were set up and run to confirm the nitrification kinetics, both using Dl water.
The remaining volume from IIIST-5 was split into two equal volumes. IIIST-Si (I for re-inoculated), wasinoculated with 10* CFU/mL nitrifier concentration, as determined from IIIST-1 calibration. Ten milliliters ofthe heterotrophic stock culture was used per liter of test volume. The second split of IIIST-5, IIIST-5n, wasnot reinoculated and continued as before. The test extention was four weeks.
An ammonia biodegradation baseline kinetic bottle, IIIST-7, was started at the same time that IIIST-5i wasstarted. Test bottle IIIST-7 was similar to bottle IIIST-1. Test bottle IIIST-7 was inoculated with 106 CFU/mLnitrifier concentration. Test bottle IIIST-8, was an ammoniaAhiocyanate baseline kinetic bottle. It wasstarted at the same time IIIST-5i. Test bottle IIIST-8 was spiked to 300 mg/L NH3 and 180 mg/L SCNT. Testbottles IIIST-7 and IIIST-8 also received phosphate buffer and sodium bicarbonate.
Test bottle IIIST-8 was analyzed twice weekly for SCN. Sampling was normally Mondays, with the secondsampling of the week on Thursdays. Test bottle IIIST-4 was sampled periodically for the primaryparameters based on the laboratory results from previous sampling events.
Short Term Test Inocula Calibration
Based on the results of the IIIST-1 inocula calibration test, the stock solution of the nitrifier culture containedapproximately 7x10* CFU/mL and yielded approximately 105 CFU/mL in each test bottle. Approximately1.4 mL of nitrifier stock solution per liter of test solution was used for any reinoculations to get a nitrifierconcentration of 10s to 106 CFU/ml.
One sample of the nitrifier culture and one sample of the heterotrophic culture were submitted to thelaboratory for testing to see if they contributed background levels of ammonia. The sample of nitrifierculture was diluted to a 10 percent concentration for submission to laboratory. The heterotrophic culturewas prepared as a 10 percent slurry, allowed to mix three hours, and screened through glass wool. Afterthe 10 percent slurry preparation was completed, a sample of the slurry was diluted further to a 1 % solutionfor submittal to the laboratory. Neither culture contributed any significant quantities of ammonia nitrogen.
Phase III Initial Long-Term Test Protocol
All bottles were covered with aluminum foil after set-up for the duration of the test to avoid light penetrationand photo oxidation of the contaminants, and photosynthesis. All bottles were buffered to a pH of
FLUOR DANIEL GTI
o

approximately 8.0. The pH was adjusted in all bottles to between 7.0 and 8.0 with either 6N HCL or 10NNaOH. The pH was periodically adjusted during the course of the study to between 7.0 and 8.0 by addingeither standardized 6N HCL or 10N NaOH.
All sample bottles except IIILT-5 and IIILT-7 were inoculated to approximately 106 CFU/mL heterotroph andnitrifier concentrations. Bottle IIILT-5 was inoculated with 100 grams of Site soil. Bottle IIILT-7, a poisoncontrol, received no inoculum and was dosed with 1.2 grams (200 mg/L) of mercuric chloride. After 6weeks, bottle IIILT-7 was again dosed with an additional 1.2 grams of mercuric chloride. Bottles IIIST-1(containing ammonia), IIIST-2 (containing ammonia and phenol), and HIST-3 (containing ammonia, phenoland thiocyanate) served as positive controls to confirm inocula viability and to determine baseline kinetics.
The headspace of each bottle was periodically flushed with a stream of oxygen gas (2.0 liter/minute) for 15minutes and then each bottle sealed. Dissolved oxygen was maintained above 5 mg/L in all bottles at alltimes by replenishing the bottle headspace with oxygen as needed.
The sampling interval for the primary contaminants was every 14 days. The pH and DO levels weremonitored and recorded twice weekly. The detection limits shown represent the minimum values thatwould meet the data quality and quantity objectives. An aliquot of bottle IIILT-4 was spiked with nitrate andnitrite at approximately 1.0 mg/L to determine if there was a matrix interference for these analyses. Theinitial sample collected from IIILT-4 was also analyzed for phenol using the GC/MS method and the resultswere compared to the GC results to verify that the analytical substitution of the GC method for the GC/MSmethod was reasonable.
The total liquid volume in each test bottle was monitored and recorded before and after each samplingevent or at any time when liquids were added to or extracted from the test bottle. The volume extracted foreach sampling event for each test bottle was measured and recorded. The total volume measured for eachtest bottle is accurate to +/- 50 mL. Each test bottle was calibrated in 100 mL increments to allow for directmeasurement of the liquid in the bottle. The test duration was 11 1/2 weeks.
Long Term Test Extension and Re-inoculation Protocol
The test extension protocol was a modification of the Phase III Long-Term Study program. It was based onobservations from the Short Term Test and Test Extension. The objective of the Long-Term StudyExtension was to determine if nitrification of Site groundwater could occur at Site groundwater dilutionsother than the 9:1 dilution (IIIST-Si) and 19:1dilution (IIIST-6).
The results of the Phase III Short-Term Test indicated a probable die-off of the active nitrifying culture. Theresults of the Short Term Test Extension, specifically the reinoculation of test bottle IIIST-Si, demonstratedthat nitrification could be achieved in Site groundwater, provided an active culture of nitrifiers was presentafter significant removal of organic species occurs. In order to achieve this in the study programreinoculation was required.
The following discusses the Phase III Long Term Study Extension and Re-inoculation Test. All of theoriginal test bottles were reinoculated with the exception of IIILT-7(poisoned control). Two new bottles,IIILT-8 and IIILT-10, were set up to confirm the ammonia biodegradation baseline kinetics. They were
FLUOR DANIEL GTI

started when the long term test bottles were re-inoculated. Test bottle HILT-8 was set up to parallel theprevious ammonia baseline kinetic studies, specifically IIIST-1 and IIIST-7. It contained 300 mg/L NH3. Testbottle HILT-10 was dosed with 700 mg/L NH3 to see if significant self-inhibition of nitrifiers would beobserved. The sampling frequency for both test bottles HILT-8 and IIILT-10 was three times a week.
In addition to the baseline ammonia kinetics studies, a duplicate of test bottle IIIST-3, identified as testbottle IIIST-3D, was run. This test bottle contained 300 mg/L NH3-N, 250 mg/L phenol, and 180 mg/Lthiocyanate (SCN) in Dl water. It was run to reconfirm the synergistic inhibition of nitrification by phenol andthiocyanate.
Several of the bottles were split or diluted to a new level. A 600 ml sample aliquot was withdrawn from testbottle IIILT-1 and diluted with 2400 ml of stored MW 13-S groundwater to make a 5 percent dilution testbottle. This bottle was designated IIILT-9J. The contents of test bottle HILT-6 were split into two equalvolumes (IHLT-6J and IIILT-6n).
Test bottles IIILT-1 i, IIILT-2J, IIILT-3I, HILT-4i, IIILT-6i, IIILT-8, HILT-9!, IIILT-10, and IIIST-3D were re-inoculated with the nitrifier stock solution containing approximately 1.8x10'° CFU/mL of Nitrosomonas at day75 to a concentration of 5x10" CFU/mL Nitrosomonas. Test bottles IIILT-1 i, IIILT-2J, IIILT-3J, IIILT-4I, IIILT-6i, IIILT-8, IIILT-Qi, IIILT-10, and IIIST-3D were also inoculated with the heterotrophic culture, containingapproximately _ CFU/mL of heterotrophs to a concentration of 106 heterotrophs. Test bottle IIILT-5i wasre-inoculated with 227.4 grams of Site soil per liter of test solution. Bottle IIILT-7, the poisoned control, wasnot reinoculated but was redosed with 200 mg of mercuric chloride per liter of test solution. Short-Term testbottle HIST- 4 served as a live control and did not receive inocula. In addition to receiving the inoculum, testbottles IIILT-8, IIILT-10, and IIIST-3D were dosed with a phosphate buffer and sodium bicarbonate.
Dissolved oxygen and pH were monitored a minimum of three times per week. If the DO in any test bottlefell below 5 mg/L, the headspace was flushed with pure oxygen. The pH was also adjusted to be between7.0 and 8.0. Test duration was 9 weeks.
Sampling frequency for the primary long-term test parameters were once every two weeks with theexception of test bottles IIILT-8, IIILT-10, and IIIST-3D which were sampled three times per week. Asupplement to the normal sampling frequency described above should be noted. More frequent sampleswere collected and analyzed from each test bottle when laboratory monitoring suggested that nitrificationwas occurring in a test bottle. Dissolved oxygen and pH were monitored as criteria that indicated nitrification.When a decrease of 0.2 pH units and a decrease in DO occurred, a sample was collected immediately andevery other day thereafter until the pH stabilized. The samples collected during these periods wereanalyzed for NH3N, NO3 N, NO2-N, and TKN.
Long Term Test Inocula Calibration
Based on the results of the IIIST-1 and IIIST-7 inocula calibration tests, the stock solution of the nitrifierculture contained approximately 1.8x10'° CFU/mL of Nitrosomonas. Approximately 28 mL of nitrifier stocksolution per liter of test solution was added to IIILT-1 i, IIILT-2i, IIILT-3i, IIILT-4J, IIILT-Si, IIILT-8, IIILT-9, IIILT-10, and IIIST-3D to achieve a concentration of 5x10* CFU/mL of Nitrosomonas.
FLUOR DANIEL GTI
o

Verification of Nitrosomonas Die-Off in the Presence of Phenol and Thiocyanate
To verify that a die-off of the nKrifiers was actually occurring, 30 mL aliquots were withdrawn from testbottles IIIST-3D, IIILT-2i, and IIILT-3J on Day 3, and the biomass present was concentrated, washed, andresuspended in 50 mL Ammonia Assay Buffer solution (0.955 g/L NH4CI; 0.46 g/L KH2PO4; 3.7 g/LK2HPO4; and 0.35 g/L NaHCOJ to determine the number of viable nitrifiers present at this time. Threealiquots were taken from each bottle for assay at time intervals of 1, 3 and 6 hours. At each of the thesetime intervals, one aliquot was sacrificed for analysis. Nitrate and nitrite concentrations were measuredusing HACH test kits. Ammonia concentration was measured using an ammonium ion specific electrode.
Appndx.wpd
FLUOR DANIEL CTI
o

APPENDIX B
ANALYTICAL RESULTS
P \croj«c*«W«ufc«e«nVtrMMta chg
FLUOR DANIEL CTI

/ /Elapsed
divs01371014172124293135363842454952565963667074788085889192949698101106109112115119126129133136140143147
Date03-Mar-9704-Mar-9706-Mar-9710-Mar-9713-Mar-971 7-Mar-9720-Mar-9724-Mar-9727-Mar-9701 -Apr-9703-Apr-9707-Apr-9708-Apr-9710-Apr-9714-Apr-9717-Apr-9721 -Apr-9724-Apr-9728-Apr-970 1 -Mav-9705-May-9708-May-9712-Mav-9716-May-9720-Mav-9722-May-9727-May-9730-Mav-9702-Jun-9703-Jun-9705-Jun-9707-Jun-9709-Jun-9712-Jun-9717-Jun-9720-Jun-9723-Jun-9726-Jun-9730-Jun-9707-Jul-9710-Jul-9714-Jul-9717-Jul-9721-Jul-9724-Jul-9728-Jul-97
samplingevent
1234567891011
121314151617
18
19
2 ( 1 )
1 1 ( 1 )
1 4 ( 1 )
final
IIIST-1 v
Amountadded (ml)
60.9
813.53.5
•mountremoved (ml)
200115120115115115170170
Measured Amount
totalvolume (ml)
60005861574656345532542153065136496649664966
5020
IIIST-2Amount
added (ml)
60.9
561062
amountremoved (ml)
200140155135145140195220
Measured Amount
totalvolume (ml)
60005861572155715442530751734980476047604760
4365
\ IIIST-3Amount
added (ml)^
60.9
44
1
10.564
1
amountremoved (ml)
200165175175170170220220190190195
90
Measured Amount
totalvolume (ml)
60005860.95695.95524.95353.95183.95014.94794.94574.9439542114020402039313931
4070
IIIST-4Amount
added (ml)
42.61052111
0.50.5
0.250.60.2
0.20.40.20.2
•mountremoved (ml)
195165170170170170220230
85
858590909080
80
90
100
85
100
600
totalvolume fatT)
400038483693352833603191302228032573257325732488248824032318222921392049196919691969196918891889188918891799179917991700170017001700170017001701170017001615161516151515151515151515915
( 1 ) Became part of longterm extension Measured Amount 1150
Waukeean Short Term shrttrm2.xls

Elapsedda vi
01371014172124293135363842454952565963667074788085889192949698101106109112115119126129133136140143147
Date03-Mar-9704-Mar-9706-Mar-9710-Mar-9713-Mar-9717-Mar-9720-Mar-9724-Mar-9727-Mar-97Ol-Apr-9703-Apr-9707-Apr-9708-Apr-9710- Apr-9714- Apr-9717- Apr-9721-Apr-9724-Apr-9728-Apr-97Ol-May-9705-May-9708-May-9712-Maj-9716-May-9720-May-9722-May-9727-May-9730-May-9702-Jun-9703-Jun-9705-Jun-9707-Jun-9709-Jun-9712-Jun-9717-Jun-9720-Jun-9723-Jun-9726-Jun-9730-Jun-9707-Jul-9710-Jul-9714-Jul-9717-M-9721-Jul-9724-Jul-9728-Jul-97
samplingevent
1234567891011
121314151617
18
19
2(1)
11(1)
14(1)
final
IIIST-5Amount
added (ml)
40.57
22
amountremoved (ml)
195165180170170180220220
170
Measured Amount
totalvolume (ml)
4000384636813503333531652985276525452545237S
2470
IIIST-SnAmount
added (ml)
1.750.50.5
amountremoved (ml^
858590858080150
Measured Amount
totalvolume (ml)
1235123511521067978893813733583
•430
IHST-SIAmount
added (ml)
10.75
10.25
amountremoved (ml)
858590907580130
Measured Amount
totalvolume (ml)
1235123511501065975886812733603
410
( 1 ) Became part of longtcrm extension

Elapseddavs
01371014172124293135363842454952565963667074788085889192949698101106109112115119126129133136140143147
Date03-Mar-9704-Mar-9706-Mar-9710-Mar-9713-Mar-9717-Mar-9720-Mar-9724-Mar-9727-Mar-97Ol-Apr-9703-Apr-9707-Apr-9708-Apr-9710- Apr-9714- Apr-9717-Apr-9721-Apr-9724- Apr-9728-Apr-97Ol-May-9705-May-9708-May-9712-May-9716-May-9720-May-9722-May-9727-May-9730-May-9702-Jun-9703-Jun-9705-Jun-9707-Jun-9709-Jun-9712-Jun-9717-Jun-9720-Jun-9723-Jun-9726-Jun-9730-Jun-9707-Jul-9710-Jul-9714-Jul-9717-Jul-9721-Jul-9724-Jul-9728-Jul-97
samplingevent
1234567891011
121314151617
18
19
2(1)
11 (1)
14(1)
final
HIST-*Amount
added (ml)
40.57
12
0.5
1.52.250.750.75
•mountremoved (ml)
200165180170170170225225
170170
859090859080
80
Measured A mount
totalvolume (ml)
400038413676349733293159298927642539253923692199219921142024193418491761168316841684168416041604
1130
IIIST-7Amount
added (ml)
1
5115
0.51
amountremoved (ml)
170
8590909090
Measured Amount
totalvolume (ml)
6000600059205841575656675578
5579
IIIST-8Amount
added (ml)
1
49621
amountremoved (ml)
190
11011011011090
Measured Amount
totalvolume (ml)
6000600058945793568955815492
5*25
(1) Became part of longterm extension

11131-1
Elapseddavs
01371014172124293135
Date03-Mar-9704-Mar-9706-Mar-9710-Mar-9713 -Mar-9717-Mar-9720-Mar-9724-Mar-9727-Mar-9701 -Apr-9703-Apr-9707-Apr-97
samplingevent
1234567891011
InitialpH
7.66.736.197.057.627.697.68
7.677.61
FinalPH
7.687.827.69
(
D.O.(mg/L)
>20>2017.015.916.913.212.913.5
12.712.3
Alkalinitymg/L
16701610155016401770171016701690
NANA
Nitratemg/L
<0.50<0.50O.50
6.4520.7122
49.8280
NANA
Nitritemg/L
<0.505.54132282285202243
<0.50
NANA
Ammoniamg/L
216235160
56.4<9.4<9.4<9.4<9.4
NANA
TKNmg/L
266275162
56.9<9.4<9.4<9.4<9.4
NANA
Total N,(Calc)mg/L
266281294345306324293280
NANA
SCN(asN)mg/L
<1NANANANANANANA
NANA
SCNmg/L
<5.0NANANANANANANA
NANA
shrttrm2.xls, IIIST-1

uisT-1 ( tElapsed
davs01371014172124293135
Date03-Mar-9704-Mar-9706-Mar-9710-Mar-9713 -Mar-9717-Mar-9720-Mar-9724-Mar-9727-Mar-9701 -Apr-9703-Apr-9707-Apr-97
samplingevent
1234567891011
CODmg/L
153NANANANANANANA
NANA
DOCmg/L
56.2NANANANANANANA
NANA
Phenol(GC)mg/L
<0.10NANANANANANANA
NANA
2-Methy>Phenol
mg/L
<0.10NANANANANANANA
NANA
3-MethylPhenolmg/L
<0.10NANANANANANANA
NANA
4-MethylPhenol
mg/L
<0.10NANANANANANANA
NANA
2,4-DimethylPhenol
mg/L
<0.10NANANANANANANA
NANA
shrttrm2.xls, IIIST-1

IIIST-2
Elapseddavs
01371014172124293135
Date03-Mar-9704-Mar-9706-Mar-9710-Mar-9713 -Mar-9717-Mar-9720-Mar-9724-Mar-9727-Mar-9701 -Apr-9703-Apr-9707-Apr-97
samplingevent
1234567891011
InitialpH
7.627.096.9
6.566.977.417.82
7.687.63
FinalpH
7.697.787.837.847.83
D.O.(mg/L)
>20>20>20>2014.215.111.010.4
10.210.0
Alkalinitymg/L
16301670208022301770211022402200
NANA
Nitratemg/L
<0.50O.50<0.50
3.311.652.447.3276
NANA
Nitritemg/L
<0.50<0.50
1.5734.7226279271
<0.50
NANA
Ammoniamg/L
245254254282
56.4<9.4<9.4<9.4
NANA
TKNmg/L
275322256284
56.9<9.418.8<9.4
NANA
Total NI(Calc)mg/L
279322258322295331337276
NANA
SCN(asN)mg/L
3.9NANANANANANANA
NANA
SCNmg/L
16.1NANANANANANANA
NANA
shrttrm2.xls, IIIST-2

uiaT-2
Elapseddavs
01371014172124293135
Date03-Mar-9704-Mar-9706-Mar-9710-Mar-9713 -Mar-9717-Mar-9720-Mar-9724-Mar-9727-Mar-9701 -Apr-9703 -Apr-9707-Apr-97
samplingevent
1234567891011
CODmg/L
893543137160224185147124]
NANA
DOCmg/L
12050.5135
40.892.510.47.3
86.8
NANA
Phenol(GQmg/L
9288
<0.2<0.1O.IO.IO.IO.I
NANA
2-MethylPhenol
mg/L
<5.0<5.0O.2O.IO.I0.1O.I0.1
NANA
3-MethyIPhenol
mg/L
<5.0<5.0O.2O.IO.IO.IO.I0.1
NANA
4-MethylPhenol
mg/L
<5.0<5.0O.4O.IO.IO.IO.IO.I
NANA
2,4-DimethylPhenol
mg/L
<5.0<5.0O.2O.IO.IO.IO.IO.I
NANA
shrttrm2.xls, IIIST-2

111ST-3
Elapseddavs
013710141721242931353638
Date03-Mar-9704-Mar-9706-Mar-9710-Mar-9713 -Mar-9717-Mar-9720-Mar-9724-Mar-9727-Mar-9701 -Apr-9703 -Apr-9707-Apr-9708-Apr-9710- Apr-97
samplingevent
1234567891011
12
InitialPH
7.597.216.977.637.527.68
7.76.726.977.07
7.49
FinalPH
7.597.71
7.72
7.827.9
7.85
7.72
D.O.(mg/L)
18.3>20>20>20>2018.518.117.77.618.68.0
3.4
Alkalinitymg/L
1650167020602360238024602420236019402090
NA
NA
Nitratemg/L
<0.500.530.53
<0.50<0.50
0.52<0.50
0.661.5916.1
<10.0
136
Nitritemg/L
O.50<0.50<0.50O.50<0.50<0.50
0.679.29209297
349.0
187
Ammoniamg/L
254273245254245266273263113
56.4<9.4
<9.4
TKNmg/L
360360275313332294348291113
65.8<9.4
<9.4
Total N2(Calc)mg/L
403404318356367295349301324379349
323
SCN(uN)mg/L
43.443.942.442.935.2
<1<1<1<1<1<1
NA
SCNmg/L
180182176178146
<5.0<5.0<5.0<5.0<5.0<5.0
NA
shrttrrn2.xls, IIIST-3

111ST-3
Elapseddavs
013710141721242931353638
Date03 -Mar-9704-Mar-9706-Mar-9710-Mar-9713 -Mar-9717-Mar-9720-Mar-9724-Mar-9727-Mar-9701 -Apr-9703 -Apr-9707-Apr-9708-Apr-9710- Apr-97
samplingevent
1234567891011
12
CODmg/L
85075535228823510414180
247368
205.0
NA
DOCmg/L
11153.246.862.8
4911.67.2210140150208
NA
Phenol(GQmg/L
9397
<0.1<0.1<0.1<0.1O.I.68bNANANA
NA
2-MethylPhenolmg/L
<5.0<5.0O.IO.IO.IO.IO.I
0.1NANANA
NA
3-MethylPhenolmg/L
<5.0<5.0O.IO.IO.IO.IO.I0.24NANANA
NA
4-MethylPhenolmg/L
<5.0<5.00.1O.IO.IO.IO.I0.13NANANA
NA
2,4-DimethyIPhenol
mg/L
<5.0<5.0O.IO.IO.IO.IO.IO.INANANA
NA
shrttrm2.xls, IIIST-3

1-4 / /
Elapsedd»vs
01371014172124293135363842454952565963667074788085889192949698101106109112115119126129133136140143147
Date03-Mar-9704-Mar-9706-Mar-9710-Mar-9713-Mar-9717-Mar-9720-Mar-9724-Mar-9727-Mar-9701 -Apr-9703-Apr-9707-Apr-9708-Apr-9710-Apr-9714-Apr-9717-Apr-9721 -Apr-9724-Apr-9728-Apr-9701 -May-9705-May-9708-May-9712-May-9716-May-9720-May-9722-May-9727-May-9730-May-9702-Jun-9703-Jun-9705-Jun-9707-Jun-9709-Jun-9712-Jun-9717-Jun-9720-Jun-9723-Jun-9726-Jun-9730-Jun-9707-Jul-9710-Jul-9714-Ju!-9717-Jul-9721-JuI-9724-Jul-9728-Jul-97
samplingevent
1234567891011
121314151617
18
19
2 ( 1 )
11(1 )
14(1)
final
IInitial
pH
8.177.937.197.217.567.527.557.75
7.757.66
7.77.937.9
7.867.767.837.857.857.767.857.787.797.827.847.968.217.977.867.9
7.947.967.937.957.887.877.917.897.97.9
7.897.887.927.93
FinalpH
7.87.757.867.817.847.827.85
7.87.75
7.817.897.89
7.877.847.887.89
D.O.(mg/L)
>20>20>2012.311.410.59.99.9
9.18.8
9.1>20>20>20>20>20>20>20>20>20
>20>20>20>2018.5>20>20>20>20>20>20>20>20>20>20>20>20>20>20>20>20>20
Alkalinitymg/L
20002000226026602740270027602720
NANANANANANA
NA
NA
2490
NA
NA
NA
VNitratemg/L
<0.50<0.50
0.560.69
<0.500.59
<0.50<0.50
0.65<0.50
0.520.57NA
<0.50
<0.50
0.51
<0.5
<0.50
0.53
<0.50
Nitritemg/L
<0.50<0.50<0.50<0.50<0.50<0.50<0.50<0.50
<0.50<0.50<0.50<0.50
NA<0.50
<0.50
<0.50
<0.5
<0.50
<0.50
<0.50
Ammoniamg/L
649649621630734635621640
687715696715NA721
882
844
901
782
828
800
TKNmg/L
759702711683740702743696
696753734818NA825
910
872
1030
865
958
1000
Total N,<C«lc)mg/L
811754759731789729767716
697753735819NA825
910
873
1030
865
958.53
1000
(1 ) Became part oi longterm extension
shrttrm2.xls, IIIST-4

uis r-4
Elapseddays
013710141721242931353638424549525659636670747880858891929496981011061091121 1 5119126129133136140143147
Date03-Mar-9704-Mar-9706-Mar-9710-Mar-9713-Mar-9717-Mar-9720-Mar-9724-Mar-9727-Mar-9701 -Apr-9703-Apr-9707-Apr-9708-Apr-9710-Apr-9714-Apr-9717-Apr-9721 -Apr-9724-Apr-9728-Apr-9701 -May-9705-May-9708-May-9712-May-9716-May-9720-May-9722-May-9727-May-9730-May-9702-Jun-9703-Jun-9705-Jun-9707-Jun-9709-Jun-9712-Jun-9717-Jun-9720-Jun-9723-Jun-9726-Jun-9730-Jun-9707-Jul-9710-Jul-9714-Jul-9717-Jul-9721-Jul-9724-Jul-9728-Jul-97
samplingevent
1234567891011
121314151617
18
19
2 ( 1 )
1 1 ( 1 )
1 4 ( 1 )
final( 1 ) Became p
-ri 1tj^i
(«N)mg/L
5252474749262420
NANANANANANA
NA
NA
NA
NA
NA
NA
a
SCNmg/L
216214195197202109
98.282.3
NANANANANANA
NA
NA
NA
NA
NA
NA
CODmg/L
169016001040935787732586555
NANANANANANA
NA
NA
291
NA
341
NA
DOCmg/L
413350109110
175069.4103358
NANANANANANA
NA
NA
322
NA
49.6
NA
/Phenol \
(GC)mg/L
110120
<0.10.1<0.1<2.0<2.0Lib
NANANANANANA
NA
NA
NA
NA
NA
NA
MethylPhenol
mg/L
1919
<0.1O.IO.I<2.0<2.00.18
NANANANANANA
NA
NA
NA
NA
NA
NA
3-MethylPhenol
mg/L
4242
0.1O.IO.I<2.0<2.00.36
NANANANANANA
NA
NA
NA
NA
NA
NA
4-MethylPhenol
mg/L
1817
O.I0.10.1<2.0<2.00.18
NANANANANANA
NA
NA
NA
NA
NA
NA
2,4-DimethylPhenol
mg/L
5.35.8
<1.0<1.0<1.0<2.0<2.0<1.0
NANANANANANA
NA
NA
NA
NA
NA
NA
shrttrm2.xls, IIIST-4

111ST-5
Elapseddavs
01371014172124293135
Date03 -Mar-9704-Mar-9706-Mar-9710-Mar-9713 -Mar-9717-Mar-9720-Mar-9724-Mar-9727-Mar-9701 -Apr-9703-Apr-9707-Apr-97
samplingevent
1234567891011
InitialPH
7.857.787.347.16
7.67.717.69
7.7
7.747.68
FinalPH
7.867.89
D.O.(mg/L)
>20>20>20>20>20>20>20>20
>20>20
Alkalinitymg/L
16901650198021002720213021202100
2120NR
Nitratemg/L
<0.500.59
<0.50<0.50<0.50
0.53<0.50<0.50
<0.50<0.50
Nitritemg/L
<0.50<0.50<0.50<0.50<0.50<0.50<0.50<0.50
0.580.6
Ammoniamg/L
235226235226235303226235
310263
TKNmg/L
370256256294246310301254
320273
Total N2
(Calc)mg/L
391279276312246311302254
321274
SCN(a«N)mg/L
21.422.319.617.8
<5.0/6.914.4/6.9
1.5<1
NANA
shrttrm2.xls, IIIST-5

111ST-5 f IElapsed
davs01371014172124293135
Date03 -Mar-9704-Mar-9706-Mar-9710-Mar-9713-Mar-9717-Mar-9720-Mar-9724-Mar-9727-Mar-9701 -Apr-9703-Apr-9707-Apr-97
samplingevent
1234567891011
SCNmg/L
8992.481.573.9
<5.0/6.914.4/6.9
6.02<5.0
NANA
CODmg/L
829563394373224239220209
85202
DOCmg/L
13577.862.845.149.2
3534.5161
173201
Phenol(GQmg/L
4636
O.IO.IO.IO.IO.IO.I
NANA
z-MethylPhenolmg/L
8.77.2
O.IO.IO.IO.IO.IO.I
NANA
3-MethylPhenolmg/L
17.98*
O.IO.IO.IO.IO.IO.I
NANA
4-MethylPhenolmg/L
8.18*
O.IO.IO.IO.IO.IO.I
NANA
2,4-DimethylPhenolmg/L
3.2<5.0O.2O.2O.2O.IO.IO.I
NANA
shrttrm2.xls, IIIST-5

LUST-511 ( f
Elapseddavs
013710141721242931353638424549525659
Date03 -Mar-9704-Mar-9706-Mar-9710-Mar-9713 -Mar-9717-Mar-9720-Mar-9724-Mar-9727-Mar-97Ol-Apr-9703-Apr-9707-Apr-9708-Apr-9710- Apr-9714- Apr-9717- Apr-9721-Apr-9724-Apr-9728-Apr-9701 -Mav-97
samplingevent
1234567891011
121314151617
InitialPH
8.248.3
8.067.867.727.887.86
FinalpH
7.97.83
7.6
D.O.(mg/L)
7.57.43>20>20>20>20>20>20
Alkalinitymg/L
NANANANANANANA
Nitratemg/L
<0.500.53
<0.500.69
<0.50<0.50<0.50
Nitritemg/L
1.48<0.50<0.50<0.50
0.590.610.97
Ammoniamg/L
282273273329292379332
TKNmg/L
329282301414367455379
Total N2(Calc)mg/L
330283301415368456380
SCN(asN)mg/L
NANANANANANANA
SCNmg/L
NANANANANANANA
shrttrm2.xls, IIIST-5n

lllST-5n
Elapseddavs
013710141721242931353638424549525659
Date03 -Mar-9704-Mar-9706-Mar-9710-Mar-9713 -Mar-9717-Mar-9720-Mar-9724-Mar-9727-Mar-9701 -Apr-9703 -Apr-9707-Apr-9708-Apr-9710- Apr-9714- Apr-9717-Apr-9721 -Apr-9724-Apr-9728-Apr-9701 -May-97
samplingevent
1234567891011
121314151617
CODmg/L
NANANANA184NANA
DOCmg/L
NANANANANANANA
Phenol(GQmg/L
NANANANANANANA
2-MethylPhenolmg/L
NANANANANANANA
3-MethylPhenolmg/L
NANANANANANANA
4-MethylPhenolmg/L
NANANANANANANA
2,4-DimethylPhenolmg/L
NANANANANANANA
shrttrm2.xls, IIIST-5n

WST-5i
Elapseddavs
013710141721242931353638424549525659
Date03-Mar-9704-Mar-9706-Mar-9710-Mar-9713-Mar-9717-Mar-9720-Mar-9724-Mar-9727-Mar-9701 -Apr-9703 -Apr-9707-Apr-9708-Apr-9710- Apr-9714-Apr-9717-Apr-9721 -Apr-9724-Apr-9728-Apr-97Ol-Mav-97
samplingevent
1234567891011
121314151617
InitialPH
8.248.3
8.067.867.727.887.86
FinalpH
7.97.837.6
D.O.(mg/L)
7.57.43>20>20>20>20>20>20
Alkalinitymg/L
NANANANANANANA
Nitratemg/L
<0.50<0.50
2.7132.4161282300
Nitritemg/L
1.916.63
1113
1.16<0.50<0.50
Ammoniamg/L
358282263273150
<9.4<9.4
TKNmg/L
367282301292179
<9.4<9.4
Total Nj(Calc)mg/L
369289315337341282300
shrttrm2.xls, IIIST-51

iliST-5i
Elapseddavs
013710141721242931353638424549525659
Date03 -Mar-9704-Mar-9706-Mar-9710-Mar-9713-Mar-9717-Mar-9720-Mar-9724-Mar-9727-Mar-9701 -Apr-9703 -Apr-9707-Apr-9708-Apr-9710- Apr-9714- Apr-9717- Apr-9721 -Apr-9724-Apr-9728-Apr-9701 -May-97
samplingevent
1234567891011
121314151617
SCN(asN)mg/L
NANANANANANANA
SCNmg/L
NANANANANANANA
CODmg/L
NANANANA174NANA
DOCmg/L
NANANANANANANA
Phenol(GC)mg/L
NANANANANANANA
2-MethylPhenol
mg/L
NANANANANANANA
3-MethylPhenol
mg/L
NANANANANANANA
4-MethylPhenol
mg/L
NANANANANANANA
2,4-DimethylPhenol
mg/L
NANANANANANANA
shrttrm2.xls, IIIST-51

111ST-6
Elapseddavs
01371014172124293135363842454952565963667074
Date03 -Mar-9704-Mar-9706-Mar-9710-Mar-9713 -Mar-9717-Mar-9720-Mar-9724-Mar-9727-Mar-9701 -Apr-9703 -Apr-9707-Apr-9708-Apr-9710- Apr-9714- Apr-9717-Apr-9721 -Apr-9724-Apr-9728-Apr-9701 -May-9705-May-9708-May-9712-Mav-9716-Mav-97
samplingevent
1234567891011
121314151617
18
InitialPH
7.547.457.117.757.81
7.87.84
7.887.81
7.847.847.947.727.336.967.527.687.76
7.87.83
FinalPH
7.657.85
7.74
7.727.847.977.91
D.O.(mg/L)
>2014.3>20>20>20>20>20>20
>20>20
>2019.718.818.217.215.515.214.614.214.214.2
Alkalinitymg/L
15501530167018601920194019401940
1940NA
NANANANANANA
NA
Nitratemg/L
<0.50<0.50
0.660.50<0.50<0.50<0.50<0.50
<0.50<0.50
<0.500.540.65
<0.50NA
28.9
135
Nitritemg/L
<0.50<0.50<0.50<0.50<0.50<0.50<0.50<0.50
0.610.58
0.6<0.50<0.50
2.65NA150
<0.50
Ammoniamg/L
56.484.7150
94.1103114134118
160122
132141141141NA
<9.4
<9.4
TKNmg/L
190104152161123150169132
170132
160160169207NA
<9.4
711
Total N2
(Calc)mg/L
201115162161123150172132
171133
161161170210NA179
NA
shrttrm2.xls, IIIST-6

IIIST-6
Elapseddavs
01371014172124293135363842454952565963667074
Date03-Mar-9704-Mar-9706-Mar-9710-Mar-9713 -Mar-9717-Mar-9720-Mar-9724-Mar-9727-Mar-9701 -Apr-9703-Apr-9707-Apr-9708-Apr-9710-Apr-9714-Apr-9717- Apr-9721 -Apr-9724-Apr-9728-Apr-97Ol-Mav-9705-May-9708-May-9712-Mav-9716-Mav-97
samplingevent
1234567891011
121314151617
18
SCN(asN)mg/L
10.911.19.7<1
00
3.3<1
NANA
NANANANANANA
NA
SCNmg/L
45.446.240.4<5.0
<5.0/6.912.7/5.3
13.6<5.0
NANA
NANANANANANA
NA
CODmg/L
46824220314311911612999
117106
NANANANANANA
NA
DOCmg/L
48.645.472.841.6112
15.415.9115
128129
NANANANANANA
NA
Phenol(GC)
mg/L
260.072
<0.1<0.1<0.1<0.1<0.1.85b
NANA
NANANANANANA
NA
2-MethyIPhenol
mg/L
4.5<10<0.1<0.1<0.1<0.1<0.10.14
NANA
NANANANANANA
NA
3-MethylPhenol
mg/L
10<10<.10<10<10<10<100.27
NANA
NANANANANANA
NA
4-MethylPhenol
mg/L
4<10<0.1<0.1<0.1<0.1<0.10.14
NANA
NANANANANANA
NA
2,4-DimethylPhenol
mg/L
1.5<20<0.1<0.1<0.1<0.1<0.1<0.1
NANA
NANANANANANA
NA
shrttrm2.xls, IIIST-6

JLULLT-7
Elapseddavs
01371014172124293135363842454952
Date03 -Mar-9704-Mar-9706-Mar-9710-Mar-9713 -Mar-9717-Mar-9720-Mar-9724-Mar-9727-Mar-9701 -Apr-9703-Apr-9707-Apr-9708-Apr-9710-Apr-9714- Apr-9717-Apr-9721 -Apr-9724-Apr-97
samplingevent
1234567891011
1213141516
InitialPH
7.68
7.116.577.157.637.54
FinalPH
7.87
7.857.977.837.7
7.86
D.O.(mg/L)
0.7>20>2015.4>20
Alkalinitymg/L
NA
NANANANANA
Nitratemg/L
<0.50
77.2<1047.2211270
Nitritemg/L
2.43
6.22247259
65.4<0.50
Ammoniamg/L
263
20765.8<9.4<9.4<9.4
TKNmg/L
272
21675.3<9.4<9.4
9.4
Total N,(Calc)mg/L
274
299322306276279
shrttrm2.xls, IIIST-7

IIILT-7
Elapseddavs
01371014172124293135363842454952
Date03-Mar-9704-Mar-9706-Mar-9710-Mar-9713 -Mar-9717-Mar-9720-Mar-9724-Mar-9727-Mar-9701 -Apr-9703-Apr-9707-Apr-9708-Apr-9710-Apr-9714- Apr-9717- Apr-9721 -Apr-9724-Apr-97
samplingevent
1234567891011
1213141516
SCN(asN)mg/L
NA
NANANANANA
SCNmg/L
NA
NANANANANA
CODmg/L
124
NANANANANA
DOCmg/L
91.5
NANANANANA
Phenol(GQ
mg/L
NA
NANANANANA
2-MethylPhenol
mg/L
NA
NANANANANA
3-MethylPhenol
mg/L
NA
NANANANANA
4-MethylPhenol
mg/L
NA
NANANANANA
2,4-DimethylPhenol
mg/L
NA
NANANANANA
shrttrm2.xls, IIIST-7

liial-8
Elapseddavs
01371014172124293135363842454952
Date03 -Mar-9704-Mar-9706-Mar-9710-Mar-9713 -Mar-9717-Mar-9720-Mar-9724-Mar-9727-Mar-9701 -Apr-9703 -Apr-9707-Apr-9708-Apr-9710- Apr-9714- Apr-9717- Apr-9721 -Apr-9724-Apr-97
samplingevent
1234567891011
1213141516
InitialpH
7.67
7.156.7
6.937.447.53
FinalpH
77.87
7.717.897.777.757.82
D.O.(mg/L)
0.7>20>2014.313.4
Alkalinitymg/L
NA
NANANANANA
Nitratemg/L
<0.50
5.11<1036.890.4180
Nitritemg/L
2.56
67.2201250198102
Ammoniamg/L
254
216113
28.2<9.4<9.4
TKNmg/L
263
254160
65.947
75.3
Total N2(Calc)mg/L
306
367361393376397
SCN(asN)mg/L
41
40.70
40.540.240.0
shrttrm2.xls, IIIST-8

IIIST-8
Elapseddavs
01371014172124293135363842454952
Date03 -Mar-9704-Mar-9706-Mar-9710-Mar-9713-Mar-9717-Mar-9720-Mar-9724-Mar-9727-Mar-9701 -Apr-9703-Apr-9707-Apr-9708-Apr-9710- Apr-9714- Apr-9717-Apr-9721 -Apr-9724-Apr-97
samplingevent
1234567891011
1213141516
SCNmg/L
169
169
168167166
CODmg/L
287
NANANANANA
DOCmg/L
103
NANANANANA
Phenol(GC)
mg/L
NA
NANANANANA
2-Methy!Phenol
mg/L
NA
NANANANANA
3-MethylPhenol
mg/L
NA
NANANANANA
4-MethyIPhenol
mg/L
NA
NANANANANA
,4-DimethylPhenol
mg/L
NA
NANANANANA
shrttrm2.xls, IIIST-8

Elapseddavi01142831353842454952565963666770747880858889909192949698101106109112115116119126127129130133136140143147150154
Date03-Mar-9704-Mar-9717-Mar-9731 -Mar-9703 -Apr-9707-Apr-9710- Apr-9714- Apr-9717-Apr-9721 -Apr-9724- Apr-9728-Apr-97Ol-Mav-9705-Mav-9708-May-9709-May-9712-May-9716-May-9720-May-9722-May-9727-Mav-9730-May-9731 -May-97Ol-Jun-9702-Jun-9703-Jun-9705-Jun-9707-Jun-9709-Jun-9712-Jun-9717-Jun-9720-Jun-9723-Jun-9726-Jun-9727-Jun-9730-Jun-9707-Jul-9708-Jul-9710-Jul-97ll-Jul-9714-Jul-9717-Jul-9721-Jul-9724-Jul-9728-Jul-9731-Jul-9704-Aug-97
samplingevent
123
4
5
6
70(1)
1
2345678910
11
12
13141516
171819
HILT-1Amountadded (ml)
63.95732
1
149
0.4
22.5
2.5
7.995.332
amountremoved (ml)
600155155
155
150
250
125700
110
105
15
100
85
90100100100
640
Measured Volume
totalvolume (ml)
600054645314516651695171517150165016501650174867486748674867486746174617461746174492394139413941394138313831383138313831372637263726371137113613361635313533344333513260316631692531
2552
HILT-2Amountadded (ml)
62.96421
175.5
1
710
amountremoved (ml)
550155155
155
150
255
130100
80
105
105
327.81585
85
90100
640
Measured Volume
totalvolume (ml)
600055135364521352155216521650615061506150614911491149114911491146564656465646564526460146014521452144164416441744174417431243124312398539703892390238173817372736273627362736272987
2890
HILT-3Amountadded (ml)
65.9683211
1.25
1
175.5
12211.50.50.50.5
1.56
6.8
7.252.50.90.4
•mountremoved (ml)
550155155
155
150
260
120125
80
1359095100100130130130130
105
85
130100100
860
Measured Volume
totalvolume (ml)
600055165367522052235225522650725072507250724922492249234923492346644664466446644544459545954515451543804291419841004001387237433613348434843380338633013308330831853090299329942134
2100
HILT-4Amountadded (ml)
80.9110.5
1
172
1
3
0.5
amountremoved (ml)
560160155
160
150
280
135
180
170
125
170
860
Measured Volume
totalvolume (ml)
600055215362520852085208520850485048504850494899489948994899489946194619461946194484465646564656465644774477447744774480431043114311431143114186418641864186418640164016401640163156
3270(1) initiation of Long Term Extension
\Vaukegan Long Term L/i gtrm2.xls

Elapseddaw01142831353842454952565963666770747880858889909192949698101106109112115116119126127129130133136140143147150154
Date03-Mar-9704-Mar-9717-Mar-9731 -Mar-9703-Apr-9707-Apr-9710-Apr-971 4- Apr-9717-Apr-9721 -Apr-9724-Apr-9728-Apr-9701 -May-9705-May-9708-Mav-9709-Mav-9712-May-9716-Mav-9720-Mav-9722-Mav-9727-Mav-9730-Mav-9731-Mav-97Ol-Jun-9702-Jun-9703-Jun-9705-Jun-9707-Jun-9709-Jun-9712-Jun-9717-Jun-9720-Jun-9723-Jun-9726-Jun-9727-Jun-9730-Jun-9707-Jul-9708-Jul-9710-Jul-97ll-Jul-9714-Jul-9717-Jul-9721-Jul-9724-Jul-9728-Jul-9731-Jul-9704-Aug-97
samplingevent
123
4
5
6
70(1)
1
23456•7
8910
11
12
13141516
171819
IIILT-5Amountadded (ml)
255
1
2.5
0.75
0.75
21
1
amountremoved (ml)
550160155
165
150
255
120
105
105
95
100
860
Measured Volume
totalvolume (ml)
600054525297514751475148514849834983498349864836483648364836483645814581458145824462446244624462446243594360436043604360425642564256425642564161416141614161416140614061406140613201
3315
HILT-6Amount
added (ml)
60.94211
0.5
0.5
amountremoved (ml)
550160155
160
150
155
120
Measured Volume
totalvolume (ml)
600055115355520252035204520450445044504450444894489448944894489447394740474047404620
4570
IIILT-6nAmountadded (ml)
0.7
0.40.4
0.2
1.42.33
amountremoved (ml)
105
105
100
86
100
10075767
totalvolume (ml)
2285228522852285218021812181218121812076207619761976197618901890189018901890179017901790179016911619855
IIIL.T-61Amountadded (ml)
91.5
2211.30.40.3
amountremoved (ml)
100
80
10510595100100105
Measured Volume
totalvolume (ml)
237423742296229821942090199618961796169116911691169116911691169116911691169116911691169116911691
1695(1) initiation Measured Volume 740
Waukegan Long Term Lngtrm2.xls

Elapseddays
01
142831353842454952565963666770747880858889909192949698101106109112115116119126127129130133
Date03-Mar-9704-Mar-9717-Mar-9731 -Mar-9703-Apr-9707-Apr-9710-Apr-9714- Apr-9717- .Apr-9721 -Apr-9724- Apr-9728-Apr-97Ol-Mav-9705-Mav-9708-Mav-9709-Mav-9712-Mav-9716-Mav-9720-Mav-9722-Mav-9727-Mav-9730-May-9731-Mav-97Ol-Jun-9702-Jun-9703-Jun-9705-Jun-9707-Jun-9709-Jun-9712-Jun-9717-Jun-9720-Jun-9723-Jun-9726-Jun-9727-Jun-9730-Jun-9707-Jul-9708-M-9710-Jul-97ll-Jul-9714-Jul-97
samplingevent
123
4
5
6
70 ( 1 )
1
2345678910
11
12
1314
HILT-7Amount
added (ml)
4
1
4321
1.5
1
0.8
amountremoved (ml)
650160155
160
150
1280
145
130
130
105
130
totalvolume (ml)
60005354519450395040504050444887488948904892474247424742474247414461446144614462431743174317431743174187418741874187418740574057405740574057395239523952395239523822
HILT-8Amount
added (ml)
17
9.52.3
0.4
amountremoved (ml)
1509080
195105100
100
Measured Volume
totalvolume (ml)
609560055935593757425637553755375437
6000
HILT-9Amount
added (ml)
3
22
amountremoved (ml)
100
80
105105
Measured Volume
totalvolume (ml)
311931193041304329382833283328332833
2780
136 17-Jul-97 15 3822
HILT-10Amount
added (ml)
16
16.516
11.15.41.41.4
amountremoved (ml)
100
80
105105100100100
Measured Volume
totalvolume (ml)
622862286165618160875987588857905690
5750
140143147150154
21-Jul-9724-Jul-9728-Jul-9731-Jul-97
04-Aug-97
16
171819
860
Measured Volume
382238222962
3115(1) initiation
Waukegan Long Term Lngtrm2.xls

Elapseddays
01
142831353842454952565963666770747880858889909192949698101106109112115116119126127129130133136140143147150154
Date03-Mar-9704-M«r-9717-Mar-9731 -Mar-9703-Apr-9707-Apr-9710-Apr-9714- Apr-9717-Apr-9721-Apr-9724- Apr-9728-Apr-9701 -May-9705-May-9708-May-9709-May-9712-May-9716-May-9720-May-9722-May-9727-May-9730-May-9731 -May-97Ol-Jun-9702-Jun-9703-Jun-9705-Jun-9707-Jun-9709-Jun-9712-Jun-9717-Jun-9720-Jun-9723-Jun-9726-Jun-9727-Jun-9730-Jun-9707-Jul-9708-Jul-9710-Jul-97ll-Jul-9714-Jul-9717-Jul-9721-Jul-9724-Jul-9728-Jul-9731-Jul-97
04-Aug-97
samplingevent
123
4
5
6
70(1)
1
2345678910
11
12
13141516
171819
IIIST-3DAmount
added (ml)
5
6622
1.6373
0.80.1
amountremoved (ml)
15013085
265175160170170170170175
Measured Volume
totalvolume (ml)
622860986019602557625589543152645101493447644590
4540
(1) initiation
Waukegan Long Term Lngtrm2.xls

iujul-1
Elapseddavs
01
142831353842454952565963666770747880858889909192949698101106109112115116119126127129130133136140143147150154
Date03-Mar-9704-Mar-9717-Mar-9731 -Mar-9703-Apr-9707-Apr-9710-Apr-9714-Apr-971 7-Apr-9721 -Apr-9724- Apr-9728-Apr-9701 -May-9705-Mav-9708-Mav-9709-May-9712-May-9716-May-9720-May-9722-May-9727-May-9730-May-9731-Mav-97Ol-Jun-9702-Jun-9703-Jun-9705-Jun-9707-Jun-9709-Jun-9712-Jun-9717-Jun-9720-Jun-9723-Jun-9726-Jun-9727-Jun-9730-Jun-9707-Jul-9708-Jul-9710-Jul-97ll-Jul-9714-Jul-9717-Jul-9721-Jul-9724-Jul-9728-Jul-9731-Jul-97
04-Aug-97
samplingevent
123
4
5
6
70(1)
1
2345678910
11
12
13141516
171819
InitialpH
8.27.076967.397.517.787.717.737.797.617.897.867.8
7.83
7.827.877.847.827.827.66
7.897.787.667.767.767.837.857.887.82
7.8
7.567.59
7.38
6.646.746.857.187.39
FinalpH
7.827.657.787.817.84
7.77
7.82
7.81
7.967.9
786
7.837.777.84
7.87.92
D.O.(mg/L)
>2019.5
1515.115.315.315.414.814.514.413.613.2
1313
12.913
11.812.7
12>20
>20>20>20>20>20>20>20>20>20>20
>20>20
16.4
8.717.816.716.118.7
I
Alkalinitymg/L
200024902680
3190
3660
3520
3660NA
3620
NA
NA
NA
NANANANA
Cyanidemg/L
<0.5NANA
NA
NA
NA
NANA
NA
NA
NA
NA
NANANANA
SCNmg/L
199214
46.2
11.9
10.6
6.38
11.9NA
NA
NA
NA
NA
NANANANA
NH,mg/L
649616715
687
872
664
749834
698
744
702
661
456288211
65.1
NOjmg/L
<0.50<0.50
0.96
<0.50
<0.50
1.96
1.042.05
<1
1.69
<10
116
293485591267
NO,mg/L
<0.50<0.50
<0.5
<0.50
<0.50
<0.50
<0.522.8
24.6
34.1
94.7
2.48
12.90.521.992.33
Phos.mg/L
1060NANA
NA
NA
NA
TKNmg/L
730702724
753
882
834
853893
949
837
810
782
819419316102
BODmg/L
>350NANA
NA
NA
NA
CODmg/L
19101040483
469
477
418
364
416
622
Photol(4-APP)rnf/L
326
( 1 ) initiation of Long Term Extension
Lngtrm2.xls,

Elapseddavs
01
142831353842454952565963666770747880858889909192949698101106109112115116119126127129130133136140143147150154
Date03-Mar-9704-Mar-9717-Mar-9731 -Mar-9703-Apr-9707-Apr-9710-Apr-971 4- Apr-9717- Apr-9721 -.Apr-9724-Apr-9728-Apr-9701 -May-9705-Mav-9708-May-9709-May-9712-May-9716-Mav-9720-May-9722-May-9727-May-9730-May-9731 -May-97Ol-Jun-9702-Jun-9703-Jun-9705-Jun-9707-Jun-9709-Jun-9712-Jun-9717-J-m-9720-Jun-9723-Jun-9726-Jun-9727-Jun-9730-Jun-9707-Jul-9708-Jul-9710-Jul-97l l -Jul-9714-Jul-9717-Jul-9721-Jul-9724-Jul-9728-Jul-9731-Jul-97
04-Aug-97
samplingevent
123
4
5
6
70(1)
1
2345678910
11
12
13141516
171819
(1) initiation
DOCmg/L
40897.476.6
479
258
525
469NA
499
60.6
/hard-ness
mg/L
140
BTEXmg/L
0.153
DissolvedArsenic
mg/L
3.54
3.29
TotalArsenicmg/L
4.22
2.25
TotalIronmg/L
0.897
4Pnenol(GQmg/L
120<0.1<0.1
<0. 1
<0. 1
2-MethylPhenolmg/L
20<0.1<0. 1
<0.1
<0.1
3-MethylPhenol
mg/L
44<0.1<0.1
<0.1
<0.1
•v
4-MethylPhenolmg/L
19<0. 1<0.1
<0. 1
<0. 1
2,4-DlmethylPhenolmg/L
6<0.1<0.1
<0.1
<0.1
Lngtrm2.xls,

1111 I -Z
Elapseddavs
01
142831353842454952565963666770747880858889909192949698101106109112115116119126127129130133136140143147150154
Date03-Mar-9704-Mar-9717-Mar-9731 -Mar-9703-Apr-9707-Apr-9710-Apr-9714- Apr-9717-Apr-9721 -.Apr-9724- Apr-9728- Apr-97Ol-Mav-9705-May-9708-Mav-9709-May-9712-May-9716-May-9720-Mav-9722-Mav-9727-May-9730-May-9731 -May-97Ol-Jun-9702-Jun-9703-Jun-9705-Jun-9707-Jun-9709-Jun-9712-Jun-9717-Jun-9720-Jun-9723-Jun-9726-Jun-9727-Jun-9730-Jun-9707-Jul-9708-Jul-9710-Jul-97ll-Jul-9714-Jul-9717-Jul-9721-Jul-9724-Jul-9728-Jul-9731-JuI-97
04-Aug-97
samplingevent
123
4
5
6
70(1)
1
2345678910
11
12
13141516
171819
InitialpH
8.016.957.167.537.657.837.837.827.867.717.877.87
7.87.81
7.827.887.72
7.87.817.55
7.737.7
7.727.687.637.747.767.757.777.737.66
6.596.52
7.79
7.787.72
FinalPH
7.747.62-1117.877.84
7.83
7.81
7.83
7.787.82
D.O.(mg/L)
>20>2019.619.3
1918.818.918.117.817.416.615.915.815.7
15.71J.214.8
1514.4>20
>20>20>20>20>20>20>20>20>20>20>20
1410
>20
>20>20
Alkalinitymg/L
181021202420
2800
3600
3120
3180
3020
Cyanidemg/L
<0.50
SCNmg/L
141135
5.74
7.78
7.3
5.55
7.77
NHjmg/L
480398470
470
559
474
626474
427
419
521
260
<9.4
<9.4
NOjmg/L
<0.50<0.50
<0.5
0.55
<0.5
<0.5
<0.53.74
<0.5
<1
<2.5
38.6
456
467
NO,mg/L
<0.50<0.50
<0.5
<0.50
<0.5
<0.5
<0.525.8
3.57
29.7
46.3
300
<0.50
0.6
Phos.mg/L
1060
TKNmg/L
484455480
508
597
503
645568
642
567
577
298
27.9
130
BODmg/L
>350
CODmg/L
1280521310
343
316
276
223
465
708
Phenol(4-APP)
mg/L
225
(1) initiation of Long Term Extension
Lng1rm2.xls

niLT-2
Elapseddavs
01
142831353842454952565963666770747880858889909192949698101106109112115116119126127129130133136140143147150154
Date03-Mar-9704-Mar-9717-Mar-9731 -Mar-9703-Apr-9707-Apr-9710- Apr-9714-Apr-9717.Apr-9721 -Apr-9724- Apr-9728-Apr-9701 -May-9705-May-9708-May-9709-May-9712-May-9716-Mav-9720-May-9722-Mav-9727-May-9730-May-9731 -May-97Ol-Jun-9702-Jun-9703-Jun-9705-Jun-9707-Jun-9709-Jun-9712-Jun-9717-Jun-9720-Jun-9723-Jun-9726-Jun-9727-Jun-9730-Jun-9707-Jul-9708-Jul-9710-Jul-97ll-Jul-9714-Jul-9717-Jul-9721-Jul-9724-Jul-9728-Jul-9731-Jul-97
04-Aug-97
samplingevent
123
4
5
6
70(1)
1
2345678910
11
12
13141516
171819
(1 ) initiation
DOCmg/L
27164.242.7
346
274
372
332
375
32.5
/harknessmg/L
70
BTEXmg/L
0.09
DissolvedArsenic
mg/L
2.11
1.7
TotalArsenic
mg/L
3.05
1.48
TotalIronmg/L
0.964
__lPhenol
(GC)mg/L
87<0.1<0.1
<0.1
<0. 1
2-MethylPhenolmg/L
14<0.1<0.1
<0. 1
<0. 1
3 MethylPhenolmg/L
31<0. 1<0.1
<0. 1
<0. 1
4-MethylPhenolmg/L
14<0. 1<0.1
<0.1
<0.1
2,4-DimethylPhenolmg/L
4.4<0.5<0.1
<0.1
<0. 1
Lngtrm2.xls

Elapirddavs
01
1428313538424549525659636667707478808588899091929496981011061091 1 21151161191261271291301331361401431471501M
Date03-Mar-9704-Mar-971 7-Mar-9731 -Mar-9703-Apr-9707-Apr-9710- Apr-9714-Apr-9717-Apr-9721 -Apr-9724-Apr-9728-Apr-9701 -May-9705-May-9708-May-9709-May-9712-May-9716-May-9720-May-9722-May-9727-May-9730-May-9731-May-97Ol-Jun-9702-Jun-9703-Jun-9705-Jun-9707-Jun-9709-Jun-9712-Jun-971 7-Jun-9720-Jun-9723-Jun-9726-Jun-9727-Jim-9730-Jun-9707-Jul-9708-Jul-9710- Jul-97I I -Jul-9714- Jul-9717- Jul-9721 -Jul-9724-Jul-9728-Jul-9731 -Jul-97
04-Aug-97
samplingevent
123
4
5
6
70(1)
1
2345678910
11
12
13141516
171819
InitialpH
83670469673174175876677378
7777.74773755782
767784782778779755
776773782
7.6753755767768768768769
74468
667
666987 16
7 5766
FinalpH
7.8176777376777
77178
77
777
78
7837.797847887797.8478
787
775778
785
7.9783
7 8784783
D.O.(mg/L)
>201713
13413413313.313112.812511.811.29410
9.89.79.29.796
>20
>2018
17915.8149146
151341299.216
>20162
16.6
9.4>20>2013.7133
Alkalinitymg/L
214027503060
3470
4330
4100
4200
3790
T ———
Cyanidemg/L
<050
SCNmg/L
273268248
215
207
9.7
16226
15.2
11.410.8108158
11,6
20
NH,mg/L
931862903
912
891
920
939995
1040
837
790772
837763847698
558
502
279298130
55.8
NO,mg/L
<050<050O50
O50
<0.50
<050
<0505.3
<25
<2.5
<5.0<10
<10<10338122
341
594
1570832873681
NO,mg/L
O50<050<050
O50
O.50
O50
O.50398
50.3
67.9
110148
106180180180
1.17
1.56
353O.51.68
O.50
Phos.mg/L
1060
TKNmg/L
1010863922
969
1180
1090
10801120
1140
1200
1030791
939847
1010921
689
568
419372168
83.7
BODmg/L
>350
CODmg/L
25001270126
932
777
497
408
230
568
(1) init iation of Long Term Extension
Phenol(4-APP)
Bg/L
439
DOCmg/L
552165
98.3
627
530
704
542
580
61.8
hard-no*Bf/L
80
BTEX•a/I*
0.1S
Lngnm2.xls

111L1-3
Elapseddays
01
142t31353842454952565963666770747880858889909192949698101106109112115116119126127129130133136140143147150154
Date03-Mar-9704-Mar-9717-Mar-9731 -Mar-9703-Apr-9707-Apr-9710- Apr-9714- Apr-971 7-Apr-9721 -Apr-9724-Apr-9728-Apr-9701 -May-9705-May-9708-May-9709-May-9712-May-9716-May-9720-May-9722-May-9727-May-9730-May-9731 -May-97Ol-Jun-9702-Jun-9703-Jun-9705-Jun-9707-Jun-9709-Jun-9712-Jun-9717.Jun-9720-Jun-9723-Jun-9726-Jun-9727-Jun-9730-Jai-9707-Jul-97OS-Jul-9710-Jul-97ll-Jul-9714-Jul-971 7-Jul-97
l-Jul-974-Jul-978-Jul-97
31-Jul-9704-Aug-97
samplingevent
123
4
5
6
70(1)
1
2345678910
11
12
13141516
171819
DissolvedAnenic
mg/L
422
572
TotalArsenic
mg/L
4.88
4.15
Tola.Ironnt/L
0.798
Phenol(GOmg/L
140<5079b
Ol
O.I
2-MethylPhenolmg/L
2221
0.14
0.1
O.I
J-MethylPhenol
mg/L
48<500.26
01
O.I
4-Meth)1Phenolmg/L
21<500.14
01
O.I
2,4-DlmethylPhenol
mg^.
63 4
O4
02
Ol
f 1) initiation
Lngtnn2.xls

uii/r-4
Elapseddavs01142831353842454952565963666770747880858889909192949698101106109112115116119126127129130133136140143147150154
Date03-Mar-9704-Mar-9717-Mar-9731 -Mar-9703-Apr-9707-Apr-9710-Apr-9714- Apr-9717-Apr-9721 -Apr-9724- Apr-9728-Apr-97Ol-Mav-9705-May-9708-Mav-9709-May-9712-May-9716-Mav-9720-Mav-9722-May-9727-May-9730-May-9731 -May-97Ol-Jun-9702-Jun-9703-Jun-9705-Jun-9707-Jun-9709-Jun-9712-Jun-9717-Jun-9720-Jun-9723-Jun-9726-Jun-9727-Jun-9730-Jun-9707-Jul-9708-Jul-9710-Jul-97ll-Jul-9714-Jul-9717-Jul-9721-Jul-9724-Jul-9728-Jul-9731-Jul-9704-Aug-97
samplingevent
123
4
5
6
70(1)
1
2345678910
11
12
13141516
171819
InitialpH
8.617.927.657.967.697.737.747.747.787.687.827.8
7.747.82
7.767.827.727.787.837.86
7.897.997.857.757.9
8.077.9
7.917.817.78
7.837.78
7.77
7.787.767.727.7
7.74
Final
7.777.797.777.78
7.73
7.84
7.86
7.87
D.O.(mg/L)
>20>20>20>20>20>20>20>20>20>20>20>20>20>20
>2019.918.819.619.2>20
>20>20>20>20>20>20>20>20>20>20
>20>20
>20
>20>2019.519.9>20
Alkalinitymg/L
337032103290
3330
4170
4030
3690
2590
Cyanidemg/L
<0.50
SCNmg/L
721879911
883
859
2200
810
817
92.9
628
98.1
NHjmg/L
269026902760
2790
2880
2470
2890
2200
2760
3060
2930
NOjmg/L
<0.50<0.50<0.50
0.5
<0.50
<0.50
<0.50
<0.5
<0.50
<0.50
<0.50
NO,mg/L
<0.50<0.500.55
<0.50
<0.50
0.54
0.59
<0.5
<0.50
<0.50
<0.50
Phos.mg/L
1040
TKNmg/L
299028002870
2800
3050
3190
3090
2960
3140
3190
4560
BODmg/L
>350
6530
CODmg/L
712064706590
7460
6690
6450
6890
10300
Phenol(4-APF)mtfL
1280
1920
(1) initiation of Long Term Extension
Lngtrm2.xls

lllLf-4
Elapseddays
01
1428.M353842454952565963666770747880858889909192949698101106109112115116119126127129130133136140143147150154
Date03-Mar-9704-Mar-9717-Mar-9731 -Mar-9703-Apr-9707-Apr-971 0-Apr-971 4-Apr-9717-Apr-9721 -Apr-9724-Apr-9728-Apr-9701 -May-9705-May-9708-May-9709-Mav-9712-May-9716-Mav-9720-May-9722-May-9727-May-9730-May-9731 -May-97Ol-Jun-9702-Jun-9703-Jun-9705-Jun-9707-Jun-9709-Jun-9712-Jun-9717-Jun-9720-Jun-9723-Jun-9726-Jun-9727-Jun-9730-Jun-9707-Jul-9708-Jul-9710-Jul-97ll-Jul-9714-Jul-9717-Jul-9721-Jul-9724-Ju!-9728-Jul-9731-Jul-97
04-Aug-97
samplingevent
123
4
5
6
70(1)
1
2345678910
11
12
13141516
171819
DOCmg/L
169016801500
2190
1810
2280
2350
1740
hard-ness
mg/L
30
BTEXmg/L
0.48
DissolvedArsenic
mg/L
14
1.75
TotalArsenic
mg/L
14.2
1.45
TotalIronmg/L
0.814
Phenol(GQmg/L
430540300
570
450
500
530
510
570
450
480
2-MethylPhenolmg/L
719048
72
52
68
82
77
70
61
66
3-MethylPhenolmg/L
153193117
200
144
146
210
200
76
71
43
4-MethylPhenolmg/L
678743
60
46
64
90
72
170
150
150
2,4-DlmethylPhenolmg/L
20<4.0<20
8.7
20
17
<40
<40
<40
<40
<40
(1) initiation
Lngtrm2.xls

H1L1O i f
Elapseddavs
01
142831353842454952565963666770747880858889909192949698101106109112115116119126127129130133136140143147150154
Dale03-Mar-9704-Mar-9717-Mar-9731-Mar-9703-Apr-9707-Apr-9710- Apr-9714-Apr-9717- Apr-9721 -.Apr-9724-Apr-9728-Apr-97Ol-Mav-9705-Mav-9708-May-9709-Mav-9712-Mav-9716-Mav-9720-May-9722-May-9727-May-9730-Mav-9731-Mav-97Ol-Jun-9702-Jun-9703-Jun-9705-Jun-9707-Jun-9709-Jun-9712-Jun-9717-Jun-9720-Jun-9723-Jun-9726-Jun-9727-Jun-9730-Jun-9707-Jul-9708-Jul-9710-Jul-97ll-Jul-9714-Jul-9717-Jul-9721-Jul-9724-Jul-9728-Jul-9731-Jul-97
04-Aug-97
samplingevent
123
4
5
6
70(1)
1
2345678910
11
12
13141516
171819
InitialpH
8.017.287.29
7.77.587.697.667.687.717.54
7.97.9
7.987.9
7857.937.777.947.787.88
7.898.067.927.727.767.87
7.97.857.827.83
7.857.88
789
7.917.897.897.877.89
FinalpH
7.757.687.83
7.77
7.9
7.8
7.74
7.87.77
7.78
V
D.O.(mg/LJ
>20>20>20>2019.818.818.918.3
1817.316.7
161616
15.515.314.614.8
14>20
>20>20>20>20>20>20>20>20>20>20
>20>20
>20
>20>20>20>20>20
Alkalinitymg/L
183021302440
2640
3060
3490
3010
2660
Cyanidemg/L
<0.50
SCNmg/L
144144109
9.42
13
5.55
13.5
NHjmg/L
442417442
480
541
465
493
270
642
707
558
NOjmg/L
<0.50<0.50<0.50
0.51
0.73
<0.50
<0.50
<0.50
<0.50
0.65
<0.50
NOjmg/L
<0.50<0.50
0.54
<0.50
<0.50
<0.50
<0.50
<0.50
<0.50
<0.50
<0.50
Phos.mg/L
1040
651
TKNmg/L
578455480
489
626
540
560
884
661
735
BODmg/L
>350
CODmg/L
1240543473
430
330
314
270
244
318
Phenol(4-APP)
ntf/L
227
(1) initiation of Long Term Extension
Lngtrm2.xls

lllLf-5
Elapseddays
01
142831353842454952565963666770747880858889909192949698101106109^112115116119126127129130133136140143147150154
Date03-Mar-9704-Mar-9717-Mar-9731 -Mar-9703-Apr-9707-Apr-9710- Apr-9714- Apr-9717- Apr-9721 -Apr-9724- Apr-9728-Apr-9701 -May-9705-May-9708-May-9709-May-9712-May-9716-May-9720-May-9722-May-9727-May-9730-May-9731 -May-97Ol-Jun-9702-Jun-9703-Jun-9705-Jun-9707-Jun-9709-Jun-9712-Jun-9717-Jun-9720-Jun-9723-Jun-9726-Jun-9727-Jun-9730-Jun-9707-Jul-9708-Jul-9710-Jul-97ll-Jul-9714-Jul-9717-Jul-9721-Jul-9724-Jul-9728-Jul-9731-Jul-97
04-Aug-97
samplingevent
123
4
5
6
70(1)
1
2345678910
11
12
13141516
171819
(1) initiation
DOCmg/L
27372.654.1
348
329
363
315
324
32.5
/harinessmg/L
30
BTEXmg/L
0.09
DissolvedArsenic
mg/L
2.11
1.72
TotalArsenicmg/L
2.8
1.55
TotalIronmg/L
0.904
/. aol(GC)mg/L
78<0.1<0.1
0.25
0.27
2-MethylPhenol
mg/L
14<0.1<0.1
<0.1
<0.1
3-MethylPhenol
mg/L
29<0.1<0.1
<0.1
<0.1
4-MethylPhenolmg/L
13<0.1<0.1
<0.1
<0.1
2,4-DbnethylPhenolmg/L
4.4<0.1<0.1
<0.1
<0.1
Lngtrm2.xls

, 111L1-O i
Elapseddavs
0!
142831353842454952565963666770747880858889909192949698101106109112115116119126127129130133136140143147150154
Date03-Mar-9704-Mar-971 7-Mar-9731 -Mar-9703-Apr-9707-Apr-9710-Apr-9714- Apr-9717-Apr-9721 -Apr-9724- Apr-9728- Apr-97Ol-Mav-9705-Mav-9708-May-9709-May-9712-May-9716-May-9720-May-9722-May-9727-May-9730-Mav-9731 -May-97Ol-Jun-9702-Jun-9703-Jun-9705-Jun-9707-Jun-9709-Jun-9712-Jun-9717-Jun-9720-Jun-9723-Jun-9726-Jun-9727-Jun-9730-Jun-9707-Jul-9708-Jul-9710-Jul-97ll-Jul-9714-Jul-9717-Jul-9721-Jul-9724-Jul-9728-Jul-9731-Jul-97
04-Aug-97
samplingevent
123
4
5
6
70(1)
1
2345678910
11
12
13141516
171819
InitialpH
7.867 197.327.617.637.8
7.817.837.847.697.97.9
7.967.9
7.867.917.787.857.83
FinalpH
7.77.667.797.87
7.8
7.83
D.O.(mg/L)
>20>20>20>20>20>20>20>20>20>20>20>20>2019.5
19.319
18.418.518.5
Alkalinitymg/L
173019102000
2320
2490
2510
Cyanidemg/L
<0.50
SCNmg/L
88.246.2
<5
6.1
5.6
<5.0
8.6
NHjmg/L
254246273
301
341
284
341
V
NOjmg/L
<O.JO<0.50<0.50
<0.50
2.61
<0.50
<0.50
NO,mg/L
<O.JO<0.50<0.50
<0.50
<0.50
<0.50
<0.50
Phot.mg/L
1070
TKNmg/L
294246273
310
370
332
379
BODmg/L
>350
CODmg/L
781277189
235
202
200
161
Phenol(4-APP)meft
129
(1 ) initiation of Long Term Extension
Page 1

Elapseddays
01
142831353842454952565963666770747880858889909192949698101106109112115116119126127129130133136140143147150154
Date03-Mar-9704-Mar-9717-Mar-9731 -Mar-9703-Apr-9707-Apr-9710-Apr-9714- Apr-971 7-Apr-9721 -Apr-9724-Apr-9728-Apr-97Ol-Mav-9705-May-9708-May-9709-May-971 2-Mav-9716-May-9720-May-9722-May-9727-May-9730-May-9731 -May-97Ol-Jun-9702-Jun-9703-Jun-9705-Jun-9707-Jun-9709-Jun-9712-Jun-9717-Jun-9720-Jun-9723-Jun-9726-Jun-9727-Jun-9730-Jun-9707-Jul-9708-Jul-9710-Jul-97ll-Jul-9714-Jul-9717-Jul-9721-Jul-9724-Jul-9728-Jul-9731-Jul-97
04-Aug-97
samplingevent
123
4
5
6
70(1)
1
2345678910
11
12
13141516
171819
(1) initiation
DOCmg/L
16457.826.8
145
223
252
/h»A-ness
mg/L
150
BTEXmg/L
0.06
DissolvedArsenic
mg/L
0.947
1.19
TotalArsenic
mg/L
1.46
1
TotalIronmg/L
0.77
< «n(GOmg/L
43<0.1<0.1
0.5
1.1
2-MethylPhenolmg/L
8.1<0.1<0.1
<0.1
1.2
3-MethylPhenol
mg/L
15.4<0.1<0.1
<0.1
0.202
4-MethylPhenolmg/L
7.6<0.1<0.1
<0.1
0.98
2,4-DtanethylPhenolmg/L
3<0.1<0.1
<0.1
<0.1
Page 2

Elapseddays
01
142831353842454952565963666770747880858889909192949698101106109112115116119126127129130133136140143147150154
Date03-Mar-9704-Mar-9717-Mar-9731 -Mar-9703-Apr-9707-Apr-9710-Apr-9714- Apr-9717- Apr-9721 -Apr-9724-Apr-9728-Apr-9701 -May-9705-May-9708-Mav-9709-May-9712-Mav-9716-Mav-9720-May-9722-Mav-9727-May-9730-Mav-9731 -May-97Ol-Jun-9702-Jun-9703-Jun-9705-Jun-9707-Jun-9709-Jun-9712-Jun-9717-Jun-9720-Jun-9723-Jun-9726-Jun-9727-Jun-9730-Jun-9707-Jul-9708-Jul-9710-Jul-97ll-Jul-9714-Jul-9717-Jul-9721-Jul-9724-Jul-9728-Jul-9731-Jul-97
04-Aug-97
samplingevent
123
4
5
6
70 ( 1 )
1
2345678910
11
12
13141516
1718
InitialpH
7867.197.327.617.63
7.87.817.837.847.697.97.9
7.967.9
7.867.917.787.85783
19 ||
FinalpH
7.77.667.797.87
7.8
7.83
\
D.O.(mg/L)
>20>20>20>20>20>20>20>20>20>20>20>20>2019.5
19.319
18.418.518.5
Alkalinitymg/L
173019102000
2320
2490
2510
Cyanidemg/L
<0.50
SCNmg/L
88.246.2
<5
6.1
5.6
<5.0
8.6
NHjmg/L
254246273
301
341
284
341
NOjmg/L
<0.50<0.50<0.50
<0.50
2.61
<0.50
<0.50
NO,mg/L
<0.50<0.50<0.50
<0.50
<0.50
<0.50
<0.50
Phos.mg/L
1070
TKNmg/L
294246273
310
370
332
379
BODmg/L
>350
(1 ) initiation of Long Term Extension
CODmg/L
781277189
235
202
200
161
Phenol(4-APP)
mg/L
129
Page 1

Elapseddays
01142831353842454952565963666770747880858889909192949698101106109112115116119126127129130133136140143147150154
Date03-Mar-9704-Mar-9717-Mar-9731 -Mar-9703-Apr-9707-Apr-9710-Apr-9714- Apr-971 7-Apr-9721 -Apr-9724-Apr-9728-Apr-9701 -May-9705-Mav-9708-May-9709-May-9712-May-97I6-May-9720-May-9722-Mav-9727-May-9730-May-9731 -May-97Ol-Jun-9702-Jun-9703-Jun-9705-Jun-9707-Jun-9709-Jun-9712-Jun-9717-Jun-9720-Jun-9723-Jun-9726-Jun-9727-Jun-9730-Jun-9707-Jul-9708-Jul-9710-Jul-97l l -JuI-9714-Jul-9717-Jul-9721-Jul-9724-Jul-9728-Jul-9731-Jul-97
04-Aug-97
samplingevent
123
4
5
6
70(1)
1
2345678910
11
12
13141516
171819
DOCmg/L
16457.826.8
145
223
252
/hart,nessmg/L
150
BTEXmg/L
0.06
DissolvedArsenic
mg/L
0.947
1.19
TotalArsenic
mg/L
1.46
1
TotalIronmg/L
0.77
-( -1(GOmg/L
43<0.1<0.1
0.5
1.1
2-MethyiPhenolmg/L
8.1<0.1<0.1
<0.1
1.2
3-MethylPhenolmg/L
15.4<0.1<0.1
<0.1
0.202
4-MethvlPhenolmg/L
7.6<0.1<0.1
<0.1
0.98
2,4-DimethylPhenolmg/L
3<0.1<0.1
<0.1
<0.1
(1) initiation
Page 2

lllLT-6n
Elapseddavs
01
142831353842454952565963666770747880858889909192949698101106109112115116119126127129130133136140143147150154
Date03-Mar-9704-Mar-9717-Mar-973 1 -Mar-9703-Apr-9707-Apr-9710-Apr-971 4-Apr-9717- Apr-9721 -.Apr-9724- Apr-9728-Apr-97Ol-Mav-9705-May-9708-Mav-9709-May-9712-Mav-9716-Mav-9720-Mav-9722-Mav-9727-Mav-9730-Mav-9731 -May-97Ol-Jun-9702-Jun-97
^03-Jun-9705-Jun-9707-Jun-9709-Jun-9712-Jun-9717-Jun-9720-Jun-9723-Jun-9726-Jun-9727-Jun-9730-Jun-9707-Jul-9708-Jul-9710-Jul-97l l-Jul-9714-Jul-9717-Jul-9721-Jul-9724-Jul-9728-Jui-9731-Jul-97
04-Aug-97
samplingevent
123
4
5
6
70(1)
1
2345678910
11
12
13141516
171819
Initial_PH
8.2
8.157997.937.827.727.877.917.887.877.87
7.927.9
7.9
7.927.917.87
7.87.226 84
7.08
FinalpH
7.86
7.867.857.79
7.84
7.787.81
7.8
——————— }
D.O.(mg/L)
>20
>20>20>20>20>20>20>20>20>20>20
>20>20
>20
>20>20>20>20>2014.7
14.1
Alkalinitymg/L
2230
Cyanidemg/L
SCNmg/L
NH,mg/L
195
363
363
400
326
NOjmg/L
<0.5
<0.50
<0.50
<0.50
<0.50
NOjmg/L
<0.5
<0.50
<0.50
<0.50
<0.50
Phos.mg/L
TKNmg/L
419
400
419
530
437
BODmg/L
CODmj/L
779
232
Phenol(4-APP)
mf/L
(1) initiation of Long Term F.xtension
Lngtrm2.xls

Elapseddays
01
1428313538424549525659636667707478808588899091929496981011061091121151161191261271291.30133136140143147150154
Date03-Mar-9704-Mar-9717-Mar-973 1 -Mar-9703-Apr-9707-Apr-9710- Apr-9714-Apr-9717-Apr-9721 -Apr-9724- Apr-9728-Apr-97Ol-Mav-9705-Mav-9708-Mav-9709-May-9712-Mav-9716-Mav-9720-May-9722-May-9727-May-9730-May-9731 -May-97Ol-Jun-9702-Jun-9703-Jun-9705-Jun-9707-Jun-9709-Jun-9712-Jun-9717-Jun-9720-Jun-9723-Jun-9726-Jun-9727-Jun-9730-Jun-9707-Jul-9708-Jul-9710-Jul-97l l - Ju l -9714-Jul-9717-Jul-9721-Jul-9724-Jul-9728-Jul-9731-Jul-97
04-Aug-97
samplingevent
123
4
5
6
70(1)
1
2345678910
11
12
13141516
171819
DOCmg/L
245
23.5
/h«Aness
mg/LBTEXmg/L
DissolvedArsenic
mg/L
TotalArsenic
mg/L
TotalIron
mg/L
/' ao\
(GC)mg/L
2-MethylPhenol
mg/L
3-MethylPhenol
mg/L
4-MethylPhenol
mg/L
2,4-DbnethylPhenol
mg/L
(1) initiation
Lngtrm2.xls

mi-*i
Elapseddavs
0I
142831353842454952565963666770747880858889909192949698101106109112115116119126127129130133136140143147150154
Date03-Mar-9704-Mar-9717-Mar-9731 -Mar-9703-Apr-9707-Apr-9710- Apr-9714- Apr-9717-Apr-9721 -Apr-9724-Apr-9728-Apr-97Ol-Mav-9705-Mav-9708-Mav-9709-Mav-971 2-Mav-9716-Mav-9720-Mav-9722-Mav-9727-Mav-9730-Mav-9731-Mav-97Ol-Jun-9702-Jun-9703-Jun-9705-Jun-9707-Jun-9709-Jun-9712-Jun-9717-Jun-9720-Jun-9723-Jun-9726-Jun-9727-Jun-9730-Jun-9707-Jul-9708-Jul-9710-Jul-97ll-Jul-9714-Jul-9717-Jul-9721-Jul-9724-Jul-9728-Jul-9731-Jul-97
04-Aug-97
samplingevent
123
4
5
6
70(1)
1
2345678910
11
12
13141516
171819
InitialpH
7.23
7.017.097.347.447.56
7.67.817.847.83
FinalpH
7.8
7.77.847.757.857.877.84
D.O.(mg/L)
>20
>20>20>20>20>20>20>20>20>20
Alkalinitymg/L
1960
Cyanidemg/L
SCNmg/L
NHjmg/L
190
114
<9.4<9.4<9.4<9.4
<9.4
... {
NO,mg/L
<10
12.4
<2578.2282289
260
NO2mg/L
143
217
280197
<0.50<0.50
0.72
Phos.mg/L
TKNmg/L
288
186
<9.4<9.4<9.4<9.4
18.6
(1) initiation of Long Term Extension
BODmg/L
CODmg/L
280
Phenol(4-APP)
raf/L
Lngtrm2.xls

Elapseddays
01
142831353842454952565963666770747880858889909192949698101106109112115116119126127129130133136140143147150154
Date03-Mar-9704-Mar-9717-Mar-9731 -Mar-9703-Apr-9707-Apr-9710- Apr-9714- Apr-9717- Apr-9721 -Apr-9724-Apr-9728-Apr-9701 -May-9705-May-9708-Mav-9709-May-9712-May-9716-May-9720-May-9722-May-9727-May-9730-May-9731 -May-97Ol-Jun-9702-Jun-9703-Jun-9705-Jun-9707-Jun-9709-Jun-9712-Jun-9717-Jun-9720-Jun-9723-Jun-9726-Jun-9727-Jun-9730-Jun-9707-Jul-9708-Jul-9710-Jul-97l l - Ju l -9714-Jul-9717-Ju!-9721-Jul-9724-Jul-9728-Jul-9731-Jul-97
04-Aug-97
samplingevent
123
4
5
6
70(1)
1
2345678910
11
12
13141516
171819
DOCmg/L
188
/h«Vness
mg/LBTEXmg/L
DissolvedArsenic
mg/L
TotalArsenic
mg/L
TotalIronmg/L
yI iol
(GC)mg/L
2-MethylPhenolmg/L
3-MethylPhenolme/L
4-MethyIPhenolmg/L
2,4-DimethylPhenolmg/L
(1) initiation
Lngtrm2.xls

U1L1-/ .
Elapseddavs
01
142831353842454952565963666770747880858889909192949698101106109112115116119126127129130133136140143147150154
Date03-Mar-9704-Mar-9717-Mar-9731 -Mar-9703-Apr-9707-Apr-97iO-Apr-9714- Apr-9717- .Apr-9721 -.Apr-9724-Apr-9728-Apr-97Ol-Mav-9705-Mav-9708-Mav-9709-May-9712-Mav-9716-Mav-9720-Mav-9722-Mav-9727-Mav-9730-Mav-9731-Mav-97Ol-Jun-9702-Jun-9703-Jun-9705-Jun-9707-Jun-9709-Jun-9712-Jun-9717-Jun-9720-Jun-9723-Jun-9726-Jun-9727-Jun-9730-Jun-9707-Jul-9708-Jul-9710-Jul-97ll-Jul-9714-Jul-9717-Jul-9721-Jul-9724-Jul-9728-Jul-9731-Jul-97
04-Aug-97
samplingevent
123
4
5
6
70 ( 1 )
1
2345678910
1 1
12
1314
. 1516
171819
InitialpH
8.247.827.758.047.627.147.257.497.627.567.867.867.897.84
7.787.827.79
87.717.81
7.827.987.877.787.757.89
7.97.9
7.877.86
7.947.89
7.89
7.917.847.797.757.73
FinalpH
7.74
7.8
7.727.687.837.797.84
7.71
7.83
D.O.(mg/L)
>20>20>20>20>2011.314.8
14.514.613.913.513.313.2
13.212.712.312.812.3>20
>20>20>20>20>20>20>20>20>20>20
>20>20
>20
>20>20>20>20>20
t
Alkalinitymg/L
198019501960
2540
3160
3390
3220
2820
Cyanidemg/L
<0.50
SCNmg/L
212216222
220
212
220
216
224
226
245
235
NHjmg/L
687664706
687
711
635
787
540
744
875
782
VNOjmg/L
<0.50<0.50<0.50
0.52
<0.50
0.52
<0.50
<0.5
<0.50
<0.50
<0.50
NO,mg/L
<0.50<0.50<0.50
<0.50
<0.50
<0.50
0.53
<0.5
0.83
<0.50
0.73
Phot.mg/L
1110
TKNmg/L
759823724
762
796
796
863
921
884
903
1040
BODmg/L
>350
CODme/L
182018001820
1090
958
953
898
786
896
Phenol(4-APP)rnt/L
338
( 1 ) initiation of Long Term Extension
Lngtrm2.xls

UlLf-7
Elapseddavs
0I
142831353842454952565963666770747880858889909192949698101106109112115116119126127129130133136140143147150154
Date03-Mar-9704-Mar-9717-Mar-9731-Mar-9703-Apr-9707-Apr-9710- Apr-9714- Apr-9717-Apr-9721 -Apr-9724-Apr-9728-Apr-97Ol-Mav-9705-May-9708-Mav-9709-May-9712-Mav-9716-May-9720-May-9722-May-9727-May-9730-Mav-9731 -May-97Ol-Jun-9702-Jun-9703-Jun-9705-Jun-9707-Jun-9709-Jun-9712-Jun-9717-Jun-9720-Jun-9723-Jun-9726-Jun-9727-Jun-9730-Jun-9707-Jul-9708-Jul-9710-Jul-971 l-Jul-9714-Jul-97I7-Jul-9721-Jul-9724-Jul-9728-Jul-9731-Jul-97
04-Aug-97
samplingevent
123
4
5
6
70(1)
1
2345678910
11
12
13141516
171819
DOCmg/L
388390578
420
425
614
456
503
127
/harkness
mg/L
60
BTEXmg/L
0.13
DissolvedArsenicmg/L
3.78
3.94
TotalArsenicmg/L
4.65
2.07
TotalIronmg/L
0.962
-i s-i(GC)mg/L
130ISO64b
1.1
2.2
0.98
<1
2-MethylPhenolmg/L
202311
16
16
14
13
3-MethylPhenolmg/L
445026
<1.0
<1.0
<1.2
<1
4-MethylPhenolmg/L
202211
<0.1
<0.1
<1.2
<1
2,4-DimethylPhenolmg/L
6.16.6
<10
3.1
2
2.4
2.3
(1) initiation
Lngtrrn2.xls
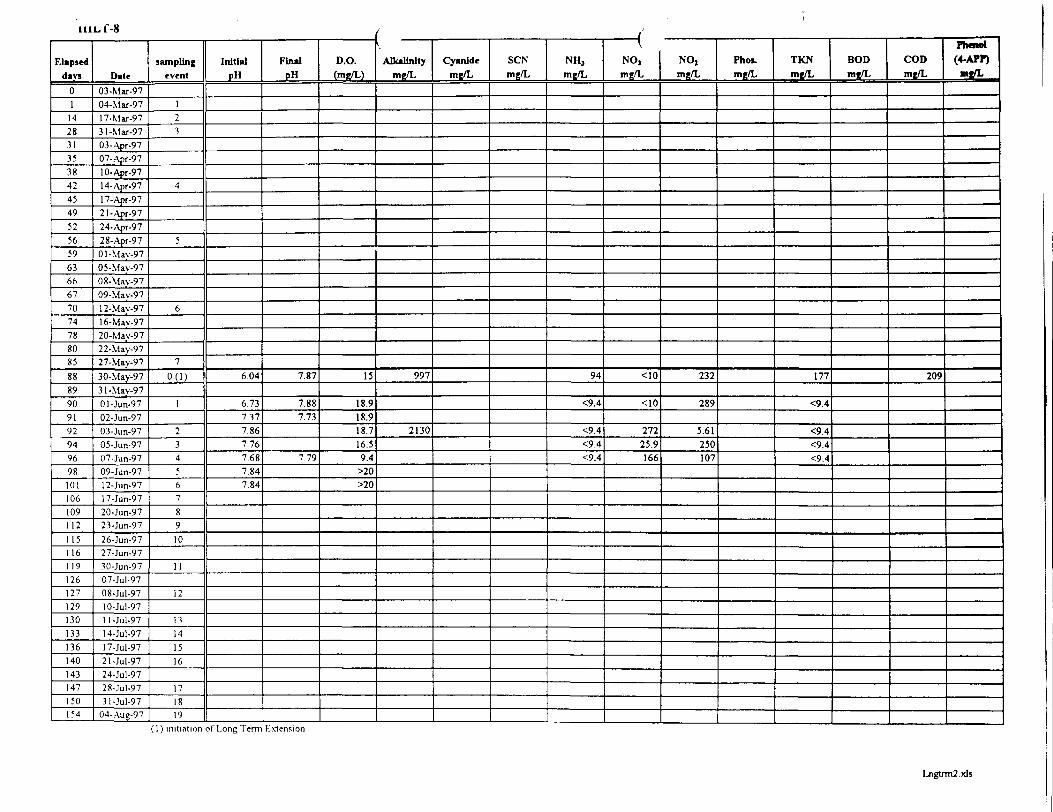
lllLf-8
Elapseddavs
01
1428313538424549525659636667707478808588899091929496981011061091 1 2115116119126127129130133136140143147150154
Date03-Mar-9704-Mar-9717-Mar-9731 -Mar-9703-Apr-9707-Apr-9710- Apr-9714- Apr-9717- Apr-9721 -Apr-9724- Apr-9728-Apr-97Ol-Mav-9705-Mav-9708-Mav-9709-May-9712-Mav-9716-Mav-9720-Mav-9722-Mav-9727-Mav-9730-Mav-9731-Mav-97Ol-Jun-9702-Jun-9703-Jun-9705-Jun-9707-Jun-9709-Jun-9712-Jun-9717-Jun-9720-Jun-9723-Jun-9726-Jun-9727-Jun-9730-Jun-9707-Jul-9708-Jul-9710-Jul-97ll-Jul-9714-Jul-9717-Jul-9721-M-9724-Jul-9728-Jul-9731-Jul-97
04-Aug-97
samplingevent
123
4
5
6
70(1 )
1
2345678910
11
12
13141516
171819
InitialpH
6.04
6.737.377.867.767.687.847.84
FinalpH
7.87
7.887.73
7.79
D.O.(mg/L)
15
18.918.918.716.59.4
>20>20
Alkalinitymg/L
997
2130
Cyanidemg/L
SCNmg/L
NHjmg/L
94
<9.4
<9.4<9.4<9.4
VNOjmg/L
<10
<10
27225.9166
NO,mg/L
232
289
5.61250107
Phos.mg/L
TKNmg/L
177
<9.4
<9.4<9.4<9.4
BODmg/L
CODmg/L
209
Phenol(4-APP)
mc/L
( 1 ) initiation of Long Term Extension
Lngtrm2.xls

UlL 1-8
Elapseddays
01
142831353842454952565963666770747880858889909192949698101106109112115116119126127129130133136140143147150154
Date03-Mar-9704-Mar-9717-Mar-9731 -Mar-9703-Apr-9707-Apr-9710-Apr-9714- Apr-971 7-Apr-9721 -Apr-9724- Apr-972 8- Apr-9701 -Mav-9705-May-9708-Mav-9709-May-9712-Mav-9716-Mav-9720-Ma\-9722-Mav-9727-May-9730-May-9731 -Mav-97Ol-Jun-9702-Jun-9703-Jun-9705-Jun-9707-Jun-9709-Jun-97!2-Jun-9717-Jun-9720-Jun-9723-Jun-9726-Jun-9727-Jun-9730-Jun-9707-Jul-9708-Jul-9710-Jul-97ll-Jul-9714-Jul-9717-Jul-9721-Jul-9724-Jul-9728-Jul-9731-Jul-97
04-Aug-97
samplingevent
123
4
5
6
70(1)
1
2345678910
11
12
13141516
171819
(1) initiation
DOCmg/L
21
/hardness
mg/LBTEXmg/L
DissolvedArsenic
mg/L
TotalArsenic
mg/L
TotalIronmg/L
-( .oTl(GC)mg/L
2-MethytPhenolmg/L
3-MethylPhenolmg/L
4-MethylPhenolmg/L
2,4-DtmethylPhenolmg/L
Lngtrm2.xls

U1LT-9
Elapseddavs
01
142831353842454952565963666770747880858889909192949698101106109112115116119126127129130133136140143147150154
Date03-Mar-9704-Mar-9717-Mar-9731 -Mar-9703-Apr-9707-Apr-9710- Apr-9714- Apr-971 7-Apr-9721 -Apr-9724- Apr-9728-Apr-97Ol-Mav-9705-May-9708-Mav-9709-Mav-9712-Mav-9716-Mav-9720-Mav-9722-Mav-9727-May-9730-May-9731-Mav-97Ol-Jun-9702-Jun-9703-Jun-9705-Jun-9707-Jun-9709-Jun-9712-Jun-9717-Jun-9720-Jun-9723-Jun-9726-Jun-9727-Jun-9730-Jun-9707-Jul-9708-Jul-9710-Jul-97l l-Jul-9714-Jul-9717-Jul-9721-Jul-9724-Jul-9728-Jul-9731-JuI-97
04-.Aug-97
samplingevent
123
4
5
6
70(1)
1
2345678910
11
12
13141516
171819
Initial
7.07
7.237.397.837.777.717.7
7.68
FinalpH
7.89
7.847.84
D.O.(mg/L)
>20
>20>20>20>20>20>20>20
Alkalinitymg/L
2330
Cyanidemg/L
SCNmg/L
NHjmg/L
28
<9.4
<9.4<9.4
—— vNOjmg/L
<10
9.67
13049.7
NO,mg/L
116
132
6.1472.3
Phos.mg/L
TKNmg/L
65.1
<9.4
<9.4<9.4
BODmg/L
CODmg/L
219
Phenol(4-APP)
mc/L
( 1 ) initiation of Long Term Extension
Lngtrm2.xls

IHlLf-9
Elapseddavs
01
142831353842454952565963666770747880858889909192949698101106109112115116119126127129130133136140143147150154
Date03-Mar-9704-Mar-971 7-Mar-9731 -Mar-9703-Apr-9707-Apr-971 0-Apr-9714- Apr-9717- Apr-9721 -Apr-9724- Apr-972 8- Apr-9701 -May-9705-Mav-9708-Mav-9709-Mav-971 2-Mav-9716-Mav-9720-May-9722-Mav-9727-May-9730-May-9731 -May-97Ol-Jun-9702-Jun-9703-Jun-9705-Jun-9707-Jun-9709-Jun-9712-Jun-9717-Jun-9720-Jun-9723-Jun-9726-Jun-9727-Jun-9730-Jun-9707-Jul-9708-Jul-9710-Jul-97ll-Jul-9714-Jul-9717-Jul-9721-Jul-9724-Jul-9728-Jul-9731-Jul-97
04-Aug-97
samplingevent
123
4
5
6
70(1)
1
2345678910
11
12
13141516
171819
DOCmg/L
156
nessmg/L
BTEXmg/L
DissolvedArsenic
mg/L
TotalArsenic
mg/L
TotalIronmg/L
i . -10!(GC)mg/L
2-MethylPhenolmg/L
3-MethylPhenolmg/L
4-MethylPhenolmg/L
2,4-DlmethylPhenolmg/L
(1) initiation
Lngtrm2.xls

Elapseddavs
01142831353842454952565963666770747880858889909192949698101106109112115116119126127129130133136140143147150154
Date03-Mar-9704-Mar-97!7-Mar-9731-Mar-9703-Apr-9707-.Apr-9710-Apr-9714-Apr-9717-Apr-9721 -.Apr-9724- Apr-9728-Apr-97Ol-Mav-9705-Mav-9708-Mav-9709-Mav-9712-Mav-9716-Mav-9720-Mav-9722-Mav-9727-Mav-9730-Mav-9731-Mav-9701 -Jun-9702-Jun-9703-Jun-9705-Jun-9707-Jun-9709-Jun-9712-Jun-9717-Jun-9720-Jun-9723-Jun-9726-Jun-9727-Jun-9730-Jtm-9707-Jul-9708-Jul-9710-Jul-97l l - Ju l -9714-Jul-9717-Jul-9721-Jul-9724-Jul-9728-Jul-9731-Jul-97
04-Aug-97
samplingevent
123
4
5
6
70(1)
1
2345678910
11
12
13141516
171819
InitialpH
6.17
6.176.566.937.127.527.677.88
FinalpH
7.82
7.887.847.877.877.797.87
D.O.(mg/L)
>20
15.57.4
>2016
>20>2018.6
Alkalinitymg/L
,
1030
2160
Cyanidemg/L
SCNmg/L
NHjmg/L
502
279
<9.4<9.4<9.4<9.4
(NOjmg/L
<10
60
617<25<25<25
NOjmg/L
271
371
12.9666685650
Phos.mg/L
TKNmg/L
568
428
<9.4<9.4<9.4<9.4
BODmg/L
CODmg/L
257
Phenol(4-APF)
mc/L
( 1 ) init iation of Long Term F.xtension
Lngtnn2.xls

niL.T-10
Elapseddays
01
142831353842454952565963666770747880858889909192949698101106109112115116119126127129130133136140143147150154
Date03-Mar-9704-Mar-9717-Mar-9731 -Mar-9703-Apr-9707-Apr-9710-Apr-9714-Apr-9717-Apr-9721 -Apr-9724- Apr-9728- Apr-97Ol-Mav-9705-Mav-9708-Mav-9709-May-9712-May-9716-May-9720-Mav-9722-Mav-9727-May-9730-May-9731 -May-97Ol-Jun-9702-Jun-9703-Jun-9705-Jun-9707-Jun-9709-Jun-9712-Jun-9717-Jun-9720-Jun-9723-Jun-9726-Jun-9727-Jun-9730-Jun-9707-Jul-9708-Jul-9710-Jul-97ll-Jul-9714-Jul-9717-Jul-9721-Jul-9724-Jul-9728-Jul-9731-Jul-97
04-Aug-97
samplingevent
123
4
5
6
70(1)
1
2345678910
11
12
13141516
171819
(1 ) initiation
DOCmg/L
23.2
/h«n.ness
mg/LBTEXmg/L
DissolvedArsenic
mg/L
TotalArsenic
mg/L
TotalIronmg/L
•< j-i~noi(GC)mg/L
2-MethylPhenolmg/L
3-MethylPhenolmg/L
4-MethylPhenolmg/L
2,4-DimethylPhenolmg/L
Lngtrm2.xls

Elapseddavs
01
142831353842454952565963666770747880858889909192949698101106109112115116119126127129130133136140143147150154
Date03-Mar-9704-Mar-9717-Mar-9731 -Mar-9703-Apr-9707-Apr-9710-Apr-9714- Apr-9717- Apr-9721 -Apr-9724-Apr-9728-Apr-97Ol-Mav-9705-Mav-9708-Mav-9709-Mav-9712-Mav-9716-Mav-9720-Mav-9722-Mav-9727-Mav-9730-Mav-9731-Mav-97Ol-Jun-9702-Jun-9703-Jun-9705-Jun-9707-Jun-9709-Jun-9712-Jun-9717-Jun-9720-Jun-9723-Jun-9726-Jun-9727-Jun-9730-Jun-9707-Jul-9708-Jul-9710-Jul-97ll-Jul-9714-Jul-9717-Jul-9721-Jul-9724-Jul-9728-Jul-9731-Jul-97
04-Aug-97
samplingevent
123
4
5
6
7
0 ( 1 )
1
2345
678910
11
12
13141516
171819
(1) ini t ia t ion
InitialpH
7.1
77.317.547.45
7.67.346.947.357.617.76
)f!.ong Fern
FinalpH
7.84
7.837.857.857.827.877.8
7.727.847.877.81
Extension
D.O.(mg/L)
0.47
13.818.2>2016.414.45.3
>20>20>2017.9
v —Alkalinity
mg/L
<508
2720
Nitratemg/L
0.81
35.7
85<5<5
<1010.3<10<1033.2
Nitritemg/L
3.9
35.6
9.5198.4118216253123309242
Ammoniamg/L
275
223
228186251
83.7<9.4<9.437.2<9.4
———— \TKNmg/L
419
335
344307391288
<9.4<9.4130
<9.4
Total Nj(Calc)mg/L
467
439405509504265123439275
SCN(«sN)mg/L
43
00
SCNmg/L
179
124
<5<5<5
5.65<5<5<5
CODmg/L
694
348
DOCmg/L
210
250
Phenol(GC)mg/L
O.I
.058bO.O.O.<0.<Q
^0<Q
(b)
Lngtrm2.xls

/ /Elapsed
days01142831353842454952565963666770747880858889909192949698101106109112115116119126127129130133136140143147150154
V
Date03-Mar-9704-Mar-9717-Mar-9731 -Mar-9703-Apr-9707-Apr-9710-Apr-9714- Apr-9717- Apr-9721 -Apr-9724-Apr-9728-Apr-9701 -May-9705-May-9708-May-9709-May-9712-May-9716-May-9720-May-9722-May-9727-May-9730-May-9731 -May-97Ol-Jun-9702-Jun-9703-Jun-9705-Jun-9707-Jun-9709-Jun-9712-Jun-9717-Jun-9720-Jun-9723-Jun-9726-Jun-9727-Jun-9730-Jun-9707-JuI-9708-Jul-9710-Jul-97ll-Jul-9714-JuI-9717-Jul-9721-Jul-9724-Jul-9728-Jul-9731-Jul-97
04-Aug-97
samplingevent
123
4
5
6
70(1)
1
2345678910
11
12
13141516
171819
2-MethylPhenolmg/L
<0.1
<0.1<0.1<0.1<0.1<0.1<0.1<0.1<0.1
3-MethylPhenolmg/L
<0.1 j
<0.1<0.1<0.1<0.1<0.1<0.1<0.1<0.1
Potential false positive
4-Mei.Phenolmg/L
<0.1
<0.<0.<0.<0.<0.<0.<0.<0.
,4-DlmethyPhenolmg/L
<0.1
<0.1<0.1<0.1<0.1<0.1<0.1<0.1<0.1
(1) initiation
Lngtrm2.xls

APPENDIX C
BIOKINETIC EVALUATION OF INDIVIDUAL PHASE III BATCH TESTS
P \fxo)*clsYM*ukagantoMt*b chg
FlUOR DANIEL GTI

Appendix C: Biokinetic Evaluation of Individual Phase III Batch Tests
Table of Contents
C. 1 Introduction . . . . . . . . . . . . . . . . . . . . . . . . . . . . . . . . . . . . . . . . . . . . . . . . . . . . . . . . . . . . . . 1
C.2 Substrate Kinetics and Previously Defined Substrate Interactions . . . . . . . . . . . . . . . . . . . . 1
C.3 Non-Matrix Batch Test Results . . . . . . . . . . . . . . . . . . . . . . . . . . . . . . . . . . . . . . . . . . . . . . . 3C.3.a Batch Test IIIST-1 (ammonia alone) . . . . . . . . . . . . . . . . . . . . . . . . . . . . . . . 4C.3.b Batch Test IIIST-2 (ammonia and phenol) . . . . . . . . . . . . . . . . . . . . . . . . . . 4C.3.C Batch Test IIIST-8 (ammonia and thiocyanate) . . . . . . . . . . . . . . . . . . . . . . . 5C.3.d Batch Test IIIST-3 (ammonia, phenol, and thiocyanate) . . . . . . . . . . . . . . . . 6C.3.e Batch Tests HILT-8 and IIIST-3D (biomass assays) . . . . . . . . . . . . . . . . . . . 8C.3.f Summary of Non-Matrix Batch Tests . . . . . . . . . . . . . . . . . . . . . . . . . . . . . . 9
_^.4 Matrix Batch Test Results . . . . . . . . . . . . . . . . . . . . . . . . . . . . . . . . . . . . . . . . . . . . . . . . . . . 9C.4.a Batch Tests IHST-6 and IIILT-6 (5 and 10 percent solutions . . . . . . . . . . . . 9C.4.b Batch Tests IIIST-5 and HIST-5i (10 percent solution) . . . . . . . . . . . . . . . . 11C.4.c Batch Test IIILT-61 (10 percent solution) . . . . . . . . . . . . . . . . . . . . . . . . . . 12C.4.d Batch Test HILT-2 (16 percent solution) . . . . . . . . . . . . . . . . . . . . . . . . . . . 13C.4.e Batch Test IIILT-1 (25 percent solution) . . . . . . . . . . . . . . . . . . . . . . . . . . . 13C.4.f Batch Test IIILT-3 (33 percent solution) . . . . . . . . . . . . . . . . . . . . . . . . . . . 14C.4.g Batch Test: IIILT-4 (100 percent solution) . . . . . . . . . . . . . . . . . . . . . . . . . 15C.4.h Matrix Time Factors . . . . . . . . . . . . . . . . . . . . . . . . . . . . . . . . . . . . . . . . . . 15
C.5 Summary . . . . . . . . . . . . . . . . . . . . . . . . . . . . . . . . . . . . . . . . . . . . . . . . . . . . . . . . . . . . . . . 15
C.6 References . . . . . . . . . . . . . . . . . . . . . . . . . . . . . . . . . . . . . . . . . . . . . . . . . . . . . . . . . . . . . . 17
C.7 Tables . . . . . . . . . . . . . . . . . . . . . . . . . . . . . . . . . . . . . . . . . . . . . . . . . . . . . . . . . . . . . . . . . . 18
C.8 Figures . . . . . . . . . . . . . . . . . . . . . . . . . . . . . . . . . . . . . . . . . . . . . . . . . . . . . . . . . . . . . . . . . 24

f • -^7Ks+ S + -rr-
N
in which S is the substrate concentration (mgs/L), t is time (days), Qmax is the maximum specificsubstrate utilization rate coefficient (mg,/(mgx«day), X is the active biomass concentration able tobiodegrade the substrate (mgj/L), Ks is the Monod or half- velocity coefficient (mgs/L), and Kt is theHaldane inhibition coefficient (mgs/L). Literature values of self-inhibitory kinetic parameters forammonia, phenol, and thiocyanate can be obtained from Gee et al. (1990), S£ez and Rittmann (1993),and Neufeld et al. (1981), respectively. It should be noted that Neufeld et al. (1981) described the self-inhibition of thiocyanate by a non-Haldane kinetic expression, which did not fully capture the degreeof thiocyanate self-inhibition observed during the Phase III batch tests. A Haldane expression for theaerobic biodegradation of thiocyanate was developed based on curve fitting the experimental data andon the values of qmax, Y (true yield, mgx/mgs), and KS reported by Neufeld et al. (1981). The self-inhibitory nature of a substrate can be observed by the increasing lag times observed when a series ofotherwise similar batch tests have increasing initial substrate concentrations. The phenomena ofincreased lag times with increasing initial thiocyanate concentrations is illustrated in Figure C-l. Asimilar approach was used to determine appropriate KI values for phenol and ammonia, based on thePhase I, II, and III batch tests. The Haldane kinetic parameters used in this evaluation of the Phase IIIbatch tests are provided in Table C-3. A comparison of the specific growth rates for ammoniaoxidizers, phenol degraders, and thiocyanate degraders is provided in Figure C-2. The specific growthrate is defined by the following equation:
--^=-K + S + - -
in which \i is the specific growth rate (I/day).
The literature indicates that three major interactions exist among nitrification, phenolbiodegradation, and thiocyanate biodegradation. As illustrated in Figure C-3, the three previouslydefined interactions are:
1 . the aerobic biodegradation of thiocyanate releases ammonia nitrogen, which is the initialsubstrate in nitrification (Luthy and Jones, 1980);
2. phenol is a strong non-competitive inhibitor of nitrification (Neufeld et al. , 1980); and
3. thiocyanate is a weak inhibitor of aerobic phenol biodegradation, and it has been describedeither as competitive inhibition (Neufeld and Valiknac, 1979) or as non-competitiveinhibition (Kumaran and Paruchuri, 1997).
The aerobic biodegradation of thiocyanate can be represented by the following mass balanceequation (Neufeld et al., 1981):
SCN- + 2 H20 + 2 02 - C02 + SO42" + NH4
+ (C-3)
Thus, each mg/L of thiocyanate degraded releases 0.24 mg/L of ammonia nitrogen. In the Phase IIIbatch tests inoculated with both nitrifiers and heterotrophs, the ammonia nitrogen released by thethiocyanate degraders can be oxidized to nitrite and nitrate by the nitrifiers.
C-2

The non-competitive inhibition of Nitrosomonas activity by phenol can be described by thefollowing equation (Neufeld etal., 1980):
dSN i 4.4dt 4.4 + SN
(C-4)
in which SN is the ammonia nitrogen concentration (mg N/L), XN is the active Nitrosomonas biomassconcentration (mgx/L), S? is the phenol concentration (mg/L), and the remaining kinetic coefficientsare for the oxidation of ammonia nitrogen to nitrite nitrogen by Nitrosomonas. In non-competitiveinhibition, increasing the concentration of the inhibitor (phenol) effectively decreases the value of theqmax,N- The degree of inhibition is independent of substrate concentration (ammonia nitrogen). FigureC-4 illustrates the decrease in qmax for ammonia nitrogen oxidation as a function of phenolconcentration based on equation (C-4). The correlation of Neufeld et al. (1980) indicates that a phenolconcentration of 100 mg/L reduces the rate of Nitrosomonas activity by about 70 percent.
The relatively weak inhibition of phenol degradation by thiocyanate has been described interms of either competitive inhibition (Neufeld and Valiknac, 1979) or non-competitive inhibition(Kumaran and Paruchuri, 1997). The two reported descriptions of the inhibition of phenolbiodegradadon are compared in Figure C-5. At 100 mg/L of phenol, the reported competitive and non-competitive models predict virtually the same phenol utilization rates. However, at 10 mg/L phenol,the compeddve model predicts a greater extent of inhibition than does the non-competitive model.The competitive inhibition approach of Neufeld and Valiknac (1979) was used in describing the PhaseIII batch test results, because it had the potential to predict the greatest degree of inhibition. Thekinetic expression used to describe competitive inhibition of phenol biodegradadon by thiocyanatehad the following form (Neufeld and Valiknac, 1979) :
dt ( JS^\ S^+ ~L26~ + S p + ¥7
in which Sp is the phenol concentration (mg/L), ST is the thiocyanate concentration (mg/L), and theother kinetic parameters are for phenol.
C.3 Non-Matrix Batch Test ResultsThe Phase III short-term batch tests contained only combinations of ammonia, phenol, and
thiocyanate in laboratory water (i.e., no groundwater from monitoring well MW-7D was used) andoffered the opportunity to verify the ability of the kinetic coefficients listed in Table 5-3 and of amechanistic microbial growth model to describe substrate disappearance. Biomass and substrate massbalance equations for each added compound were solved simultaneously. For each microorganismtype, the substrate and biomass equations were of the form
f - =^
C-3

— ———i^~ -K. + S+-JT-
N
in which Y is the true yield for the particular substrate (mgx/mgs) and b is the first-order biomass lossrate coefficient (I/day). The non-competitive inhibition of ammonia degraders by phenol andcompetitive inhibition by thipcyanate of phenol biodegradation used equations (C-4) and (C-5),respectively, instead of the simple Haldane terms in equations (C-6) and (C-7). (The completemathematical expressions for each substrate are presented later in Section 5.3.d) Model inputsincluded the initial substrate and biomass concentrations. During the Phase III batch tests, initialNitrosomonas concentrations were determined by monitoring the decrease in ammonia nitrogenconcentration and the increase in nitrite- and nitrate-nitrogen concentrations during batch tests thatcontained only ammonia as a biodegradable substrate. Determining the distribution of addedheterotrophic biomass into phenol-degrading and thiocyanate-degrading fractions was part of themodel calibration process. The initial biomass concentrations used by the mechanistic model todescribe the Phase III batch tests are presented in Table C-4.
C.S.a Batch Test HIST-1 (ammonia alone)
The IIIST-1 short-term batch test consisted of adding inocula of nitrifying and heterotrophicmicroorganisms to nutrient media that also contained a targeted ammonia concentration of 300 mgN/L as the only substrate. This batch test had two objectives: (1) to verify that the nitrifyingcomponent of the inoculum was indeed active and (2) to provide an estimate of the initial nitrifierbiomass concentration in all of the short- and long-term batch tests started on March 4, 1997. A trial-and-error approach of curve fitting the observed decrease in ammonia concentrations was used toestimate the initial nitrifier concentration, based on the kinetic parameters for Nitrosomonas listed inTable C-3. The predicted ammonia decay curve was obtained by simultaneously solving equations (C-6) and (C-7) via a fourth-order Runge-Kutta algorithm (Chapra and Canale, 1988). An initialammonia concentration of 275 mg N/L was assumed, based on the measured initial concentration.Curve fitting suggested that the initial Nitrosomonas biomass concentration was about 1»107 CFU/mL(1 mgx/L). The observed and predicted ammonia decay curves are compared in Figure C-6. Theability of the curve-fitted predicted curve to capture the general shape and magnitude of the observeddata points suggests that the Nitrosomonas kinetic parameters obtained from the literature (Gee et al.,1990) describe the activity of the nitrifying inoculum and that an initial Nitrosomonas biomassconcentration of MO7 CFU/mL is reasonable.
C.3.b Batch Test IIIST-2 (ammonia and phenol)
The IIIST-2 short-term batch test consisted of adding inocula of nitrifying and heterotrophicmicroorganisms to nutrient media that also contained a targeted ammonia concentration of 300mg N/L and a targeted phenol concentration of 250 mg/L. The objective of the IIIST-2 batch test wasto verify the reported inhibition of Nitrosomonas activity by the presence of phenol. The measuredinitial ammonia and phenol concentrations of 275 mg N/L and 209 mg/L, respectively, were used asthe initial substrate concentrations for curve fitting of the two decay curves. The initial biomassconcentrations of ammonia- and phenol-degraders were assumed equal to those for the IIIST-1 batchtest and are listed in Table C-4.
The observed ammonia and phenol concentrations plotted in Figure C-7 confirm that phenoldoes inhibit Nitrosomonas activity. Comparison of Figure C-6 (the ammonia only IIIST-1 batch test)and Figure C-7 (the ammonia and phenol IIIST-2 batch test) suggests that Nitrosomonas activity is
C-4

sharply reduced when phenol is present. Complete removal of ammonia in the IIIST-1 batch testrequired about 13 days, while complete removal of ammonia in the IIIST-2 batch test (phenol present)required about 16 days. Phenol was present in the IIIST-2 batch test reactor for about 3 days beforebeing completely removed by the phenol-degrading microorganisms. The additional lag time forammonia removal in the IIIST-2 batch test is about equal to the length of time during which phenolremained present. Thus, the IIIST-2 batch test results suggest that phenol is an inhibitor ofnitrification.
The predicted decay curves for ammonia and phenol during the IIIST-2 batch test weredetermined by simultaneously solving the mass balance equations for ammonia, nitrifier biomass,phenol, and phenol-degrading biomass. The ammonia and nitrifier biomass mass balance equationsincluded terms for the non-competitive inhibition of nitrification by phenol as illustrated in equation(C-4). The observed and predicted decay curves for the niST-2 batch test are provided in Figure C-7.The good match between the observed and predicted phenol decay curves suggests that ammonia hasno effect on phenol biodegradation. The good agreement between the observed and predictedammonia decay curves suggests that the inhibition of nitrification by phenol follows the non-competitive relationship reported by Neufeld et al. (1980). Thus, the observed interactions betweennitrification and phenol in the IIIST-2 batch test are consistent with those reported in the literature.
C.3.C Batch Test IIIST-8 (ammonia and thiocyanate)
The IIIST-8 short-term batch test consisted of adding inocula of nitrifying and heterotrophicmicroorganisms to nutrient media that also contained a targeted ammonia concentration of 300 mgN/L and a targeted thiocyanate concentration of 180 mg/L. The objective of the IIIST-8 batch test wasto determine the presence of any additional interactions between nitrification and thiocyanate, otherthan the reported release of ammonia during the aerobic biodegradation of thiocyanate. The measuredinitial ammonia and thiocyanate concentrations were 283 mg N/L and 170 mg/L, respectively, andwere used as the initial substrate concentrations for curve fitting the two decay curves. The initialNitrosomonas biomass concentration was determined from the ammonia decay curve observed duringthe IIIST-7 batch test (an ammonia only batch test) and was equal to 2»10? CFU/mL (2 mgx/L). Theassumed initial thiocyanate-degrading biomass concentration was the value used in developing thepredicted curves in Figure C-l and was equal to 4'IQ5 CFU/mL (0.04 mgx/L).
The predicted decay curves for ammonia and thiocyanate during the IIIST-8 batch test weredetermined by simultaneously solving the mass balance equations for ammonia, nitrifier biomass,thiocyanate, and thiocyanate^degrading biomass. The only interaction included in the mass balanceequations was the release of ammonia during the aerobic biodegradation of thiocyanate. Because thepredicted lag time for thiocyanate removal occurred about a week after the predicted disappearance ofammonia nitrogen and about a week after the development of a large nitrifier population, the predictedremoval of thiocyanate had no impact on the predicted IIIST-8 ammonia decay curve.
The observed and predicted ammonia and thiocyanate decay curves are compared in Figure C-8. The comparison yields two observations. First, although the predicted curve suggests that thethiocyanate should be gone within 16 days, the observed thiocyanate concentrations show nosignificant decrease within 17 days. The lack of any thiocyanate removal suggests that no activethiocyanate-degrading microorganisms were present (for an unknown reason) in the IIIST-8 batch testor that the required lag time is greater than 17 days. Without a significant active population ofthiocyanate-degrading microorganisms, the IIIST-8 batch test can not confirm that the aerobicbiodegradation of thiocyanate results in the accumulation of ammonia in solution.
The second observation from Figure C-8 is that the ammonia appears to be removed at a rateslower than predicted. Curve-fitting of the ammonia decay curve suggests that the exposure of the
C-5

Nitrosomonas population to a constant thiocyanate concentration of 170 mg/L inhibits the rate ofnitrification by between 10 and 20 percent at 10 days. However, concentrations of nitrite- and nitrate-nitrogen that accumulated during the fflST-8 batch test that the ammonia-nitrogen concentration at 10days should be 0 mg N/L, instead of the observed 28 mg N/L. In this case, the ammonia decay curvewould indicate no apparent inhibition of nitrification by thiocyanate. Because the nitrite/nitrateanalysis tends to be more accurate than ammonia analysis, it is assumed that thiocyanate does notinhibit nitrification.
Although the IIIST-8 batch test was unable to confirm that the aerobic biodegradation ofthiocyanate results in the release of ammonia, it suggests that a constant thiocyanate concentration of170 mg/L has little effect on nitrification rates.
C.3.d Batch Test IIIST-3 (ammonia, phenol, and thiocyanate)
The IIIST-3 short-term batch test consisted of adding inocula of nitrifying and heterotrophicmicroorganisms to nutrient media that also contained a targeted ammonia concentration of 300 mgN/L, a targeted phenol concentration of 250 mg/L, and a targeted thiocyanate concentration of 180mg/L. The objective of the IIIST-3 batch test was to confirm the reported interactions betweennitrification, phenol, and thiocyanate that are illustrated in Figure C-3. The measured initial ammonia,phenol, and thiocyanate concentrations were 275 mg N/L, 211 mg/L, and 170 mg/L, respectively,which were used as the initial substrate concentrations for the curve fitting of the three substrate decaycurves. The initial Nitrosomonas biomass concentration was determined from the ammonia decaycurve observed during the IIIST-1 batch test (an ammonia only batch test) and was equal to 1»107
CFU/mL (1 mgx/L). The assumed initial phenol-degrading and thiocyanate-degrading biomassconcentrations were 5»1Q5 CFU/mL (0.05 mgx/L) and 4»1Q5 CFU/mL (0.04 mgx/L), respectively.
The predicted decay curves for ammonia and thiocyanate during the IIIST-8 batch test weredetermined by simultaneously solving the mass balance equations for ammonia, nitrifier biomass,phenol, phenol-degrading biomass, thiocyanate, and thiocyanate-degrading biomass. The massbalance equations included the interactions illustrated in Figure C-3 and described in Section 5.2above. The complete set of mass balance equations is
dS,dt
4.4
^LX
ST
S 2ST
dX,dt
4.4~ b X
(C-8)
(C-9)
d (C-10)
dXp
~dT7- \+ SD + KI.P
(C-ll)
C-6

dt ST2
i,T
dXT YTq _ X T S Tmax,T • • K Vy - DT ATdtK^ + ST + -^
in which y is the mg of ammonia nitrogen released per mg of thiocyanate biodegraded (0.2414mg N/mg SCN-), S is substrate concentration (mg/L), X is biomass concentration (mgx/L), b is thefirst-order biomass loss coefficient (I/day), the subscript N refers to ammonia nitrogen, the subscriptP refers to phenol, and the subscript T refers to thiocyanate. Equations (C-8) through (C-13) weresolved simultaneously using a fourth-order Runge-Kutta algorithm (Chapra and Canale, 1988).
The ammonia, phenol, and thiocyanate decay curves predicted by the six mass balanceequations are compared to the observed decay curves in Figure C-9. The agreement between thepredicted and observed decay curves for phenol and thiocyanate suggests that the combination of theabove mass balance equations and the kinetic coefficients listed in Table C-3 successfully describe theactivity of the phenol- and thiocyanate-degrading microorganisms.
Figure C-9 also demonstrates that ammonia is released during the aerobic biodegradation ofthiocyanate. As the thiocyanate is rapidly being biodegraded between days 15 and 17, the ammonianitrogen increases by the appropriate stoichiometric amount, i.e., the removal of about 180 mg/L ofthiocyanate results in about a 43 mg N/L increase in ammonia nitrogen concentration.
In contrast to the phenol and thiocyanate comparisons, there is a poor agreement between thepredicted and observed ammonia-nitrogen decay curves. For example, the predicted decay curveindicates that the ammonia should be gone within 13 days. The observed decay curve indicates that itrequired 34 days for the ammonia is disappear. A possible explanation for the apparent adverse effectis that an largely inactive Nitrosomonas inoculum was added to the batch test reactor, i.e., anexperimental artifact. However, the IIIST-1 and IIIST-2 batch tests demonstrated that theNitrosomonas inoculum was active.
The inability of the mechanistic model to describe the ammonia decay curve suggests that thesimultaneous presence of phenol and thiocyanate in solution has an adverse effect on nitrification.This adverse effect is much stronger than the non-competitive inhibition of nitrification by phenolalone. A rapid loss of biomass during the 3.5 days when phenol and thiocyanate were both present canexplain the observed ammonia decay curve. Curve fitting indicated that an active Nitrosomonasbiomass concentration of about 0.0025 mgjt/L at 3.5 days would allow the model to describe theobserved ammonia decay curve for the IIIST-3 batch test. This suggests that the active Nitrosomonasconcentration decreased 400-fold during the 3.5 days when both phenol and thiocyanate were present.For this to occur, the first-order biomass loss rate coefficient (b^) for Nitrosomonas in equation (C-9)needs to be increased from 0.1 I/day to about 1.9 I/day when phenol and thiocyanate are presenttogether.
C-7

C.3.e Batch Tests HILT-8 and HIST-3D (biomass assays)
The non-matrix batch tests IIIST-1, mST-2, and HIST-3 demonstrated that the aerobicbiodegradation of ammonia, phenol, and thiocyanate can be described by the mechanistic model,except when attempting to describe nitrification when phenol and thiocyanate are present together.Curve fitting of the observed ammonia decay curve from the IIIST-3 batch test suggests that the datacould be explained by a 400-fold decrease in active Nitrosomonas biomass concentration during theinitial 3.5 days of the batch test when phenol and thiocyanate were present together. The experimentalresults presented in this section confirm that the combination of phenol and thiocyanate is toxic toNitrosomonas.
The IIIST-3 batch test was repeated, except that samples were withdrawn from the batchreactor and assayed for Nitrosomonas activity on days 3 and 6 (see Section 4.3.3 for protocol). Thisduplicate of the IIIST-3 batch test is called IIIST-3D. An ammonia-only batch test called IIILT-8 wasrun along side the IIIST-3D batch test to provide a basis of comparison, so that the phenol/thiocyanateeffect could be demonstrated. A second ammonia-only batch test called HILT-10 was used incombination with the IIILT-8 batch test to determine the initial active concentration of Nitrosomonasin all three batch tests.
The comparison of the predicted and observed ammonia decay curves for the HILT-8 andHILT-10 is provided in Figure C-10. An initial active Nitrosomonas biomass concentration of about2.5»108 CFU/mL or 25 mgx/L allows the mechanistic model to describe the two observed ammoniadecay curves.
The active Nitrosomonas biomass concentrations predicted by the modeling and obtained fromthe biomass assays for IIILT-8 are compared in Figure C-l 1. The biomass assay results mirror thepredicted increase in active biomass concentration during the first 3 days of the batch test. On day 6 ofthe batch test, the biomass assay results suggest a smaller residual active biomass concentration thanis predicted by the modeling. This suggests that when the substrate is absent the first-order biomassloss rate coefficient for Nitrosomonas (bN) is faster than the 0.1 I/day value listed in Table C-3.However, as long as substrate is available, the IIILT-8 batch test results suggest that the biomass assayand modeling approaches generate comparable active Nitrosomonas biomass concentrations.
Figure C-l2 presents the predicted and observed substrate decay curves for the IIIST-3D batchtest. The modeling predicts a faster rate of ammonia removal than is actually observed. The modelingsuggests that ammonia should be removed within 5 days, while it actually required about 15 days.Thus, the HIST-3D batch test appears to have captured the same adverse effect on nitrification as wasobserved in the HIST-3 batch test. Curve fitting the observed ammonia decay curve suggests that thefirst-order biomass loss rate coefficient (b^ for Nitrosomonas in equation (C-9) needs to be increasedfrom 0.1 I/day to about 1.9 I/day when phenol and thiocyanate are present together. This is consistentwith the HIST-3 batch test. As illustrated in Figure C-l3, when this elevated b^ value is incorporatedinto the model to address biomass loss when phenol and thiocyanate are present, the modelsuccessfully tracks the observed ammonia decay curve.
The biomass assay results suggest that the combination of phenol and thiocyanate are toxic toNitrosomonas. The day-3 biomass assay results for the IIILT-8 and HIST-3D batch tests are presentedin Figure C-14. The biomass-containing water sample harvested from the ammonia-only IIILT-8bioreactor generates nitrite- and nitrate-nitrogen at a faster rate than that harvested from the IIIST-3Dreactor. The active Nitrosomonas biomass concentrations obtained from the biomass assays areprovided in Table C-5. On day 3, the assay results indicate an active biomass concentration of about100 mgx/L in the IIIST-8 batch test, while the IIIST-3D batch test only had 30 mgx/L. Compared tothe ammonia-alone batch test, the combined presence of phenol and thiocyanate results in lessbiomass being generated.
C-8

The active Nitrosomonas biomass concentrations predicted by the modeling and obtained fromthe biomass assays are compared in Figure C-15. By assuming a bn value of 1.9 when phenol andthiocyanate are present together, the modeling predicts that the active Nitrosomonas biomassconcentration decreases from 25 mg^/L to about 1 mgx/L by day 3, while the day-3 biomass assayresult is 30 mgx/L. At day 6, the two approaches are in agreement: the predicted active biomassconcentration is 4.5 mgx/L and the observed concentration from the biomass assay is 2.5 mg^L.
A possible explanation for the difference between the day-3 active biomass concentrationsobtained by modeling and from the biomass assays is that the adverse phenol/thiocyanate effectremains reversible for the first several days. The biomass assay results listed in Table C-5 suggest thatactive Nitrosomonas biomass concentrations did not change significantly from 25 mgx/L between day0 to day 3. However, by day 6, the active biomass concentration dropped to 2.5 mgx/L. This suggeststhat during the first 3 days the cells were inhibited by the phenol/thiocyanate mixture, resulting in nonet growth. When removed from the mixture and placed in clean media, the cells returned to theirinitial level of activity. Somewhere between day 3 and 6, the adverse effect became irreversible andresulted in the loss of activity observed by the biomass assay. Thus, like most chemical toxicants, theadverse effect of phenol and thiocyanate on Nitrosomonas activity appears to be a function of toxicantconcentration and exposure time.
C.3.f Summary of Non-Matrix Batch Tests
The Phase III non-matrix short-term batch tests did not contain diluted MW-7D groundwater.In general, the non-matrix batch tests demonstrated the ability of a mechanistic model to predict thebiological removal of ammonia, phenol, and thiocyanate, when the substrates were presentindividually or in pairs. The model consisted of equations (C-8) through (C-13) and the literature-derived kinetic coefficients listed in Table C-3. However, when the mechanistic model attempted todescribe the simultaneous removal of all three substrates, the model overestimated nitrification rates.Biomass assays and additional biokinetic modeling indicated inhibitory and eventually toxic effectson nitrification are associated with the combined presence of phenol and thiocyanate. Therefore, inaddition to confirming the substrate interactions illustrated in the Figure C-3, the non-matrix batchtests indicated a combined toxic effect of phenol and thiocyanate on Nitrosomonas.
C.4 Matrix Batch Test ResultsThe matrix batch tests contained various dilutions of groundwater collected from the site's
MW-7D well. Batch test media ranged from a 5 percent groundwater solution to a 100 percentgroundwater solution. One objective of the matrix batch tests was to determine the fate of thecontaminants of concern in an aerobic biological process. Another objective was to determine thepotential for nitrification at various groundwater dilutions. Of particular interest was the determinationof any additional adverse effects that the groundwater matrix may have on nitrification, beyond thoseobserved during the non-matrix batch tests.
C.4.a Batch Tests IIIST-6 and IIILT-6 (5 and 10 percent solutions)
The IIIST-6 batch test consisted of adding nutrients, pH buffer, and inocula of nitrifying andheterotrophic microorganisms to a reactor containing a 5 percent solution of MW-7D groundwater.The IIILT-6 batch test was identical to the IIIST-6 batch test, except that the reactor contained a 10percent solution of MW-7D groundwater. An objective of the two batch tests was to determine theability of the initial inoculum to biodegrade aerobically the ammonia nitrogen, phenol, and
C-9

thiocyanate found in the diluted groundwater. Another objective was to evaluate the ability of thecalibrated mechanistic model to predict the decay curves for the three compounds.
The predicted and observed compound decay curves for the IIIST-6 (5%-solution) batch testare compared in Figure C-16. The initial observed ammonia nitrogen, phenol, and thiocyanateconcentrations were 56,59, and 45 mg/L, respectively. Based on the cumulative generation of nitrite-and nitrate- nitrogen during the batch test, on the amount of ammonia nitrogen that can bestoichiometrically produced from the biodegradation of thiocyanate, and on the initial TKNconcentration of 190 mg/L, the predicted ammonia decay curve assumed an initial ammoniaconcentration of 130 mg/L. The agreement between the predicted and observed decay curves forphenol and thiocyanate suggests that the biodegradation of these two organic compounds is asobserved during the non-matrix batch tests, i.e., the same kinetic coefficients and mass balanceequations can be used to describe phenol and thiocyanate removal. However, even when the toxiceffect associated with the combined presence of phenol and thiocyanate on nitrification is included inthe mechanistic model, the model predicts a much shorter time for ammonia removal than is observed.The model predicts that the ammonia should be removed within 15 days, while ammonia removalactually occurred within 55 days. Thus, Figure C-16 suggests that something is inhibiting nitrificationin addition to the phenol/thiocyanate toxic effect and the other known interactions illustrated inFigure 5-3.
The predicted and observed compound-decay curves for the IIELT-6 (10%-solution) batch testare compared in Figure C-17. The predicted ammonia decay curve assumed an initial ammoniaconcentration of 275 mg N/L. As with the 5%-solution batch test, the removal of phenol andthiocyanate in a 10%-solution batch test is successfully described by the calibrated mechanisticmodel, while ammonia removal is not described by the model. The model predicted that ammoniaremoval would occur within 20 days, while 80 percent removal of the assumed initial ammoniaconcentration required about 153 days. Figure C-17 supports the hypothesis that an additional factor isinhibiting nitrification beyond those quantified during the non-matrix batch tests. Because the lag timeincreased from about 55 days for the 5%-solution to about 153 days for the 10%-solution, the degreeof inhibition or toxicity increases with the concentration of groundwater in the batch test reactor.
During the operation of the Phase III batch tests, it became obvious that the time framesrequired to demonstrate nitrification were much longer than originally anticipated. This wasconfirmed by the IIILT-6 (10%-solution) batch test, which had a lag time of about 153 days. Thus, theexperimental protocol was modified such that selected short-term and long-term batch test reactorswere re-inoculated with nitrifying and heterotrophic microorganisms. Also, because the inhibitory ortoxic effect appears to be stronger at higher concentrations of groundwater in the reactor, the potentialexisted that virtually all of the initial nitrifying biomass could have been killed before the nitrifiersacclimated to the groundwater chemical matrix. The reinoculation protocols are described inSection 4.3.2.
To capture the long lag times for the ammonia decay curves observed during various matrixbatch tests, the mechanistic model assumed that an undefined toxic agent in the MW-7D groundwateris responsible for the loss of active Nitrosomonas biomass. The reinoculation of matrix batch testsolutions with Nitrosomonas after the phenol and thiocyanate are removed allowed the biomass lossrate coefficient bN that corresponds to the matrix toxicity effect to be quantified.
The matrix toxicity bN value was determined from biomass assays performed at 3 and 6 daysfollowing the reinoculation with Nitrosomonas of solutions obtained from the IIILT-2 (16%-solution)and HILT-3 (33%-solution) batch tests. The objective of the biomass assays was to determine theinitial die-off of Nitrosomonas biomass in a solutions containing MW-7D groundwater after thesolution had be subjected to aerobic treatment for 85 days. As in the previous biomass assays, theinitial Nitrosomonas biomass concentration in the reactors after reinoculation was assumed to be 25
C-10

, based on the mLT-8 and IIILT-10 batch test results. As provided in Table C-5 and Figure C-18, active Nitrosomonas biomass concentrations decreased with exposure time to the groundwatersolutions. This loss in active biomass occurred despite the fact that no phenol or thiocyanate remainedin the HILT-2 and IIELT-3 batch test reactors. Thus, some component of the MW-7D groundwaterremains in solution after 85 days of aerobic treatment that is toxic to unacclimated Nitrosomonascultures.
Figure C-18 suggests that the initial rate at which active Nitrosomonas biomass disappears isthe same for the IHLT-2i and IIILT-3i batch reactors. (The small i refers to the batch test afterreinoculation and ii refers to the batch test after a second reinoculation.) Despite having a factor of 2difference in their initial concentration of groundwater, the loss of active biomass for both batch testscan be described by a first-order biomass loss coefficient O>N) of 0.62 I/day. Of course, theconcentration of the undefined toxic agent may be similar in the two reactors after 85 days of aerobictreatment.
To quantify the effect that the undefined toxic agent in the MW-7D groundwater had on activeNitrosomonas biomass, a matrix time factor was computed. The concept is that the toxic agent exertsits toxic effect for a length of time called the matrix time factor. Based on the results of Figure C-18,the added rate of biomass loss due to the toxic agent is 0.62 I/day. Table C-6 shows the variousbiomass decay rate coefficients used in the modeling of the non-matrix and matrix batch tests.Whenever the groundwater is toxic, the supplemental 0.62 I/day decay rate coefficient is in effect.
The matrix time factors for the IIIST-6 (5%-solution) and IIILT-6 (10%-solution) batch testswere determined by trial-and-error curve fitting. In other words, the time that the matrix toxicity wasactive was varied until the ammonia decay curves were fitted well. Figure C-19 illustrates that amatrix time factor of 18 days results in a predicted ammonia decay curve that matches the observedammonia decay curve for the IIIST-6 (5%-solution) batch test. Figure C-20 illustrates that a matrixtime factor of 58 days is appropriate for the HILT-6 (10%-solution) batch test. Thus, the greater theconcentration of MW-7D groundwater in the batch test, the greater is the calculated matrix timefactor, and greater is the toxic effect on Nitrosomonas.
C.4.b Batch Tests IIIST-5 and IIIST-5i (10 percent solution)
The IIIST-5 batch test consisted of adding nutrients, pH buffer, and inocula of nitrifying andheterotrophic microorganisms to a reactor containing a 10-percent solution of MW-7D groundwater.An initial objective of the HIST-5 batch test was evaluate the kinetic coefficients for ammonia,phenol, and thiocyanate biodegradation in the presence of a 10-percent groundwater solution.Although the phenol and thiocyanate had disappeared within the first 12 days of the batch test, theammonia showed no signs of biodegradation after 33 days. On day 34, the remaining medium wassplit into two portions. The first portion was not modified in any way and was in essence acontinuation of the original IHST-5 batch test. The second portion was re-inoculated with nitrifyingand heterotrophic microorganisms and was called the IIIST-5i batch test. The splitting of the mediaallowed the impact of reinoculation to be evaluated and provided a means of determining if anysignificant Nitrosomonas biomass developed after the initial exposure to the groundwater matrix.
The predicted and observed ammonia, phenol, and thiocyanate decay curves for the IIIST-5and IIIST-5i batch tests are provided in Figure C-21. Once again, the mechanistic model captures theremoval of phenol and thiocyanate. The blue line in Figure C-21 represents the predicted ammoniadecay curve allowing for a possible phenol/thiocyanate toxicity, but the blue line does not considerany matrix effects. Without matrix effects, the model predicts that ammonia should be removed withinabout 19 days. Figure C-21 indicates that no ammonia removal occurred within 58 days. Thisconfirms the observation from the IIIST-6 (5%-solution) and IIILT-6 (10%-solution) batch tests that
C-l l

there is a potentially toxic agent to Nitrosomonas in the groundwater in addition to the previouslyevaluated phenol/thiocyanate toxic effect. The ammonia decay curve for the HILT-6 (10%-solution)batch test had a lag time of over 150 days. Thus, the initial inoculum of Nitrosomonas in the IIIST-5(10%-solution) batch test apparently had insufficient time to recover sufficiently from the initialexposure to the groundwater matrix to nitrify measurable amounts of ammonia within 58 days.
After 33 days of aerobic treatment, a portion of the IIIST-5 media was re-inoculated withNitrosomonas and heterotrophic microorganisms. As shown in Figure C-21, nitrification removed allof the ammonia nitrogen within 21 days of reinoculation. If there was no matrix inhibition ofnitrification, then the inoculation of the IHST-5i batch test reactor with 25 mgx/L of Nitrosomonasshould only required 3 days to remove all of the ammonia nitrogen. Because no phenol or thiocyanateremained in solution at reinoculation, the inhibition must be due to matrix inhibition. Curve fittingindicated that a matrix time factor of 7.5 days is required for the mechanistic model to describe theobserved ammonia decay curve for the IIIST-5J batch test The resulting predicted ammonia decaycurve is represented by Uie purple line in Figure C-21.
The matrix time factor for the IIIST-5i (10%-solution) batch test after 33 days of prior aerobictreatment is 7.5 days. A matrix time factor of 58 days is required for the model to describe theammonia decay curve for the mLT-6 (10%-solution), which received no aerobic treatment prior toinoculation. Thus, longer periods of aerobic treatment appear to reduce the toxicity of the MW-7Dgroundwater to unacclimated cultures of Nitrosomonas.
C.4.c Batch Test IHLT-6i (10 percent solution)
The IIILT-6 batch test consisted of adding nutrients, pH buffer, and inocula of nitrifying andheterotrophic microorganisms to a reactor containing a 10-percent solution of MW-7D groundwater.After no ammonia removal was observed during the first 84 days of the IIILT-6 (10%-solution) batchtest, the remaining medium was split into two portions on day 85. The first portion was not modifiedin any way and was in essence a continuation of the original IIILT-6 batch test. The results of thecontinuing IIILT-6 batch test are described in Section 5.4.a. The second portion was re-inoculatedwith nitrifying and heterotrophic microorganisms and was called the niLT-6i batch test. As shown inFigure C-22, nitrification removed all of the ammonia nitrogen within 6 days of reinoculation. Curvefitting indicated that a matrix time factor of 1.0 days is required for the mechanistic model to describethe observed ammonia decay curve for the IIILT-6i batch test. The resulting predicted ammonia decaycurve is represented by the purple line in Figure C-22.
The calculated matrix time factor for the IIILT-6i batch test supports the trend that the shortermatrix time factors are associated with longer lengths to aerobic treatment prior to inoculation withunacclimated Nitrosomonas cultures. As provided in Table C-7, no prior aerobic treatment of a 10-percent solution of MW-7D groundwater results in calculated matrix time factor of 58 days. With 33days of prior aerobic treatment (IIIST-5i), the matrix time factor is reduced to 7.5 days. With 84 daysof aerobic treatment prior to reinoculation (IIILT-6i), the matrix time factor is reduced to 1.0 days.Thus, the longer a 10-percent solution of MW-7D groundwater is exposed to aerobic treatment, theless toxic the solution is to an unacclimated inoculum of Nitrosomonas.
C-12

C.4.d Batch Test IIILT-2 (16 percent solution)
The IIDLT-2 batch test consisted of adding nutrients, pH buffer, and inocula of nitrifying andheterotrpphic microorganisms to a reactor containing a 16-percent solution of MW-7D groundwater.The initial ammonia nitrogen, phenol, and thiocyanate concentrations were 480,198, and 141 mg/L,respectively. Figure C-23 illustrates that the aerobic biodegradation of phenol and thiocyanate in a 16-percent solution of MW-7D groundwater can be described by the same kinetic coefficients andinteractions used for the more dilute MW-7D groundwater batch tests and for the non-matrix batchtests. Thus, the 16-percent groundwater solutions does not alter the biokinetics of phenol andthiocyanate biodegradation.
The initial inoculum of Nitrosomonas did not oxidize significant amounts of ammonianitrogen. The batch reactor was re-inoculated with microorganisms on day 85, but no significantnitrification was observed. The batch-test reactor was re-inoculated for a second time on day 114,which resulted in observable nitrification. As illustrated in Figure C-23, the second reinoculation wasable to nitrify all of the ammonia within 12 days. Curve fitting indicated that a matrix time factor of1.0 days allowed the model to describe the observed decay curve. The predicted decay curve for thesecond reinoculation, plotted in Figure C-23, assumes a matrix time factor of 1.0 days and anammonia concentration of 500 mg N/L at the time of the second reinoculation. However, the modelwithout any matrix toxicity also accurately described the decay curve.
The ability of the second reinoculation of Nitrosomonas to start nitrifying the remainingammonia almost instantly suggests that the prior aerobic treatment of the 16-percent groundwatersolution for 113 days removes almost all of the matrix toxicity. This interpretation discounts anygeneration of active biomass from the first reinoculation.
C.4.e Batch Test HILT-1 (25 percent solution)
The HILT-1 batch test consisted of adding nutrients, pH buffer, and inocula of nitrifying andheterotrpphic microorganisms to a reactor containing a 25 percent solution of MW-7D groundwater.The initial ammonia nitrogen, phenol, and thiocyanate concentrations were 649, 273, and 199 mg/L,respectively. The comparison of the predicted and observed phenol and thiocyanate decay curvesprovided in Figure C-24 suggests that the mechanistic model and the kinetic coefficients listed inTable C-3 can describe the biological removal of phenol and thiocyanate in a 25-percent solution ofMW-7D groundwater, although a close examination of the thiocyanate data suggests that thiocyanatewas removed at rates slower man predicted by the model.
The HILT-1 batch test results suggest that a 25-percent solution of MW-7D is toxic toNitrosomonas and that this toxic effect can be mitigated by aerobic treatment. Figure C-24 illustratesthat the initial inoculum of Nitrosomonas and the first reinoculation of Nitrosomonas on day 85 wereunable to nitrify significant amounts of ammonia. The matrix time factor for the first reinoculation isat least 6 days (Figure C-18). The batch reactor was re-inoculated for a second time on day 118, whichresulted in about a 90-percent removal of ammonia within 21 days of reinoculation. Figure C-24indicates that the observed ammonia decay curve following the second reinoculation can be describedby the mechanistic model when the model includes a matrix time factor of 6.5 days. As with theinterpretation of the IIILT-2 (16%-solution) batch test, any impact of the first reinoculation on theresulting ammonia decay curve is not considered.
The HILT-1 (25%-solution) batch test results support the hypothesis that prior aerobictreatment reduces the toxicity of the MW-7D groundwater solution. The initial inoculation and firstreinoculation of the batch reactor with Nitrosomonas resulted in little or no nitrification. The secondreinoculation was performed after the solution was subjected to 117 days of aerobic treatment. This
C-13

second reinoculation with 14 mgx/L of Nitrosomonas resulted in nitrification with an apparent matrixtime factor of 6.5 days. In comparison, the second reinoculation of the IIILT-2 (16%-solution) batchtest had an apparent matrix time factor of only 1.0 days. Thus, removal of the toxicity from solutionscontaining MW-7D groundwater appears to require longer periods of aerobic treatment as the solutionstrength increases.
C.4.f Batch Test IIILT-3 (33 percent solution)
The HILT-3 batch test consisted of adding nutrients, pH buffer, and inocula of nitrifying andheterotrpphic microorganisms to a reactor containing a 33-percent solution of MW-7D groundwater.The initial ammonia nitrogen, phenol, and thiocyanate concentrations were 931, 318, and 273 mg/L,respectively. Comparisons of the predicted and observed decay curves for ammonia nitrogen, phenol,and thiocyanate are provided in Figure C-25. The mechanistic model was able to describe the phenoldecay curve.
The observed thiocyanate decay curve indicated that complete thiocyanate removal occurredwithin 70 days of the initial inoculation. The model predicted that the thiocyanate would be entirelyremoved within about 20 days. Thiocyanate removal required an additional 50 days than the timepredicted by the model. Based on the success of the model in describing thiocyanate at more diluteconcentrations of MW-7D groundwater, Figure C-25 suggests inhibition of thiocyanatebiodegradation in the 33-percent solution of MW-7D groundwater.
The IIILT-3 (33%-solution) batch test results suggest a slightly different explanation for theobserved ammonia nitrogen decay curve than the previous long-term matrix batch tests. The initialinoculation of Nitrosomonas resulted in no observable nitrification. On day 85, the IIILT-3 batch testreactor was re-inoculated with 25 mgx/L of unacclimated Nitrosomonas. By day 111, theNitrosomonas population had recovered sufficiently such that 214 mg/L of ammonia nitrogen, orabout 23 percent of the initial ammonia nitrogen concentration, had been nitrified to nitrite and nitrate.Such activity for the first reinoculation was not observed in the 16-percent (IIILT-2) and 25-percent(IIELT-1) solutions. It is not clear why the first reinoculation of the IIILT-3 (33%-solution) batch testwith Nitrosomonas inoculum was able to reduce ammonia concentrations, while similar inoculaadded to less concentrated solutions were unable to reduce ammonia concentrations.
As illustrated in Figure C-18 and Table C-5, there was a rapid loss of active Nitrosomonasbiomass immediately after this first reinoculation due to the toxicity of the 33-percent solution ofMW-7D groundwater. The matrix time factor for this first reinoculation was at least 6 days (Figure C-18). Curve fitting based on varying only the matrix time factor alone did not provide a satisfactorydescription of the ammonia decay curve. However, a matrix time factor of 9 days combined with a 45percent reduction in the value of qmax,N was able to describe the ammonia decay curve following thefirst reinoculation. In addition to an initial loss of unacclimated Nitrosomonas biomass afterreinoculation, the curve-fitting effort suggests that the growth rate of the surviving microorganismsand their progeny is inhibited by the 33-percent solution of MW-7D groundwater.
A second reinoculation of the IIILT-3 (33%-solution) batch test reactor with Nitrosomonaswas performed on day 114. A 92-percent reduction in ammonia nitrogen concentration occurredwithin 25 days of this second reinoculation. Without considering any effects due to the carryover ofactive Nitrosomonas biomass from the first reinoculation, curve fitting of the ammonia decay curvefollowing the second reinoculation suggests a matrix time factor of 6.5 days. While the use of thismatrix time factor allows the model to describe when most of the ammonia nitrogen is gone, its use isnot strictly correct, because active biomass carried over from the first reinoculation. This probablyexplains the poor description of the ammonia decay curve immediately after the second reinoculation(Figure C-25).
C-14

In summary, the IIILT-3 (33%-solution) batch test results provide the first evidence that thebiodegradation of thiocyanate can be inhibited by the groundwater. The IIILT-3 batch test results alsoprovide additional support for the hypothesis that the toxicity of the groundwater to unacclimatedcultures of Nitrosomonas can be reduced by prior aerobic treatment.
C.4.g Batch Test: IIILT-4 (100 percent solution)
The IIILT-4 batch test consisted of adding nutrients, pH buffer, and inocula of nitrifying andheterotrophic microorganisms to a reactor containing undiluted MW-7D groundwater. The initialammonia nitrogen, phenol, and thiocyanate concentrations were 2690,977, and 721 mg/L,respectively. Comparisons of the predicted and observed decay curves for ammonia nitrogen, phenol,and thiocyanate are provided in Figure C-26. The observed ammonia, phenol, and thiocyanateconcentrations suggested no significant biodegradation during the first 84 days. The reactor was re-inoculated on day 85. Observed compound removal after day 85 is questionable. The thiocyanateconcentrations drop to about 100 mg/L on days 105 and 132, but the reported value of 628 on day 118suggests that measured reduction in the thiocyanate may be just an analytical artifact. The modelindicates that phenol and thiocyanate should be removed within 17 and 52 days, respectively. This isclearly not the case, which suggests that the matrix is inhibiting or is toxic to the added heterotrophicmicroorganisms in a much more intense manner than is described by the model. The predictedammonia decay curve for the initial inoculum indicates that no ammonia removal is expected duringthe first 84 days due to the excessive phenol/toxicity effect caused by the slow predicted removal ofphenol and thiocyanate. While the predicted decay curve agrees with the observed decay curve of noammonia nitrogen removal, there is no reason to believe that model includes all of actual mechanismsresponsible for no ammonia removal.
The IIILT-4 batch test results indicate that aerobic treatment is not likely to be effective in thebiological treatment of solutions consisting almost entirely of MW-7D groundwater.
C.4.h Matrix Time Factors
Matrix time factors are an index of groundwater toxicity toward Nitrosomonas. The matrixtime factors for the matrix batch tests are summarized in Figure C-27 in terms of groundwaterconcentrations and the length of time the matrix was subject to aerobic treatment prior toreinoculation. Those batch tests that only had an initial inoculation of Nitrosomonas had 0 days ofprior aerobic treatment. Higher matrix time factors represent a more toxic solution. The general trendsobtained from Figure C-27 are that the toxicity of the solution to Nitrosomonas increases withincreased MW-7D groundwater concentration and the toxicity of the solution decreases with increasedaerobic treatment prior to the addition of the unacclimated Nitrosomonas inoculum.
C.5 SummaryPhase III of the biotreatability study performed on groundwater collected from the monitoring
wells MW-7D and MW-13S on the Waukegan Manufactured Gas and Coke Plant (WMGCP) siteconsisted of numerous batch tests that were designed to verify and quantify the interactions amongphenol, thiocyanate, and nitrification, and to assess the groundwater matrix effects on aerobicbiological activity. A biokinetic evaluation of individual Phase III batch tests had the followingresults:
• the aerobic biodegradation of phenol and thiocyanate by commercially-available microbialcultures can be described by Haldane inhibition kinetics when each compound is evaluated
C-15

separately in laboratory media (ammonia is reported to follow Haldane kinetics, but the PhaseIII batch tests did not allow verification);
• phenol is a strong inhibitor of nitrification (thiocyanate is reported to be a weak inhibitor ofphenol biodegradation, but the Phase III batch tests did not allow verification);
• the combined presence of phenol and thiocyanate appears to have an initial inhibitory effect onnitrification that with time becomes a toxic effect resulting in the loss of active Nitrosomonasbiomass;
• the chemical matrix of the groundwater collected from MW-7D had an adverse effect onnitrification at groundwater concentrations as low as 5 percent and batch tests performed atMW-7D groundwater concentrations of 15 and 33 percent demonstrated that the chemicalmatrix was toxic to the Nitrosomonas inocula;
• the chemical matrix of the groundwater collected from MW-7D appeared to inhibitthiocyanate biodegradation at concentrations possibly as low as 25 percent and completelyinhibited thiocyanate biodegradation in the 100 percent MW-7D groundwater solution;
• the chemical matrix of the groundwater collected from MW-7D appeared to inhibit completelythe aerobic biodegradation of phenol in the 100 percent MW-7D groundwater solution(sampling frequency precluded an assessment of matrix inhibition at lower groundwaterconcentrations); and
• prior aerobic treatment of the MW-7D groundwater appears to reduce the toxicity of thegroundwater matrix to Nitrosomonas.
In conclusion, the biokinetic evaluation of the Phase III batch tests suggests that thecontaminants of concern in the WMGCP aquifer (i.e., phenol, thiocyanate, and ammonia) arebiodegradable under aerobic conditions provided that sufficient dilution of the MW-7D groundwateris achieved to prevent complete inhibition of the respective microorganisms. The Phase III batch testsdid not determine the maximal concentration of MW-7D groundwater that can support thebiodegradation of phenol and thiocyanate, but the phenol and thiocyanate were completely removedfrom a 33 percent solution of MW-7D groundwater within 90 days. Nitrification was more sensitive tothe adverse effects associated with the groundwater matrix than was the biodegradation of phenol andthiocyanate, but prior aerobic treatment of the groundwater appeared to reduce the intensity of theadverse effect As with the biological treatment of coal gasification wastewaters, the aerobicbiological treatment of the WMGCP groundwater appears possible provided that the various chemicaland biological interactions are considered in process design and operation.
C-16

C.6 ReferencesCHAPRA S. C. and CANALE R. P. 1988. Numerical Methods for Engineers, Second Edition.McGraw-Hill Book Company, New York, NY, 812 pp.
GEE S. C., SUIDAN M. T. and PFEFFER J. T. 1990. Modeling of nitrification under substrate-limiting conditions. Journal of Environmental Engineering, ASCE 116(1): 18-31.
KUMARAN P. and PARUCHURI Y. L. 1997. Kinetics of phenol biotransformation. Water Research31(1): 11-22.
LUTHY R. G. and JONES L. D. 1980. Biological oxidation of coke plant effluent. Journal ofEnvironmental Engineering, ASCE 106(4): 847-851.
NEUFELD R. D. and VALIKNAC T. 1979. Inhibition of phenol biodegradation by thiocyanate.Journal Water Pollution Control Federation 51(9): 2283-2291.
NEUFELD R. D., HILL A. J. and ADEKOYA D. O. 1980. Phenol and free ammonia inhibition toNitrosomonas activity. Water Research 14: 1695-1703.
NEUFELD R. D., MATTSON L. and LUBON P. 1981. Thiocyanate bio-oxidation kinetics. Journalof Environmental Engineering, ASCE 107(5): 1035-1049.
SAEZ P. B. and RITTMANN B. E. 1993. Biodegradation kinetics of a mixture containing a primarysubstrate (phenol) and an inhibitory co-metabolite (4-chlorophenol). Biodegradation 4: 3-21.
C-17

C.7 Tables
Table C-1. Description of the short-term Phase in batch tests.
Batch Test Name Inoculation Dates Description
IIIST-1
IIIST-2
IIIST-3
IUST-3D
IIIST-4
IIIST-5
IIIST-6
IIIST-7
IIIST-8
4 March 1997
4 March 1997
4 March 1997
28 May 1997
4 March 1997
4 March 19977 April 1997
4 March 1997
7 April 1997
7 April 1997
300 mg N/L of NH3 in laboratory water
300 mg N/L of NH3 and 250 mg/L of phenol inlaboratory water
300 mg N/L of NH3, 250 mg/L of phenol, and180 mg/L of thiocyanate in laboratory water
300 mg N/L of NH3, 250 mg/L of phenol, and180 mg/L of thiocyanate in laboratory water
25 percent solution of MW-7D groundwater
10 percent solution of MW-7D groundwater
5 percent solution of MW-7D groundwater
300 mg N/L of NH3 in laboratory water
300 mg N/L of NH3 and 180 mg/L ofthiocyanate in laboratory water
C-18

Table C-2. Description of the long-term Phase III batch tests.
Batch Test Name Inoculation Dates Description
niLT-i
HILT-2
HILT-3
IIILT-4
IIILT-5
HILT-6
IIILT-7
IIILT-8
IIILT-9
HILT-10
4 March 199728 May 199730 June 1997
4 March 199728 May 199726 June 1997
4 March 199728 May 199726 June 1997
4 March 199728 May 1997
4 March 199728 May 1997
4 March 1997
none
28 May 1997
28 May 1997
28 May 1997
25 percent solution of MW-7D groundwater
16 percent solution of MW-7D groundwater
33 percent solution of MW-7D groundwater
100 percent solution of MW-7D groundwater
16 percent solution of MW-7D groundwaterinoculated with site soil
10 percent solution of MW-7D groundwater
poison control, 25 percent solution of MW-7Dgroundwater
300 mg N/L in laboratory water
a 5 percent solution of media from IIILT-1,which is equivalent to the reinoculation of a1 .25 percent solution of MW-7D groundwater
600 mg N/L of NHs in laboratory water
C-19

Table C-3. Kinetic coefficients used to develop the predicted substrate concentration curves forthe Phase III batch tests.
Parameter
True yield
Maximumspecificutilization rate
Half-velocitycoefficient
Haldanecoefficient
Biomass losscoefficient
Minimumsubstrateconcentrationfor steady-state growth
Substrateconcentrationbeyond whichrates slow
Maximumsubstrateconcentrationfor steady-state growth
Symbol Units NH3-N
Y mgj/mgs 0.30
Qroa* mgs/mg^day 1.90
Ks mgs/L 0.70
Kj mgs/L 9000
b I/day 0.1
S^ mg/L 0.15
S* mg/L 79.4
Smax mg/L 42,300
Substrate
Phenol Thiocyanate
1.24 0.35
8.50 2.40
1.20 5.00
65 300
0.1 0.1
0.01 0.68
8.8 38.7
6,800 2,200
C-20

Table C-4. Assumed initial biomass concentrations for the Phase IIIshort-term and long-term tests.
InitialInitial Phenol- Thiocyanate-
Initial Initial Degrading DegradingApproximate Nitrosomonas Nitrosomonas Nitrosomonas Bacteria BacteriaInoculation Calibration Concentration Concentration Concentration Concentration
Date Batch Test (CFU/mL) (mgx/L) (mgx/L) (mgx/L)
3 April 1997 IIIST-1
7 April 1997 IIIST-7
28 May 1997 IIILT-8IIILT-10
30 June 1997 no-name
1.0*107
2.0*107
2.5*108
1.4*108
1.0
2.0
25
14
0.05
0.05
1.25
0
0.04
0.04
1.40
0
C-21

Table C-5. Calculated active Nitrosomonas concentrations obtained from the biomass assaysperformed with samples harvested from the HILT-8 (ammonia alone), IIIST-3D (ammonia,phenol, and thiocyanate), IIILT-2I (re-inoculated reactor containing a 16 percent solution of
MW-7D groundwater), and IIILT-3i (re-inoculated reactor containing a 33 percent dilution ofMW-7D groundwater) batch tests.
Active Nitrosomonas concentration (mg/L)
Exposure Time(days) IIILT-8 IIIST-3D IIILT-2i IIILT-3i
0
0.83
3
6
25*
100
20
25*
30
2.5
25*
3.0
0.6
25
15.5
3.0
0.75
= not performed
C-22

Table C-6. First-order biomass loss rate coefficients for active Nitrosomonas biomass (bN)used in equation (C-9) as a function of various assigned conditions.
Value of bN(I/day) Characteristic or When Used by Model
0.1 endogenous decay coefficient with no toxicity
0.62 biomass loss coefficient assumed during the initial length ofelapsed time defined by the matrix time factor, when phenoland thiocyanate are not present together
1.9 biomass loss coefficient that describes the toxic effect createdwhen phenol and thiocyanate are present together in solution,but no MW-7D groundwater is present
2.42 biomass loss coefficient assumed during the initial length ofelapsed time defined by the matrix time factor, and whenphenol and thiocyanate are present together in solution
C-23

SDMS US EPA REGION V
COLOR-RESOLUTION - 2IMAGERY INSERT FORM
The following page(s) of this document include color or resolution variations.Unless otherwise noted, these pages are available in monochrome. The originaldocument is available for viewing at the Superfund Records Center.
SITE NAME
DOC ID #
DESCRIPTIONOF ITEM(S)
PRP
DOCUMENTVARIATION
DATE OF ITEM(S)
NO. OF ITEMS
PHASE
OPERABLE UNITS
LOCATION1>¥T A CJ17rllAaiL
(AR DOCUMENTS ONLY)
OMC/Waukegan (IL)
142919
Charts & Graphs
X COLOR OR RESOLUTION
01/01/0001
26
Box # 5 Folder # 4 SubsectionX Remedial Removal Deletion Docket Original
Updated 3 Volume 3 of 5
COMMENT(S)

C.8 Figures
—— Predicted, IIIST-6
—— Predicted, IIIST-5
—— Predicted, IIIST-3
—— Predicted, IIIST-4
— Observed, IIIST-6
— Observed, HIST-5
A Observed, IIIST-3
— Observed, IIIST-4
0 3 6 9 12 15 18 21 24Elapsed Time (days)
Figure C-l. Demonstration of increased lag times associated with increased initialconcentrations of a self-inhibitory substrate. The predicted thiocyanate decay curves werecalculated using the Haldane kinetic parameters listed in Table C-3 and an initialthiocyanate-degrading biomass concentration of 0.04 mgx/L.
C-24

1.00 ,,
Phenol
Thiocyanate
NH3-N
1 10 100 1000Substrate Concentration (mg/L)
Figure C-2. Comparison of specific growth rates as a function of substrate concentration. Notethat the above curves assume no interaction between substrates.
C-25
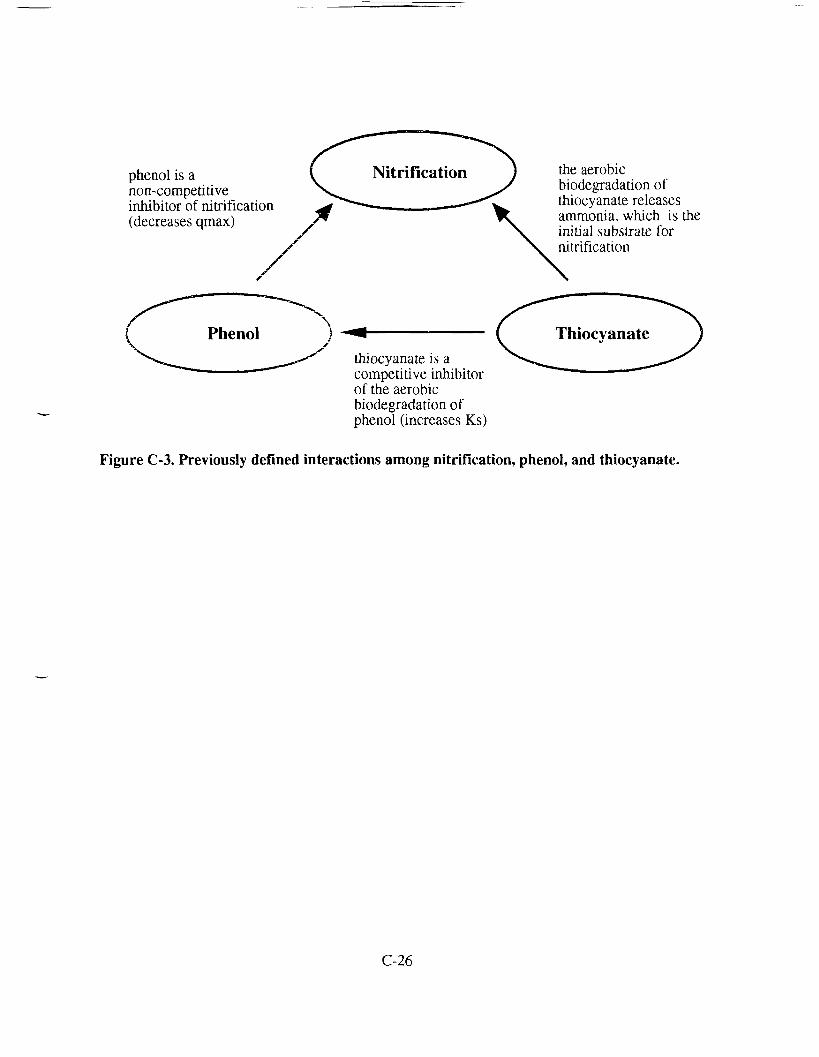
phenol is anon-competitiveinhibitor of nitrification(decreases qmax)
thiocyanate is acompetitive inhibitorof the aerobicbiodegradation ofphenol (increases Ks)
the aerobicbiodegradation ofthiocyanate releasesammonia, which is theinitial substrate fornitrification
Figure C-3. Previously defined interactions among nitrification, phenol, and thiocyanatt
C-26

* 0.8E
cr
« 0.2-
50 100 150 200 250 300
Phenol Concentration (mg/L)
Figure 5.-4. Fractional effective qmax value for the oxidation of ammonia nitrogen to nitritenitrogen by Nitrosomonas as a function of phenol concentration (Neufeld et a/., 1980).
C-27

o
If-*-1 * si — ,^ DC"o Ee '/)
0£
B*
C
6-
5-
4-
3-
2-
i20 40 60
Non-Competitive(10 ppm Phenol)
Competitive(10 ppm Phenol)
Non-Competitive(100 ppm Phenol)
Competitive(100 ppm Phenol)
0 20 40 60 80 100
Thiocyanate Concentration (mg/L)
Figure C-5. Comparison of reported competitive and non-competitive inhibition of aerobicphenol biodegradation by thiocyanate as a function of thiocyanate and phenolconcentrations.
C-28

Ammonia NitrogenConcentration (mg N/L)
oto

—— MO7 CFU/mL
—— 5'105 CFU/mL
H NH3-N (obs)
C Phenol(obs)
i • i • T ' r8 10 12 14 16 18 20
Elapsed Time (days)
Figure C-7. Comparison of the predicted and observed decay curves for ammonia nitrogen andphenol during the IIIST-2 batch test. The assumed initial nitrifying and phenol-degradingbiomass concentrations were 1-107 CFU/mL (1 mg^L) and 5»l()s CFU/mL (0.05respectively.
C-30

0
—— 2-107 CFU/mL
—— 4-105 CFU/mL
g NH3-N (observed)
A SCN (observed)
10 12 14 16 18 20Elapsed Time (days)
Figure C-8. Comparison of the predicted and observed decay curves for ammonia nitrogen andthiocyanate during the IIIST-8 batch test. The assumed initial nitrifying and thiocyanate-degrading biomass concentrations were 2*107 CFU/mL (2 mgx/L) and 4»105 CFU/mL (0.04mgx/L), respectively.
C-31

23ens'
T" >•"" soQ. as '
PS
S I3- ct-«•*• re
na S
03rH B9
a
3 s-1 S*<w r. a "x 3 ...r8 ™ 2. §"•t n *" 3I -3.§« L3 S>
d3"
re
Substrate Concentration (mg/L)
H
^ 2 5 n & H-r_ »5 —-T3 <* I r.'O g H >-» Q.
3 S " 9- H5 S- 3" n' S'Cjp re re 5- 3^__ ..—. TO ^"
.sroto_-1
(/l O
^oz'cT<?3cuo.
•
5o^
cro<^o.
•
iw,zo"OrcSh-t<^QQ.
1•
§,
n33"^L[^
i•o^naPp3t"~'
•
Oj
n3S*E__4C"

is3I
<rc5*S re
H9Ammonia Nitrogen
Concentration (mg N/L)

PredictedBioassay
Elapsed Time (days)
Figure C-11. Comparison of active Nitrosomonas biomass concentrations for the HILT-8 batchtest predicted by the biokinetic modeling and obtained from the biomass assays performedon days 3 and 6. Both sets of data assume an initial active Nitrosomonas biomassconcentration of 25 mg,/L.
C-34

—— 2.5'108 CFU/mL
—— 1.25-107 CFU/mL
—— 1.4-107 CFU/mL
m NH3-N (observed)
9 Phenol (observed)
A SCN (observed)
0 4 6 8 10Elapsed Time (days)
16
Figure C-12. Comparison of the predicted and observed decay curves for ammonia nitrogen,phenol, and thiocyanate during the IIIST-3D batch test with no adjustments for thephenol/thiocyanate effect on nitrification. The assumed initial nitrifying biomassconcentration was 2.5* 10« CFU/mL (25 mgx/L). The initial phenol-degrading andthiocyanate-degrading biomass concentrations of 1.25«107 CFU/mL (1.25 mgx/L), and1.4»107 CFU/mL (1.4 mgx/L), respectively, were obtained by curve fitting the observed decaycurves.
C-35

—— 2.5- LO8 CFU/mL
—— 1.25-107 CFU/mL
—— l.4'107 CFU/mL
m NH3-N (observed)
— Phenol (observed)
A SCN (observed)
0 4 6 8 10 12Elapsed Time (days)
i14 16
Figure C-13. Comparison of the predicted and observed decay curves for ammonia nitrogen,phenol, and thiocyanate during the IIIST-3D batch test assuming that b;\ increases from theusual 0.1 I/day to 1.9 I/day when phenol and thiocyanate are present together. The initialbiomass concentrations are as in Figure C-12.
C-36

• IIILT-8
9 IIIST-3D
eo
fcz« 2fZ E€«O vi
S o.2 -.5•c o4> »-u S.Ou
Elapsed Time (hours)
Figure C-14. Accumulation of nitrification products (nitrite-nitrogen and nitrate-nitrogen) forthe biomass assays performed with biomass harvested from the IIILT-8 (ammonia) andIIIST-3D (ammonia, phenol, and thiocyanate) batch tests on day-3 of each batch test.
C-37

Predicted
Bioassay
i • i ^ i ' i ' i ' I ' I <\ ' r0 2 4 6 8 10 12 14 16 18 20
Elapsed Time (days)
Figure C-15. Comparison of active Nitrosomonas biomass concentrations for the IIIST-3D batchtest predicted by the biokinetic modeling and obtained from the biomass assays performedon days 3 and 6. Both sets of data assume an initial active Nitrosomonas biomassconcentration of 25
C-38

160-r
£c
o
2s
C/5
10 20 30 40 50
Elapsed Time (days)60
M07CFU/mL
5-105 CPU/ml,
4«105CFU/mL
NH3-N (observed)
Phenol (observed)
SCN (observed)
Figure C-16. Comparison of the predicted and observed decay curves for ammonia nitrogen,phenol, and thiocyanate during the IIIST-6 batch test which contained a 5 percent solutionof MW-7D groundwater. The predicted ammonia decay curve includes thephenol/thiocyanate toxic effect quantified during the non-matrix batch tests.
C-39

"3tre"T3 C^TS Bre 5» ft rt
§1§9«=: "fr- ^!^n
trf* >2 f*- M
to5- °
Illl B aNil 1 s-i"•-otren a I-& 1 — n> ,c « ? a Hg ft » S' 5"
l
Substrate Concentration (mg/L)
SJ re HH O. ft
i I
S B ?>••<5 3 sr o«
8
ill:a =•" 3\J1 JT ^^ 9
!?ft og' "S 3
i s-i2-3 «•<->• "iw Co tre
*• •
9 i•c P^^ oo ~i" o->-l V>
Q. <
• 1
OJ ^^i ' nz n? ?l1 i:
1o
ly>
n3P-
•
o--J
n3P.

IIILT-21
IIILT-31
Elapsed Time (days)
Figure C-18. Decay of active Nitrosomonas biomass concentration as a function of exposure timeto a 16 percent (IIILT-2i) and 33 percent (HILT-3i) solution of MW-7D groundwater. Thenet decay in active biomass can be described by a first-order biomass loss rate coefficientequal to 0.62 I/day (the green line).
C-41

__ l-107CFU/mL(matrix time factor = 18 days)
—— 5'105CFU/mL
—— 4-105 CFU/mL
m NH3-N (observed)
— Phenol (observed)
A SCN (observed)
Elapsed Time (days)
Figure C-19. Comparison of the predicted and observed decay curves for ammonia nitrogen,phenol, and thiocyanate during the IIIST-6 (5%-solution) batch test assuming a matrix timefactor of 18 days. The ammonia decay curve also includes the phenol/thiocyanate toxic effect.
C-42

til
10 20 30 40
Elapsed Time (days)
I 'DOB50 60
—— MO7 CFU/mL
2.5-108 CFU/mL—— (re-inoculated)
(matrix time factor = 7.5 days)
—— 5-K)5 CFU/mL
—— 4«105 CFU/mL
N (observed)
DNH3-N (observed)(re-inoculated)
Phenol(observed)
Thiocyanate (observed)
Figure C-21. Comparison of the predicted and observed decay curves for ammonia nitrogen,phenol, and thiocyanate during the IIIST-5 and IIIST-5i (10%-solution) batch tests. TheIIIST-5i batch test was re-inoculated with Nitrosomonas and heterotrophic microorganismson day 34. The blue line represents the predicted ammonia decay curve for the IIIST-5 batchtest assuming only a phenol/thiocyanate toxic effect and no matrix effects. The purple linerepresents the predicted ammonia decay curve for the IIIST-5i batch test assuming a matrixtime factor of 7.5 days and no phenol/thiocyanate toxic effect, because the phenol andthiocyanate were already biologically removed prior to the start of the IIlST-5i batch test.
C-44

400-
e4>U
oUo>
.0aC/5
0-
51
[
]
«-
__ 1-107 CFU/mL(matrix time factor = 58 days)
2.5-108 CFU/mL—— (re-inoculated)
(matrix time factor = 1 day)
—— 5-105 CFU/mL
—— 4-105 CFU/mL
g NH3-N (observed)
D
9
A
NH3-N (observed)(re-inoculated)
Phenol (observed)
SCN (observed)0 20 40 60 80 100 120 140 160
Elapsed Time (days)
Figure C-22. Comparison of the predicted and observed decay curves for ammonia nitrogen,phenol, and thiocyanate during the HILT-6 and IHLT-6i (10%-solution) batch tests. TheHILT-6! batch test was re-inoculated with Nitrosomonas and heterotrophic microorganismson day 85. The blue line represents the predicted ammonia decay curve for the HILT-6batch test assuming a phenol/thiocyanate toxic effect and matrix time factor of 58 days. Thepurple line represents the predicted ammonia decay curve for the IHLT-6i batch testassuming a matrix time factor of 1.0 days and no phenol/thiocyanate toxic effect, because thephenol and thiocyanate were already biologically removed prior to the start of the IIILT-6ibatch test.
C-45

Substrate Concentration (mg/L)

Substrate Concentration lg/L)
??i^iB5 fc !O O?• S X 3.= * 3- as» I S 2.?oN
a w »*^ re D5
S"? §.>1
^ * •>-l *v 'Z *o I ^ ^•3 £. z ?
1 1 1k W, ——— ——— K- K-
5 ^ g. Q-i 0
i n x'? ^ ob'R ' r T ^ "^ P- 3' n T!^ l l ^ ^ i l ^ G
CT" CP GJ(/3 ^. /-^
g - -oS
3 „. c 5 3_^ C1 f*™<
§ °'n ^ON
c.c/>

1200MO7 CFU/mL
1.4-108 CFU/mL(2nd re-inoculation)(matrix time factor = 6.5 days)
5» 105 CFU/mL
4-105 CFU/mL
NH3-N (observed)
Phenol (observed)
Thiocyanate (observed)
20 40 60 80 100 120 140 160Elapsed Time (days)
Figure C-25. Comparison of the predicted and observed ammonia nitrogen, phenol, andthiocyanate decay curves for the IHLT-3 (33%-solution) batch test. The arrows representthe two reinoculations of the batch test reactor with Nitrosomonas on days 85 and 114. Amatrix time factor of 6.5 days was used to describe nitrification after the day 114-reinoculation.
C-48

JJUVJ— ——————————————————
- — -
^JD 3(XX)JS 1 , • "^C 2500 -T£ 108i 2000-c| 1500-o^ • •S3 100°-*- .* 1 1 A
tc Jl 1 * *v^ 500- 1 ^\* \
0 , \r~r~, —— . —— Lu , , , , l0 20 40
—— .'•a
. • • • ' . .T '1 A A
60 80 100 120 V•0
—— l-107CFU/mL
—— 5-105 CFU/mL
—— 4-105 CFU/mL
g NH3-N (observed)
9 Phenol (observed)
A Thiocyanate (observed)
Elapsed Time (days)
Figure C-26. Comparison of the predicted and observed decay curves for ammonia nitrogen,phenol, and thiocyanate during the IIILT-4 (100%-solution) batch test. The arrowrepresents the reinoculation of the batch test reactor with Nitrosomonas and heterotrophicmicroorganisms on day 85.
C-49

Figure C-27. Matrix time factors as a function of MW-7D groundwater concentration insolution and the length of aerobic treatment prior to the addition of the unacclimatedNitrosomonas culture. The matrix time factor for the 16%-solution with 84 days of prioraerobic treatment should be interpreted as something greater than 6 days. The matrix timefactor for the 33%-solution with 84 days of prior aerobic treatment is plotted as 9 days,which is consistent with one curve fitting effort that assumed a 45 percent inhibition ofQ.max,N-
C-50