FLUOPYRAM (243) EXPLANATION - Food and … · that fluopyram and major metabolites (BZM, PAA and...
41
Fluopyram 617 FLUOPYRAM (243) First draft was prepared by Mr David Lunn, Ministry for Primary Industries, Wellington, New Zealand. EXPLANATION Fluopyram, a pyridylethylamide broad spectrum fungicide was evaluated for the first time by the 2010 JMPR, where an ADI of 0–0.01 mg/kg bw and an ARfD of 0.5 mg/kg bw were established, and maximum residue levels were recommended for a limited number of uses where GAP information was available. The 2010 JMPR also established residue definitions for fluopyram: For plant products (compliance with MRLs and dietary intake assessment): fluopyram. For animal products (compliance with MRLs): sum of fluopyram and 2-(trifluoromethyl) benzamide, expressed as fluopyram. For animal products (dietary intake assessment): sum of fluopyram, 2- (trifluoromethyl)benzamide and the combined residues N-{(E)-2-[3-chloro-5-(trifluoromethyl)pyridin- 2-yl]ethenyl}-2-trifluoromethyl) benzamide and N-{(Z)-2-[3-chloro-5-(trifluoromethyl)pyridin-2- yl]ethenyl}-2-trifluoromethyl) benzamide, all expressed as fluopyram. New GAP information, supporting residue data and additional analytical sample storage stability studies were provided by the manufacturer for evaluation by the Meeting. In this evaluation, the values presented in the tables are as reported in the various studies, but in the accompanying text, they have generally been rounded to two significant digits. Abbreviations have also been used for the various fluopyram metabolites mentioned in the study reports. These are: • BZM = AE C656948-benzamide • PAA = AE C656948-pyridyl-acetic acid • PCA = AE C656948-carboxylic acid • 7-OH = AE C656948-7-hydroxy METHODS OF RESIDUE ANALYSIS Analytical methods The 2010 JMPR reviewed and summarized analytical method descriptions and validation data for fluopyram and major metabolites (BZM, 7-OH, PCA, PAA and the methyl-sulfoxide) in crop and animal commodities and in soil. Method GM-001-P07-01 A minor modification of Method 00984 [Ref: 2010 JMPR] was used to measure residues of the parent compound in the new supervised residue trials on grapes and apples and Method 00984 was used in the extended storage stability studies.. Stability of residues in stored analytical samples The 2010 JMPR reviewed freezer storage stability studies on a range of representative substrates covering those with a high water content (lettuce), a high starch content (wheat grain), a high protein content (dry pea seed), a high oil content (rape seed) and a high acid content (orange) and concluded that fluopyram and major metabolites (BZM, PAA and PCA) are stable in these representative substrates for at least 24 months in frozen storage. The 2010 JMPR also concluded that residues of the
Transcript of FLUOPYRAM (243) EXPLANATION - Food and … · that fluopyram and major metabolites (BZM, PAA and...

Fluopyram
617
FLUOPYRAM (243)
First draft was prepared by Mr David Lunn, Ministry for Primary Industries, Wellington, New Zealand.
EXPLANATION
Fluopyram, a pyridylethylamide broad spectrum fungicide was evaluated for the first time by the 2010 JMPR, where an ADI of 0–0.01 mg/kg bw and an ARfD of 0.5 mg/kg bw were established, and maximum residue levels were recommended for a limited number of uses where GAP information was available.
The 2010 JMPR also established residue definitions for fluopyram:
For plant products (compliance with MRLs and dietary intake assessment): fluopyram.
For animal products (compliance with MRLs): sum of fluopyram and 2-(trifluoromethyl) benzamide, expressed as fluopyram.
For animal products (dietary intake assessment): sum of fluopyram, 2-(trifluoromethyl)benzamide and the combined residues N-{(E)-2-[3-chloro-5-(trifluoromethyl)pyridin-2-yl]ethenyl}-2-trifluoromethyl) benzamide and N-{(Z)-2-[3-chloro-5-(trifluoromethyl)pyridin-2-yl]ethenyl}-2-trifluoromethyl) benzamide, all expressed as fluopyram.
New GAP information, supporting residue data and additional analytical sample storage stability studies were provided by the manufacturer for evaluation by the Meeting.
In this evaluation, the values presented in the tables are as reported in the various studies, but in the accompanying text, they have generally been rounded to two significant digits. Abbreviations have also been used for the various fluopyram metabolites mentioned in the study reports. These are:
• BZM = AE C656948-benzamide
• PAA = AE C656948-pyridyl-acetic acid
• PCA = AE C656948-carboxylic acid
• 7-OH = AE C656948-7-hydroxy
METHODS OF RESIDUE ANALYSIS
Analytical methods
The 2010 JMPR reviewed and summarized analytical method descriptions and validation data for fluopyram and major metabolites (BZM, 7-OH, PCA, PAA and the methyl-sulfoxide) in crop and animal commodities and in soil.
Method GM-001-P07-01
A minor modification of Method 00984 [Ref: 2010 JMPR] was used to measure residues of the parent compound in the new supervised residue trials on grapes and apples and Method 00984 was used in the extended storage stability studies..
Stability of residues in stored analytical samples
The 2010 JMPR reviewed freezer storage stability studies on a range of representative substrates covering those with a high water content (lettuce), a high starch content (wheat grain), a high protein content (dry pea seed), a high oil content (rape seed) and a high acid content (orange) and concluded that fluopyram and major metabolites (BZM, PAA and PCA) are stable in these representative substrates for at least 24 months in frozen storage. The 2010 JMPR also concluded that residues of the
Fluopyram
618
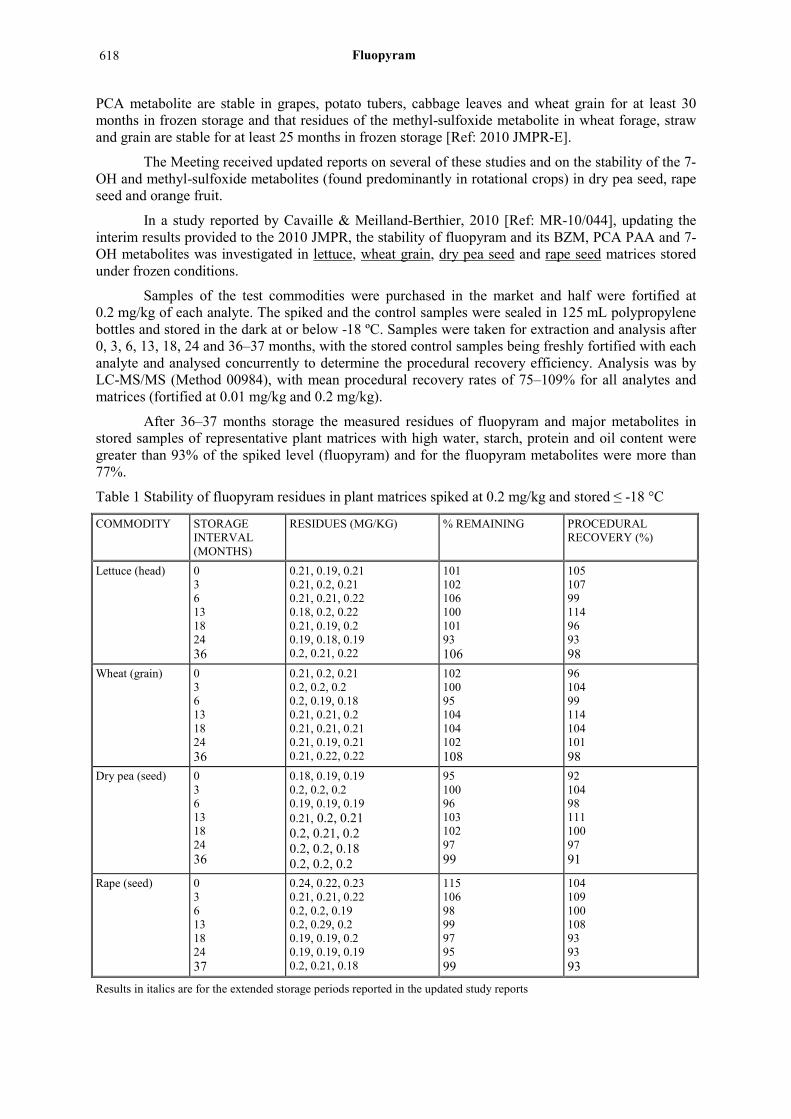
PCA metabolite are stable in grapes, potato tubers, cabbage leaves and wheat grain for at least 30 months in frozen storage and that residues of the methyl-sulfoxide metabolite in wheat forage, straw and grain are stable for at least 25 months in frozen storage [Ref: 2010 JMPR-E].
The Meeting received updated reports on several of these studies and on the stability of the 7-OH and methyl-sulfoxide metabolites (found predominantly in rotational crops) in dry pea seed, rape seed and orange fruit.
In a study reported by Cavaille & Meilland-Berthier, 2010 [Ref: MR-10/044], updating the interim results provided to the 2010 JMPR, the stability of fluopyram and its BZM, PCA PAA and 7-OH metabolites was investigated in lettuce, wheat grain, dry pea seed and rape seed matrices stored under frozen conditions.
Samples of the test commodities were purchased in the market and half were fortified at 0.2 mg/kg of each analyte. The spiked and the control samples were sealed in 125 mL polypropylene bottles and stored in the dark at or below -18 ºC. Samples were taken for extraction and analysis after 0, 3, 6, 13, 18, 24 and 36–37 months, with the stored control samples being freshly fortified with each analyte and analysed concurrently to determine the procedural recovery efficiency. Analysis was by LC-MS/MS (Method 00984), with mean procedural recovery rates of 75–109% for all analytes and matrices (fortified at 0.01 mg/kg and 0.2 mg/kg).
After 36–37 months storage the measured residues of fluopyram and major metabolites in stored samples of representative plant matrices with high water, starch, protein and oil content were greater than 93% of the spiked level (fluopyram) and for the fluopyram metabolites were more than 77%.
Table 1 Stability of fluopyram residues in plant matrices spiked at 0.2 mg/kg and stored ≤ -18 °C
COMMODITY STORAGE INTERVAL (MONTHS)
RESIDUES (MG/KG) % REMAINING PROCEDURAL RECOVERY (%)
Lettuce (head) 0 3 6 13 18 24 36
0.21, 0.19, 0.21 0.21, 0.2, 0.21 0.21, 0.21, 0.22 0.18, 0.2, 0.22 0.21, 0.19, 0.2 0.19, 0.18, 0.19 0.2, 0.21, 0.22
101 102 106 100 101 93 106
105 107 99 114 96 93 98
Wheat (grain) 0 3 6 13 18 24 36
0.21, 0.2, 0.21 0.2, 0.2, 0.2 0.2, 0.19, 0.18 0.21, 0.21, 0.2 0.21, 0.21, 0.21 0.21, 0.19, 0.21 0.21, 0.22, 0.22
102 100 95 104 104 102 108
96 104 99 114 104 101 98
Dry pea (seed) 0 3 6 13 18 24 36
0.18, 0.19, 0.19 0.2, 0.2, 0.2 0.19, 0.19, 0.19 0.21, 0.2, 0.21 0.2, 0.21, 0.2 0.2, 0.2, 0.18 0.2, 0.2, 0.2
95 100 96 103 102 97 99
92 104 98 111 100 97 91
Rape (seed) 0 3 6 13 18 24 37
0.24, 0.22, 0.23 0.21, 0.21, 0.22 0.2, 0.2, 0.19 0.2, 0.29, 0.2 0.19, 0.19, 0.2 0.19, 0.19, 0.19 0.2, 0.21, 0.18
115 106 98 99 97 95 99
104 109 100 108 93 93 93
Results in italics are for the extended storage periods reported in the updated study reports

Fluopyram
619
Table 2 Stability of residues of the BZM metabolite of fluopyram in plant matrices spiked at 0.2 mg/kg and stored ≤ -18 °C
COMMODITY STORAGE INTERVAL (MONTHS)
RESIDUES REMAINING (MG/KG)
% RESIDUES REMAINING
PROCEDURAL RECOVERY (%)
Lettuce (head) 0 3 6 13 18 24 36
0.18, 0.18, 0.19 0.2, 0.19, 0.18 0.19, 0.19, 0.19 0.16, 0.17, 0.17 0.18, 0.19, 0.2 0.18, 0.18, 0.18 0.18, 0.18, 0.18
93 96 95 84 96 89 91
103 103 97 109 91 92 95
Wheat (grain) 0 3 6 13 18 24 36
0.18, 0.19, 0.19 0.2, 0.2, 0.2 0.18, 0.19, 0.19 0.18, 0.17, 0.17 0.19, 0.2, 0.2 0.18, 0.18, 0.18 0.19, 0.18, 0.18
92 101 93 86 99 90 92
92 105 96 110 98 95 93
Dry pea (seed) 0 3 6 13 18 24 36
0.18, 0.18, 0.18 0.2, 0.19, 0.19 0.18, 0.18, 0.18 0.16, 0.16, 0.17 0.18, 0.18, 0.19 0.18, 0.18, 0.17 0.17, 0.18, 0.18
90 96 91 83 92 88 87
90 98 94 108 92 92 93
Rape (seed) 0 3 6 13 18 24 37
0.17, 0.17, 0.17 0.25, 0.25, 0.25 0.2, 0.2, 0.19 0.17, 0.17, 0.18 0.2, 0.2, 0.19 0.17, 0.18, 0.17 0.19, 0.18, 0.18
85 124 97 86 96 86 92
94 124 93 107 91 84 94
Results in italics are for the extended storage periods reported in the updated study reports
Table 3 Stability of residues of the PAA metabolite of fluopyram in plant matrices spiked at 0.2 mg/kg and stored ≤ -18 °C
COMMODITY STORAGE INTERVAL (MONTHS)
RESIDUES REMAINING (MG/KG)
% RESIDUES REMAINING
PROCEDURAL RECOVERY (%)
Lettuce (head) 0 3 6 13 18 24 36
0.19, 0.19, 0.2 0.19, 0.19, 0.18 0.19, 0.19, 0.18 0.17, 0.17, 0.16 0.16, 0.15, 0.17 0.16, 0.16, 0.16 0.15, 0.14, 0.14
95 94 93 83 81 80 73
94 99 96 108 98 92 92
Wheat (grain) 0 3 6 13 18 24 36
0.17, 0.16, 0.17 0.17, 0.18, 0.17 0.17, 0.17, 0.17 0.19, 0.19, 0.18 0.18, 0.19, 0.2 0.17, 0.18, 0.17 0.16, 0.17, 0.16
82 87 86 93 95 88 82
84 91 87 103 95 87 81

Fluopyram
620
COMMODITY STORAGE INTERVAL (MONTHS)
RESIDUES REMAINING (MG/KG)
% RESIDUES REMAINING
PROCEDURAL RECOVERY (%)
Dry pea (seed) 0 3 6 13 18 24 36
0.16, 0.16, 0.17 0.17, 0.17, 0.18 0.17, 0.16, 0.16 0.18, 0.17, 0.18 0.17, 0.19, 0.18 0.16, 0.15, 0.15 0.15, 0.16, 0.17
82 88 83 87 90 77 80
80 88 85 102 85 78 85
Rape (seed) 0 3 6 13 18 24 37
0.18, 0.18, 0.18 0.17, 0.17, 0.17 0.16, 0.18, 0.17 0.19, 0.19, 0.19 0.18, 0.17, 0.18 0.16, 0.17, 0.16 0.15, 0.17, 0.16
91 87 85 96 89 82 80
91 91 89 105 85 80 86
Results in italics are for the extended storage periods reported in the updated study reports
Table 4 Stability of residues of the PCA metabolite of fluopyram in plant matrices spiked at 0.2 mg/kg and stored ≤ -18 °C
COMMODITY STORAGE INTERVAL (MONTHS)
RESIDUES REMAINING (MG/KG)
% RESIDUES REMAINING
PROCEDURAL RECOVERY (%)
Dry pea (seed) 0 3 6 13 18 24 36
0.18, 0.19, 0.18 0.19, 0.21, 0.21 0.19, 0.19, 0.19 0.17, 0.17 0.17, 0.17 0.19, 0.19, 0.18 0.16, 0.18, 0.18
91 101 95 87 87 93 88
89 100 88 85 89 87 90
Rape (seed) 0 3 6 13 18 24 37
0.18, 0.17, 0.18 0.17, 0.17, 0.18 0.19, 0.18, 0.19 0.19, 0.19, 0.19 0.19, 0.21 0.14, 0.13, 0.13 0.13, 0.13, 0.16
88 87 93 95 101 67 70
99 92 91 97 102 64 66
Results in italics are for the extended storage periods reported in the updated study reports
Table 5 Stability of residues of the 7-OH metabolite of fluopyram in plant matrices spiked at 0.2 mg/kg and stored ≤ -18 °C
COMMODITY STORAGE INTERVAL (MONTHS)
RESIDUES REMAINING (MG/KG)
% RESIDUES REMAINING
PROCEDURAL RECOVERY (%)
Lettuce (head) 0 3 6 13 18 24 36
0.21, 0.2, 0.22 0.19, 0.19, 0.2 0.19, 0.2, 0.2 0.2, 0.2, 0.19 0.19, 0.18, 0.2 0.19, 0.19, 0.19 0.2, 0.2, 0.2
104 98 98 98 96 95 101
108 104 101 111 97 97 97

Fluopyram
621
COMMODITY STORAGE INTERVAL (MONTHS)
RESIDUES REMAINING (MG/KG)
% RESIDUES REMAINING
PROCEDURAL RECOVERY (%)
Wheat (grain) 0 3 6 13 18 24 36
0.21, 0.2, 0.21 0.2, 0.2, 0.2 0.19, 0.19, 0.19 0.21, 0.2, 0.21 0.2, 0.2, 0.19 0.2, 0.19, 0.19 0.2, 0.2, 0.2
104 101 94 104 97 97 99
99 107 100 116 95 98 97
Results in italics are for the extended storage periods reported in the updated study reports
In a study reported by Cavaille & Meilland-Berthier, 2010 [Ref: MR-08/036], updating the
interim results provided to the 2010 JMPR, the stability of fluopyram and its BZM, PCA and PAA metabolites was investigated in orange fruit stored under frozen conditions.
Oranges were purchased in the market and half were fortified at 0.2 mg/kg of each analyte. The spiked and the control samples were sealed in 125 mL polypropylene bottles and stored in the dark at or below -18 °C. Samples were taken for extraction and analysis after 0, 4, 6, 12, 19, 24 and 36 months, with the stored control samples being freshly fortified with each analyte and analysed concurrently to determine the procedural recovery efficiency. Analysis was by LC-MS/MS (Method 00984), with mean procedural recovery rates of 70–107% for all analytes and matrices (fortified at 0.01 mg/kg and 0.2 mg/kg).
After 36 months storage the measured residues of fluopyram and major metabolites in stored samples of orange (representing matrices with high acid content) were greater than 95% of the nominal level (0.2 mg/kg) except for the PAA metabolite, where levels decreased to about 60% after 36 months storage.
Table 6 Residue stability of fluopyram and major plant metabolites in orange fruit spiked at 0.2 mg/kg and stored ≤ -18 °C
ANALYTE STORAGE INTERVAL (MONTHS)
RESIDUES REMAINING (MG/KG)
% RESIDUES REMAINING
PROCEDURAL RECOVERY (%)
Fluopyram 0 4 6 12 19 24 36
0.22, 0.2, 0.22 0.2, 0.2, 0.2 0.21, 0.21, 0.21 0.21, 0.19, 0.2 0.2, 0.2, 0.18 0.19, 0.19, 0.18 0.2, 0.22, 0.22
107 100 104 101 97 93 107
103 97 100 98 93 94 107
BZM 0 4 6 12 19 24 36
0.21, 0.2, 0.2 0.17, 0.17, 0.17 0.17, 0.2, 0.18 0.19, 0.2, 0.2 0.18, 0.19, 0.18 0.18, 0.18, 0.19 0.21, 0.19, 0.2
102 86 87 98 92 91 100
102 93 93 94 90 90 97
PAA 0 4 6 12 19 24 36
0.18, 0.18, 0.18 0.16, 0.17, 0.17 0.16, 0.15, 0.15 0.12, 0.11, 0.12 0.12, 0.13, 0.12 0.12, 0.12, 0.11 0.1, 0.1, 0.1
91 83 78 58 62 57 48
88 91 81 72 85 83 79

Fluopyram
622
ANALYTE STORAGE INTERVAL (MONTHS)
RESIDUES REMAINING (MG/KG)
% RESIDUES REMAINING
PROCEDURAL RECOVERY (%)
PCA 0 4 6 12 19 24 36
0.21, 0.2, 0.2 0.19, 0.19, 0.19 0.19, 0.19, 0.2 0.19, 0.2, 0.18 0.18, 0.18 0.18, 0.18 0.2, 0.19
102 96 96 95 93 92 98
99 99 95 101 93 96 96
Results in italics are for the extended storage periods reported in the updated study reports
In a study reported by Cavaille & Meilland-Berthier, 2010 [Ref: MR-10/045], the stability of
the 7-OH and methyl-sulfoxide metabolites of fluopyram was investigated in dry pea seed, rape seed and orange fruit stored under frozen conditions.
Samples of dry pea seed, rape seed and orange were fortified at 0.2 mg/kg of each analyte with the spiked and the control samples stored in sealed 125 mL polypropylene bottles in the dark at or below -18 °C. Samples were taken for extraction and analysis at various intervals up 24–25 months, with the stored control samples being freshly fortified with each analyte and analysed concurrently to determine the procedural recovery efficiency. Analysis was by LC-MS/MS (Method 00984), with mean procedural recovery rates of 73–122% for both analytes and all matrices (fortified at 0.01 mg/kg and 0.2 mg/kg).
After 24–25 months frozen storage, the measured residues of the 7-OH and –methyl sulfoxide metabolites of fluopyram in stored samples of orange (representing matrices with high acid content), dry pea seed (representing high protein matrices) and rape seed (representing oily matrices) were greater than 92% of the nominal level (0.2 mg/kg).
Table 7 Stability of methyl-sulfoxide metabolite of fluopyram residues in plant matrices spiked at 0.2 mg/kg and stored ≤ -18 °C
COMMODITY STORAGE INTERVAL (MONTHS)
RESIDUES (MG/KG) % REMAINING PROCEDURAL RECOVERY (%)
Orange 0 3 7 12 18 25
0.2, 0.2, 0.2 0.22, 0.21, 0.21 0.23, 0.2, 0.21 0.24, 0.23, 0.22 0.2, 0.21, 0.19 0.22, 0.22, 0.22
100 105 107 115 99 112
100 103 109 120 101 120
Dry pea (seed) 0 4 7 13 19 25
0.2, 0.2, 0.2 0.16, 0.16, 0.16 0.21, 0.2, 0.19 0.22, 0.2, 0.2 0.19, 0.18, 0.18 0.19, 0.2, 0.19
99 81 100 103 91 96
91 82 99 108 92 104
Rape (seed) 0 3 6 12 18 24
0.19, 0.21, 0.21 0.21, 0.22, 0.21 0.21, 0.21, 0.21 0.22, 0.21, 0.23 0.2, 0.21, 0.19 0.2, 0.21, 0.22
100 106 104 109 99 104
100 106 108 109 103 113

Fluopyram
623
Table 8 Stability of 7-OH metabolite of fluopyram residues in plant matrices spiked at 0.2 mg/kg and stored ≤ -18 °C
COMMODITY STORAGE INTERVAL (MONTHS)
RESIDUES (MG/KG) % REMAINING PROCEDURAL RECOVERY (%)
Orange 0 3 7 12 18 25
0.2, 0.2, 0.2 0.18, 0.18, 0.18 0.2, 0.19, 0.19 0.2, 0.2, 0.2 0.2, 0.2, 0.19 0.22, 0.2, 0.2
100 91 97 101 100 103
100 95 94 99 101 104
Dry pea (seed) 0 4 7 13 19 25
0.2, 0.2, 0.2 0.17, 0.18, 0.16 0.19, 0.2, 0.19 0.2, 0.19, 0.18 0.18, 0.18, 0.19 0.19, 0.19, 0.19
99 81 100 103 91 96
91 82 99 108 92 104
Rape (seed) 0 3 6 12 18 24
0.2, 0.19, 0.2 0.18, 0.18, 0.19 0.18, 0.18, 0.18 0.18, 0.19, 0.18 0.19, 0.18, 0.19 0.19, 0.19, 0.19
96 91 91 92 93 95
98 96 93 94 95 98
USE PATTERNS
Information on GAP in Canada, Germany, Guatemala, Morocco, Panama, Turkey, the Ukraine and the USA was provided to the Meeting for foliar applications to a range of fruit, vegetables, pulses, tree nuts and oil seed crops, and summarized in the following Table.
Table 9 Registered uses of fluopyram (SC formulations) 2012
Crop Country Application Max/season PHI (days)
Remarks:
method kg ai/ha kg ai/hL water L/ha (min) no kg ai/ha Pome fruits
Apple Canada spray 0.15 500 3 0.5 7 7–14 d intervals
Apple Turkey spray b 0.007 14 10–12 d intervals
Apple Ukraine spray c 0.06–0.08 2 20
Apple USA spray 0.09–0.25 470 0.5 7 7–10 d intervals
Apple USA spray a 0.09–0.15 470 0.5 72 7–10 d intervals
Apple USA spray b 0.07–0.15 470 0.5 75 7–10 d intervals
Apple USA spray c 0.06–0.11 470 0.39 14 7–14 d intervals
Pear Turkey spray b 0.007 14 10–12 d intervals
Pome fruit Germany spray b 0.025–0.05 /metre canopy height
up to 500/ha/metre canopy height
4 14 14 d intervals
Stone fruits
Apricot Turkey spray b 0.005 2 14 Up to full flowering
Cherries Canada spray 0.125 500 3 0.375 0 14 d intervals
Cherries Turkey spray b 0.005 3 3 Over flowering and at colour change
Cherries USA spray 0.1 470 (ground) 140 (air)
0.21 0 5–7 d intervals

Fluopyram
624
Crop Country Application Max/season PHI (days)
Remarks:
method kg ai/ha kg ai/hL water L/ha (min) no kg ai/ha Cherries USA spray b 0.08–0.1 470 (ground)
140 (air) 0.21 0 7 d intervals
Cherries USA spray c 0.06–0.1 470 (ground) 140 (air)
0.21 1 7–14 d intervals
Peach Turkey spray b 0.005 3 10–14 d intervals
Peach Ukraine spray c 0.06–0.08 3 30
Berries & other small fruit
Grapes (wine)
Canada spray 0.25 500 2 0.5 7
Grapes (wine)
Germany spray b 0.025–0.25 0.006 400–1600 3 28 12–14 d intervals
Grapes Romania spray 0.2–0.25 800–1000 2 0.5 3 (table) 12 (wine)
See 2010 JMPR
Grapes (wine)
Turkey spray b 0.005 14 14 d intervals
Grapes (wine)
USA spray 0.09–0.25 470 0.5 7 12–21 d intervals
Grapes (wine)
USA spray a 0.09–0.25 470 0.5 7 12–21 d intervals
Grapes (wine)
USA spray b 0.07–0.13 470 0.5 14
Grapes (wine)
USA spray c 0.04–0.14 470 6 0.5 14 12–21 d intervals
Strawberries Canada drip irrig
0.25 0.5 0 5–7 d intervals
Strawberries Morocco spray c 0.015 2 3 7 d interval Strawberries USA drip
irrig 0.25 0.5 0 (field)
1(indoor) 5–7 d intervals Min 4 ha greenhouses
Other fruit Banana Panama spray 0.08–0.1 NS (ground)
12–15 (air) 5 0 With 7–10 L oil/ha
(air) Bulb vegetables Garlic Guatemala spray b 0.08–0.1 4 7 7–14 d intervals Garlic Panama spray b 0.08–0.1 400–600 (ground)
50–100 (air) 4 7 7–14 d intervals
Leek Guatemala spray b 0.08–0.1 4 7 7–14 d intervals Leek Panama spray b 0.08–0.1 400–600 (ground)
50–100 (air) 4 7 7–14 d intervals
Onion Guatemala spray b 0.08–0.1 4 7 7–14 d intervals Onion Panama spray b 0.08–0.1 400–600 (ground)
50–100 (air) 4 7 7–14 d intervals
Brassica vegetables Broccoli Guatemala spray b 0.08–0.1 4 7 7–14 d intervals Broccoli Panama spray b 0.08–0.1 400–600 (ground)
50–100 (air) 4 7 7–14 d intervals
Cabbage Guatemala spray b 0.08–0.1 4 7 7–14 d intervals Cabbage Panama spray b 0.08–0.1 400–600 (ground)
50–100 (air) 4 7 7–14 d intervals
Cabbage Ukraine spray b 0.07–0.15 2 30

Fluopyram
625
Crop Country Application Max/season PHI (days)
Remarks:
method kg ai/ha kg ai/hL water L/ha (min) no kg ai/ha Cauliflower Guatemala spray b 0.08–0.1 4 7 7–14 d intervals Cauliflower Panama spray b 0.08–0.1 400–600 (ground)
50–100 (air) 4 7 7–14 d intervals
Cucurbits Cucumber China spray 0.038–0.075 3 2 See 2010 JMPR Cucumber Guatemala spray b 0.08–0.1 4 7 7–14 d intervals Cucumber Panama spray b 0.08–0.1 400–600 (ground)
50–100 (air) 4 7 7–14 d intervals
Cucumber Ukraine spray b 0.07–0.15 2 14 Cucumber (indoor)
Turkey spray b 0.006 3 10 d intervals
Melons Guatemala spray b 0.08–0.1 4 7 7–14 d intervals Melons Panama spray b 0.08–0.1 400–600 (ground)
50–100 (air) 4 7 7–14 d intervals
Squash (indoor)
Turkey spray b 0.006 3 10 d intervals
Watermelon Canada spray 0.08–0.25 200 6 0.5 0 7–14 d intervals Watermelon Guatemala spray b 0.08–0.1 4 7 7–14 d intervals Watermelon Panama spray b 0.08–0.1 400–600 (ground)
50–100 (air) 4 7 7–14 d intervals
Watermelon USA drip irrig
0.25 0.5 7 5–10 d intervals Min 4 ha greenhouses
Watermelon USA spray 0.09–0.25 94 (ground) 0.5 0(field) 3(indoor)
7–14 d intervals Min 4 ha greenhouses
Watermelon USA spray b 0.07–0.25 94 (ground) 0.5 7 10–14 d intervals Min 4 ha greenhouses
Watermelon USA spray c 0.06–0.14 94 (ground) 4 0.5 0(field) 3(indoor)
10–14 d intervals Min 4 ha greenhouses
Zucchini Guatemala spray b 0.08–0.1 4 7 7–14 d intervals Zucchini Panama spray b 0.08–0.1 400–600 (ground)
50–100 (air) 4 7 7–14 d intervals
Fruiting vegetables Eggplant Guatemala spray b 0.08–0.1 4 7 7–14 d intervals Eggplant Turkey spray b 0.006 3 Peppers Guatemala spray b 0.08–0.1 4 7 7–14 d intervals Peppers Panama spray b 0.08–0.1 400–600 (ground)
50–100 (air) 4 7 7–14 d intervals
Peppers Turkey spray b 0.006 3 Tomato Guatemala spray b 0.08–0.1 4 7 7–14 d intervals Tomato Morocco spray c 0.008–0.0125 2 3 7 d interval Tomato Panama spray b 0.08–0.1 400–600 (ground)
50–100 (air) 4 7 7–14 d intervals
Tomato Turkey spray b 0.006 3 Tomato Ukraine spray b 0.07–0.15 2 14 Legume vegetables Beans (incl string beans)
Guatemala spray b 0.08–0.1 4 7 7–14 d intervals

Fluopyram
626
Crop Country Application Max/season PHI (days)
Remarks:
method kg ai/ha kg ai/hL water L/ha (min) no kg ai/ha Beans (incl string beans)
Panama spray b 0.08–0.1 400–600 (ground) 50–100 (air)
4 7 7–14 d intervals
Peas Guatemala spray b 0.08–0.1 4 7 7–14 d intervals Peas Panama spray b 0.08–0.1 400–600 (ground)
50–100 (air) 4 7 7–14 d intervals
Pulses Beans (dry) g
Canada spray 0.08–0.15 200 0.3 14 7–14 d intervals No grazing or for animal feed
Beans (dry) g
USA spray 0.15 94 (ground) 47 (air)
0.3 14 7–14 d intervals No grazing or for animal feed
Beans (dry) g
USA spray d 0.1–0.15 94 (ground) 47 (air)
0.3 14 7 (cutting)
7–14 d intervals No grazing or for animal feed
Root & tuber vegetables Carrot Guatemala spray b 0.08–0.1 4 7 7–14 d intervals Carrot Panama spray b 0.08–0.1 400–600 (ground)
50–100 (air) 4 7 7–14 d intervals
Carrot Ukraine spray b 0.07–0.15 2 30 Potato Canada spray 0.08–0.15 200 (ground)
50 (air) 0.4 7 7–12 d intervals
Potato Guatemala spray b 0.08–0.1 4 7 7–14 d intervals Potato Panama spray b 0.08–0.1 400–600 (ground)
50–100 (air) 4 7 7–14 d intervals
Potato USA spray 0.15–0.2 (ground) 0.1 (air)
94 (ground) 47 (air)
0.4 (ground) 0.31 (air)
7 5–7 d intervals
Potato USA spray a 0.1 (ground) 0.1 (air)
94 (ground) 47 (air)
0.4 (ground) 0.3 (air)
7 7–14 d intervals
Potato USA spray c 0.09–0.11 (ground) 0.1 (air)
94 (ground) 47 (air)
4 0.4 (ground) 0.31 (air)
7 14 d intervals
Sugar beet USA spray 0.125 94 (ground) 0.25 7 5–7 d intervals Sugar beet USA spray c 0.126 94 (ground) 0.25 21 10–21 d intervals Sugar beet USA spray d 0.125 94 (ground) 0.25 7 14 d intervals Tree nuts Almond Canada spray 0.12–0.25 500 0.5 14 14 d intervals Almond USA spray a 0.11–0.25 470 (ground)
140 (air) 0.5 30 7–14 d intervals
Almond USA spray b 0.07–0.25 470 (ground) 140 (air)
0.5 35 7–14 d intervals
Almond USA spray c 0.07–0.14 470 (ground) 140 (air)
4 0.5 60 7–14 d intervals Up to hull split
Pecan USA spray b 0.13–0.25 470 (ground) 140 (air)
0.5 14 d intervals Up to shuck split
Pecan USA spray c 0.07–0.14 470 (ground) 140 (air)
6 0.5 30 14 d intervals Up to shuck split
Pistachio USA spray a 0.15–0.25 470 (ground) 140 (air)
0.5 30 7–14 d intervals

Fluopyram
627
Crop Country Application Max/season PHI (days)
Remarks:
method kg ai/ha kg ai/hL water L/ha (min) no kg ai/ha Pistachio USA spray b 0.09–0.25 470 (ground)
140 (air) 0.5 35
Pistachio USA spray c 0.09–0.14 470 (ground) 140 (air)
4 0.42 28 14–21 d intervals
Tree nuts f USA spray 0.12–0.25 470 (ground) 140 (air)
0.5 14 7–14 d intervals
Tree nuts f USA spray b 0.13–0.25 470 (ground) 140 (air)
0.5 35 except almonds, pecans, pistachio 7–14 d intervals
Tree nuts f USA spray c 0.1–0.14 470 (ground) 140 (air)
0.28 60 except almonds, pecans, pistachio 7–14 d intervals
Oilseeds Oil seed rape
Germany spray e 0.125 200–400 1 End of flowering
Oil seed rape
Ukraine spray e 0.1–0.11 2 30
Peanut USA spray b 0.18–0.23 94 (ground) 47 (air)
0.5 14 14 d intervals No grazing or for animal feed
Peanut USA spray c 0.13 94 (ground) 47 (air)
0.5 14 14 d intervals No grazing or for animal feed
Peanut USA spray d 0.2 94 (ground) 47 (air)
0.82 14 14 d intervals No grazing or for animal feed
Peanut Canada spray 0.12–0.25 200 0.5 7 14 d intervals No grazing or for animal feed
Peanut USA spray 0.2–0.25 94 (ground) 47 (air)
0.5 7 14 d intervals No grazing or for animal feed
Sunflower Ukraine spray e 0.1–0.11 2 50 a SC formulation containing 125 g ai/L fluopyram + 374 g ai/L pyrimethanil b SC formulation containing 200 g ai/L fluopyram + 200 g ai/L tebuconazole c SC formulation containing 250 g ai/L fluopyram + 250 g ai/L trifloxystrobin d SC formulation containing 200 g ai/L fluopyram + 200 g ai/L prothioconazole e SE formulation containing 125 g ai/L fluopyram + 125 g ai/L prothioconazole f Tree nuts = almond, beech nut, Brazil nut, butternut, cashew, chestnut, chinquapin, filbert (hazelnut), hickory nut, macadamia nut, pecan, pistachio, walnuts g Dry beans = Dried Shelled Bean, Bean (Lupinus spp., includes grain lupin, sweet lupin, white lupin, and white sweet lupin), Bean (Phaseolus spp., includes field bean, kidney bean, lima bean (dry), navy bean, pinto bean, tepary bean), Bean (Vigna spp., includes adzuki bean, black-eyed pea, catjang, Crowder pea, moth bean, mung bean, rice bean, Southern pea, Urd bean), Other Beans [Broad bean (dry), chickpea, Lablab bean, Lentil].
RESIDUES RESULTING FROM SUPERVISED TRIALS ON CROPS
The Meeting received new information on supervised field trials involving foliar applications of fluopyram to the following crops.
Crop group Commodity Country Table No. Pome fruit Apple Canada, USA Table 10 Berries & small fruit Grapes (wine) USA Table 14 Fruiting vegetables Peppers, Sweet Turkey Table 17

Fluopyram
628
The supervised trials were well documented with laboratory and field reports. Laboratory
reports included method validation including procedural recoveries with spiking at residue levels similar to those occurring in samples from the supervised trials. Dates of analyses or duration of residue sample storage were also provided. Although trials included control plots, no control data are recorded in the tables unless residues in control samples exceeded the LOQ. Residue data are recorded unadjusted for recovery.
When multiple applications were made to a crop, the application rate, spray concentration and spray volume were not always identical from one application to the next. If the variation was small, only the final values for application rate, concentration and spray volume were recorded. For larger variations all values were recorded.
Intervals of freezer storage between sampling and analysis were recorded for all trials and were covered by the conditions of the freezer storage stability studies.
Results from replicated field plots are presented as individual values. When residues were not detected they are shown as below the LOQ (e.g., < 0.01 mg/kg). Residues and application rates have been rounded to two significant digits (or if close to the LOQ, rounded to one significant digit). Average values and proportionally adjusted residues have been calculated from the residue results prior to rounding and the results from trials used for the estimation of maximum residue levels have been (underlined).
The results from trials previously evaluated by the 2010 JMPR and either matching critical GAP or where the results can be proportionally adjusted (scaled) to reflect GAP application rates are summarized in the following ‘Interpretation tables’. The approach used to scale the results from trials where the application rates range from 0.33× GAP to 5× GAP (but otherwise match the critical GAP) is described in the Report of the 2010 JMPR (Section 2.8).
Crop group Commodity Country Table No.
Pome fruit Apples Canada, USA Table 11 Stone fruit Cherries
Peaches USA S Europe
Table 12 Table 13
Berries & small fruit Strawberries USA Table 15 Assorted tropical fruit Bananas C America Table 16 Fruiting vegetables Sweet peppers, Tomatoes Europe Tables 18, 19 Pulses Beans (dry) USA Table 20 Root & tuber vegetables Carrots
Potatoes, Sugar beet N Europe USA
Table 21 Tables 22, 23
Tree nuts Almonds, Pecans USA Tables 24, 25 Oilseeds Peanuts
Rape seed USA N Europe
Table 26 Table 27
Animal feedstuffs Sugar beet tops Almond hulls
USA USA
Table 28 Table 29
Pome fruits
Apples
Results from supervised trials from the USA on apples and pears were provided to the Meeting. In these trials, three applications of fluopyram (SC 500 formulation) were made with spray adjuvant to mature, full-sized trees 12–14 days apart as foliar sprays using ground-based airblast equipment. At most sites, two application methods were used, one involving low volume sprays (440–630 L/ha) and one using high volume treatments (1900–2600 L/ha). Plot sizes in these trials ranged from 29–290 m2 and involved at least four trees per plot.
Duplicate samples of at least 2 kg fruit were taken from at least four trees/plot, frozen within 4 hours of sampling and stored at -15 °C for up to 225 days before whole fruit was analyzed for

Fluopyram
629
fluopyram using LC/MS/MS Method GM-001-P07-01. The reported LOQ was 0.01 mg/kg and the mean recovery rates in samples spiked with 0.01–0.5 mg/kg fluopyram ranged from 90–103%.
Table 10 Residues on apples from trials in Canada and the USA involving foliar applications of fluopyram (500 SC formulations)
APPLES Country, year Location (variety)
Application PHI (days)
Residues (mg/kg) Reference & Comments no kg ai/ha water
(L/ha) kg ai/hL Fluopyram mean
USA, 2009 Hereford, PA (Starkrimson Red Delicious)
3 b 0.1 2200 0.005 12 0.08, 0.07 0.07 RAGMP162 GM001-09HA-B
USA, 2009 Hereford, PA (Starkrimson Red Delicious)
3 a 0.1 530 0.019 12 0.09, 0.09 0.09 RAGMP162 GM001-09HA-A
USA, 2009 Alton, NY (Cortland)
3 b 0.1 1900 0.005 14 0.08, 0.07 0.07 RAGMP162 GM002-09HA-B
USA, 2009 Alton, NY (Cortland)
3 a 0.1 560 0.018 14 0.1, 0.09 0.1 RAGMP162 GM002-09HA-A
USA, 2009 North Rose, NY (Rome)
3 b 0.1 2100 0.005 14 0.1, 0.1 0.1 RAGMP162 GM003-09HA-B
USA, 2009 North Rose, NY (Rome)
3 a 0.1 610 0.016 14 0.08, 0.08 0.08 RAGMP162 GM003-09HA-A
USA, 2009 Alto, GA (Stayman Red)
3 b 0.1 2600 0.004 14 0.07, 0.07 0.07 RAGMP162 GM004-09HA-B
USA, 2009 Alto, GA (Stayman Red)
3 a 0.1 580 0.017 14 0.05, 0.05 0.05 RAGMP162 GM004-09HA-A
USA, 2009 Arkansaw, WI (Connel Red)
3 b 0.1 1900 0.005 14 0.15, 0.16 0.15 RAGMP162 GM005-09HA-B
USA, 2009 Arkansaw, WI (Connel Red)
3 a 0.1 480 0.021 14 0.14, 0.12 0.13 RAGMP162 GM005-09HA-A
USA, 2009 Conklin, MI (Red Delicious)
3 b 0.1 2300 0.004 14 0.07, 0.07 0.07 RAGMP162 GM006-09HA-B
USA, 2009 Conklin, MI (Red Delicious)
3 a 0.1 580 0.017 14 0.09, 0.08 0.08 RAGMP162 GM006-09HA-A
Canada, 2009 Branchton, ON (Northern Spy)
3 b 0.096 2000 0.005 14 0.04, 0.04 0.04 RAGMP162 GM007-09HA-B
Canada, 2009 Branchton, ON (Northern Spy)
3 a 0.1 620 0.016 14 0.07, 0.06 0.06 RAGMP162 GM007-09HA-A
Canada, 2009 Waterdown, ON (Mutsu -crispin)
3 b 0.1 1900–2300 0.005-0.004 14 0.07, 0.09 0.08 RAGMP162 GM008-09HA-B
Canada, 2009 Waterdown, ON (Mutsu -crispin)
3 a 0.1 470–550 0.021-0.018 14 0.1, 0.12 0.11 RAGMP162 GM008-09HA-A

Fluopyram
630
APPLES Country, year Location (variety)
Application PHI (days)
Residues (mg/kg) Reference & Comments no kg ai/ha water
(L/ha) kg ai/hL Fluopyram mean
Canada, 2009 Simcoe (Royal Gala)
3 b 0.1 2200 0.005 14 0.05, 0.05 0.05 RAGMP162 GM009-09HA-B
Canada, 2009 Simcoe (Royal Gala)
3 a 0.1 530 0.019 14 0.07, 0.05 0.06 RAGMP162 GM009-09HA-A
USA, 2009 Arkansaw, WI (Regents)
3 b 0.1 1900 0.005 14 0.09, 0.09 0.09 RAGMP162 GM010-09HA-B
USA, 2009 Arkansaw, WI (Regents)
3 a 0.1 480 0.021 14 0.06, 0.07 0.06 RAGMP162 GM010-09HA-A
USA, 2009 Hart, MI (Golden Delicious)
3 b 0.1 2100 0.005 0 7 14 17 21
0.28, 0.43 0.19, 0.28 0.22, 0.25 0.22, 0.27 0.17, 0.26
0.35 0.24 0.23 0.24 0.21
RAGMP162 GM011-09DA-B
USA, 2009 Hart, MI (Golden Delicious)
3 a 0.1 500–480 0.02-0.021 14 0.15, 0.25 0.2 RAGMP162 GM011-09DA-A
USA, 2009 Perry, UT (Gala)
3 b 0.1 1900–2000 0.005 14 0.1, 0.11 0.11 RAGMP162 GM012-09HA-B
USA, 2009 Perry, UT (Gala)
3 a 0.1 580–500 0.017-0.02 14 0.13, 0.14 0.14 RAGMP162 GM012-09HA-A
USA, 2009 Sanger, CA (Pink Lady)
3 b 0.1 2300–2100 0.004-0.005 14 0.04, 0.04 0.04 RAGMP162 GM013-09HA-B
USA, 2009 Sanger, CA (Pink Lady)
3 a 0.1 580–440 0.02-0.023 14 0.03, 0.03 0.03 RAGMP162 GM013-09HA-A
USA, 2009 Hood River, OR (Jonagold)
3 b 0.1 2400–2500 0.004 14 0.08, 0.07 0.08 RAGMP162 GM014-09HA-B
USA, 2009 Hood River, OR (Jonagold)
3 a 0.1 560–540 0.019 14 0.09, 0.04 0.06 RAGMP162 GM014-09HA-A
USA, 2009 Ephrata, WA (Red Delicious)
3 b 0.1 1900 0.005 14 0.11, 0.13 0.12 RAGMP162 GM015-09HA-B
USA, 2009 Ephrata, WA (Red Delicious)
3 a 0.1 470 0.021 14 0.16, 0.21 0.18 RAGMP162 GM015-09HA-A
USA, 2009 Ephrata, WA (Braeburn)
3 b 0.1 1900 0.005 14 0.07, 0.09 0.08 RAGMP162 GM016-09HA-B
USA, 2009 Ephrata, WA (Braeburn)
3 a 0.1 470 0.021 14 0.15, 0.14 0.14 RAGMP162 GM016-09HA-A
USA, 2009 Weiser, ID (Law Rome)
3 b 0.1 1900 0.005 0 7 14 17 20
0.14, 0.13 0.11, 0.11 0.11, 0.12 0.12, 0.1 0.1, 0.1
0.14 0.11 0.11 0.11 0.1
RAGMP162 GM017-09DA-B
Fluopyram
631
APPLES Country, year Location (variety)
Application PHI (days)
Residues (mg/kg) Reference & Comments no kg ai/ha water
(L/ha) kg ai/hL Fluopyram mean
USA, 2009 Weiser, ID (Law Rome)
3 a 0.1 560 0.018 14 0.14, 0.12 0.13 RAGMP162 GM017-09DA-A
All treatments included 0.125% v/v/ ‘Induce’ spray adjuvant a = low volume airblast application d =high volume airblast application
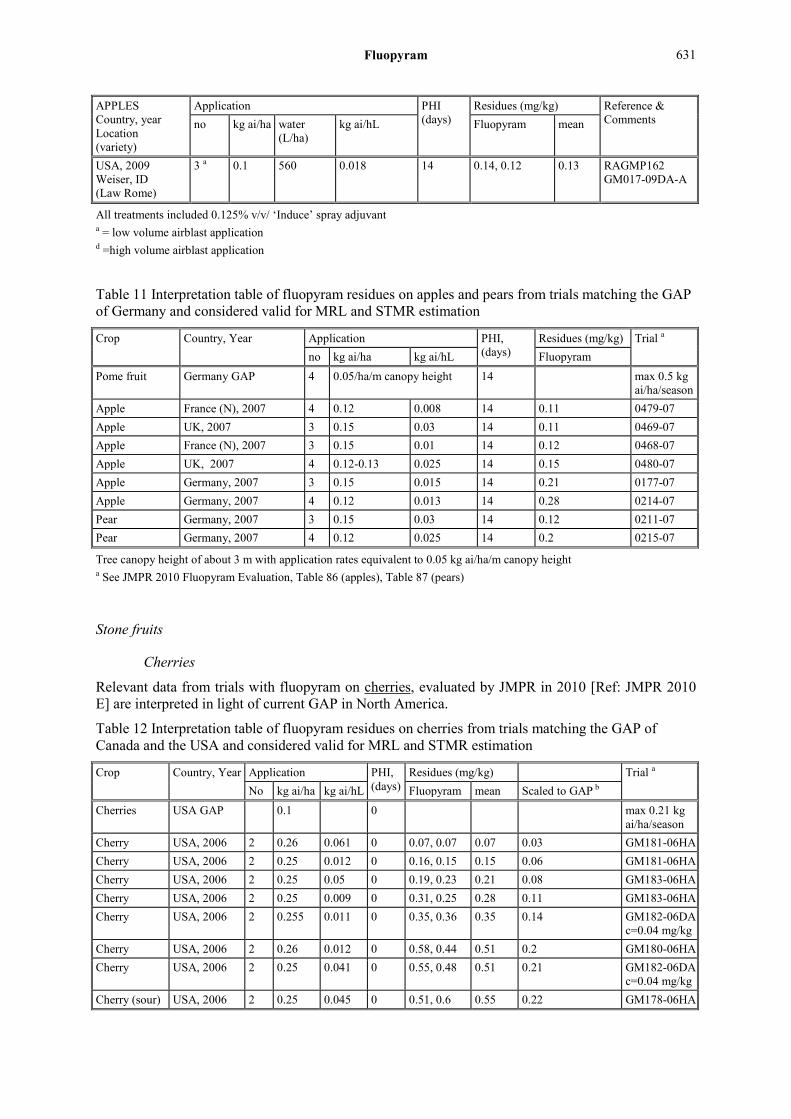
Table 11 Interpretation table of fluopyram residues on apples and pears from trials matching the GAP of Germany and considered valid for MRL and STMR estimation
Crop Country, Year Application PHI, (days)
Residues (mg/kg) Trial a no kg ai/ha kg ai/hL Fluopyram
Pome fruit Germany GAP 4 0.05/ha/m canopy height 14 max 0.5 kg ai/ha/season
Apple France (N), 2007 4 0.12 0.008 14 0.11 0479-07 Apple UK, 2007 3 0.15 0.03 14 0.11 0469-07 Apple France (N), 2007 3 0.15 0.01 14 0.12 0468-07 Apple UK, 2007 4 0.12-0.13 0.025 14 0.15 0480-07 Apple Germany, 2007 3 0.15 0.015 14 0.21 0177-07 Apple Germany, 2007 4 0.12 0.013 14 0.28 0214-07 Pear Germany, 2007 3 0.15 0.03 14 0.12 0211-07 Pear Germany, 2007 4 0.12 0.025 14 0.2 0215-07
Tree canopy height of about 3 m with application rates equivalent to 0.05 kg ai/ha/m canopy height a See JMPR 2010 Fluopyram Evaluation, Table 86 (apples), Table 87 (pears)
Stone fruits
Cherries
Relevant data from trials with fluopyram on cherries, evaluated by JMPR in 2010 [Ref: JMPR 2010 E] are interpreted in light of current GAP in North America.
Table 12 Interpretation table of fluopyram residues on cherries from trials matching the GAP of Canada and the USA and considered valid for MRL and STMR estimation
Crop Country, Year Application PHI, (days)
Residues (mg/kg) Trial a No kg ai/ha kg ai/hL Fluopyram mean Scaled to GAP b
Cherries USA GAP 0.1 0 max 0.21 kg ai/ha/season
Cherry USA, 2006 2 0.26 0.061 0 0.07, 0.07 0.07 0.03 GM181-06HA Cherry USA, 2006 2 0.25 0.012 0 0.16, 0.15 0.15 0.06 GM181-06HA Cherry USA, 2006 2 0.25 0.05 0 0.19, 0.23 0.21 0.08 GM183-06HA Cherry USA, 2006 2 0.25 0.009 0 0.31, 0.25 0.28 0.11 GM183-06HA Cherry USA, 2006 2 0.255 0.011 0 0.35, 0.36 0.35 0.14 GM182-06DA
c=0.04 mg/kg Cherry USA, 2006 2 0.26 0.012 0 0.58, 0.44 0.51 0.2 GM180-06HA Cherry USA, 2006 2 0.25 0.041 0 0.55, 0.48 0.51 0.21 GM182-06DA
c=0.04 mg/kg Cherry (sour) USA, 2006 2 0.25 0.045 0 0.51, 0.6 0.55 0.22 GM178-06HA

Fluopyram
632
Crop Country, Year Application PHI, (days)
Residues (mg/kg) Trial a No kg ai/ha kg ai/hL Fluopyram mean Scaled to GAP b
Cherry (sour) USA, 2006 2 0.26 0.053 0 0.64, 0.5 0.57 0.22 GM179-06HA Cherry (sour) USA, 2006 2 0.25 0.011 0 0.66, 0.6 0.63 0.25 GM179-06HA Cherry USA, 2006 2 0.25 0.041 0 0.64, 0.64 0.64 0.26 GM180-06HA Cherry (sour) USA, 2006 2 0.25 0.013 0 1.2, 1.1 1.17 0.47 GM178-06HA a See JMPR 2010 Fluopyram Evaluation, Table 92 b Mean residues scaled to GAP application rate
Peach
Relevant data from trials with fluopyram on peaches, evaluated by JMPR in 2010 [Ref: JMPR 2010 E] are interpreted in light of current GAP of Turkey.
Table 13 Interpretation table of fluopyram residues on peaches from trials matching the GAP iof Turkey and considered valid for MRL and STMR estimation
Crop Country, Year Application PHI, (days)
Residues (mg/kg) Trial a
No kg ai/ha kg ai/hL Fluopyram Scaled to GAP b Peaches Turkey GAP 0.005 3 Peach Portugal, 2006 3 0.124 0.017 3 0.11 0.03 0489-06 Peach France, 2006 3 0.124 0.012 3 0.15 0.06 0362-06 Peach Italy, 2006 3 0.124 0.01 3 0.2 0.1 0487-06 Peach France, 2007 3 0.125 0.01 3 0.24 0.12 0225-07 Peach Spain, 2007 3 0.125 0.01 2 0.33 0.14 0496-07 Peach Spain, 2006 3 0.124 0.01 3 0.34 0.16 0488-06 Peach Italy, 2007 3 0.125 0.012 3
7 10
0.27 0.27 0.34
0.11 0.11 0.16
0497-07
Peach Greece, 2007 3 0.125 0.018 3 0.26 0.17 0498-07 a See JMPR 2010 Fluopyram Evaluation, Table 90 b Mean residues scaled to GAP application rate
Berries and other small fruits
Grapes
Results from supervised trials from the USA on grapes were provided to the Meeting. In these trials, unreplicated plots were treated with three foliar spray applications of fluopyram (SC 500 formulation) with spray adjuvant, 13–15 days apart, using ground-based airblast sprayers to apply 0.09–0.12 kg ai/ha. At most sites, two application methods were used, one involving low volume sprays (3600–640 L/ha) and one using high volume treatments (1900–3400 L/ha). Plot sizes in these trials ranged from 24–109 m2.
Duplicate samples of at least 1 kg grapes (berries) were taken from at least four separate vines, frozen within 3.3 hours of sampling and stored frozen for up to 267 days before analysis for fluopyram using LC/MS/MS Method GM-001-P07-01. The reported LOQ was 0.01 mg/kg. Mean recovery rates in samples spiked with 0.01–5 mg/kg fluopyram ranged from 88–96%.

Fluopyram
633
Table 14 Fluopyram residues in grapes from supervised trials in USA, involving three foliar applications of fluopyram (500 SC formulation)
GRAPE Country, year Location (variety)
Application PHI, (days)
Residues (mg/kg) Reference & Comments no kg ai/ha kg ai/hL water
(L/ha) Fluopyram mean
USA GAP 0.087–0.25
7 max 0.5 kg ai/ha/season
USA, 2009 Dundee, NY (Vidal)
3 b 0.12 0.005 2300 14 fruit 0.5, 0.56 0.53 RAGMP164 GM027-09HA-B
USA, 2009 Dundee, NY (Vidal)
3 a 0.12 0.026 470 14 fruit 0.35, 0.41 0.38 RAGMP164 GM027-09HA-A
USA, 2009 Orefield, PA (Niagara)
3 b 0.12 0.004 2700 12 fruit 0.3, 0.37 0.34 RAGMP164 GM028-09HA-B
USA, 2009 Orefield, PA (Niagara)
3 a 0.12 + 0.09 + 0.12
0.024 + 0.017 + 0.023
510-530 12 fruit 0.25, 0.2 0.22 RAGMP164 GM028-09HA-A
USA, 2009 Nashville, IL (Niagara)
3 b 0.12 0.005 2300 13 fruit 0.5, 0.52 0.51 RAGMP164 GM029-09HA-B
USA, 2009 Nashville, IL (Niagara)
3 a 0.12 0.02 610 13 fruit 0.3, 0.42 0.36 RAGMP164 GM029-09HA-A
Canada, 2009 Branchton, ON (Marechal Foch)
3 b 0.12 0.006 2000 14 fruit 0.17, 0.19 0.18 RAGMP164 GM030-09HA-B
Canada, 2009 Branchton, ON (Marechal Foch)
3 a 0.12 0.02 610 14 fruit 0.09, 0.11 0.1 RAGMP164 GM030-09HA-A
USA, 2009 Comstock Park, MI (Concord)
3 b 0.12 0.006 2100 14 fruit 0.59, 0.69 0.64 RAGMP164 GM031-09HA-B
USA, 2009 Comstock Park, MI (Concord)
3 a 0.12 0.022 550 14 fruit 0.47, 0.5 0.48 RAGMP164 GM031-09HA-A
USA, 2009 Lawton, MI (Niagara)
3 b 0.12 0.005 2300 14 fruit 0.14, 0.12 0.13 RAGMP164 GM032-09HA-B
USA, 2009 Lawton, MI (Niagara)
3 a 0.12 0.022 550 14 fruit 0.19, 0.21 0.2 RAGMP164 GM032-09HA-A
USA, 2009 Madera, CA (Thompson Seedless)
3 b 0.12 0.006 2000 0 7 14 17 21
fruit 0.32, 0.36 0.23, 0.31 0.25, 0.26 0.26, 0.25 0.24, 0.27
0.34 0.27 0.25 0.26 0.25
RAGMP164 GM033-09DA-B
USA, 2009 Madera, CA (Thompson Seedless)
3 a 0.12 0.02 610 14 fruit 0.21, 0.15 0.18 RAGMP164 GM033-09DA-A
USA, 2009 Hickman, CA (Chardonnay)
3 b 0.12 0.006 2100 14 fruit 0.69, 0.64 0.67 RAGMP164 GM034-09HA-B
USA, 2009 Hickman, CA (Chardonnay)
3 a 0.12 0.022 540 14 fruit 0.56, 0.61 0.58 RAGMP164 GM034-09HA-A
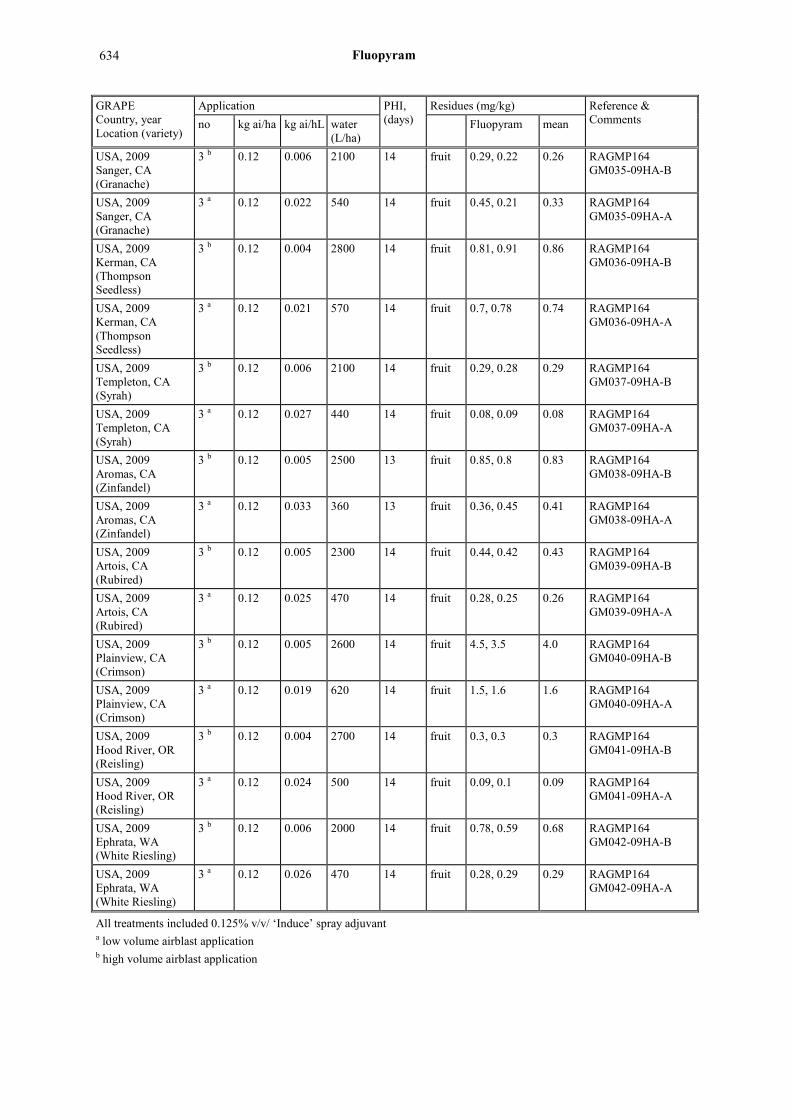
Fluopyram
634
GRAPE Country, year Location (variety)
Application PHI, (days)
Residues (mg/kg) Reference & Comments no kg ai/ha kg ai/hL water
(L/ha) Fluopyram mean
USA, 2009 Sanger, CA (Granache)
3 b 0.12 0.006 2100 14 fruit 0.29, 0.22 0.26 RAGMP164 GM035-09HA-B
USA, 2009 Sanger, CA (Granache)
3 a 0.12 0.022 540 14 fruit 0.45, 0.21 0.33 RAGMP164 GM035-09HA-A
USA, 2009 Kerman, CA (Thompson Seedless)
3 b 0.12 0.004 2800 14 fruit 0.81, 0.91 0.86 RAGMP164 GM036-09HA-B
USA, 2009 Kerman, CA (Thompson Seedless)
3 a 0.12 0.021 570 14 fruit 0.7, 0.78 0.74 RAGMP164 GM036-09HA-A
USA, 2009 Templeton, CA (Syrah)
3 b 0.12 0.006 2100 14 fruit 0.29, 0.28 0.29 RAGMP164 GM037-09HA-B
USA, 2009 Templeton, CA (Syrah)
3 a 0.12 0.027 440 14 fruit 0.08, 0.09 0.08 RAGMP164 GM037-09HA-A
USA, 2009 Aromas, CA (Zinfandel)
3 b 0.12 0.005 2500 13 fruit 0.85, 0.8 0.83 RAGMP164 GM038-09HA-B
USA, 2009 Aromas, CA (Zinfandel)
3 a 0.12 0.033 360 13 fruit 0.36, 0.45 0.41 RAGMP164 GM038-09HA-A
USA, 2009 Artois, CA (Rubired)
3 b 0.12 0.005 2300 14 fruit 0.44, 0.42 0.43 RAGMP164 GM039-09HA-B
USA, 2009 Artois, CA (Rubired)
3 a 0.12 0.025 470 14 fruit 0.28, 0.25 0.26 RAGMP164 GM039-09HA-A
USA, 2009 Plainview, CA (Crimson)
3 b 0.12 0.005 2600 14 fruit 4.5, 3.5 4.0 RAGMP164 GM040-09HA-B
USA, 2009 Plainview, CA (Crimson)
3 a 0.12 0.019 620 14 fruit 1.5, 1.6 1.6 RAGMP164 GM040-09HA-A
USA, 2009 Hood River, OR (Reisling)
3 b 0.12 0.004 2700 14 fruit 0.3, 0.3 0.3 RAGMP164 GM041-09HA-B
USA, 2009 Hood River, OR (Reisling)
3 a 0.12 0.024 500 14 fruit 0.09, 0.1 0.09 RAGMP164 GM041-09HA-A
USA, 2009 Ephrata, WA (White Riesling)
3 b 0.12 0.006 2000 14 fruit 0.78, 0.59 0.68 RAGMP164 GM042-09HA-B
USA, 2009 Ephrata, WA (White Riesling)
3 a 0.12 0.026 470 14 fruit 0.28, 0.29 0.29 RAGMP164 GM042-09HA-A
All treatments included 0.125% v/v/ ‘Induce’ spray adjuvant a low volume airblast application b high volume airblast application

Fluopyram
635
Strawberry
Relevant data from trials with fluopyram on strawberries, evaluated by JMPR in 2010 [Ref: JMPR 2010 E] are interpreted in light of current GAPs in North America and Morocco.
Table 15 Interpretation table of fluopyram residues on strawberries from trials matching the GAP for drip irrigation applications in Canada and considered valid for MRL and STMR estimation
Crop Country, Year Application PHI, (days)
Residues (mg/kg) Trial a No kg ai/ha water
(L/ha) Fluopyram mean
Strawberries (drip irrigation)
Canada GAP 2 0.25 0 Max 0.5 kg ai/ha/season
Strawberries USA, 2007 2 0.25 1 0 < 0.01, < 0.01 < 0.01 GM072-07HA
Strawberries USA, 2007 2 0.25 2.1 0 7
0.05, 0.05 0.12, 0.09
0.05 0.1
GM073-07HA
Strawberries USA, 2007 2 0.25 1.9 0 7
0.03, 0.03 0.06, 0.06
0.03 0.06
GM074-07HA
Strawberries USA, 2007 2 0.25 2.2 0 7
< 0.01, < 0.01 0.03, 0.02
< 0.01 0.02
GM075-07HA
Strawberries USA, 2007 2 0.25 1.8 0 7
< 0.01, < 0.01 0.02, 0.01
< 0.01 0.01
GM076-07HA
Strawberries USA, 2007 2 0.25 1 0 7
< 0.01, < 0.01 < 0.01, < 0.01
< 0.01 < 0.01
GM077-07HA
Strawberries USA, 2007 2 0.25 1.4 0 3 7 10
< 0.01, < 0.01 0.01, 0.02 0.02, 0.02 0.03, 0.03
< 0.01 0.01 0.02 0.03
GM078-07DA
Strawberries USA, 2007 2 0.25 1.1 0 7
0.08, 0.11 0.22, 0.24
0.1 0.23
GM079-07HA
Strawberries USA, 2007 2 0.26 1.7 0 7
< 0.01, 0.01 0.03, 0.02
0.01 0.03
GM080-07HA
Strawberries USA, 2007 2 0.25 1.5 0 7
0.04, < 0.01 < 0.01, < 0.01
0.02 < 0.01
GM081-07HA
a See JMPR 2010 Fluopyram Evaluation, Table 100
Banana
Relevant data from trials with fluopyram on bananas, evaluated by JMPR in 2010 [Ref: JMPR 2010 E] are interpreted in light of current GAP in Panama.
Table 16 Interpretation table of fluopyram residues on bananas from trials matching the GAP of Panama and considered valid for MRL and STMR estimation
Crop Country, Year Application PHI, (days)
Residues (mg/kg) Trial a No kg ai/ha water
(L/ha) sample Fluopyram mean
Banana Panama GAP 5 0.075–0.1
0 max 0.5 kg ai/ha/season
Banana Costa Rica, 2007 6 0.1 22 0 Bagged Unbagged
< 0.01, < 0.01 0.02, 0.02
< 0.01 0.02
GM149-07HA
Banana Costa Rica, 2007 6 0.1 40–45 0 Bagged Unbagged
0.04, 0.04 0.26, 0.15
0.04 0.21
GM150-07HA
Banana Costa Rica, 2007 6 0.1 40–46 0 Bagged Unbagged
0.02, 0.02 0.28, 0.22
0.02 0.25
GM151-07HA
Banana Ecuador, 2007 6 0.1 29–30 0 Bagged Unbagged
0.03, 0.02 0.37, 0.31
0.02 0.34
GM152-07HA
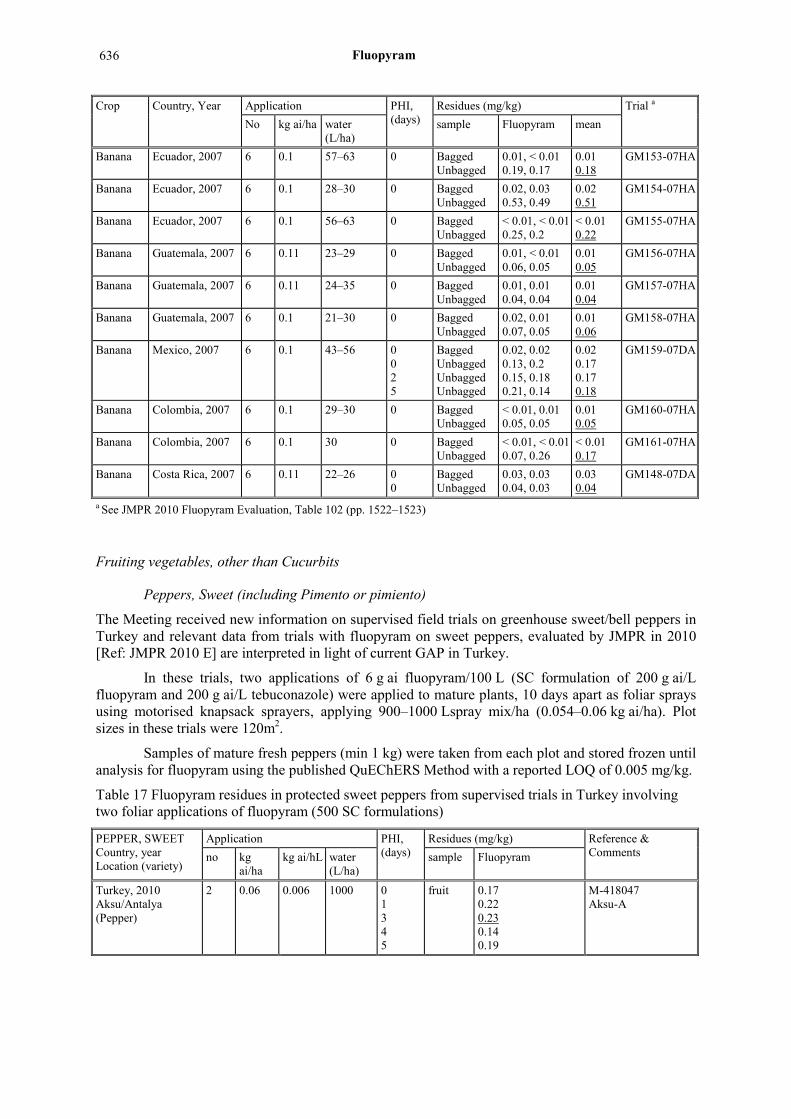
Fluopyram
636
Crop Country, Year Application PHI, (days)
Residues (mg/kg) Trial a No kg ai/ha water
(L/ha) sample Fluopyram mean
Banana Ecuador, 2007 6 0.1 57–63 0 Bagged Unbagged
0.01, < 0.01 0.19, 0.17
0.01 0.18
GM153-07HA
Banana Ecuador, 2007 6 0.1 28–30 0 Bagged Unbagged
0.02, 0.03 0.53, 0.49
0.02 0.51
GM154-07HA
Banana Ecuador, 2007 6 0.1 56–63 0 Bagged Unbagged
< 0.01, < 0.01 0.25, 0.2
< 0.01 0.22
GM155-07HA
Banana Guatemala, 2007 6 0.11 23–29 0 Bagged Unbagged
0.01, < 0.01 0.06, 0.05
0.01 0.05
GM156-07HA
Banana Guatemala, 2007 6 0.11 24–35 0 Bagged Unbagged
0.01, 0.01 0.04, 0.04
0.01 0.04
GM157-07HA
Banana Guatemala, 2007 6 0.1 21–30 0 Bagged Unbagged
0.02, 0.01 0.07, 0.05
0.01 0.06
GM158-07HA
Banana Mexico, 2007 6 0.1 43–56 0 0 2 5
Bagged Unbagged Unbagged Unbagged
0.02, 0.02 0.13, 0.2 0.15, 0.18 0.21, 0.14
0.02 0.17 0.17 0.18
GM159-07DA
Banana Colombia, 2007 6 0.1 29–30 0 Bagged Unbagged
< 0.01, 0.01 0.05, 0.05
0.01 0.05
GM160-07HA
Banana Colombia, 2007 6 0.1 30 0 Bagged Unbagged
< 0.01, < 0.01 0.07, 0.26
< 0.01 0.17
GM161-07HA
Banana Costa Rica, 2007 6 0.11 22–26 0 0
Bagged Unbagged
0.03, 0.03 0.04, 0.03
0.03 0.04
GM148-07DA
a See JMPR 2010 Fluopyram Evaluation, Table 102 (pp. 1522–1523)
Fruiting vegetables, other than Cucurbits
Peppers, Sweet (including Pimento or pimiento)
The Meeting received new information on supervised field trials on greenhouse sweet/bell peppers in Turkey and relevant data from trials with fluopyram on sweet peppers, evaluated by JMPR in 2010 [Ref: JMPR 2010 E] are interpreted in light of current GAP in Turkey.
In these trials, two applications of 6 g ai fluopyram/100 L (SC formulation of 200 g ai/L fluopyram and 200 g ai/L tebuconazole) were applied to mature plants, 10 days apart as foliar sprays using motorised knapsack sprayers, applying 900–1000 Lspray mix/ha (0.054–0.06 kg ai/ha). Plot sizes in these trials were 120m2.
Samples of mature fresh peppers (min 1 kg) were taken from each plot and stored frozen until analysis for fluopyram using the published QuEChERS Method with a reported LOQ of 0.005 mg/kg.
Table 17 Fluopyram residues in protected sweet peppers from supervised trials in Turkey involving two foliar applications of fluopyram (500 SC formulations)
PEPPER, SWEET Country, year Location (variety)
Application PHI, (days)
Residues (mg/kg) Reference & Comments no kg
ai/ha kg ai/hL water
(L/ha) sample Fluopyram
Turkey, 2010 Aksu/Antalya (Pepper)
2 0.06 0.006 1000 0 1 3 4 5
fruit 0.17 0.22 0.23 0.14 0.19
M-418047 Aksu-A

Fluopyram
637
PEPPER, SWEET Country, year Location (variety)
Application PHI, (days)
Residues (mg/kg) Reference & Comments no kg
ai/ha kg ai/hL water
(L/ha) sample Fluopyram
Turkey, 2010 Kumluca/Antalya (Pepper)
2 0.054 0.006 900 0 1 3 4 5
fruit 0.22 0.23 0.21 0.24 0.18
M-418047 Kumluca-B
Table 18 Interpretation table of fluopyram residues on sweet peppers from trials matching the GAP of Turkey and considered valid for MRL and STMR estimation
Crop Country, year Application PHI, (days)
Residues (mg/kg) Trial a no kg ai/ha kg ai/hL Fluopyram Scaled to GAP b
Peppers, sweet Turkey GAP 0.006 3 Peppers, sweet (greenhouse)
Netherlands, 2006 2 0.3 0.03 3 0.16 0.03 0554-06
Peppers, sweet (greenhouse)
Portugal, 2006 2 0.3 0.05 3 0.25 0.03 0560-06
Peppers, sweet (greenhouse)
Italy, 2006 2 0.3 0.04 3 0.29 0.04 0556-06
Peppers, sweet (greenhouse)
France, 2006 2 0.3 0.03 3 0.25 0.05 0555-06
Peppers, sweet (greenhouse)
Greece, 2006 2 0.3 0.04 3 0.31 0.05 0559-06
Peppers, sweet (greenhouse)
Germany, 2006 2 0.3 0.36
0.03 3 0.42 0.08 0364-06
Peppers, sweet (greenhouse)
Spain, 2006 2 0.28 0.3
0.025 3 7
0.26 0.29
0.07 0.08
0558-06
Peppers, sweet (greenhouse)
Spain, 2006 2 0.3 0.02 3 7
0.28 0.31
0.08 0.09
0557-06
Peppers, sweet (greenhouse)
Italy, 2007 2 0.3 0.027 3 7
0.51 0.58
0.12 0.13
0236-07
a See JMPR 2010 Fluopyram Evaluation, Tables 131, 132 b Mean residues scaled to GAP application rate—values underlined if within the scaling range of 0.3× – 5× GAP
Tomatoes
Relevant data from trials with fluopyram on tomatoes, evaluated by JMPR in 2010 [Ref: JMPR 2010 E] are interpreted in light of current GAP in Morocco.
Table 19 Interpretation table of fluopyram residues on tomatoes from trials matching the GAP of Turkey and considered valid for MRL and STMR estimation
Crop Country, year Application PHI, (days)
Residues (mg/kg) Trial a no kg ai/ha kg ai/hL Fluopyram Scaled to GAP b
Tomatoes Morocco GAP 2 0.0125 3 Tomatoes (indoor) Germany, 2007
Cherry tomato 2 0.3 0.03 3 0.13 0.05 0235-07
Tomatoes (indoor) Greece, 2006 2 0.3 0.03 3 0.15 0.06 0550-06 Tomatoes (indoor) Germany, 2006 2 0.3 0.03 3 0.15 0.06 0552-06 Tomatoes (indoor) Netherlands, 2006 2 0.3 0.03 3 0.15 0.06 0553-06 Tomatoes (indoor) Italy 2 0.3 0.03 3 0.19 0.08 0547-06

Fluopyram
638
Crop Country, year Application PHI, (days)
Residues (mg/kg) Trial a no kg ai/ha kg ai/hL Fluopyram Scaled to GAP b
Tomatoes (indoor) Germany, 2007 Cherry tomato
2 0.3 0.03 3 0.19 0.08 0519-07
Tomatoes (indoor) Italy, 2007 Cherry tomato
2 0.3 0.02 3 7
0.13 0.16
0.08 0.1
0518-07
Tomatoes (indoor) France, 2006 2 0.3 0.02 3 0.24 0.15 0363-06 Tomatoes (indoor) Spain, 2006 2 0.32 0.02 3
7 0.26 0.28
0.16 0.18
0546-06
Tomatoes (indoor) Germany, 2006 2 0.3 0.04 4 8
0.61 0.62
0.19 0.19
0545-06
Tomatoes (indoor) Portugal, 2006 2 0.3 0.025 3 7
0.31 0.44
0.16 0.22
0549-06
Tomatoes (indoor) Spain, 2007 Cherry tomato
2 0.3 0.02 3 0.36 0.23 0517-07
a See JMPR 2010 Fluopyram Evaluation, Tables 128, 129 b Mean residues scaled to GAP application rate
Pulses
Beans (dry)
Relevant data from trials with fluopyram on beans, evaluated by JMPR in 2010 [Ref: JMPR 2010 E] are interpreted in light of current GAP in the USA and Canada.
Table 20 Interpretation table of fluopyram residues on beans (dry) from trials matching the GAP of the USA and Canada and considered valid for MRL and STMR estimation
CROP COUNTRY, YEAR
APPLICATION PHI, (DAYS)
RESIDUES (MG/KG) TRIAL A NO KG
AI/HA KG AI/HL
FLUOPYRAM
MEAN
SCALED TO GAP C
Beans (dry) USA GAP 0.1–0.15
14 max 0.3 kg ai/ha/season
Beans (dry) USA, 2006 2 0.25 0.23 14 0.01, 0.02 0.01 < 0.01 GM325-06HA Beans (dry) USA, 2006 2 0.25 0.15 14 0.01, 0.01 0.01 < 0.01 GM327-06HA Beans (dry) USA, 2006 2 0.25 0.2 14 < 0.01, < 0.01 < 0.0
1 < 0.01 GM328-06HA
Beans (dry) USA, 2006 2 0.24 0.16 14 + 17 b < 0.01, < 0.01 < 0.01
< 0.01 GM330-06HA
Beans (dry) USA, 2006 2 0.25 0.28 14 + 10 b < 0.01, < 0.01 < 0.01
< 0.01 GM332-06HA
Beans (dry) USA, 2006 2 0.25 0.14 14 0.02, 0.01 0.01 < 0.01 GM324-06DA Beans (dry) USA, 2006 2 0.25 0.2 13 + 1 b 0.03, 0.02 0.03 0.02 GM326-06HA Beans (dry) USA, 2007 2 0.25 0.21 0 + 14 b 0.05, 0.06 0.05 0.03 GM331-06HA Beans (dry) USA, 2006 2 0.25 0.18 13 0.06, 0.08 0.07 0.04 GM329-06HA a See JMPR 2010 Fluopyram Evaluation, Tables 149, 150 b Drying interval between cutting and sampling c Mean residues scaled to GAP application rate

Fluopyram
639
Root and tuber vegetables
Carrot
Relevant data from trials with fluopyram on carrots, evaluated by JMPR in 2010 [Ref: JMPR 2010 E] and interpreted in light of current GAP in the Ukraine.
Table 21 Interpretation table of fluopyram residues on carrots from trials matching the GAP of the Ukraine and considered valid for MRL and STMR estimation
Crop Country, Year Application PHI, (days)
Residues (mg/kg) Trial a No kg ai/ha kg ai/hL Fluopyram
Carrots Ukraine GAP 2 0.07–0.15 30 Carrots United Kingdom, 2007 3 0.15 0.05 27 0.03 0578-07 Carrots United Kingdom, 2006 3 0.15 0.05 28 0.04 0481-06 Carrots Germany, 2007 3 0.15 0.05 28 0.07 0577-07 Carrots Netherlands, 2006 3 0.15 0.019 28 0.08 0480-06 Carrots Germany, 2007 3 0.15 0.025 28 0.1 0579-07 Carrots France, 2007 3 0.15 0.05 28 0.13 0062-07 Carrots France, 2006 3 0.15 0.03 28 0.15 0358-06 Carrots Germany, 2006 3 0.15 0.05 28 0.19 0482-06 a See JMPR 2010 Fluopyram Evaluation, Table 156
Potato
Relevant data from trials with fluopyram on potatoes, evaluated by JMPR in 2010 [Ref: JMPR 2010 E] and interpreted in light of current GAP in USA.
Table 22 Interpretation table of fluopyram residues on potato from trials matching the GAP of the USA and considered valid for MRL and STMR estimation
Crop Country, Year Application PHI, (days)
Residues (mg/kg) Trial a No kg ai/ha kg ai/hL Fluopyram mean
Potato USA GAP 2 max 0.2 7 max 0.4 kg ai/ha/season
Potato USA, 2006 2 0.25 0.14 7 < 0.01, < 0.01 < 0.01 GM274-06HA Potato USA, 2006 2 0.25 0.15 7 < 0.01, < 0.01 < 0.01 GM275-06HA Potato USA, 2006 2 0.25 0.23 7 < 0.01, < 0.01 < 0.01 GM277-06HA Potato USA, 2006 2 0.25 0.19 6 < 0.01, < 0.01 < 0.01 GM279-06HA Potato USA, 2006 2 0.25 0.18 7 < 0.01, < 0.01 < 0.01 GM280-06HA Potato USA, 2006 2 0.24 0.15 6 < 0.01, < 0.01 < 0.01 GM281-06HA Potato USA, 2006 2 0.25 0.16 7 < 0.01, < 0.01 < 0.01 GM282-06HA Potato USA, 2006 2 0.25 0.14 7 < 0.01, < 0.01 < 0.01 GM283-06HA Potato USA, 2006 2 0.25 0.26 6 < 0.01, < 0.01 < 0.01 GM285-06HA Potato USA, 2006 2 0.25 0.18 6 < 0.01, < 0.01 < 0.01 GM286-06HA Potato USA, 2006 2 0.25 0.15 7 < 0.01, < 0.01 < 0.01 GM287-06HA Potato USA, 2006 2 0.25 0.14 7 < 0.01, < 0.01 < 0.01 GM288-06HA Potato USA, 2006 2 0.25 0.21 7 < 0.01, < 0.01 < 0.01 GM289-06HA Potato USA, 2006 2 0.25 0.14 7 < 0.01, < 0.01 < 0.01 GM284-06DA Potato USA, 2006 2 0.25 0.18 7
14 21
< 0.01, < 0.01 < 0.01, < 0.01 0.01, 0.01
< 0.01 < 0.01 0.01
GM278-06DA
Potato USA, 2006 2 0.26 0.27 7 0.02, 0.02 0.02 GM276-06HA a See JMPR 2010 Fluopyram Evaluation, Tables 157

Fluopyram
640
Sugar beet
Relevant data from trials with fluopyram on sugar beet, evaluated by JMPR in 2010 [Ref: JMPR 2010 E] and interpreted in light of current GAP in USA.
Table 23 Interpretation table of fluopyram residues on sugar beet (roots) from trials matching the GAP of the USA and Canada and considered valid for MRL and STMR estimation
Crop Country, Year Application PHI, (days)
Residues (mg/kg) Trial a No kg ai/ha kg ai/hL Fluopyram mean Scaled to GAP b
Sugar beet USA GAP 0.125 7 max 0.25 kg ai/ha/season
Sugar beet USA, 2006 2 0.25 0.28 7 0.02, 0.02 0.02 < 0.01 GM175-06HA Sugar beet USA, 2006 2 0.25 0.12 6
13 0.01, 0.02 0.02, 0.02
0.02 0.02
< 0.01 < 0.01
GM165-06DA
Sugar beet USA, 2006 2 0.26 0.14 7 0.02, 0.02 0.02 0.01 GM166-06HA Sugar beet USA, 2006 2 0.24 0.15 7 0.03, 0.03 0.03 0.01 GM168-06HA Sugar beet USA, 2006 2 0.25 0.2 7 0.03, 0.02 0.03 0.01 GM170-06HA Sugar beet USA, 2006 2 0.25 0.14 7 0.01, 0.03 0.02 0.01 GM174-06HA Sugar beet USA, 2006 2 0.25 0.19 7 0.03, 0.05 0.04 0.02 GM167-06HA Sugar beet USA, 2006 2 0.25 0.14 7 0.04, 0.03 0.04 0.02 GM169-06HA Sugar beet USA, 2006 2 0.25 0.18 6 0.04, 0.04 0.04 0.02 GM171-06HA Sugar beet USA, 2006 2 0.25 0.14 7 0.05, 0.02 0.03 0.02 GM173-06HA Sugar beet USA, 2006 2 0.25 0.15 7 0.04, 0.05 0.05 0.02 GM176-06HA a See JMPR 2010 Fluopyram Evaluation, Tables 159 b Mean residues scaled to GAP application rate
Tree nuts
Relevant data from trials with fluopyram on almonds and pecans, evaluated by JMPR in 2010 [Ref: JMPR 2010 E] are interpreted in light of current GAP in USA.
Almonds
Table 24 Interpretation table of fluopyram residues in almonds (nutmeat) from trials matching the GAP in USA and considered valid for MRL and STMR estimation
Crop Country, Year Application PHI, (days)
Residues (mg/kg) Trial a No kg ai/ha kg
ai/hL sample Fluopyram mean
Almonds USA GAP 2 max 0.25 14 max 0.5 kg ai/ha/season
Almonds USA, 2006 2 c 0.25 0.01 14 nutmeat < 0.01, < 0.01 < 0.01 GM205-06HA
Almonds USA, 2006 2 b 0.25 0.045 14 nutmeat < 0.01, < 0.01 < 0.01 GM202-06HA
Almonds USA, 2006 2 c 0.25 0.012 14 nutmeat < 0.01, < 0.01 < 0.01 GM203-06HA
Almonds USA, 2006 2 c 0.25 0.013 14 nutmeat < 0.01, < 0.01 < 0.01 GM204-06HA
Almonds USA, 2006 2 b 0.25 0.05 14 nutmeat 0.02, 0.02 0.02 GM201-06DA a See JMPR 2010 Fluopyram Evaluation, Table 174 b low volume airblast application c high volume airblast application

Fluopyram
641
Pecans
Table 25 Interpretation table of fluopyram residues in pecan (nutmeat) from trials matching the GAP in USA and considered valid for residue estimation
Crop Country, Year Application PHI, (days)
Residues (mg/kg) Trial a No kg ai/ha kg ai/hL sample Fluopyram mean
Pecans USA GAP max 0.25 14 max 0.5 kg ai/ha/season
Pecans USA, 2006 2 c 0.25 0.009 14 nutmeat < 0.01, < 0.01 < 0.01 GM206-06DA
Pecans USA, 2006 2 b 0.26 0.05 14 nutmeat < 0.01, < 0.01 < 0.01 GM208-06DA
Pecans USA, 2006 2 c 0.25 0.012 13 nutmeat < 0.01, < 0.01 < 0.01 GM209-06HA
Pecans USA, 2006 2 b 0.25 0.065 14 nutmeat < 0.01, 0.01 0.01 GM207-06HA
Pecans USA, 2006 2 c 0.25 0.012 12 nutmeat 0.02, 0.05 0.03 GM210-06HA a See JMPR 2010 Fluopyram Evaluation, Table 175 b low volume airblast application c high volume airblast application
Oilseeds
Relevant data from trials with fluopyram on peanuts, rape seed and sunflower seed, evaluated by JMPR in 2010 [Ref: JMPR 2010 E] are interpreted in light of current GAP in USA.
Peanut
Table 26 Interpretation table of fluopyram residues in peanut (nutmeat) from trials matching the GAP in USA and Canada and considered valid for residue estimation
Crop Country, Year Application PHI, (days)
Residues (mg/kg) Trial a No kg ai/ha kg ai/hL Fluopyram mean
Peanuts USA GAP 0.2–0.25 7 max 0. 5 kg ai/ha/season
Peanut USA, 2006 2 0.24 0.25
0.18 0.22
7 < 0.01, < 0.01 < 0.01 GM133-06HA
Peanut USA, 2006 2 0.25 0.25
0.17 0.18
6 < 0.01, < 0.01 < 0.01 GM134-06HA
Peanut USA, 2006 2 0.26 0.25
0.27 0.25
7 < 0.01, < 0.01 < 0.01 GM135-06HA
Peanut USA, 2006 2 0.25 0.25
0.15 0.15
7 < 0.01, < 0.01 < 0.01 GM136-06HA
Peanut USA, 2006 2 0.25 0.25
0.18 0.19
7 < 0.01, < 0.01 < 0.01 GM137-06HA
Peanut USA, 2006 2 0.25 0.25
0.16 0.15
7 < 0.01, < 0.01 < 0.01 GM138-06HA
Peanut USA, 2006 2 0.25 0.25
0.16 0.15
7 < 0.01, < 0.01 < 0.01 GM139-06HA
Peanut USA, 2006 2 0.25 0.25
0.19 0.27
7 < 0.01, < 0.01 < 0.01 GM142-06HA
Peanut USA, 2006 2 0.25 0.25
0.18 0.18
7 < 0.01, < 0.01 < 0.01 GM143-06HA
Peanut USA, 2006 2 0.25 0.25
0.17 0.16
6 < 0.01, < 0.01 < 0.01 GM132-06DA
Peanut USA, 2006 2 0.24 0.25
0.15 0.15
7 0.01, 0.01 0.01 GM141-06HA

Fluopyram
642
Crop Country, Year Application PHI, (days)
Residues (mg/kg) Trial a No kg ai/ha kg ai/hL Fluopyram mean
Peanut USA, 2006 2 0.26 0.25
0.14 0.14
7 0.02, 0.02 0.02 GM140-06HA
a See JMPR 2010 Fluopyram Evaluation, Table 176
Rape seed
Table 27 Interpretation table of fluopyram residues in rape seed from trials matching the GAP in Germany and considered valid for residue estimation
Crop Country, Year Application PHI, (days)
Residues (mg/kg) Trial a No BBCH b kg
ai/ha kg ai/hL sample Fluopyram
Rape seed Germany GAP 1 0.125 End of flowering Rape seed France (N), 2006 2 73 0.125 0.05 66 seed 0.02 0408-06 Rape seed Germany, 2006 2 73 0.125 0.042 57 seed 0.04 0409-06 Rape seed Germany, 2007 2 73 0.125 0.042 69 seed 0.08 0808-07 Rape seed France (N), 2007 2 73 0.125 0.042 50 seed 0.09 0238-07 Rape seed UK, 2006 2 73 0.125 0.062 43 seed 0.1 0410-06 Rape seed Germany, 2006 2 73 0.125 0.042 50 seed 0.11 0406-06 Rape seed Germany, 2007 2 73 0.125 0.042 61 seed 0.11 (c=0.02) 0809-07 Rape seed UK, 2007 2 73 0.125 0.042 57 seed 0.19 (c=0.01) 0810-07 a See JMPR 2010 Fluopyram Evaluation, Table 177 b BBCH Growth Stage at last application
Animal feeds
Sugar beet (tops)
Relevant data from trials with fluopyram on sugar beet, evaluated by JMPR in 2010 [Ref: JMPR 2010 E] and interpreted in light of current GAP in USA.
Table 28 Interpretation table of fluopyram residues on sugar beet (tops) from trials matching the GAP in USA and Canada and considered valid for residue estimation.
Crop Country, Year Application PHI, (days)
Residues (mg/kg) Trial a No kg ai/ha kg ai/hL Fluopyram mean Scaled to GAP b
Sugar beet USA GAP 2 0.125 7 max 0.25 kg ai/ha/season
Sugar beet USA, 2006 2 0.25 0.15 7 0.41, 0.29 0.35 0.18 GM176-06HA Sugar beet USA, 2006 2 0.25 0.28 7 0.3, 0.46 0.38 0.19 GM175-06HA Sugar beet USA, 2006 2 0.25 0.14 7 0.77, 0.58 0.67 0.34 GM169-06HA Sugar beet USA, 2006 2 0.25 0.12 6 0.82, 0.56 0.69 0.35 GM165-06DA Sugar beet USA, 2006 2 0.25 0.18 6 0.79, 0.7 0.7 0.37 GM171-06HA Sugar beet USA, 2006 2 0.24 0.15 7 1.0, 0.76 0.89 0.46 GM168-06HA Sugar beet USA, 2006 2 0.25 0.2 7 1.7, 1.8 1.8 0.89 GM170-06HA Sugar beet USA, 2006 2 0.25 0.19 7 3.8, 2.6 3.2 1.6 GM167-06HA Sugar beet USA, 2006 2 0.26 0.14 7 4.7, 4.7 4.7 2.3 GM166-06HA Sugar beet USA, 2006 2 0.25 0.14 7 8.4, 10.5 9.4 4.7 GM174-06HA Sugar beet USA, 2006 2 0.25 0.14 7 18.7, 14.3 16.5 8.3 GM173-06HA a See JMPR 2010 Fluopyram Evaluation, Table 159

Fluopyram
643
b Mean residues scaled to GAP application rate
Almond hulls
Relevant data from trials with fluopyram on almonds, evaluated by JMPR in 2010 [Ref: JMPR 2010 E] are interpreted in light of current GAP in USA.
Table 29 Interpretation table of fluopyram residues on almond hulls from trials matching the GAP in USA and Canada and considered valid for residue estimation
Crop Country, Year Application PHI, (days)
Residues (mg/kg) Trial a
No kg ai/ha kg ai/hL sample Fluopyram mean Almonds Canada GAP 2 max 0.25 14 max 0.5 kg
ai/ha/season
Almonds USA, 2006 2 c 0.25 0.012 14 hulls (91% DM) 2.3, 2.6 2.4 GM203-06HA
Almonds USA, 2006 2 b 0.25 0.051 14 21 28
hulls (24% DM) 1.9, 2.0 2.6, 3.1 3.1, 3.2
2.0 2.8 3.2
GM201-06DA
Almonds USA, 2006 2 c 0.25 0.013 14 hulls (65% DM) 3.8, 3.5 3.6 GM204-06HA
Almonds USA, 2006 2 b 0.25 0.045 14 hulls (57% DM) 4.2, 4.3 4.3 GM202-06HA
Almonds USA, 2006 2 c 0.25 0.01 14 hulls (81% DM) 4.8, 6.1 5.4 GM205-06HA a See JMPR 2010 Fluopyram Evaluation, Table 174 b low volume airblast application c high volume airblast application
FATE OF RESIDUES IN STORAGE AND IN PROCESSING
Magnitude of the residue in processing
Information was provided to the 2010 JMPR on the residue distribution of fluopyram in peel and pulp (melons), on the effects of trimming, washing and cooking of strawberries, blueberries, cabbage, broccoli, summer squash, lettuce, spinach, Mustard greens, celery and on the effects of simulated commercial processing on residues of fluopyram and metabolites in oranges, apples, plums, grapes, tomatoes, potatoes, sugar beet, soya beans, wheat, maize, peanut, rape seed, cotton seed and sunflower seed.
Processing factors derived by the 2010 JMPR of relevance to the commodities considered for maximum residue levels, dietary intake or livestock dietary burden estimation by the current meeting are summarized below:
Table 30 Summary of selected processing factors for fluopyram
RAW AGRICULTURAL COMMODITY
PROCESSED COMMODITY CALCULATED PROCESSING FACTORS A PROCESSING FACTOR (MEAN OR MEDIAN)
Apples Dried fruit 0.03, 0.62, 0.64, 0.88, 0.91 0.64 (median)
Sauce 0.01, 0.24, 0.36, 0.36, 0.63 0.36 (median)
Juice < 0.05, < 0.09, < 0.09, < 0.13, 0.44 < 0.09 (median)
Pomace (wet) 1.2, 1.7, 2.3, 2.5, 4.1 2.3 (median)
Grape Juice < 0.02, < 0.02, < 0.02, < 0.03, 0.53 < 0.02 (median)
Red wine 0.14, 0.17, 0.2, 0.2 0.18

Fluopyram
644
RAW AGRICULTURAL COMMODITY
PROCESSED COMMODITY CALCULATED PROCESSING FACTORS A PROCESSING FACTOR (MEAN OR MEDIAN)
Pomace (wet) 2.2, 3.1, 3.6, 3.9 3.2
Raisins 2.0, 2.4, 2.9, 3.2, 6.6 2.9 (median)
Strawberry Preserve 0.25, 0.27, 0.33, 0.4 0.31 Jam 0.28, 0.58, 0.63, 0.64, 0.74, 1.0 0.65 Tomato Juice 0.09, 0.27, 0.42, 0.44, 0.56 0.36
Pomace (wet) 0.08, 0.09, 0.11, 0.13 0.1
Preserve 0.07, 0.18, 0.21, 0.25, 0.33 0.21
Puree 0.18, 0.46, 0.73, 0.94, 2.2 0.73 (median)
Paste 0.46 0.46
Potato Wet peel (process waste) < 0.64 < 0.64
Peeled tubers < 0.64 < 0.64
Crisps < 0.64 < 0.64
Flakes 1 1
Sugar beet Sugar 1.3 1.3
Molasses (thick juice) 0.92 0.92
Dried pulp 1.3 1.3
Peanut Meal 0.19 0.19
Butter 0.22 0.22
Oil 0.01 0.01 a Each value represents a separate study where residues were above the LOQ in the RAC. The factor is the ratio of the total residue in the processed item divided by the total residue in the RAC. Commodities in italics are livestock feed items
LIVESTOCK FEEDING STUDIES
Lactating dairy cows
The 2010 JMPR reviewed a feeding study with fluopyram on lactating dairy cows, reported by Schoening & Wolters, 2008 [Ref: JMPR 2010 E] and the following table summarizes the residues found in cow's milk and tissues after oral dosing for 29 consecutive days with fluopyram at levels corresponding to feed concentrations of 1.5 ppm to 133 ppm.
Table 31 Residues of fluopyram and its BZM and total-olefine metabolites in cow tissues a Feeding level 1.5 ppm (0.1×) 14.4 ppm (1×) 44 ppm (3×) 133 ppm (10×) Fluopyram residues (mg/kg) Commodity mean max mean max mean max mean max Milk skim milk cream
nd nd 0.01 0.02 0.05 0.09 0.12 0.02 1.3
0.15 0.02 1.4
Perirenal Fat < 0.01 < 0.01 0.04 0.06 0.25 0.33 0.49 0.6 Mesenteric Fat < 0.01 < 0.01 0.04 0.07 0.25 0.33 0.69 0.71 Subcutaneous Fat < 0.01 < 0.01 0.04 0.07 0.25 0.33 0.57 0.65 Liver 0.25 0.26 0.71 0.98 2.07 2.8 4.0 4.0 Muscle nd nd < 0.01 < 0.01 0.02 0.04 0.03 0.03 Kidney nd nd < 0.01 < 0.01 0.03 0.05 0.07 0.08

Fluopyram
645
Feeding level 1.5 ppm (0.1×) 14.4 ppm (1×) 44 ppm (3×) 133 ppm (10×) BZM residues (mg/kg) Commodity mean max mean max mean max mean max Milk skim milk cream
0.02 0.02 0.24 0.37 0.57 0.77 1.3 1.4 0.85
1.4 1.5 0.98
Perirenal Fat < 0.01 < 0.01 0.18 0.33 0.27 0.34 0.85 0.94 Mesenteric Fat < 0.01 < 0.01 0.16 0.29 0.26 0.31 0.72 0.8 Subcutaneous Fat 0.01 0.01 0.18 0.31 0.37 0.45 1 1.1 Liver 0.1 0.1 1.21 1.9 2.8 3.2 6.9 7.0 Muscle 0.02 0.02 0.29 0.44 0.6 0.79 1.4 1.5 Kidney 0.03 0.03 0.28 0.38 0.72 0.88 1.6 1.6 Total-olefines residues (mg/kg) Commodity mean max mean max mean max mean max Milk skim milk cream
nd nd < 0.02 0.02 0.03 0.05 0.12 nd 1.0
0.14 nd 1.3
Perirenal Fat < 0.02 < 0.02 0.09 0.12 0.28 0.29 0.85 0.86 Mesenteric Fat < 0.02 < 0.02 0.07 0.09 0.29 0.32 0.9 0.94 Subcutaneous Fat < 0.02 < 0.02 0.06 0.08 0.18 0.23 0.55 0.57 Liver nd < 0.02 0.04 0.06 0.12 0.13 0.5 0.58 Muscle nd nd < 0.02 < 0.02 0.02 0.03 0.04 0.04 Kidney nd nd < 0.02 < 0.02 0.04 0.04 0.13 0.15 a See JMPR 2010 Fluopyram Evaluation, Table 222
Poultry
The 2010 JMPR also reviewed a feeding study with fluopyram on poultry, reported by Billian, 2008 [Ref: JMPR 2010 E] and the following table summarizes the residues found in hen eggs and tissues after oral dosing for 28 consecutive days with fluopyram at levels corresponding to feed concentrations of 0.5 ppm to 4.8 ppm.
Table 32 Residues of fluopyram and metabolites in hen eggs and tissues
Feeding level 0.05 ppm (0.1× group)
0.49 ppm (1× group)
1.6 ppm (3× group)
4.8 ppm (10× group)
Fluopyram residues (mg/kg)
Commodity mean max mean max mean max mean max
eggs nd nd nd nd nd nd nd nd
Skin with Fat nd nd nd nd nd nd nd < 0.01
Liver nd nd nd nd nd nd nd nd
Muscle nd nd nd nd nd nd nd nd
BZM residues (mg/kg)
Commodity mean max mean max mean max mean max
eggs nd < 0.01 0.08 0.09 0.22 0.23 0.72 0.92
Skin with Fat < 0.01 < 0.01 0.04 0.04 0.1 0.11 0.41 0.63
Liver 0.01 0.02 0.16 0.16 0.41 0.43 1.4 1.6
Muscle < 0.01 < 0.01 0.03 0.04 0.09 0.1 0.29 0.33
Total-olefines residues (mg/kg)
Commodity mean max mean max mean max mean max
eggs nd nd nd nd nd < 0.02 0.02 0.03

Fluopyram
646
Feeding level 0.05 ppm (0.1× group)
0.49 ppm (1× group)
1.6 ppm (3× group)
4.8 ppm (10× group)
Skin with Fat nd nd < 0.02 < 0.02 0.02 0.03 0.05 0.08
Liver nd nd nd nd < 0.02 < 0.02 < 0.02 0.02
Muscle nd nd nd nd nd nd 0.02 0.06 a See JMPR 2010 Fluopyram Evaluation, Table 225 Results are the mean residues from 3 sub-groups (of 3 animals each) in each dose group
APPRAISAL
Fluopyram, a pyridylethylamide broad spectrum fungicide was evaluated for the first time by the 2010 JMPR, where an ADI of 0–0.01 mg/kg bw and an ARfD of 0.5 mg/kg bw were established, residue definitions were proposed and maximum residue levels were recommended for a number of uses where GAP information was available.
Residue definitions recommended by the 2010 JMPR are:
• For compliance with the MRL and for dietary intake estimation for plant commodities: fluopyram
• For MRL-compliance for animal commodities: sum of fluopyram and 2-(trifluoromethyl) benzamide, expressed as fluopyram
• For dietary intake estimation for animal products: sum of fluopyram, 2-(trifluoromethyl)benzamide and the combined residues N-{(E)-2-[3-chloro-5-(trifluoromethyl)pyridin-2-yl]ethenyl}-2-trifluoromethyl) benzamide and N-{(Z)-2-[3-chloro-5-(trifluoromethyl)pyridin-2-yl]ethenyl}-2-trifluoromethyl) benzamide, all expressed as fluopyram
The residue is not fat-soluble.
New GAP information, supporting residue data and additional analytical sample storage stability studies were provided by the manufacturer for evaluation by the Meeting.
Stability of residues in stored analytical samples
The Meeting received updated information on the stability of residues in frozen analytical samples of representative substrates covering those with a high water content (lettuce), a high starch content (wheat grain), a high protein content (dry pea seed), a high oil content (rape seed) and a high acid content (orange).
Residues of fluopyram and its -benzamide, -pyridyl-acetic acid and -pyridyl-carboxylic acid metabolites were all stable in these representative substrates (except orange) stored frozen for up to 36–37 months. In orange, levels of the -pyridyl-acetic acid metabolite decreased from about 80% of the spiked level after 6 months to about 50% after 36 months storage.
Results of supervised residue trials on crops
The Meeting received new supervised trial data for foliar applications of fluopyram (SC formulations) on apples, wine grapes and peppers and agreed to use the data provided to the 2010 JMPR to estimate maximum residue levels for commodities for which new GAP information was available.
The results from these new trials and those previously reported by the 2010 JMPR and either matching critical GAP or where the results can be proportionally adjusted (scaled) to reflect GAP application rates were used to estimate maximum residue levels, STMRs and HRs for a number of commodities. The approach used to scale the results from trials where the application rates range from 0.33 × GAP to 5 × GAP (but otherwise match the critical GAP) is described in the Report of the 2010 JMPR (Section 2.8).

Fluopyram
647
The OECD MRL calculator was used as a tool to assist in the estimation of maximum residue levels from the selected residue data set obtained from the supervised residue trials. As a first step, the Meeting reviewed all relevant factors related to each data set in arriving at a best estimate of the maximum residue level using expert judgement. Then the OECD calculator was employed. If the statistical calculation spreadsheet suggested a different value from that recommended by the Meeting, a brief explanation of the deviation was supplied.
Pome fruits
Results from supervised field trials on apples and pears conducted in Europe and North America were provided to the 2010 JMPR and the results from additional trials on apples in North America were provided to the Meeting.
The critical GAP for pome fruit is in Germany, a maximum of 4 applications of 0.05 kg ai/ha/metre of canopy height, PHI 14 days (equivalent to 0.15 kg ai/ha for 3m canopy trees). In trials on apples (6) and pears (2) from northern Europe, reported by the 2010 JMPR and matching the GAP in Germany, fluopyram residues were: 0.11, 0.11, 0.12, 0.12, 0.15, 0.2, 0.21 and 0.28 mg/kg.
The Meeting estimated a group maximum residue level of 0.5 mg/kg, an STMR of 0.135 mg/kg and an HR of 0.28 mg/kg for fluopyram on pome fruits.
Stone fruits
Results from supervised field trials on cherries conducted in USA and peaches conducted in Europe and USA were provided to the 2010 JMPR.
Cherries
The critical GAP for cherries is in Canada, up to 3 applications of 0.125 kg ai/ha, 14 days apart, PHI 0 days and a maximum seasonal rate of 0.375 kg ai/ha. None of the trials reported by the 2010 JMPR matched this GAP.
GAP for cherries in USA is 0.1 kg ai/ha, PHI 0 days, a 5–7 day spraying interval and a maximum of 0.21 kg ai/ha/season. In trials from USA reported by the 2010 JMPR, where cherries were treated with 2 × 0.25–0.26 kg ai/ha fluopyram, residues at 0 DAT (days after the last treatment) were: 0.07, 0.15, 0.21, 0.28, 0.35, 0.51, 0.51, 0.57, 0.63, 0.64 and 1.2 mg/kg. When proportionally adjusted to the 0.1 kg ai/ha GAP application rate (scaling factors of 0.38–0.4), fluopyram residues in cherries from these trials were: 0.03, 0.06, 0.08, 0.11, 0.14, 0.20, 0.21, 0.22, 0.22, 0.25, 0.26 and 0.47 mg/kg (n = 12).
The Meeting agreed to use the proportionally adjusted data matching the GAP of the USA for cherries to estimate a maximum residue level of 0.7 mg/kg, an STMR of 0.205 mg/kg and an HR of 0.47 mg/kg for fluopyram on cherries.
Peach
The critical GAP for peaches is in Turkey, 0.005 kg ai/hL, PHI 3 days. In trials from Southern Europe reported by the 2010 JMPR, where peaches were treated with 3 × 0.01–0.018 kg ai/hL fluopyram, residues at 3 DAT were: 0.11, 0.15, 0.2, 0.24, 0.26, 0.33, 0.34 and 0.34 mg/kg. When proportionally adjusted to the 0.005 kg ai/hL GAP application rate (scaling factors of 0.28–0.5), fluopyram residues in peaches from these trials were: 0.03, 0.06, 0.10, 0.12, 0.14, 0.16, 0.16 and 0.17 mg/kg (n = 9).
The Meeting agreed to use the Southern European trial results, proportionally adjusted to match the GAP in Turkey to estimate a maximum residue level of 0.4 mg/kg, an STMR of 0.13 mg/kg and an HR of 0.17 mg/kg for fluopyram on peach.

Fluopyram
648
Berries and other small fruits
Grapes
Results from supervised field trials on wine and table grapes conducted in Europe and on table grapes in USA were provided to the 2010 JMPR and additional trial results on wine grapes from USA were provided to the Meeting.
New GAP information was provided to the Meeting for wine grapes in USA (0.25 kg ai/ha, PHI 7 days with a maximum seasonal rate of 0.5 kg ai/ha) and in North American trials matching this GAP, fluopyram residues in grapes were: 0.1, 0.15, 0.15, 0.19, 0.21, 0.27, 0.32, 0.37, 0.43, 0.47, 0.49, 0.52, 0.57, 0.62, 0.63 and 0.95 mg/kg (n = 16).
The Meeting noted that the 2010 JMPR had estimated a maximum residue level of 2 mg/kg, an STMR of 0.58 mg/kg and an HR of 1 mg/kg for fluopyram on grape, based on data from European trials matching the Romanian GAP for table grapes (2 × 0.25 kg ai/ha, PHI 3 days) and that this 2010 recommendation accommodated the new GAP in USA.
Strawberry
Results from supervised field trials on strawberries in USA (foliar applications and drip irrigation treatments) and Europe (foliar applications) to strawberries were provided to the 2010 JMPR.
The critical GAP for strawberries is in Morocco, 2 applications of 0.015 kg ai/hL, PHI 3 days but none of the European trials matched this GAP.
GAP for strawberries in Canada is for a maximum of 2 drip irrigation treatments of up to 0.25 kg ai/ha, PHI 0 days with a maximum seasonal application rate of 0.5 kg ai/ha. In trials from USA, reported by the 2010 JMPR and matching the GAP in Canada, fluopyram residues were: < 0.01, < 0.01, 0.01, 0.02, 0.02, 0.03, 0.03, 0.06, 0.1 and 0.23 mg/kg (n = 10).
The Meeting estimated a maximum residue level of 0.4 mg/kg, an STMR of 0.025 mg/kg and an HR of 0.23 mg/kg for fluopyram on strawberries..
Banana
Results from supervised field trials on bagged and unbagged bananas in Mexico, Central and South America were provided to the 2010 JMPR.
The critical GAP for bananas is in Panama, a maximum of 5 foliar applications of 0.1 kg ai/ha, PHI 0 days. In trials on bananas, reported by the 2010 JMPR and matching the GAP in Panama (but involving 6 applications), fluopyram residues in unbagged bananas (whole fruit) were: 0.02, 0.04, 0.04, 0.05, 0.05, 0.06, 0.17, 0.18, 0.18, 0.21, 0.22, 0.25, 0.34 and 0.51 mg/kg (n = 14).
The Meeting considered that residue contribution from the first of the six applications, applied at least 30 days before harvest would not significantly influence the final residue.
The Meeting estimated a maximum residue level of 0.8 mg/kg, an STMR of 0.175 mg/kg and an HR of 0.51 mg/kg for fluopyram on banana.
Cucumber
The 2010 JMPR evaluated residue trial data and GAP information on the use of fluopyram as a foliar spray on cucumber in China (3 × 0.075 kg ai/ha, 2-day PHI) and estimated an STMR of 0.11 mg/kg, an HR of 0.19 mg/kg and recommended a maximum residue level of 0.5 mg/kg for fluopyram on cucumbers.
New information was provided to the Meeting on the GAP in Turkey for cucumbers grown under cover (0.006 kg ai/hL, 3 day PHI). None of the trials in Europe, reported by the 2010 JMPR, matched the GAP in Turkey.

Fluopyram
649
Fruiting vegetables, other than Cucurbits
Peppers
The critical GAP for peppers is in Turkey, 0.006 kg ai/hL, 3 day PHI. In the two new trials provided to the Meeting on peppers grown under cover in Turkey and matching the GAP in Turkey, fluopyram residues were 0.23 and 0.24 mg/kg.
In trials reported by the 2010 JMPR, where fluopyram was applied 2 × 0.025–0.03 kg ai/hL to peppers grown under cover, residues 3 DAT were: 0.16, 0.25, 0.29, 0.31, 0.42 and 0.58 mg/kg. When proportionally adjusted to the 0.006 kg ai/hl GAP application rate in Turkey (scaling factors of 0.2–0.3), residues of fluopyram in peppers were: 0.03, 0.05, 0.08, 0.08, 0.09 and 0.13 mg/kg (n = 6).
The combined data set of results from the pepper trials matching the GAP in Turkey, including the proportionally scaled results were: 0.03, 0.05, 0.08, 0.08, 0.09, 0.13, 0.23 and 0.24 mg/kg (n = 8).
The Meeting estimated a maximum residue level of 0.5 mg/kg, an STMR of 0.085 mg/kg and an HR of 0.24 mg/kg for fluopyram on peppers.
For dried chili peppers, using the data set for peppers and a dehydration factor of 10, the Meeting estimated an STMR of 0.85 mg/kg, an HR of 2.4 mg/kg and recommended a maximum residue level of 5 mg/kg for fluopyram on peppers chili, dried.
Tomato
The critical GAP for tomato is in Morocco, up to 2 applications/season of 0.0125 kg ai/hL, 3 day PHI. None of the trials on tomatoes in Europe, reported by the 2010 JMPR, matched the GAP in Morocco and the Meeting decided to assess the results of the trials on indoor-grown tomatoes against the Moroccan GAP. In these trials, where fluopyram was applied 2 × 0.02 or 0.03 kg ai/hL (2 × 0.3 kg ai/ha), residues 3 DAT were: 0.13, 0.15, 0.15, 0.15, 0.16, 0.19, 0.19, 0.24, 0.28, 0.36, 0.44 and 0.62 mg/kg. When proportionally adjusted to the 0.0125 kg ai/hl GAP application rate (scaling factors of 0.31–0.63), fluopyram residues in tomatoes were: 0.05, 0.06 (3), 0.08, 0.08, 0.1, 0.15, 0.18, 0.19, 0.22 and 0.23 mg/kg (n = 12).
Based on the results of the trials on indoor-grown tomatoes, the Meeting estimated a maximum residue level of 0.4 mg/kg, an STMR of 0.09 mg/kg and an HR of 0.23 mg/kg for fluopyram on tomato.
Beans (dry)
The critical GAP for dry beans (except soya beans) is in USA, 0.15 kg ai/ha, at 7-10 day intervals, 14 day PHI with a maximum seasonal rate of 0.3 kg ai/ha. None of the trials reported by the 2010 JMPR matched the USA GAP but in trials in USA on dry beans where fluopyram was applied 2 × 0.24–0.26 kg ai/ha, residues 14 DAT were: < 0.01, < 0.01, < 0.01, 0.01, 0.01, 0.01, 0.03, 0.05 and 0.07 mg/kg. When proportionally adjusted to the 0.15 kg ai/ha GAP application rate (scaling factors of 0.58-0.63), fluopyram residues in beans (dry) from these trials were: < 0.01 (6), 0.02, 0.03 and 0.04 mg/kg (n = 9).
The Meeting noted that the GAP in USA for 'dry beans' crop group includes lupins, chick-pea and lentil, which are not covered by the Codex 'beans (dry)' crop group and agreed to extrapolate the data for dry beans to these commodities.
The Meeting estimated a maximum residue level of 0.07 mg/kg and an STMR of 0.01 mg/kg for fluopyram on beans (dry), lupin (dry), chick-pea (dry) and lentil (dry).
Root and tuber vegetables
Results from supervised field trials on carrots, potatoes and sugar beet in North America and on carrots in Europe were provided to the 2010 JMPR.

Fluopyram
650
Carrots
GAP for carrots in Ukraine is for a maximum of 2 foliar applications of 0.15 kg ai/ha, 30 day PHI. In carrot trials in Northern Europe matching the GAP in Ukraine and reported by the 2010 JMPR, residues were: 0.03, 0.04, 0.07, 0.08, 0.1, 0.13, 0.15 and 0.19 mg/kg (n = 8).
The Meeting estimated a maximum residue level of 0.4 mg/kg, an STMR of 0.09 mg/kg and an HR of 0.19 mg/kg for fluopyram on carrot.
Potato
The critical GAP for potatoes is in USA, 0.2 kg ai/ha, 7 day PHI with a maximum seasonal rate of 0.4 kg ai/ha. In potato trials in USA matching the GAP in USA and reported by the 2010 JMPR, residues were: < 0.01 (14), 0.01 and 0.02 mg/kg (n = 16).
The Meeting estimated a maximum residue level of 0.03 mg/kg, an STMR of 0.01 mg/kg and an HR of 0.02 mg/kg for fluopyram on potatoes. The OECD Calculator recommended a value of 0.02 mg/kg but the Meeting noted the high level of censored data and proposed a higher level.
Sugar beet
The critical GAP for sugar beet in USA is 0.125 kg ai/ha, 7 day PHI with a maximum seasonal rate of 0.25 kg ai/ha. None of the sugar beet trials reported by the 2010 JMPR matched the GAP in USA, but in trials in USA where fluopyram was applied 2 × 0.24–0.26 kg ai/ha, residues 7 DAT in sugar beet roots were: 0.02 (4), 0.03 (3), 0.04 (3) and 0.05 mg/kg. When proportionally adjusted to the 0.125 kg ai/ha GAP application rate (scaling factors of 0.48–0.52), fluopyram residues in sugar beet roots were: < 0.01, < 0.01, 0.01, 0.01, 0.01, 0.01, 0.02, 0.02, 0.02, 0.02 and 0.02 mg/kg (n = 11).
The Meeting estimated a maximum residue level of 0.04 mg/kg, an STMR of 0.01 mg/kg and an HR of 0.02 mg/kg for fluopyram on sugar beet roots.
Tree nuts
The critical GAP for tree nuts is in USA, 0.25 kg ai/ha, 14 day PHI with a seasonal maximum rate of 0.5 kg ai/ha.
In almond trials in USA, reported by the 2010 JMPR, matching the GAP for tree nuts in USA, fluopyram residues in almond nutmeat were: < 0.01, < 0.01, < 0.01, 0.01 and 0.02 mg/kg (n = 5).
In pecan trials in USA, reported by the 2010 JMPR, matching the GAP for tree nuts in USA, fluopyram residues in pecan nutmeat were: < 0.01, < 0.01, < 0.01, 0.01 and 0.03 mg/kg (n = 5).
The Meeting noted that the residue distributions in almonds and pecans were similar and agreed to combine them to support a group maximum residue level. The combined data set is: < 0.01 (6), 0.01, 0.01, 0.02 and 0.03 mg/kg (n = 12).
The Meeting estimated a maximum residue level of 0.04 mg/kg, an STMR of 0.01 mg/kg and an HR of 0.03 mg/kg for fluopyram on tree nuts.
Oilseeds
Peanut
The critical GAP for peanuts is in USA, 0.25 kg ai/ha, 7 day PHI with a maximum seasonal rate of 0.5 kg ai/ha.
In peanut trials reported by the 2010 JMPR, matching the GAP in USA, fluopyram residues in peanut (nutmeat) were: < 0.01 (10), 0.01 and 0.02 mg/kg (n = 12).
The Meeting estimated a maximum residue level of 0.03 mg/kg and an STMR of 0.01 mg/kg for fluopyram on peanut.
Fluopyram
651
Rape seed
The critical GAP for oilseed rape is in Germany, a single application of 0.125 kg ai/ha over the flowering period (from BBCH 57 to BBCH 69, i.e., up to the end of flowering). In the Northern European supervised trials on oilseed rape reported by the 2010 JMPR, one fluopyram application of 0.125 kg ai/ha was made early flowering (about BBCH 63) and a second treatment was applied between 14 and 39 days later, at BBCH 73 (30% pods at full size).
Fluopyram residues in rape seed from these Northern European trials were: 0.02, 0.04, 0.08, 0.09, 0.1, 0.11, 0.11 and 0.19 mg/kg.
The Meeting agreed that these trials did not match the GAP in Germany and could not be used to estimate a maximum residue level for rape seed.
Animal feeds
Bean forage and fodder
The critical GAP for dry beans (except soya beans) is in USA, 0.15 kg ai/ha, at 7–10 day intervals, 14 day PHI with a maximum seasonal rate of 0.3 kg ai/ha, but as the GAP includes a restriction that livestock should not be grazed on or fed hay or threshings from treated crops, the Meeting did not estimate a median residue for livestock dietary burden estimation.
Sugar beet tops
The critical GAP for sugar beet in USA is 0.125 kg ai/ha, 7 day PHI with a maximum seasonal rate of 0.25 kg ai/ha. None of the sugar beet trials reported by the 2010 JMPR matched the GAP in USA, but in trials in USA where fluopyram was applied 2 × 0.24–0.26 kg ai/ha, residues 7 DAT in sugar beet tops were: 0.35, 0.38, 0.67, 0.69, 0.7, 0.89, 1.8, 3.2, 4.7, 9.4 and 16.5 mg/kg. When proportionally adjusted to the 0.125 kg ai/ha GAP application rate (scaling factors of 0.48-0.52), fluopyram residues in sugar beet tops were: 0.18, 0.19, 0.34, 0.35, 0.37, 0.46, 0.89, 1.6, 2.3, 4.7 and 8.3 mg/kg.
For livestock dietary burden estimation, the Meeting estimated a median residue of 0.46 mg/kg and a highest residue of 8.3 mg/kg for fluopyram on sugar beet tops.
Almond hulls
The critical GAP for tree nuts is in USA; 0.25 kg ai/ha, 14 day PHI with a seasonal maximum rate of 0.5 kg ai/ha. In almond trials in USA, reported by the 2010 JMPR, matching the GAP for tree nuts in USA, fluopyram residues in almond hulls were: 2.4, 3.2, 3.6, 4.3 and 5.4 mg/kg.
For animal dietary burden estimation, the Meeting estimated a median residue of 3.6 mg/kg for fluopyram on almond hulls.
Peanut forage and fodder
The critical GAP for peanuts is in USA; 0.25 kg ai/ha, 7 day PHI with a maximum seasonal rate of 0.5 kg ai/ha but as the GAP includes a restriction that livestock should not be grazed on or fed hay or threshings from treated crops, the Meeting did not estimate a median residue for livestock dietary burden estimation.
Fate of residues during processing
The 2010 JMPR reported that fluopyram was stable under conditions simulating pasteurisation, boiling and sterilisation and also estimated processing factors and STMR-Ps for a range of commodities. Relevant processing factors and STMR-Ps for the commodities considered at this Meeting and used for dietary intake risk assessment or for estimating livestock animal burdens are summarized below.
Summary of relevant processing factors and STMR-P values for fluopyram residues.

Fluopyram
652
Raw agricultural commodity
Processed commodity Processing factor a (mean or median)
RAC STMR (HR) (mg/kg)
STMR-P (HR-P) (mg/kg)
Tomato Juice 0.36 0.09 0.03
Tomato Pomace (wet) 0.1 0.09 0.01
Tomato Preserve 0.21 0.09 0.02
Tomato Puree 0.73 0.09 0.07
Tomato Paste 0.46 0.09 0.04
Potato Peeled tubers < 0.64 0.01 (0.02) < 0.006 (< 0.013)
Potato Chips (crisps) < 0.64 0.01 < 0.006
Potato Flakes 1 0.01 0.01
Potato Wet peel (process waste) 4.3 0.01 0.04
Sugar beet Sugar 1.3 0.01 0.01
Sugar beet Thick juice (Molasses) 0.92 0.01 0.01
Sugar beet Dried pulp 1.3 0.01 0.01
Apples Dried fruit 0.64 (median) 0.135 0.09
Apples Sauce 0.36 (median) 0.135 0.05
Apples Juice < 0.09 (median) 0.135 < 0.01
Apples Pomace (wet) 2.3 (median) 0.135 0.31
Peanut Meal 0.19 0.01 0.002
Peanut Butter 0.22 0.01 0.002
Peanut Oil 0.01 0.01 0.0001
Strawberry Preserve 0.31 0.025 0.008
Strawberry Jam 0.65 0.025 0.02 a The processing factor is the ratio of the total residue in the processed item divided by the total residue in the RAC.
Residues in animal commodities
Farm animal dietary burden
The Meeting estimated the dietary burden of fluopyram in farm animals on the basis of the diets listed in Annex 6 of the 2009 JMPR Report (OECD Feedstuffs Derived from Field Crops).
Animal dietary burden, fluopyram, ppm of dry matter diet US-Canada EU Australia Japan Max Mean Max Mean Max Mean Max Mean Beef cattle 0.13 0.12 7.69 0.74 2.97 2.93c - - Dairy cattle 0.64 0.55 11.2 a b 0.87 2.96 2.92d - - Poultry – broiler 0.002 0.002 0.16 0.08 0.008 0.008 - - Poultry – layer 0.002 0.002 1.97e g 0.18f h 0.008 0.008 - - a Highest maximum beef or dairy cattle dietary burden suitable for MRL estimates for mammalian tissues b Highest maximum dairy cattle dietary burden suitable for MRL estimates for mammalian milk c Highest mean beef or dairy cattle dietary burden suitable for STMR estimates for mammalian tissues. d Highest mean dairy cattle dietary burden suitable for STMR estimates for milk. e Highest maximum poultry dietary burden suitable for MRL estimates for poultry tissues. f Highest mean poultry dietary burden suitable for STMR estimates for poultry tissues. g Highest maximum poultry dietary burden suitable for MRL estimates for poultry eggs. h Highest mean poultry dietary burden suitable for STMR estimates for poultry eggs.

Fluopyram
653
Farm animal feeding studies
The 2010 JMPR reviewed feeding studies with fluopyram on lactating dairy cows and laying hens and the conclusions from these residue transfer studies were used to estimate residue levels of fluopyram and its metabolites in milk, eggs and livestock tissues, based on the above dietary burdens.
Animal commodity maximum residue levels
Cattle
Maximum and mean residues expected in milk and tissues were obtained by using the residue transfer factors estimated by the 2007 JMPR.
For maximum residue estimation, the high residues of fluopyram and BZM (expressed as fluopyram equivalents) were calculated by interpolating the maximum dietary burden (11.2 ppm) from the 1.5:14.4 ppm feeding levels in the dairy cow feeding study and using the highest tissue concentrations of fluopyram plus BZM (fluopyram equivalents) from individual animals within those feeding groups. The same interpolation was used to calculate the highest tissue concentrations of fluopyram, BZM plus total olefins (fluopyram equivalents) for estimating HRs for dietary intake estimation.
The STMR values for the tissues were calculated by interpolating the STMR dietary burden (2.93 ppm from the same feeding levels and using the mean tissue concentrations of fluopyram, BZM plus total olefins (fluopyram equivalents) from those feeding groups.
For milk MRL estimation, the high residues in the milk were calculated by interpolating the maximum dietary burden for dairy cattle (11.2 ppm) from the 1.5:14.4 ppm feeding levels in the dairy cow feeding study and using the mean milk concentrations of fluopyram and BZM (fluopyram equivalents) from this feeding group.
The STMR value for milk was calculated by interpolating the mean dietary burden for dairy cows (2.92 ppm) from the 1.5:14.4 ppm feeding levels and using the mean milk concentrations of fluopyram, BZM plus total olefins (fluopyram equivalents).
Feed level for milk (ppm)
Residues in milk (mg/kg)
Feed level for tissues (ppm)
Residues (mg/kg) Muscle Liver Kidney Fat
Maximum residue level beef or dairy cattle ((fluopyram + BZM) Feeding study (1) 1.5
14.4 0.02 0.25
1.5 14.4
0.02 < 0.45
0.36 2.88
0.03 < 0.39
< 0.02 0.4
Dietary burden/residue estimate
11.2b 0.193 2.43a 0.343 2.25 0.301 0.306
High residue beef or dairy cattle (fluopyram + BZM + Total olefins) Feeding study (2) 1.5
14.4 0.02 < 0.47
< 0.38 2.94
0.03 < 0.41
< 0.04 0.52
Dietary burden/residue estimate
2.43a 0.358 2.305 0.316 0.401
STMR beef or dairy cattle ((fluopyram + BZM + Total olefins) Feeding study (2) 1.5
14.4 0.02 < 0.27
1.5 14.4
0.02 < 0.47
0.36 2.92
0.03 < 0.41
< 0.04 0.49
Dietary burden/residue estimate
2.92 0.048 2.93 0.053 0.527 0.061 0.059
a Highest residues for tissues and mean residues for milk b Mean residues for tissues and for milk

Fluopyram
654
Combined residues of fluopyram and BZM (expressed as fluopyram equivalents) expected in cattle milk and tissues for use in estimating maximum residue levels are: 0.31 mg/kg (fat), 0.34 mg/kg (muscle), 2.25 mg/kg (liver) and 0.3 mg/kg (kidney) and the mean residue for milk is 0.19 mg/kg.
The Meeting estimated maximum residue levels of 0.5 mg/kg for fluopyram in meat (from mammals other than marine mammals), 3 mg/kg for liver of cattle, goats, pigs and sheep, 0.5 mg/kg for kidney of cattle, goats, pigs and sheep and 0.3 mg/kg for milks and agreed to withdraw the previous recommendations for meat (from mammals other than marine mammals), edible offal (mammalian) and milks.
Estimated HRs for dietary intake estimation for fluopyram (and including residues of BZM and total olefins) are 0.4 mg/kg for mammalian fat, 0.36 mg/kg for mammalian muscle, 2.3 mg/kg for liver and 0.32 mg/kg for kidney.
Estimated STMRs for dietary intake estimation for fluopyram (and including residues of BZM and total olefins) are 0.06 mg/kg for mammalian fat, 0.05 mg/kg for mammalian muscle, 0.53 mg/kg for liver of cattle, goats, pigs and sheep, 0.06 mg/kg for kidney of cattle, goats, pigs and sheep and 0.05 mg/kg for milks
Poultry
The dietary burdens for poultry broilers are 0.18 ppm (maximum) and 0.08 ppm (mean) but the Meeting decided to estimate residue levels in poultry tissues using the higher mean/maximum dietary burden in poultry layers (1.97 ppm) as they may also be consumed. Tissue concentrations of fluopyram plus BZM (fluopyram equivalents) for maximum residue level estimation and of fluopyram, BZM plus total olefins (fluopyram equivalents) for dietary intake were obtained by interpolation between the 1.6 ppm and the 4.8 ppm feeding levels in the poultry study reported by the 2010 JMPR.
For eggs, for MRL estimation, residue levels in eggs were also estimated by interpolation between the higher dose levels (1.6 ppm and 4.8 ppm) because of the higher poultry layer dietary burden (1.97 ppm) but for estimating the STMR, based on a mean dietary burden of 0.18 ppm for poultry layers, mean residue levels were estimated by interpolation between the 0.05 ppm and the 0.49 ppm feeding levels.
Feed level for eggs (ppm)
Residues in eggs (mg/kg)
Feed level for tissues (ppm)
Residues (mg/kg) Muscle Liver Skin with Fat
Maximum residue level broiler or laying hen (fluopyram + BZM) Feeding study (1) 1.6
4.8 0.22 0.72
1.6 4.8
0.1 0.33
0.43 1.6
0.11 < 0.64
Dietary burden/residue estimate 1.97 b 0.193 1.97 a 0.127 0.565 0.171 High residue broiler or laying hen (fluopyram + BZM + Total olefins) Feeding study (2) 1.6
4.8 0.1 0.39
< 0.45 1.8
< 0.14 < 072
Dietary burden/residue estimate 1.97 a 0.134 0.585 0.207 STMR broiler or laying hen (fluopyram + BZM + Total olefins) Feeding study (2) 0.05
0.49 0 0.8
0.05 0.49
< 0.01 0.03
0.1 0.16
< 0.01 < 0.06
Dietary burden/residue estimate 0.18 0.008 0.18 0.011 0.02 0.013 a Highest residues for tissues and mean residues for eggs b Mean residues for tissues and for eggs
Combined residues of fluopyram and BZM (expressed as fluopyram equivalents) expected in
poultry eggs and tissues for use in estimating maximum residue levels are: 0.17 mg/kg (fat), 0.13 mg/kg (muscle), 0.56 mg/kg (liver) and 0.19 mg/kg (eggs).
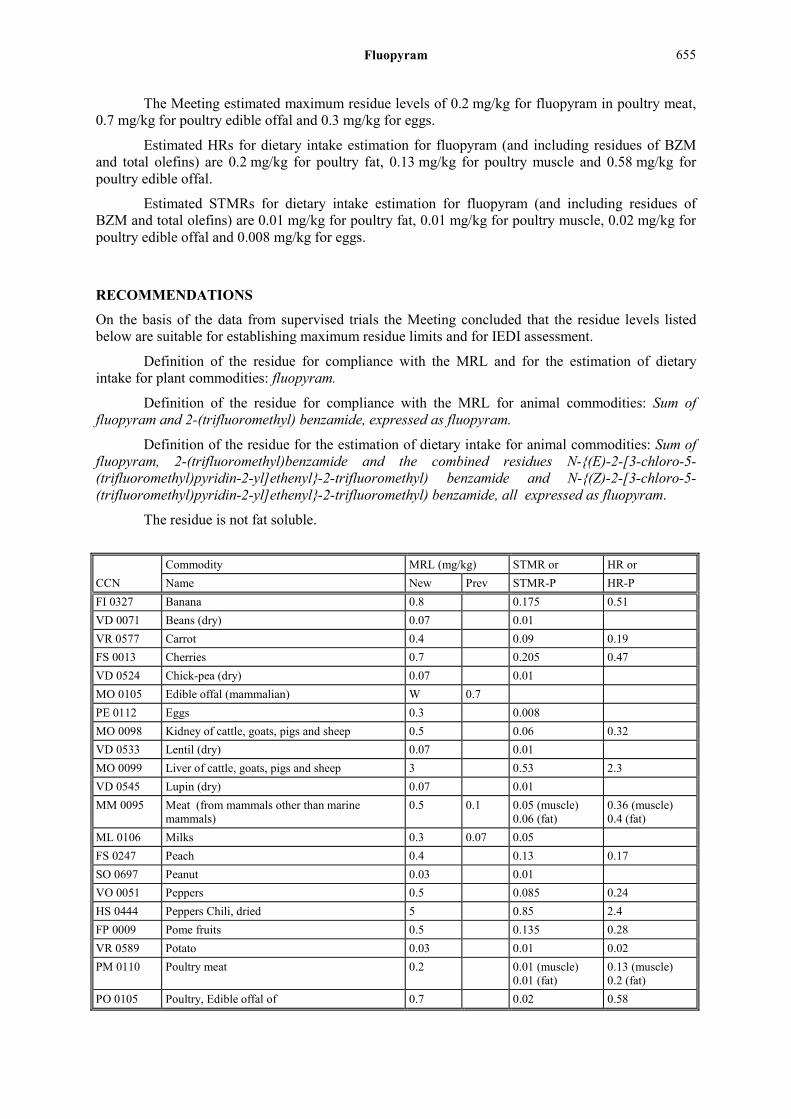
Fluopyram
655
The Meeting estimated maximum residue levels of 0.2 mg/kg for fluopyram in poultry meat, 0.7 mg/kg for poultry edible offal and 0.3 mg/kg for eggs.
Estimated HRs for dietary intake estimation for fluopyram (and including residues of BZM and total olefins) are 0.2 mg/kg for poultry fat, 0.13 mg/kg for poultry muscle and 0.58 mg/kg for poultry edible offal.
Estimated STMRs for dietary intake estimation for fluopyram (and including residues of BZM and total olefins) are 0.01 mg/kg for poultry fat, 0.01 mg/kg for poultry muscle, 0.02 mg/kg for poultry edible offal and 0.008 mg/kg for eggs.
RECOMMENDATIONS
On the basis of the data from supervised trials the Meeting concluded that the residue levels listed below are suitable for establishing maximum residue limits and for IEDI assessment.
Definition of the residue for compliance with the MRL and for the estimation of dietary intake for plant commodities: fluopyram.
Definition of the residue for compliance with the MRL for animal commodities: Sum of fluopyram and 2-(trifluoromethyl) benzamide, expressed as fluopyram.
Definition of the residue for the estimation of dietary intake for animal commodities: Sum of fluopyram, 2-(trifluoromethyl)benzamide and the combined residues N-{(E)-2-[3-chloro-5-(trifluoromethyl)pyridin-2-yl]ethenyl}-2-trifluoromethyl) benzamide and N-{(Z)-2-[3-chloro-5-(trifluoromethyl)pyridin-2-yl]ethenyl}-2-trifluoromethyl) benzamide, all expressed as fluopyram.
The residue is not fat soluble.
Commodity MRL (mg/kg) STMR or HR or CCN Name New Prev STMR-P HR-P FI 0327 Banana 0.8 0.175 0.51 VD 0071 Beans (dry) 0.07 0.01 VR 0577 Carrot 0.4 0.09 0.19 FS 0013 Cherries 0.7 0.205 0.47 VD 0524 Chick-pea (dry) 0.07 0.01 MO 0105 Edible offal (mammalian) W 0.7 PE 0112 Eggs 0.3 0.008 MO 0098 Kidney of cattle, goats, pigs and sheep 0.5 0.06 0.32 VD 0533 Lentil (dry) 0.07 0.01 MO 0099 Liver of cattle, goats, pigs and sheep 3 0.53 2.3 VD 0545 Lupin (dry) 0.07 0.01 MM 0095 Meat (from mammals other than marine
mammals) 0.5 0.1 0.05 (muscle)
0.06 (fat) 0.36 (muscle) 0.4 (fat)
ML 0106 Milks 0.3 0.07 0.05 FS 0247 Peach 0.4 0.13 0.17 SO 0697 Peanut 0.03 0.01 VO 0051 Peppers 0.5 0.085 0.24 HS 0444 Peppers Chili, dried 5 0.85 2.4 FP 0009 Pome fruits 0.5 0.135 0.28 VR 0589 Potato 0.03 0.01 0.02 PM 0110 Poultry meat 0.2 0.01 (muscle)
0.01 (fat) 0.13 (muscle) 0.2 (fat)
PO 0105 Poultry, Edible offal of 0.7 0.02 0.58
Fluopyram
656
Commodity MRL (mg/kg) STMR or HR or CCN Name New Prev STMR-P HR-P FB 0275 Strawberry 0.4 0.025 0.23 VR 0596 Sugar beet 0.04 0.01 0.02 VO 0448 Tomato 0.4 0.09 0.23 TN 0085 Tree nuts 0.04 0.01 0.03 AM 0660 Almond hulls 3.6 DF 0226 Apple, dried 0.09 JF 0226 Apple juice 0.01 AB 1230 Apple pomace, wet 0.31 Apple sauce 0.05 Peanut butter 0.002 Peanut meal 0.002 OR 0697 Peanut oil 0.0001 Potato (peeled) 0.006 0.013 Potato chips (crisps) 0.006 Potato flakes 0.01 Potato wet peel (process waste) 0.04 Strawberry jam 0.02 Strawberry preserve 0.008 Sugar beet (sugar) 0.01 Sugar beet pulp (dry) 0.01 DM 0596 Sugar beet thick juice (molasses) 0.01 Sugar beet tops 0.46 8.3 JF 0448 Tomato juice 0.03 VW 0448 Tomato paste 0.04 Tomato pomace (wet) 0.01 Tomato preserve 0.02 Tomato puree 0.07
DIETARY RISK ASSESSMENT
Long-term intake
The International Estimated Daily Intakes (IEDIs) for fluopyram were calculated for the food commodities for which STMRs or HRs were estimated and for which consumption data were available. The results are shown in Annex 3 of the 2012 JMPR Report.
The International Estimated Daily Intakes of fluopyram for the 13 GEMS/Food regional diets, based on estimated STMRs were 2–20% of the ADI of 0–0.01 mg/kg bw. The Meeting concluded that the long-term intake of residues of fluopyram from uses that have been considered by the JMPR is unlikely to present a public health concern.
Short-term intake
The International Estimated Short-term Intakes (IESTIs) for fluopyram were calculated for the food commodities for which STMRs or HRs were estimated and for which consumption data were available (see Annex 4 of the 2012 JMPR REport).
For fluopyram the IESTI varied from 0–10% of the ARfD (0.5 mg/kg bw) and the Meeting concluded that the short-term intake of residues of fluopyram from uses considered by the Meeting is
Fluopyram
657
REFERENCES
Code Author(s) Year Title, Institute, Report reference JMPR 2010 E Anon 2010 Pesticide residues in food—2010 Evaluations. Part I. Residues. Fluopyram (243), pp
1415-1701. FAO Plant Production and Protection Paper 206, 2011. Published. M-418047 Anon. 2011 Determination of the residues of AE C656948 and Tebuconazole in/on pepper after
spraying of AE C656948 & HWG 1608 (400 SC) in the field in Turkey—Parts 1 & 2 M-387923-01-1
MR-08/036 Cavaillé, C & Meilland-Berthier, I
2010 Storage stability of residues of AE C656948 and its metabolites (AE F148815, AE C657188 and BCS-AA10139) in orange during deep freeze storage for up to 36 months. Bayer CropScience S.A., Lyon, France. Bayer CropScience Report No 07-02, 2009. Amended 2010-09-09—Report No MR-08/036. GLP, unpublished M-356046-02-2
MR-10/044 Cavaillé, C & Meilland-Berthier, I
2010 Storage stability of residues of AE C656948 and its metabolites (AE F148815, AE C657188, BCS-AA10139 and BCS-AA10065) in plants during deep freeze storage for up to 36 months. Bayer CropScience S.A., Lyon, France. Bayer CropScience Report No 06-06, 2008. Amended 2010-06-28—Report No MR-10/044. GLP, unpublished M-299461-03-3
MR-10/044 Cavaillé, C & Meilland-Berthier, I
2010 Storage stability of residues of AE C656948 metabolites (AE 1344122 and BCS-AA10065) in dry pea, rape and orange during deep freeze storage for up to 24 months. Bayer CropScience S.A., Lyon, France. Bayer CropScience Report No MR-10/045. Date 2010-09-10. GLP, unpublished M-389465-01-2
RAGMP162 Krolski, ME 2010 Fluopyram 500 SC—Magnitude of the residue in apple. Bayer CropScience LP, Environmental Research, Stilwell, KS, USA. Bayer CropScience Report No.: RAGMP162, Date 2010-08-13. GLP, unpublished M-387923-01-1
RAGMP164 Fischer, DR 2010 AE C656948 500 SC—Magnitude of the residue in/on grapes. Bayer CropScience LP, Environmental Research, Stilwell, KS, USA. Bayer CropScience Report No.: RAGMP164, Date 2010-07-23. GLP, unpublished M-386732-01-1


![Package ‘PAA’ - Bioconductor · Package ‘PAA’ September 16, 2018 Version 1.14.0 Title PAA (Protein Array Analyzer) Author Michael Turewicz [aut, cre], Martin Eisenacher [ctb,](https://static.fdocuments.in/doc/165x107/5bab934309d3f2ca018c48f1/package-paa-package-paa-september-16-2018-version-1140-title.jpg)