Flows and Salinity in the South Delta January 6, 2011 · Flows and Salinity in the South Delta...
23
Flows and Salinity in the South Delta January 6, 2011 Flows and Salinity in the South Delta January 6, 2011 Tara Smith Chief, Delta Modeling California Department of Water Resources
Transcript of Flows and Salinity in the South Delta January 6, 2011 · Flows and Salinity in the South Delta...
Flows and Salinity in the South Delta
January 6, 2011
Flows and Salinity in the South Delta
January 6, 2011
Tara SmithChief, Delta Modeling
California Department of Water Resources

Key Points
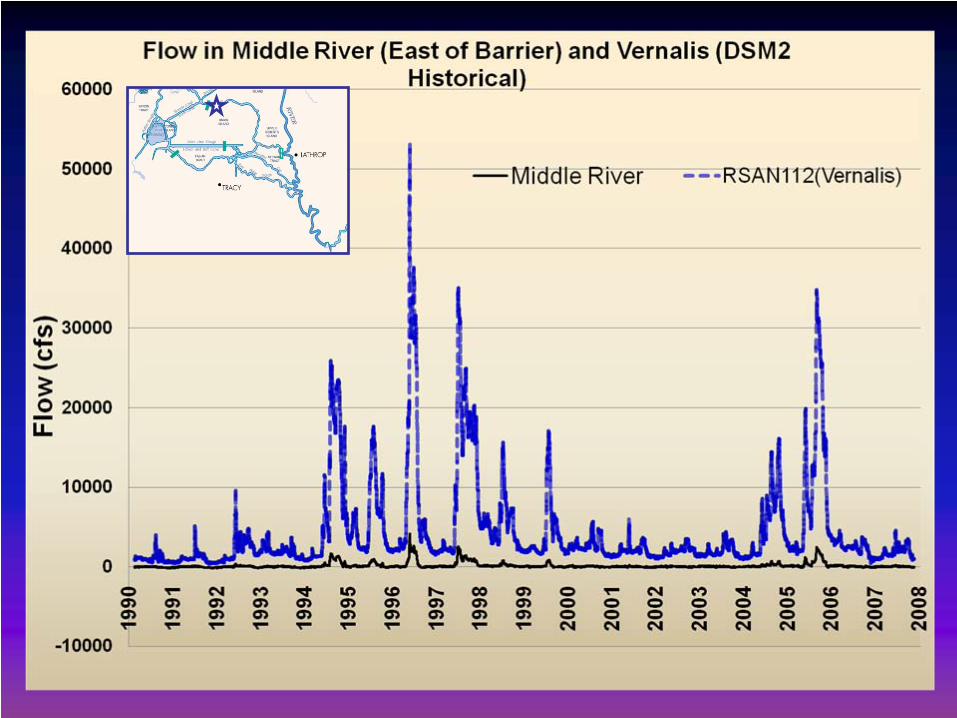
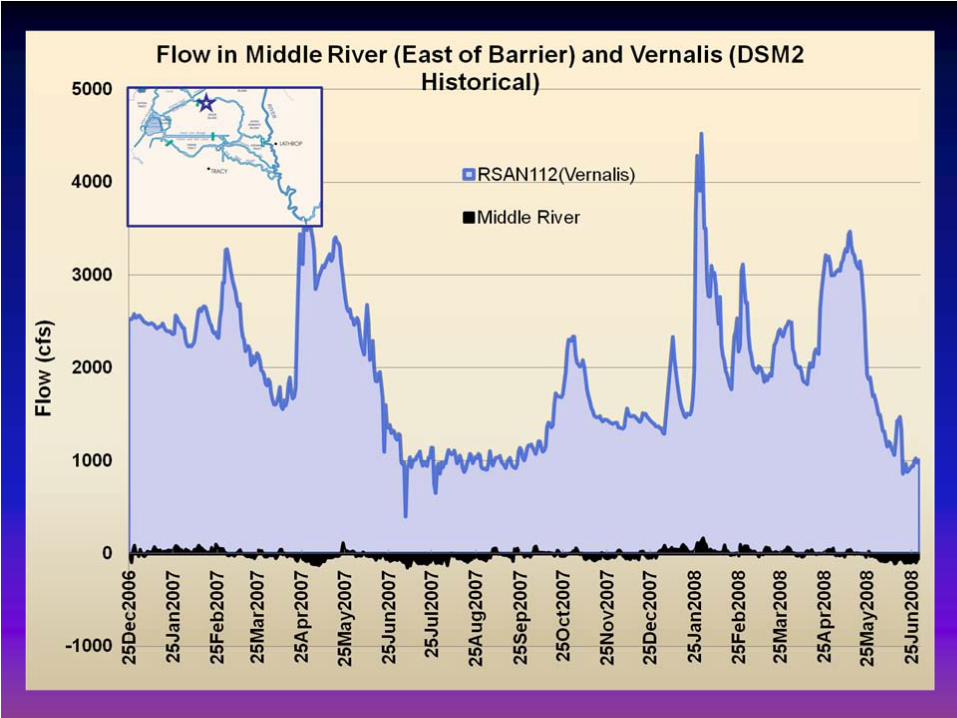
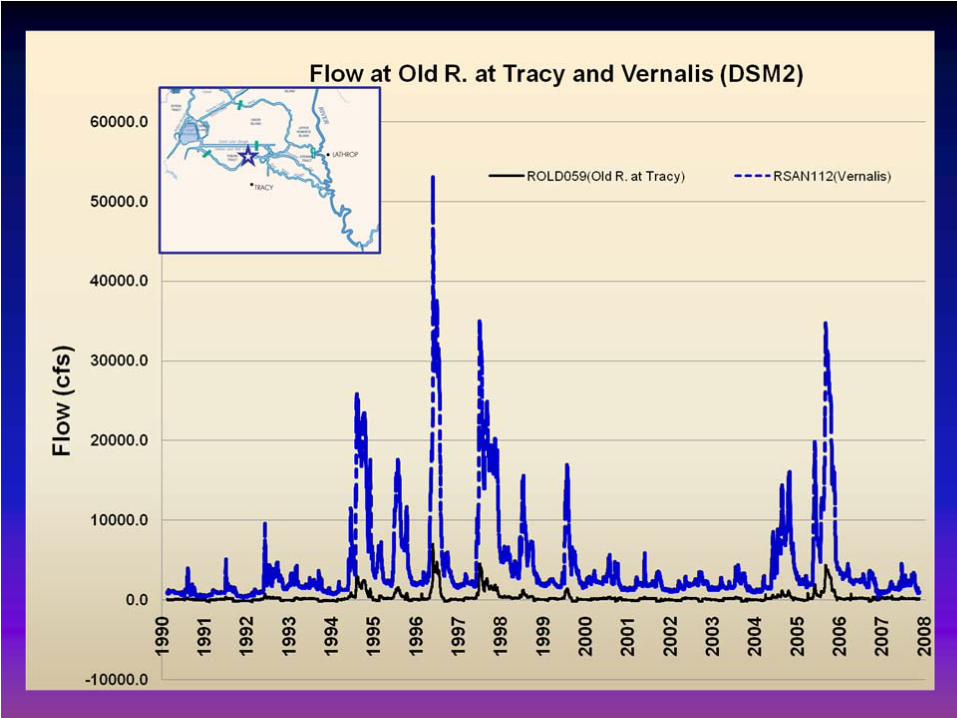
• Flow– San Joaquin River at Vernalis flow - flows downstream into
the South Delta
– Exports are downstream of the objective locations
– Barriers utilize tidal energy to move water upstream into the South Delta
– Increases in San Joaquin flow do not result in a proportional increase in flow at Old River at Tracy

Key Points• Water Quality
– Salinity in the South Delta is primarily dominated by the San Joaquin River and in Delta Sources
– Reduction in exports and/or additional Sacramento flows alone cannot cause significant changes in water quality at the south Delta objective locations.
– Circulation of “Sacramento side” water can be moved upstream to affect the water quality at two of the three objective locations by the use of temporary barriers.
– Water Quality at Brandt Bridge cannot be significantly affected by changes in Sacramento flow, export reduction, or gates

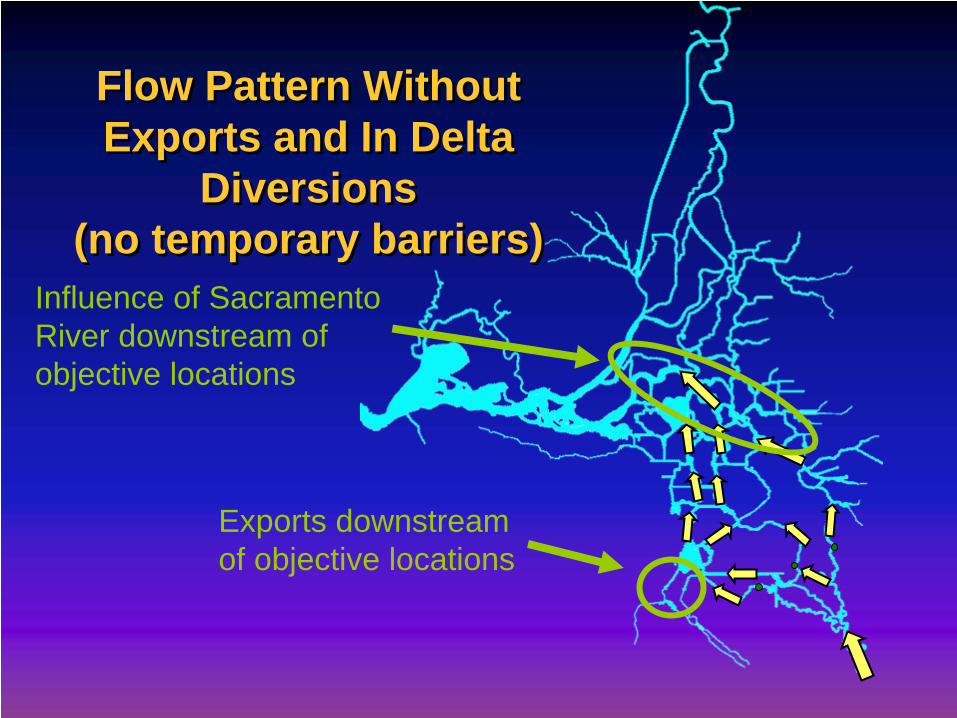
Flow Pattern Without Exports and In Delta
Diversions (no temporary barriers)
Flow Pattern Without Exports and In Delta
Diversions (no temporary barriers)
Flow Pattern Without Exports and In Delta
Diversions (no temporary barriers)
Flow Pattern Without Exports and In Delta
Diversions (no temporary barriers)
Exports downstream of objective locations
Influence of Sacramento River downstream of objective locations

Flow Pattern With Exports And In Delta Diversions (no temporary barriers)
Flow Pattern With Exports And In Delta Diversions (no temporary barriers)

Flow Pattern With Exports and In Delta Diversions (no temporary barriers)
Flow Pattern With Exports and In Delta Diversions (no temporary barriers)
Exports downstream of objective locations
Influence of Sacramento River downstream of objective locations
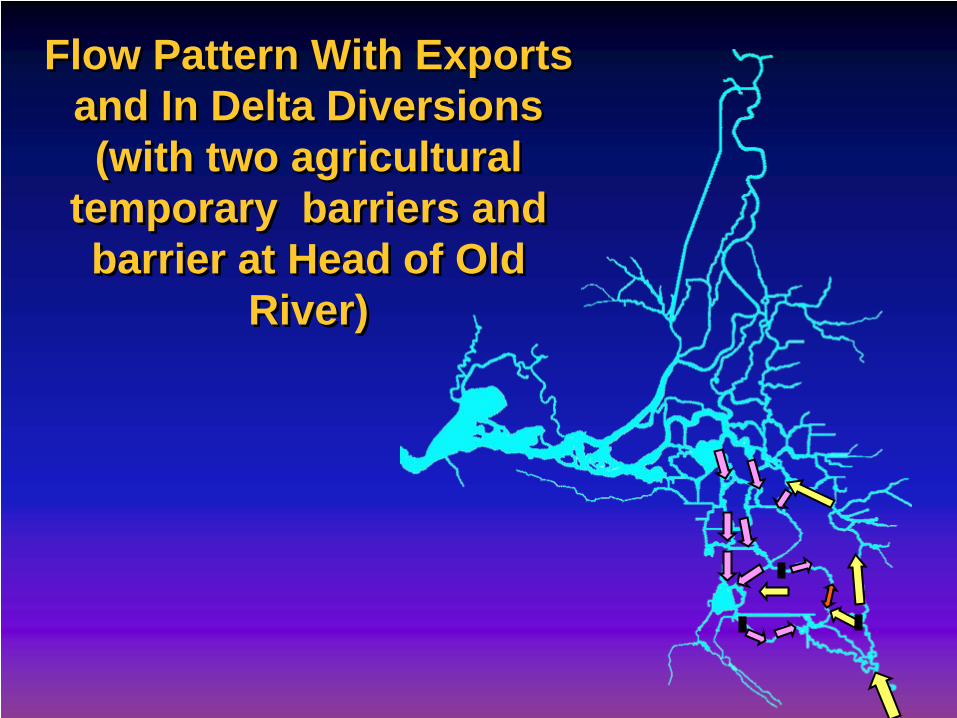
Flow Pattern With Exports and In Delta Diversions (with two agricultural
temporary barriers and barrier at Head of Old
River)
Flow Pattern With Exports and In Delta Diversions (with two agricultural
temporary barriers and barrier at Head of Old
River)

Flow Pattern With Exports and In Delta Diversions (with three agricultural
temporary barriers)
Flow Pattern With Exports and In Delta Diversions (with three agricultural
temporary barriers)

PTM Animation Generated Hydrology


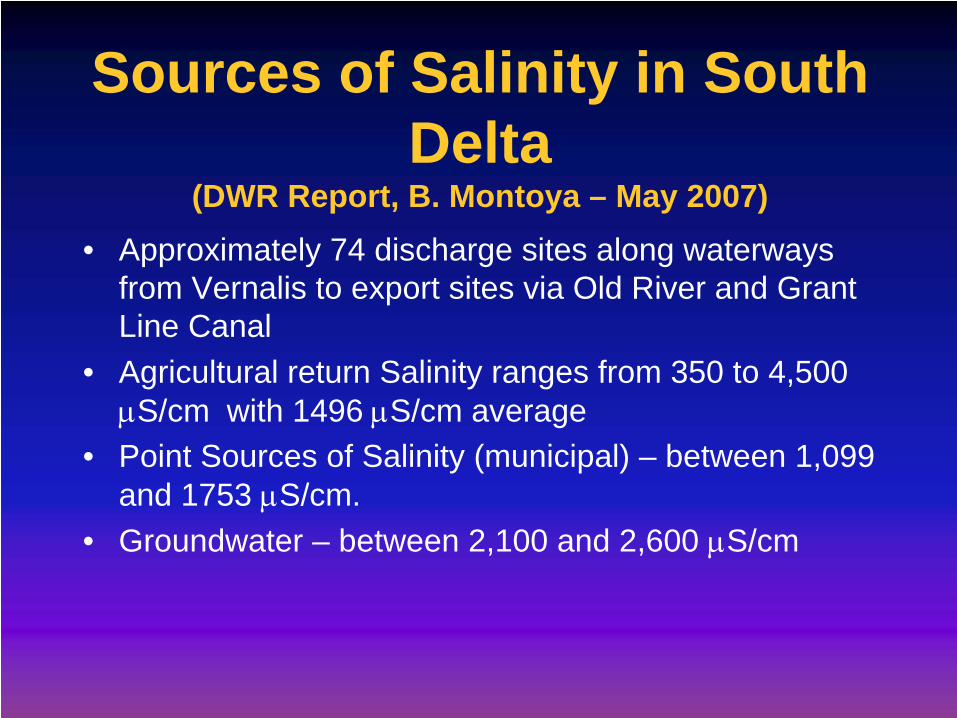
Sources of Salinity in South Delta
(DWR Report, B. Montoya – May 2007)• Approximately 74 discharge sites along waterways
from Vernalis to export sites via Old River and Grant Line Canal
• Agricultural return Salinity ranges from 350 to 4,500 μS/cm with 1496 μS/cm average
• Point Sources of Salinity (municipal) – between 1,099 and 1753 μS/cm.
• Groundwater – between 2,100 and 2,600 μS/cm
Acknowledgements
• Barry Montoya• Myint Thein• Lan Liang• Min Yu• Bob Suits• Parviz Nader-Tehrani• Bijaya Shrestha

Extra SlidesExtra Slides

Old R. Near Mid. R.
GLC West of Barrier
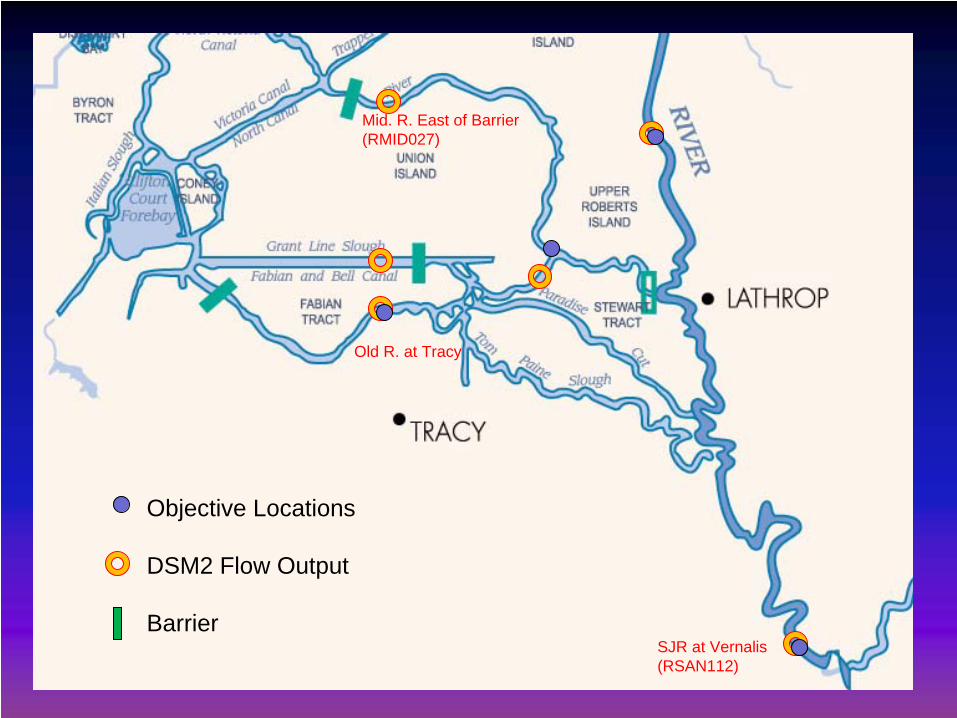
Mid. R. East of Barrier(RMID027)
Old R. at Tracy
SJR at Vernalis (RSAN112)
Objective Locations
DSM2 Flow Output
Barrier

Old R. Near Mid. R.
GLC West of Barrier
Mid. R. East of Barrier(RMID027)
Old R. at Tracy
SJR at Vernalis (RSAN112)
Objective Locations
DSM2 Flow Output
Barrier
Objective of PresentationObjective of Presentation