FLOWGISTICS AND WATER QUALITY - vsb.czkatedry.fmmi.vsb.cz/639/qmag/14_11_03.pdf · In such a way...
13
1/13 FLOWGISTICS AND WATER QUALITY Ljudmil A. Golemanov, Kristina Zgodavova ABSTRACT Paper is briefly dealing with theoretically relatively independent, but in practice tightly corresponding themes from the field of Flowgistics and Water Quality Engineering and Management. Base of the paper is case study (Golemanov, 2002). Merit of the paper is presentation and particular solution of problematic incidental with rationalization of financial, energy, labour and material flows. Addition of this paper is the impulse for such solution of Flowgistics tasks in which is among of Key Performance Results taking account also on Customer Satisfaction, People Satisfaction and Impact to Society. Key words: Flowgistics, Automation, System Engineering, Quality Engineering, Quality Management, 1. FLOWGISTICS Being of Byzantic origin, the terms logo (thinking), logos (common sense), logistikos (logical consideration, inclusive rational thinking and planning), the Logism as such, should be treated as present consideration with calculations of past results for a future plan. As such way the term Logistics was first used in Byzantium during the reign of Leon the IV (865 - 912). In industrial age, that is about more then two centuries of Logistics usage as Multi-National – MN term, it is mainly related to the science of industrial and economic Time-dependent Flows. The factor Time – T (with big, not small T) was first subject to monetary conversion more than 200 years by Benjamin Franklin, introducing the Cash Flow - CF. In modern Time any Logistics is based on Quality and Automation. But according to the father of European science and philosophy “Anything is Flowing in Time”, that is “We are in Time and the Time is in Us” because the GLObe and LOCal Moon are also flowing as follows: Consequently in this 21st century, however, T has become to what flows of fuels and metals were to previous epochs. Constantly measured and priced, this vital resource continues to spur the growth of economies built on a foundation of gigabits per second. By some definitions, Time – T is a continuum flow in which one event follows another from the History – H
Transcript of FLOWGISTICS AND WATER QUALITY - vsb.czkatedry.fmmi.vsb.cz/639/qmag/14_11_03.pdf · In such a way...

1/13
FLOWGISTICS AND WATER QUALITY
Ljudmil A. Golemanov, Kristina Zgodavova ABSTRACT Paper is briefly dealing with theoretically relatively independent, but in practice tightly corresponding themes from the field of Flowgistics and Water Quality Engineering and Management. Base of the paper is case study (Golemanov, 2002). Merit of the paper is presentation and particular solution of problematic incidental with rationalization of financial, energy, labour and material flows. Addition of this paper is the impulse for such solution of Flowgistics tasks in which is among of Key Performance Results taking account also on Customer Satisfaction, People Satisfaction and Impact to Society. Key words: Flowgistics, Automation, System Engineering, Quality Engineering, Quality Management, 1. FLOWGISTICS Being of Byzantic origin, the terms logo (thinking), logos (common sense), logistikos (logical consideration, inclusive rational thinking and planning), the Logism as such, should be treated as present consideration with calculations of past results for a future plan. As such way the term Logistics was first used in Byzantium during the reign of Leon the IV (865 - 912). In industrial age, that is about more then two centuries of Logistics usage as Multi-National – MN term, it is mainly related to the science of industrial and economic Time-dependent Flows.
The factor Time – T (with big, not small T) was first subject to monetary conversion more than 200 years by Benjamin Franklin, introducing the Cash Flow - CF. In modern Time any Logistics is based on Quality and Automation. But according to the father of European science and philosophy “Anything is Flowing in Time”, that is “We are in Time and the Time is in Us”
because the GLObe and LOCal Moon are also flowing as follows:
Consequently in this 21st century, however, T has become to what flows of fuels and metals were to previous epochs. Constantly measured and priced, this vital resource continues to spur the growth of economies built on a foundation of gigabits per second. By some definitions, Time – T is a continuum flow in which one event follows another from the History – H

2/13
through Present – P to the Future - F. Today the number of occurrences packed inside a given interval TPP – Time Period at Present, whether it is a year or a second, increases unendingly. The IT age has become an event driven dynamic evolution in which more is always better.
Consequently Flowgistics of material, energy (inclusive electricity, oil, gas etc.) cash, financial, labor, goods and knowledge are all subject to control, monitoring, total management with imbedded automation and integration into Inter-, Intra-&Extra-Nets, perhaps.
In such a way given Flowgistic System – FS, later also System – S only) should ensure continuously that the right resources, with the right Quantity & Quality – Q&Q, are at the right point in the State Space – X (inclusive place) at the right Time - T. In other words FS concentrates mainly on the dynamic processes related to the continuous Flow considerations (inclusive Cash Flows – CF) as well as their structural inter-relationships for the FS as a whole, used at different facilities and economic organizations. Therefore, the Integrated Logistic System – ISL is considered here-in-after as a part of a Flowgistic System – FS, in which part the process automation is embedded and integrated with Inter-, Intra- and Extra-Nets. An ILS can thus be a part of the supply and value chain process that plans, implements, monitors and controls the efficient and effective flow and accumulating of resources such as materials, energy, cash, services and related information from the points of their generation to the points of their consumption.
As illustrated here in after, in the 1990s Logistics began to be discussed as an integration of streamlined, flexible and effective flow of resources over supply and value chains, which flow, presently define the success or failure of organizations and even entire business areas.
In the cases of total resource handling and management, the systems theory and operations research are and should be used as the theoretical base for modern Systems Engineering – SE approaches, which are based on global economic, business and investment strategies. Therefore, the System Efficiency – SE and Cost Effectiveness – CE are resulting first from resource rationalization and their further optimization, such as continuous creating of an rational and then optimal balance between production, energy, investment and business costs. As for production, activities and energy sub-processes that do not add value to the end-product should rationalized, the optimized and then outsourced or avoided. The activities that actually reduce the value originate to a large extent from lack of co-ordination and lack of relevant, on Time - T production, energy, economic and business information, that is the lack of a System – S integrating Production & Energy Logistic with Economic & Business Logistics into Inter-, Intra & Extra Net environment.
Cost Efficiency – CE must still be viewed in Time – T with the assumption that revenues and business opportunities are of equal or even higher interest. To this end, flowgistics must be viewed as Spatial-Temporal realization of new time-efficient production and energy processes and ensures that the products from these processes reach the customer in an effective and economically profitable way.
21st century market is characterized by Discrete Time – DT being important in almost every respect and this will be even more so in the Future. Companies must be able to respond effectively to changes and continuously reconfigure the flows of their material, energy, labor and financial resources in order to compete and generate profit by taking advantage of the opportunities that arise. Furthermore, there are ongoing trends towards GLObalization and fast customization with temporal Multi-Focusing on bringing VALue into the completely delivered product. Many of these trends have been summarized in the term agility, which has been defined as the ability to profit from rapidly changing, continually fragmenting, GLObal markets for individualisable, customer value-based products and services.

3/13
The advent of Inter-, Intra- & Extra-Nets is eliminating burden of having to wait until the next day for the documents delivery or bank transaction. In Internet Time, everything happens everywhere at once--connected computer users can witness an update to a Web page or account at an identical moment in New York, London or Tokyo. In other words Inter-, Intra- & Extra-Nets prove that Time – T has, in essence, triumphed over the State space – X, as illustrated here in after.
Noting this trend, Swatch is trying to abolish the temporal boundaries that separate global places one from another. It created a standard for Internet timekeeping that eliminated time zones, dividing the day into 1,000 increments that are the same anywhere on the globe. This also proves the effective use of Information Technology – IT by means of Integrated Automation Systems – IAS have primary role to play in all Flowgistic Systems. The new global market opportunities and rapid reaction to uncertain changes in Time T make it essential to have access to adequate production, energy, economic and business information for timely control, management and decision-making. Therefore IAS is built-into the logistics system and easily reconfigurable at all levels for present Inter-, Intra- & Extra-Net environment.
Consequently, Logistics being a part of Flowgistics as illustrated here in after, is also focused on such Multi-Functional – MF activities as generation, supply, accumulation, production and distribution of material, energy, human, and intellectual interrelations with invested financial, labour and other committed to the Future – F, Resources - R. These resources being external and internal as well as active and passive are forming modern Flowgistics considerations of any Flowgistics System - FS, presented here in after (Fig.1). The most important, however, is the fact that net flow and respective Performance functional can not be negative. Forming such a sub-class of non-negative systems in present age of II& ENetworking, multi-criterial optimal Flowgistics problem can be converted to classical in 1960’s Time-optimal problem. This means application of Pontryagin’s maximum principle developed for state space considerations.
Fig. 1 Flowgistics system

4/13
Flow Quality is also Time dependent nature, inherent or distinguishing characteristic of material, production, energy, labour, knowledge or financial Flow; that is a fundamental property or attribute of Flowgistics.
Mathematically all mappings from Quality to Flow are both one-to-many and Time-variant. In present world of GLObalization of knowledge-based economies, all roads lead to neo-Rome, named II&ENets. These roads for REGionalization and LOCalization operations in Flowgistics are both Multi-Lingual – ML in terminology and Multi-National – MN in terms of Quality standards and formats on LOCal, REGional and GLObal levels.
2. WATER QUALITY Quality means conformance. (Crosby, 1997) There are the words of well known quality expert P.B. Crosby. Conformance to the requirements is checked by measurement. In ancient Egypt and Mesopotamia, measures and weights were controlled by the emperor to ensure standards in the trade of precious metals and oils.
Standardization in general is required when manufacturing uniform products in large quantities.
In context of drinking water it is for example elimination of health risk.
Water quality means conformance to the specification determined for given water product. These are defined by water engineers and used by customers/consumers. Water quality also means satisfying customers/consumer needs and surprising customers with pleasing results knowing what the customers really need and how to reduce variation to deliver consistence water to them.
Quality is uprising in elements and makes itself felt in relations between them. Water quality is given not only by its chemical elements behaviour, but also by bindings between them and further characteristics as: water temperature, clarity, pipeline impact etc.
From history we know, that one of the Rome Emporium fall factors were also lead water-pipes.
The first thing is that the best test for water quality is in its everyday use by customers/consumer. The second think is health risk elimination.
Application of Quality Engineering Methodology – QEM and Total Quality Management – TQM Primary task of Quality Engineering - QE in water quality industry is identification, modelling, analysis, evaluation and projecting of quality control to fulfil and improve specific product features, in our case specification of requirements for water quality.
For water quality assurance in wider sense of a word we focus on issues relating to water quality management and health risk reduction, from catchments and reservoir management and water treatment to the distribution of drinking water to consumers' taps and performance of whole system for water treatment. In wider relations is for achieving of excellency of water industry, but mostly for achieving of continuously sustainable development required to allow among Total Quality Management - TQM Philosophy:
T – Total: Customer orientation, Employee orientation, Society and environmental orientation, Cross-functionality
5/13
Leadership Policy and Strategy
Partnerships and Resources
People Results
Customer Results
Society Results
Key PerformanceResults
People
Enablers Results
Innovation &Learning
Processes management
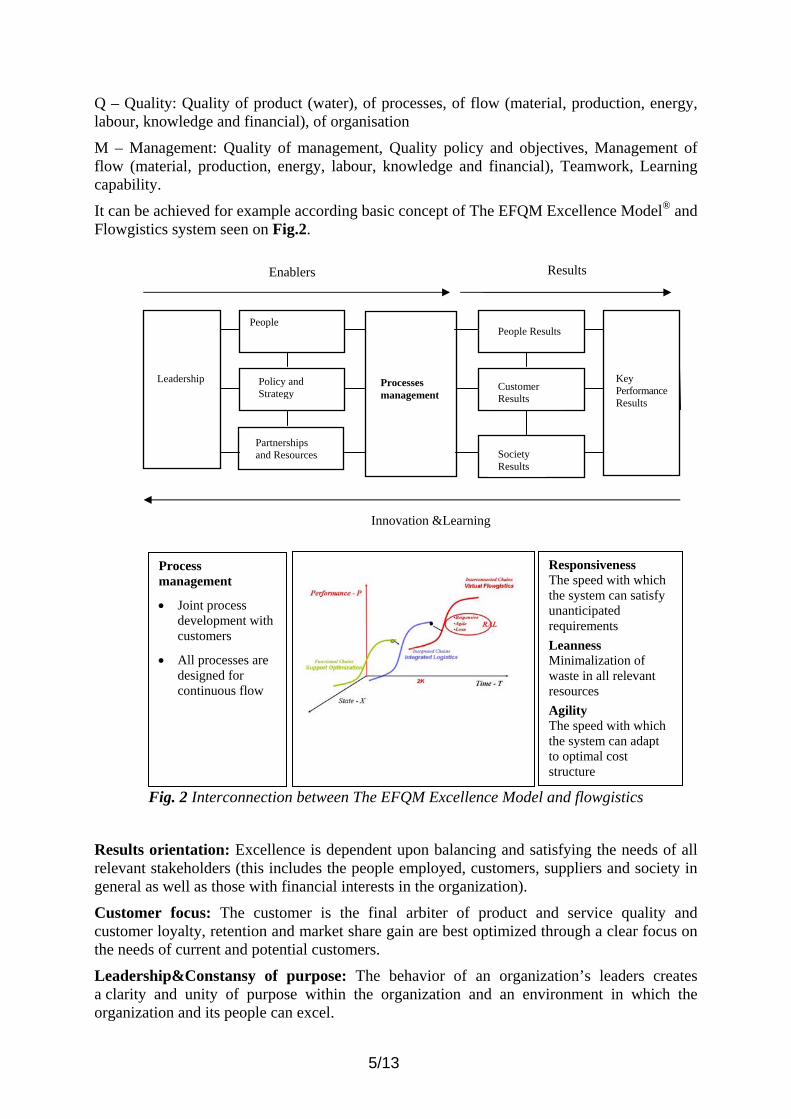
Process management
• Joint process development with customers
• All processes are designed for continuous flow
Responsiveness The speed with which the system can satisfy unanticipated requirements Leanness Minimalization of waste in all relevant resources Agility The speed with which the system can adapt to optimal cost structure
Q – Quality: Quality of product (water), of processes, of flow (material, production, energy, labour, knowledge and financial), of organisation
M – Management: Quality of management, Quality policy and objectives, Management of flow (material, production, energy, labour, knowledge and financial), Teamwork, Learning capability.
It can be achieved for example according basic concept of The EFQM Excellence Model® and Flowgistics system seen on Fig.2.
Fig. 2 Interconnection between The EFQM Excellence Model and flowgistics
Results orientation: Excellence is dependent upon balancing and satisfying the needs of all relevant stakeholders (this includes the people employed, customers, suppliers and society in general as well as those with financial interests in the organization).
Customer focus: The customer is the final arbiter of product and service quality and customer loyalty, retention and market share gain are best optimized through a clear focus on the needs of current and potential customers.
Leadership&Constansy of purpose: The behavior of an organization’s leaders creates a clarity and unity of purpose within the organization and an environment in which the organization and its people can excel.
6/13
Management by processes & facts: Organization perform more effectively when all inter-related activities are understood and systematically managed and decisions concerning current operations and planned improvements are made using reliable information that includes stakeholder perceptions.
People development & involvement: The full potential of an organistraion´s people is best released through shared values and a culture of trust and empowerment, which encourages the improvement of everyone.
Continuous Learning, innovation & Improvement: Organizational performance is maximized when it is based on the management and sharing of knowledge within a culture of continuous learning, innovation and improvement.
Partnership development: An organization works more effectively when it has mutually beneficial relationships, built on trust, sharing of knowledge and integration, with its partners.
Public responsibility: The long-term interest of the organization and its people are best served by adopting an ethical approach and exceeding the expectations and regulations of the community at large.
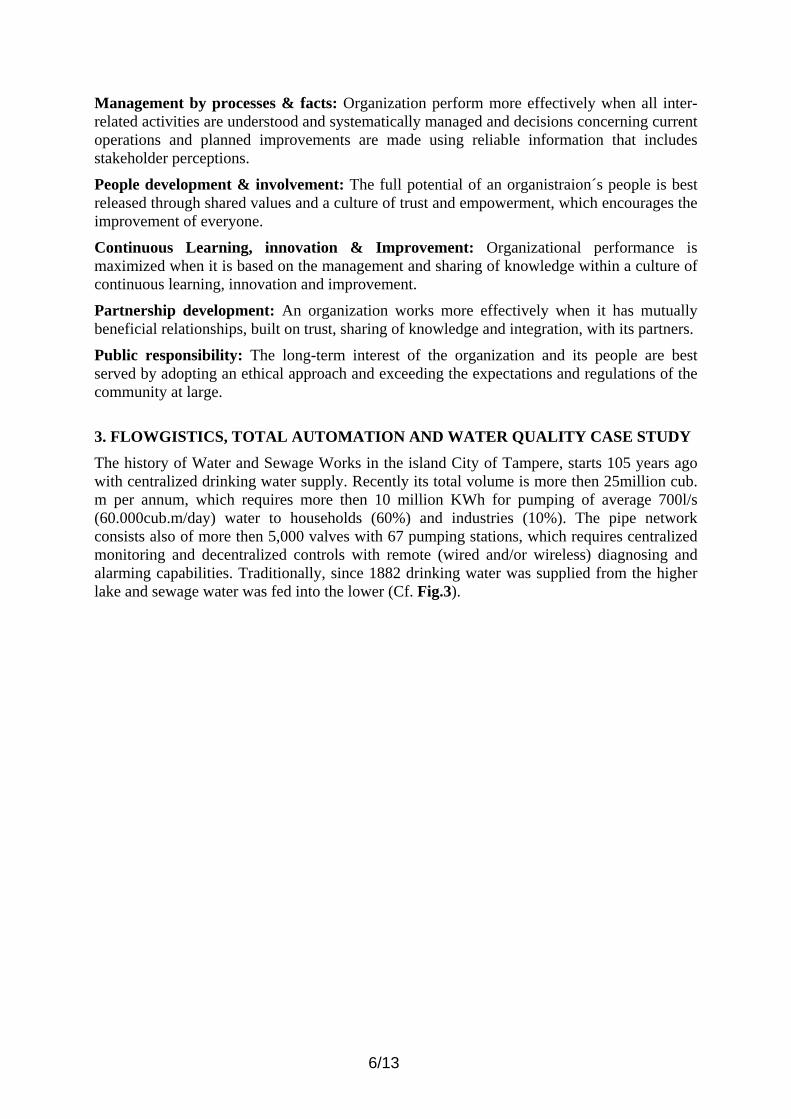
3. FLOWGISTICS, TOTAL AUTOMATION AND WATER QUALITY CASE STUDY The history of Water and Sewage Works in the island City of Tampere, starts 105 years ago with centralized drinking water supply. Recently its total volume is more then 25million cub. m per annum, which requires more then 10 million KWh for pumping of average 700l/s (60.000cub.m/day) water to households (60%) and industries (10%). The pipe network consists also of more then 5,000 valves with 67 pumping stations, which requires centralized monitoring and decentralized controls with remote (wired and/or wireless) diagnosing and alarming capabilities. Traditionally, since 1882 drinking water was supplied from the higher lake and sewage water was fed into the lower (Cf. Fig.3).
7/13
First biological treatment process in Tampere started in 1962 at Rahola Waste Water Treatment Plant, where a sludge aeration digesting was introduced at the beginning of 70s and then modernized in 1982 with anaerobic sludge digesting, known also as two-step aeration process. In 1972 the operation of Viinikanlahti Water Treatment Plant was started with mechanical sedimentation, changed in 1976 to chemical precipitation and using aluminium sulphate as a coagulant. The plant was enlarged at the beginning of 80s with biological treatment stage forming so called bio-chemical precipitation treatment process and thus finalized with two anaerobic sludge digesters.
During last ten years the waste water pipe network increased its total length form 800 to 1,100km requiring presently 1,100KWh for driving 67 pumping station.
Consequently, at the beginning of the 90s the key issue was also centralized monitoring and decentralized controls with remote diagnosing and alarming of water demand, supply and treatment systems as a whole. In addition to electrical energy any biological treatment and especially those situated in Nordic countries require thermal energy for preheating and compensating seasonal variation in water temperatures. Hourly changes in sewers income flows in all suburban areas and across the lakes as well as in the overall influent and biological load requires application of both Quantitative (conventional in terms of numeric and statistical variables) controls as well as Qualitative (linguistic, verbal or fuzzy) control algorithms, that is Q&Q control strategies. The interconnection of Q&Q controls and their EVAluation, RATionalization and OPTimization strategies is given in Fig.4).
The implementation of Q&Q approach in Flowgistics and Total Automation System at Water and Sewage Works at City of Tampere in order to satisfy all Q&Q REQuirements and System SPECifications was the overall objective of investment projects started in the first half of 90’s.
Application of Q&Q approach leads to the fact that retained earnings in 1996 were higher then the value of equipment supplied by the main contractor of overall system – Omron Electronics Oy, Finland. Therefore, Total Automation System, implementation of Systems Engineering Methodology – SEM and financial results achieved are described here in after.
Financial Engineering Methodology – FEM in term of pricing and portfolio sections was used for accounting of different and normally conflicting interests and criteria in process,
Fig.3 1,750 km Pipe Network Flowgistics, 67 Pumping Stations, 5,000 Valves, 97% Waste Reduction, Total Energy Utilization by Means of Qualitative Control
with Investments Pay-Back (Off)Time–PB(O)T < 3 years.

8/13
instrumentation, control and systems engineering organizations from one side and financing, decision making and management authorities from other.
Fig.4 Interconnection of Q&Q controls and their EVAluation, RATionalization and
OPTimization strategies
3.1 Rahola waste water treatment plant The plant is designed in 80’s for total daily flow of 20,000m3/day. The treatment capacity is, however, 1,100m3/h, since the Flow rate – F of hourly influent over 24h can vary ten and even more times. Hence, in 1996 total Quantity of purified water was 5,15 million m3 with specific electrical energy consumption of 0,27MWh/m3. The waste-water is entering the plant from 25 wireless controlled pumping stations, shown in Fig.3, which amount is treated and then discharged via 100m long unloading sewer at a depth of 4m into the lower lake, closed to Nokia (Fig.3).
Measurements, Process Calculations and Optimization All main process variables, their calculations and daily scheduling are realized by means of four spreadsheets in a separate workbook on MS Excel. The first sheet contains on-line measured process data with minimal and maximal admissible values for their signal validation. The validated variables are then updated with results obtained by analysis from city laboratory through Local Area Network - LAN and Wireless Area Network – WAN forming in such a way the second spreadsheet. The third one is containing scheduling formulas and validation calculations for each day of the month, such that all laboratory final results are stored as forth spreadsheet in the management information system MIS of Tampere, presented in Fig.5.

9/13
Pumps, Compressors, Motors, Gas-motor and Total Air-Load Controls All process equipment in the plant, included pumps, motors, gas-motor and air compressors are controlled according to Fig.5 with Omron Programmable Logic Controllers - PLCs. Qualitative or Fuzzy controls are realized by means of additional processing card added especially for Total Air-Load Distribution and Control. Two other PLCs are installed in Chemical Preparation and Rotting Station in City of Tampere.
Qualitative Fuzzy Logic and Total Air-Load Control Finland is producing more then 12 million tons of paper; that is more then 2,000kg per capita, which amount is several times higher then the world’s second producer. Therefore the problem of steam allocation among pulp cocking and paper drying was and is of prime importance for buffering steam demand variations. RATional - RAT and then OPTimal - OPT distribution of total steam load among recovery, oil/gas and bark boilers was traditionally solved by means of quantitatively OPTimizing Linear Programming – LP tools. The RATional solution, however, is based usually on simple and manually realizable set of rules stating that: recovery boiler should be loaded at MAXimum – MAX, oil and gas boilers at NOMinal – NOM that is asymmetrically between MIN and MAX admissible loads and bark boiler should thus buffering all variations in steam DEMand – DEM in pulp and paper Production and Economic System - PES.
Fig.5 Systems Engineering Diagram
PS221PS221 PS221 PROCES STATION 2PROCES STATION 1 150 m n 225 m
SYSMAC LINK VÄYLÄ
MIS OF CITY OFTAMPERE
PC-LINK - FUZZY CONTROL
SYSWAY RS422
Viinikanlahti Waste Water Treatment Plant
Rahola Waste Water Treatment Plant
CONTROL AND SUPERVISIONRAPORT STATION RAHOLA VIINIKANLAHTI PUMPING STATIONS
CV1000 C1000H
ETHERNET TCP/IP
CONTROL AND SUPERVISION RAHOLA RAHOLA PUMP STATIONS
VIINKANLAHTI
PROSES STATION 1 PROSES STATION 2 PROSES STATION 3 PROSES STATION 4
ROUTER MODEM 512 KBS
REPEATER
FIBER
VAX 6000-400 MANSE5
ALPHA 2100 MANSEA
ROUTER
REPEATER
DIGITAL PATHWORKS VER5.1 NETWORK OPERATION SYSTEM
NET PRINTER VAX TERMINALS
TERMINAL SERVER
HUB
MODEM 512 KBS
PROCES STATION 3 CV1000H
HUB
ROUTER
MODEM 512 KBS
NET PRINTER VAX TERMINALS
TERMINAL SERVER
NET PRINTER
VAX TERMINALS
TERMINAL SERVER Laboratory&Water Quality Monitoring

10/13
Air-load allocation problem in the aeration part of water treatment process described here in above is based on the same set of RATional rules, but applied between minimal and maximal speed of bio-gas motor, on-off air compressors and frequency controlled compressor. Therefore it is solved by means of Qualitative (fuzzy) Linear Programming – an LP routine, which is illustrated in Fig.6.
Notice also that oxygen content measurements are highly non-linear with respect to the compressed amount of air and with considerable Time-Delays - TDs.
In additional to conventional PID controls, process non-linearity and considerable Time Constants – TCs require an additional, knowledgeable and manual intervention at different Operating Modes – OMs. This intervention is replaced by process control diagram given in Fig.6. The operation of air Qualitative distribution algorithm is illustrated in the same figure, which proves it EFFiciency in energy saving, by means of Q&Q (difference and interval) calculus on PLCs.
FROM CONTROL ROOM
INPUT SIGNALAVERAGE / MIN
CALCULA TION
SET - POINT 02 CALCULATION
C200H-FZ001
PROCESSING RULES DEFUZZIFICATION
IF dO2 PL AND O2 PM THENMVM NL
max 128 rulesCENTER OFGRAVITY
dO 2 eO 2
CONTROLSPEED
GAS MOTOR
COMPRESSOR
OUTPUTPWC
1000-1500 r/min
BIOGAS FROM STATE OF DECAY
INVERTER
CONTROL OFCONTACTOR
COMPRESSOR
COMPRESSOR
QUANTITAIVECALCULATIONS
PARAMETERS FROM CONTROL ROOM
r/min feedback
FREQUENCY OF INVERTER
AIR
AIR
AIR QUALITATIVE / FUZZY
PROCESS VARIABLE OXYGEN
100
Quantitative and Qualitative (Q&Q) Air-Load Distribution, %
SPO2
Time, 27.08.1997,15:31h
Set-Point O2
FrequencyControlledCompressor
On/OffCompressor
Process Variable -PV-O2
Bio-GasCompressor
MIN
Fig. 6 Qualitative (fuzzy Linear Programming – LP routines)

11/13
3.2 Viinikanlahti waste water treatment plant The designed capacity is 120,000m3/day for pre-clarification and 67,000m3/day for biological treatment with total pumping rate of 3,3m3/s. With this capacity the plant is treating about ¾ of overall waste waters in City of Tampere. They are collected from waste, storm and mixed sewers through wireless controlled pumping stations. The collecting flowgistics has the advantage of very efficient pumping at constant speed over very wide (even 10 times) RANGE of Flow variations per day.
Total Automation of Pumping-Stations The sewers in suburban areas and across the lake together with all 67 stations (each of which with one operating and one reserving pump) are collecting overall waste waters and sewage at City of Tampere. Therefore all pumping stations are remotely monitored, diagnosed, controlled and operated according to centralized REQuirements and by means of wireless and highly decentralized communication and alarming system. With more then hundred wireless and wired modems the monitoring and diagnosis of all pumping station is definitely a considerable labour and fuel saving for patrolling which was typical for 1980s. Therefore, Total Automation System is realized by means of more then hundred PLCs, the configuration of which is available to all readers of this document.
3.3 Implementation of Total Automation System
Main Contractor and Sub-Contractors The project as a whole was based on Flowgistics considerations, summarized as Logistic Ontology of Flows. From Systems Engineering – SE point of view the project was based on non-negative definite structural and parametric causality of fluids (fresh and sewage waters), energy (direct and indirect), cash and information Flows – F in Time – T, covering both Production and Energy as well as Business and Economic Logistics – PEL & BEL.
The sub-project Total Automation System was thus decomposed by main contractor Omron Electronics Oy to several Tampere-based subcontractors.
Time-Scheduling, Flowgistics and Control Engineering Total Automation sub-project described here in above was first implemented at Rahola Waste Water Treatment Plant in 1992-3. In 1994 accumulated experience was successfully extended to Viinikanlahti Waste Water Treatment Plant. Presently as shown in Fig.5 and especially during the nigh shifts all centralized monitoring, diagnosis and reporting functions for both plants and 67 wireless controlled pumping stations are realized from one control room in Viinikalahti.
In this project Flowgistics was based on mathematical methods of Control Engineering, which are traditionally used by System Analysis, but multi-focusing on both: Production and Energy Logistics - PEL as well as Business and Economic Logistics – BEL. In such a way Control Engineering – CE is considered as a field of System Engineering – SE, which is concentrated mainly on analysis and design of controls, stabilizing desired dynamic behavior of physical, chemical, energy, bio- and other processes and thus compensating external influences, disturbing desired dynamic characteristics.

12/13
Systems and Financial Engineering Systems Engineering – SE, as such is dealing with DESigning, RATionalizing and then OPTimizing Systems – S in terms of S EFFiciency - SEFF, starting with S REQuirements - SREQ, through S PERformance – SPER and ending up with complete set of S PECifications – SPECs for all System elements and over the whole Life-Time – LT of the System - S. Foundations of SE are in Systems Theory, inclusive DESigning, RATionalizing and then OPTimizing dynamic process and respective controls.
Financial Engineering – FE is dealing primary with Active (non-passive) Resources – AR, such as Capital Assets – CA, included in present and future Project Portfolio – PP, for which RATional and then OPTimal pricing are searched on Local And Global – LAG markets over given Time Period at Present and in Future - TPP and TPF. Theoretical foundations of FE are in the theory of modern finance, which is usually divided into pricing theory and project portfolio management.
Pricing theory is concerned with determining a realistic market-related LAG PRICE of an AR or an asset that is not yet marketed. Pricing Theory has therefore benefited greatly from Systems Theory. The Systems Engineering also benefits from Pricing Theory in regarding the proper multi-focusing and multi-criteria objective function for dynamic control and management problems, which involve Cash Flow – CF streams with financial REQUirements, SPECified over TPP and TPF.
For instance, only two years after implementation in 1996 the man-power of both plants was 27 employees only and retained earnings accounted were higher then net value of Total Automation equipment supplied by main contractor.
Consequently, application of FE to totally automated Flowgistics proves the applicability of SE Methodology – SEM in analysis and design of controls for non-negative inputs and outputs by means of Systems Engineering Net-metering – SEN. 5. RESULTS ACHIEVED AND CONCLUSION
Waste and Water Quality, Reliability and Availability The Waste and Water Quality were and are extremely stable after implementation and since 1996 their average values including purification power measured as Reduction – R in %, which can be summarized in the following Tab 1. Notice also that during summer period the Nitrification was 98% and 94%, respectively.
Tab. 1 Plant pH
BOD7(ATU),
mg/l
Suspended Solids, mg/l Phosphorus
P, mg/l
Nitrification
NH4-N, mg/l
In Eff In Eff R% In Eff R% In Eff R% In Eff R%
Viinkal 7,4 7,5 200 7,9 96 220 12,5 94 6,2, 0,41 93 27 11,6 58
Rahola 7,4 7,6 270 9,7 96 330 9,8 97 9,5 0,46 95 34 22 35
Compared with the specified REQuirements given in the Tab.1 it can be concluded that such SE measures as RELIAbility and AVAILability of the Total Automation System are extremely high. Moreover, the average values in the Table are based on more then 40 thousand samples analyzed since 1996 in the City laboratory together with results obtained by Difference and Interval Calculus – D&IC and widely reported with MS EXCEL add-ins and then distributed by MIS of City of Tampere on LAN given in Fig.5.

13/13
Energy and Labor Savings Total energy saving can be calculated as a difference between electrical energy input and thermal energy output, forming so called energy netput. The energy netput for both waste water treatment plants considered is 60% of total energy consumption. Average Pay-Back (Off) Time – PB(O)T of all energy saving solutions described above is less than 3 years, taking into account all DISCounting, INFLation and other Financial Engineering – FE parameters. Labor saving after implementation of Total Automation System can be described even by non-filling of free vacancies after retirement, only. This rule of saving human capital practically led to minimal man-power of only 27 employees in both plants, of which 12 shift-operators with two foreman, 7 maintenance and servicing engineers with two electrical and two process operating engineers.
Recycling Flowgistics, Economic and Conclusions At drinking water price of approximately 0,75EUR/m3 with specific consumption per capita of 0.3m3/day, the revenue since 1996 was about 10MEUR/annum. At waste water price of 1EUR/m3 the Returned Earnings from both treatment plants were 350KEUR/year. This is due to recycling economics and successful implementation of Total Automation System in the island City of Tampere. Finally, the net value of equipment supplied by main contractor Omron Electronics was less then retained earnings, reported by both waste-water treatment plants for 1996 accounting period, only.
As a final conclusion it can be claimed that this case-study proves the efficiency of Systems Engineering Management – SEM, since today high-dimensional LAG markets present an important challenge resulting from cooperation between flowgistics, automation, controls, finance and systems fields.
REFERENCES Golemanov, L.A. (2002): Flowgistics, Total Automation and Qualitative Control of Water Resources in Island City of Tampere, Finland, Quality Innovation Prosperity, VI/2/2002, ISSN 1335-1745.
Zgodavová, K.: Total Quality Management, Technical University of Kosice, Slovakia, ISBN 80-7099-831-8
Taguchi, G. (1988): Introduction to Quality Engineering, Designing Quality into Products and Processes, Asian Productivity Organization, UNIPUB/Quality Resources and American Supplier Institute, Inc. USA.
The EFQM Excellence Model: http://www.efqm.org/Downloads/EFQM_Introducing_purple.pdf
Tervola, K. (2003): Alma software presentation, Kokkola, Finland
Authors: Academician L. A. Golemanov, Dr. Sci. (Habil.), Dr.Tech., University of Vaasa, Finland [email protected] Assoc. prof. Kristina Zgodavova, PhD. Technical University of Kosice, Faculty of Economics, Slovakia. [email protected]
Reviewers: The paper has been reviewed by Proceedings of the International Conference on Industrial Logistics 2003, Edited by Lilian Barros, Petri Helo and Tauno Kekäle, University of Vaasa, ISBN952-.476-0101-X.