Flow phenomena leading to surge in a centrifugal compressor
16
Flow phenomena leading to surge in a centrifugal compressor Bernhard Semlitsch * , Mihai Mih aescu Linn e FLOW Centre and Competence Center for Gas Exchange (CCGEx), Department of Mechanics, Royal Institute of Technology (KTH), Osquars Backe 18, Stockholm, 10044, Sweden article info Article history: Received 7 January 2015 Received in revised form 23 February 2016 Accepted 2 March 2016 Keywords: Compressor flows Large eddy simulation Flow decomposition methods Turbocharged engines Turbomachinery abstract Surge is a global flow instability occurring in centrifugal compressors at low mass-flow rate operation. Due to its violent nature, it is the limiting factor for operability. To enhance the operating range, un- derstanding of the flow instability inception when approaching surge is essential. Therefore, the flow evolution along a speed line is analysed by performing unsteady, three-dimensional flow simulations using a centrifugal compressor geometry with ported shroud. A stable operating condition, at high mass- flow rates, is compared to lower mass-flow rate operating conditions close to and at surge. The partic- ularities of the flow-fields are analysed and described. A smooth flow-field is observed for the stable operating condition, whereas flow reversal manifesting as tip leakage at the outer periphery of the impeller occurs for all off-design operating conditions. The reversed flow exhibits swirling motion in the impeller rotation direction. This induces a globally swirling flow upstream of the impeller, which in- fluences the flow incidence angles at the blades and hence, their efficiency. Proper orthogonal decom- position and dynamic mode decomposition have been performed to analyse the flow structures appearing with surge more thoroughly. For the lowest mass-flow rate operating condition, low frequency modes describing the filling and emptying processes during surge have been found. © 2016 Elsevier Ltd. All rights reserved. 1. Introduction Engine downsizing has become a common practice to increase the specific efficiency and specific power of automotive internal combustion engines. In order to maintain the power output by recovering energy from the hot exhaust gases while reducing the displacement of the engine, turbocharging has become a widely applied technique. The reduction of the engine size leads to diminished thermal and frictional losses when compared to natu- rally aspirated internal combustion engines. Additionally the reduction of fuel required to achieve the same work results in less pollution production, which facilitates to comply with legislation emission restrictions. However, the recovered energy from the exhaust gases needs to blown off beyond the operational limits of the turbocharger and the engine efficiency is reduced. Wang et al. [1] analysed the impact of high altitude operation of a turbocharged engine and show that the lowered ambient pressure reduces the effectiveness of the turbocharger due to a narrowing of the operation range. Hence, a wide turbocharger operating range is desired to boost the engine at all operating conditions. The operating range and performance parameters governing the compressor characteristics, i.e. pressure ratio, mass-flow rate, and efficiency, are commonly described in a compressor specific oper- ation map. The obtainable boost pressure is given as ratio of the total pressure p 0;2 at the compressor outlet to the total pressure p 0;1 at the compressor inlet and illustrated as function of mass-flow rate _ m and rotational speed n. Commonly, the adiabatic efficiency h is utilised to quantify the compressor performance as a ratio of the ideally obtained work W is to the actually supplied work W act . The actually performed work is given by the rotational velocity u and the torque t. The ideally obtained work is proportional to the temperature increase from the suction inlet to the compressor outlet, which leads to the expression [2]; h ¼ W is W act ¼ _ mc p T is 0;2 T 0;1 t u ; (1) where c p is the heat capacity at constant pressure, T 0 is the total temperature, and the indexes 1 and 2 are referencing the quantities to the inlet and outlet, respectively. The superscript is denotes that the quantity is estimated via isentropic relations. Since the * Corresponding author. Tel.: þ46 70 4742657. E-mail address: [email protected] (B. Semlitsch). Contents lists available at ScienceDirect Energy journal homepage: www.elsevier.com/locate/energy http://dx.doi.org/10.1016/j.energy.2016.03.032 0360-5442/© 2016 Elsevier Ltd. All rights reserved. Energy 103 (2016) 572e587
Transcript of Flow phenomena leading to surge in a centrifugal compressor
Flow phenomena leading to surge in a centrifugal compressor
Bernhard Semlitsch*, Mihai Mih!aescuLinn"e FLOW Centre and Competence Center for Gas Exchange (CCGEx), Department of Mechanics, Royal Institute of Technology (KTH), Osquars Backe 18,Stockholm, 10044, Sweden
a r t i c l e i n f o
Article history:Received 7 January 2015Received in revised form23 February 2016Accepted 2 March 2016
Keywords:Compressor flowsLarge eddy simulationFlow decomposition methodsTurbocharged enginesTurbomachinery
a b s t r a c t
Surge is a global flow instability occurring in centrifugal compressors at low mass-flow rate operation.Due to its violent nature, it is the limiting factor for operability. To enhance the operating range, un-derstanding of the flow instability inception when approaching surge is essential. Therefore, the flowevolution along a speed line is analysed by performing unsteady, three-dimensional flow simulationsusing a centrifugal compressor geometry with ported shroud. A stable operating condition, at high mass-flow rates, is compared to lower mass-flow rate operating conditions close to and at surge. The partic-ularities of the flow-fields are analysed and described. A smooth flow-field is observed for the stableoperating condition, whereas flow reversal manifesting as tip leakage at the outer periphery of theimpeller occurs for all off-design operating conditions. The reversed flow exhibits swirling motion in theimpeller rotation direction. This induces a globally swirling flow upstream of the impeller, which in-fluences the flow incidence angles at the blades and hence, their efficiency. Proper orthogonal decom-position and dynamic mode decomposition have been performed to analyse the flow structuresappearing with surge more thoroughly. For the lowest mass-flow rate operating condition, low frequencymodes describing the filling and emptying processes during surge have been found.
© 2016 Elsevier Ltd. All rights reserved.
1. Introduction
Engine downsizing has become a common practice to increasethe specific efficiency and specific power of automotive internalcombustion engines. In order to maintain the power output byrecovering energy from the hot exhaust gases while reducing thedisplacement of the engine, turbocharging has become a widelyapplied technique. The reduction of the engine size leads todiminished thermal and frictional losses when compared to natu-rally aspirated internal combustion engines. Additionally thereduction of fuel required to achieve the same work results in lesspollution production, which facilitates to comply with legislationemission restrictions. However, the recovered energy from theexhaust gases needs to blown off beyond the operational limits ofthe turbocharger and the engine efficiency is reduced. Wang et al.[1] analysed the impact of high altitude operation of a turbochargedengine and show that the lowered ambient pressure reduces theeffectiveness of the turbocharger due to a narrowing of the
operation range. Hence, a wide turbocharger operating range isdesired to boost the engine at all operating conditions.
The operating range and performance parameters governing thecompressor characteristics, i.e. pressure ratio, mass-flow rate, andefficiency, are commonly described in a compressor specific oper-ation map. The obtainable boost pressure is given as ratio of thetotal pressure p0;2 at the compressor outlet to the total pressure p0;1at the compressor inlet and illustrated as function of mass-flow rate_m and rotational speed n. Commonly, the adiabatic efficiency h isutilised to quantify the compressor performance as a ratio of theideally obtained work Wis to the actually supplied work Wact . Theactually performed work is given by the rotational velocity u andthe torque t. The ideally obtained work is proportional to thetemperature increase from the suction inlet to the compressoroutlet, which leads to the expression [2];
h ¼ Wis
Wact ¼_m cp
!Tis0;2 " T0;1
"
t u; (1)
where cp is the heat capacity at constant pressure, T0 is the totaltemperature, and the indexes 1 and 2 are referencing the quantitiesto the inlet and outlet, respectively. The superscript is denotes thatthe quantity is estimated via isentropic relations. Since the
* Corresponding author. Tel.: þ46 70 4742657.E-mail address: [email protected] (B. Semlitsch).
Contents lists available at ScienceDirect
Energy
journal homepage: www.elsevier .com/locate/energy
http://dx.doi.org/10.1016/j.energy.2016.03.0320360-5442/© 2016 Elsevier Ltd. All rights reserved.
Energy 103 (2016) 572e587
compressor wheel is usually driven by a turbine extracting energyfrom hot exhaust gases and transonic flow conditions are reachedin parts of the compressor map, it is more convenient and realisticto assess the actual temperatures instead of rotational velocity andtorque. Therefore, the relation
h ¼_m cp
!Tis0;2 " T0;1
"
t u¼
_m cp!Tis0;2 " T0;1
"
_m cp#T0;2 " T0;1
$ (2)
is used in compressor operating maps. The ideal temperature riseresults due to gas compression from the inlet total pressure p0;1 tothe outlet total pressure p0;2, which can be estimated via isentropicrelations,
h ¼_m cp
!Tis0;2 " T0;1
"
_m cp#T0;2 " T0;1
$ ¼T0;1
Tis0;2
T0;1 " 1
!
#T0;2 " T0;1
$ ¼T0;1
%p0;2p0;1
g"1g " 1
&
#T0;2 " T0;1
$
¼p0;2p0;1
g"1g " 1
T0;2T0;1 " 1
; (3)
where g is the averaged ratio of specific heats between inlet andoutlet. The required quantities (i.e. total temperature ratio and totalpressure ratio) to estimate the compressor efficiency are obtainedby measurements or simulations.
The operating range, outlined on the compressor map, isrestricted by two limits called surge (at low mass-flow rates) andchoke (at highmass-flow rates). At these limits, the efficiency of thecompressor is lower than at design operating conditions. The surgephenomenon is a global flow instability affecting the entirecompressor, which can cause large vibratory stresses in the bladesand lead to breakdown of operability. The large vibrations induce aloud characteristic noise, which can become dominant. Hence,operating the compressor into surge is not desired, since this couldlead to fatigue. Therefore, the compressor is usually bypassed inoperation conditions close to surge at the so-called surge line toprevent damage. The surge line criterion indicating the onset ofsurge is chosen by the manufacturer and provided to the costumer.Andersen et al. [3] discuss different definitions of this criterionutilised by individual fabricators. Due to the implied uncertaintywith different surge margin definitions, internal combustion en-gine producer apply safety margins to the compressor operationmap. Better understanding of the surge phenomenon and its causewould allow expanding the potential of the turbocharger in awiderrange.
Surge occurs at low engine speeds combined with high loads,e.g. during rapid accelerations, high altitude operation, or gear-shifts, and is basically a phenomenon of air stalling with partialflow reversal in the compressor. Globally induced mass-flow rateand pressure ratio oscillations characterise surge. Fink et al. [4]described these oscillations as emptying and refilling process ofthe piping tract volume downstream of the compressor, whichgoverns frequency and amplitude of these oscillations. Galindoet al. [5] showed with experiments and numerical modelling that alarger volume downstream of the compressor can lead to deepdestructive surge with low frequency, whereas a smaller volumecan result in a gentle high frequent surge. At off-design conditionsprior to surge, stall or rotating stall may occur. However, thesephenomena restrict the compressor efficiency, but are not as savageas surge.
Many active and passive flow control strategies have beendeveloped in order to increase the operation width of centrifugalcompressors. The ported shroud is a simple and reliable passive
flow control technique used to increase the surge margins byallowing some flow to recirculate from the blade passage back intothe compressor inlet. Yang et al. [6] showed that flow unsteadinessis drained out of the blade passage at the blade tips and the flowstreaming through the blade passages is stabilised. Due to thesimplicity and reliability of this passive flow control device, theported shroud is widely used in automotive turbocharger com-pressors. It is worthwhile to mention that induced swirling motiongenerated upstream of the compressor inlet against the wheelrotationwas used by Galindo et al. [7] and Figurella et al. [8] to shiftthe surge limits by stabilising the flow at off-design operationconditions.
Analysis of the flow at surge operating conditions is necessary tounderstand the phenomenon. However, the experimental assess-ment of the flow-field in confined compressor geometries is chal-lenging. Typically, pressure, mass-flow, and temperature pointmeasurements are performed. At higher effort, LDV (Laser DopplerVelocimetry) and PIV (Particle Image Velocimetry) flow measure-ments have been used to investigate the flow in a partial domain.With computational simulations, the entire flow-field in thecompressor is available, but the numerical challenges are multi-faceted. The flow velocities are typically high in automotiveturbocharger compressors, close to transonic speeds. Compress-ibility effects might occur and the problem specific Reynoldsnumber is relatively high. Further, the geometry of a turbochargercompressor is complex and thewheel is rotating with respect to thestatic housing. Therefore, the demand on the selected computa-tional approach is high, which has to handle the two main issues,i.e. compressible turbulence modelling and treatment of the wheelrotation. Common approaches used for most accurate simulation ofcentrifugal compressors are either computationally resourcedemanding or involve advanced numerical modelling of theoccurring phenomena. Sundstr€om et al. [9] showed by comparingnumerical predictions with experiments that steady-state RANS(Reynolds Averaged NaviereStokes) simulations can be utilised tocharacterise the performance of the compressor at stable operatingconditions. The rotation of the wheel with these kinds of compu-tations is commonly handled by the steady-state frozen rotorapproach. Thereby, the rotation of the wheel is modelled by using arotating reference frame. At the interface between rotor and stator,the forces are converted to the other coordinate system. However,this method gives only the solution for one fixed reference positionof the frozen rotor. The mixing plane approach models thecontinuous rotation of the wheel using circumferential averaging.Several improved methods, such as the APES (Average-PassageEquation System) method or the NLH (Non-Linear Harmonic)method, have been developed to improve the predictability whenrotor stator interactions become important. However, towardssurge the flow-field begins to oscillate globally and steady-stateapproaches cannot capture the physics of pulsating flow dy-namics accurately. Hence, unsteady simulation approaches arerequired.
Unsteady RANS formulations [10], DES (Detached Eddy Simu-lation) [11] and the LES (Large Eddy Simulation) approach [12] havebeen used to describe the unsteady flow-field at off-design oper-ating conditions. Unsteady RANS resolves the integral scales in aturbulent flow-field while all smaller flow scales are modelled.Bourgeois et al. [11] compared numerical simulation approachesshowing that a blind choice of turbulence closures can lead toerroneous simulation results. The reliability and accuracy of theseapproaches are highly sensitive to the turbulence model employedand the selection of wall treatment.
Unlike RANS based formulations, LES solves the most energeticstructures in the flow-field down to the inertial subrange whilemodelling only the unresolved dissipative scales. Therefore, the LES
B. Semlitsch, M. Mih!aescu / Energy 103 (2016) 572e587 573
approach requires a finer mesh, which represents a highercomputational effort. Especially, accurate prediction of boundarylayer effects is numerically expensive, since fine clustering of cellsat the walls is required to resolve near wall effects. However, manyphenomena in the centrifugal compressor, including surge, aregoverned by large-scale flow structures rather than small struc-tures generated nearby the walls. Hence, when large-scale phe-nomena are investigated, under-resolved wall resolutions incombination with modelling are commonly utilised for computa-tional efficiency reasons, whereas the large flow structures areresolved as accurate as possible. Therefore, the zonal method DES,applying the RANS approach in the under-resolved domain and LESin the resolved domain region [11], or LES with wall functions [13]are preferably used. The effect of wall functions and detailed wallmodelling has been investigated by Mendonca et al. [14] showingthat the large-scale flow structures are not affected by carefullyemployed wall treatment. Gourdain et al. [15] underline in a reviewof numerical methods for compressor flows the relevance of wallfunctions with expensive computations. Within the framework ofunsteady flow simulations, several numerical techniques areavailable to handle the rotation of the wheel. The frozen rotorapproach, previously mentioned, has also been used for unsteadysimulations. However, a more accurate technique for this purpose isthe sliding mesh approach. Two mesh grids, reassembling thestationary compressor components and the rotating impellerrespectively, are used. During the rotation of the mesh, the nu-merical cell connectivity changes on either side of the commoninterface at each time step. The cell values are interpolated over theinterface to the nearest joint cell. Therefore, the sliding meshapproach is numerically very expensive. Since the flow-field has tobe interpolated from one interface side to the other, the numericalaccuracy is slightly decreased and coherent flow structures may bealtered with this process. However, this procedure with accurateinterpolation provides the most accurate handling of the flow overthe interface.
The unsteady flow motion is often assessed by statistical ex-amination of quantities, e.g. in terms of mean and variance ofgathered flow variables. However, these distributions do not suf-ficiently identify the spatial characteristics or the degree of tem-poral variation of flow instabilities. Therefore, flow decompositionmethods have been commonly used to extract the coherent flowstructure characteristics. The POD (Proper Orthogonal Decompo-sition) method has been successfully used in a wide range of ap-plications to visualise energetic large-scale structures of the flow.Hence, unsteady flow motion can be investigated at a higher leveland large coherent structures can be identified accordingly to theircorrelation. However, POD modes are not necessarily associatedwith one single frequency and therefore, this method is not idealfor spectral identification of flow features. The DMD (DynamicMode Decomposition) method provides unique modes corre-sponding to one frequency. Thus, this flow decomposition methodis perfectly suited to investigate dynamic key features in flowsassociated with tonal characteristics, such as surge. Further, modalflow analysis exhibit the potential to describe more accurately thecomplex flow phenomena by ordinary differential equations, whichcan be included in one-dimensional engine simulation codes.Nakonieczny [16] developed such a one-dimensional flow modelfor predicting entropy production in a turbocharged diesel engineand achieved a reasonable comparison with experiments. Thismodel allows finding ideal combinations of engine setting, as e.g.valve lift curves. The validity of such codes can be extended towardsoff-design operating conditions by representing the complex flowphenomena in low-order simulations.
Steady-state RANS and one-dimensional simulations allowoptimising the geometry in a wide operating range with numerous
simulations at reasonable numerical effort and represent thereforethe state of the art for geometry design of turbocharger compres-sors. Unsteady simulations are too expensive to calculate the per-formance at many operating points and are therefore onlyperformed for research purposes at selected conditions. However,unsteady simulation approaches are required for the investigationof flow structures. Especially, for global flow instabilities affectingthe entire compressor, accurate simulations capturing the flowfeatures of the entire 360$ geometry are essential employing thesliding mesh technique. Such computationally expensive calcula-tions with accurate turbulence treatment, as presented in thepresent work, are only performed by a few research groups atpresent time. We analyse in detail the flow-field evolution occur-ring in a centrifugal ported shroud compressor of an automotiveturbocharger while decreasing progressively the mass-flow ratealong a constant speed line, from a stable operating point towardsan unstable lower mass-flow rate operating points. Although, manyresearchers have reported global characteristics of surge, the large-scale flow structures occurring in the compressor have not beenassessed. Understanding the large-scale flow structures betterwould allow to invent improved techniques for delaying surge.Therefore, we employ modal decomposition methods to charac-terise these flow structures leading to surge. Thereby, this studyrepresents, the first modal flow decomposition analysis of thethree-dimensional flow in a centrifugal compressor.
2. Case setup
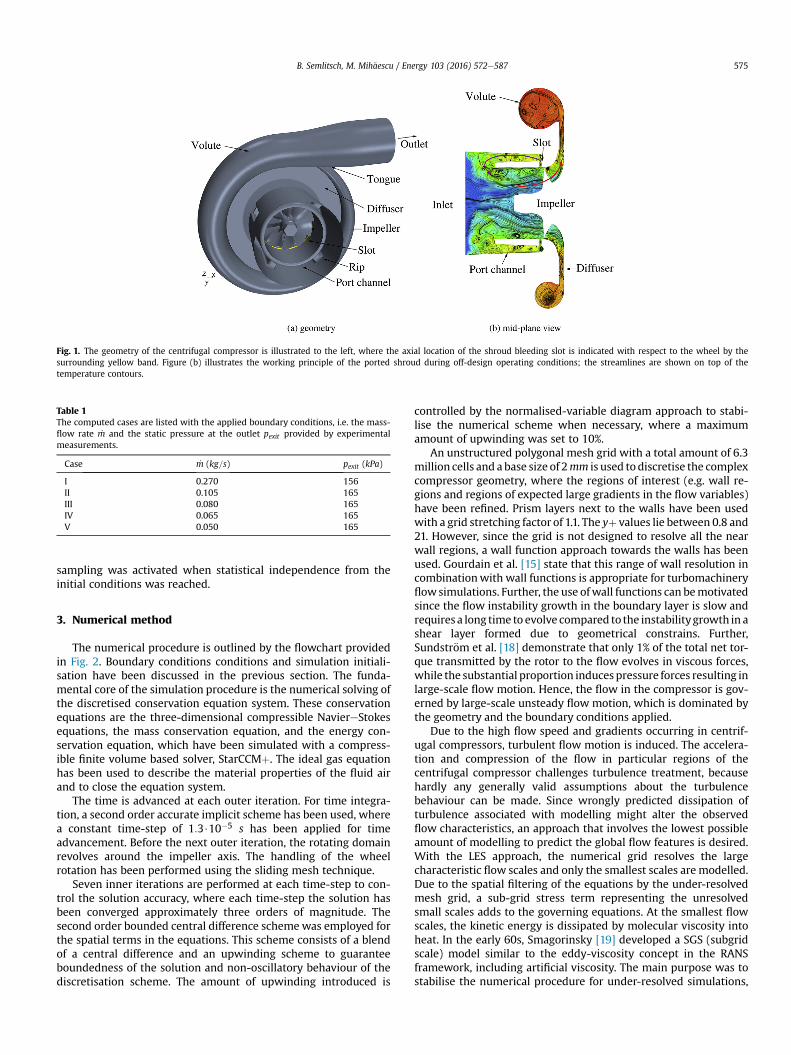
The investigated ported shroud compressor geometry of anautomotive turbocharger, the Honeywell GT40, is shown in Fig. 1(a). The centrifugal compressor is designed for heavy-duty truckengines in a power range of 400e850 kW . The wheel has 10 fullblades with a back sweep angle of 25$ at the discharge. Theimpeller is designed with an exducer diameter of 88mm and a trimratio of 56. The compressor diffuser is vaneless with an exit radiusof 152 mm and the diffuser area ratio is 0.57. In order to extend theoperating range, the compressor is equipped with a ported shroud,which allows a part of the possible back-flow occurring underunstable operating conditions to recirculate from the blade passagethrough the shroud cavities back into the main flow upstream ofthe impeller inlet. Fig. 1 (b) illustrates the operating principle of theported shroud at off-design operation conditions, where the tem-perature contours indicate recirculating fluid. The red arrow in-dicates the flow path for normal operation and the purple arrowsketches the recirculating flow path. The shroud is supported byfour ribs, which are arranged in asymmetric manner to preventamplification of harmonic oscillations causing vibrations and highcycle fatigue.
The evolution of the flow-field in the centrifugal compressorfrom stable operating conditions towards the surge phenomenon isinvestigated by analysing data considering five cases on a constantspeed line of 64 krpm. The operating conditions for each of theseare listed in Table 1, where the employed boundary conditionvalues have been obtained by Gancedo et al. [17] in an experimentalinvestigation of the same compressor geometry. For all cases, themass-flow rate and total temperature have been specified at thecompressor inlet, where the total temperature was set to 296 K. Atthe compressor exit, an outlet pipe has been attached to extend thenumerical domain. At the outlet boundary, a constant static pres-sure has been imposed, which is specified in Table 1. No-slip,adiabatic boundary conditions have been applied at the walls.
The simulations I and II were initialised with flow solutions ofsteady-state RANS calculations. The solutions towards surge wereobtained by progressively reducing the mass-flow rate at thecompressor inlet within the transient simulations. The data
B. Semlitsch, M. Mih!aescu / Energy 103 (2016) 572e587574
sampling was activated when statistical independence from theinitial conditions was reached.
3. Numerical method
The numerical procedure is outlined by the flowchart providedin Fig. 2. Boundary conditions conditions and simulation initiali-sation have been discussed in the previous section. The funda-mental core of the simulation procedure is the numerical solving ofthe discretised conservation equation system. These conservationequations are the three-dimensional compressible NaviereStokesequations, the mass conservation equation, and the energy con-servation equation, which have been simulated with a compress-ible finite volume based solver, StarCCMþ. The ideal gas equationhas been used to describe the material properties of the fluid airand to close the equation system.
The time is advanced at each outer iteration. For time integra-tion, a second order accurate implicit scheme has been used, wherea constant time-step of 1:3$10"5 s has been applied for timeadvancement. Before the next outer iteration, the rotating domainrevolves around the impeller axis. The handling of the wheelrotation has been performed using the sliding mesh technique.
Seven inner iterations are performed at each time-step to con-trol the solution accuracy, where each time-step the solution hasbeen converged approximately three orders of magnitude. Thesecond order bounded central difference scheme was employed forthe spatial terms in the equations. This scheme consists of a blendof a central difference and an upwinding scheme to guaranteeboundedness of the solution and non-oscillatory behaviour of thediscretisation scheme. The amount of upwinding introduced is
controlled by the normalised-variable diagram approach to stabi-lise the numerical scheme when necessary, where a maximumamount of upwinding was set to 10%.
An unstructured polygonal mesh grid with a total amount of 6.3million cells and a base size of 2mm is used todiscretise the complexcompressor geometry, where the regions of interest (e.g. wall re-gions and regions of expected large gradients in the flow variables)have been refined. Prism layers next to the walls have been usedwith a grid stretching factor of 1.1. The yþ values lie between 0.8 and21. However, since the grid is not designed to resolve all the nearwall regions, a wall function approach towards the walls has beenused. Gourdain et al. [15] state that this range of wall resolution incombinationwith wall functions is appropriate for turbomachineryflowsimulations. Further, the use ofwall functions can bemotivatedsince the flow instability growth in the boundary layer is slow andrequires a long time to evolve compared to the instabilitygrowth in ashear layer formed due to geometrical constrains. Further,Sundstr€om et al. [18] demonstrate that only 1% of the total net tor-que transmitted by the rotor to the flow evolves in viscous forces,while the substantial proportion inducespressure forces resulting inlarge-scale flow motion. Hence, the flow in the compressor is gov-erned by large-scale unsteady flow motion, which is dominated bythe geometry and the boundary conditions applied.
Due to the high flow speed and gradients occurring in centrif-ugal compressors, turbulent flow motion is induced. The accelera-tion and compression of the flow in particular regions of thecentrifugal compressor challenges turbulence treatment, becausehardly any generally valid assumptions about the turbulencebehaviour can be made. Since wrongly predicted dissipation ofturbulence associated with modelling might alter the observedflow characteristics, an approach that involves the lowest possibleamount of modelling to predict the global flow features is desired.With the LES approach, the numerical grid resolves the largecharacteristic flow scales and only the smallest scales are modelled.Due to the spatial filtering of the equations by the under-resolvedmesh grid, a sub-grid stress term representing the unresolvedsmall scales adds to the governing equations. At the smallest flowscales, the kinetic energy is dissipated by molecular viscosity intoheat. In the early 60s, Smagorinsky [19] developed a SGS (subgridscale) model similar to the eddy-viscosity concept in the RANSframework, including artificial viscosity. The main purpose was tostabilise the numerical procedure for under-resolved simulations,
Fig. 1. The geometry of the centrifugal compressor is illustrated to the left, where the axial location of the shroud bleeding slot is indicated with respect to the wheel by thesurrounding yellow band. Figure (b) illustrates the working principle of the ported shroud during off-design operating conditions; the streamlines are shown on top of thetemperature contours.
Table 1The computed cases are listed with the applied boundary conditions, i.e. the mass-flow rate _m and the static pressure at the outlet pexit provided by experimentalmeasurements.
Case _m (kg=s) pexit (kPa)
I 0.270 156II 0.105 165III 0.080 165IV 0.065 165V 0.050 165
B. Semlitsch, M. Mih!aescu / Energy 103 (2016) 572e587 575
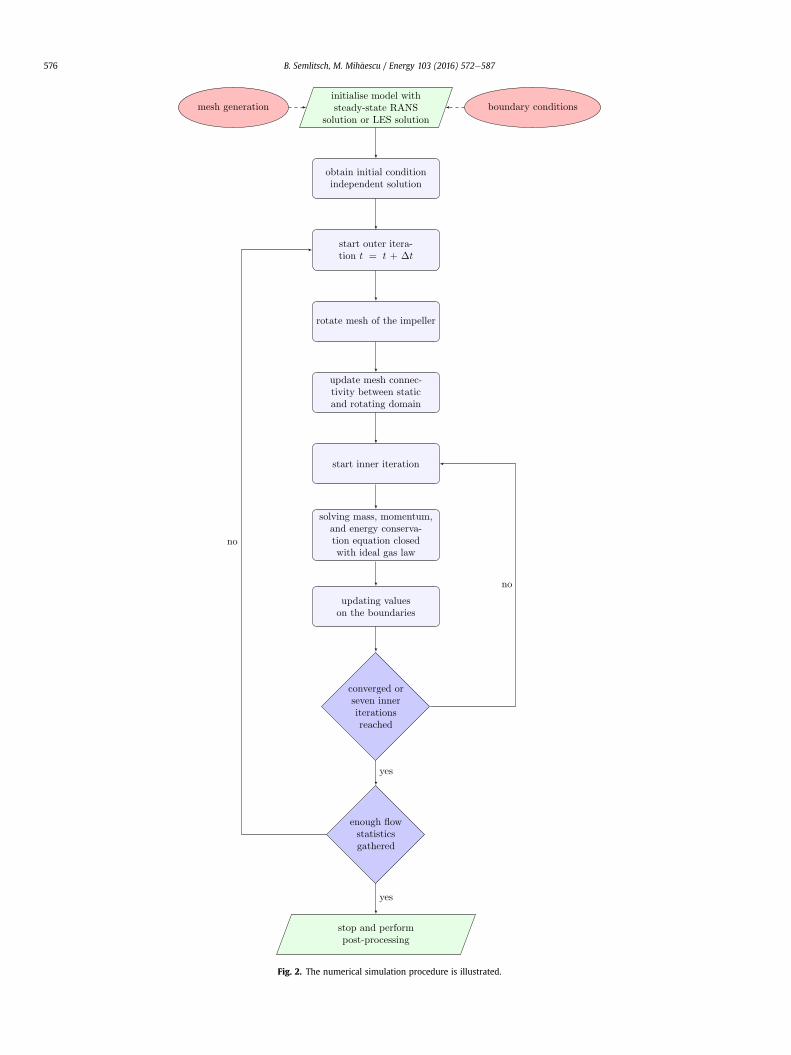
Fig. 2. The numerical simulation procedure is illustrated.
B. Semlitsch, M. Mih!aescu / Energy 103 (2016) 572e587576
since themissing dissipation at the level of the smallest, unresolvedscales lead to unphysical oscillations of the flow solution. Since thisSGS model was initially developed to prevent from numerical sta-bility issues, the model lacks of physical reliability. Moreover, it isreliant on empirical calibration constants. However, it is today oneof the most popular SGS models applied for problems involvingturbulence in compressible flows.
The amount of kinetic energy, dissipated by the smallest flowscales, depends on the amount transferred from the large-scales tothe small-scales through the energy cascade. Hence, an appropriatenumerical discretisation scheme with low dissipative error, e.g. thecentral difference scheme, is desired for the convective terms tocapture accurately the turbulence energy cascade. At a distancefrom boundaries, the small turbulent flow structures exhibit astatistically universal character. Hence, these scales can bemodelled based on this assumption, e.g. by SGS models. However,the contribution of the subgrid scale models is commonly of theorder of the truncation error of the numerical scheme [20], whichrequires explicit filtering of the governing equations to provideaccuracy [21]. Thus, one can use the numerical truncation error tomimic the effect of the smallest turbulent scales. This approach iscommonly known as monotone integrated LES or implicit LES andthe mathematical foundation for this approach is described byMargolin and Rider [22]. Margolin et al. [23] demonstrate viamathematical derivations that the numerical truncation errorterms can be interpreted as a Clark subgrid scale model for themomentum conservation equation and as a Smagorinsky-typesubgrid scale model for the energy conservation equation, whena non-oscillatory finite volume discretisation of at least secondorder accuracy is used. Further, it is shown that the kinetic energy isabsolutely decreasing. Fureby and Grinstein [24] demonstrate thata normalised-variable diagram discretisation scheme, as thecurrently used, is applicable for implicit LES. The remarkableproperties of this approach lead to a subgrid scale model withoutcalibration constants and without explicit filter. Due to thecomputational efficiency of implicit LES, this approach is used inthe present investigation.
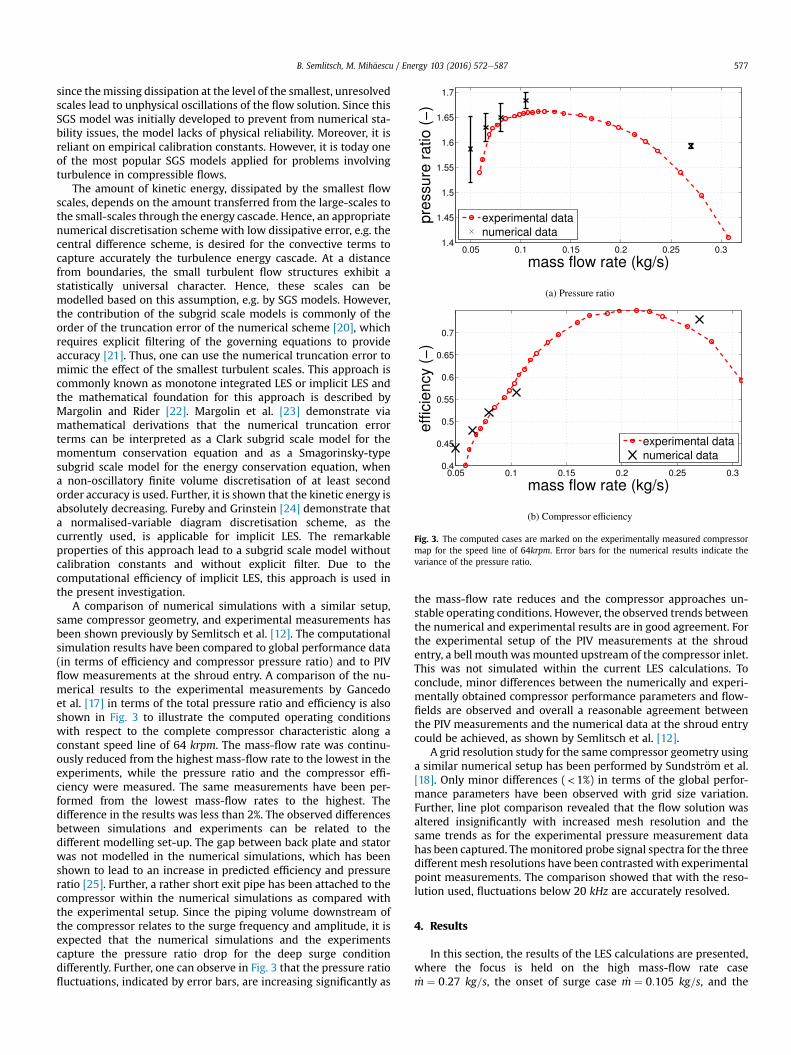
A comparison of numerical simulations with a similar setup,same compressor geometry, and experimental measurements hasbeen shown previously by Semlitsch et al. [12]. The computationalsimulation results have been compared to global performance data(in terms of efficiency and compressor pressure ratio) and to PIVflow measurements at the shroud entry. A comparison of the nu-merical results to the experimental measurements by Gancedoet al. [17] in terms of the total pressure ratio and efficiency is alsoshown in Fig. 3 to illustrate the computed operating conditionswith respect to the complete compressor characteristic along aconstant speed line of 64 krpm. The mass-flow rate was continu-ously reduced from the highest mass-flow rate to the lowest in theexperiments, while the pressure ratio and the compressor effi-ciency were measured. The same measurements have been per-formed from the lowest mass-flow rates to the highest. Thedifference in the results was less than 2%. The observed differencesbetween simulations and experiments can be related to thedifferent modelling set-up. The gap between back plate and statorwas not modelled in the numerical simulations, which has beenshown to lead to an increase in predicted efficiency and pressureratio [25]. Further, a rather short exit pipe has been attached to thecompressor within the numerical simulations as compared withthe experimental setup. Since the piping volume downstream ofthe compressor relates to the surge frequency and amplitude, it isexpected that the numerical simulations and the experimentscapture the pressure ratio drop for the deep surge conditiondifferently. Further, one can observe in Fig. 3 that the pressure ratiofluctuations, indicated by error bars, are increasing significantly as
the mass-flow rate reduces and the compressor approaches un-stable operating conditions. However, the observed trends betweenthe numerical and experimental results are in good agreement. Forthe experimental setup of the PIV measurements at the shroudentry, a bell mouth was mounted upstream of the compressor inlet.This was not simulated within the current LES calculations. Toconclude, minor differences between the numerically and experi-mentally obtained compressor performance parameters and flow-fields are observed and overall a reasonable agreement betweenthe PIV measurements and the numerical data at the shroud entrycould be achieved, as shown by Semlitsch et al. [12].
A grid resolution study for the same compressor geometry usinga similar numerical setup has been performed by Sundstr€om et al.[18]. Only minor differences (<1%) in terms of the global perfor-mance parameters have been observed with grid size variation.Further, line plot comparison revealed that the flow solution wasaltered insignificantly with increased mesh resolution and thesame trends as for the experimental pressure measurement datahas been captured. Themonitored probe signal spectra for the threedifferent mesh resolutions have been contrastedwith experimentalpoint measurements. The comparison showed that with the reso-lution used, fluctuations below 20 kHz are accurately resolved.
4. Results
In this section, the results of the LES calculations are presented,where the focus is held on the high mass-flow rate case_m ¼ 0:27 kg=s, the onset of surge case _m ¼ 0:105 kg=s, and the
Fig. 3. The computed cases are marked on the experimentally measured compressormap for the speed line of 64krpm. Error bars for the numerical results indicate thevariance of the pressure ratio.
B. Semlitsch, M. Mih!aescu / Energy 103 (2016) 572e587 577
lowest mass-flow rate case studied _m ¼ 0:05 kg=s. The flow-fieldspredicted for operating conditions in between the near surge case( _m ¼ 0:105 kg=s) and the lowest mass-flow rate case( _m ¼ 0:05 kg=s) do not exhibit large changes in the flow-field andfollow the general trends. The high mass-flow rate case_m ¼ 0:27 kg=s has been simulated over 720 revolutions, the nearsurge case _m ¼ 0:105 kg=s has been computed over approximately375 revolutions, and the simulation of the lowest mass-flow ratecase _m ¼ 0:05 kg=s was run over 600 revolutions.
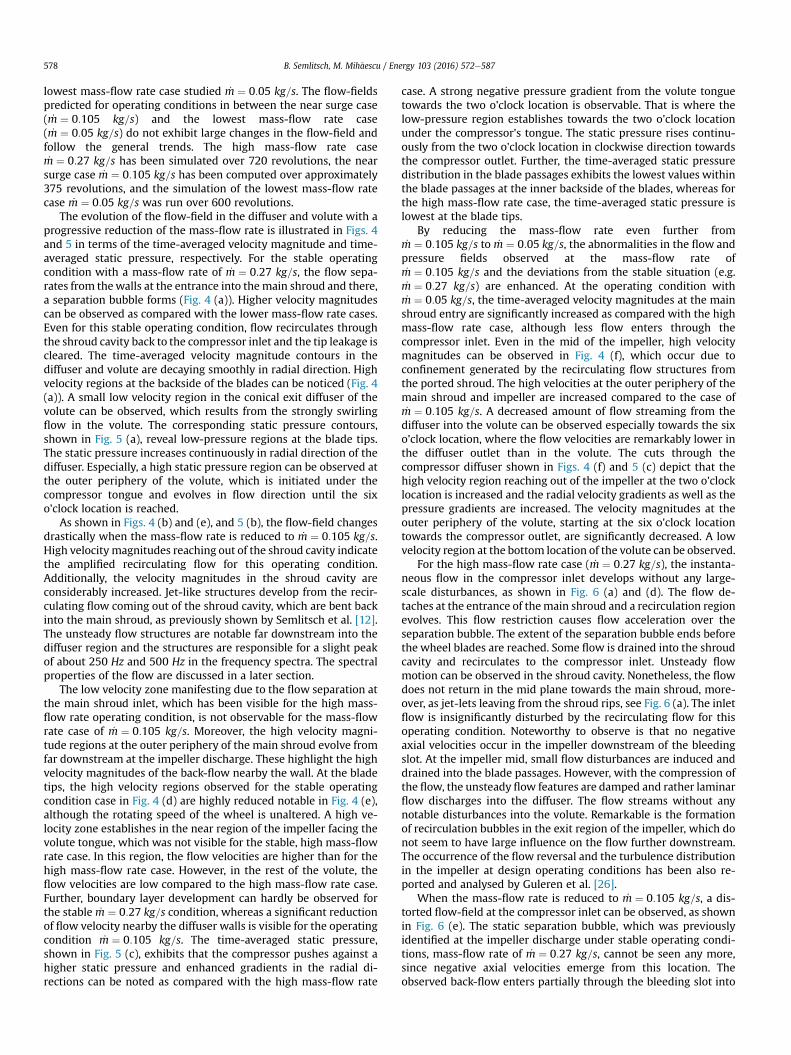
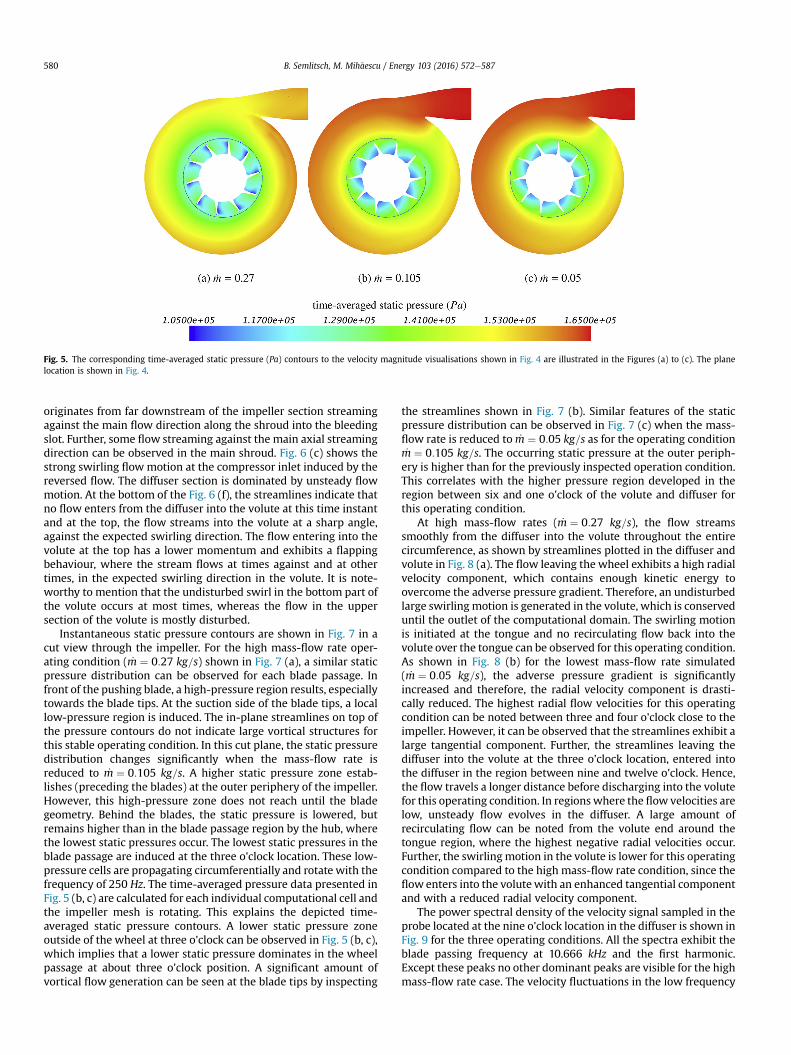
The evolution of the flow-field in the diffuser and volute with aprogressive reduction of the mass-flow rate is illustrated in Figs. 4and 5 in terms of the time-averaged velocity magnitude and time-averaged static pressure, respectively. For the stable operatingcondition with a mass-flow rate of _m ¼ 0:27 kg=s, the flow sepa-rates from thewalls at the entrance into themain shroud and there,a separation bubble forms (Fig. 4 (a)). Higher velocity magnitudescan be observed as compared with the lower mass-flow rate cases.Even for this stable operating condition, flow recirculates throughthe shroud cavity back to the compressor inlet and the tip leakage iscleared. The time-averaged velocity magnitude contours in thediffuser and volute are decaying smoothly in radial direction. Highvelocity regions at the backside of the blades can be noticed (Fig. 4(a)). A small low velocity region in the conical exit diffuser of thevolute can be observed, which results from the strongly swirlingflow in the volute. The corresponding static pressure contours,shown in Fig. 5 (a), reveal low-pressure regions at the blade tips.The static pressure increases continuously in radial direction of thediffuser. Especially, a high static pressure region can be observed atthe outer periphery of the volute, which is initiated under thecompressor tongue and evolves in flow direction until the sixo'clock location is reached.
As shown in Figs. 4 (b) and (e), and 5 (b), the flow-field changesdrastically when the mass-flow rate is reduced to _m ¼ 0:105 kg=s.High velocity magnitudes reaching out of the shroud cavity indicatethe amplified recirculating flow for this operating condition.Additionally, the velocity magnitudes in the shroud cavity areconsiderably increased. Jet-like structures develop from the recir-culating flow coming out of the shroud cavity, which are bent backinto the main shroud, as previously shown by Semlitsch et al. [12].The unsteady flow structures are notable far downstream into thediffuser region and the structures are responsible for a slight peakof about 250 Hz and 500 Hz in the frequency spectra. The spectralproperties of the flow are discussed in a later section.
The low velocity zone manifesting due to the flow separation atthe main shroud inlet, which has been visible for the high mass-flow rate operating condition, is not observable for the mass-flowrate case of _m ¼ 0:105 kg=s. Moreover, the high velocity magni-tude regions at the outer periphery of the main shroud evolve fromfar downstream at the impeller discharge. These highlight the highvelocity magnitudes of the back-flow nearby the wall. At the bladetips, the high velocity regions observed for the stable operatingcondition case in Fig. 4 (d) are highly reduced notable in Fig. 4 (e),although the rotating speed of the wheel is unaltered. A high ve-locity zone establishes in the near region of the impeller facing thevolute tongue, which was not visible for the stable, high mass-flowrate case. In this region, the flow velocities are higher than for thehigh mass-flow rate case. However, in the rest of the volute, theflow velocities are low compared to the high mass-flow rate case.Further, boundary layer development can hardly be observed forthe stable _m ¼ 0:27 kg=s condition, whereas a significant reductionof flow velocity nearby the diffuser walls is visible for the operatingcondition _m ¼ 0:105 kg=s. The time-averaged static pressure,shown in Fig. 5 (c), exhibits that the compressor pushes against ahigher static pressure and enhanced gradients in the radial di-rections can be noted as compared with the high mass-flow rate
case. A strong negative pressure gradient from the volute tonguetowards the two o'clock location is observable. That is where thelow-pressure region establishes towards the two o'clock locationunder the compressor's tongue. The static pressure rises continu-ously from the two o'clock location in clockwise direction towardsthe compressor outlet. Further, the time-averaged static pressuredistribution in the blade passages exhibits the lowest values withinthe blade passages at the inner backside of the blades, whereas forthe high mass-flow rate case, the time-averaged static pressure islowest at the blade tips.
By reducing the mass-flow rate even further from_m ¼ 0:105 kg=s to _m ¼ 0:05 kg=s, the abnormalities in the flow andpressure fields observed at the mass-flow rate of_m ¼ 0:105 kg=s and the deviations from the stable situation (e.g._m ¼ 0:27 kg=s) are enhanced. At the operating condition with_m ¼ 0:05 kg=s, the time-averaged velocity magnitudes at the mainshroud entry are significantly increased as compared with the highmass-flow rate case, although less flow enters through thecompressor inlet. Even in the mid of the impeller, high velocitymagnitudes can be observed in Fig. 4 (f), which occur due toconfinement generated by the recirculating flow structures fromthe ported shroud. The high velocities at the outer periphery of themain shroud and impeller are increased compared to the case of_m ¼ 0:105 kg=s. A decreased amount of flow streaming from thediffuser into the volute can be observed especially towards the sixo'clock location, where the flow velocities are remarkably lower inthe diffuser outlet than in the volute. The cuts through thecompressor diffuser shown in Figs. 4 (f) and 5 (c) depict that thehigh velocity region reaching out of the impeller at the two o'clocklocation is increased and the radial velocity gradients as well as thepressure gradients are increased. The velocity magnitudes at theouter periphery of the volute, starting at the six o'clock locationtowards the compressor outlet, are significantly decreased. A lowvelocity region at the bottom location of the volute can be observed.
For the high mass-flow rate case ( _m ¼ 0:27 kg=s), the instanta-neous flow in the compressor inlet develops without any large-scale disturbances, as shown in Fig. 6 (a) and (d). The flow de-taches at the entrance of themain shroud and a recirculation regionevolves. This flow restriction causes flow acceleration over theseparation bubble. The extent of the separation bubble ends beforethe wheel blades are reached. Some flow is drained into the shroudcavity and recirculates to the compressor inlet. Unsteady flowmotion can be observed in the shroud cavity. Nonetheless, the flowdoes not return in the mid plane towards the main shroud, more-over, as jet-lets leaving from the shroud rips, see Fig. 6 (a). The inletflow is insignificantly disturbed by the recirculating flow for thisoperating condition. Noteworthy to observe is that no negativeaxial velocities occur in the impeller downstream of the bleedingslot. At the impeller mid, small flow disturbances are induced anddrained into the blade passages. However, with the compression ofthe flow, the unsteady flow features are damped and rather laminarflow discharges into the diffuser. The flow streams without anynotable disturbances into the volute. Remarkable is the formationof recirculation bubbles in the exit region of the impeller, which donot seem to have large influence on the flow further downstream.The occurrence of the flow reversal and the turbulence distributionin the impeller at design operating conditions has been also re-ported and analysed by Guleren et al. [26].
When the mass-flow rate is reduced to _m ¼ 0:105 kg=s, a dis-torted flow-field at the compressor inlet can be observed, as shownin Fig. 6 (e). The static separation bubble, which was previouslyidentified at the impeller discharge under stable operating condi-tions, mass-flow rate of _m ¼ 0:27 kg=s, cannot be seen any more,since negative axial velocities emerge from this location. Theobserved back-flow enters partially through the bleeding slot into
B. Semlitsch, M. Mih!aescu / Energy 103 (2016) 572e587578
the shroud cavity against the axial mean flow direction. A largeramount of fluid recirculates through the shroud cavity at amplifiednegative axial velocities as compared with the stable operatingcondition. The flow through the shroud cavity interacts and dis-turbs the flow-field at the compressor inlet. Further, negative axialvelocities can be observed at the periphery of the main shroud,which cause large recirculation zones at the main shroud entry.Naturally, the axial back-flow returns from the impeller passagestowards the inlet with a tangential velocity component. This causesa global rotating flow-field at the compressor inlet, which is shownin Fig. 6 (b). Hence, the flow-field develops non-uniform towardsthe blades. The unsteady flow features develop mainly at the outerradii in the blade passages, whereas the flow towards the centrelineis less effected by the disturbances. The flow reaching the diffuser is
highly disturbed, as illustrated in Fig. 6 (e). Unsteady flow featuresare noticeable, which propagate through the diffuser into thevolute.
Fig. 6 (f) shows that unsteady flow motion can be observed inthe entire region of the compressor inlet for the lowest mass-flowrate simulated ( _m ¼ 0:05 kg=s). At the bottom, vortical flow struc-tures of the size of the blade passage are blocking the inflow andalso at the top large structures are influencing the inflow. Therefore,high axial flow velocities in the mid of the compressor inlet areinduced, which result in enhanced unsteady flow structuresevolving from the mid of the impeller. A large amount of flowrecirculates through the shroud cavity and high back-flow veloc-ities ("140 m=s) can be observed in Fig. 6 (f). Also in this case, alarge proportion of the mass-flow entering into the shroud cavity
Fig. 4. The time-averaged velocity magnitude (m=s) is show in the Figures (a) to (f) for different mass-flow rates at the speed line of 64 krpm. The locations of the cut planes withrespect to each other are indicated by the dashed lines in the Figures (a) and (d).
B. Semlitsch, M. Mih!aescu / Energy 103 (2016) 572e587 579
originates from far downstream of the impeller section streamingagainst the main flow direction along the shroud into the bleedingslot. Further, some flow streaming against the main axial streamingdirection can be observed in the main shroud. Fig. 6 (c) shows thestrong swirling flowmotion at the compressor inlet induced by thereversed flow. The diffuser section is dominated by unsteady flowmotion. At the bottom of the Fig. 6 (f), the streamlines indicate thatno flow enters from the diffuser into the volute at this time instantand at the top, the flow streams into the volute at a sharp angle,against the expected swirling direction. The flow entering into thevolute at the top has a lower momentum and exhibits a flappingbehaviour, where the stream flows at times against and at othertimes, in the expected swirling direction in the volute. It is note-worthy to mention that the undisturbed swirl in the bottom part ofthe volute occurs at most times, whereas the flow in the uppersection of the volute is mostly disturbed.
Instantaneous static pressure contours are shown in Fig. 7 in acut view through the impeller. For the high mass-flow rate oper-ating condition ( _m ¼ 0:27 kg=s) shown in Fig. 7 (a), a similar staticpressure distribution can be observed for each blade passage. Infront of the pushing blade, a high-pressure region results, especiallytowards the blade tips. At the suction side of the blade tips, a locallow-pressure region is induced. The in-plane streamlines on top ofthe pressure contours do not indicate large vortical structures forthis stable operating condition. In this cut plane, the static pressuredistribution changes significantly when the mass-flow rate isreduced to _m ¼ 0:105 kg=s. A higher static pressure zone estab-lishes (preceding the blades) at the outer periphery of the impeller.However, this high-pressure zone does not reach until the bladegeometry. Behind the blades, the static pressure is lowered, butremains higher than in the blade passage region by the hub, wherethe lowest static pressures occur. The lowest static pressures in theblade passage are induced at the three o'clock location. These low-pressure cells are propagating circumferentially and rotate with thefrequency of 250 Hz. The time-averaged pressure data presented inFig. 5 (b, c) are calculated for each individual computational cell andthe impeller mesh is rotating. This explains the depicted time-averaged static pressure contours. A lower static pressure zoneoutside of the wheel at three o'clock can be observed in Fig. 5 (b, c),which implies that a lower static pressure dominates in the wheelpassage at about three o'clock position. A significant amount ofvortical flow generation can be seen at the blade tips by inspecting
the streamlines shown in Fig. 7 (b). Similar features of the staticpressure distribution can be observed in Fig. 7 (c) when the mass-flow rate is reduced to _m ¼ 0:05 kg=s as for the operating condition_m ¼ 0:105 kg=s. The occurring static pressure at the outer periph-ery is higher than for the previously inspected operation condition.This correlates with the higher pressure region developed in theregion between six and one o'clock of the volute and diffuser forthis operating condition.
At high mass-flow rates ( _m ¼ 0:27 kg=s), the flow streamssmoothly from the diffuser into the volute throughout the entirecircumference, as shown by streamlines plotted in the diffuser andvolute in Fig. 8 (a). The flow leaving the wheel exhibits a high radialvelocity component, which contains enough kinetic energy toovercome the adverse pressure gradient. Therefore, an undisturbedlarge swirlingmotion is generated in the volute, which is conserveduntil the outlet of the computational domain. The swirling motionis initiated at the tongue and no recirculating flow back into thevolute over the tongue can be observed for this operating condition.As shown in Fig. 8 (b) for the lowest mass-flow rate simulated( _m ¼ 0:05 kg=s), the adverse pressure gradient is significantlyincreased and therefore, the radial velocity component is drasti-cally reduced. The highest radial flow velocities for this operatingcondition can be noted between three and four o'clock close to theimpeller. However, it can be observed that the streamlines exhibit alarge tangential component. Further, the streamlines leaving thediffuser into the volute at the three o'clock location, entered intothe diffuser in the region between nine and twelve o'clock. Hence,the flow travels a longer distance before discharging into the volutefor this operating condition. In regions where the flow velocities arelow, unsteady flow evolves in the diffuser. A large amount ofrecirculating flow can be noted from the volute end around thetongue region, where the highest negative radial velocities occur.Further, the swirlingmotion in the volute is lower for this operatingcondition compared to the high mass-flow rate condition, since theflow enters into the volutewith an enhanced tangential componentand with a reduced radial velocity component.
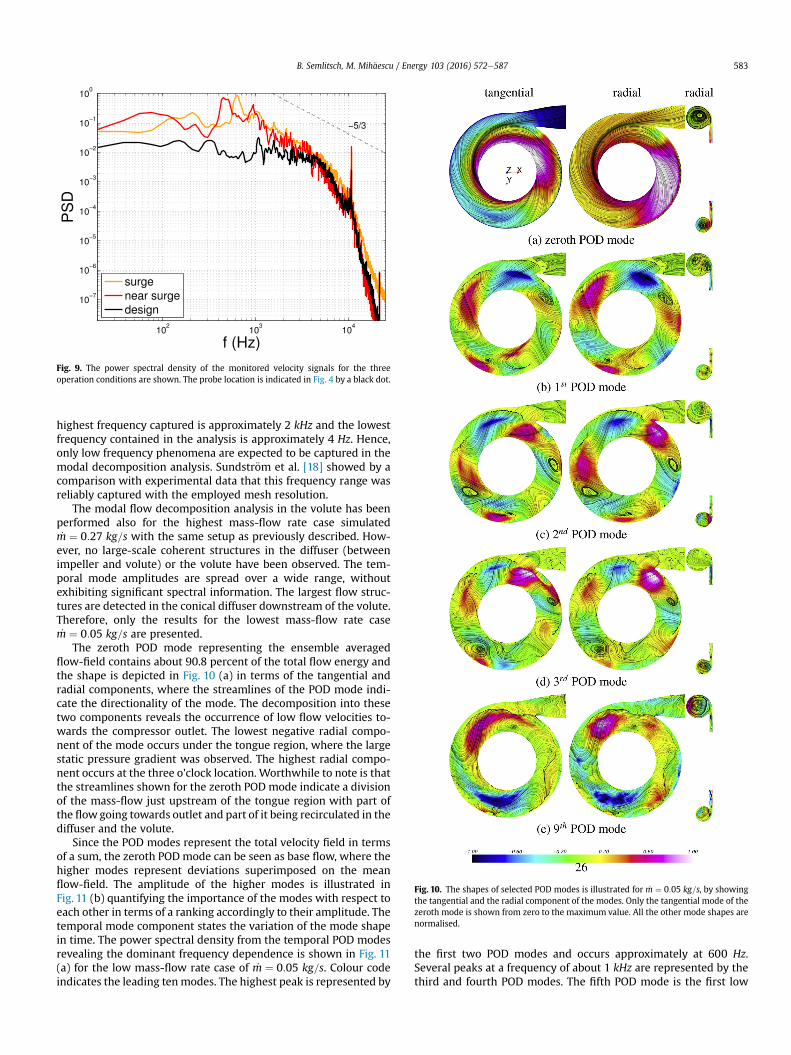
The power spectral density of the velocity signal sampled in theprobe located at the nine o'clock location in the diffuser is shown inFig. 9 for the three operating conditions. All the spectra exhibit theblade passing frequency at 10.666 kHz and the first harmonic.Except these peaks no other dominant peaks are visible for the highmass-flow rate case. The velocity fluctuations in the low frequency
Fig. 5. The corresponding time-averaged static pressure (Pa) contours to the velocity magnitude visualisations shown in Fig. 4 are illustrated in the Figures (a) to (c). The planelocation is shown in Fig. 4.
B. Semlitsch, M. Mih!aescu / Energy 103 (2016) 572e587580
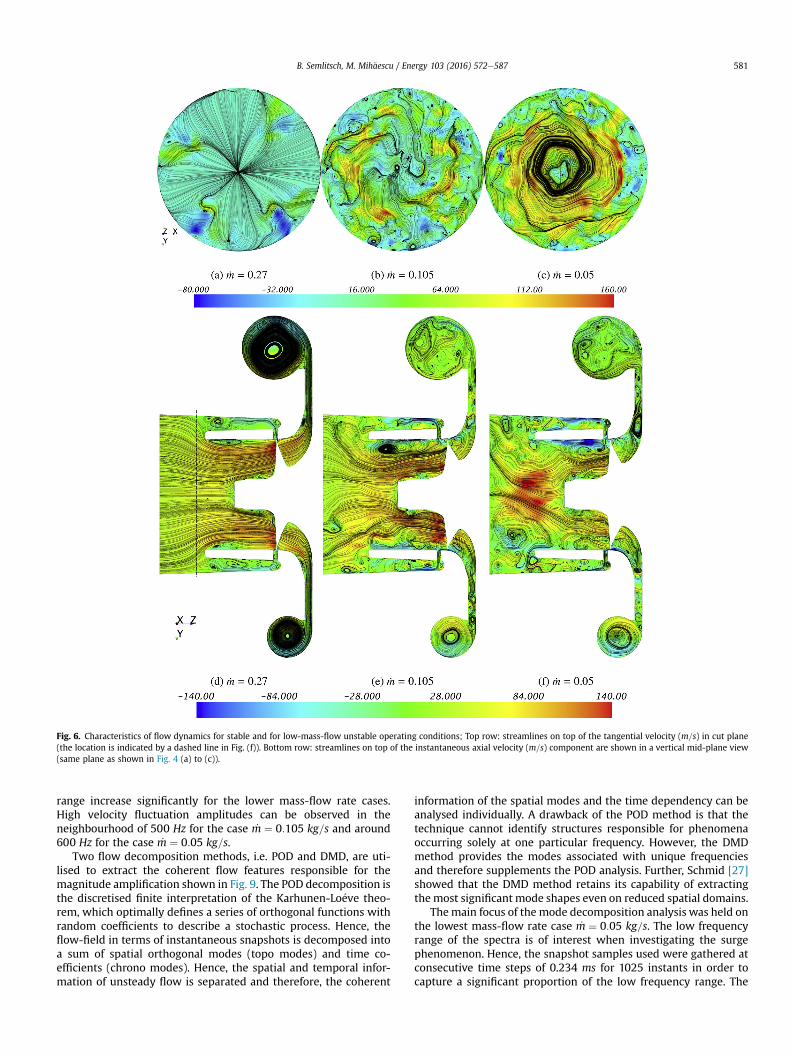
range increase significantly for the lower mass-flow rate cases.High velocity fluctuation amplitudes can be observed in theneighbourhood of 500 Hz for the case _m ¼ 0:105 kg=s and around600 Hz for the case _m ¼ 0:05 kg=s.
Two flow decomposition methods, i.e. POD and DMD, are uti-lised to extract the coherent flow features responsible for themagnitude amplification shown in Fig. 9. The POD decomposition isthe discretised finite interpretation of the Karhunen-Lo"eve theo-rem, which optimally defines a series of orthogonal functions withrandom coefficients to describe a stochastic process. Hence, theflow-field in terms of instantaneous snapshots is decomposed intoa sum of spatial orthogonal modes (topo modes) and time co-efficients (chrono modes). Hence, the spatial and temporal infor-mation of unsteady flow is separated and therefore, the coherent
information of the spatial modes and the time dependency can beanalysed individually. A drawback of the POD method is that thetechnique cannot identify structures responsible for phenomenaoccurring solely at one particular frequency. However, the DMDmethod provides the modes associated with unique frequenciesand therefore supplements the POD analysis. Further, Schmid [27]showed that the DMD method retains its capability of extractingthemost significant mode shapes even on reduced spatial domains.
Themain focus of the mode decomposition analysis was held onthe lowest mass-flow rate case _m ¼ 0:05 kg=s. The low frequencyrange of the spectra is of interest when investigating the surgephenomenon. Hence, the snapshot samples used were gathered atconsecutive time steps of 0.234 ms for 1025 instants in order tocapture a significant proportion of the low frequency range. The
Fig. 6. Characteristics of flow dynamics for stable and for low-mass-flow unstable operating conditions; Top row: streamlines on top of the tangential velocity (m=s) in cut plane(the location is indicated by a dashed line in Fig. (f)). Bottom row: streamlines on top of the instantaneous axial velocity (m=s) component are shown in a vertical mid-plane view(same plane as shown in Fig. 4 (a) to (c)).
B. Semlitsch, M. Mih!aescu / Energy 103 (2016) 572e587 581
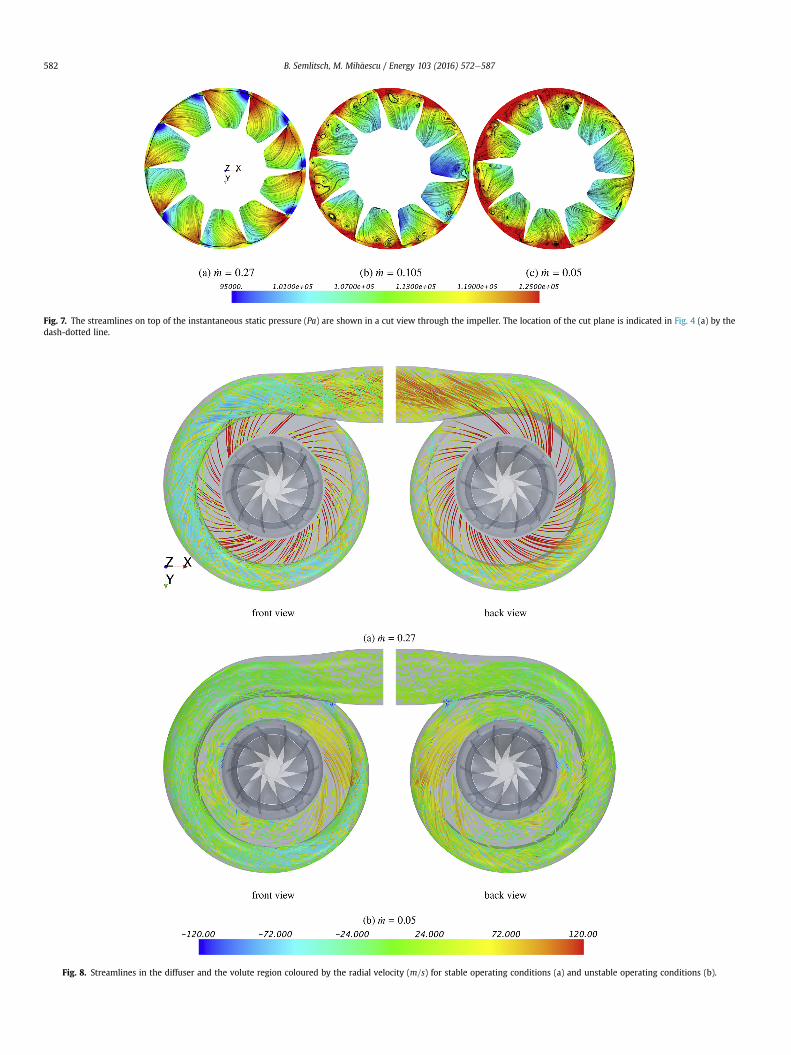
Fig. 7. The streamlines on top of the instantaneous static pressure (Pa) are shown in a cut view through the impeller. The location of the cut plane is indicated in Fig. 4 (a) by thedash-dotted line.
Fig. 8. Streamlines in the diffuser and the volute region coloured by the radial velocity (m=s) for stable operating conditions (a) and unstable operating conditions (b).
B. Semlitsch, M. Mih!aescu / Energy 103 (2016) 572e587582
highest frequency captured is approximately 2 kHz and the lowestfrequency contained in the analysis is approximately 4 Hz. Hence,only low frequency phenomena are expected to be captured in themodal decomposition analysis. Sundstr€om et al. [18] showed by acomparison with experimental data that this frequency range wasreliably captured with the employed mesh resolution.
The modal flow decomposition analysis in the volute has beenperformed also for the highest mass-flow rate case simulated_m ¼ 0:27 kg=s with the same setup as previously described. How-ever, no large-scale coherent structures in the diffuser (betweenimpeller and volute) or the volute have been observed. The tem-poral mode amplitudes are spread over a wide range, withoutexhibiting significant spectral information. The largest flow struc-tures are detected in the conical diffuser downstream of the volute.Therefore, only the results for the lowest mass-flow rate case_m ¼ 0:05 kg=s are presented.
The zeroth POD mode representing the ensemble averagedflow-field contains about 90.8 percent of the total flow energy andthe shape is depicted in Fig. 10 (a) in terms of the tangential andradial components, where the streamlines of the POD mode indi-cate the directionality of the mode. The decomposition into thesetwo components reveals the occurrence of low flow velocities to-wards the compressor outlet. The lowest negative radial compo-nent of the mode occurs under the tongue region, where the largestatic pressure gradient was observed. The highest radial compo-nent occurs at the three o'clock location. Worthwhile to note is thatthe streamlines shown for the zeroth POD mode indicate a divisionof the mass-flow just upstream of the tongue region with part ofthe flowgoing towards outlet and part of it being recirculated in thediffuser and the volute.
Since the POD modes represent the total velocity field in termsof a sum, the zeroth POD mode can be seen as base flow, where thehigher modes represent deviations superimposed on the meanflow-field. The amplitude of the higher modes is illustrated inFig. 11 (b) quantifying the importance of the modes with respect toeach other in terms of a ranking accordingly to their amplitude. Thetemporal mode component states the variation of the mode shapein time. The power spectral density from the temporal POD modesrevealing the dominant frequency dependence is shown in Fig. 11(a) for the low mass-flow rate case of _m ¼ 0:05 kg=s. Colour codeindicates the leading tenmodes. The highest peak is represented by
the first two POD modes and occurs approximately at 600 Hz.Several peaks at a frequency of about 1 kHz are represented by thethird and fourth POD modes. The fifth POD mode is the first low
Fig. 9. The power spectral density of the monitored velocity signals for the threeoperation conditions are shown. The probe location is indicated in Fig. 4 by a black dot.
Fig. 10. The shapes of selected POD modes is illustrated for _m ¼ 0:05 kg=s, by showingthe tangential and the radial component of the modes. Only the tangential mode of thezeroth mode is shown from zero to the maximum value. All the other mode shapes arenormalised.
B. Semlitsch, M. Mih!aescu / Energy 103 (2016) 572e587 583
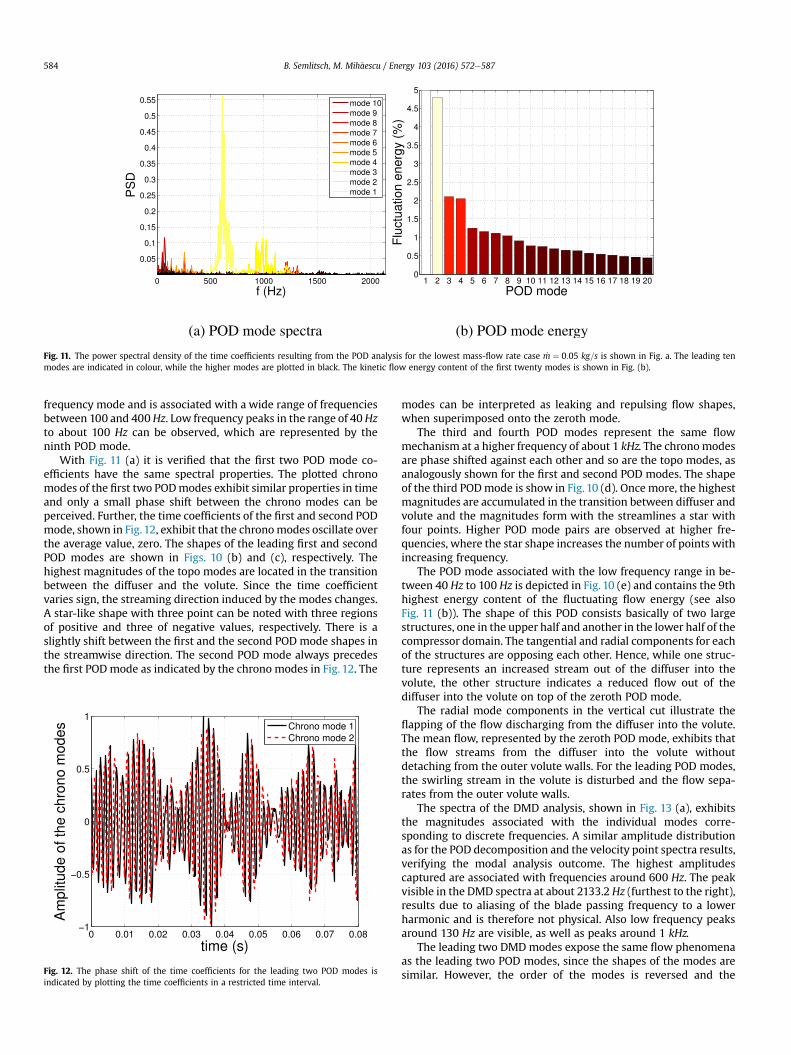
frequency mode and is associated with a wide range of frequenciesbetween 100 and 400Hz. Low frequency peaks in the range of 40Hzto about 100 Hz can be observed, which are represented by theninth POD mode.
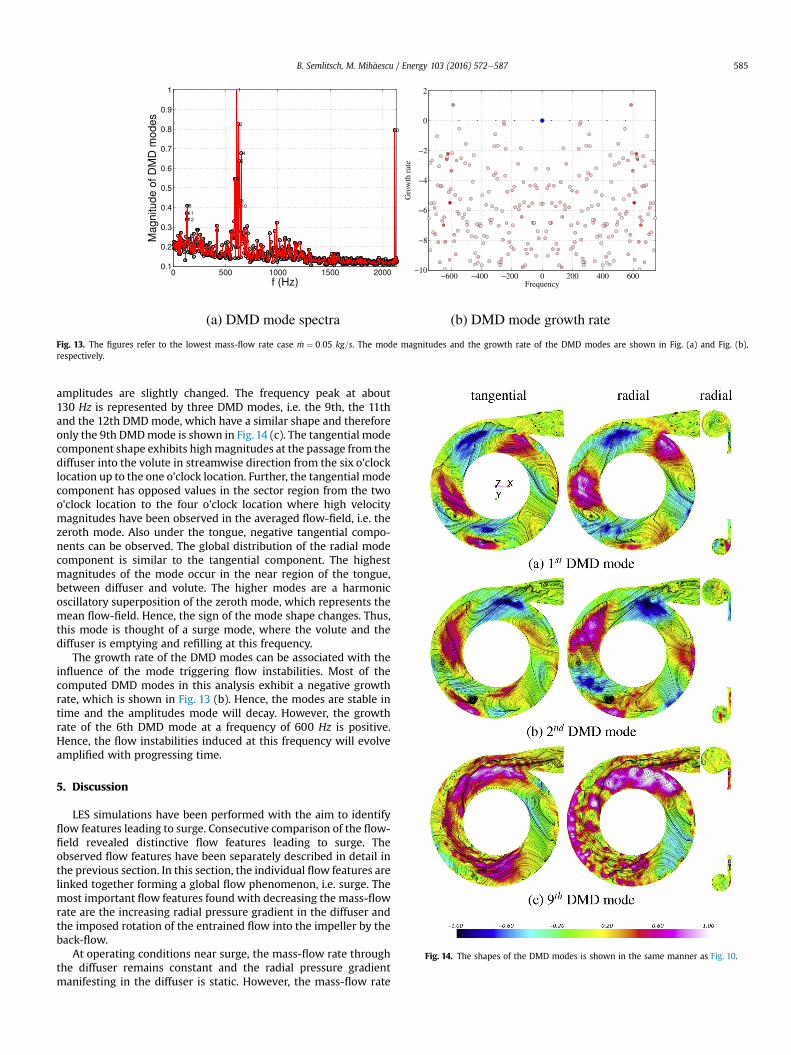
With Fig. 11 (a) it is verified that the first two POD mode co-efficients have the same spectral properties. The plotted chronomodes of the first two PODmodes exhibit similar properties in timeand only a small phase shift between the chrono modes can beperceived. Further, the time coefficients of the first and second PODmode, shown in Fig.12, exhibit that the chronomodes oscillate overthe average value, zero. The shapes of the leading first and secondPOD modes are shown in Figs. 10 (b) and (c), respectively. Thehighest magnitudes of the topo modes are located in the transitionbetween the diffuser and the volute. Since the time coefficientvaries sign, the streaming direction induced by the modes changes.A star-like shape with three point can be noted with three regionsof positive and three of negative values, respectively. There is aslightly shift between the first and the second POD mode shapes inthe streamwise direction. The second POD mode always precedesthe first PODmode as indicated by the chrono modes in Fig. 12. The
modes can be interpreted as leaking and repulsing flow shapes,when superimposed onto the zeroth mode.
The third and fourth POD modes represent the same flowmechanism at a higher frequency of about 1 kHz. The chronomodesare phase shifted against each other and so are the topo modes, asanalogously shown for the first and second POD modes. The shapeof the third PODmode is show in Fig. 10 (d). Once more, the highestmagnitudes are accumulated in the transition between diffuser andvolute and the magnitudes form with the streamlines a star withfour points. Higher POD mode pairs are observed at higher fre-quencies, where the star shape increases the number of points withincreasing frequency.
The POD mode associated with the low frequency range in be-tween 40 Hz to 100 Hz is depicted in Fig. 10 (e) and contains the 9thhighest energy content of the fluctuating flow energy (see alsoFig. 11 (b)). The shape of this POD consists basically of two largestructures, one in the upper half and another in the lower half of thecompressor domain. The tangential and radial components for eachof the structures are opposing each other. Hence, while one struc-ture represents an increased stream out of the diffuser into thevolute, the other structure indicates a reduced flow out of thediffuser into the volute on top of the zeroth POD mode.
The radial mode components in the vertical cut illustrate theflapping of the flow discharging from the diffuser into the volute.The mean flow, represented by the zeroth POD mode, exhibits thatthe flow streams from the diffuser into the volute withoutdetaching from the outer volute walls. For the leading POD modes,the swirling stream in the volute is disturbed and the flow sepa-rates from the outer volute walls.
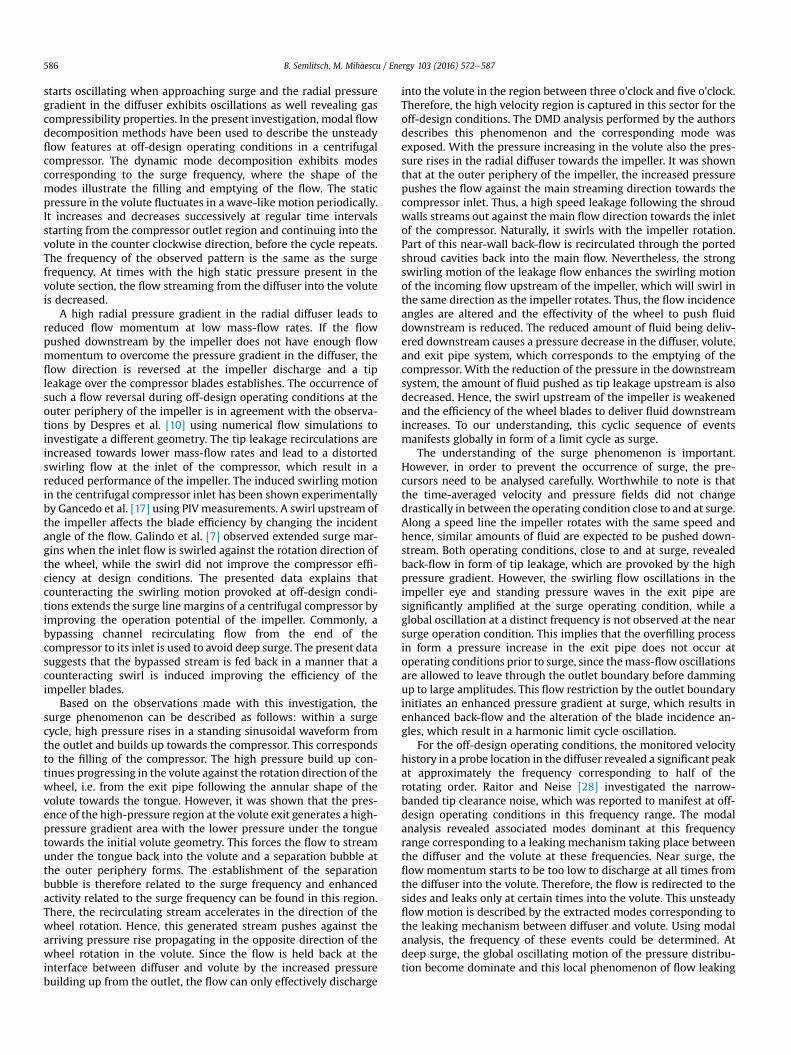
The spectra of the DMD analysis, shown in Fig. 13 (a), exhibitsthe magnitudes associated with the individual modes corre-sponding to discrete frequencies. A similar amplitude distributionas for the POD decomposition and the velocity point spectra results,verifying the modal analysis outcome. The highest amplitudescaptured are associated with frequencies around 600 Hz. The peakvisible in the DMD spectra at about 2133.2 Hz (furthest to the right),results due to aliasing of the blade passing frequency to a lowerharmonic and is therefore not physical. Also low frequency peaksaround 130 Hz are visible, as well as peaks around 1 kHz.
The leading two DMDmodes expose the same flow phenomenaas the leading two POD modes, since the shapes of the modes aresimilar. However, the order of the modes is reversed and the
Fig. 11. The power spectral density of the time coefficients resulting from the POD analysis for the lowest mass-flow rate case _m ¼ 0:05 kg=s is shown in Fig. a. The leading tenmodes are indicated in colour, while the higher modes are plotted in black. The kinetic flow energy content of the first twenty modes is shown in Fig. (b).
Fig. 12. The phase shift of the time coefficients for the leading two POD modes isindicated by plotting the time coefficients in a restricted time interval.
B. Semlitsch, M. Mih!aescu / Energy 103 (2016) 572e587584
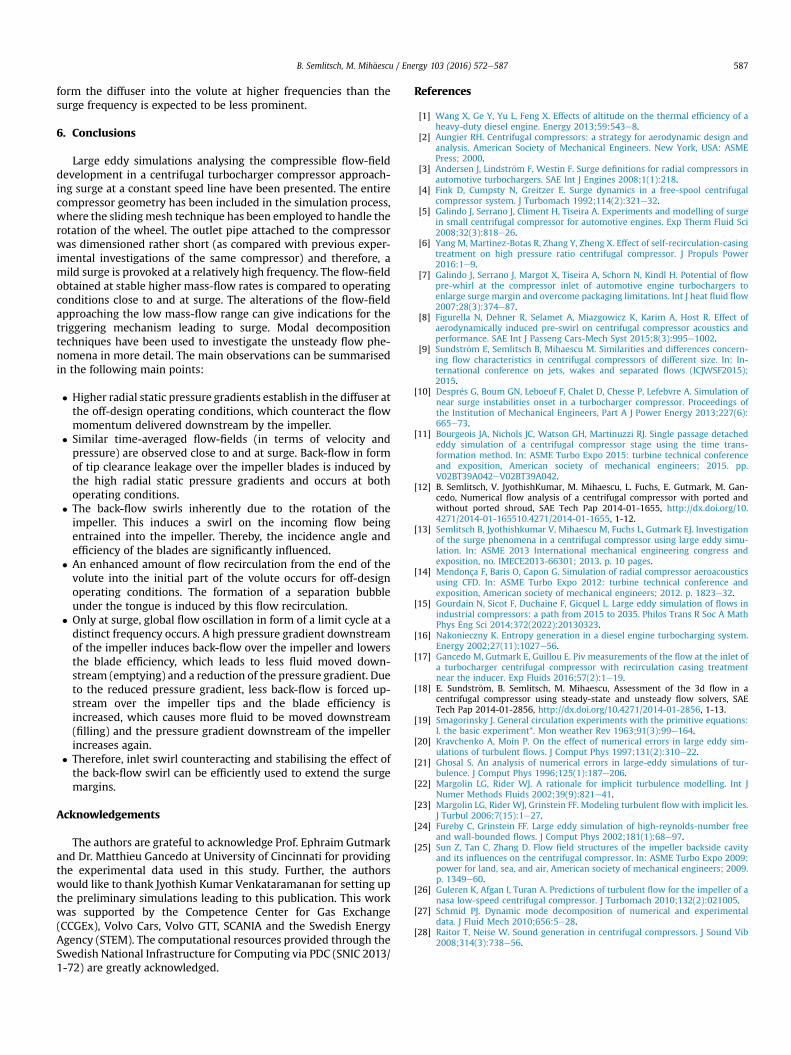
amplitudes are slightly changed. The frequency peak at about130 Hz is represented by three DMD modes, i.e. the 9th, the 11thand the 12th DMDmode, which have a similar shape and thereforeonly the 9th DMDmode is shown in Fig. 14 (c). The tangential modecomponent shape exhibits highmagnitudes at the passage from thediffuser into the volute in streamwise direction from the six o'clocklocation up to the one o'clock location. Further, the tangential modecomponent has opposed values in the sector region from the twoo'clock location to the four o'clock location where high velocitymagnitudes have been observed in the averaged flow-field, i.e. thezeroth mode. Also under the tongue, negative tangential compo-nents can be observed. The global distribution of the radial modecomponent is similar to the tangential component. The highestmagnitudes of the mode occur in the near region of the tongue,between diffuser and volute. The higher modes are a harmonicoscillatory superposition of the zeroth mode, which represents themean flow-field. Hence, the sign of the mode shape changes. Thus,this mode is thought of a surge mode, where the volute and thediffuser is emptying and refilling at this frequency.
The growth rate of the DMD modes can be associated with theinfluence of the mode triggering flow instabilities. Most of thecomputed DMD modes in this analysis exhibit a negative growthrate, which is shown in Fig. 13 (b). Hence, the modes are stable intime and the amplitudes mode will decay. However, the growthrate of the 6th DMD mode at a frequency of 600 Hz is positive.Hence, the flow instabilities induced at this frequency will evolveamplified with progressing time.
5. Discussion
LES simulations have been performed with the aim to identifyflow features leading to surge. Consecutive comparison of the flow-field revealed distinctive flow features leading to surge. Theobserved flow features have been separately described in detail inthe previous section. In this section, the individual flow features arelinked together forming a global flow phenomenon, i.e. surge. Themost important flow features found with decreasing the mass-flowrate are the increasing radial pressure gradient in the diffuser andthe imposed rotation of the entrained flow into the impeller by theback-flow.
At operating conditions near surge, the mass-flow rate throughthe diffuser remains constant and the radial pressure gradientmanifesting in the diffuser is static. However, the mass-flow rate
Fig. 13. The figures refer to the lowest mass-flow rate case _m ¼ 0:05 kg=s. The mode magnitudes and the growth rate of the DMD modes are shown in Fig. (a) and Fig. (b),respectively.
Fig. 14. The shapes of the DMD modes is shown in the same manner as Fig. 10.
B. Semlitsch, M. Mih!aescu / Energy 103 (2016) 572e587 585
starts oscillating when approaching surge and the radial pressuregradient in the diffuser exhibits oscillations as well revealing gascompressibility properties. In the present investigation, modal flowdecomposition methods have been used to describe the unsteadyflow features at off-design operating conditions in a centrifugalcompressor. The dynamic mode decomposition exhibits modescorresponding to the surge frequency, where the shape of themodes illustrate the filling and emptying of the flow. The staticpressure in the volute fluctuates in a wave-like motion periodically.It increases and decreases successively at regular time intervalsstarting from the compressor outlet region and continuing into thevolute in the counter clockwise direction, before the cycle repeats.The frequency of the observed pattern is the same as the surgefrequency. At times with the high static pressure present in thevolute section, the flow streaming from the diffuser into the voluteis decreased.
A high radial pressure gradient in the radial diffuser leads toreduced flow momentum at low mass-flow rates. If the flowpushed downstream by the impeller does not have enough flowmomentum to overcome the pressure gradient in the diffuser, theflow direction is reversed at the impeller discharge and a tipleakage over the compressor blades establishes. The occurrence ofsuch a flow reversal during off-design operating conditions at theouter periphery of the impeller is in agreement with the observa-tions by Despres et al. [10] using numerical flow simulations toinvestigate a different geometry. The tip leakage recirculations areincreased towards lower mass-flow rates and lead to a distortedswirling flow at the inlet of the compressor, which result in areduced performance of the impeller. The induced swirling motionin the centrifugal compressor inlet has been shown experimentallyby Gancedo et al. [17] using PIV measurements. A swirl upstream ofthe impeller affects the blade efficiency by changing the incidentangle of the flow. Galindo et al. [7] observed extended surge mar-gins when the inlet flow is swirled against the rotation direction ofthe wheel, while the swirl did not improve the compressor effi-ciency at design conditions. The presented data explains thatcounteracting the swirling motion provoked at off-design condi-tions extends the surge line margins of a centrifugal compressor byimproving the operation potential of the impeller. Commonly, abypassing channel recirculating flow from the end of thecompressor to its inlet is used to avoid deep surge. The present datasuggests that the bypassed stream is fed back in a manner that acounteracting swirl is induced improving the efficiency of theimpeller blades.
Based on the observations made with this investigation, thesurge phenomenon can be described as follows: within a surgecycle, high pressure rises in a standing sinusoidal waveform fromthe outlet and builds up towards the compressor. This correspondsto the filling of the compressor. The high pressure build up con-tinues progressing in the volute against the rotation direction of thewheel, i.e. from the exit pipe following the annular shape of thevolute towards the tongue. However, it was shown that the pres-ence of the high-pressure region at the volute exit generates a high-pressure gradient area with the lower pressure under the tonguetowards the initial volute geometry. This forces the flow to streamunder the tongue back into the volute and a separation bubble atthe outer periphery forms. The establishment of the separationbubble is therefore related to the surge frequency and enhancedactivity related to the surge frequency can be found in this region.There, the recirculating stream accelerates in the direction of thewheel rotation. Hence, this generated stream pushes against thearriving pressure rise propagating in the opposite direction of thewheel rotation in the volute. Since the flow is held back at theinterface between diffuser and volute by the increased pressurebuilding up from the outlet, the flow can only effectively discharge
into the volute in the region between three o'clock and five o'clock.Therefore, the high velocity region is captured in this sector for theoff-design conditions. The DMD analysis performed by the authorsdescribes this phenomenon and the corresponding mode wasexposed. With the pressure increasing in the volute also the pres-sure rises in the radial diffuser towards the impeller. It was shownthat at the outer periphery of the impeller, the increased pressurepushes the flow against the main streaming direction towards thecompressor inlet. Thus, a high speed leakage following the shroudwalls streams out against the main flow direction towards the inletof the compressor. Naturally, it swirls with the impeller rotation.Part of this near-wall back-flow is recirculated through the portedshroud cavities back into the main flow. Nevertheless, the strongswirling motion of the leakage flow enhances the swirling motionof the incoming flow upstream of the impeller, which will swirl inthe same direction as the impeller rotates. Thus, the flow incidenceangles are altered and the effectivity of the wheel to push fluiddownstream is reduced. The reduced amount of fluid being deliv-ered downstream causes a pressure decrease in the diffuser, volute,and exit pipe system, which corresponds to the emptying of thecompressor. With the reduction of the pressure in the downstreamsystem, the amount of fluid pushed as tip leakage upstream is alsodecreased. Hence, the swirl upstream of the impeller is weakenedand the efficiency of the wheel blades to deliver fluid downstreamincreases. To our understanding, this cyclic sequence of eventsmanifests globally in form of a limit cycle as surge.
The understanding of the surge phenomenon is important.However, in order to prevent the occurrence of surge, the pre-cursors need to be analysed carefully. Worthwhile to note is thatthe time-averaged velocity and pressure fields did not changedrastically in between the operating condition close to and at surge.Along a speed line the impeller rotates with the same speed andhence, similar amounts of fluid are expected to be pushed down-stream. Both operating conditions, close to and at surge, revealedback-flow in form of tip leakage, which are provoked by the highpressure gradient. However, the swirling flow oscillations in theimpeller eye and standing pressure waves in the exit pipe aresignificantly amplified at the surge operating condition, while aglobal oscillation at a distinct frequency is not observed at the nearsurge operation condition. This implies that the overfilling processin form a pressure increase in the exit pipe does not occur atoperating conditions prior to surge, since themass-flow oscillationsare allowed to leave through the outlet boundary before dammingup to large amplitudes. This flow restriction by the outlet boundaryinitiates an enhanced pressure gradient at surge, which results inenhanced back-flow and the alteration of the blade incidence an-gles, which result in a harmonic limit cycle oscillation.
For the off-design operating conditions, the monitored velocityhistory in a probe location in the diffuser revealed a significant peakat approximately the frequency corresponding to half of therotating order. Raitor and Neise [28] investigated the narrow-banded tip clearance noise, which was reported to manifest at off-design operating conditions in this frequency range. The modalanalysis revealed associated modes dominant at this frequencyrange corresponding to a leaking mechanism taking place betweenthe diffuser and the volute at these frequencies. Near surge, theflow momentum starts to be too low to discharge at all times fromthe diffuser into the volute. Therefore, the flow is redirected to thesides and leaks only at certain times into the volute. This unsteadyflow motion is described by the extracted modes corresponding tothe leaking mechanism between diffuser and volute. Using modalanalysis, the frequency of these events could be determined. Atdeep surge, the global oscillating motion of the pressure distribu-tion become dominate and this local phenomenon of flow leaking
B. Semlitsch, M. Mih!aescu / Energy 103 (2016) 572e587586
form the diffuser into the volute at higher frequencies than thesurge frequency is expected to be less prominent.
6. Conclusions
Large eddy simulations analysing the compressible flow-fielddevelopment in a centrifugal turbocharger compressor approach-ing surge at a constant speed line have been presented. The entirecompressor geometry has been included in the simulation process,where the slidingmesh technique has been employed to handle therotation of the wheel. The outlet pipe attached to the compressorwas dimensioned rather short (as compared with previous exper-imental investigations of the same compressor) and therefore, amild surge is provoked at a relatively high frequency. The flow-fieldobtained at stable higher mass-flow rates is compared to operatingconditions close to and at surge. The alterations of the flow-fieldapproaching the low mass-flow range can give indications for thetriggering mechanism leading to surge. Modal decompositiontechniques have been used to investigate the unsteady flow phe-nomena in more detail. The main observations can be summarisedin the following main points:
% Higher radial static pressure gradients establish in the diffuser atthe off-design operating conditions, which counteract the flowmomentum delivered downstream by the impeller.
% Similar time-averaged flow-fields (in terms of velocity andpressure) are observed close to and at surge. Back-flow in formof tip clearance leakage over the impeller blades is induced bythe high radial static pressure gradients and occurs at bothoperating conditions.
% The back-flow swirls inherently due to the rotation of theimpeller. This induces a swirl on the incoming flow beingentrained into the impeller. Thereby, the incidence angle andefficiency of the blades are significantly influenced.
% An enhanced amount of flow recirculation from the end of thevolute into the initial part of the volute occurs for off-designoperating conditions. The formation of a separation bubbleunder the tongue is induced by this flow recirculation.
% Only at surge, global flow oscillation in form of a limit cycle at adistinct frequency occurs. A high pressure gradient downstreamof the impeller induces back-flow over the impeller and lowersthe blade efficiency, which leads to less fluid moved down-stream (emptying) and a reduction of the pressure gradient. Dueto the reduced pressure gradient, less back-flow is forced up-stream over the impeller tips and the blade efficiency isincreased, which causes more fluid to be moved downstream(filling) and the pressure gradient downstream of the impellerincreases again.
% Therefore, inlet swirl counteracting and stabilising the effect ofthe back-flow swirl can be efficiently used to extend the surgemargins.
Acknowledgements
The authors are grateful to acknowledge Prof. Ephraim Gutmarkand Dr. Matthieu Gancedo at University of Cincinnati for providingthe experimental data used in this study. Further, the authorswould like to thank Jyothish Kumar Venkataramanan for setting upthe preliminary simulations leading to this publication. This workwas supported by the Competence Center for Gas Exchange(CCGEx), Volvo Cars, Volvo GTT, SCANIA and the Swedish EnergyAgency (STEM). The computational resources provided through theSwedish National Infrastructure for Computing via PDC (SNIC 2013/1-72) are greatly acknowledged.
References
[1] Wang X, Ge Y, Yu L, Feng X. Effects of altitude on the thermal efficiency of aheavy-duty diesel engine. Energy 2013;59:543e8.
[2] Aungier RH. Centrifugal compressors: a strategy for aerodynamic design andanalysis. American Society of Mechanical Engineers. New York, USA: ASMEPress; 2000.
[3] Andersen J, Lindstr€om F, Westin F. Surge definitions for radial compressors inautomotive turbochargers. SAE Int J Engines 2008;1(1):218.
[4] Fink D, Cumpsty N, Greitzer E. Surge dynamics in a free-spool centrifugalcompressor system. J Turbomach 1992;114(2):321e32.
[5] Galindo J, Serrano J, Climent H, Tiseira A. Experiments and modelling of surgein small centrifugal compressor for automotive engines. Exp Therm Fluid Sci2008;32(3):818e26.
[6] Yang M, Martinez-Botas R, Zhang Y, Zheng X. Effect of self-recirculation-casingtreatment on high pressure ratio centrifugal compressor. J Propuls Power2016:1e9.
[7] Galindo J, Serrano J, Margot X, Tiseira A, Schorn N, Kindl H. Potential of flowpre-whirl at the compressor inlet of automotive engine turbochargers toenlarge surge margin and overcome packaging limitations. Int J heat fluid flow2007;28(3):374e87.
[8] Figurella N, Dehner R, Selamet A, Miazgowicz K, Karim A, Host R. Effect ofaerodynamically induced pre-swirl on centrifugal compressor acoustics andperformance. SAE Int J Passeng Cars-Mech Syst 2015;8(3):995e1002.
[9] Sundstr€om E, Semlitsch B, Mihaescu M. Similarities and differences concern-ing flow characteristics in centrifugal compressors of different size. In: In-ternational conference on jets, wakes and separated flows (ICJWSF2015);2015.
[10] Despr"es G, Boum GN, Leboeuf F, Chalet D, Chesse P, Lefebvre A. Simulation ofnear surge instabilities onset in a turbocharger compressor. Proceedings ofthe Institution of Mechanical Engineers, Part A J Power Energy 2013;227(6):665e73.
[11] Bourgeois JA, Nichols JC, Watson GH, Martinuzzi RJ. Single passage detachededdy simulation of a centrifugal compressor stage using the time trans-formation method. In: ASME Turbo Expo 2015: turbine technical conferenceand exposition, American society of mechanical engineers; 2015. pp.V02BT39A042eV02BT39A042.
[12] B. Semlitsch, V. JyothishKumar, M. Mihaescu, L. Fuchs, E. Gutmark, M. Gan-cedo, Numerical flow analysis of a centrifugal compressor with ported andwithout ported shroud, SAE Tech Pap 2014-01-1655, http://dx.doi.org/10.4271/2014-01-165510.4271/2014-01-1655, 1-12.
[13] Semlitsch B, Jyothishkumar V, Mihaescu M, Fuchs L, Gutmark EJ. Investigationof the surge phenomena in a centrifugal compressor using large eddy simu-lation. In: ASME 2013 International mechanical engineering congress andexposition, no. IMECE2013-66301; 2013. p. 10 pages.
[14] Mendonça F, Baris O, Capon G. Simulation of radial compressor aeroacousticsusing CFD. In: ASME Turbo Expo 2012: turbine technical conference andexposition, American society of mechanical engineers; 2012. p. 1823e32.
[15] Gourdain N, Sicot F, Duchaine F, Gicquel L. Large eddy simulation of flows inindustrial compressors: a path from 2015 to 2035. Philos Trans R Soc A MathPhys Eng Sci 2014;372(2022):20130323.
[16] Nakonieczny K. Entropy generation in a diesel engine turbocharging system.Energy 2002;27(11):1027e56.
[17] Gancedo M, Gutmark E, Guillou E. Piv measurements of the flow at the inlet ofa turbocharger centrifugal compressor with recirculation casing treatmentnear the inducer. Exp Fluids 2016;57(2):1e19.
[18] E. Sundstr€om, B. Semlitsch, M. Mihaescu, Assessment of the 3d flow in acentrifugal compressor using steady-state and unsteady flow solvers, SAETech Pap 2014-01-2856, http://dx.doi.org/10.4271/2014-01-2856, 1-13.
[19] Smagorinsky J. General circulation experiments with the primitive equations:I. the basic experiment*. Mon weather Rev 1963;91(3):99e164.
[20] Kravchenko A, Moin P. On the effect of numerical errors in large eddy sim-ulations of turbulent flows. J Comput Phys 1997;131(2):310e22.
[21] Ghosal S. An analysis of numerical errors in large-eddy simulations of tur-bulence. J Comput Phys 1996;125(1):187e206.
[22] Margolin LG, Rider WJ. A rationale for implicit turbulence modelling. Int JNumer Methods Fluids 2002;39(9):821e41.
[23] Margolin LG, Rider WJ, Grinstein FF. Modeling turbulent flowwith implicit les.J Turbul 2006;7(15):1e27.
[24] Fureby C, Grinstein FF. Large eddy simulation of high-reynolds-number freeand wall-bounded flows. J Comput Phys 2002;181(1):68e97.
[25] Sun Z, Tan C, Zhang D. Flow field structures of the impeller backside cavityand its influences on the centrifugal compressor. In: ASME Turbo Expo 2009:power for land, sea, and air, American society of mechanical engineers; 2009.p. 1349e60.
[26] Guleren K, Afgan I, Turan A. Predictions of turbulent flow for the impeller of anasa low-speed centrifugal compressor. J Turbomach 2010;132(2):021005.
[27] Schmid PJ. Dynamic mode decomposition of numerical and experimentaldata. J Fluid Mech 2010;656:5e28.
[28] Raitor T, Neise W. Sound generation in centrifugal compressors. J Sound Vib2008;314(3):738e56.
B. Semlitsch, M. Mih!aescu / Energy 103 (2016) 572e587 587