Flow pattern assessment in tubes with wire coil inserts in laminar and transition regimes
10
Flow pattern assessment in tubes with wire coil inserts in laminar and transition regimes A. Garcı ´a a, * , J.P. Solano a , P.G. Vicente b , A. Viedma a a Universidad Polite ´cnica de Cartagena, Departamento de Ingenierı ´a Te ´rmica y de Fluidos, Campus de la Muralla del Mar, 30202 Cartagena, Spain b Universidad Miguel Herna ´ ndez, Departamento de Ingenierı ´a de Sistemas Industriales, Avenida de la Universidad, s/n 03202 Elche, Spain Received 7 February 2006; received in revised form 14 June 2006; accepted 13 July 2006 Available online 1 September 2006 Abstract The paper presents an analysis of the flow mechanisms in tubes with wire coils using hydrogen bubble visualization and PIV tech- niques. Results have been contrasted with experimental data on pressure drop. The relation between the observed flow patterns and the friction factor has been analysed. The experimental analysis that has been carried out allows one to state that at low Reynolds numbers (Re < 400) the flow in tubes with wire coils is basically similar to the flow in smooth tubes. At Reynolds numbers between 500 and 700 and in short pitch wire coils a recirculating flow appears. The insertion of wires coils in a smooth tube accelerates significantly the transition to turbulence. This is pro- duced at Reynolds numbers between 700 and 1000 depending on the wire pitch. Ó 2006 Elsevier Inc. All rights reserved. Keywords: Heat transfer enhancement; Wire coil inserts; Heat exchangers; Turbulence promoters 1. Introduction Wire coils are a type of inserted elements which present some advantages compared to other enhancement tech- niques, such as artificial roughness by mechanical deforma- tion. They may be installed in an existing smooth tube heat exchanger. They keep the mechanical strength of the smooth tube. Their installation is easy and their cost is very low. The insertion of a device such as a wire coil inside a smooth tube produces an increase in the heat transfer due to one or more of the following phenomena: • Turbulence promotion. Wires attached to the wall cause separation in the flow that increases its turbulence level. They act also as roughness elements mixing up the flow in the viscous sublayer. • Secondary flow promotion. Many inserted devices induce secondary flows which can favour thermal exchange. Helical wire coils produce a helicoidal flow at the periphery superimposed on the main axial flow. Due to the flow velocity increase and to the appearance of centrifugal forces, convection increases. This favours the convection in heating processes. • Hydraulic diameter reduction. Any inserted element in a smooth tube will reduce the cross-sectional area increas- ing the average flow velocity. The wetted perimeter also increases and the hydraulic diameter decreases. Evidence suggests that depending on the wire coil geom- etry and on the Reynolds number, two different types of flows can occur: rotating flow and separated flow. The first one occurs at the tube periphery due to the helix angle and affects to a greater or lesser extent the thickness of the flow. A separated flow can occur due to the fluid crossover through the wire. Most of the experimental works on wire coils focus on the turbulent regime and pay little attention to their 0142-727X/$ - see front matter Ó 2006 Elsevier Inc. All rights reserved. doi:10.1016/j.ijheatfluidflow.2006.07.001 * Corresponding author. E-mail address: [email protected] (A. Garcı ´a). www.elsevier.com/locate/ijhff International Journal of Heat and Fluid Flow 28 (2007) 516–525
Transcript of Flow pattern assessment in tubes with wire coil inserts in laminar and transition regimes
www.elsevier.com/locate/ijhff
International Journal of Heat and Fluid Flow 28 (2007) 516–525
Flow pattern assessment in tubes with wire coil insertsin laminar and transition regimes
A. Garcıa a,*, J.P. Solano a, P.G. Vicente b, A. Viedma a
a Universidad Politecnica de Cartagena, Departamento de Ingenierıa Termica y de Fluidos, Campus de la Muralla del Mar, 30202 Cartagena, Spainb Universidad Miguel Hernandez, Departamento de Ingenierıa de Sistemas Industriales, Avenida de la Universidad, s/n 03202 Elche, Spain
Received 7 February 2006; received in revised form 14 June 2006; accepted 13 July 2006Available online 1 September 2006
Abstract
The paper presents an analysis of the flow mechanisms in tubes with wire coils using hydrogen bubble visualization and PIV tech-niques. Results have been contrasted with experimental data on pressure drop. The relation between the observed flow patterns andthe friction factor has been analysed.
The experimental analysis that has been carried out allows one to state that at low Reynolds numbers (Re < 400) the flow in tubes withwire coils is basically similar to the flow in smooth tubes. At Reynolds numbers between 500 and 700 and in short pitch wire coils arecirculating flow appears. The insertion of wires coils in a smooth tube accelerates significantly the transition to turbulence. This is pro-duced at Reynolds numbers between 700 and 1000 depending on the wire pitch.� 2006 Elsevier Inc. All rights reserved.
Keywords: Heat transfer enhancement; Wire coil inserts; Heat exchangers; Turbulence promoters
1. Introduction
Wire coils are a type of inserted elements which presentsome advantages compared to other enhancement tech-niques, such as artificial roughness by mechanical deforma-tion. They may be installed in an existing smooth tube heatexchanger. They keep the mechanical strength of thesmooth tube. Their installation is easy and their cost is verylow.
The insertion of a device such as a wire coil inside asmooth tube produces an increase in the heat transferdue to one or more of the following phenomena:
• Turbulence promotion. Wires attached to the wall causeseparation in the flow that increases its turbulence level.They act also as roughness elements mixing up the flowin the viscous sublayer.
0142-727X/$ - see front matter � 2006 Elsevier Inc. All rights reserved.
doi:10.1016/j.ijheatfluidflow.2006.07.001
* Corresponding author.E-mail address: [email protected] (A. Garcıa).
• Secondary flow promotion. Many inserted devicesinduce secondary flows which can favour thermalexchange. Helical wire coils produce a helicoidal flowat the periphery superimposed on the main axial flow.Due to the flow velocity increase and to the appearanceof centrifugal forces, convection increases. This favoursthe convection in heating processes.
• Hydraulic diameter reduction. Any inserted element in asmooth tube will reduce the cross-sectional area increas-ing the average flow velocity. The wetted perimeter alsoincreases and the hydraulic diameter decreases.
Evidence suggests that depending on the wire coil geom-etry and on the Reynolds number, two different types offlows can occur: rotating flow and separated flow. The firstone occurs at the tube periphery due to the helix angle andaffects to a greater or lesser extent the thickness of the flow.A separated flow can occur due to the fluid crossoverthrough the wire.
Most of the experimental works on wire coils focuson the turbulent regime and pay little attention to their

Nomenclature
d envelope (maximum inner) diameter (m)e wire diameter (m)lp length of test section between pressure taps
(m)_m mass flow rate (kgs�1)p helical pitch (m)DP pressure drop across the test section (Pa)T temperature (K)
Dimensionless groups
f Fanning friction factorRe Reynolds number
Greek symbols
a helical angle (atan(p)d/p)l dynamic viscosity (Pas)q fluid density(kg m�3)
Subscripts
a augmented tube (wire coil fitted inside a smoothtube)
in tube inletout tube outlets smooth tube
Fig. 1. Visualization facility.
A. Garcıa et al. / Int. J. Heat and Fluid Flow 28 (2007) 516–525 517
behaviour in laminar and transition regimes. It is worthmentioning the experimental studies by Uttarwar and RajaRao (1985) and Inaba et al. (1994) and the state-of-the-artreviews carried out by Wang and Sunden (2002) and mostrecently by Dewan et al. (2004).
An aspect to point out in the analysis of the enhacementtechniques is the general ignorance in relation to the phys-ical flow nature. The flow pattern is responsible for heattransfer enhancement and knowledge of it is very usefulto optimize the geometry of enhancement techniques. Onlythe work by Li et al. (1982) on corrugated tubes and thework by Ravigururajan and Bergles (1994) on wire coilshave paid attention to this important field of study. Ravi-gururajan and Bergles (1994) considered their own paperas a preliminary work on flow visualization on flow withwire coils. They pointed out the necessity of carrying outmore thorough works in order to have quantitative infor-mation on how each variable affects the flow pattern andthus better understanding their influence on heat transferenhancement. They consider that every type of artificialroughness disturbs the flow in a similar way. Thereforethe conclusions for one improvement technique can beextrapolated to another one.
Previous works published on corrugated tubes (Vicenteet al., 2004), on dimpled tubes (Vicente et al., 2002) andwire coils (Garcıa et al., 2005) suggest that each geometrygenerates a particular flow pattern as different transitionsto turbulence in each technique shows. We consider thesuggestion that every artificial roughness disturbs the flowin a similar way to be a simplification that must be handledwith extreme care.
The experimental work carried out by the authors withwire coils (Garcıa et al., 2005) showed that transitional flowin tubes with wire coil inserts is produced gradually, and ina different way to that produced in smooth tubes or even inmechanically deformed tubes. That study was centred onestablishing thermohydraulic behaviour in wire coils anddeveloping design correlations for pressure drop and heattransfer. The results of that work were complete for designpurposes but failed to provide a relation between flow
characteristics and pressure drop and heat transferaugmentation.
This paper studies flow mechanisms by visualizationtechniques in tubes with wire coils. The visualization resultsshow different flow patterns depending on the Reynoldsnumber. These results are contrasted with experimentaldata on pressure drop and show their interrelation.
2. Experimental programme
2.1. Visualization facility
The facility depicted in Fig. 1 was built in order to studythe flow pattern induced by a wire coil inserted in a tube.The main section consists of a 32 mm diameter acrylic tube

518 A. Garcıa et al. / Int. J. Heat and Fluid Flow 28 (2007) 516–525
installed between two reservoir tanks, that stabilize theflow. In the upper reservoir tank the flow temperature isregulated by an electric heater and a thermostat. The flowis impelled from the lower calm deposit to the upper one bya gear pump, which is regulated by a frequency converter.By using mixtures of water and propyleneglycol at temper-atures from 20 �C to 50 �C, Reynolds numbers between 100and 20 000 can be obtained. The tests presented in thiswork were carried out employing a mixture of 50% waterand propyleneglycol at temperatures from 25 �C to 40 �C,yielding Reynolds number in the range from 200 to 3000.Heat losses in the vertical tube were calculated and it wasconfirmed that the velocity field was not modified by buoy-ancy forces in any test.
The test section has been placed at a distance of45 diameters from the tube entrance in order to ensure afully developed flow condition. To improve optical accessin this section, a flat-sided acrylic box was placed aroundthe test section. The box was filled with the same test
Fig. 2. Sketch of hydrogen bubbles visualization technique.
Fig. 3. Sketch of Particle Image Velo
fluid that flows through the test section. Two differentcomplementary visualization techniques have been used:visualization by hydrogen bubbles and by Particle ImageVelocimetry.
The visualization by hydrogen bubbles is a qualitativetechnique that gives a full perception of the flow, inthree-dimensions. Fig. 2 shows a sketch of how this tech-nique has been used. A rear lighting system at 45� has beenused.
A copper-wire cathode placed horizontally crosses thetube diameter. By adjusting its feed voltage value, the cre-ation of an appropriate quantity of bubbles for eachtest was achieved. In order to work with feed voltagesbelow 50 V, the fluid conductivity was increased by addingsalt.
Particle Image Velocimetry (PIV) is a well-knowntechnique to obtain global velocity information, instanta-neously and with high accuracy. In these experimentsplanar slices of the flow field that contained the axis ofthe pipe (longitudinal section) were illuminated, as shownin Fig. 3. The flow was seeded by 50 mu diameter polyam-ide particles. The camera viewed the illuminated planefrom an orthogonal direction and recorded particle imagesat two successive instants in time in order to extract thevelocity over the planar two-dimensional domain. The spa-tial resolution of the measurement is 160 lm/pixel.
A 1 mm thick light sheet is created by a pulsating diodelaser of 808 nm wavelength. A computer synchronizes thecamara shutter opening and the laser shot at the appropi-ate frequency for the test conditions.
Image processing was carried out with the software ‘vid-PIV’, that applies a cross-correlation algorithm betweenconsecutive images. The interrogation window size usedfor PIV processing was 32 · 32 pixels, with a 50% overlap.To obtain a clear velocity field, after the images were cor-related, a global and a local filter were applied to removeoutliers. The resulting vectors were averaged over fifty real-izations. Using the standard formula for 20–1 odds,±1.96rN�0.5, the uncertainty in PIV measurements is
cimetry (PIV) working principle.
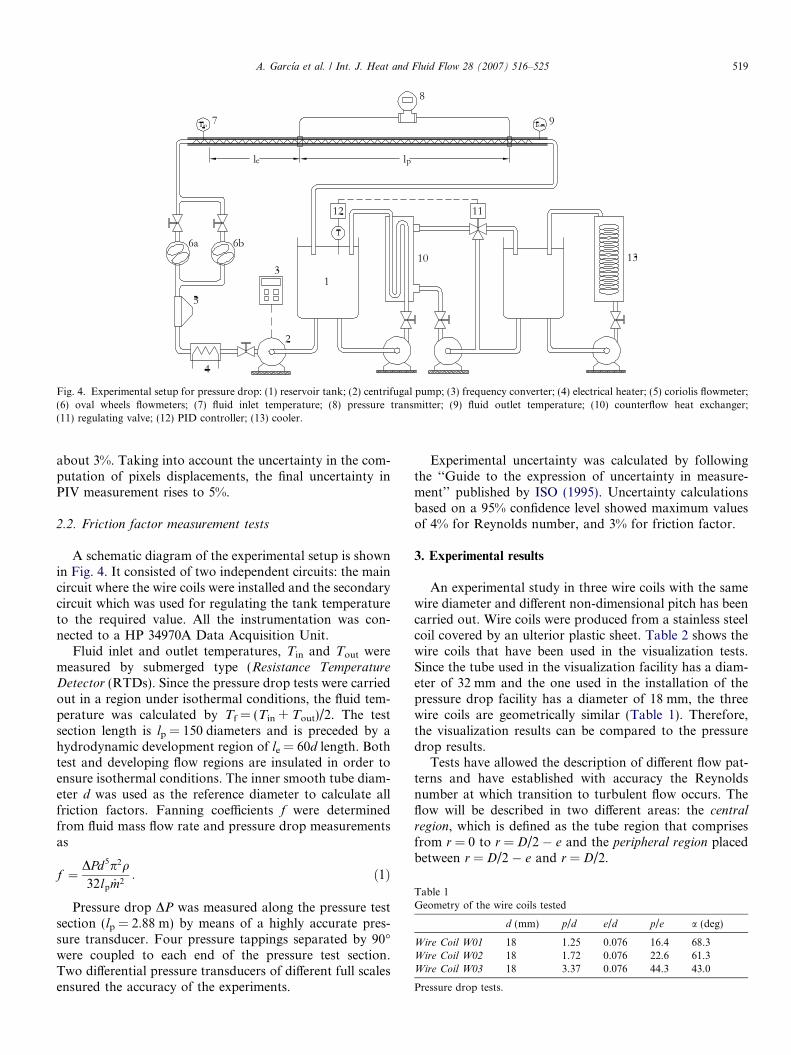
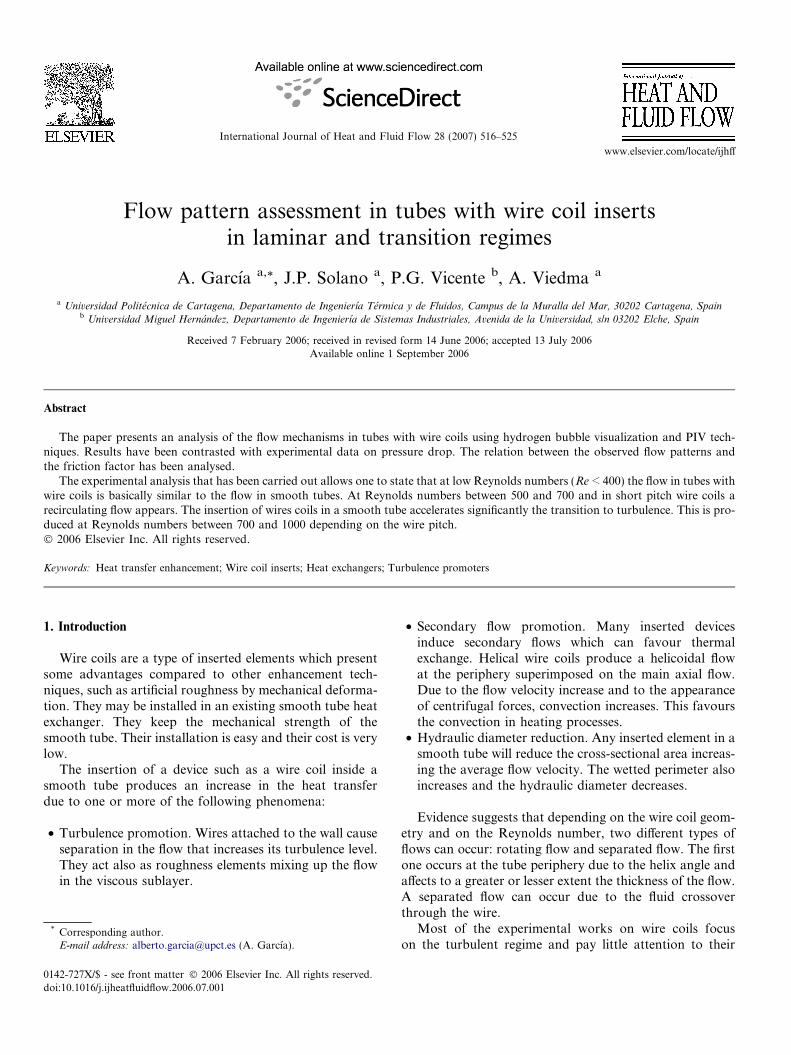
Fig. 4. Experimental setup for pressure drop: (1) reservoir tank; (2) centrifugal pump; (3) frequency converter; (4) electrical heater; (5) coriolis flowmeter;(6) oval wheels flowmeters; (7) fluid inlet temperature; (8) pressure transmitter; (9) fluid outlet temperature; (10) counterflow heat exchanger;(11) regulating valve; (12) PID controller; (13) cooler.
Table 1Geometry of the wire coils tested
d (mm) p/d e/d p/e a (deg)
Wire Coil W01 18 1.25 0.076 16.4 68.3Wire Coil W02 18 1.72 0.076 22.6 61.3Wire Coil W03 18 3.37 0.076 44.3 43.0
Pressure drop tests.
A. Garcıa et al. / Int. J. Heat and Fluid Flow 28 (2007) 516–525 519
about 3%. Taking into account the uncertainty in the com-putation of pixels displacements, the final uncertainty inPIV measurement rises to 5%.
2.2. Friction factor measurement tests
A schematic diagram of the experimental setup is shownin Fig. 4. It consisted of two independent circuits: the maincircuit where the wire coils were installed and the secondarycircuit which was used for regulating the tank temperatureto the required value. All the instrumentation was con-nected to a HP 34970A Data Acquisition Unit.
Fluid inlet and outlet temperatures, Tin and Tout weremeasured by submerged type (Resistance Temperature
Detector (RTDs). Since the pressure drop tests were carriedout in a region under isothermal conditions, the fluid tem-perature was calculated by Tf = (Tin + Tout)/2. The testsection length is lp = 150 diameters and is preceded by ahydrodynamic development region of le = 60d length. Bothtest and developing flow regions are insulated in order toensure isothermal conditions. The inner smooth tube diam-eter d was used as the reference diameter to calculate allfriction factors. Fanning coefficients f were determinedfrom fluid mass flow rate and pressure drop measurementsas
f ¼ DPd5p2q32lp _m2
: ð1Þ
Pressure drop DP was measured along the pressure testsection (lp = 2.88 m) by means of a highly accurate pres-sure transducer. Four pressure tappings separated by 90�were coupled to each end of the pressure test section.Two differential pressure transducers of different full scalesensured the accuracy of the experiments.
Experimental uncertainty was calculated by followingthe ‘‘Guide to the expression of uncertainty in measure-ment’’ published by ISO (1995). Uncertainty calculationsbased on a 95% confidence level showed maximum valuesof 4% for Reynolds number, and 3% for friction factor.
3. Experimental results
An experimental study in three wire coils with the samewire diameter and different non-dimensional pitch has beencarried out. Wire coils were produced from a stainless steelcoil covered by an ulterior plastic sheet. Table 2 shows thewire coils that have been used in the visualization tests.Since the tube used in the visualization facility has a diam-eter of 32 mm and the one used in the installation of thepressure drop facility has a diameter of 18 mm, the threewire coils are geometrically similar (Table 1). Therefore,the visualization results can be compared to the pressuredrop results.
Tests have allowed the description of different flow pat-terns and have established with accuracy the Reynoldsnumber at which transition to turbulent flow occurs. Theflow will be described in two different areas: the central
region, which is defined as the tube region that comprisesfrom r = 0 to r = D/2 � e and the peripheral region placedbetween r = D/2 � e and r = D/2.

Table 2Geometry of the wire coils tested
d (mm) p/d e/d p/e a (deg)
Wire Coil W01 32 1.21 0.073 16.6 68.9Wire Coil W02 32 1.65 0.073 22.6 62.3Wire Coil W03 32 3.66 0.073 50.1 40.6
Visualization tests.
520 A. Garcıa et al. / Int. J. Heat and Fluid Flow 28 (2007) 516–525
Before the wire coils were tested, a series of tests wascarried out in the smooth tube in order to verify the correctoperation of both experimental installations.
3.1. Smooth tube
The flow visualization in a smooth tube by means of thehydrogen bubbles allows one to establish when the flowstarts to become unstable and how the transition to the tur-bulent regime is produced.
Fig. 5 shows the friction factor results obtained underisothermal conditions depending on the Reynolds number.Experimental results in laminar regime are compared withthe analytical solution (fs = 16/Re) and results in turbulentregime are compared with the Blasius equation (fs = 0.0791Re�0.25). Deviations were lower than 4% for the 95% of theexperimental data. These tests served to the adjustment andverification of the experimental installation.
Next the results obtained from the hydrogen bubblesvisualization along with the pressure drop results arecommented:
• I. Reynolds number range from 100 to 1800. Stable lam-inar flow, parabolic velocity profile. Friction factorresults adjust perfectly to the curve fs = 16/Re.
• II. Reynolds number range from 1800 to 2100. Laminarflow with light flow oscillations. At Re � 2000 the pres-ence of turbulence outbreaks is appreciated.
• III. Reynolds number range higher than 2100. Turbu-lence is clearly established. From the flow visualizationby means of the hydrogen bubbles, the break point at
101 102 103 104 105103
102
101
Reynolds number, Re
Fric
tion
fact
or, f
I II III
SMOOTH TUBE
f=16/Re
f=0.079 Re0.25
Fig. 5. Fanning friction factor vs. Reynolds number (smooth tube).
Re = 2100 was established. In the friction factor curvea minimum at 2100 is observed. Moreover, a quite sud-den friction factor increasement due to the transitionfrom laminar to turbulent flow is found.
In order to adjust and verify the PIV system, some mea-surements of the velocity field in the smooth tube werecarried out. From the processing of 50 images taken at100 fps (100 frames per second), the velocity profile thatappears in Fig. 6 has been obtained. The velocity profileis made non-dimensional by using the flow average velocitywhich is calculated by means of the average flow rate in theinstallation.
The non-dimensional velocity profile achieved adjuststo the theoretical result in most of the tube diameter.The velocity data taken in the nearest region to the wallshow deviations. In this region there is light reflection inthe tube and it is difficult to measure very low velocitiesusing the PIV technique, since it is based on particledisplacement.
3.2. Wire Coil W01, short pitch
The flow characterization in the wire coil has been car-ried out using the fluid visualization by means of hydrogenbubbles and the velocity profile measurement by the PIVtechnique. On a qualitative level, images have served toshow the flow pattern based on the Reynolds numberand to establish the point where transition occurs. Theanalysis of the general flow structure is carried out simulta-neously with the analysis of the friction factor results(Fig. 7).
Four different types of flow structure for the followingReynolds number ranges have been observed:
• I. Reynolds numbers from 0 to 350:
This is a stable laminar flow where the fluid in theperipheral region goes through the wire coil without anytype of recirculation.
–0.5 –0.4 –0.3 –0.2 –0.1 0 0.1 0.2 0.3 0.4 0.50
0.5
1
1.5
2
2.5
r/D
U/U
med
Fig. 6. Velocity profile in the smooth tube obtained by PIV at Reynoldsnumber Re = 370.

101 102 103 104 10510–3
10–2
10–1
Reynolds number, Re
Fric
tion
fact
or,f
I II III IV
WIRE COIL W01p/d=1.25, e/d=0.076, p/e=16.4
Fig. 7. Fanning friction factor vs. Reynolds number. Wire coil W01results.
A. Garcıa et al. / Int. J. Heat and Fluid Flow 28 (2007) 516–525 521
Fig. 8 shows a sketch of the flow pattern at Reynoldsnumbers below 350. It is observed that in the peripheral
region (D/2 � e < r < D/2) the flow remains attached (sep-aration downstream the wire is not produced).
The flow in the central region remains almostunchanged. Visualization by hydrogen bubbles (Fig. 9)shows an ascending stable laminar flow, where there is onlyan azimuthal velocity component that spins the bubble cur-tain which is produced by the copper wire. Though itappears that the bubble curtain becomes narrower, it is justa spin of this, as the 2-D and 3-D flow sketches show. Thecentral flow spin depends on the Reynolds number: atRe = 200 the central flow spins 90� along 20 diameterswhereas at Re = 350 the 90� spin occurs along 10 diame-ters. It can be clearly stated that the flow pattern in thecentral region is similar to the one that occurs in asmooth tube with a light spin that hardly affects the flowbehaviour.
Fig. 8. Flow features for wire coil W01 at Re < 350. Left: central flow.Right: flow in the peripheral region.
The wire coil is an inserted element which reduces thetube cross section and increases the average flow veloc-ity. The velocity increases due to the cross section reduc-tion produced by the wire coil is just a 2%, which ispractically negligible. Using the PIV technique the veloc-ity field in the central flow region has been measured(Fig. 10). Velocity in the tube axis is 15% higher thanwhich that occurs in a smooth tube without wire coils.Therefore, it can be stated that the wire coil geometryproduces an important flow variation, even in the lami-nar regime.
The variation of the velocity profile shape which thewire coil produces results in a friction factor increase.For Reynolds numbers lower than 350 the friction factorcan be correlated by
f ¼ 14:5=Re0:93: ð2Þ
• II. Reynolds numbers from 350 to 500:
Visualization by hydrogen bubbles shows a stable lami-nar flow and recirculation downstream of the wire isobserved. This recirculation together with the azimuthalvelocity component produces a helical flow which ascendsalong the wire coil body. Fig. 11 shows a sketch of the flowpattern observed: the flow separation downstream the wireobserved in the left drawn yields to a helicoical flow in theperipheral region (r = D/2 � e to r = D/2) represented inthe right hand sketch.
The central flow remains laminar and shows a 90� spinalong 10 diameters of the tube. Recirculation downstreamto the wire produces a perceptible pressure drop increase.In this region the fricton factor is proportional to Re�0.55
instead Re�1 as occurs in the smooth tube. At Re = 500,the friction factor is 60% higher to the friction factor inthe smooth tube.
• III. Reynolds numbers from 500 to 700:
The general flow topology is similar to that of region II,except that the central flow becomes oscillatory. AtRe = 500, it is observed that the central flow oscillatesand seems to be a laminar undulating flow. At Re = 600flashes of turbulent flow are observed. These are turbulenceoutbreaks. At Re = 650 the central flow is in a turbulent-transitional regime. The flow at the peripheral region fol-lows mostly the helix angle directon. At Re = 700 the flowis fully turbulent.
Friction factor becomes almost constant. This meansthat the pressure drop is proportional to the mean squarevelocity (a typical solution of turbulent flows). Given theflow structure in the transitional region to turbulence, thisis produced smoothly without any kind of discontinuity. Infact, in the pressure drop tests, the transitional pointcannot be established (just as occurs in the smooth tubetests).

Fig. 9. Central flow for wire coil W01 at Re < 350. Visualization by hydrogen bubbles.
–0.5 –0.4 –0.3 –0.2 –0.1 0 0.1 0.2 0.3 0.4 0.50
0.5
1
1.5
2
2.5
S1
U/U
med
–0.5 –0.4 –0.3 –0.2 –0.1 0 0.1 0.2 0.3 0.4 0.50
0.5
1
1.5
2
2.5
S2
U/U
med
–0.5 –0.4 –0.3 –0.2 –0.1 0 0.1 0.2 0.3 0.4 0.50
0.5
1
1.5
2
2.5
S3
r/D
U/U
med
Fig. 10. Flow visualization of wire coil W01 processed by PIV technique.
522 A. Garcıa et al. / Int. J. Heat and Fluid Flow 28 (2007) 516–525

Fig. 11. Flow features for wire coil W01 at Re = 350–500. Left: centralflow. Right: flow in the peripheral region.
A. Garcıa et al. / Int. J. Heat and Fluid Flow 28 (2007) 516–525 523
• IV. Reynolds numbers higher than 700:
Turbulence is clearly established. Visualization byhydrogen bubbles shows a strong blend of these and vortexflow structures, typical of turbulent flow. The flow at theperipheral region follows the direction of the wire pitch.Flow observation is difficult due to the strong blend ofthe peripheral and central flows.
Results make it possible to state that for the sameReynolds number, the turbulence level in a wire coilis much higher than that in a smooth tube. At Re =3000 the friction factor produced by the wire coil W01is five times higher than that of the smooth tube.From this Reynolds number on, the tendency of the fric-tion factor curve is to follow the typical behaviour ofturbulent flow on structured rough surfaces (f /Re�0.2).
101
102
103
104
105
10–3
10–2
10–1
Reynolds number, Re
Fric
tion
fact
or, f
I II III IV
WIRE COIL W02p/d=1.72, e/d=0.076, p/e=22.6
Fig. 12. Fanning friction factor vs. Reynolds number. Wire coil W02results.
3.3. Wire Coil W02, intermediate pitch
Wire coil W02 has a larger non-dimensional pitch p/dthan W01. Features observed in wires W01 and W02 arevery similar. In W02 transitions among the different flowpatterns occur at slightly higher Reynolds numbers.
Fig. 12 shows results for the pressure drop at Reynoldsnumbers between 50 and 70 000. Next, results for the fric-tion factor together with visualization results for the fol-lowing Reynolds numbers range are commented upon:
• I. Reynolds numbers lower than 400:Stable laminar flow. The flow in the wire region passesover the wire without any type of recirculation. A smallincrease in the friction factor is obtained. This can becorrelated by:
f ¼ 14:8=Re0:95 ð3Þ• II. Reynolds numbers from 400 to 550:
A recirculation downstream of the wire is observed. Thisrecirculation along with the azimuthal component of theflow in this area produces a helical flow which is similarto the one observed in wire coil W01 (Fig. 11). Increaseof the friction factor goes from 25% at Re = 400 to 45%at Re = 500.
• III. Reynolds numbers from 550 to 750:Oscillating central flow. At Re = 550 a smooth undulat-ing flow is observed. At Re = 600, the flow remains lam-inar but the flow oscillations become more abrupt.
• IV. Reynolds numbers higher than Re = 750:The flow is fully turbulent. From Re = 750 to Re = 3000the friction factor is almost constant and similar tof = 0.04. A constant friction factor value implies thatthe pressure drop is proportional to the flow meansquare of the mean flow velocity. This is typical for tur-bulent flow. From Re = 3000 on, the tendency is for thefriction factor to become typical of flow in tubes withstructured roughness (f / Re�0.2).
3.4. Wire Coil W03, long pitch
This is a very long pitch wire coil with p/d = 3.66 (threetimes longer than wire coil W01). Features for the flow ofthis wire are different to those of the previous two wires.A separated flow is not produced. Instead the flow at theperipheral region follows an angle near to that of the helix.
Fig. 13 shows experimental results for the pressure dropfor a Reynolds number range between 50 and 80 000. Next,results for the three flow patterns observed are commentedupon:
• I. Reynolds numbers between 0 and 700:Stable laminar flow. The flow of the wire region passesthrough the wire without any type of recirculation.Friction factor results in this region can be correlatedby:
FigRig
101 102
103
104
105
10–3
10–2
10–1
Reynolds number, Re
Fric
tion
fact
or, f
I II III
WIRE COIL W03p/d=3.37, e/d=0.076, p/e=44.3
Fig. 13. Fanning friction factor vs. Reynolds number. Wire coil W03results.
524 A. Garcıa et al. / Int. J. Heat and Fluid Flow 28 (2007) 516–525
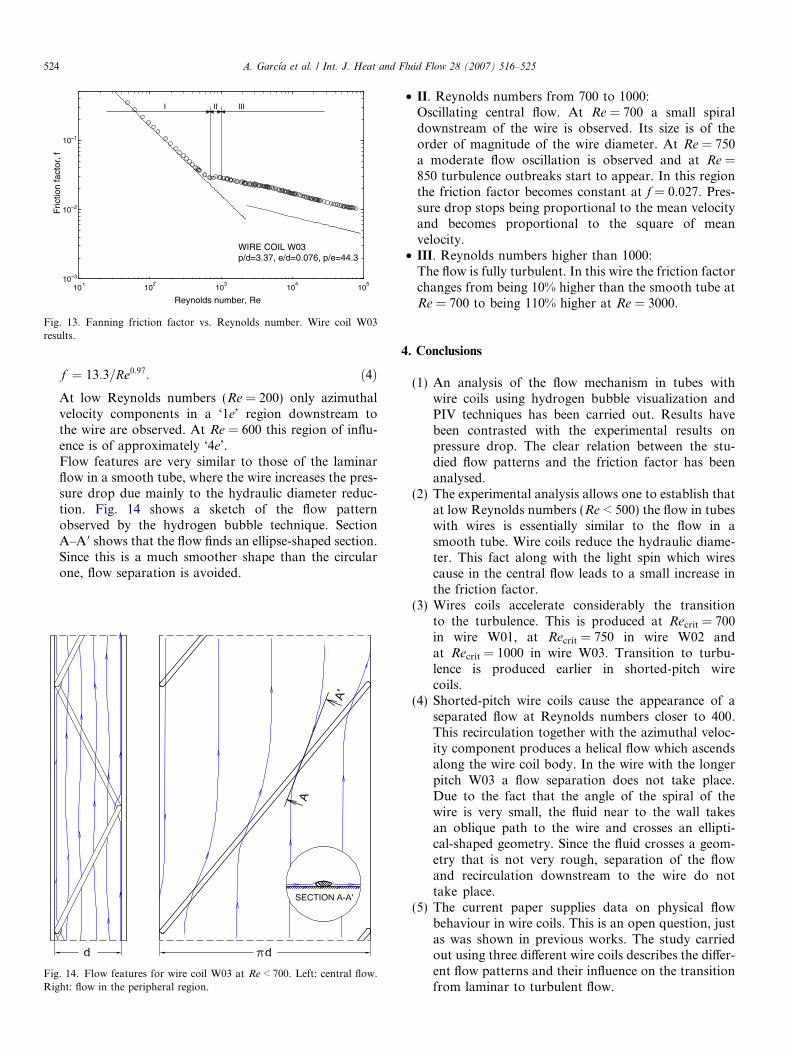
f ¼ 13:3=Re0:97: ð4ÞAt low Reynolds numbers (Re = 200) only azimuthalvelocity components in a ‘1e’ region downstream tothe wire are observed. At Re = 600 this region of influ-ence is of approximately ‘4e’.Flow features are very similar to those of the laminarflow in a smooth tube, where the wire increases the pres-sure drop due mainly to the hydraulic diameter reduc-tion. Fig. 14 shows a sketch of the flow patternobserved by the hydrogen bubble technique. SectionA–A 0 shows that the flow finds an ellipse-shaped section.Since this is a much smoother shape than the circularone, flow separation is avoided.
. 14. Flow features for wire coil W03 at Re < 700. Left: central flow.ht: flow in the peripheral region.
• II. Reynolds numbers from 700 to 1000:Oscillating central flow. At Re = 700 a small spiraldownstream of the wire is observed. Its size is of theorder of magnitude of the wire diameter. At Re = 750a moderate flow oscillation is observed and at Re =850 turbulence outbreaks start to appear. In this regionthe friction factor becomes constant at f = 0.027. Pres-sure drop stops being proportional to the mean velocityand becomes proportional to the square of meanvelocity.
• III. Reynolds numbers higher than 1000:The flow is fully turbulent. In this wire the friction factorchanges from being 10% higher than the smooth tube atRe = 700 to being 110% higher at Re = 3000.
4. Conclusions
(1) An analysis of the flow mechanism in tubes withwire coils using hydrogen bubble visualization andPIV techniques has been carried out. Results havebeen contrasted with the experimental results onpressure drop. The clear relation between the stu-died flow patterns and the friction factor has beenanalysed.
(2) The experimental analysis allows one to establish thatat low Reynolds numbers (Re < 500) the flow in tubeswith wires is essentially similar to the flow in asmooth tube. Wire coils reduce the hydraulic diame-ter. This fact along with the light spin which wirescause in the central flow leads to a small increase inthe friction factor.
(3) Wires coils accelerate considerably the transitionto the turbulence. This is produced at Recrit = 700in wire W01, at Recrit = 750 in wire W02 andat Recrit = 1000 in wire W03. Transition to turbu-lence is produced earlier in shorted-pitch wirecoils.
(4) Shorted-pitch wire coils cause the appearance of aseparated flow at Reynolds numbers closer to 400.This recirculation together with the azimuthal veloc-ity component produces a helical flow which ascendsalong the wire coil body. In the wire with the longerpitch W03 a flow separation does not take place.Due to the fact that the angle of the spiral of thewire is very small, the fluid near to the wall takesan oblique path to the wire and crosses an ellipti-cal-shaped geometry. Since the fluid crosses a geom-etry that is not very rough, separation of the flowand recirculation downstream to the wire do nottake place.
(5) The current paper supplies data on physical flowbehaviour in wire coils. This is an open question, justas was shown in previous works. The study carriedout using three different wire coils describes the differ-ent flow patterns and their influence on the transitionfrom laminar to turbulent flow.

A. Garcıa et al. / Int. J. Heat and Fluid Flow 28 (2007) 516–525 525
Acknowledgement
This research has been partially financed by theDPI2003-07783-C02 grant of the ‘‘Direccion General deInvestigacion del Ministerio de Educacion y Ciencia deEspana’’ and the ‘‘HRS Spiratube’’ company.
Appendix A. Supplementary data
Supplementary data associated with this article canbe found, in the online version, at doi:10.1016/j.ijheatfluidflow.2006.07.001.
References
Dewan, A.., Mahanta, P., Sumithra Raju, K., Suresh Kumar, P., 2004.Review of pasive heat transfer augmentation techniques. In: Proceed-ings of INSTN Mechanical Engineers. Par A: J. Power and Energy,vol. 218.
Garcıa, A., Vicente, P.G., Viedma, A., 2005. Experimental study of heattransfer enhancement with wire coil inserts in laminar-transition-turbulent regimes at different Prandtl numbers. International Journalof Heat and Mass Transfer 48, 4640–4651.
Inaba, H., Ozaki, K., Kanakoa, S., 1994. A fundamental study of heattransfer enhancement and flow-drag reduction in tubes by means of
wire coil insert, Nippon Kikai Gakkai Ronbunshu. Transact. the JpnSoci. Mech. Enginrs 60, 240–247.
ISO, 1995. Guide to the expression of uncertainty in measurement, firsted., ISBN 92-67-10-188-9, International Organization for Standariza-tion, Switzerland.
Li, H.M., Ye, K.S., Tan, Y.K., Deng, S.J., 1982. Investigation on Tube-Side Flow Visualization, Friction Factors and Heat Transfer Charac-teristics of Helical-Ridging Tubes. In: Grigull, U. et al. (Eds.), HeatTransfer 1982, Proceedings, Seventh International Heat TransferConference, vol. 3. Hemisphere Publishing Corp., Washington, D.C,pp. 75–80.
Ravigururajan, T.S., Bergles, A.E., 1994. Visualization of flow phenomenanear enhanced surfaces. Journal of Heat Transfer 116, 54–57.
Uttarwar, S.B., Raja Rao, M., 1985. Augmentation of laminar flow heattransfer in tubes by means of wire coil inserts. Transactions of theASME 107, 930–935.
Vicente, P.G., Garcıa, A., Viedma, A., 2002. Experimental study of mixedconvection and pressure drop in helically dimpled tubes for laminarand transition flow. International Journal of Heat and Mass Transfer45, 5091–5105.
Vicente, P.G., Garcıa, A., Viedma, A., 2004. Mixed convection heattransfer and isothermal pressure drop in corrugated tubes for laminarand transition flow. International Communications of Heat and MassTransfer 31, 651–662.
Wang, L., Sunden, B., 2002. Performance comparison of some tubeinserts. International Communications of Heat and Mass Transfer 29(1), 45–56.
![arXiv:1312.2787v1 [physics.flu-dyn] 10 Dec 2013 · STEADY AND PERIODIC REGIMES OF LAMINAR FLOW AROUND THE ROTATING CYLINDER E:I:Kalinin & A:B:Mazo KazanFederalUniversity,18 KremlyovskayaStreet,Kazan420008,](https://static.fdocuments.in/doc/165x107/60351c9a56c1c959220a34dd/arxiv13122787v1-10-dec-2013-steady-and-periodic-regimes-of-laminar-flow-around.jpg)


![Comparative analysis of heat exchanger with different inserts...wall heat flux,Applied Science Research 29 (1974) 401–418. [4] M. Akiyama, K.C. Cheng, Laminar forced convection in](https://static.fdocuments.in/doc/165x107/60ffa4de797757787b6b2ddb/comparative-analysis-of-heat-exchanger-with-different-inserts-wall-heat-fluxapplied.jpg)