FLOW INVESTIGATION OF THE NISQUALLY RIVER … · WAC also established minimum flows for control...
32
FLOW INVESTIGATION OF THE NISQUALLY RIVER LOWER REACH THURSTON COUNTY, WASHINGTON November 2001 Publication No. 01-11-015 printed on recycled paper
-
Upload
hoangkhanh -
Category
Documents
-
view
214 -
download
0
Transcript of FLOW INVESTIGATION OF THE NISQUALLY RIVER … · WAC also established minimum flows for control...
FLOW INVESTIGATION OF THENISQUALLY RIVER LOWER REACH
THURSTON COUNTY, WASHINGTON
November 2001
Publication No. 01-11-015printed on recycled paper

This report is available on the Department of Ecology home page on theWorld Wide Web at http://www.ecy.wa.gov/biblio/0111015.html
For additional copies of this publication, please contact:
Department of Ecology Publications Distributions OfficeAddress: PO Box 47600, Olympia WA 98504-7600E-mail: [email protected]: (360) 407-7472
Refer to Publication Number 01-11-015
The Department of Ecology is an equal opportunity agency and does notdiscriminate on the basis of race, creed, color, disability, age, religion, nationalorigin, sex, marital status, disabled veteran's status, Vietnam era veteran's status,or sexual orientation.
If you have special accommodation needs or require this document in alternativeformat, please contact Joan LeTourneau, Environmental Assessment Program, at(360)-407-6764 (voice). Ecology's telecommunications device for the deaf(TDD) number at Ecology Headquarters is (360) 407-6006.

FLOW INVESTIGATION OF THENISQUALLY RIVER LOWER REACH
THURSTON COUNTY, WASHINGTON
byTom Culhane
Water Resources ProgramOlympia, Washington 98504-7710
November 2001
Water Resource Inventory Area 11
Publication No. 01-11-015printed on recycled paper


Page i
Table of ContentsPage
List of Figures and Tables .................................................................................................. ii
Abstract .............................................................................................................................. iii
Acknowledgements............................................................................................................ iv
Introduction..........................................................................................................................1Background....................................................................................................................1Previous Attempts at Determining Lower Nisqually Flows ..........................................4
Methods of Investigation .....................................................................................................4
Factors Affecting Flows.......................................................................................................5Snowpack on Mount Rainier .........................................................................................7Alder Dam......................................................................................................................7Other Basin Precipitation...............................................................................................9Other Surface Water Contributions ...............................................................................9
Analysis of Flow Data .......................................................................................................12Ecology Data versus Established Minimum Flows .....................................................12Potential Errors in Streamflow Measurements ............................................................14
Analysis of Historical Flows..............................................................................................15Relationship between Ecology Data and Upstream Flows ..........................................15Historical Data Versus Established Minimum Flows..................................................17
Discussion and Conclusions ..............................................................................................19
Selected References ...........................................................................................................24

Page ii
List of Figures and Tables Page
Figures
1. Location of Nisqually River and gages..........................................................................2
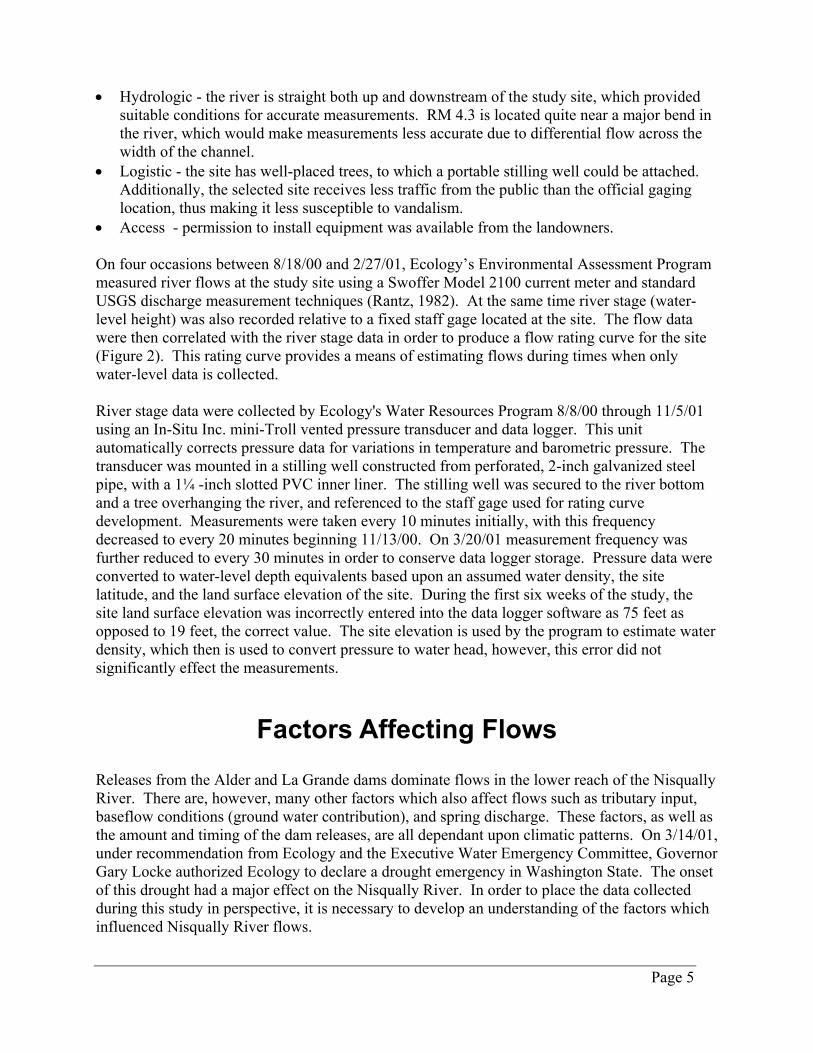
2. Flow rating curve for Nisqually River RM 4.6 site .......................................................6
3. Estimated Alder Lake inflows October 1999 - October 2001 (Tacoma Power)............8
4. Olympia airport precipitation (National Weather Service)..........................................10
5. Flows in Muck Creek at Roy April 2000 - February 2001 (CH2M/Hill, 2000)..........11
6. Nisqually River flows 8/8/00 - 11/6/01 at RM 4.6 ......................................................13
7. Daily Nisqually River RM 4.6 flows and combined USGS flows 8/9/00 - 11/5/01....16
8. Correlation between Ecology RM 4.6 data and USGS upstream data ........................18
9. Actual Nisqually River RM 4.6 flows and flows generated by the power equation ...20
Tables
1. Nisqually River RM 4.3 minimum instream flows........................................................1
2. FERC-related minimum instream flows ........................................................................3
3. Nisqually River RM 26.2 minimum instream flows......................................................3

Page iii
AbstractIn 1988 Chapter 173-511 Washington Administrative Code (WAC) established minimuminstream flow requirements for the lower reach of the Nisqually River. This WAC referenced ariver mile (RM) 4.3 control point, however, a gage at this location was never established. TheDepartment of Ecology (Ecology) is required to consider instream flows when acting upon waterapplications within the watershed. Consequently, the purpose of this study was to collect andanalyze data for this location to determine whether instream flows were being met. Furthermore,by comparing these data with those collected by the U.S. Geological Survey (USGS) upstream, arelationship was sought which could be used to analyze whether RM 4.3 minimum flows havebeen met in the past and are being met in the future.
Due to hydrologic, logistic and access considerations, the site measured during this study waslocated at RM 4.6. The study method included developing a rating curve based on dischargemeasurements collected with a Swoffer flow meter on four occasions. A vented pressuretransducer was also used to collect stage data from 8/8/00 through 11/5/01, excepting a four-hourhiatus on 8/17/00, a 32-day hiatus from 12/1/00 to 1/2/01, and a 1-day hiatus on 3/1/01. A linearcorrection factor was then applied to account for instrumentation drift, and stage data wereconverted to flows by means of the flow rating curve.
In November of 2000 Washington State moved into a period of drought and Tacoma Powerdropped its releases from Alder Lake. This reduction resulted in a decline in flows measured atthe RM 4.6 site. Nonetheless, the data collected suggests that Nisqually River flows were abovethe established minimum flows during all but portions of six days during the gaged period.Based on the potential for streamflow measurement error, there is actually a range of 0 toportions of 31 days over which minimum flows might not have been met. The timing of the 32-day data gap when the gaging equipment was removed makes it possible that there wereadditional days when minimum instream flows were not met.
The combined flows at the upstream USGS 12089208 and 12089500 gages were used as anindication of flows at the RM 4.6 site. A comparison indicates a shift from higher upstream tohigher downstream flows starting in November 2000. There are many possible causes for thisincluding measurement errors, and changes in tributary contribution, bluff seepage, and powercanal seepage - as well as any influences caused by the drought.
Regression analyses of the RM 4.6 flow data versus the combined upstream data were used todevelop a tool for predicting whether Nisqually River instream flows likely have been met in thepast. These analyses produced the equation y = 19.85x0.5792, where y equals the expected flowsnear RM 4.6 and x equals the combined data from the two USGS gages. Based on the historicalupstream flow data and this equation, WAC 173-511 minimum instream flows were met all daysat RM 4.3 from 6/9/88 through 8/8/00. This equation failed to detect the failure to meetminimum flows during January of 2001 (suggested by the corrected Ecology data) and the likelyfailure to meet minimum flows during December 2000 (suggested by the combined raw USGSupstream data). Consequently results produced by this equation are not entirely accurate.

Page iv
AcknowledgementsThe author wishes to thank Ecology's Environmental Assistance Program, and particularly BradHopkins, for producing the rating curve which was essential to measuring the river flows.Additionally, I wish to thank both Kirk Sinclair and Chris Neumiller who provided thoughtfulreview and input regarding this report.

Page 1
IntroductionThe Nisqually River drains the 720 square mile area of Water Resource Inventory Area (WRIA)11. In 1988 Chapter 173-511 Washington Administrative Code (WAC) established an InstreamResources Protection Program (IRPP) for the basin. The WAC divides the river into fourreaches and establishes minimum instream flow requirements or partial-year closures for each.This report focuses on the farthest downstream reach, which extends from the farthest upstreaminfluence of mean annual high tide at river mile (RM) 4.3, to the outlet of the Centralia CityLight power plant at RM 12.6 (Figure 1). The WAC identifies the control point for this reach as"New gage Nisqually River,” but a gaging station was never established at this location.
The Department of Ecology (Ecology) is required to consider instream flows when acting uponsurface or ground water applications within the watershed. The purpose of this study was tocollect and analyze data from the designated control point to determine whether Nisqually Riverinstream flows were being met. Furthermore, by comparing these data with those collected bythe U.S. Geological Survey (USGS) upstream, a relationship was sought which could be appliedto the USGS data to analyze whether instream flows likely have been met in the past. Thisrelationship will also be available to determine whether flows are being met in the future.
Initially the plan was to conduct flow monitoring at the study site for one year starting in August2000. When preliminary results were presented to the WRIA 11 Watershed Planning Committeeon 5/9/01, however, this group asked that measurements continue at least through one additionaldry season. For this reason the data collection period was extended through October 2001.
BackgroundChapter 173-5-11 WAC specifies the following minimum instream flows for the "New gageNisqually River":
Table 1. Nisqually River RM 4.3 minimum instream flows.Month Day Flow (cfs) Month Day Flow (cfs)Januray 1 900 July 1 800
15 900 15 800February 1 900 August 1 800
15 900 15 800March 1 900 September 1 600
15 900 15 600April 1 900 October 1 700
15 900 15 700May 1 900 November 1 700
15 900 15 700June 1 900 December 1 800
15 850 15 900

Page 2
Figu
re 1
. Lo
catio
n of
Nis
qual
ly R
iver
and
gag
es.

Page 3
The purpose of these flows is to retain perennial rivers, streams, and lakes in the Nisqually Basinwith instream flows and levels necessary to provide protection for wildlife, fish, scenic,aesthetic, environmental values, recreation, navigation, and to preserve water quality. The WACprohibits further surface water withdrawals during times when these flows are not met. TheWAC also established minimum flows for control points for three upstream reaches of the river.
Flows in the Nisqually River are heavily influenced by operation of the Alder and La Grandedams, as well as the river diversion through the Centralia City Light power project. Theseprojects were built prior to establishment of Chapter 173-511 WAC and thus are not subject tothe WAC's minimum flows. These projects are, however, regulated by the Federal EnergyRegulatory Commission (FERC). According to FERC Docket No. P-1862-001, stipulation andsettlement agreements between the Tacoma Power subdivision of Tacoma Public Utilities andthe Nisqually Tribe, and also between Centralia City Light and the Nisqually Tribe, establishedminimum flow levels outside those set forth in the WAC. Accordingly, flows in the bypasssection and the Nisqually River mainstem from the La Grande powerhouse (RM 40.8) to theCentralia City Light power canal diversion (RM 26.2) are established in the docket as follows:
Table 2. FERC-related minimum instream flows.Bypass Mainstem
October 1 - December 15 550 cfs 700 cfsDecember 16 - May 31 600 cfs 900 cfsJune 1 - July 31 500 cfs 750 cfsAugust 1 - September 30 370 cfs 575 cfs
As a result of these agreements, Tacoma's releases at the La Grande Dam must be sufficient, "sothat the flow in the mainstem portion of this Nisqually River, measured as flow reaching theYelm Project Diversion Dam, shall at all times equal or exceed the greater of: (a) those flowsspecified in paragraph (1) above for the bypass, less 120 cfs, plus the lesser of 720 cfs or thecalculated natural inflow at the Yelm Project Diversion Dam; or (b) the flows specified inparagraph (1) above for the mainstem." By comparison, the WAC's minimum flows for nearlythe same "Mid Reach" of the Nisqually River (from RM 40.4 to RM 26.2) are as follows:
Table 3. Nisqually River RM 26.2 minimum instream flows.
Month Day Flow (cfs) Month Day Flow (cfs)Januray 1 900 July 1 800 (closed)
15 900 15 800 (closed)February 1 900 August 1 800 (closed)
15 900 15 650 (closed) March 1 900 September 1 600 (closed)
15 900 15 600 (closed) April 1 900 October 1 700 (closed)
15 900 15 700 (closed) May 1 900 November 1 700
15 900 15 700June 1 800 (closed) December 1 800
15 800 (closed) 15 900

Page 4
Flows for the intervening dates not specified in the WAC, ramp gradationally between thepreceding and subsequent flows specified in this table. The control point for these flows wasestablished as gage 12086500, which has not existed since 1979. Further complicating matters isthe fact that the WAC control point was located at RM 32.6, while the FERC docket controlpoint is the Yelm Project Diversion Dam located at RM 26.2. The 120 cfs figure mentioned inthe docket, presumably is meant to account for the influence of tributary inputs above thediversion dam. Nonetheless, the differences in minimum flows and control points in the WACversus those established for Tacoma, make it difficult to compare the two.
Previous Attempts at Determining Lower Nisqually FlowsThe nearest locations on the Nisqually River system continuously gaged by the USGS are a gageon the Nisqually River located near McKenna at RM 21.8 (Station Number 12089500) and agage on the Centralia City Light power canal diversion, which returns water to the Nisqually atRM 12.6 (Station Number 12089208). These locations are considerably upstream of the RM 4.3control point for the lower reach of the Nisqually River established in the WAC. Below thesecontrol points, the Nisqually receives local inflows from perennial springs, baseflow, and othersources, including Muck Creek at RM 10.6.
Between 1959 and 1991 the USGS collected 11 sets of non-storm event, miscellaneous dischargemeasurements at the Nisqually River I-5 bridge (approximately RM 2.4). In 1998 NorthwestHydraulic Consultants, subcontracting to Pacific Groundwater Group (PGG), calculated monthlyflow duration plots by performing a regression analysis on this miscellaneous data and McKennaand Centralia City Light power canal gage data collected by the USGS. The results arepresented in the 1998 PGG report, McAllister Springs Wellfield – Phase II SupplementalAnalysis of Pumping Effects and Proposed Mitigation. Based on their analysis for April 1979through June 1994, there were no significant violations of minimum instream flows for mostmonths, with minor exceptions in August. There are concerns regarding this analyses, however,due to limited downstream data points and the possibility that the downstream data may havebeen tidally influenced. Consequently, while this analysis provides a useful estimate based uponthe available information, it is inadequate for regulatory purposes.
Methods of InvestigationThe WAC identifies the control point for the lower reach of the Nisqually River as being locatedat RM 4.3 in Section 9, T. 18 N., R. 1 E. The river mile index for the Nisqually River publishedby the Pacific Northwest River Basins Commission (1989) indicates that the Northern PacificRailroad bridge crosses the river at RM 3.8. The site measured during this study is locatedupstream of this crossing, at approximately RM 4.6. This site located slightly upstream of theofficial control point was selected based upon the following considerations:
Page 5
• Hydrologic - the river is straight both up and downstream of the study site, which providedsuitable conditions for accurate measurements. RM 4.3 is located quite near a major bend inthe river, which would make measurements less accurate due to differential flow across thewidth of the channel.
• Logistic - the site has well-placed trees, to which a portable stilling well could be attached.Additionally, the selected site receives less traffic from the public than the official gaginglocation, thus making it less susceptible to vandalism.
• Access - permission to install equipment was available from the landowners.
On four occasions between 8/18/00 and 2/27/01, Ecology’s Environmental Assessment Programmeasured river flows at the study site using a Swoffer Model 2100 current meter and standardUSGS discharge measurement techniques (Rantz, 1982). At the same time river stage (water-level height) was also recorded relative to a fixed staff gage located at the site. The flow datawere then correlated with the river stage data in order to produce a flow rating curve for the site(Figure 2). This rating curve provides a means of estimating flows during times when onlywater-level data is collected.
River stage data were collected by Ecology's Water Resources Program 8/8/00 through 11/5/01using an In-Situ Inc. mini-Troll vented pressure transducer and data logger. This unitautomatically corrects pressure data for variations in temperature and barometric pressure. Thetransducer was mounted in a stilling well constructed from perforated, 2-inch galvanized steelpipe, with a 1¼ -inch slotted PVC inner liner. The stilling well was secured to the river bottomand a tree overhanging the river, and referenced to the staff gage used for rating curvedevelopment. Measurements were taken every 10 minutes initially, with this frequencydecreased to every 20 minutes beginning 11/13/00. On 3/20/01 measurement frequency wasfurther reduced to every 30 minutes in order to conserve data logger storage. Pressure data wereconverted to water-level depth equivalents based upon an assumed water density, the sitelatitude, and the land surface elevation of the site. During the first six weeks of the study, thesite land surface elevation was incorrectly entered into the data logger software as 75 feet asopposed to 19 feet, the correct value. The site elevation is used by the program to estimate waterdensity, which then is used to convert pressure to water head, however, this error did notsignificantly effect the measurements.
Factors Affecting FlowsReleases from the Alder and La Grande dams dominate flows in the lower reach of the NisquallyRiver. There are, however, many other factors which also affect flows such as tributary input,baseflow conditions (ground water contribution), and spring discharge. These factors, as well asthe amount and timing of the dam releases, are all dependant upon climatic patterns. On 3/14/01,under recommendation from Ecology and the Executive Water Emergency Committee, GovernorGary Locke authorized Ecology to declare a drought emergency in Washington State. The onsetof this drought had a major effect on the Nisqually River. In order to place the data collectedduring this study in perspective, it is necessary to develop an understanding of the factors whichinfluenced Nisqually River flows.
Page 6
Figu
re 2
. Fl
ow ra
ting
curv
e fo
r Nis
qual
ly R
iver
RM
4.6
site
.

Page 7
Snowpack on Mount RainierThe Alder and La Grande dams are operated by the Tacoma Power subdivision of TacomaPublic Utilities and the release of water from these is largely a function of snow pack on MountRainier. In analyzing trends in the water supplying the two associated reservoirs, data wereobtained from the National Resource Conservation Service (NRCS) Snotel site at ParadiseRanger Station in Mount Rainier National Park. This site is the only snow gage in the upperreaches of the Nisqually watershed. Cumulative data from Snotel sites are provided in wateryears. Water years correspond with the 12–month period from October 1 through September 30,and are designated by the calendar years in which they end. Water-year 2000, therefore, ends on9/30/00. Analyses of precipitation by water years are useful in western Washington because theydo not break any one winter rainy season into separate years.
In general, data from the Paradise site suggest that cumulative precipitation was slightly aboveaverage throughout most of water-year 2000, with the exception of August. Cumulative snowwater content at Paradise was also above average for most of water-year 2000. The maximumdifference between actual and average cumulative snow water content occurred in May 2000, atabout the same time that snow stopped accumulating. At that time the snow water content wasabout 20 inches greater than the 65-inch average. Cumulative precipitation for water-year 2001remained well below average and ended the year in October of 2001 at about 32 inches belowthe 109 inch per year average. The cumulative snow-water content was roughly 12 inches belowaverage by 5/1/01. Snow-water content at Paradise was zero by July, as opposed to early Augustwhich is normally the case. In short, water-year 2001 was a very dry year.
Alder DamTacoma Power calculates natural flows entering Alder Lake based upon a combination ofdischarge from the La Grande Dam and change in storage at Alder Lake (pers. com. Todd Lloyd,Tacoma Power, 1/16/01, 3/30/01 and 11/29/01). In essence these are predictions of the flowsthat would be expected in the Nisqually River in the vicinity of the lake, if the dams were notthere. Figure 3 depicts Tacoma Power's predictions for October 1999 through October 2001. Itis clear from this figure that Alder Lake inflow was far below normal during most of the studyperiod. When these inflow predictions dropped off in November of 2000, the Nisqually RiverCoordinating Committee convened via conference call. This committee was formed as anoutgrowth of previous FERC license proceedings and includes membership by Tacoma Power,the Nisqually Tribe, the National Marine Fisheries Service, the Washington State Department ofFish and Wildlife, and Centralia City Light. Concerned with the prospect of maintainingminimum flows throughout a potentially protracted drought, the committee agreed to reduce LaGrande Dam discharge to 730 cfs (+/- 20 cfs) beginning in late November 2000. Thus at thattime, Tacoma Power began to significantly restrict its releases of water to the middle and lowerreaches of the Nisqually River.

Page 8
Figu
re 3
. Es
timat
ed A
lder
Lak
e in
flow
s Oct
ober
199
9 - O
ctob
er 2
001
(Tac
oma
Pow
er, p
ers.
com
. Tod
d Ll
oyd,
200
1).

Page 9
Other Basin PrecipitationAlthough snow pack on Mount Rainier is the largest factor affecting Nisqually River flows,rainfall lower in the watershed also contributes. For this reason National Weather Service datawere analyzed for the Olympia airport site. The Olympia site is actually located a bit to the westof the study area within the Deschutes basin, but is close enough to pick up general trends.Figure 4 depicts precipitation data for Olympia available October 1999 through October 2001.This figure indicates that Olympia precipitation was higher than normal in November andDecember of 1999, then roughly normal through the summer of 2000. During the winter andspring of water-year 2001, however, precipitation was far below normal. The cumulative datafor Olympia indicates that the year-end total for the water year was 20 inches below the 51-inchaverage by September 2001.
Much of the precipitation which falls in the Nisqually basin initially becomes ground waterrecharge, which affects river flows through baseflow contribution. In analyzing precipitationdata, therefore, it is important to acknowledge the lag effect whereby reduced precipitation in thewinter months can affect spring and base flow contribution during the summer months.
Other Surface Water ContributionsFlows which occur below La Grande Dam, but above the previously mentioned Nisqually gages,are supplemented by numerous tributaries, including Ohop Creek, Tanwax Creek, and MuckCreek, as well as springs and ground water conditions. Muck Creek is the largest tributary to theNisqually below RM 12.6 (the confluence with the Centralia City Light power canal).
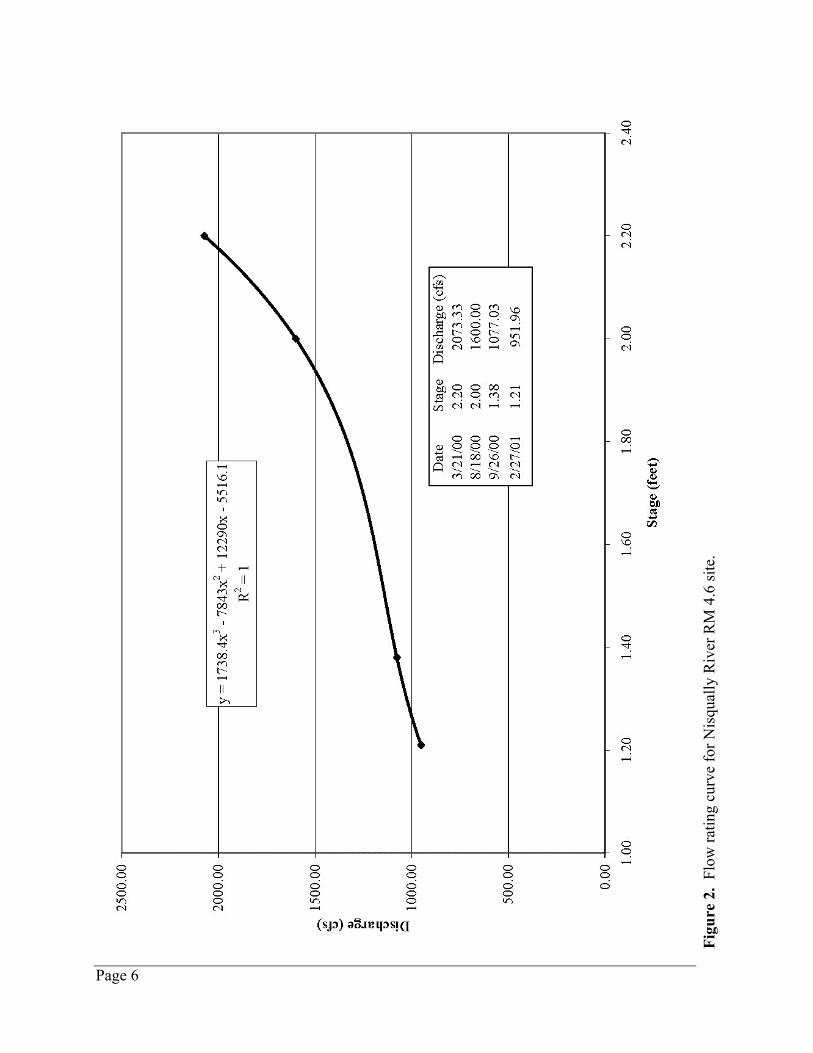
An investigation of the Nisqually Lake area by the USGS (Pearson and Dion, 1979) producedonce-a-month synonymous discharge measurements for Muck Creek at the mouth and MuckCreek at Roy, August 1975 though August 1977. These data indicate a complex relationshipbetween loosing and gaining conditions, which were significantly different from one year to thenext. More recently, a gage was established on Muck Creek at Roy as part of a basincharacterization study initiated by Pierce County (CH2M/Hill, 2000). Although the historicaldata presented in the USGS report indicate potentially significant changes between Muck Creekflows at Roy and at the mouth, the more recent data do provide an indication of Muck Creek'scontribution to the Nisqually River during a portion of the study period.
Figure 5 presents monthly flow data for Muck Creek at Roy collected April 2000 throughFebruary 2001. These data indicate mean monthly flows ranging from a maximum of 129 cfsduring April of 2000, to a minimum of 0.08 cfs during August and during September of 2000.As one indication of the variability, however, the recent data indicate a maximum flow of 17 cfsand a mean flow of 9 cfs for January 2001. By comparison, the older USGS spot measurementdata indicate that flows in Muck Creek at Roy were 367 cfs on 1/14/76 (computed dischargefrom gage height and a rating table) and 1.51 cfs on 1/11/77 (actual discharge measurement, butwith ice on the water surface).

Page 10
Figu
re 4
. O
lym
pia
airp
ort p
reci
pita
tion
(Nat
iona
l Wea
ther
Ser
vice
).
Page 11
Figu
re 5
. F
low
s in
Muc
k C
reek
at R
oy A
pril
2000
- Fe
brua
ry 2
001
(CH
2M/H
ill, 2
000)
.

Page 12
Springs also contribute water to the lower reach of the Nisqually River. The Pearson and Dionreport includes discharge data for the spring used by the Nisqually Tribe Clear Creek Hatchery,which emanates from a bluff just east of the Nisqually River at approximately RM 5.6. Thesedata indicate discharge as high as 4.6 cfs on 5/14/76. Not surprisingly, anecdotal informationprovided by the hatchery manager suggests significantly less than normal spring flow duringmuch of the study period (pers. com. Bill St. Jean, 4/19/01). The hatchery requires roughly10,000 gallons per minute in order to operate, and during normal years spring water is able tomeet all of the hatchery needs except during the months of September and October. Starting inSeptember 2000 through at least 4/19/01, however, the Tribe pumped its wells at approximately7,000 gallons per minute in order to augment its spring-fed supply.
Analysis of Flow Data
Ecology Data versus Established Minimum FlowsFigure 6 presents the results of the flow measurements for the study site collected between8/8/01 and 11/5/01. There was a four-hour hiatus in data collection on 8/17, a 32-day hiatusfrom 2/1/00 to 1/2/01 (when the equipment was removed for warranty work), and a 1-day hiatusin data collection on 3/1/01 (due to equipment failure).
Streamflow measurements are never 100 percent accurate. One possible source of error duringthis study comes from instrumentation drift. Drift refers to the loss of pressure transduceraccuracy over time. The potential for drift increases over time, thus regular site visits were madeto recalibrate the transducer with the staff gage. The duration between site visits varied from 10to 49 days and the stage errors detected ranged from 0 to 0.057 feet. Consequently, the raw datacollected by Ecology were corrected for instrumentation drift through the application of alinearly distributed correction factor. The amount of drift which occurred between visits wasdivided by the number of measurements recorded, then added incrementally to each interveningmeasurement based upon a linear distribution. In order to make large data sets manageableduring this procedure, data collected at more frequent time intervals were first averaged. Whereavailable, the 10-minute data were averaged to 30-minute increments and the 20-minute datawere averaged to 40-minute increments. These data were then corrected for instrumentation driftbased upon a linear distribution of the drift detected.
As shown in Figure 6, Nisqually River flows were above established Chapter 173-510 WACminimum levels during most of the gaged period. Flows ranged from 1031 to 1592 cfs Augustthrough early November 2000, which was at least 300 cfs greater than the minimum flows levels.Flows dropped as low as 816 cfs during one measurement on 11/23/00, then rebounded andleveled off to approximately 1,000 cfs on 12/1/00 before the equipment was removed for onemonth. After the equipment was reinstalled on 1/2/01, flows tended fluctuate in the 900 to1,000cfs range for about one month, with variations including dips below the 900 cfs minimum levelduring portions of six days in January. Flows varied after that time, but in general they increasedsuch that flows never again came close to dipping below minimum instream flow levels.

Page 13
Figu
re 6
. Nis
qual
ly R
iver
flow
s 8/8
/00
- 11/
6/01
at R
M 4
.6.

Page 14
As mentioned above, Tacoma Power reduced La Grande Dam discharge to 730 cfs (+/- 20 cfs) inlate November of 2000. This reduction was made in response to mounting drought conditionsand resulted in an obvious decline in flows measured during 38 miles downstream at RM 4.6.The difference between the measured flows and this approximately 730 cfs release attests to theinfluence of the intervening tributaries, as well as springs, ground water and precipitation.
Tacoma Power is not required to meet the minimum flows established in Chapter 173-511 WAC,but the minimum flows associated with Tacoma's FERC license has some similarities to the"Mid Reach" Nisqually River flows established in the WAC. Even the farthest downstreampoint of this reach, however, is about 22 miles upstream of the WAC control point for the lowerreach of the Nisqually River (RM 4.3). Considering the differences in the "Mid Reach" flowrequirements and the distance between the upstream stretch in which Tacoma is striving tomaintain instream flows, it is impressive that the WAC minimum flows for the lower reach wereas closely met as described above, even during a drought.
It is also worthy of mention, however, that the timing of the 32-day data gap when the gagingequipment was removed for warranty work from 12/1/00 through 1/2/01, was unfortunate.Based on the flows depicted in Figure 6, it appears quite possible that there were additional daysduring that month when Nisqually River lower reach minimum instream flows were not met.
Potential Errors in Streamflow MeasurementsThere are a number of potential sources of error associated with discharge measurements otherthat those caused by instrumentation drift. The flow rating curve is the means by which flowdata are created from stage measurements. The flow data which Ecology ultimately produced,therefore, are only as accurate as the flow rating curve. The rating curve used during this studywas based upon four discharge measurements, with the lowest measured flow being 952 cfs.Below that amount, the rating curve has only been projected. Because flows below that amountare less accurate and some of the most critical, 952 cfs has also been depicted in Figure 6.
Another possible source of rating curve error relates to changes in the shape of the river channel.Ideally it would have been helpful to have discharge measurements taken in October 2001 toverify that the rating curve reflected river conditions toward the end of the study. The mostrecent measurements, however, were taken on 3/3/01. Fortunately, very few high flow eventsoccurred beyond that time through November 2001. Consequently, it is unlikely that the channelmorphology changed significantly.
A comprehensive study by Sauer and Meyer (USGS, 1992) suggests that standard errorsassociated with streamflow measurements, such as those used to develop the rating curve, rangefrom three to six percent. As mentioned above, the recent Ecology data suggest that duringJanuary 2001, Nisqually River flows approached 900 cfs and minimum instream flows violationsbegan occurring. For perspective, a six percent error compounded onto a 900 cfs flow wouldresult in a flow error of 54 cfs. Applying a six percent error to the entire data set, thensubtracting the resultant amounts from the data, suggests that flows would not have been metduring portions of 31 days during the measured period. This compares with portions of six days
Page 15
based on the unadjusted Ecology data. Adding a six percent error, on the other hand, suggeststhat flows were met during the entire gaged period.
Analysis of Historical Flows
Relationship between Ecology Data and Upstream FlowsUSGS gage 12089500 on the mainstem of the Nisqually River is located at the State Highway507 bridge at McKenna at RM 21.8. The Centralia City Light power canal is used to divertwater from the Nisqually River at approximately RM 26.1 and return water at approximately RM12.6. USGS gage 12089208 is located on the power canal about 500 feet downstream of theheadworks dam.
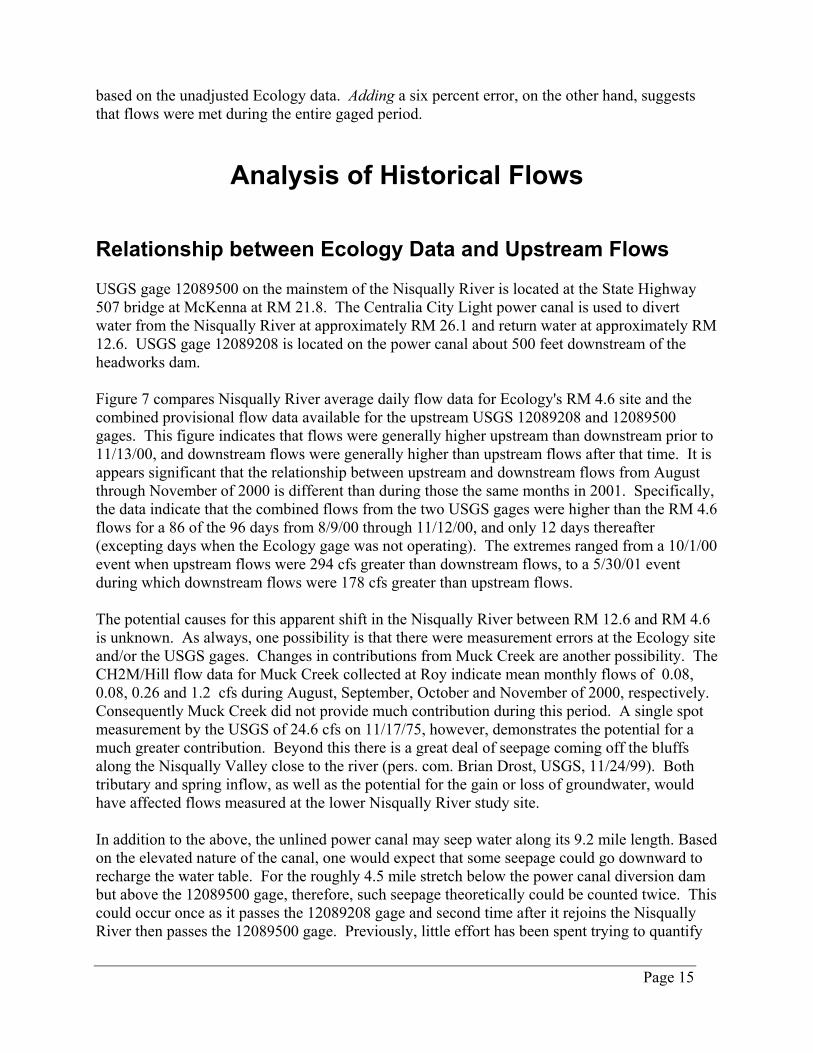
Figure 7 compares Nisqually River average daily flow data for Ecology's RM 4.6 site and thecombined provisional flow data available for the upstream USGS 12089208 and 12089500gages. This figure indicates that flows were generally higher upstream than downstream prior to11/13/00, and downstream flows were generally higher than upstream flows after that time. It isappears significant that the relationship between upstream and downstream flows from Augustthrough November of 2000 is different than during those the same months in 2001. Specifically,the data indicate that the combined flows from the two USGS gages were higher than the RM 4.6flows for a 86 of the 96 days from 8/9/00 through 11/12/00, and only 12 days thereafter(excepting days when the Ecology gage was not operating). The extremes ranged from a 10/1/00event when upstream flows were 294 cfs greater than downstream flows, to a 5/30/01 eventduring which downstream flows were 178 cfs greater than upstream flows.
The potential causes for this apparent shift in the Nisqually River between RM 12.6 and RM 4.6is unknown. As always, one possibility is that there were measurement errors at the Ecology siteand/or the USGS gages. Changes in contributions from Muck Creek are another possibility. TheCH2M/Hill flow data for Muck Creek collected at Roy indicate mean monthly flows of 0.08,0.08, 0.26 and 1.2 cfs during August, September, October and November of 2000, respectively.Consequently Muck Creek did not provide much contribution during this period. A single spotmeasurement by the USGS of 24.6 cfs on 11/17/75, however, demonstrates the potential for amuch greater contribution. Beyond this there is a great deal of seepage coming off the bluffsalong the Nisqually Valley close to the river (pers. com. Brian Drost, USGS, 11/24/99). Bothtributary and spring inflow, as well as the potential for the gain or loss of groundwater, wouldhave affected flows measured at the lower Nisqually River study site.
In addition to the above, the unlined power canal may seep water along its 9.2 mile length. Basedon the elevated nature of the canal, one would expect that some seepage could go downward torecharge the water table. For the roughly 4.5 mile stretch below the power canal diversion dambut above the 12089500 gage, therefore, such seepage theoretically could be counted twice. Thiscould occur once as it passes the 12089208 gage and second time after it rejoins the NisquallyRiver then passes the 12089500 gage. Previously, little effort has been spent trying to quantify

Page 16
Figu
re 7
. D
aily
Nis
qual
ly R
iver
RM
4.6
flow
s and
com
bine
d U
SGS
flow
s 8/9
/00
- 11/
5/01
.

Page 17
seepage losses from the power canal. (pers. com. Ron Whitman, Centralia City Light, 4/19/01).Weirs have been placed outside the canal at four locations to measure flow at places whereobvious seepage is occurring through the levee. The combined surface flow at these locationswas 83 gallons per minute (0.18 cfs) on 4/19/01 - an amount which is negligible in this analysis.
On two occasions Ecology’s Environmental Assessment Program measured the flow in thepower canal, at the bridge located roughly 500 feet upstream of the point where the canal entersthe powerhouse penstocks. During the first site visit, measurements were made with both aSwoffer current meter and an RD Instruments, Inc. Rio Grande 1200 Acoustic Doppler CurrentProfiler (ADCP). During the second site visit measurements were made with the ADCP alone.The purpose of these measurements was to provide data to compare with provisional flow dataavailable for the USGS 12089208 gage located roughly 9 miles upstream. The firstmeasurement took place on 8/16/01, when flow at the USGS gage was about 630 cfs. On thatoccasion Ecology measured a flow of 670 cfs using the current meter and 660 cfs using theADCP. During a site visit on 12/6/01 Ecology measured a flow of 804 cfs near the powerhouse,while the corresponding flow at the USGS gage was approximately 765 cfs. These data suggestan increase of about 30 to 40 cfs during the dry season, and about 39 cfs in December. Asalways, however, the potential for error must also be considered. As mentioned above, standarderrors associated with streamflow measurements often range from three to six percent. A sixpercent error compounded onto a 670 cfs measurement, for example, produces a flow rangebetween 630 to 710 cfs. If the flow was only 630 cfs on 8/16/01, this suggests that no gainoccurred in the power canal.
Historical Data Versus Established Minimum FlowsRegression analyses were performed on the daily average of flow data collected at RM 4.6 andthe combined upstream USGS data. Careful inspection, however, suggests a slight split in thedata. When the data for flows prior to 11/13/00 are plotted with a different symbol, two separatetrends emerge (Figure 8). Mid-November is the time period when conditions shifted from thoseof generally higher upstream flows to those of generally higher downstream flows. This shiftcomplicates selection of single trendline to best fit all flow conditions. It would not be practical,however, to apply two separate trendline equations to the past and future data collected at theUSGS gages, as there would be no reference to determine which equation was best to apply. Forthis reason, the data plotted in Figure 8 were treated as a single set when performing the trendlineanalyses.
Various trendlines were projected onto the data in Figure 8, including those generated by linear,logarithmic, 2nd order polynomial, exponential and power analyses. A projection of the powertrendline nearly crosses through the origin of the x and y axes. This suggests no local inflowbetween the upstream USGS gages and the Ecology site. Given the uncertainties in ourunderstanding of the system, this is the most conservative interpretation. The formula for thepower trendline is y = 19.85x0.5792 , where y equals the expected flows near RM 4.6 and x equalsthe combined data from the two USGS gages. The R squared coefficient for this trendline is 0.7.Considering the limited hydrogeologic information available, it also seems reasonable to assumethat some inflow might occur over the stretch of river between the upstream USGS gages and the

Page 18
Figu
re 8
. C
orre
latio
n be
twee
n Ec
olog
y R
M 4
.6 d
ata
and
USG
S up
stre
am d
ata.
Page 19
Ecology site. The 2nd order polynomial crosses the y axis at the next least amount, however, they intercept is nearly the same as that for the linear trendline. As the linear trendline is a simplercase, this trendline was also considered. The equation for the linear trendline is y = 0.5917x +493.67, with an R squared coefficient of 0.71.
In order to select the best trendline for use in predicting flows at RM 4.6, the corrected Ecologydata was plotted directly beside the predictive results for both the power and linear trendlineequations. This plot indicated little differences between the predictions based on either of thetwo. The power equation did, however, predict slightly lower flows during January 2001, Asthis was the critical time with respect to minimum instream flows during the study period, thisequation is considered a better predictor of flows at RM 4.6.
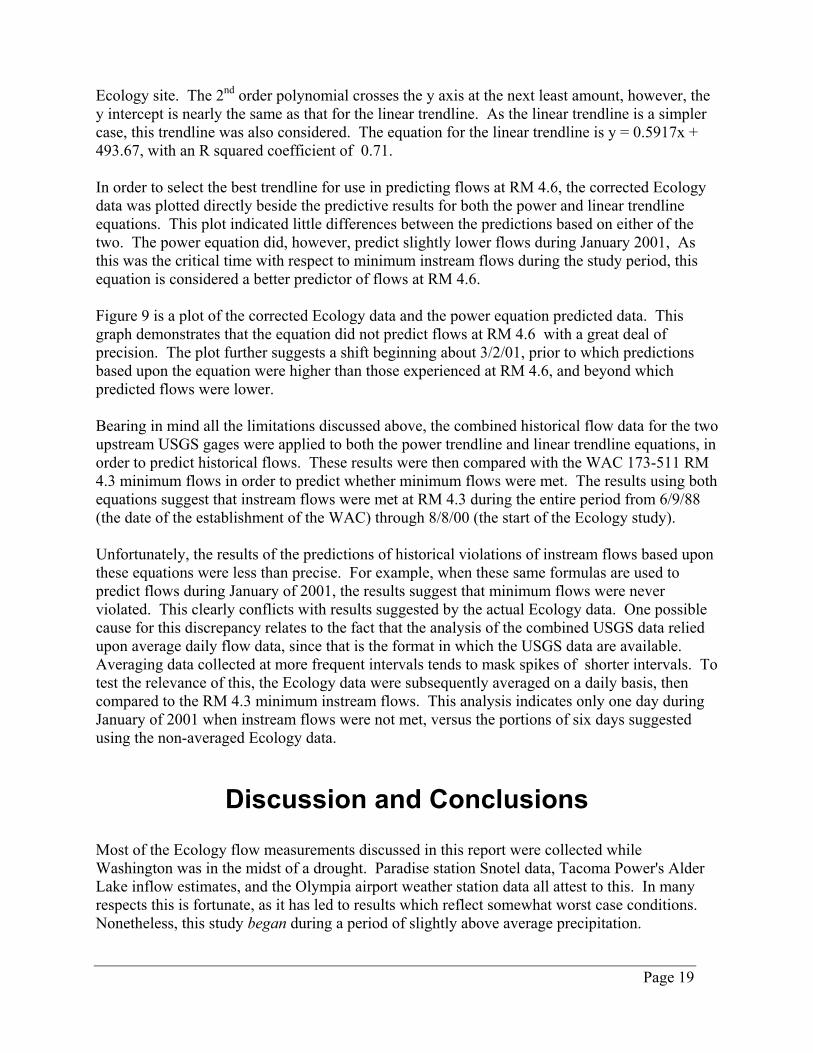
Figure 9 is a plot of the corrected Ecology data and the power equation predicted data. Thisgraph demonstrates that the equation did not predict flows at RM 4.6 with a great deal ofprecision. The plot further suggests a shift beginning about 3/2/01, prior to which predictionsbased upon the equation were higher than those experienced at RM 4.6, and beyond whichpredicted flows were lower.
Bearing in mind all the limitations discussed above, the combined historical flow data for the twoupstream USGS gages were applied to both the power trendline and linear trendline equations, inorder to predict historical flows. These results were then compared with the WAC 173-511 RM4.3 minimum flows in order to predict whether minimum flows were met. The results using bothequations suggest that instream flows were met at RM 4.3 during the entire period from 6/9/88(the date of the establishment of the WAC) through 8/8/00 (the start of the Ecology study).
Unfortunately, the results of the predictions of historical violations of instream flows based uponthese equations were less than precise. For example, when these same formulas are used topredict flows during January of 2001, the results suggest that minimum flows were neverviolated. This clearly conflicts with results suggested by the actual Ecology data. One possiblecause for this discrepancy relates to the fact that the analysis of the combined USGS data reliedupon average daily flow data, since that is the format in which the USGS data are available.Averaging data collected at more frequent intervals tends to mask spikes of shorter intervals. Totest the relevance of this, the Ecology data were subsequently averaged on a daily basis, thencompared to the RM 4.3 minimum instream flows. This analysis indicates only one day duringJanuary of 2001 when instream flows were not met, versus the portions of six days suggestedusing the non-averaged Ecology data.
Discussion and ConclusionsMost of the Ecology flow measurements discussed in this report were collected whileWashington was in the midst of a drought. Paradise station Snotel data, Tacoma Power's AlderLake inflow estimates, and the Olympia airport weather station data all attest to this. In manyrespects this is fortunate, as it has led to results which reflect somewhat worst case conditions.Nonetheless, this study began during a period of slightly above average precipitation.

Page 20
Figu
re 9
. A
ctua
l Nis
qual
ly R
iver
RM
4.6
flow
s and
flow
s gen
erat
ed b
y th
e po
wer
equ
atio
n.

Page 21
The Ecology data (corrected for instrumentation drift) indicate that the lower reach of theNisqually River met established minimum instream flows during late summer and early fall of2000. In November of 2000, however, precipitation fell far short of normal conditions andTacoma Power dropped it's releases from Alder Lake to a minimum 730 cfs. This reductionresulted in a clear decline in flows measured by Ecology at the RM 4.6 site. The differencebetween the Ecology measured flows and the 730 cfs dam release attests to the influence of thenumerous intervening tributaries, as well as springs, ground water and precipitation. Based onthe collected data, it appears the lower Nisqually River met minimum instream flows for all butportions of six days during the study period (in January 2001). Considering the differences inthe "Mid Reach" flow requirements and the distance between the upstream stretch where Tacomais striving to maintain instream flows, it is impressive that these minimum flows were so closelymet, even during a drought.
The timing of the 32-day data gap when the gaging equipment was removed, however, wasunfortunate. Based on the flows depicted in Figure 6, it is quite possible that there wereadditional days 12/1/00 through 1/2/01, when lower reach Nisqually River minimum instreamflows were not met. On the other hand, standard errors associated with streamflowmeasurements could skew the number of days flows were not met in either direction. Forexample, an assumed six percent error subtracted from the entire data set suggests flows wouldnot have been met during portions of 31 days during the measured period. An assumed sixpercent error added to the entire data set, on the other hand, suggests flows were met during theentire gaged period.
Figure 7 compares Nisqually River average daily flow data for RM 4.6 and the combined flowsfor the upstream USGS 12089208 and 12089500 gages. These data suggest that flows werehigher upstream than downstream for a 86 of the 96 days from 8/8/00 through 11/12/00, and only12 days thereafter. As always, there is the possibility that the perceived shift, at least in part, wasa product of measurement errors by either Ecology or the USGS. It appears more thancoincidence, however, that this began at roughly the same time as the onset of a drought.
A number of factors relating to this shift would be affected by changing climatic conditions.Muck Creek contributes flow to the Nisqually River between RM 12.6 and RM 4.6, as doesseepage coming off the bluffs close to the river. Recent flow data collected by CH2M/Hill,suggest mean monthly flows of only 0.08 cfs during August and during September of 2000. Thislow tributary contribution corresponds with the period during which Nisqually flowsdownstream of Muck Creek were lower than those upstream. What is unknown, however, iswhat flows were during that same period in 2001.
The Centralia City Light power canal is unlined and may itself either gain or loose water. Basedupon the locations of the two upstream USGS gages, it is theoretically possible that some canalwater may have seeped out, then re-entered the Nisqually River above the McKenna gage, andthus essentially have been counted twice. Two flow measurements made by Ecology above thepower plant, however, suggest that the canal actually gained 30 to 40 cfs both in August 2001and December of 2001. Additional measurements would be needed to verify gaining and/orloosing conditions - especially on a year-round basis.

Page 22
In general, all of the above relates to the relative importance of the various factors within thehydrologic system. Fortunately, data were collected during an August through November timeframe for two years running, and this facilitates some comparisons. For example, upstreamflows in the Nisqually River (as suggested by the combined flow at the USGS 12089500 and12089208 gages) were generally less August through November of 2001, compared with flowsduring those same months in 2000 (due to the drought). If ground water contribution or springflow during this period was less effected or nearly the same, than their relative importance ofthese would have been increased. This might, at least in part, explain why downstream flowscould be greater than upstream flows at the conclusion of a drought, but not before.
In addition to the above, analyses were performed to determine whether it was likely thatNisqually River instream flows have been met in the past. Based upon regression analysesperformed on plots of daily average flow data collected at RM 4.6 versus the combined upstreamUSGS data, equations for power and linear trendlines were derived. In order to select the besttrendline for use in predicting lower Nisqually River flows, the corrected Ecology data wasplotted directly beside the predictive results for both the power and linear trendline equations.The power equation predicted slightly lower flows during January 2001. As this was the criticaltime with respect to minimum flows during the study period, this equation is considered a betterpredictor. The formula for the power trendline is y = 19.85x0.5792 , where y equals the expectedflows near RM 4.6 and x equals the combined data from the two USGS gages.
The combined historical flow data for the two upstream USGS gages were applied to both thepower trendline and linear trendline equations, in order to predict historical flows for the controlpoint for the lower reach of the Nisqually River (RM 4.3). These results were then comparedwith the WAC 173-511 flows in order to predict whether minimum flows had been met. Theresults using both equations suggest that instream flows were met at RM 4.3 during the entireperiod from 6/9/88 (the date of the establishment of the WAC) through 8/8/00 (the start of theEcology study).
Figure 9 is a plot of the corrected Ecology data and the power equation predicted data.Unfortunately, this graph demonstrates consistent errors in the RM 4.6 predictions. When thetrendline equations were used to predict flows during January of 2001, the results suggest thatminimum flows were never violated during January of 2001. This conflicts with resultssuggested by the actual Ecology data. One possible cause for the discrepancy relates to the factthat the analysis of the USGS data relied upon average daily flow data. Averaging data collectedat more frequent intervals tends to mask shorter interval spikes. To test the relevance of this, theEcology data were averaged on a daily basis, then compared to the RM 4.3 minimum instreamflows. This analysis indicates only one day during January of 2001 when instream flows werenot met, versus the portions of six days suggested using the non-averaged Ecology data.
In short, predictions of violations of minimum instream flows for the lower reach of theNisqually River based upon these equations are less than precise. Predictions of whetherminimum flows are being met in the future based upon these same equations, therefore, can notbe considered entirely accurate. In order to state with certainty whether flows are being met onthe lower reach of the Nisqually River, a long-term stream gage would need to be established ator near the official control point at RM 4.3.

Page 23
Finally, it is worth noting that the provisions of Chapter 173-511 WAC seem inconsistent withregard to reaches of the Nisqually River which are located up-gradient to the lower reachinvestigated during this study. Specifically, the Bypass Reach and the Mid Reach are bothidentified in the WAC as having partial year closures from June 1 through October 15, beyondthe minimum flows set for these control points for the remainder of the year. The Upper Reach(that furthest up the watershed), however, has only year-round minimum flows set. That impliesthat water is provisionally available on that stretch of the Nisqually provided these minimumflows are met. Such conclusions are contradictory, however, given that any consumptive use ofwater on the uppermost reach June 1 through October 15, would also result in reduced flows inthe Bypass Reach and the Mid Reach during their closure periods.

Page 24
Selected ReferencesDrost, Brian W., 1999. Hydrologist for U.S. Geological Survey, Washington DistrictWater Resources Division, personal communication.
CH2M/Hill, 2000. Muck Creek basin study phase 1, basin characterization plan, draft report.Prepared for Pierce County Public Works and Utilities. 34 p., plus figures and appendices.
Lloyd, Todd, 2001. Power Analyst Tacoma Power subdivision of Tacoma Public Utilities,personal communication 1/16/01, 3/30/01 and 11/29/01 .
National Weather Service data available at the University of Washington Department ofAtmospheric Sciences website at:http://www-k12.atmos.washington.edu/k12/grayskies/nw_weather.html
Pacific Groundwater Group, 1998. McAllister Springs wellfield - Phase II supplemental analysisof pumping effects and proposed mitigation. 44 p., plus figures and appendices.
Pacific Northwest River Basins Commission, 1989. River mile index -- Deschutes River,Nisqually River, Puyallup River, Green River, Lake Washington and Snohomish River,Washington. 53 p.
Pearson, H.E., and Dion, N.P., 1979. Water resources of the Nisqually Lake area, Pierce County,Washington. U.S. Geological Survey Water-Resources Investigations 78-101, 34 p.
Rantz, S.F., et al., 1982. Measurements and computations of streamflow: volume 1.measurements of stage and discharge. U.S. Geological Survey Water Supply Paper 2175, 284 p.
Sauer, V.B. and Meyer, R.W., 1992. Determination of error in individual dischargemeasurements. U.S. Geological Survey Open-File Report 92-144, 21 p.
St. Jean, Bill, 2001. Hatchery Manager for Nisqually Tribe Clear Creek Hatchery, personalcommunication.
USGS provisional stream flow data available at http://water.usgs.gov/nwis/sw
Whitman, Ron, 2001. Centralia City Light power house manager, personal communication.