
Flow Injection Systems for Process Analytical...
44
Flow Injection Systems for Process Analytical Chemistry by Ingrid Lukkari & %%% * or> AKADEMISK AVHANDLING som med vederbörligt tillstånd av rektorsämbetet vid Umeå Universitet för erhållande av filosofie doktorsexamen framlägges till offentlig granskning vid Kemiska Institutionen, Hörsal B, Naturvetarhuset, fredagen den 26 januari 1996, Klockan 10:00.
Transcript of Flow Injection Systems for Process Analytical...
Flow Injection Systems for Process Analytical Chemistry
by
Ingrid Lukkari
& %%%
*or>
AKADEMISK AVHANDLING
som med vederbörligt tillstånd av rektorsämbetet vid Umeå Universitet för erhållande av filosofie doktorsexamen framlägges till offentlig granskning vid Kemiska Institutionen,
Hörsal B, Naturvetarhuset, fredagen den 26 januari 1996, Klockan 10:00.

F lo w In je c tio n S y stem s fo r P rocess A n a ly tic a l C k e m is try
A u th o r: Ingrid Lukkari
A d d ress: Departm ent of Analytical Chemistry, U m eå University, S -Ç 01 8 7 Um eå,Sweden
A b stra ct Flow injection systems have great potential for sample handling and analysisin process analytical chemistry. The flexibility and versatility of flow injection manifolds can he utilized in specific applications o f sample conditioning and analysis. A n overview of various flow injection methods, including flow reversals, double injection, and sequential injection is given, as well as different clean-up methods, such as gas diffusion, solid phase extraction, dialysis, and solvent extraction. Calibration techniques, such as single standard and multivariate calibration are also discussed. In addition, different aspects of process analytical chemistry, in particular sampling and sample handling, are discussed.
T he papers in this thesis describe a number of flow systems, where gradient-, gas diffusion-, and solid phase extraction- methodologies are applied, all of which have potential use in process analytical chemistry. Paper I is focused on m ulticom ponent analysis of mixtures of organic acids by mathem atically extracting information from complex spectra. The selectivity is improved by generating pH-gradients in the flow system. In paper II, the m ethodology of sensor injection is described and electrochemical and spectroscopic sensors are im plem ented in a sequential injection system. T he m ethod is illustrated by using pH sensors and a glucose electrode. A m m onia and am m onium ions are determined on-line to a bioprocess by gas diffusion in paper III. T he benefit of frequent re-calibrations and in-line cleaning sequences are demonstrated. Finally a m ethod for on-line determination of o-diphenols in the kraft process has been developed (paper IV). T he o-diphenols are isolated from black liquor samples by solid phase extraction and thereafter transferred to a high performance liquid chromatography system for separation and quantification.
K eyw ords: Flow injection, Sequential injection, Process analytical chemistry,M ultivariate calibration, Sensor injection, Gas-diffusion, Sam ple clean-up.
ISBN 9 1 -7 1 9 1 -1 3 0 -8
Table of Contents iii
TLis tliesis is partly based on the investigations presented in tlie following published papers and accepted manuscript, hereafter referred to by their Rom an numerals and appended at the end of the thesis:
I. In grid L ukkari and V a lt e r L indberg
Multicomponent determinations in flow system s by partial least squares modeling.
A n a l Chim. Acta, 2 1 1 (1988) 1 -10 .
II. H erb ert L. L ancaster, Ingrid L ukkari, G ary D . C h ristia n an d Jarom ir R u zick a
1electrochemical an d spectroscopical sensor injection: Methodology and application.
J. Flow Injection A nal., 9 (1992) 2 0 -3 8 .
III. In grid L ukkari, Jarom ir R u zick a and G ary D . C h risti an
Determination o f total ammonium-nitrogen and free ammonia in a fermentation medium by sequential injection analysis.
Fresenius J. A nal. Chem ., 3 4 6 (1993) 8 1 3 -8 1 8 .
IV . In grid L ukk ari, K n u t Irgum , P er L in d gren an «U an L id én
Ondine monitoring of pyrocathecoi\ protocathecuic acid, pyrogallol and gallic acid in black liquor by sequential injection and H PLC .
Process Control Qual., in press.
T he following papers and manuscript are not included in this thesis:
A . In grid L ukkari, K n u t Irgum , P er L indgren and Jan L id én
Ondine monitoring o f pyrocathecoi and gaflic acid in black liquor form the Kraft processing o f various wood species.
M anuscript in preparation
B . H a n s S u n d gren , Ingem ar L u n d ström , F red rik V in q u is t , In grid L ukkari, R o lf C a rlsso n and S v a n te V o id
Evaluation o f multiple gas mixture with a simple M O S F E T (Metal-oxidc j-semiconductor FE T) gas sensor array and pattern recognition.
Sens. Actuators, B, B 2 (1990) 1 1 5 -1 2 3 .
C . H a n s S u n d gren , F redrik V in q u is t , In grid Lukkari an d In gem ar L u n d ström
Artificial neural networks and gas sensor arrays: Quantification o f individual components in a gas mixture.
M eas. Sci. Technol. 2 (1991) 4Ó4-4Ó9.

iv Flow Injection Systems for Process Analytical Chemistry
TABLE OF CO NTENTS
INTRODUCTION.................................................................................................................................1
History o f Flow Injection............................................................................................................1
FLOW INJECTION TECHNIQUES.................................................................................................... 3
Terminology...................................................................................................................................3
Flow Injection Analysis............................................................................................................... 3Stopped Flow............................................................................................................................... 4Double Injection........................................................................................................................... 4
Sequential Injection Analysis.................................................................................................... 5Practical Aspects in Sequential Injection....................................................................................... 6
Contamination caused by the multiposition valve.............................................................................................. 6Sample carry-over................................................................................................................................................. 6Computer control........................................................................................................................ 7
Principles of Flow Injection.......................................................................................................7Read-out........................................................................................................................................7Dispersion.....................................................................................................................................8Flow Injection Gradient................................................................................................................ 9Zone Penetration.........................................................................................................................10Flow Reversals............................................................................................................................10
CALIBRATION TECHNIQUES IN FLOW INJECTION.................................................................12
Single Standard Calibration.....................................................................................................12Gradient Calibration....................................................................................................................12Single Standard Calibration in Sequential Injection.....................................................................13Standard Addition.......................................................................................................................14
Multivariate Calibration............................................................................................................15Partial Least Squares....................................................................................................................15
PROCESS AN ALYSIS .......................................................................................................................17
Sampling.......................................................................................................................................17Sampling Theory..........................................................................................................................18Sample Conditioning...................................................................................................................19
Cross-flow filtration units..................................................................................................................................19
Clean-up of Process Samples in Flow Injection System s................................................. 20Gas Diffusion.............................................................................................................................. 20Dialysis....................................................................................................................................... 21Solvent Extraction...................................................................................................................... 21Solid Phase Extraction................................................................................................................ 22

Table o f Contents v
APPLICATIONS OF FLOW INJECTION IN PROCESS ANALYTICAL CHEMISTRY...............23
Multicomponent Analysis in Flow Injection Systems, Paper 1........................................23
Sensor Injection, Paper II........................................................................................................25
On-line Flow Injection Systems in Process Analysis, Papers III and IV ...................... 27Flow Injection Analysis in Bioprocesses.....................................................................................28Ammonia Determination in Flow Injection, Paper III................................................................. 28Flow Injection for Sample Preprocessing in Liquid Chromatography, Paper IV..........................30
CONCLUSIONS.................................................................................................................................33
ACKNOWLEDGMENTS.................................................................................................................. 34
REFERENCES....................................................................................................................................35

Introduction 1
IN TR O D U CTIO N
Competitiveness in the production industry has increased during the last decades and has resulted in a need to optimize and control the chemical processes more rigorously. Chemical analyzers operating on-line provide fast results, which confer opportunities of feed-back control for the process. A closed sample handling system and immediate analysis also minimizes contamination and degradation of samples. Several analytical techniques used in the laboratory have been adapted to on-line process analysis, like chromatography [1], absorption spectrometry, electroanalysis, and wet chemistry in flow injection systems [2]. The availability of such feed-back systems in combination with chemometric techniques has dramatically improved the conditions for process optimization. As a result of this development an increase in productivity, higher quality, and reduction of waste have been achieved. However, it should be emphasized that accurate, informative and reliable analyses are required for the process control and optimization to be successful [3].
Analyzers based on flow injection have great potential in process analysis [4-6] both as complete analytical systems or as units for sample preparation and transport.
History of Flow Injection
Flow injection analysis, FIA, has become a very popular technique in analytical laboratories following its introduction in the mid-1970 [7]. The main reasons for this are its relative simplicity, the high sample throughput, and the comparably low cost.
The flow injection technique is based on three major factors, reproducible injection, a reproducible reaction time, and controlled dispersion. The controlled dispersion arises from laminar flow, secondary flow, and molecular diffusion of the liquids while they are transported in a narrow bore tube. As a consequence of this controlled dispersion, every injected sample in a specific flow injection system is treated in the same way, and therefore highly reproducible results are obtained. There is no need for homogeneous mixing and, in cases where chemical reactions are involved, it is not necessary that the reaction has reached equilibrium before detection, provided there are no matrix components present in the sample that change the reaction rate for the analyte.
In the early years FIA was mainly used to automate existing wet chemical analyses, e.g., in the determination of ammonia [8] and phosphate [9]. The flow injection technique has, nowadays, a much broader field of application and is used as an automated solution handling system for sensors and electrodes [Paper II, 10], chromatography [Paper IV, 11], and analytical instruments based on the inductively coupled plasma, ICP, [12], atomic absorption
2 Flow Injection Systems for Process Analytical Chemistry
spectrometry [13, 14], flow cytometers [15], and various types of spectrophotometers such as ultra-violet/visible diode-array, and Fourier transform infrared spectrometry, FTIR, [16,17]. These techniques and analyzers require different types of sample preparation which can often be achieved by flow injection.
The latest development of the flow injection technique is called sequential injection, SI, and provides a more robust methodology compared to traditional flow injection. The manifold is simpler, only a single line. The flow is propelled by a bi-directional pump, e.g., a syringe pump, which contributes highly to the robustness [18]. The hub in the manifold is the multiposition valve which provides access to several solutions in the single line manifold.
Flow Injection Techniques 3
FLOW INJECTIO N TECHN IQUES
Terminology
The terms, flow injection analysis and, flow injection have already been used in the introduction. Flow injection analysis, FIA, has over the years become a general term used for low pressure narrow bore flow systems. The term, FIA, is in this thesis used in a more precise manner, where the flow injection manifold and the detector can be considered as a complete analytical instrument, whereas flow injection (FI) is used in a broader context also involving situations where the system serves as a sample handling step prior to another instrument. The same definition is also used for, sequential injection, SI, and sequential injection analysis, SLA.
Flow Injection Analysis
The flow injection analysis manifold, in its simplest form, consists of a single line. For example, the sample is injected into a continuously pumped reagent stream, and the reaction occurs during the transport to the detector. If the reagent is expensive and the sample is available in large quantities, the reagent can be injected into the continuously pumped sample stream, reversed FLA [19]. Computer control of the pump or injector is not necessary, but it increases the flexibility.
The propelling unit should, ideally, produce a constant pulse-free flow rate. Several techniques such as gas pressure and gravitational units can be used to accomplish this. The most common flow propelling unit is the peristaltic pump. It is simple, small, and easy to handle. However, it provides both a pulsating flow, and changes in flow rate over time. The changes in flow rate arise from wear and tear of the pump tubings, but this can be limited by using material which is compatible with the solutions being pumped and by changing the tubes frequently. If new tubes are conditioned by running the pump for a while until the flow-rate is stabilized, the flow-variation is minimized.
The injector should introduce a precise volume of sample solution into the carrier as a plug, without disturbing the flow. The four-way rotary valve is commonly used, where the loop size determines the sample volume. Other valves like proportional injectors and solenoid valves have also been used [19-21]. Narrow bore tubing extruded from PTFE, poly(tetrafluoroethene), is suitable as transporting channel and inner diameters between 0.3-0.8 mm are most used. Finally, the detector, which should provide fast, reproducible and continuous response, and for this purpose a large variety of electrochemical and optical detection principles have been used.
4 Flow Injection Systems for Process Analytical Chemistry
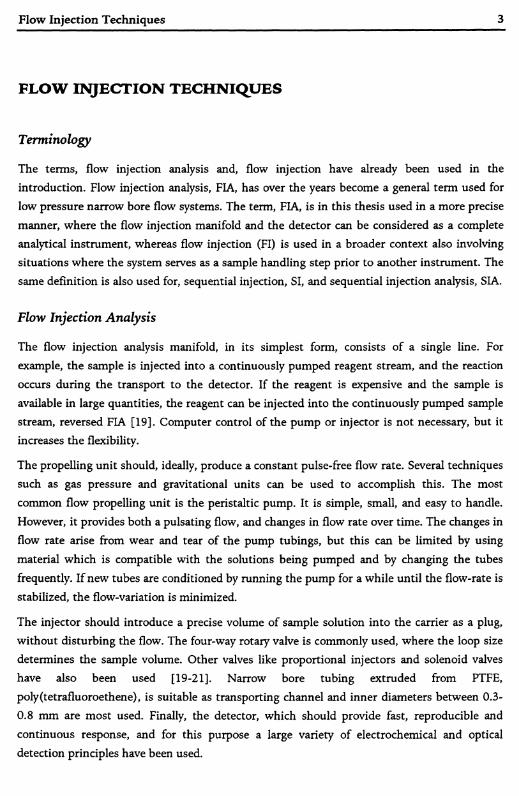
Multiple line manifolds have been developed to accommodate more complex reagent mixtures. Several stream lines, from one or more pumps, are merged at confluence points along the way to the detector. This way of practicing FIA has been termed the merging zone technique (Figure 1). The flow injection analysis manifold is thus very flexible and can be designed to accommodate almost any chemical reaction, but the manifolds required for more complicated chemistries often tends to grow into very complex systems.
Figure 1. Schematics of two typical flow injection analysis systems. The upper is, a single line
manifold and the lower a merging zone manifold with two reagent lines. P=pump, S=injection
valve with sample loop, MC= mixing coil, D=detector, W=waste, RI, R2, R=reagents,
C=carrier.
Stopped Flow
The stopped-flow technique can be applied in a regular flow injection manifold. It requires precise control and timing of the pump, in order to stop and restart the pump in a reproducible manner, at specific times. The important advantage is the possibility to extend the reaction time for a chemical reaction, without increasing the dispersion or liquid consumption [22]. Reaction rates can be measured by arresting the sample zone in the detector and then monitoring the product formation as a function of time. The reaction rate signal is independent of the background signal and is therefore suitable for samples with varying background levels.
Double Injection
The double injection manifold is quite similar to a regular single line flow injection manifold. The injector contains two or more injection loops, which are used to inject zones simultaneously into the carrier stream. The zones penetrate each other on the way to the
Flow Injection Techniques 5
detector. An advantage of the double injection technique is that both sample and reagents can be injected into the single line manifold, resulting in low consumption of both sample and reagent [19,23, 24].
Sequential Injection Analysis
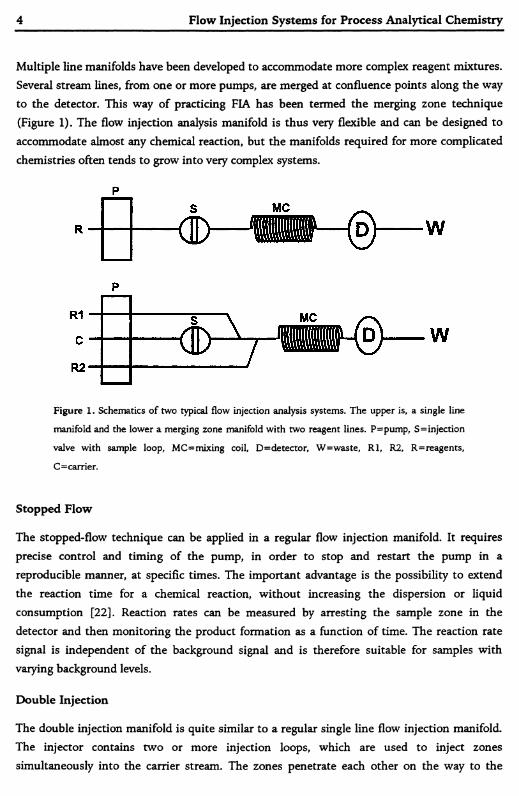
The sequential injection manifold has a simpler design compared to conventional flow injection manifolds while maintaining flexibility, Figure 2. A single line manifold containing a computer controlled multiposition valve and a bi-directional pump, usually a syringe pump, can replace the sometimes very complex manifolds needed in FIA [18,25-27]. The multiposition valve has a common port connected to the pump, and several selection channels connected to various solution reservoirs, the detector, etc. The channels can be arbitrarily selected, one at the time. This provides a system with the capability to aspirate reagents, samples, calibration solutions, and so on, in any desired order. The pump can be a high precision peristaltic pump [28], a sinusoidal flow syringe pump [29], or a linear syringe pump [30]. The syringe pump has the advantage of being more robust, due to its lack of pump tubings. The disadvantage is a limited stroke volume of the syringe, in contrast to the peristaltic pump, which can pump the carrier solution continuously. Rinsing of the holding coil can also be performed with a syringe pump by installing a three way valve between the syringe and the holding coil, as in a burette pump [30].
HCSP R2 MC
MP
R3
S2
Figure 2. Schematic of a sequential injection analysis manifold. SP=syringe pump,
MP=multiposition valve, HC and MC=holding and mixing coils, D=detector, W=waste, Rl-
R3=reagents, C=carrier, S=sample, ST1, ST2=standards.
A typical example of an analytical procedure, using a syringe pump can be performed as follows:
• Initially the pump is primed by filling the flow lines with liquid and removing all air bubbles from the system.
• A large volume of wash solution, typically water (2-3 ml), is aspirated into the syringe and the holding coil by running the pump in reversed direction.
6 Flow Injection Systems for Process Analytical Chemistry
• The valve is turned to the sample line and 50-200 fil sample is aspirated.
• The valve is moved to the reagent 1 position and 50-200 fi\ is aspirated.
• Finally 50-200 fil of reagent 2 is aspirated from its line on the valve.
• The valve is finally turned to the line connected to the detector, the pump is started, and sample and reagents are propelled to the detector and during this transport the solutions are mixed by dispersion.
The wash solution has the same function as a carrier in conventional flow injection analysis,i.e., to rinse the coils and restore the baseline of the detector. In sequential injection the wash solution also prevents sample from entering the syringe and thereby hinders carryover between samples.
A good example of the complicated chemistries that can be carried out with the sequential injection analysis technique is the determination of Factor XIII (a blood coagulating factor) where six reagents are involved [31].
Practical Aspects in Sequential Injection
Contamination caused by the multiposition valve
The multiposition valve is the hub in the SI system where several solutions are connected by the valve and are available in the analysis. The necessary solutions like sample and reagents are of course connected, but also, calibration solutions and solutions for cleaning of the sensor or detector may be used. The Valeo 10-port multiposition valve is equipped with a common channel which is connected to each channel in turn as the rotor revolves. The valve can only turn clockwise, and when moving from port 1 to 10 all channels are passed. Great care must be taken not to build up a pressure difference between the syringe and any other channel in order not to contaminate the main stream with any unwanted solution. The solutions and the order these solutions are connected to the valve must therefore be chosen with care and the pump must also be stopped for 3-4 seconds prior to actuating the valve.
Sample carry-over
Another important factor to be considered in SI is carry-over in the sample line. Residues from the previous analysis left in the sample line of the multiposition valve will contaminate the next sample aspirated, if not removed. There are several ways to overcome this problem [25], first, the sample line may be cleaned by aspirating a portion of sample and discarding it through the auxiliary waste. Second, a portion of wash may be expelled via the sample line followed by aspiration of fresh sample. This procedure is only recommended if a large volume of sample solution is available and the contamination from the sample line is negligible. A third way is possible only when reagents are used and involves aspiration of such a large

Flow Injection Techniques 7
sample volume that the contaminated zone never comes in contact with the dispersed reagents. The first way is safest and has the greatest applicability, and it is preferred by the author. The drawback with the first and second ways is that they include an extra aspiration cycle which takes time and consequently lowers the sample throughput.
Computer control
A computer controlled SI manifold is mandatory if all the advantages of SI are to be exploited. All aspiration volumes are determined by the time the pump is drawing solution from a selected stream and changes in volumes are simply effectuated by changing the pump run time or speed from the computer.
The computer control was previously regarded as a disadvantage of SI [26], but nowadays, when computers have become everyday tools in laboratories, computer control can hardly be considered as a serious drawback. Considering all the benefits gained by computer control, like unattended runs, good reproducibility, simple manifolds and ease of variation of volumes, stop flow, flow reversals, etc., the expense and complexity of a computer are by far outweighed.
In Paper II, an SI system without computer control was used. It was designed so that the start of the valve was triggered by the position of the cam of the pump. Screws were mounted at 30 degree increments on the cam, and when a screw hit a micro switch the rotor moved one step. The advantage with such a configuration is, that the aspiration volumes are only dependent on the distance between the screws on the cam and totally independent of time and pump speed. The uncomputerised system also becomes very compact and thus suitable as a portable system.
Principles o f Flow Injection
Read-out
A transient signal is registered when the dispersed sample zone passes through the detector. The typical output from FLA, by some termed a "fiagram", is a single peak. The simplest and most common readout is peak height. The peak height is directly proportional to concentration, provided the detector has a linear response in the actual range. The peak amplitude measurement is often made on the peak apex but can be made anywhere on the ascending or descending part of the peak. This is applied in so called artificial dilution (See section flow injection gradient). Peak area is also directly proportional to concentration, provided the pump speed is reproducible. A disadvantage may be the requirement for a computer or integrator to undertake the integration, and also, information from gradients is lost [19,21]. For sample series with large variations in viscosity and density, however, the peak area may in
8 Flow Injection Systems for Process Analytical Chemistry
some cases improve the precision of the read-out. The dispersion is dependent on viscosity and density, and peak area measurements are less sensitive to variations in dispersion [32]. Finally, the peak width is proportional to the logarithm of the concentration, but the precision obtained with this kind of measurement is lower than for peak height and peak area. The peak width has never the less been used successfully in flow injection titration measurements.[19,21]
Dispersion
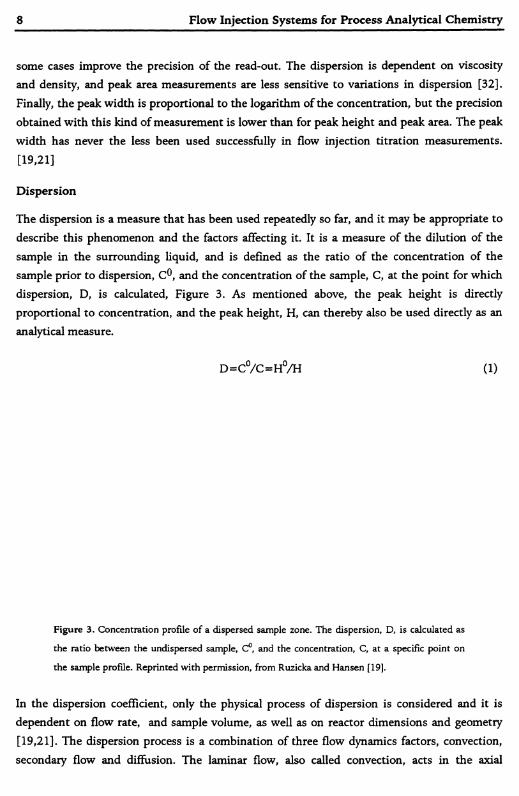
The dispersion is a measure that has been used repeatedly so far, and it may be appropriate to describe this phenomenon and the factors affecting it. It is a measure of the dilution of the sample in the surrounding liquid, and is defined as the ratio of the concentration of the sample prior to dispersion, C°, and the concentration of the sample, C, at the point for which dispersion, D, is calculated, Figure 3. As mentioned above, the peak height is directly proportional to concentration, and the peak height, H, can thereby also be used directly as an analytical measure.
D=C°/C=H°/H (1)
Figure 3. Concentration profile of a dispersed sample zone. The dispersion, D, is calculated as
the ratio between the undispersed sample, C°, and the concentration, C, at a specific point on
the sample profile. Reprinted with permission, from Ruzicka and Hansen [19].
In the dispersion coefficient, only the physical process of dispersion is considered and it is dependent on flow rate, and sample volume, as well as on reactor dimensions and geometry[19,21]. The dispersion process is a combination of three flow dynamics factors, convection, secondary flow and diffusion. The laminar flow, also called convection, acts in the axial
sisa0002
Maskinskriven text
Bild borttagen – se tryckt version Image removed – see printed version
sisa0002
Maskinskriven text

Flow Injection Techniques 9
direction and gives rise to a parabolic flow profile. The flow velocity of the streamline in the center of the channel is, according to the model twice, the average velocity, while the flow rate at the wall of the tube will tend to zero, Figure 4 [33]. Molecular diffusion and secondary flow are the two forces which act in the radial direction. By molecular diffusion the analytes move between streamlines. Molecules at the wall of the tube will therefore diffuse into faster moving lines, while molecules from the center will diffuse into the slower moving streams adjacent to the wall. In a completely straight tube only laminar flow and diffusion prevail, but if curvature is present, a secondary flow is introduced. The secondary flow introduces radial mixing by enabling the streamlines to cross each other. As mentioned above, under laminar flow conditions the fluid in the center of the tube has twice the average velocity, and therefore also twice the average momentum. The central element of fluid will therefore strive to travel in a straight path to a higher degree than other streamlines when a curve in the flow path is encountered. This difference in centrifugal forces on the streamlines causes the secondary flow in the tube. At very low flow rates this effect is small, due to the weak centrifugal forces, while at high flow rates the effect is substantial and dispersion decreases markedly. The effect is magnified by the sharpness of the tube curvature and by alterations in its directions, and a knitted tube is therefore more effective for mixing than a coiled tube [19,21].
Figure 4. Cross-section of a laminar flow-profile. The streamlines under laminar flow conditions
form a parabolic flow velocity profile.
Flow Injection Gradient
A simple form of concentration gradient is generated by injecting a sample plug into a carrier stream which is subjected to dispersion, e.g., introducing a mixing chamber in the system to promote turbulent flow. Large dispersion, D>10, generates a gradient suitable for titrations in the flow injection system. Linear gradients can be generated by using programmable pumps, as in paper I.
The advantage of the gradient is exploited in gradient dilution where the readout of the peak is performed at specific time slices on the slope of the peak instead of at the peak maximum. This enables readout at more suitable sample to reagent ratios, or in a linear detection range, without having to manually dilute the sample. In the same way and for the same reason the gradient can be used in a stop-flow method. The gradient can also be used for single standard

10 Flow Injection Systems for Process Analytical Chemistry
calibration which is discussed in a section below. The gradient can furthermore be used to improve the selectivity in the determination of the species used in multicomponent determination [19,21].
Zone Penetration
An essential parameter in most sequential injection applications is zone penetration, i.e., mutual dispersion of zones into each other [26]. The zone penetration, or zone overlap, can be calculated, analogous to the calculation of resolution in chromatography, Figure 5.
P=2W0(Ws+W r)-l (2)
Figure 5. Zone penetration of sample and reagent plugs in a single line manifold. Wr=width of
reagent zone, Ws=width of sample zone, W0=width of overlap, Iç)=iso dispersion point.
Reprinted with permission, from Gubeli et al. [26].
Partial zone overlap, P, varies between 0 and 1, where complete overlap is obtained for P=1 and no overlap gives P=0. Zone penetration is a result of dispersion and is therefore affected by the same parameters, i.e., sample volume, and reactor volume, but also by flow reversals, made possible by a bi-directional pump. Iq is the isodispersion point, at which point both zones have reached the same degree of dispersion.
Flow Reversals
Flow reversals increase the travel length of the sample and therefore increase the sample dispersion without increasing the liquid consumption or modifying the manifold. The peak shape changes from skewed to a more Gaussian form with an increasing number of mixing steps [34, 35]. Compared to a single line conventional FI system, the dispersion of the peak
sisa0002
Maskinskriven text
Bild borttagen – se tryckt version Image removed – see printed version

Flow Injection Techniques 11
obtained by reversing the flow is lower, and the peak width is narrower given the same distance traveled [36]. By each reversal of the flow the parabolic flow profile is collapsed and therefore the axial dispersion will decrease compared to unidirectional dispersion with a corresponding travel length. From chromatography and the random walk theory an equation describing zone broadening can be applied to flow reversals [18,26].
s=lN* (3)
s=standard deviation of peak, N=number of steps, l=length of mixing steps. Two phenomena can be explained by this equation, first increasing the length of the mixing step is more efficient than increasing the number of mixing steps. Second, the first mixing step is the most efficient one [26]. Multiple flow reversals increase the overall cycle time and therefore decrease sample throughput, and are thus only used when an increased mixing without increasing axial dispersion is necessary.

12 Flow Injection Systems for Process Analytical Chemistry
CALIBRATION TECHN IQ U ES IN FLOW IN JECTIO N
During the calibration procedure the relation between the detector response and concentration is established. Internal standards, standard additions and calibration curves, are used for this purpose. The calibration procedure can be implemented in the flow injection method by taking advantage of the precise and reproducible dilution by the dispersion process. The establishment of a calibration curve from a single standard and standard addition in flow injection processes are discussed below.
Single Standard Calibration
A calibration performed by a single standard in the regular flow injection manifold is preferred if the goal is to keep the procedure simple and fast. Single standard calibration can be performed by taking advantage of the concentration gradient formed by the dispersion. Several methods for single standard calibration in flow injection have been suggested in the literature [37, 38]; two methods will be described here.
Gradient Calibration
Figure 6. Principle of gradient calibration. The segments of the gradient are correlated to the
height of the calibration standards to generate a calibration curve. Reprinted with permission,
from Ruzicka and Hansen [19].
One type of single standard calibration is termed gradient calibration. This technique exploits the whole transient signal of a standard solution. The gradient contains information on the whole concentration range, at different time segments. By conventional calibration with a series of standards, corresponding time segments on the gradient can be identified, Figure 6.
sisa0002
Maskinskriven text
Bild borttagen – se tryckt version Image removed – see printed version
sisa0002
Maskinskriven text

Calibration Techniques in Flow Injection Analysis 13
After the initial calibration all subsequent calibrations can be performed by a single standard [19, 39]. This calibration method does not exclude the tedious work of preparing solutions and measuring a standard series. However, the recalibrations are fast and simple after the initial calibration has been performed. The calibration is based on a single measurement, and an error in this measurement is propagated to the calibration curve as a systematic error.
Single Standard Calibration in Sequential Injection
Figure 7. Single standard calibration in sequential injection. The dilution conduit generates and
stores the concentration gradient used for the calibration. Reprinted with permission, from
Baron et al. [40].
This calibration method is based on an in-line dilution of the standard, performed before addition of reagents, and this calibration method can therefore be performed even when multiple reagents are involved [40]. The dilution of the standard is done by aspirating a volume of standard solution into the holding coil and thereafter transporting it into a dilution conduit, see Figure 7. The standard is dispersed into the carrier while being propelled in the holding and dilution coil and a concentration gradient is formed in the dilution conduit. From the dilution conduit, portions of the diluted standard are aspirated, as from a regular sample line, and transported to the detector.
The degree of dilution in the concentration gradient contained in the dilution conduit depends on the volume of standard solution (stock) Vs, transfer volume VT (the volume transferred to the dilution conduit) and volume of the standard aliquots V^, which should be equal to the analyte volume. The dispersion is also dependent on length and diameter of tubing and flow rate.
Dwj = DdqDhc-DhcDd =c°/ci(Vs,VT,VA) (4)
The total dispersion Dtot,i is the dispersion that a standard aliquot is exposed to during the transport to the detector, involving dispersion of the stock solution in holding coil Dhc>
sisa0002
Maskinskriven text
Bild borttagen – se tryckt version Image removed – see printed version
sisa0002
Maskinskriven text
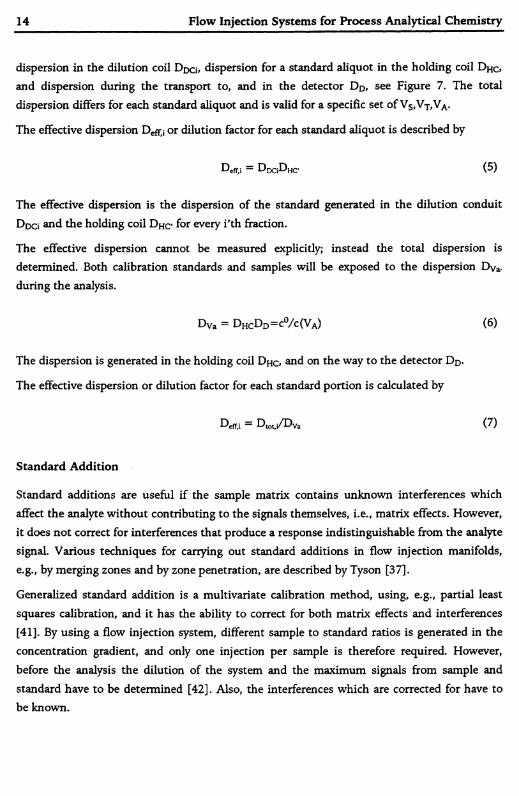
14 Flow Injection Systems for Process Analytical Chemistry
dispersion in the dilution coil Ddcû dispersion for a standard aliquot in the holding coil Dho and dispersion during the transport to, and in the detector Dd, see Figure 7. The total dispersion differs for each standard aliquot and is valid for a specific set of Vs,Vj,VA.
The effective dispersion Deff,i or dilution factor for each standard aliquot is described by
Deff,i = D dcì^ hc' (5 )
The effective dispersion is the dispersion of the standard generated in the dilution conduit Ddo and the holding coil Dhc for every i'th fraction.
The effective dispersion cannot be measured explicitly; instead the total dispersion is determined. Both calibration standards and samples will be exposed to the dispersion Dya> during the analysis.
Dva = D hcD d = c0/ c(Va ) (6)
The dispersion is generated in the holding coil Dho and on the way to the detector Dq.
The effective dispersion or dilution factor for each standard portion is calculated by
Deff,i = Dtotji/D Va (7)
Standard Addition
Standard additions are useful if the sample matrix contains unknown interferences which affect the analyte without contributing to the signals themselves, i.e., matrix effects. However, it does not correct for interferences that produce a response indistinguishable from the analyte signal. Various techniques for carrying out standard additions in flow injection manifolds, e.g., by merging zones and by zone penetration, are described by Tyson [37].
Generalized standard addition is a multivariate calibration method, using, e.g., partial least squares calibration, and it has the ability to correct for both matrix effects and interferences [41]. By using a flow injection system, different sample to standard ratios is generated in the concentration gradient, and only one injection per sample is therefore required. However, before the analysis the dilution of the system and the maximum signals from sample and standard have to be determined [42]. Also, the interferences which are corrected for have to be known.
Calibration Techniques in Flow Injection Analysis 15
Multivariate Calibration
The aim of multivariate calibration is to establish a more informative relationship between X (response) and Y (concentration) than can be accomplished using univariate calibration. A characteristic feature is that X is a matrix containing many variables. The x-variables can be, e.g., a spectrum from a diode-array spectrophotometer, signal intensities in a "fiagram", or a combination of these two. There are several statistical methods available for multivariate calibration, and among these are multiple linear regression, MLR, principal component regression, PCR, and partial least squares regression, PLS. Only the last method will be discussed in this thesis. PLS can handle fat data matrixes, i.e., datasets with more x-variables than samples, co-linearities in X and Y, several y-variables and also missing data points. The three last features make it suitable for process analytical chemistry data.
cal
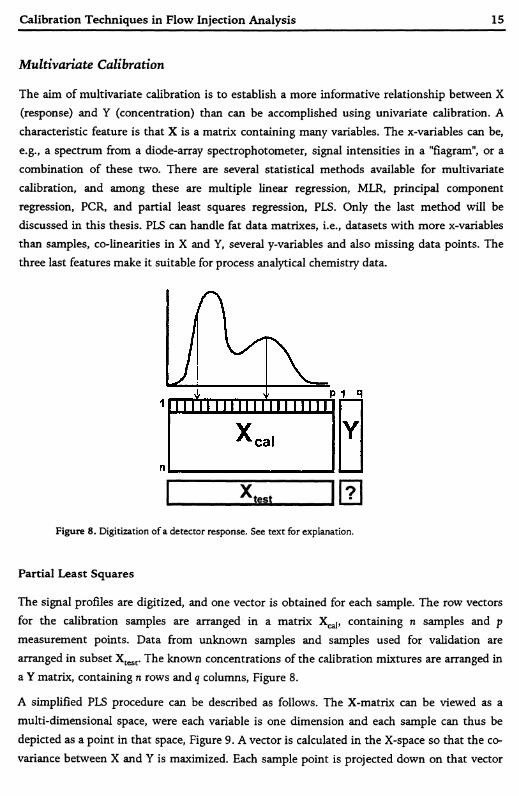
I x,„, ~ |f?1Figure 8. Digitization of a detector response. See text for explanation.
Partial Least Squares
The signal profiles are digitized, and one vector is obtained for each sample. The row vectors for the calibration samples are arranged in a matrix Xcal, containing n samples and p measurement points. Data from unknown samples and samples used for validation are arranged in subset Xtest. The known concentrations of the calibration mixtures are arranged in a Y matrix, containing n rows and q columns, Figure 8.
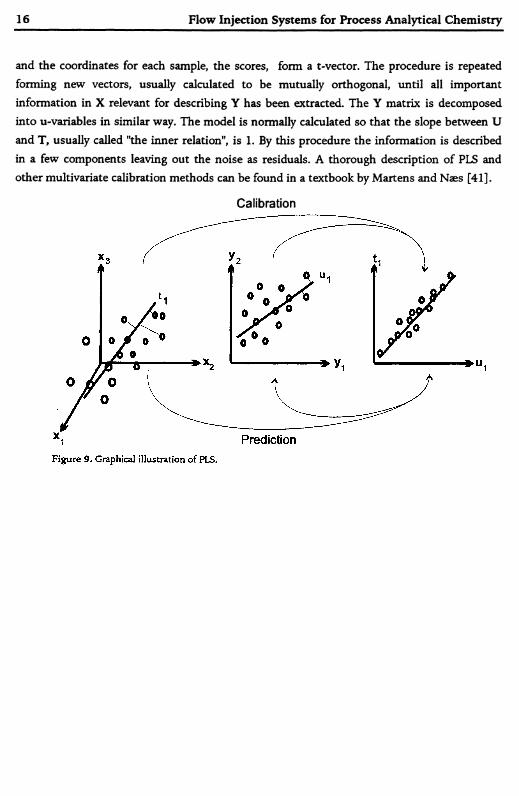
A simplified PLS procedure can be described as follows. The X-matrix can be viewed as a multi-dimensional space, were each variable is one dimension and each sample can thus be depicted as a point in that space, Figure 9. A vector is calculated in the X-space so that the co- variance between X and Y is maximized. Each sample point is projected down on that vector
16 Flow Injection Systems for Process Analytical Chemistry
and the coordinates for each sample, the scores, form a t-vector. The procedure is repeated forming new vectors, usually calculated to be mutually orthogonal, until all important information in X relevant for describing Y has been extracted. The Y matrix is decomposed into u-variables in similar way. The model is normally calculated so that the slope between U and T, usually called "the inner relation", is 1. By this procedure the information is described in a few components leaving out the noise as residuals. A thorough description of PLS and other multivariate calibration methods can be found in a textbook by Martens and Næs [41].
Calibration
PredictionFigure 9. Graphical illustration of PLS.
Process Analysis 17
PRO CESS ANALYSIS
Process analysis is categorized mainly on the basis of the different sampling strategies; offline, at-line, on-line, in-line and non-invasive. Some authors also view it as an evolutionary chain in the development of process analysis [43].
Off-line analysis is the traditional way of process analysis, where the sample is sent to a central laboratory after manual sampling. The advantage with a central laboratory is access to sophisticated instruments operated by skilled personnel.
In order to shorten the distance and time gap between sampling and analysis, the analyzer can be placed in close proximity to the process and the sample analyzed at-line. However, the environment at the process site is normally unsuitable for most laboratory instruments. Factors like dust, corrosive fumes, large temperature variations, etc., thus call for more robust instruments.
On-line analysis requires a sampling system automatically providing the analyzer with representative samples. The sampling system may also include filtering and sample conditioning, etc. The on-line system can, to some extent, protect the sample from contamination and degradation. On-line systems are suitable for intermittent techniques like chromatography, FIA etc. but also continuous techniques like spectroscopic instruments, which require sample conditioning before analysis.
The advantage of in-line and non-invasive analysis is the real-time monitoring without a sampling step. There is no risk for degradation of the sample and measurements can be done continuously. In in-line analysis a sensor or probe is placed in the process stream and the analysis is done in situ. Non-invasive techniques include spectroscopic, X-ray and acoustic methods, and are performed directly, or through a window, in the process line. A drawback with the in-line and non-invasive approaches is that a sensor or window continuously exposed to the process stream is likely to get fouled sooner or later, and this fouling can be difficult to detect. There are also limited opportunities for recalibration during operation.
Sampling
The total estimation error is the sum of the analysis error and sampling error. The sampling step is therefore very important in process analysis, and great care must be taken to select a representative sample. The reliability of the analyzer is usually controlled by frequent calibration, while the representativity of the samples is more difficult to check. The design of the sampling system is therefore critical to minimize the sampling error. Examples of
18 Flow Injection Systems for Process Analytical Chemistry
sampling hardware engineering can be found elsewhere [44-46]. Clevett has also listed some basic requirements for sample handling systems [44].
• The sample measured by the analyzer must represent the process stream with respect to the measured variable(s).
• The sample must be presented to the analyzer in a state and condition compatible with the analyzer.
• The time delay between a change in process conditions affecting the measured variable (s) and the response of the analyzer to that change must be acceptable.
• The sample system must be highly reliable, and require a minimum of maintenance.
• The total cost of the system must be kept to a minimum, subject to the aforementioned requirements.
• The system must be safe.
Sampling Theory
The composition of a sample taken at a sampling point is supposed to represent the whole batch at a particular time or location. If the lot is completely homogeneous the sampling error will be zero. Unfortunately this ideal situation does not exist in practice. Heterogeneity can, for example, be caused by dispersed phases or discrete particles, e.g., bubbles, liquid droplets or solid particles. It can also be caused by differences in physical properties like size, shape or density, or in chemical composition between or within individual particles [46].
Gy has set up some rules for a correct sampling technique;
• Any fraction of the batch can be selected for analysis.
• No discrimination between fragments of the sample due to design or performance of the sampling system during sampling.
• The sample has to be kept unaltered during sample processing, i.e., no losses, contamination, chemical or physical alteration, or intentional or unintentional changes may take place in the samples.
When the sampling procedure fulfills these criteria the sampling error will be a random variable and can be characterized by the normal statistical distribution models. The sample can be considered as representative when the accuracy and reproducibility are smaller than a set limit value [47].
Process Analysis 19
Sample Conditioning
As mentioned above, the sample should ideally be analyzed in the same condition as it is present in the process. However, in many cases the sample has to go through both conditioning and clean-up before it can enter the analyzer. Examples of conditioning are cooling, pressure reduction, and removal of gas bubbles or solid particles from the liquid.
Cross-flow filtration units
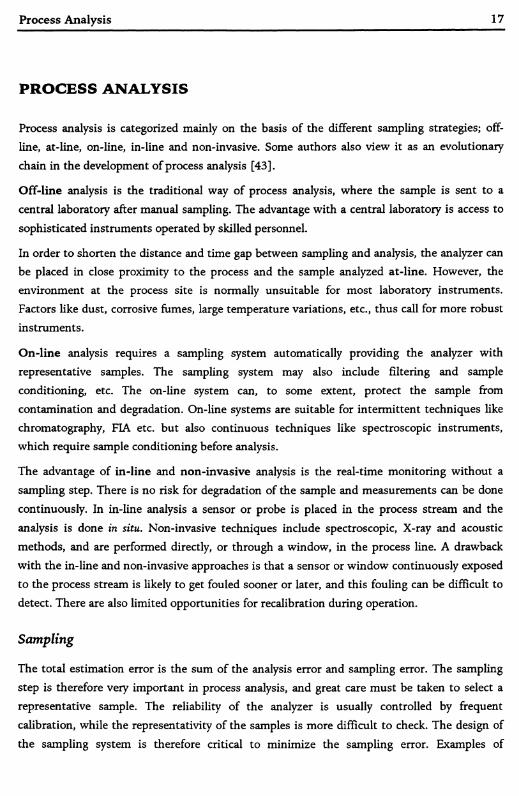
The cross-flow filtration unit described below fulfills several criteria important for a sampling/filtering unit used in bio-process monitoring. Steam sterilization is possible, the unit has low dead volume, it is simple to maintain, and it is not prone to clogging of the membrane [48].
The disk-shaped filtration unit is made of two stainless steel half-shells with a membrane in between, Figure 10. The fluid to be sampled is circulated at high speed, 0.5-1 I/m in., through a spiral-shaped groove on the donor side, and the high tangential flow thus created prevents the membrane from clogging. The filtrate is collected through a capillary which can be connected directly to the sample inlet of the flow injection manifold.
Figure 10. Schematics of a cross-flow filtration unit. Reprinted with permission, from Pedersen
et al. [49].
sisa0002
Maskinskriven text
Bild borttagen – se tryckt version Image removed – see printed version
sisa0002
Maskinskriven text
20 Flow Injection Systems for Process Analytical Chemistry
A micro-filtration unit was used in paper III to separate the yeast cells from the fermentation fluid. The filtration unit also worked as a sterile barrier between the reactor and the analyzer [24, 48, Paper III].
The same kind of unit has also been used with an ultra-filtration membrane in waste-water monitoring [49].
Clean-up o f Process Samples in Flow Injection Systems
Samples containing a sample matrix incompatible with the chosen analytical method have to be “cleaned-up”, e.g., by transferring the analyte from the complex matrix to a solution suitable for analysis. The aim of the separation of the sample matrix is to protect the analytical equipment and increase the selectivity of the analysis by removing interferences. The analyte may also be converted in the collector stream in order to improve sensitivity. Sample clean-up by, e.g., gas diffusion, dialysis, solvent extraction and solid phase extraction can be performed in flow injection systems. These systems can also usually perform preconcentration or dilution of the analyte simultaneously to the clean-up.
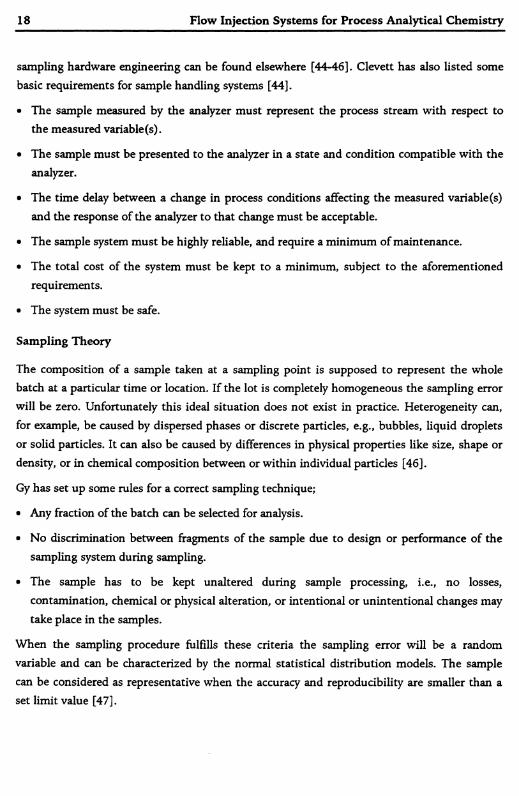
Figure 11. Gas-diffusion unit used in paper III. LS=to light source, D=to detector, S= PTFE
spacers, M=gas permeable membrane. Reprinted with permission, from Peres Pavon et al.
Anal.Chem. 64 (1992) 923.
Gas Diffusion
Gas diffusion is a powerful clean-up technique for analytes which can form a volatile compound. The analyte is converted to a volatile species in the donor stream and diffuses over to an acceptor stream through a gas-permeable membrane. The gas-diffusion unit consists of two parallel flow lines, the donor and acceptor streams, on each side of a membrane. The cell
sisa0002
Maskinskriven text
Bild borttagen – se tryckt version Image removed – see printed version
sisa0002
Maskinskriven text
Process Analysis 21
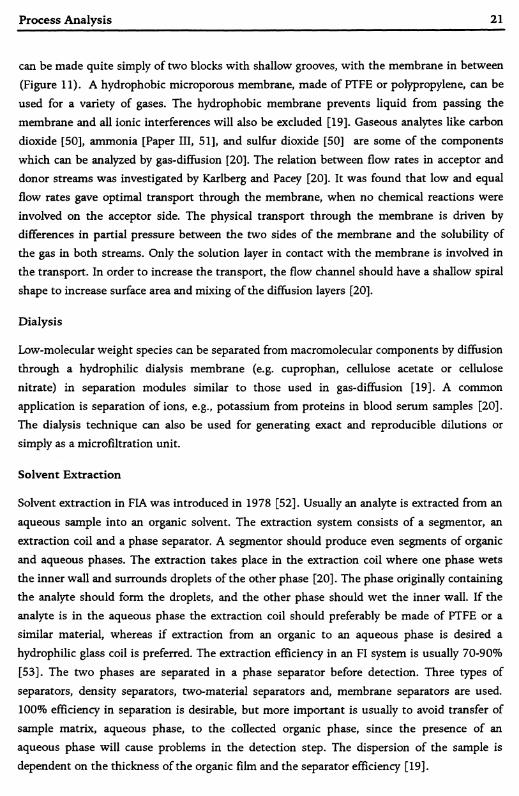
can be made quite simply of two blocks with shallow grooves, with the membrane in between (Figure 11). A hydrophobic microporous membrane, made of PTFE or polypropylene, can be used for a variety of gases. The hydrophobic membrane prevents liquid from passing the membrane and all ionic interferences will also be excluded [19]. Gaseous analytes like carbon dioxide [50], ammonia [Paper III, 51], and sulfur dioxide [50] are some of the components which can be analyzed by gas-diffusion [20]. The relation between flow rates in acceptor and donor streams was investigated by Karlberg and Pacey [20]. It was found that low and equal flow rates gave optimal transport through the membrane, when no chemical reactions were involved on the acceptor side. The physical transport through the membrane is driven by differences in partial pressure between the two sides of the membrane and the solubility of the gas in both streams. Only the solution layer in contact with the membrane is involved in the transport. In order to increase the transport, the flow channel should have a shallow spiral shape to increase surface area and mixing of the diffusion layers [20].
Dialysis
Low-molecular weight species can be separated from macromolecular components by diffusion through a hydrophilic dialysis membrane (e.g. cuprophan, cellulose acetate or cellulose nitrate) in separation modules similar to those used in gas-diffusion [19]. A common application is separation of ions, e.g., potassium from proteins in blood serum samples [20]. The dialysis technique can also be used for generating exact and reproducible dilutions or simply as a microfiltration unit.
Solvent Extraction
Solvent extraction in FIA was introduced in 1978 [52]. Usually an analyte is extracted from an aqueous sample into an organic solvent. The extraction system consists of a segmentor, an extraction coil and a phase separator. A segmentor should produce even segments of organic and aqueous phases. The extraction takes place in the extraction coil where one phase wets the inner wall and surrounds droplets of the other phase [20]. The phase originally containing the analyte should form the droplets, and the other phase should wet the inner wall. If the analyte is in the aqueous phase the extraction coil should preferably be made of PTFE or a similar material, whereas if extraction from an organic to an aqueous phase is desired a hydrophilic glass coil is preferred. The extraction efficiency in an FI system is usually 70-90% [53]. The two phases are separated in a phase separator before detection. Three types of separators, density separators, two-material separators and, membrane separators are used. 100% efficiency in separation is desirable, but more important is usually to avoid transfer of sample matrix, aqueous phase, to the collected organic phase, since the presence of an aqueous phase will cause problems in the detection step. The dispersion of the sample is dependent on the thickness of the organic film and the separator efficiency [19].

22 Flow Injection Systems for Process Analytical Chemistry
A simplified extraction system was recently described by Agudo [54], in which the segmentor, the extraction coil and the phase separator were excluded and the extraction takes place directly in the detector cuvette.
Solid Phase Extraction
Solid phase extraction is a useful method for sample clean-up and preconcentration in flow injection systems. The analyte can be separated from interfering components either by selective adsorption of the analyte or the interfèrent to the column material. If the analyte is adsorbed, a preconcentration of the analyte can be performed. A large amount of sample is passed through the column and thereafter the analyte is eluted by a small volume of eluent. The most commonly used adsorption materials are C18 silica, alumina or silica beads, but also ion-exchange columns are used for clean-up and preconcentration [55].
The column can be placed before the injection system, in the injection loop, between the injection system and the detector or, in some cases, in the detector [56]. In cases where the analyte is adsorbed to the column, it is wise to place the column before or in the injection loop, thereby avoiding the removed matrices from entering the detector.
Solid phase reactors may also be used when enzymatic, immunological, or redox reactions are involved. Solid phase reactors decrease dispersion compared to addition of reagents as liquids and thereby the sensitivity will be higher for a solid phase system.
Applications o f Flow Injection in Process Analytical Chemistry 23
A PPLICA TIO N S OF FLOW INJECTION IN PROCESS ANALYTICAL CHEM ISTRY
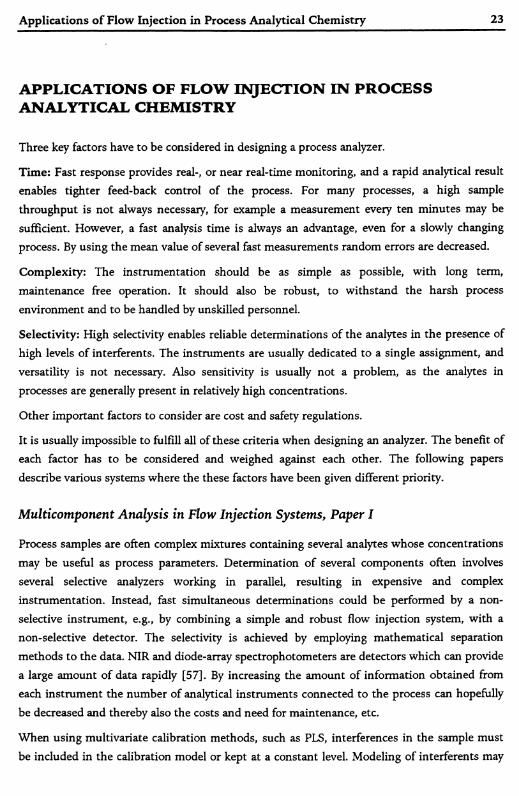
Three key factors have to be considered in designing a process analyzer.
Time: Fast response provides real-, or near real-time monitoring, and a rapid analytical result enables tighter feed-back control of the process. For many processes, a high sample throughput is not always necessary, for example a measurement every ten minutes may be sufficient. However, a fast analysis time is always an advantage, even for a slowly changing process. By using the mean value of several fast measurements random errors are decreased.
Complexity: The instrumentation should be as simple as possible, with long term, maintenance free operation. It should also be robust, to withstand the harsh process environment and to be handled by unskilled personnel.
Selectivity: High selectivity enables reliable determinations of the analytes in the presence of high levels of interferents. The instruments are usually dedicated to a single assignment, and versatility is not necessary. Also sensitivity is usually not a problem, as the analytes in processes are generally present in relatively high concentrations.
Other important factors to consider are cost and safety regulations.
It is usually impossible to fulfill all of these criteria when designing an analyzer. The benefit of each factor has to be considered and weighed against each other. The following papers describe various systems where the these factors have been given different priority.
Multicomponent Analysis in Flow Injection Systems, Paper I
Process samples are often complex mixtures containing several analytes whose concentrations may be useful as process parameters. Determination of several components often involves several selective analyzers working in parallel, resulting in expensive and complex instrumentation. Instead, fast simultaneous determinations could be performed by a non- selective instrument, e.g., by combining a simple and robust flow injection system, with a non-selective detector. The selectivity is achieved by employing mathematical separation methods to the data. NIR and diode-array spectrophotometers are detectors which can provide a large amount of data rapidly [57]. By increasing the amount of information obtained from each instrument the number of analytical instruments connected to the process can hopefully be decreased and thereby also the costs and need for maintenance, etc.
When using multivariate calibration methods, such as PLS, interferences in the sample must be included in the calibration model or kept at a constant level. Modeling of interferents may

24 Flow Injection Systems for Process Analytical Chemistry
be difficult, but it is also useful to mathematically separate contributions from analytes and interferents which give similar responses. Mathematical separation of inteferents may decrease the need for preprocessing of the sample, which saves time and also reduces the risk of introducing errors as a result of the conditioning.
Multivariate calibration methods like PLS use, e.g., a spectrum of a mixture to determine the separate concentrations of the involved analytes. The determination can often be performed even if the spectral differences are small and seem insignificant to the eye. This method was used in the determination of two metal ions by using the spectra from ion-reagent complexes [58-60]. The sample mixture is injected into a uniform reagent stream, and the resulting fiagram will contain only redundant information and therefore only a spectrum from one time slice at the peak maximum is used, and the spectral differences between the two ion- complexes are exploited.
Instead of using spectral differences, the gradient generated in a flow injection system can be exploited. This was done by Porter et al., who, by using a pH gradient, could determine Zn and Cd in a mixture by utilizing the pH dependent fluorescent reaction with 8- hydroxyquinoline-5-sulfonic acid [61]. Whitman et al. used a double injection system for simultaneous determination of iron and nickel, by injecting a complexing reagent for iron (persulfate and thiocyanate) and the sample in to a carrier stream (water). The two dispersed plugs consist of three partly overlapping zones, unreacted sample used for nickel detection, the central part where sample and iron reagent are mixed and thus contains information on both the nickel and iron content, and finally in the trailing part where unreacted reagent can be used as regent blank, see Figure 8. The individual concentrations can not be determined at any specific point in the fiagram because of the peak overlap, therefore a multivariate calibration is performed [23]. Prediction errors or reproducibility reported for the above discussed papers are in the range of 3-5 %.
Both of the above approaches work well for a limited number of components, but as the sample complexity increases, spectral differences, or the gradient alone, may not give sufficient selectivity to achieve good mathematical separation. By combination of the two approaches, as in paper I, a three-dimensional data matrix is obtained. Instead of a pH gradient, separation in the time domain can also be obtained by using kinetic differences [62].
In paper I, a two-pump gradient system was used to create a wide gradient, Figure 1 in paperI. The slope of the gradient can be altered by varying the time for the gradient pump to reach maximum speed. A diode-array detector was used for detection of UV-absorbing organic acids, and up to five organic acids were determined. These acids have spectra which differ in protonated and unprotonated form. To illustrate the advantage of using a three-dimensional data set, two analytes, sulfanilic acid and phenol, were detected at a single wavelength and with a diode-array detector.

Applications of Flow Injection in Process Analytical Chemistry 25
At a single wavelength, 290 nm, the analytes have a low absorption coefficient in the protonated form and a high coefficient in the unprotonated form. The response will therefore be a two-dimensional titration curve, whereas the diode-array detector adds information from the spectra resulting in a three-dimensional titration curve. The prediction error for a single wavelength was found to be 4.3 % and for the diode-array detector the error was 2.7 %, although, the sample concentrations using the diode-array detector were 10 times lower.
The difficulty in predicting two components with similar pK* and spectra are shown in an experiment where five acids in a mixture were determined. Two of the acids were very similar, nicotinic acid (3-pyridinecarboxylic acid), pK* 4.8, and picolinic acid (2-pyridinecarboxylic acid), pKa 5.4. Their spectra were hardly discernible by visual observation and the pIQ difference is small. Consequently, the prediction errors for these two components were significantly larger as compared to the other three components. Also, nicotinic acid showed a positive error, while nicotinic acid showed a negative error, see Table 3 in paper I. In this case a wider gradient would most probably improve the prediction errors.
The simplest method to generate a pH gradient in an FIA system is by injecting an acid in an alkaline carrier, or vice versa, followed by mixing in a mixing chamber. However, the gradient is usually steep and does not enable determinations of several components. This type of gradient is used in a paper by Poppi and Pasquini [63] where two acids where determined in a gradient using indicators for detection. Also in Paper I, a gradient generated in the same way was evaluated for the determination of sulfanilic acid and phenol, with very good results (prediction error 1.3 %). The two components have markedly different spectra and pK,, and can therefore be detected in a steep gradient. The gradient in the single line flow injection system was found to be more reproducible than the two-pump gradient, probably because it was less dependent on flow variations, which are primarily the result of wear and tear of the peristaltic pump tubing.
In all papers on PLS and FIA discussed in this section a photo diode-array detector or spectrophotometer was used. Other array detectors may very well also be used, e.g., an array of sixteen electrochemical sensors has been used for determination of twenty-seven phenolic compounds by HPLC separation and principal component analysis, PCA [64].
Sensor Injection, Paper II
Sensors are frequently used both in laboratories and process environments, and the most commonly used sensor is probably the pH electrode. In laboratories the measurements are usually performed by manually dipping the electrode in the solution, preceded, and sometimes also followed, by a calibration procedure. Frequent calibrations are important for most sensors and electrodes in order to correct for drift, sensitivity changes by surface fouling or poisoning, and to detect failure of the sensor. In process analysis the measurement is automated and the

26 Flow Injection Systems for Process Analytical Chemistry
sensor is often placed in-line, in the reactor or circulation line, for continuous real-time monitoring. Many types of in-line probes cannot be removed during operation and calibration and service of the sensor are not thereby possible while the process is running. There are, however, arrangements with safety valves from which the in-line sensor can be withdrawn, thereby enabling servicing and recalibration to be performed during operation [45].
An alternative to in-line monitoring is to place the sensor in a flow injection system in a bypass position to the process line, i.e., on-line monitoring. This arrangements is more complex than an in-line arrangement, since a sampling and flow system is required. However, the advantages are the capability for frequent calibrations, maintenance of sensor, and detection of drift. The flow system can also be used for sample manipulation and clean-up, for example to increase the ionic strength by mixing a sample with a potassium chloride solution prior to the pH measurement [65]. If the flow system is used only for sample transport to the sensor, the dispersion of the sample should be limited, so the sample is unaltered when reaching the sensor. Flow injection systems have been used as sampling systems for several sensors, e.g. ion-selective electrodes [65, 10], glucose electrodes [66, 67], and ion-sensitive FET sensors [68].
The flow system described in paper II has been termed sensor injection, and it consists of a flow injection or sequential injection system for transport of sample to the sensor. A flow system can provide small and reproducible sample volumes to the sensor. Sensor injection operates in an intermittent mode instead of in continuous mode, and this also has advantages. In intermittent operation, the sensor is exposed to a harsh sample matrix for only short periods of time, and this will reduce the risk of poisoning and surface fouling of the sensor. The lifetime of the sensor can also be extended if a suitable conditioning solution is provided to the sensor between measurements, i.e., a suitable carrier in the flow system. And finally, by utilizing the baseline response and frequent recalibrations, baseline drift and sensitivity changes can be controlled and corrected for.
When a sequential injection manifold is used together with the sensor, a cleaning sequence can be incorporated in the measurement cycle to reduce surface fouling. This was done in paper II, where glucose was determined in a fermentation broth by a glucose electrode, because sensitivity decreased due to fouling by proteins from the fermentation broth which adhere to the membrane containing the glucose oxidase. A solution of protease was thus used to clean the membrane and therefore the lifetime of the sensor was extended. The same method was used in paper III to prevent protein fouling of a gas diffusion membrane.
Re-calibration measurements have generally been performed in separate calibration procedures between sample measurements. These calibration procedures decreased the sample throughput, and therefore a method was developed where the calibration samples were incorporated in the sample analysis, also investigated in paper II. The calibration was

Applications of Flow Injection in Process Analytical Chemistry 27
performed by injecting two large volumes (—300 jA each) of buffer in a sequence, where one was a calibration standard and the other used as a sample. Each zone was detected independently at a single point where the overlap from the other zone was considered zero. A calibration curve was established from the calibration samples and, although the slope of the pH electrode response did not obey the Nemst law, (51.0 mV/decade), the prediction error for the samples was of the order of 0.3 pH units.
In this method the standards are subjected to a slightly higher degree of dispersion (D=1.3) compared to the sample zone (D = l.l) and they are therefore not exposed to the same treatment as they should be in a calibration. The initial calibration should be performed with standard buffers in the position of the sample. After the initial calibration has been performed a control of the calibration with the dual zone injection method is suitable. The response from baseline and standard is used for indication of both drift and sensitivity changes over a period of time. Unecessary and time-consuming recalibrations can thereby be avoided. By using the dual zone injection the response check can be performed while maintaining a high sample throughput, 45 samples/hour in the above experiment.
Wang and Taha [69] introduced a method they called batch injection analysis, for use primarily as an injection system to sensors. The sensor is placed in a container with a large volume of stirred blank solution and the sample is introduced, by a micro pipette, close to the sensor surface. The signal is similar to a FIA peak and the technique has the same advantages as in sensor injection, i.e., reproducible sample introduction, short sample exposure, and small sample volumes. However, the batch injection analysis technique lacks the versatility and automation of the sensor injection, and is dependent on the reproducibility of the manual injection. One minor advantage over sensor injection is, however, the cost, because neither valves nor pumps are used, and only a micro-pipette is needed. To improve the injection reproducibility, automated sample introduction by robots has been suggested, but thereby the cost will increase.
On-line Flow Injection Systems in Process Analysis, Papers III and IV
The benefit of flow injection systems in process analysis has been discussed since the mideighties [4, 5]. However, papers describing implementations of flow injection systems in online process analyzers are few, except in the area of bioprocess control. A number of flow injection methods have been applied on-line in microbial processes, e.g., determination of glucose, galactose, lactose, lactic acid, protein, biomass, and ammonia [70]. Rank et al. described a system measuring penicillin V, glucose and ethanol [71] and a method for simultaneous determination of L-glutamine and ammonia was presented by Palsson et al. [72]. Water quality control is another area where a couple of papers on on-line flow injection analysis have been published [49, 73]. Papers dealing with on-line measurements using flow

28 Flow Injection Systems for Process Analytical Chemistry
injection systems in other process applications are the determination of sulfite in brine [74], hydrogen cyanide in process gas from a cracking process [75], and glucose in cellulose hydrolysis and amygdalin containing effluents [76].
Flow Injection Analysis in Bioprocesses
In-line sensors are often used for control and feed-back regulation in bioreactors. However, they are limited to sensors which can be sterilized, preferably by steam, and thereafter the sensor cannot be removed, in order to keep the process free from unwanted microbes. Other, non-sterilizeable sensors may be used in combination and a sampling device with a sterile filter, e.g., the cross-flow filtration unit described earlier, where the filter serves as a sterile barrier between the bioreactor and the analytical system. After the sample is removed from the reactor it can be handled without maintaining it sterile, and the analysis is therefore not limited to selective sensors only. Any suitable analytical method can thus be applied.
In the CPAC fermentation laboratory (CPAC, University of Washington), a laboratory-scale fermenter was used to run yeast fermentations as test processes for the development of new analyzers. As an example, simple flow injection systems, suitable for on-line process monitoring, were developed. In the paper by Chung et al. [24], glucose, ammonium and total protein were determined by utilizing stop-flow and reaction rate measurements in a double injection manifold. However, the analysis was limited to single reagent reactions, and some methods did not perform well. A year later, the sequential injection technique was implemented in the glucose determination, and thereby a more flexible manifold could be created [77]. The determinations of high and low concentrations of glucose were split into two different analytical sequences. In the determination of high concentration samples, 1-5 g/L glucose, a smaller and more dispersed sample was used, and the stop flow was also performed on the tailing portion of the peak, to accommodate the high concentrations. In a recent paper, a Danish group described a sequential injection system where glucose, lactic acid and penicillin determination is performed in a single manifold [78].
Ammonia Determination in Flow Injection, Paper III
Determination of both ammonia and total ammonium nitrogen in yeast fermentation processes requires a method which can accommodate very wide concentration ranges, and the goal was to cover the range between 0-350 mM in one on-line monitoring method. The ammonia and ammonium levels are important variables to monitor and control in many bioprocesses. Ammonia is sometimes added to the bioprocess as a nutrient or to regulate pH, but excessively high levels can affect the process in a negative way. Ammonia is also a common analyte in the monitoring of water quality for different applications. Consequently, several methods for ammonia determination in flow injection systems have been described in the literature. The most common methods are based on classical color reactions like the
Applications o f Flow Injection in Process Analytical Chemistry 29
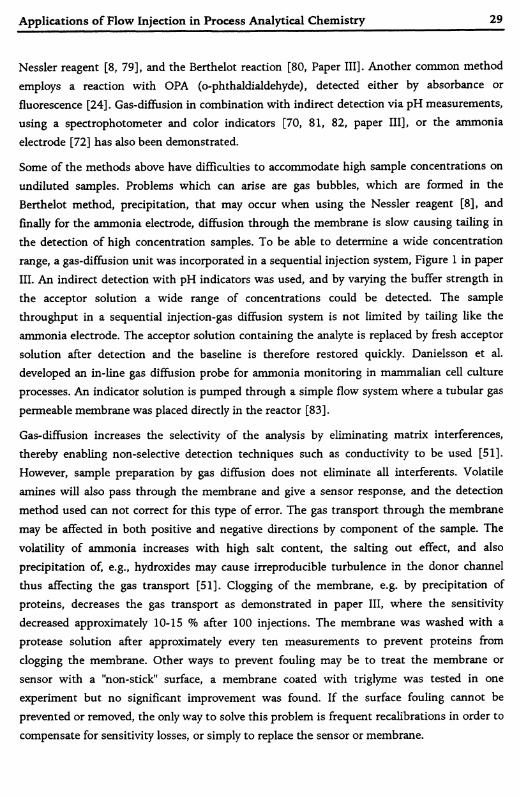
Nessler reagent [8, 79], and the Berthelot reaction [80, Paper III]. Another common method employs a reaction with OPA (o-phthaldialdehyde), detected either by absorbance or fluorescence [24]. Gas-diffusion in combination with indirect detection via pH measurements, using a spectrophotometer and color indicators [70, 81, 82, paper III], or the ammonia electrode [72] has also been demonstrated.
Some of the methods above have difficulties to accommodate high sample concentrations on undiluted samples. Problems which can arise are gas bubbles, which are formed in the Berthelot method, precipitation, that may occur when using the Nessler reagent [8], and finally for the ammonia electrode, diffusion through the membrane is slow causing tailing in the detection of high concentration samples. To be able to determine a wide concentration range, a gas-diffusion unit was incorporated in a sequential injection system, Figure 1 in paper III. An indirect detection with pH indicators was used, and by varying the buffer strength in the acceptor solution a wide range of concentrations could be detected. The sample throughput in a sequential injection-gas diffusion system is not limited by tailing like the ammonia electrode. The acceptor solution containing the analyte is replaced by fresh acceptor solution after detection and the baseline is therefore restored quickly. Danielsson et al. developed an in-line gas diffusion probe for ammonia monitoring in mammalian cell culture processes. An indicator solution is pumped through a simple flow system where a tubular gas permeable membrane was placed directly in the reactor [83].
Gas-diffusion increases the selectivity of the analysis by eliminating matrix interferences, thereby enabling non-selective detection techniques such as conductivity to be used [51]. However, sample preparation by gas diffusion does not eliminate all interferents. Volatile amines will also pass through the membrane and give a sensor response, and the detection method used can not correct for this type of error. The gas transport through the membrane may be affected in both positive and negative directions by component of the sample. The volatility of ammonia increases with high salt content, the salting out effect, and also precipitation of, e.g., hydroxides may cause irreproducible turbulence in the donor channel thus affecting the gas transport [51]. Clogging of the membrane, e.g. by precipitation of proteins, decreases the gas transport as demonstrated in paper III, where the sensitivity decreased approximately 10-15 % after 100 injections. The membrane was washed with a protease solution after approximately every ten measurements to prevent proteins from clogging the membrane. Other ways to prevent fouling may be to treat the membrane or sensor with a "non-stick” surface, a membrane coated with triglyme was tested in one experiment but no significant improvement was found. If the surface fouling cannot be prevented or removed, the only way to solve this problem is frequent recalibrations in order to compensate for sensitivity losses, or simply to replace the sensor or membrane.
30 Flow Injection Systems for Process Analytical Chemistry
Determination of free ammonia was performed by using an acceptor solution of unbuffered BTB solution, and a calibration range of 0-1 mM ammonia was covered. However, normally the levels of free ammonia in the yeast fermentation broth are very low, due to a pH of approximately 4.5. The determination of ammonia is therefore more useful as an indicator of something going wrong than an accurate measurement of ammonia in the process. For example, a sudden increase in ammonia level may indicate a failing pH electrode leading to a pH increase. In the determination of total ammonium nitrogen, the sample is mixed with sodium hydroxide and ammonia diffused over to an acceptor solution containing a mixture of three indicators and 0.05 M each of phosphate and TRIS. By using this acceptor solution a concentration range from 7 to 350 mM ammonium was covered utilizing a second order calibration curve. The concentrations of total ammonium nitrogen in the fermentation liquid varied between 100-200 mM during the fermentation, which is well within the calibration range.
The initial idea was to alternate between measuring free ammonia and total ammonium nitrogen during the fermentation process, in order to control both variables. In the total ammonium determination, the sample is mixed with sodium hydroxide and ammonia is formed. During the determination of free ammonia, irreproducible results were obtained, and the reason was found to be traces of a sodium hydroxide leaking into the sample through the multiposition valve. A solution was either to install an extra valve in the manifold, or manually disconnect the sodium hydroxide line during measurement of free ammonia. The second alternative was chosen because the concentration of free ammonia is normally below the detection limit, and therefore a more sporadic determination, 1/hour, of free ammonia was sufficient.
Ammonia and ammonium were monitored on-line during four yeast fermentation processes, each running for approximately 72 hours. The method performed well with an analysis capacity of 30 samples/hour. The high sample throughput of SI allows recalibrations and washing cycles to be performed between measurements. The system was calibrated once or twice a day, and in-between, the calibration was checked by running a single standard every one or two hours. The variation between calibration curves was negligible over the three day period the process was running, but a tendency for loss of sensitivity by membrane fouling was noticed.
Flow Injection for Sample Preprocessing in Liquid Chromatography, Paper IV
Process samples often contain complex matrices, and often the matrix or some of its components must be removed before analysis. An example of a complex sample matrix is black liquor from the kraft process. Samples contain high levels of hydroxide and sulfide, decomposition products from cellulose, hemicellulose, lignin and tannins, calcium,
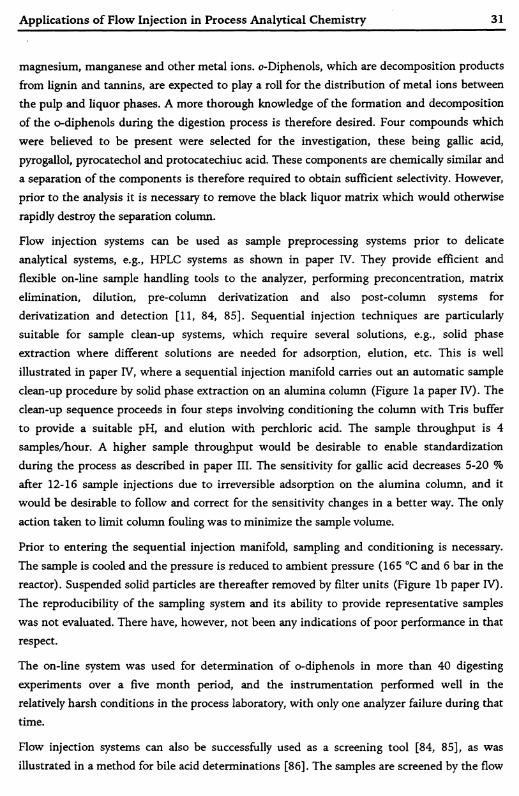
Applications o f Flow Injection in Process Analytical Chemistry 31
magnesium, manganese and other metal ions. o-Diphenols, which are decomposition products from lignin and tannins, are expected to play a roll for the distribution of metal ions between the pulp and liquor phases. A more thorough knowledge of the formation and decomposition of the o-diphenols during the digestion process is therefore desired. Four compounds which were believed to be present were selected for the investigation, these being gallic acid, pyrogallol, pyrocatechol and protocatechiuc acid. These components are chemically similar and a separation of the components is therefore required to obtain sufficient selectivity. However, prior to the analysis it is necessary to remove the black liquor matrix which would otherwise rapidly destroy the separation column.
Flow injection systems can be used as sample preprocessing systems prior to delicate analytical systems, e.g., HPLC systems as shown in paper IV. They provide efficient and flexible on-line sample handling tools to the analyzer, performing preconcentration, matrix elimination, dilution, pre-column derivatization and also post-column systems for derivatization and detection [11, 84, 85]. Sequential injection techniques are particularly suitable for sample clean-up systems, which require several solutions, e.g., solid phase extraction where different solutions are needed for adsorption, elution, etc. This is well illustrated in paper IV, where a sequential injection manifold carries out an automatic sample clean-up procedure by solid phase extraction on an alumina column (Figure la paper IV). The clean-up sequence proceeds in four steps involving conditioning the column with Tris buffer to provide a suitable pH, and elution with perchloric acid. The sample throughput is 4 samples/hour. A higher sample throughput would be desirable to enable standardization during the process as described in paper III. The sensitivity for gallic acid decreases 5-20 % after 12-16 sample injections due to irreversible adsorption on the alumina column, and it would be desirable to follow and correct for the sensitivity changes in a better way. The only action taken to limit column fouling was to minimize the sample volume.
Prior to entering the sequential injection manifold, sampling and conditioning is necessary. The sample is cooled and the pressure is reduced to ambient pressure (165 °C and 6 bar in the reactor). Suspended solid particles are thereafter removed by filter units (Figure lb paper IV). The reproducibility of the sampling system and its ability to provide representative samples was not evaluated. There have, however, not been any indications of poor performance in that respect.
The on-line system was used for determination of o-diphenols in more than 40 digesting experiments over a five month period, and the instrumentation performed well in the relatively harsh conditions in the process laboratory, with only one analyzer failure during that time.
Flow injection systems can also be successfully used as a screening tool [84, 85], as was illustrated in a method for bile acid determinations [86]. The samples are screened by the flow

32 Flow Injection Systems for Process Analytical Chemistry
injection analysis manifold measuring the total amount of bile acids, and only the samples with high analyte content are thereafter reanalyzed in the chromatographic system. The screening is time-efficient considering the sample frequency in the flow injection analysis system was 30 samples per hour while the LC has a throughput of 4 samples per hour. Screening is usually not required in on-line determinations where trends, changes and concentrations in all samples are of interest. However, an automated screening procedure might be useful to indicate a certain process state and could then easily be implemented in the type of manifold used in paper IV. A second detector could be placed between the alumina column and the HPLC detector, and connected to the computer. A possible procedure can then be as follows: The absorbance is measured during desorption of the alumina column. If a high signal is obtained the flow is stopped when the analyte is situated in the HPLC loop and thereafter, the separation is performed. If the signal from the screening detector is below a threshold value, the flow is not stopped and the desorbed analyte is propelled through the HPLC loop to waste.
Conclusions 33
CONCLUSIONS
The major goal of process analysis is to provide information in order to accurately control and regulate industrial processes to make them more efficient. Process control decisions require that the information becomes available in a timely manner and thus a close interplay between process, analysis, and decisions is necessary to enable fast and correct judgments to be made. Sampling and sample handling are important procedures in process analysis because the analyzed sample must represent the actual process at a particular time and location.
The flow injection technique, being versatile and relatively simple, can provide efficient, tailor made systems for analysis and sample handling. Four applications have been presented in this thesis where the different capabilities of the flow injection and sequential injection techniques have been illustrated. Different types of gradients generated in flow injection systems are used to improve the selectivity in multicomponent analyses of complex mixtures. Sensor injection is used to extend and improve the capacity of sensors in process analysis. Two sequential injection manifolds, one with gas diffusion and one using solid phase extraction, illustrate how to improve the selectivity and sensitivity of the analysis and they are tested in two process analytical applications. Some solutions to common problem with surface fouling have also been illustrated.

34 Flow Injection Systems for Process Analytical Chemistry
ACKNOW LEDGM ENTS
I wish to thank my supervisors Professor Anders Cedergren and Dr. Knut Irgum for stimulating discussions and valuable advice during the course of this work. Also, thanks are due to my co-authors for helping me to transform the draft manuscripts to readable papers.
I also wish to thank all who are working, or have worked, at the department during all these years for a pleasant time. In particular, I want to thank Ulla Lind, Lars Lundmark, Svante Jonsson and Vasti Granberg for valuable help in different practical matters, as well as Dr. Douglas C. Baxter for skillful linguistic revision of the thesis.
I also wish to thank Jerker Öhman who one day found himself playing the role of cosupervisor in the undergraduate research project resulting in Paper I, because his help has not been acknowledged before. He was also the one who gave me the initial push which resulted in me going to go to Seattle.
I also wish to express my gratitude to Professors Jaromir Ruzicka and Gary D. Christian for making room for me in their FIA-group for two years. Thanks are also due to all the graduate students and visitors in the FIA-group I learned to know during my time there as well as the CPAC personnel who all made my stay in Seattle enjoyable. Financial support from The Swedish Institute, J.O. Nauclérs Memorial Fund, The Sweden-America Foundation, The Thanks to Scandinavia Foundation, J.C. Kempe Foundation and the K-Fund made my visit at the University of Washington possible.
Many, many special thanks to Walter for encouragement and advice in my work and for helpful discussions during the preparation of papers and thesis.
Finally, I want to thank The Bengt Lundqvist Memorial Foundation, J.C. Kempe Foundation and The Set M. Kempe Memorial Foundation for financial support during the last year, and to Jerker, Solomon, Knut, Camilla, Christina, Åsa and Torbjörn, Erik and Eija, and Lennart for providing food and/or lodging during my visits in Umeå during the last final effort to finish this dissertation.
References 35
REFERENCES
1. C.L. Guillemin, Anal. Chim. Acta, 238 (1990) 17.
2. J.R.P. Clark, Anal. Chim. Acta, 190 (1986) 1.
3. M.T. Riebe and D.J. Eustace, Anal. Chem., 62 (1990) 65A.
4. M. Gisin and C. Thommen, Anal. Chim. Acta, 190 (1986) 165.
5. W. Frenzel, Fresenius Z. Anal. Chem., 329 (1988) 668.
6. E.D. Yalvac and R.A. Bredeweg, Process Control Qual., 6 (1994) 91.
7. J. Ruzicka and E.H. Hansen, Anal. Chim. Acta, 78 (1975) 145.
8. F.J. Krug, J. Ruzicka and E.H. Hansen, Analyst, 104 (1979) 47.
9. J. Ruzicka and J.W.B. Stewart, Anal. Chim. Acta, 79 (1975) 79.
10. J. Nyman and A. Ivaska, Talanta, 40 (1993) 95.
11. R. Carabias Martinez, E. Rodriguez Gonzalo, E. Hernandez Fernandez and J. Hernandez Méndez, Anal. Chim. Acta, 304 (1995) 323.
12. A. Stroh, U. Vollkopf and E.R. Denoyer,/ . Anal. At. Spectrom., 7 (1992) 1201.
13. B. Welz, Microchem. J., 45 (1992) 163.
14. J.F. Tyson, S.R. Bysouth, E.A. Grzeszczyk and E. Debrah, Anal. Chim. Acta, 261 (1992) 75.
15. J. Ruzicka and W. Lindberg, Anal. Chem., 64 (1992) A 537.
16. M. Guzman, J. Ruzicka, G.D. Christian and P. Shelley, Vibrational Spectroscopy, 2 (1991) 1.
17. M. de la Guardia, S. Garrigues, M. Gallignani, J.L. Burguera and M. Burguera, Anal. Chim. Acta, 261 (1992) 53.
18. J. Ruzicka and G.D. Marshall, Anal Chim. Acta, 273 (1990) 329.
19. J. Ruzicka and E.H. Hansen, Flow Injection Analysis, Wiley, New York, 2nd edn., 1988.
20. B. Karlberg and G.E. Pacey, Flow Injection Analysis-A practical guide, Elsevier, Amsterdam, 1989.
21. M. Valcarcel and M.D. Luque de Castro, Flow-Injection Analysis. Principles and Applications, Horwood, Chichester, 1987.
22. G. D. Christian and J. Ruzicka, Anal. Chim. Acta, 261 (1992) 11.
23. D.A. Whitman, M.-B. Seasholtz, G.D. Christian, J. Ruzicka and B.R. Kowalski, Anal. Chem., 63 (1991) 775.
36 Flow Injection Systems for Process Analytical Chemistry
24. S. Chung, X. Wen, K. Vilholm, M. De Bang, G.D. Christian and J. Ruzicka, Anal. Chim. Acta, 249 (1991) 77.
25. G.D. Marshall and J. F. van Staden, Process Control Qual., 3 (1992) 251.
26. T. Giibeli, G.D. Christian and J. Ruzicka, Anal. Chem., 63 (1991) 2407.
27. J. Ruzicka and T. Giibeli, Anal. Chem.t 63 (1991) 1680.
28. A. IvaskaandJ. Ruzicka, Analyst, 118 (1993) 885.
29. J. Ruzicka and G.D. Marshall, G.D. Christian, Anal. Chem., 62 (1990) 1861.
30. A. Cladera, C. Tomàs, E. Gómez, J.M. Estela and V. Cedrà, Anal. Chim. Acta, 302 (1995) 297.
31. M. Guzman, C. Pollema, J. Ruzicka and G.D. Christian, Talanta, 40 (1993) 81.
3 2 .1. Nordin Andersson, PhD thesis, University of Umeå, 1986.
33. J.M. Reijn, W.E. van der Linden and H. Poppe, Anal. Chim. Acta, 123 (1981) 229.
34. G.D. Clark, J.Zable, J.Ruzicka and G.D. Christian., Talanta, 38 (1991) 119.
35. D. Betteridge, P.B. Oates and A.P. Wade, Anal. Chem., 59 (1987) 1236.
36. M. Romero-Saldana, A. Rios and M. Valcårcel, Fersenius J. Anal. Chem. 342 (1992) 547.
37. J. Tyson, Fresenius Z. Anal. Chem., 329 (1988) 663.
38. S. Fan and Z. Fang, Anal. Chim. Acta, 241 (1990) 15.
39. S. Olsen, J. Ruzicka, E.H. Hansen, Anal. Chim. Acta, 136 (1982) 101.
40. A. Baron, M. Guzman, J. Ruzicka and G.D. Christian, Analyst, 117 (1992) 1839.
41. H. Martens and T. Næs, Multivariate Calibration, Wiley, New York, 1989
42. I.E. Bechmann, L. Norgaard and C. Ridder, Anal. Chim. Acta, 304 (1995) 229.
43. J.B. Callis, D.L. Illman and B.R. Kowalski, Anal. Chem., 59 (1987) 624A.
44. K. Clevett, Process Analyzers Technology, Wiley, New York, 1986
45. P.E. Mix, The design and application of process analyzer systems, Wiley, New York, 1984
46. D.C. Comish, G. Jepson and M.J. Smurthwaite, Sampling systems for process analysers, Butterworths, London, 1981.
47. P.M. Gy, Process Control Quai, 1 (1990) 15.
48. M. Gam, M. Gisin, C. Thommen and P. Cevey, Biotechnol. Bioeng., 34 (1989) 423.
49. K.M. Pedersen, M. Kümmel and H. Soeberg, Anal. Chim. Acta, 238 (1990) 191.
50. P. Linares, M.D. Luque de Castro and M. Valcårcel, Anal. Chim. Acta, 225 (1989) 443

References 37
51. W. Frenzel and C.-Y. Liu, Fresenius J. Anal, Chern., 342 (1992) 276.
52. B. Karlberg and S. Thelander, Anal. Chim. Acta, 98 (1978) 1.
53. M. Trojanowicz andj. Szpunar-Lobinska, Chemia Analityczna, 37 (1992) 517.
54. M. Agudo, A. Rios and M. Valcårcel, Analyst, 119 (1994) 2097.
55. M.D. Luque de Castro and M. T. Tena, Talanta, 40 (1993) 21.
56. M.D. Luque de Castro, Trends AnaLChem., 11 (1992) 149.
57. P. MacLaurin and P. J. Worsfold, Microchem. J., 45 (1992) 178.
58. C. Ridder and L. Ncrgaard, Chemom. Intell. Lab. Syst., 14 (1992) 297.
59. M. Blanco, J. Coello, H. Iturriaga, S. Maspoch, M. Redón and J.Riba, Anal. Chim. Acta, 259(1992) 219.
60. P. MacLaurin, P.J. Worsfold, P. Norman and M. Crane, Analyst, 118 (1993) 617.
61. N. Porter, B.T. Hart, R. Morrison and I.C. Hamilton, Anal. Chim. Acta, 281 (1993) 229.
62. J.M. Garcia, A.I. Jiménez, J.J. Arias, K.D. Khalaf, A. Morales-Rubio and M. de la Guardia, Analyst, 120 (1995) 313.
63. R.J. Poppi, C. Pasquini, Chemom. Intell. Lab. Syst. 19 (1993) 243.
64. P.Gamache, E.Ryan and I.N. Acworth, J.Chromatogr., 635 (1993) 143.
65. W. Frenzel, Fresenius Z. Anal. Chem., 329 (1988) 698.
66. R. Appelqvist and E. H. Hansen, Anal. Chim. Acta, 235 (1990) 265.
67. P. Bataillard, S. Haemmerli, H. Lüdi and H. M. Widmer, Sensors and Actuators B, 4 (1991)309.
68. P. Woias, S. Koch, E. Müller, D. Barrow, J. Cefai, G. Curtis and H. Hughes, Sensors and Actuators B, 15-16 (1993) 68.
69. J. Wang and Z. Taha, Anal.Chem., 63 (1991) 1053.
70. J. Nielsen, Process Control Qual., 2 (1992) 371.
71. M. Rank, J. Gram and B. Danielsson, Anal. Chim. Acta, 281 (1993) 521.
72. B.O. Palsson, B.Q. Shen, M.E. Meyerhoff andM. Trojanowicz, Analyst, 118 (1993) 1361.
73. R.L. Benson, P.J. Worsfold and F.W. Sweeting, Anal. Chim. Acta, 238 (1990) 177.
74. P. MacLaurin, K.S. Parker, A. Townshend, P.J. Worsfold, N.W. Barnett and M. Crane, Anal. Chim. Acta, 238 (1990) 171.
75. D.C. Olson, S.R. Bysouth, P.K. Dasgupta and V. Kuban, Process Control Qual. 5 (1994) 259.

38 Flow Injection Systems for Process Analytical Chemistry
76. E.F. Umoh and K. Schügerl, Anal. Chim. Acta, 293 (1994) 147.
77. S. Chung, G.D. Christian and J. Ruzicka, Process Control Qual., 3 (1992) 115.
78. R. Wei Min, J. Nielsen and J. Villadsen, Anal. Chim. Acta, 312 (1995) 149.
79. M. Menezes Santos Filha, B.F. Reis, H. Bergamin P and N. Baccan, Anal. Chim. Acta, 261(1992) 339.
80. A.C. Ariza, P. Linares, M.D. Luque de Castro and M. Valcårcel, J. Automatic Chemistry, 14 (1992) 181.
81. S. Fan, H. Müller, B. Schweizer and W. Böhme, Fresenius J. Anal. Chem.t 347 (1993) 103.
82. J. van Staden, Anal. Chim. Acta, 261 (1992) 453.
83. L.-G. Danielsson, L. Kovanen, L. Häggström and J. Ljunggren, Process Control Qua/., 6(1994) 159.
84. M.D. Luque de Castro and M. Valcårcel,/. Chromatogr., 600 (1992) 183.
85. P. Richter, J.M. Femandez-Romero, M.D. Luque de Castro and M. Valcårcel, Chromatographia, 34 (1992) 445.
86. A. Membiela, F. Låzaro, M.D. Luque de Castro and M. Valcårcel, Anal. Chim. Acta, 249 (1991) 461.


![Analytical Letters Sequential Injection Analysis ... · SIA HYPHENATED TECHNIQUES 375 Downloaded By: [University of Porto] At: 09:58 19 February 2011. operation. Thus, in this kind](https://static.fdocuments.in/doc/165x107/5f393eb65db6ce48c5714f1c/analytical-letters-sequential-injection-analysis-sia-hyphenated-techniques-375.jpg)

