Flow in Porous Media -...
47
Flow in Porous Media Module 3.c Fundamental of Two Phase Flow in Porous Media Two phase flow in gas condensate reservoirs
Transcript of Flow in Porous Media -...

Flow in Porous Media
Module 3.c Fundamental of Two Phase Flow in Porous Media
Two phase flow in gas condensate reservoirs
Initial Reservoir (P & T) Conditions
Gas Condensate Reservoirs

(Monograph vol. 20, SPE)
Dominant composition: C1
Heavier composition< 15%
Gas Condensate Reservoirs- Composition
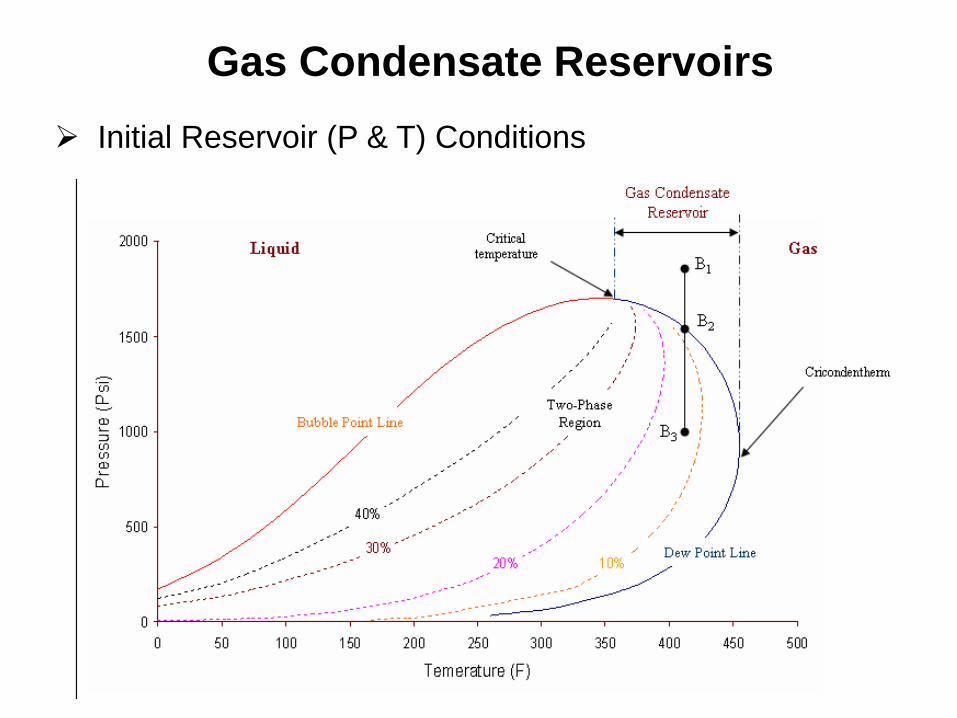
(McCain, 1990)
GOR,
SCF/STB
Surface Yield,
STB/MMSCF
Type
3,300 300 Highly Rich
150,000 7 Highly Lean
*GOR > 50,000 treated as a Wet gas
Gas Condensate Reservoirs- Field Indicators

Ternary Visualization of Hydrocarbon Classification

1. Reduces the condensate recovery (immobile oil phase)
2. May result in poor well deliverabilities due to condensate blockage
•The effect of condensate blockage depends on:
(1) relative permeabilities,
(2) PVT properties, and
(3) how the well is being produced (constant rate vs. constant BHFP).
•The reduced wellbore deliverability due to condensate blockage is only
important when BHFP reaches a minimum (dictated by surface pressure
constraints) and the well is forced to go on decline.
Condensate Drop-Out

Condensate dropout with severe productivity decline
(SPE 28749, 1994)
Condensate dropout without severe productivity decline (Schlumberger 2005-2006 report)
•In high productive or fractured reservoirs •Vuktyl GC field in the Komi Republic, Russia •Loss of valuable intermediate and heavier components (855 million bbl)
•Arun Indonesian giant GC field; 23000 acres •Thick limestone formation; local thickness of 1,000ft •Rapid decline after approximately 10 years; some of productivities decline down to 50%. • Confirmed through pressure transient response and PI test
1. Lower condensate recovery (immobile oil phase)
2. May result in poor well deliverabilities
Why Condensate Drop-Out is important?

In reality the composition of the overall reservoir fluid does not remain constant.
This result in a shift in the phase envelope, and leads to less revaporization at
lower pressures
Shift in Phase Envelope of Gas-Condensate Mixture as the Heavier Components Are Dropped Out in Reservoir
Presence of heavier components
(C4-C7+) expands the phase
envelope
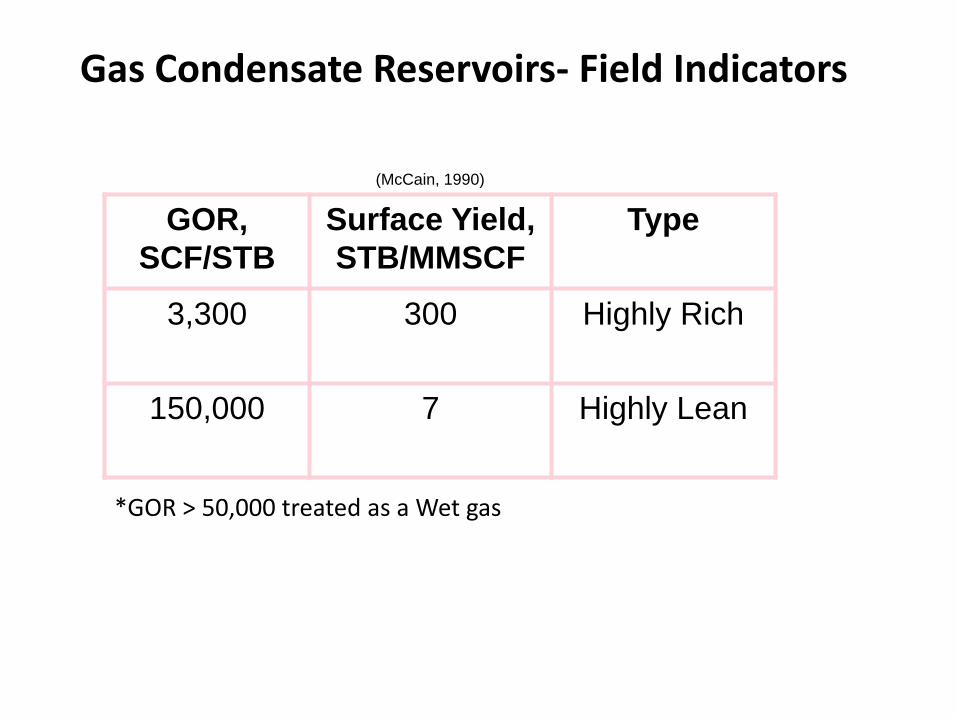
1. PVT Sampling
Captured at single-phase period
Conventional surface (Recombination method)
Novel down-hole sampling (Schlumberger, 2001)
Highly important in EOS tuning and reservoir fluid characterization
2. Lab Experiments:
CCE
Pdew
CVD
Liquid dropout curve
Single phase gas deviation factor, directly measured
Viscosities, directly measured
2-phase gas deviation factors, indirectly calculated
Vaporized oil-gas ratio below Pdew, indirectly calculated
Material Balance calculations (L.P. Dake, 2001)
Gas Condensate Reservoirs- Experimental Work


Constant Composition vs. Constant Volume

Drawdown Behavior
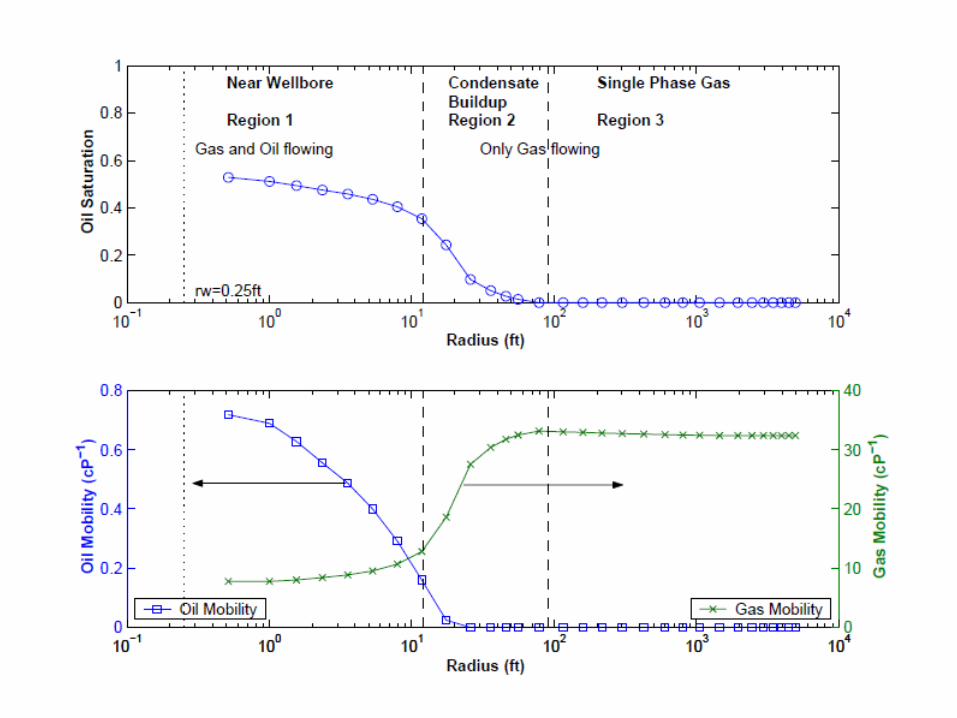
Fluid flow towards the well in a gas condensate reservoir during depletion can be
divided into three concentric main flow regions, from the wellbore to the reservoir
(Fevang, 1995):
Near-wellbore Region 1: Around the wellbore, region with high condensate
saturation where both gas and condensate are flowing simultaneously.
Condensate buildup Region 2: Region where the condensate is dropping out
of the gas. The condensate phase is immobile and only gas is flowing.
Single phase gas Region 3: Region containing only the original reservoir gas.

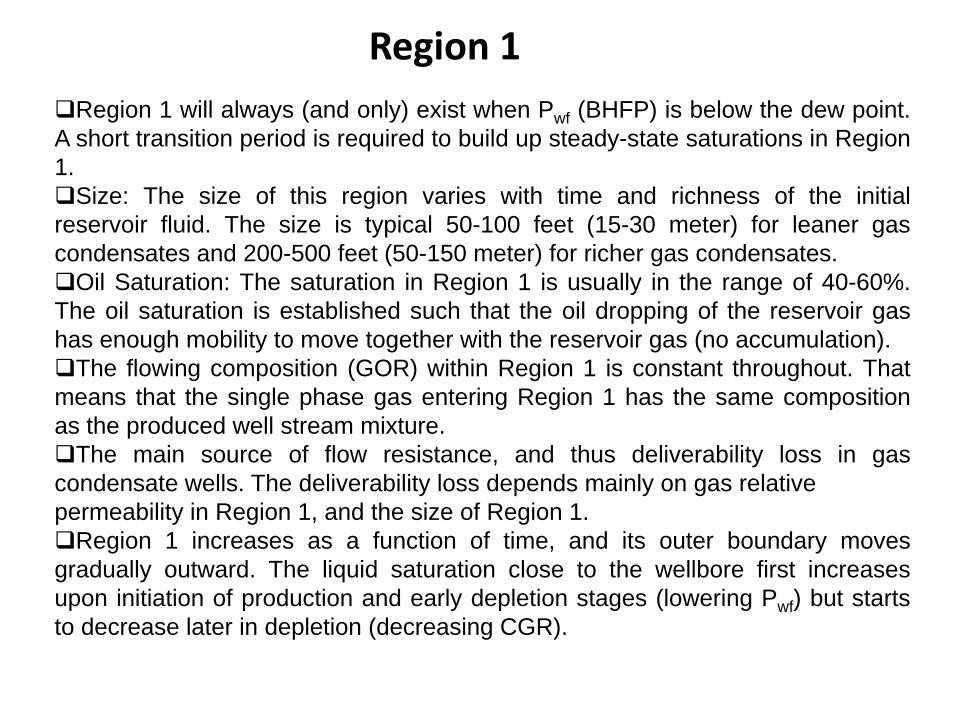
Region 1 will always (and only) exist when Pwf (BHFP) is below the dew point.
A short transition period is required to build up steady-state saturations in Region
1.
Size: The size of this region varies with time and richness of the initial
reservoir fluid. The size is typical 50-100 feet (15-30 meter) for leaner gas
condensates and 200-500 feet (50-150 meter) for richer gas condensates.
Oil Saturation: The saturation in Region 1 is usually in the range of 40-60%.
The oil saturation is established such that the oil dropping of the reservoir gas
has enough mobility to move together with the reservoir gas (no accumulation).
The flowing composition (GOR) within Region 1 is constant throughout. That
means that the single phase gas entering Region 1 has the same composition
as the produced well stream mixture.
The main source of flow resistance, and thus deliverability loss in gas
condensate wells. The deliverability loss depends mainly on gas relative
permeability in Region 1, and the size of Region 1.
Region 1 increases as a function of time, and its outer boundary moves
gradually outward. The liquid saturation close to the wellbore first increases
upon initiation of production and early depletion stages (lowering Pwf) but starts
to decrease later in depletion (decreasing CGR).
Region 1

Region 2 will always exist together with Region 1 after reservoir pressure
drops below the dew point.
Size: The size of this region depends on size of region 1 and reservoir
pressure (relative to dew point pressure.
Saturation: The saturation is approximately the same as the CVD saturation
(corrected for Sw).
The pressure in this region is lower than the dew point pressure of the initial
reservoir fluid. The oil condensing from the reservoir gas has no or negligible
mobility. This region has a net accumulation of condensate.
The deliverability loss in region 2 is usually limited as gas relative permeability
is usually high (often S-shaped gas relative permeability) at low oil saturations.
For well deliverability calculations, the condensate saturations in Region 2 can
be approximated by the liquid dropout curve from a CVD experiment, corrected
for Sw
The important consequence of Region 2 is that producing wellstream
composition (GOR) is leaner than calculated by a simple volumetric material
balance (e.g. CVD measurements).
Region 2 has only a small effect on net condensate recovery. The effect is
small on oil recovery calculations because of the relatively small difference
between the producing oil-gas ratio (rp=1/Rp) and solution oil-gas ratio rs of the
producing wellstream (evaluated at average reservoir pressure).
Region 2

Region 3 will always and only exist when the reservoir pressure drops is above
the below the dew point of the original reservoir fluid.

Proof of the Two-phase Steady-State Theory for Flow Through Porous Media (SPE14472)
Condensate liquid accumulation occurs near a wellbore
Bottomhole pressure (BHP) falls below the saturation pressure
of the reservoir fluid.
The formation flow capacity to the gas phase becomes less than
the formation flow capacity to single-phase gas flow.
Production from the well

Component Material-Balance Equations
Assumptions: •No Dispersion, •No Capillary, •No Gravity effects
Overall hydrocarbon material balance
Concept of Steady State: At steady state, there is no accumulation of component “i” at any location in the reservoir and no accumulation of overall mass of hydrocarbon.
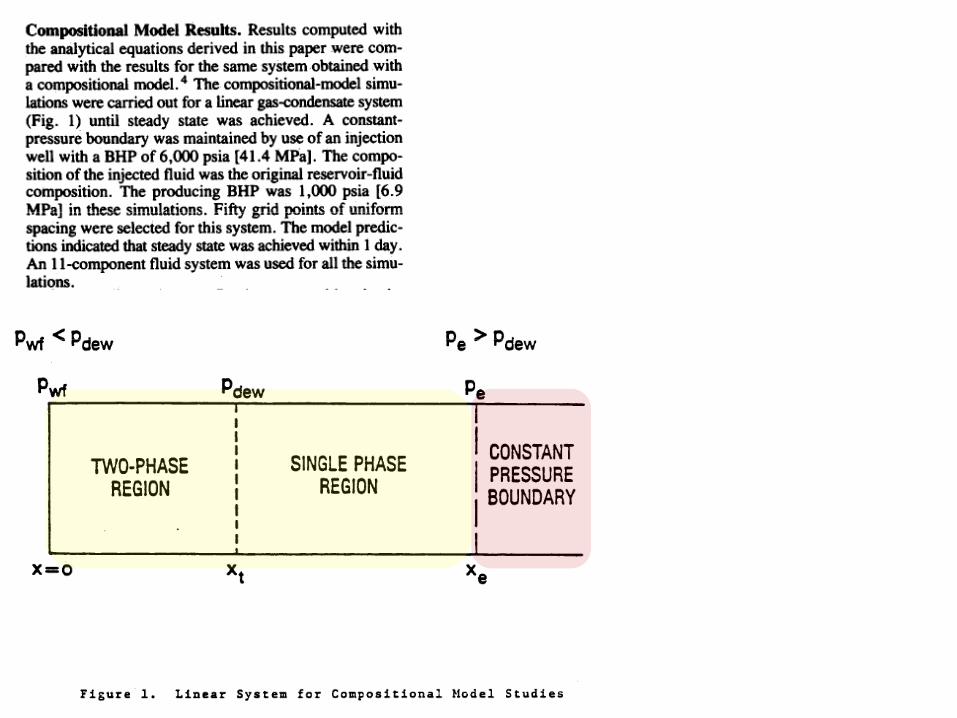
•This theory predicts saturation and pressure distribution in the vicinity of a producing well and total fluid production rate as a function of the BHP.
•It was based on the" assumption that, at any location within the two phase region the ratio of the volumetric flow rates of the two phases equals the ratio of the volume fractions of the two phases as given by constant composition expansion (CCE) at the, corresponding pressure.
Linear system Radial system

There is no component molar production except at the producing well.

The overall flowing composition reflects what the composition would be if one were to sample the flow streams in the reservoir.
The overall in-place composition is defined as
The overall in-place composition at a given location would be obtained if one were to analyze the core at that location in the reservoir.


Thermodynamic
property
Fluid flow property
Bgd :dry gas formation volume factor, rb/scf
Rp : Producing gas oil ratio, scf/stb
Rs : Solution gas oil ratio, scf/stb
rs : Solution oil gas ratio, stb/scf
VroCCE :Relative oil volume in CCE experiment for each pressure step
Vo : Oil volume in an experimental cell in each pressure step, ft3
Vg : Gas volume in an experimental cell in each pressure step, ft3
Modified Black Oil PVT Compositional Model
krg/kro

Bgd :dry gas formation volume factor, rb/scf Rp : Producing gas oil ratio, scf/stb
Rs : Solution gas oil ratio, scf/stb rs : Solution oil gas ratio, stb/scf
VroCCE :Relative oil volume in CCE experiment for each pressure step
Vo : Oil volume in an experimental cell in each pressure step, ft3
Vg : Gas volume in an experimental cell in each pressure step, ft3
kr baseed on
Corey equation
krg(Swi) = 1

•krg and kro can each be expressed directly as a function of the ratio krg/kro when
both phases are mobile. (Evinger and Muskat).
•If the ratio of krg/kro is known, the values of krg and kro
can be calculated from the
relative permeability curves, and the pseudo-pressure integral evaluated.
Diagnostic plots for Rich Gas A and Lean Gas B showing the variation of krg/kro (in
Region 1) and CCE oil relative volume as a function of pressure during depletion.
pd
pd
pd
pd
(Fevan
g, 1995)

(Wh
itso
n e
t al.,
20
03
)
Saturation dependent relative permeability curves for three different immiscible
correlations, showing in particular the region that affect flow behavior in the near-
well region (boxed area). The three correlations have the ‘same’ krg = f(krg/kro)
relationship in the boxed region.
Krg(krg/kro) is the fundamental relationship controlling the reduction
in gas relative permeability in the near well bore region.


•Most gas-condensate reservoirs are found at near-critical conditions where the
interfacial tension between gas and condensate is low.
•Experimental studies have shown that as interfacial tensions (IFT) decrease,
the relative permeability curves become progressively straighter (miscible)
whereas the residual fluid saturations decrease.
•An increase in relative permeability with velocity has been demonstrated in
numerous laboratory core-flood experiments and actual field data. Danesh et al
were the first to report laboratory experiments results showing improvements of
relative permeability in condensate systems with increases in velocity or
decreases in interfacial tension.
•High velocities and low IFT’s both increase the ratio of viscous to capillary
forces and can be represented by a single parameter, called the capillary
number (Nc)
•A combination of IFT and velocity is called Capillary Number. g
C
vN
Capillary Number

r
Pore size distribution
Wettability
Saturationk f
Saturation history
IFT
Until 1995 it was assumed that relative permeability of a fluid is mainly a
function of:
g
C
vN
In 1995 both Shell and Heriot-Watt (Henderson) published results showing the
effect of capillary number (Nc) on relative permeability.
Effect of IFT & Rate on Darcy Kr

•Capillary number describes the relative balance of viscous and capillary forces
(Nc = Δpviscous/Pc, or Nc = vpgμg/σgo)
•For small Nc, capillary forces dominate and traditional (‘immiscible’) relative
permeability behavior is found.
• For large Nc, viscous forces dominate and relative permeabilities tend to
approach straight lines or ‘misciblelike’ behavior.
•IFT change the shape of the curve
•vs shifts the curve to higher krg
Velocity effect on krg = f(krg/kro) relationship for a Berea sandstone and
a synthetic gas condensate mixture Data taken from Henderson et al.
(Fe
van
g, 1995)
vs=qg/[Aφ(1-Swi)]

Interfacial Tension as a Function of Pressure for
Different Gas Condensates
(Fevang, 1995)
moderate to high IFT

As IFT approaches zero the relative permeabilities approach straight lines with
zero residual saturations
(Fevang, 1995)
g s
C
vN
Increasing Nc
Miscible and Immiscible Kr

krgI and krgM are evaluated at the same value of krg/kro – not at the same
saturation.
It only can be used for the steady-state region where both gas and oil are
flowing.
Transition function
α is a constant dependent only on rock properties
korg gas relative permeability at Swi.
Whitson and Fevang (1997)

In near the wellbore region where the velocity is highest, any positive effect that
high Nc has on "Darcy" relative permeability may be reduced by non-Darcy flow
effects.
Non-Darcy Flow: Forchheimer equation
To quantify the effect of non-Darcy pressure loss, an effective gas relative
permeability krg,eff is defined.
a ∼ 109– 1010, b ∼ 0.5–1.5, and c ∼ 0–5.5.
The correction of β for relative permeability effect (Blom and Hagoort ;2003b)
Effect of Non-Darcy Flow on Kr

krg, HVF is defined such that the pressure drop using only two-phase Darcy’s
law with krg, HVF is equal to the pressure drop using two-phase Forchheimer
equation.
)//( rgrorgHVFro kkkk

Example of gas relative permeability variation with pressure for radial flow
geometry in a rich gas condensate well using proposed steady-state
pseudopressure model;shows effect of Nc dependence on krg and effect of
inertial HVF (‘turbulence’) on capillary number.
(Whitson et al., 2003)

Rate–time behavior for a a rich gas condensate radial well showing the effect of
including capillary number improvement of krg, and inertial high velocity flow
(‘turbulence’).
(Whitson et al., 2003)
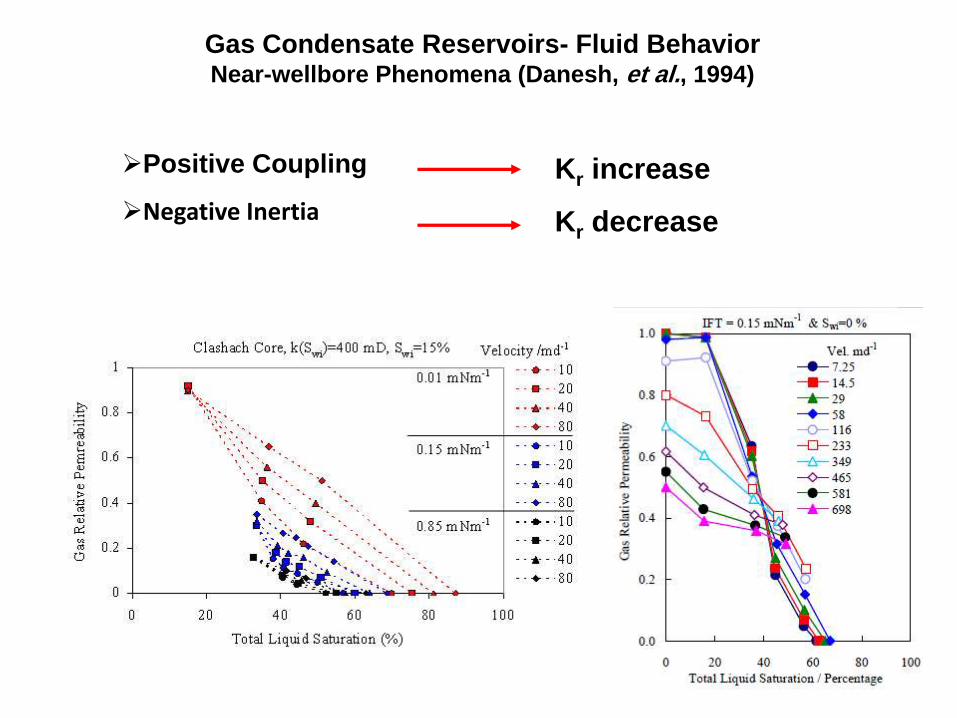
Positive Coupling
Negative Inertia
Kr increase
Kr decrease
Gas Condensate Reservoirs- Fluid Behavior Near-wellbore Phenomena (Danesh, et al., 1994)

Theory of Steady-State Compositional Flow
the system of equations describing the flow of a two-phase multi-component
mixture in porous medium
Linear system
Radial system
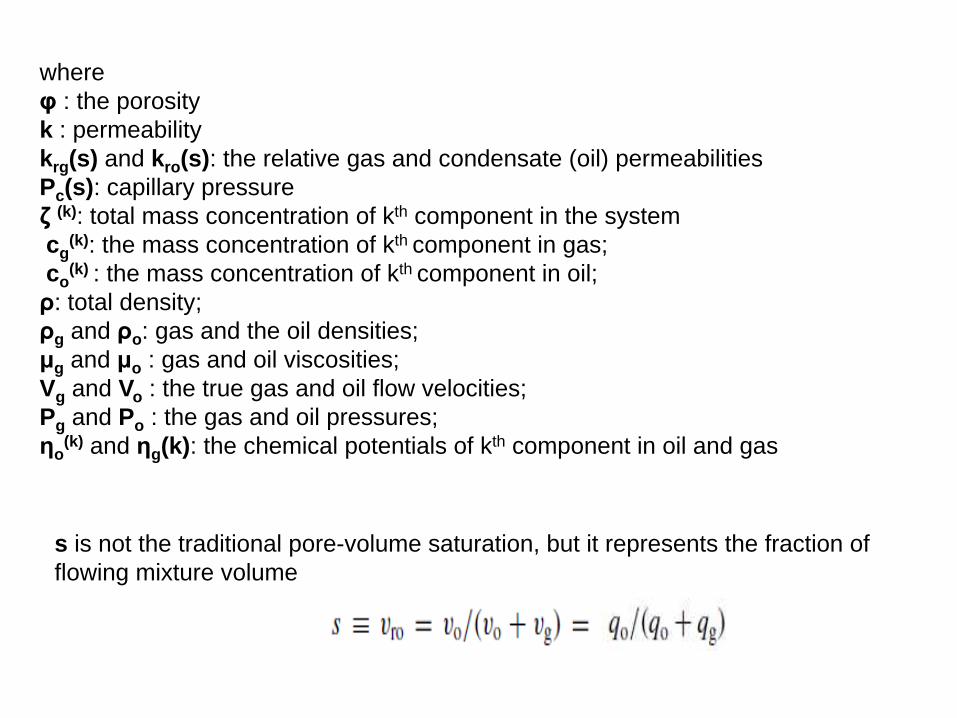
where
φ : the porosity
k : permeability
krg(s) and kro(s): the relative gas and condensate (oil) permeabilities
Pc(s): capillary pressure
ζ (k): total mass concentration of kth component in the system
cg(k): the mass concentration of kth component in gas;
co(k) : the mass concentration of kth component in oil;
ρ: total density;
ρg and ρo: gas and the oil densities;
μg and μo : gas and oil viscosities;
Vg and Vo : the true gas and oil flow velocities;
Pg and Po : the gas and oil pressures;
ηo(k) and ηg(k): the chemical potentials of kth component in oil and gas
s is not the traditional pore-volume saturation, but it represents the fraction of
flowing mixture volume