FLOW CHARACTERISTICS OF STREAMS THAT DRAIN THE FORT …
63
FLOW CHARACTERISTICS OF STREAMS THAT DRAIN THE FORT APACHE AND SAN CARLOS INDIAN RESERVATIONS, EAST-CENTRAL ARIZONA, 1930-86 By Stanley Baldys, III, and John A. Bayles U.S. GEOLOGICAL SURVEY Water-Resources Investigations Report 90-4053 Prepared in cooperation with the ARIZONA DEPARTMENT OF WATER RESOURCES Tucson, Arizona August 1990
Transcript of FLOW CHARACTERISTICS OF STREAMS THAT DRAIN THE FORT …

FLOW CHARACTERISTICS OF STREAMS THAT DRAIN THE FORT APACHE AND SAN CARLOS INDIAN RESERVATIONS, EAST-CENTRAL ARIZONA, 1930-86
By Stanley Baldys, III, and John A. Bayles
U.S. GEOLOGICAL SURVEY
Water-Resources Investigations Report 90-4053
Prepared in cooperation with the
ARIZONA DEPARTMENT OF WATER RESOURCES
Tucson, Arizona August 1990

DEPARTMENT OF THE INTERIOR
MANUEL LUJAN, JR., Secretary
U.S. GEOLOGICAL SURVEY
Dallas L. Peck, Director
For additional information write to:
District Chief U.S. Geological Survey Federal Building, FB-44 300 West Congress Street Tucson, Arizona 85701-1393
Copies of this report can be purchased from:
U.S. Geological SurveyBooks and Open-File Reports SectionFederal Center, Building 810Box 25425Denver, Colorado 80225
CONTENTS
Page
Abstract.......................................................... 1Introduction...................................................... 1
Purpose and scope............................................ 3Description of study area.................................... 4
Streamflow characteristics........................................ 5Basin and climatic characteristics........................... 7Explanation of statistical summaries......................... 11Trends in streamflow......................................... 12Trends in precipitation ..................................... 14
Estimation of mean annual streamflow.............................. 15Selection of base period..................................... 17Gaged sites.................................................. 18Ungaged sites near gaged sites............................... 21Sites on ungaged natural streams............................. 23Sites on stream reaches affected by diversions............... 26
Summary........................................................... 27Selected references............................................... 27Statistical summaries............................................. 31
ILLUSTRATIONS
[Plate is in pocket]
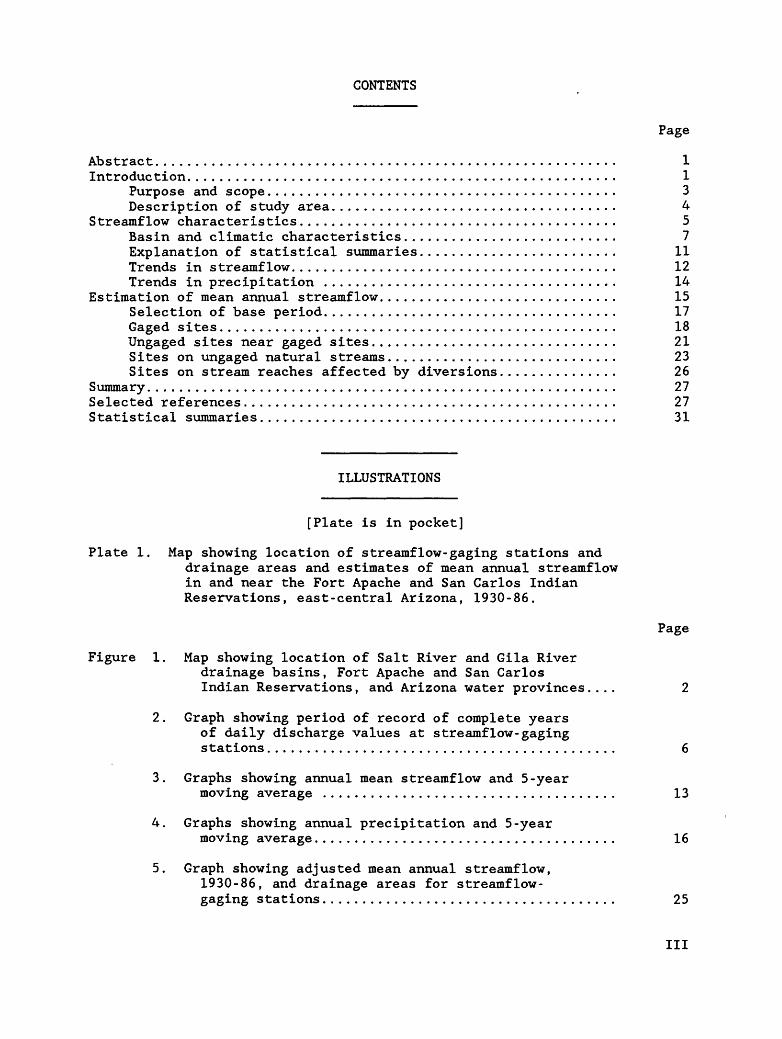
Plate 1. Map showing location of streamflow-gaging stations anddrainage areas and estimates of mean annual streamflow in and near the Fort Apache and San Carlos Indian Reservations, east-central Arizona, 1930-86.
Page
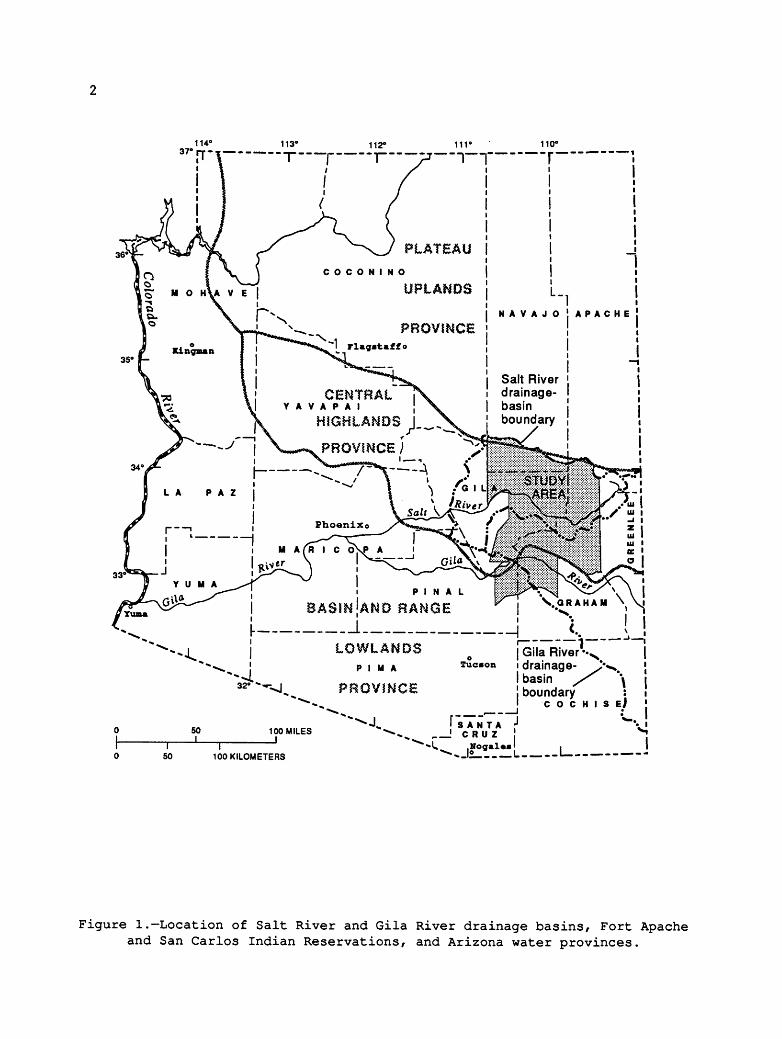
Figure 1. Map showing location of Salt River and Gila River drainage basins, Fort Apache and San Carlos Indian Reservations, and Arizona water provinces.... 2
2. Graph showing period of record of complete years of daily discharge values at streamflow-gaging stations............................................ 6
3. Graphs showing annual mean streamflow and 5-yearmoving average ..................................... 13
4. Graphs showing annual precipitation and 5-yearmoving average...................................... 16
5. Graph showing adjusted mean annual streamflow, 1930-86, and drainage areas for streamflow- gaging stations..................................... 25
III
IV
TABLES
Page
Table 1
2
3
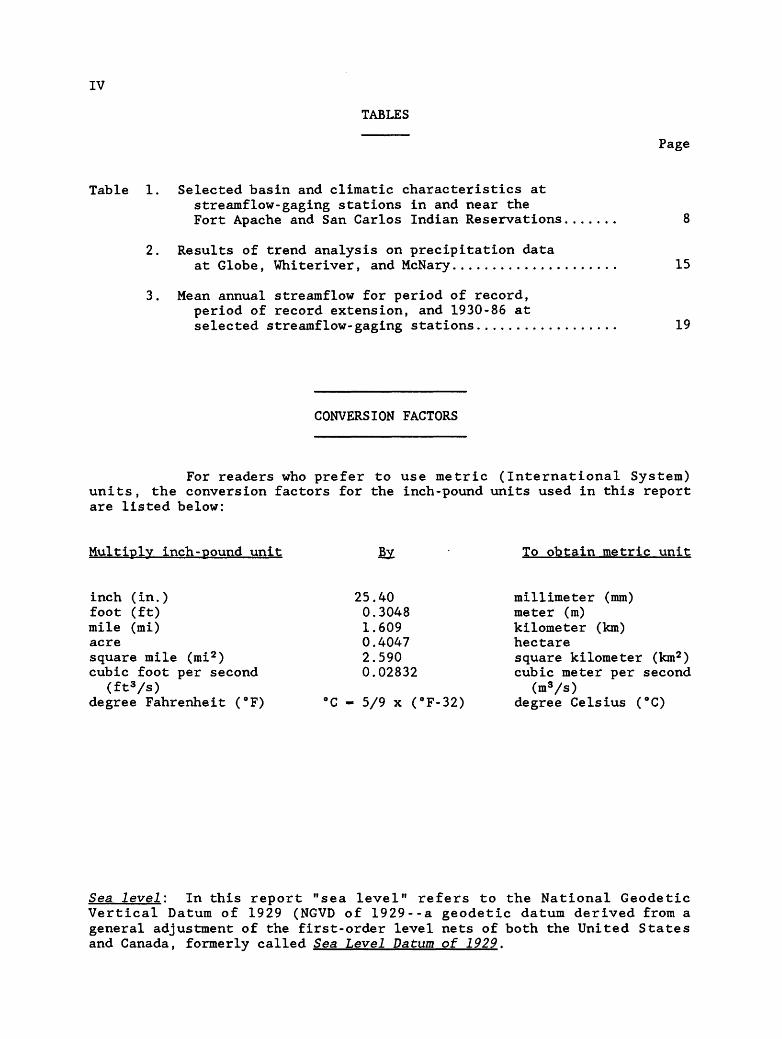
Selected basin and climatic characteristics at streamflow-gaging stations in and near the Fort Apache and San Carlos Indian Reservations
Results of trend analysis on precipitation data at Globe, Whiteriver, and McNary..............
Mean annual streamflow for period of record, period of record extension, and 1930-86 at selected streamflow-gaging stations........
15
19
CONVERSION FACTORS
For readers who prefer to use metric (International System) units, the conversion factors for the inch-pound units used in this report are listed below:
Multiply inch-pound unit To obtain metric unit
inch (in.)foot (ft)mile (mi)acresquare mile (mi 2 )cubic foot per second
(ft3/s) degree Fahrenheit (°F)
25.400.30481.6090.40472.5900.02832
'C - 5/9 x (°F-32)
millimeter (mm)meter (m)kilometer (km)hectaresquare kilometer (km2 )cubic meter per second
(m»/s) degree Celsius (°C)
Sea level: In this report "sea level" refers to the National Geodetic Vertical Datum of 1929 (NGVD of 1929--a geodetic datum derived from a general adjustment of the first-order level nets of both the United States and Canada, formerly called Sea Level Datum of 1929.

FLOW CHARACTERISTICS OF STREAMS THAT DRAIN THE FORT APACHEAND SAN CARLOS INDIAN RESERVATIONS,
EAST-CENTRAL ARIZONA, 1930-86
By
Stanley Baldys, III, and John A. Bayles
ABSTRACT
An appraisal of streamflow characteristics of the Salt River and Gila River basins in the Fort Apache and San Carlos Indian Reservations, east-central Arizona, was done in response to pending adjudication of water resources in those basins. Statistical summaries were compiled for 28 streamflow-gaging stations in and near the reservations. Mean annual streamflow for 1930-86 was computed for streamflow-gaging stations with complete records for the period; for those stations with records that did not completely cover the 1930-86 period, record-extension techniques were used. Mean annual streamflow for ungaged sites on streams with gaging stations was estimated by interpolation between data points using drainage-area ratios. Two regression equations were derived to estimate mean annual streamflow at sites on ungaged natural streams. The standard error of the regression for estimation of mean annual flow for sites in the Salt River basin is -37 to +59 percent. The standard error of the regression for estimation of mean annual flow for sites in the Gila River basin is -18 to +21 percent.
INTRODUCTION
The Salt and Gila Rivers are the major surface-water drainages in east-central Arizona (fig. 1), and the rights to use water from those rivers are being claimed by agricultural, industrial, and domestic users. A general adjudication of water rights is underway for the Salt River and Gila River drainage basins to determine the rights of water users to the available supply. The Fort Apache and San Carlos Indian Reservations make up a large part of the Salt River and Gila River drainage basins (fig. 1). A better understanding of year-to-year variations in streamflows and their relation to long-term climatic conditions in the drainage basin will allow estimates to be compiled for the mean annual quantity of surface water available at various points on major streams for use in the adjudication process. As part of the adjudication process, the U.S. Geological Survey, in cooperation with the Arizona Department of Water Resources, did an appraisal of the streamflow characteristics of the Salt and Gila Rivers and their major tributaries in the Fort Apache and San Carlos Indian Reservations (fig. 1).
114°37° rr-
113" 112° in- no*~ r- r ,.r-/
11
( /^l {
. -J "1 T -/ 1
/ !ii 1
~ '[ " "
j
jiPLATEAU I
ii
! L -, !j NAVAJO! APACHE!
I i iPROVINCE '
-i___-_S '^k.
LOWLANDSP I M A
PROVINCE
SOI
100 MILES
i50
i 100 KILOMETERS
. i~ j Gila River '-x \ i drainage- >^ j I basin /^ '\ j j boundary : i I c o c H i 3 EJ J
I" 3 A N T A J W"v| __! CRUZ ^|
^ ^J»H*."L- I - -
Figure 1. Location of Salt River and Gila River drainage basins, Fort Apache and San Carlos Indian Reservations, and Arizona water provinces.

Purpose and Scope
This report presents an appraisal of characteristics of streamflow in the Fort Apache and San Carlos Indian Reservations in east-central Arizona. The first section of the report includes results of the investigation of basin and climatic characteristics at streamflow-gaging stations, analysis of data from streamflow-gaging stations, and an analysis of the stationarity of streamflow and precipitation patterns at selected sites. The second section gives selected estimates of mean annual streamflow at streamflow-gaging stations for the base period of 1930-86 and methods of estimating mean annual streamflow at ungaged sites.
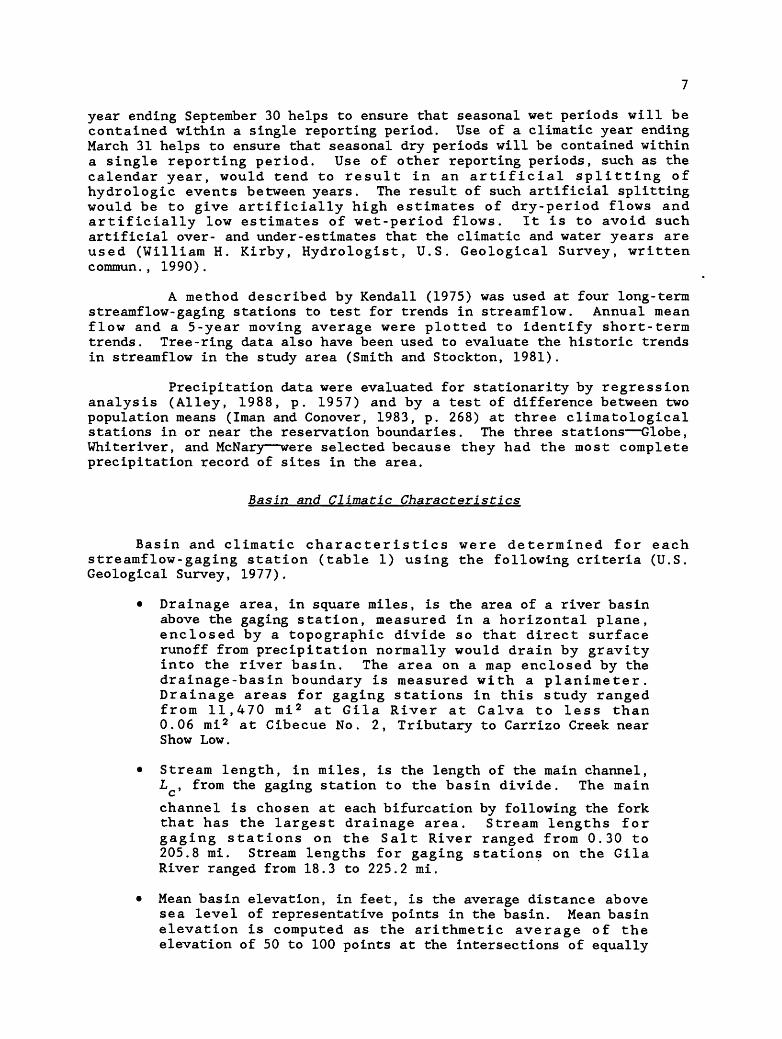
Basin and climatic characteristics calculated for each streamflow-gaging station include drainage area, stream length, mean basin elevation, forested area, soil index, mean annual precipitation, precipitation intensities, and main-channel slope index. Several of these characteristics were updated from those previously calculated on the basis of new or updated 1:24,000 topographic maps and were stored in files of the U.S. Geological Survey.
Streamflow data used in this study were collected at U.S. Geological Survey streamf low-gaging stations. Statistics calculated from streamflow data include mean monthly and annual discharges, magnitude and probability of annual low and high flows, magnitude and probability of instantaneous peak flow, and duration of daily mean flow. Summaries of these statistics for 28 streamflow-gaging stations through water year 1986 are given at the end of the report.
An analysis of the stationarity of streamflow and precipitation data was made at long-term sites within or near reservation boundaries. The analysis was to determine if the base period selected for the estimation of mean annual streamflow represented long-term conditions. Stationarity of streamflow patterns was evaluated at four streamflow-gaging stations 09448500, Gila River at head of Safford Valley, near Solomon; 09468500, San Carlos River near Peridot; 09497500, Salt River near Chrysotile; and 09498500, Salt River near Roosevelt. Precipitation data used in this study are from stations operated by private individuals, corporations, or Federal agencies. The data from those stations were collected and published by the National Oceanic and Atmospheric Administration (1933-86). Major changes in precipitation patterns were investigated at three climatological stations Globe, Whiteriver, and McNary.
Mean annual streamflow for a base period of 1930-86 was estimated for reaches of streams in the study area where sufficient data allowed a reliable estimate to be made. These estimates are shown on plate 1. Mean annual streamflow for the reach of the Gila River between Solomon and Calva was not estimated because of lack of accurate data for diversions and pumpage of water from the Gila River and problems with estimating the amount of streamflow lost to recharge and evapotranspiration. Mean annual streamflow upstream from the confluence of the San Francisco River and the upper Gila River are not shown on plate 1 because these drainages do not lie within the Fort Apache Indian Reservation or San Carlos Indian Reservation boundaries.

Description of Study Area
The study area in east-central Arizona includes the Fort Apache and San Carlos Indian Reservations, which cover 5,457 mi 2 , and selected adjacent drainages that contain streamflow-gaging stations. The study area is bounded on the north by the Mogollon Rim and the White Mountains and extends southward to the Gila Mountains. The Gila Mountains form the major part of the southeast boundary of the San Carlos Reservation. Several mountain ranges, which include the Sierra Ancha and Final Mountains, form the west boundary. Elevations in the study area range from about 2,200 ft above sea level along the Gila River downstream from the San Carlos Reservoir to 11,403 ft at the summit of Mount Baldy in the White Mountains.
Climatic variations are controlled largely by elevation and topography of the land surface. Average annual precipitation ranges from about 15 in. in the low-lying area southwest of the San Carlos Reservoir to about 34 in. in the White Mountains and is between 15 and 25 in. throughout much of the study area (table 1). In the winter months, precipitation that results from frontal storms is widespread and light to moderate in intensity. Localized and sometimes intense rainfall is associated with convective storms in July and August. At San Carlos, which is the lowest elevation climatological station in the reservations, the average daily maximum temperature is 101 °F in July and 61 °F in January (Sellers and others, 1985). At Hawley Lake in the White Mountains, which is the highest elevation station in the reservations, the average daily maximum temperature is 75 °F in July and 41 °F in January (Sellers and others, 1985).
The Salt and Gila Rivers are the two largest rivers that drain the Fort Apache and San Carlos Indian Reservations (pi. 1). The Black and White Rivers join near the center of the study area and form the Salt River. The Black River and its continuation as the Salt River form the boundary between the two reservations. The Gila River flows in a northwesterly and westerly direction through the southern part of the San Carlos Indian Reservation. The San Carlos River drains the central part of the San Carlos Indian Reservation and joins the Gila River at San Carlos Reservoir. Some reaches of the tributary streams are perennial, but the magnitude of flow in most of these streams is unknown.
The Fort Apache and San Carlos Indian Reservations are mainly in the Central highlands water province (Harshbarger and others, 1966; fig. 1, this report) . The southwestern part of the San Carlos Reservation, which includes the main channel of the Gila River through Safford Valley and its contributing drainage area, is in the Basin and Range lowlands province (Harshbarger and others, 1966).
The study area consists of drainage basins with diverse surface geology. The Black River and Big Bonito Creek in the Salt River basin head in the White Mountains, which are composed mainly of basalt (Wilson and others, 1960). Cibecue Creek and Carrizo Creek drainage basins are underlain mostly by Coconino Sandstone and Supai Formation (Wilson and others, 1959; 1960). The upper part of the White River drainage basin is underlain mainly by basalt, and the lower part of the basin is underlain mainly by the Supai Formation (Wilson and others, 1959; 1960).

Bonita Creek drainage in the Gila River basin contains volcanic deposits at the higher elevations and sedimentary deposits in the lower elevations of the basin (Wilson and Moore, 1958). The part of the Gila River drainage basin that is within the San Carlos Indian Reservation is underlain mainly by alluvial deposits of gravel, sand, and silt. Mount Turnbull, south of San Carlos Reservoir, is composed of granite and crystalline intrusive rocks (Wilson and Moore, 1958). Eagle Creek basin generally contains volcanic rocks, although there is an area of sedimentary deposits in the Point of Pines area (Wilson and Moore, 1958). Deposits in the areas northwest and southwest of San Carlos Reservoir are a mixture of granitic, volcanic, sedimentary, and metamorphic rocks (Wilson and others, 1959; Wilson and Moore, 1958).
Most of the Salt River drainage basin south of the Salt River is volcanic in composition. The exception is the part of the Salt River basin at the west boundary of the Fort Apache Indian Reservation, which is underlain by a mixture of sandstone, quartzite, limestone, and diabase (Wilson and others, 1959).
STREAMFLOW CHARACTERISTICS
Characteristics of streamflow in the study area were determined from streamflow data collected as early as 1915; by 1930, five streamflow-gaging stations were in operation. Streamflow statistics excluding those for frequency of instantaneous peak flows were calculated from values of daily mean flow determined at 28 streamflow-gaging stations (pi. 1). Standard methods (Corbett, 1943, p. 109-115; Rantz and others, 1982a, b) were used in the measurement, collection, arid computation of streamflow records. Streamflow records prior to water year 1960 were published in two compilation reports by the U.S. Geological Survey (1954; 1964). Streamflow records for the 1960-86 water years are published in the annual water-data series (U.S. Geological Survey, 1965-74, 1976-82; White and Garrett, 1984, 1988; Wilson and Garrett, 1988).
Standard statistical procedures for compiling streamflow statistics (Chow, 1964, p. 8-6 to 8-8) were used in this study except for procedures used to compute frequency of peak flows. Frequencies of instantaneous peak flows were calculated using log-Pearson Type III frequency distributions only at sites with at least 10 years of record (U.S. Interagency Advisory Committee on Water Data, 1982). The period of record for which streamflow statistics were compiled at streamflow- gaging stations used in this study except for frequencies of instantaneous peak flows is shown in figure 2. All streamflow statistics were calculated on the basis of a water year that begins on October 1 and ends on September 30, with the exception of magnitude and probability of annual low flows, which were calculated on the basis of a climatic year that begins on April 1 and ends on March 31. Different definitions of the year are used for compiling low-flow and high-flow data. The different definitions are needed in order to obtain hydrologically meaningful statistics. Streamflow in eastern Arizona is generally seasonal. Summer dry periods (low-flow events) alternate with winter-spring wet periods (high-flow events). It is the statistical characteristics of these events that are of hydrologic (and socioeconomic) importance. Compilations of low-flow and high-flow data, therefore, should reflect the occurrence of these events. Use of a water

PERIOD OF RECORD
.. 11 i. .. i... i. ..
GILA RIVER BASIN
Eagle Creek:09445500 Willow Creek near Point of Pfnee. near Morend 09446000 Willow Creek near Double Circle Ranch, near Morenc? 09446500 Eagle Creek near Double Circle Ranch, near Morenc! 09447000 Eagle Creek above Pumping Plant near Morenc! 09447800 Bonlta Creek near Morenc!09448500 Gflo River at Head of Safford Valley, near Solomon 09466500 Gfla River at Calva 09468500 San Carloe River near Peridot
SALT RIVER BASIN 09489070 North Fork of East Fork Black River near Alpine
Black River:09489100 Black River near Maverick 09489200 Pacheta Creek near Maverick09489500 Black River below pumping plant, near Point of Plnee 09489700 Big Bonlto Creek near Fort Apache 09490500 Black River near Fort Apache 09490800 North Fork White River near Greer 09491000 North Fork White River near McNary 09492400 Eaat Fork White River near Fort Apache 09494000 White River near Fort Apache
Salt Riven09494300 Carrizo Creek above Corduroy Creek, near Show Low 09494500 Cordurory Creek above Foreetdole Creek, near Show Low 09496000 Corduroy Creek near mouth, near Show Low 09496500 Carrizo Creek near Show Low
Carrizo Creek Tributary:09496600 Clbecue No. 1. Tributary Carrizo Creek, near Show Low 09496700 Clbecue No. 2. Tributary Carrizo Creek, near Show Low 09497500 Salt River near Chryeottle 09497800 Clbecue Creek near Chryeotfle 09497980 Cherry Creek near Globe 09498500 Salt River near Rooeevelt
Figure 2. Period of record of complete years of daily discharge values at streamflow-gaging stations.
year ending September 30 helps to ensure that seasonal wet periods will be contained within a single reporting period. Use of a climatic year ending March 31 helps to ensure that seasonal dry periods will be contained within a single reporting period. Use of other reporting periods, such as the calendar year, would tend to result in an artificial splitting of hydrologic events between years. The result of such artificial splitting would be to give artificially high estimates of dry-period flows and artificially low estimates of wet-period flows. It is to avoid such artificial over- and under-estimates that the climatic and water years are used (William H. Kirby, Hydrologist, U.S. Geological Survey, written commun., 1990).
A method described by Kendall (1975) was used at four long-term streamf low-gaging stations to test for trends in streamflow. Annual mean flow and a 5-year moving average were plotted to identify short-term trends. Tree-ring data also have been used to evaluate the historic trends in streamflow in the study area (Smith and Stockton, 1981).
Precipitation data were evaluated for stationarity by regression analysis (Alley, 1988, p. 1957) and by a test of difference between two population means (Iman and Conover, 1983, p. 268) at three climatological stations in or near the reservation boundaries. The three stations Globe, Whiteriver, and McNary were selected because they had the most complete precipitation record of sites in the area.
Basin and Climatic Characteristics
Basin and climatic characteristics were determined for each streamflow-gaging station (table 1) using the following criteria (U.S. Geological Survey, 1977).
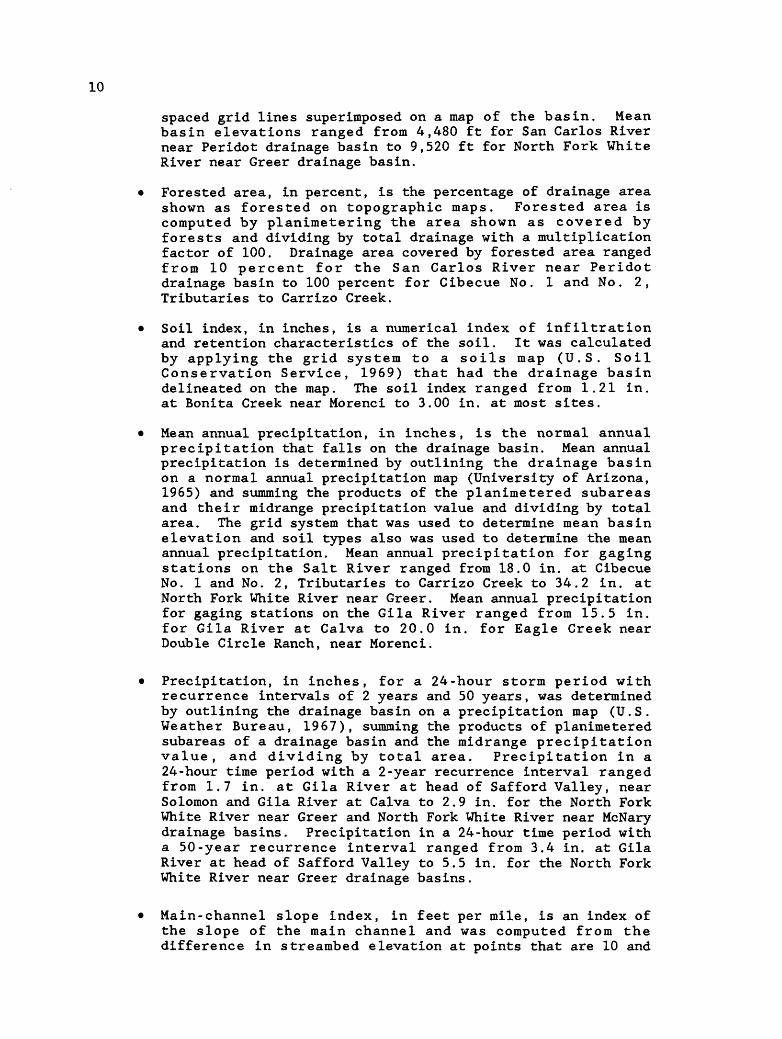
Drainage area, in square miles, is the area of a river basin above the gaging station, measured in a horizontal plane, enclosed by a topographic divide so that direct surface runoff from precipitation normally would drain by gravity into the river basin. The area on a map enclosed by the drainage-basin boundary is measured with a planimeter. Drainage areas for gaging stations in this study ranged from 11,470 mi 2 at Gila River at Calva to less than 0.06 mi 2 at Cibecue No. 2, Tributary to Carrizo Creek near Show Low.
Stream length, in miles, is the length of the main channel, L , from the gaging station to the basin divide. The main
channel is chosen at each bifurcation by following the fork that has the largest drainage area. Stream lengths for gaging stations on the Salt River ranged from 0.30 to 205.8 mi. Stream lengths for gaging stations on the Gila River ranged from 18.3 to 225.2 mi.
Mean basin elevation, in feet, is the average distance above sea level of representative points in the basin. Mean basin elevation is computed as the arithmetic average of the elevation of 50 to 100 points at the intersections of equally

Table 1.--Selected basin and climatic characteristics at streamflow-gaging stations in and near the
Station number
09445500
09446000
09446500
09447000
09447800
09448500
09466500
09468500
09489070
09489100
09489200
09489500
09489700
09490500
Station name
Ui I low Creek near Point of Pines, near Morenci
Willow Creek near Double Circle Ranch, near Morenci
Eagle Creek near Double Circle Ranch, near Morenci
Eagle Creek above pumping plant, near Morenci
Bonita Creek near Morenci
Gila River at head of Safford Valley, near Solomon
Gila River at Calva
San Car I os River near Peridot
North Fork of East Fork Black River near Alpine
Black River near Maverick
Pacheta Creek at Maverick
Black River below pumping plant, near Point of Pines
Big Bonito Creek near Fort Apache
Black River near Fort Apache
Period of
record, water
years 1
1945-67
1945-67
1945-67
1945-86
1982-86
1915-86
1930-86
1930-86
1966-78
1963-82
1958-80
1954-86
1958-81
1913-15, 1958-86
Fort Apache
Drainage area, in square miles
102
149
377
613
302
7,896
11,470
1,026
38.1
315
14.8
560
119
1,232
and San
Stream length,
in miles
18.3
27.5
29.2
52.5
43.2
177
225
56.7
10.1
38.4
14.2
69.2
33.5
120
Carlos Indian Reservations
Mean basin eleva tion, in feet
6,340
6,310
6,410
6,060
5,310
6,360
5,650
4,480
9,060
8,700
8,810
8,000
7,920
7,200
Forested area, in
percent
59
63
75
64
18
58
44
10
24
82
88
86
95
81
Soil index,
in inches
3.00
3.00
3.00
2.79
1.21
2.77
2.56
2.03
3.00
3.00
3.00
2.89
3.00
2.95
Mean annual
precipi tation, in inches
19.8
19.2
20.0
19.2
18.4
16.7
15.5
17.2
27.5
27.2
30.3
25.3
27.9
23.4
Precipitation, in inches, for 24 -hour period and indicated recurrence interval.
2- year
2.0
2.0
2.0
2.0
2.0
1.7
1.7
2.1
2.4
2.4
2.2
2.3
2.5
2.2
50-year
4.0
3.9
3.9
3.8
3.9
3.4
3.5
4.0
4.4
4.8
5.2
4.4
4.8
4.2
Main- channel slope index,
in feet per mile
73.0
77.7
100.5
60.9
38.3
26.4
20.4
29.4
48.8
69.4
160.4
51.1
105.6
36.2
1 See footnote at end of table.
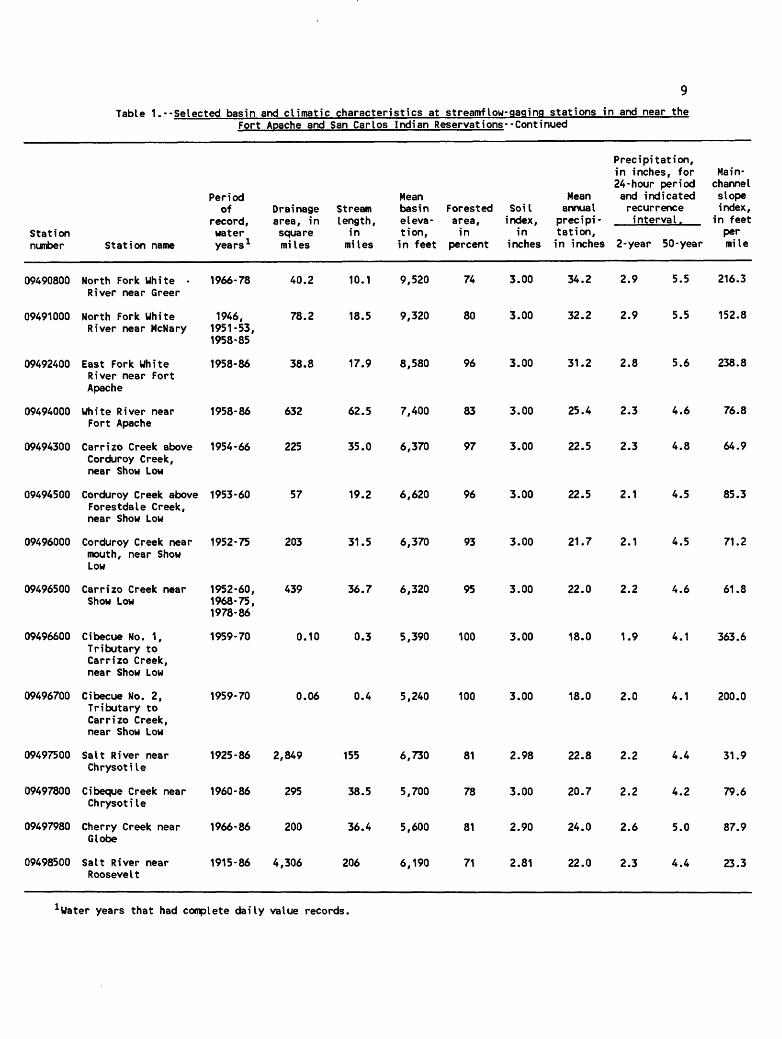
Table 1.--Selected basin and climatic characteristics at streamflow-gaging stations in and near the
Station number
09490800
09491000
09492400
09494000
09494300
09494500
09496000
09496500
09496600
09496700
09497500
09497800
09497980
09498500
Station name
North Fork White River near Greer
North Fork White River near McNary
East Fork White River near Fort Apache
White River near Fort Apache
Carrizo Creek above Corduroy Creek, near Show Low
Corduroy Creek above Forestdale Creek, near Show Low
Corduroy Creek near mouth, near Show Low
Carrizo Creek near Show Low
Cibecue No. 1, Tributary to Carrizo Creek, near Show Low
Cibecue No. 2, Tributary to Carrizo Creek, near Show Low
Salt River near Chrysotile
Cibeque Creek near Chrysoti le
Cherry Creek near Globe
Salt River near Roosevelt
Fort
Period of
record, water years 1
1966-78
1946, 1951-53, 1958-85
1958-86
1958-86
1954-66
1953-60
1952-75
1952-60, 1968-75, 1978-86
1959-70
1959-70
1925-86
1960-86
1966-86
1915-86
Aoache and San Carlos
Drainage Stream area, in length, square in miles miles
40.2 10.1
78.2 18.5
38.8 17.9
632 62.5
225 35.0
57 19.2
203 31.5
439 36.7
0.10 0.3
0.06 0.4
2,849 155
295 38.5
200 36.4
4,306 206
Indian Reservations- -Continued
Mean basin eleva tion, in feet
9,520
9,320
8,580
7,400
6,370
6,620
6,370
6,320
5,390
5,240
6,730
5,700
5,600
6,190
Forested area, in
percent
74
80
96
83
97
96
93
95
100
100
81
78
81
71
Soil index,
in inches
3.00
3.00
3.00
3.00
3.00
3.00
3.00
3.00
3.00
3.00
2.98
3.00
2.90
2.81
Mean annual
precipi tation, in inches
34.2
32.2
31.2
25.4
22.5
22.5
21.7
22.0
18.0
18.0
22.8
20.7
24.0
22.0
Precipitation, in inches, for 24 -hour period and indicated recurrence interval.
2 -year
2.9
2.9
2.8
2.3
2.3
2.1
2.1
2.2
1.9
2.0
2.2
2.2
2.6
2.3
50 -year
5.5
5.5
5.6
4.6
4.8
4.5
4.5
4.6
4.1
4.1
4.4
4.2
5.0
4.4
Main- channel slope index,
in feet per mile
216.3
152.8
238.8
76.8
64.9
85.3
71.2
61.8
363.6
200.0
31.9
79.6
87.9
23.3
1 Water years that had complete daily value records.
10
spaced grid lines superimposed on a map of the basin. Mean basin elevations ranged from 4,480 ft for San Carlos River near Peridot drainage basin to 9,520 ft for North Fork White River near Greer drainage basin.
Forested area, in percent, is the percentage of drainage area shown as forested on topographic maps. Forested area is computed by planimetering the area shown as covered by forests and dividing by total drainage with a multiplication factor of 100. Drainage area covered by forested area ranged from 10 percent for the San Carlos River near Peridot drainage basin to 100 percent for Cibecue No. 1 and No. 2, Tributaries to Carrizo Creek.
Soil index, in inches, is a numerical index of infiltration and retention characteristics of the soil. It was calculated by applying the grid system to a soils map (U.S. Soil Conservation Service, 1969) that had the drainage basin delineated on the map. The soil index ranged from 1.21 in. at Bonita Creek near Morenci to 3.00 in. at most sites.
Mean annual precipitation, in inches, is the normal annual precipitation that falls on the drainage basin. Mean annual precipitation is determined by outlining the drainage basin on a normal annual precipitation map (University of Arizona, 1965) and summing the products of the planimetered subareas and their midrange precipitation value and dividing by total area. The grid system that was used to determine mean basin elevation and soil types also was used to determine the mean annual precipitation. Mean annual precipitation for gaging stations on the Salt River ranged from 18.0 in. at Cibecue No. 1 and No. 2, Tributaries to Carrizo Creek to 34.2 in. at North Fork White River near Greer. Mean annual precipitation for gaging stations on the Gila River ranged from 15.5 in. for Gila River at Calva to 20.0 in. for Eagle Creek near Double Circle Ranch, near Morenci.
Precipitation, in inches, for a 24-hour storm period with recurrence intervals of 2 years and 50 years, was determined by outlining the drainage basin on a precipitation map (U.S. Weather Bureau, 1967), summing the products of planimetered subareas of a drainage basin and the midrange precipitation value, and dividing by total area. Precipitation in a 24-hour time period with a 2-year recurrence interval ranged from 1.7 in. at Gila River at head of Safford Valley, near Solomon and Gila River at Calva to 2.9 in. for the North Fork White River near Greer and North Fork White River near McNary drainage basins. Precipitation in a 24-hour time period with a 50-year recurrence interval ranged from 3.4 in. at Gila River at head of Safford Valley to 5.5 in. for the North Fork White River near Greer drainage basins.
Main-channel slope index, in feet per mile, is an index of the slope of the main channel and was computed from the difference in streambed elevation at points that are 10 and

11
85 percent of the distance along the main channel from the gaging station to the basin divide. The 10 and 85 percent distance points are selected to provide an index with a relative standard error of estimate of 5 percent by excluding in the computation parts of the basin with nonuniform main- channel slope. Main-channel slope index was computed from the equation
E -rssc 0.75L c
where5 - main-channel slope index, in feet per mile;
Eft- elevation at 85 percent of main-channel distance, in feet;
E- n elevation at 10 percent of main-channel distance, in feet; and
L length of main channel, in miles, c
Main-channel slope index ranged from 20.4 ft/mi for the Gila River at Calva to 363.6 ft/mi for the Cibecue No. 1, Tributary to Carrizo Creek near Show Low. In the study area, 75 percent of the drainage basins had main-channel slope indices of less than 100 ft/mi.
Explanation of Statistical Summaries
Statistical summaries of streamflow data were computed on the basis of daily mean values of flow and instantaneous peak flows and were compiled for each of the 28 streamflow-gaging stations in the study area (see statistical summaries at end of the report). Summaries were determined for mean monthly and annual discharges, magnitude and probability of annual low and high flows, magnitude and probability of instantaneous peak flow, and percent of time that a given daily mean flow was exceeded or equaled. With the exception of magnitude and probability of instantaneous peak flow, values of the streamflow characteristics were computed from water year data sets containing complete daily mean streamflow records. The calculation of the magnitude and probability of instantaneous peak flow may include a peak outside the systematic record. For example, the peak flow that occurred in the 1916 water year at Salt River near Chrysotile was included in the calculation of the magnitude and probability of instantaneous peak flow but was not used in the determination of the other streamflow characteristics for that station. Streamflow statistics for recurrence intervals greater than two times the length of record have uncertain reliability and a potential error that is caused by the extrapolation of the statistic beyond the period of record.
Statistics of mean monthly discharges show the flow distribution by month and are used to determine when the largest flow is expected. For
12
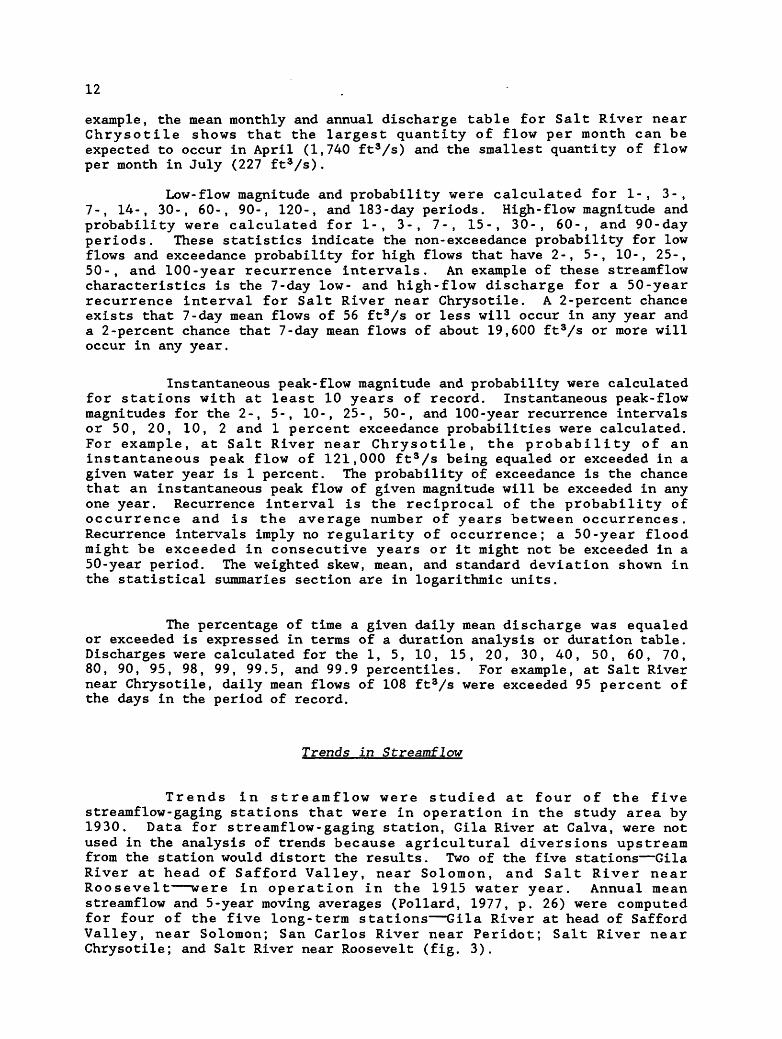
example, the mean monthly and annual discharge table for Salt River near Chrysotile shows that the largest quantity of flow per month can be expected to occur in April (1,740 ft3/8 ) and the smallest quantity of flow per month in July (227 ft3/s).
Low-flow magnitude and probability were calculated for 1-, 3-, 7-, 14-, 30-, 60-, 90-, 120-, and 183-day periods. High-flow magnitude and probability were calculated for 1-, 3-, 7-, 15-, 30-, 60-, and 90-day periods. These statistics indicate the non-exceedance probability for low flows and exceedance probability for high flows that have 2-, 5-, 10-, 25-, 50-, and 100-year recurrence intervals. An example of these streamflow characteristics is the 7-day low- and high-flow discharge for a 50-year recurrence interval for Salt River near Chrysotile. A 2-percent chance exists that 7-day mean flows of 56 ft3/s or less will occur in any year and a 2-percent chance that 7-day mean flows of about 19,600 ft 3/s or more will occur in any year.
Instantaneous peak-flow magnitude and probability were calculated for stations with at least 10 years of record. Instantaneous peak-flow magnitudes for the 2-, 5-, 10-, 25-, 50-, and 100-year recurrence intervals or 50, 20, 10, 2 and 1 percent exceedance probabilities were calculated. For example, at Salt River near Chrysotile, the probability of an instantaneous peak flow of 121,000 ft 3 /s being equaled or exceeded in a given water year is 1 percent. The probability of exceedance is the chance that an instantaneous peak flow of given magnitude will be exceeded in any one year. Recurrence interval is the reciprocal of the probability of occurrence and is the average number of years between occurrences. Recurrence intervals imply no regularity of occurrence; a 50-year flood might be exceeded in consecutive years or it might not be exceeded in a 50-year period. The weighted skew, mean, and standard deviation shown in the statistical summaries section are in logarithmic units.
The percentage of time a given daily mean discharge was equaled or exceeded is expressed in terms of a duration analysis or duration table. Discharges were calculated for the 1, 5, 10, 15, 20, 30, 40, 50, 60, 70, 80, 90, 95, 98, 99, 99.5, and 99.9 percentiles. For example, at Salt River near Chrysotile, daily mean flows of 108 ft3/s were exceeded 95 percent of the days in the period of record.
Trends in Streamflow
Trends in streamflow were studied at four of the five streamflow-gaging stations that were in operation in the study area by 1930. Data for streamflow-gaging station, Gila River at Calva, were not used in the analysis of trends because agricultural diversions upstream from the station would distort the results. Two of the five stations Gila River at head of Safford Valley, near Solomon, and Salt River near Roosevelt were in operation in the 1915 water year. Annual mean streamflow and 5-year moving averages (Pollard, 1977, p. 26) were computed for four of the five long-term stations Gila River at head of Safford Valley, near Solomon; San Carlos River near Peridot; Salt River near Chrysotile; and Salt River near Roosevelt (fig. 3).

13
o oLU CO DC LU Q.
LU LU
400
300
200
100
2,400
1,800
1,200
SAN CARLOS RIVER NEAR PERIDOT
£ 600
O
LU DCH- CO
LU2
GILA RIVER AT HEAD OF SAFFORD VALLEY
SALT RIVER NEAR CHRYSOTILE
4,000
3,000
2,000
1,000
1111111111111111111111111111111111111111111111
SALT RIVER NEAR ROOSEVELT
n 111' 11111111111111111111111111111111111 n 11111111111111111111111111111111111111
1910 1920 1930 1940 1950 1960 1970 1980 1990
WATER YEAR
EXPLANATION
ANNUAL MEAN STREAMFLOW
5-YEAR MOVING AVERAGE
Figure 3. Annual mean streamflow and 5-year moving average.
14
Annual mean streamflow data for 1915-86 for Gila River at head of Safford Valley, near Solomon, and Salt River near Roosevelt generally show higher-than-average flow conditions for 1916-20 and 1978-86 (fig. 3). The 5-year moving average of annual mean discharge for the four gaging stations indicates that 1945-55 had the smallest quantities of streamflow. A Kendall tau test (Kendall, 1975) on annual mean streamflow that uses annual precipitation as an explanatory variable did not show a constantly increasing or decreasing trend in streamflow for the period of record at any of the four streamflow-gaging stations. Instead, the 5-year moving average showed a generally decreasing trend for 1916-22, a generally increasing trend for 1970-86, and a fairly stable period for 1923-69.
Trends in Precipitation
Precipitation data at climatological stations Globe, Whiteriver, and McNary were analyzed for trends to evaluate stationarity of the data. Changes in precipitation patterns on the study area would have an affect on the runoff yield from the drainage basins. Climatological data have been collected at several other sites in the study area; however, these three sites were selected for precipitation-data analysis because of the length of record, range in elevation covered between sites, and period of record that is concurrent with the operation of streamflow-gaging stations in the study area (pi. 1). Elevations ranged from 3,550 ft at the Globe climatological station to 7,320 ft at the McNary station. Collection of precipitation data began at Globe in 1888 (systematic collection began in 1908), at Whiteriver in 1923, and at McNary in 1934. Although the records generally are continuous, periods of no data collection occurred at each site (table 2). Where gaps in records exist, precipitation data were estimated using multiple-regression analysis from one of the other two precipitation stations to provide a systematic record so that a 5-year moving average could be computed (fig. 4). Precipitation data followed the same pattern as the streamflow data. Above-average annual precipitation with a decreasing trend occurred in 1916-22 at the Globe station. Above-average annual precipitation with a generally increasing trend occurred in 1978-85 at each of the three stations. Precipitation totals for 1942-52 generally were less than average (fig. 4).
Precipitation data at the three sites for the period of data collection were evaluated for monotonic trends (significantly increasing or decreasing with time) using a linear-regression analysis of precipitation against time and analyzing the slope of the regression line (Alley, 1988, p. 1957). The parametric test, linear-regression analysis, was chosen over the Kendall tau test (a nonparametrie test) because of the distribution of the precipitation data. The regression analysis did not show a statistically significant trend (95-percent confidence level) in precipitation amounts at the three sites (table 2). The slope of the three regression lines was positive and probably was influenced by the larger-than-average amounts of precipitation for 1978-85 (fig. 4). Precipitation amounts were analyzed for two separate time periods 1930-86 and from the start of data collection through 1986 using a difference between two population-means test (Iman and Conover, 1983, p. 268) to determine if annual precipitation for the two periods was different. The statistical test did not find a significant difference between the

15
Table 2.--Results of trend analysis on precipitation data at Globe. Whiteriver. and HcNary
[Dashes indicate no data]
Difference between two population means test 1 Regression analysis2
Climato-logicalstation
Globe........
Whiteriver...
Mrklarv
Periodof
record.in wateryears
1908-74,1976-79,1984-86
1923-33,1941-86
1934-37,1939,
1943-86
Average annual precipitation, Signi-
in inches ficantAltitude,in
feet
3,500
5,280
7,320
Period ofrecord
16.67
18.80
26.93
differencesbetween
1930-863 periods
16.65 No
18.93 No
Slope ofregression
Increasing
Increasing
Increasing
Signifi cant at a 95-
percentconf i -dencelevel
No
No
No
1 (Iman and Conover, 1983, p. 268). 2 (Iman and Conover, 1983, p. 374).3 Includes records estimated from regression analyses of data collected at the
three sites.
precipitation amounts for Globe and Whiteriver for the two time periods (table 2). The precipitation record at McNary was not evaluated using this procedure because data collection at the site did not start until 1934.
ESTIMATION OF MEAN ANNUAL STREAMFLOW
An accurate estimate of mean annual streamflow for sites in the study area is necessary to provide the framework for the adjudication of water rights within the two reservation boundaries. This report provides estimates of streamflow for a base time period for sites on streams in the study area using one of several methods. The method available to estimate mean annual flow at a site depends on the data available near or at the site. Sites are classified as gaged sites at gaging stations, ungaged sites near gaged sites, sites on ungaged natural streams, and sites on stream reaches affected by diversions.

16
GLOBE PRECIPITATION STATION Elevation, 3,550 feet
40
30
Q.O 20UJccQ.-> 10
< 0
50
40
30
20
10
I p. Illl M||irTTII I I || I I IHTTT^TI Mil I I | | n T I T TTr( |
WHITERIVER PRECIPITATION STATION Elevation, 5,280 feet
Mean
TTMcNARY PRECIPITATION STATION
Elevation, 7,320 feet
1900 1910 1920 1930 1940 1950 1960 1970 1980 1990
WATER YEAR
EXPLANATION
ANNUAL PRECIPITATION
5-YEAR MOVING AVERAGE
Figure 4. Annual precipitation and 5-year moving average.

17
Selection of Base Period
A base period was selected so that statistics computed at various locations could be compared to define spatial relations without interference caused by temporal variations. The selection of a base period for computation of mean annual streamflow is based on two major criteria: (1) The period should encompass the range of hydrologic conditions that can be expected in the study area and (2) the period must be one in which streamflow data have been collected or can be estimated with a high degree of reliability. The base period also should be as long as possible subject to availability of data in the region and be of sufficient length to remove the effects of any short-term trends.
Time-series plots of annual streamflow data and, to a less pronounced extent, precipitation data show a u-shaped pattern with periods of larger quantities of streamflow and precipitation at the ends of the data-collection period (figs. 3 and 4). The smallest quantities of streamflow and precipitation generally occur in the center of the data sets. The exception is the 1941 water year in which larger-than-normal quantities of streamflow and precipitation were recorded.
The second criterion for the selection of a base period for computation of mean annual streamflow is based on the availability of reliable streamflow data. Daily streamflow data for an entire water year were collected in the study area as early as water year 1914 at Salt River near Roosevelt and as early as water year 1915 at Gila River at head of Safford Valley, near Solomon. Systematic streamflow-data collection began at Salt River at Chrysotile in 1925, at Gila River at Calva in 1930, and at San Carlos River near Peridot in 1930.
The reach of the Gila River between streamflow-gaging stations Gila River at head of Safford Valley, near Solomon and Gila River at Calva has several diversions of streamflow for agricultural purposes. Although these diversions were monitored from 1922 to 1931, water in excess of irrigation needs was not monitored and was returned to the Gila River to be rediverted. Streamflow measured as diverted water at an upstream diversion was remeasured again as diverted water at the next downstream diversion. Data collection at the diversions was discontinued during the 1932-35 water years. When the Gila River Decree came into effect on January 1, 1936, water diverted in excess of irrigation needs was reduced to an insignificant amount and data collection at the 12 largest diversions and direct pumping from the Gila River was resumed (U.S. Geological Survey, 1954; 1964). The problems in extending streamflow record at Gila River at Calva include inaccurate or nonexistent records of water returned to the river before 1936 and lack of diversion data for 1932-35. Both problems preclude the reliable estimation of streamflow record during periods of missing record at the Gila River at Calva gaging station before 1936.
Reliable estimation of streamflow before 1930 at San Carlos River at Peridot is difficult because of the lack of correlation with other gaging stations in the same basin. The mouth of the San Carlos River at Peridot is at the north end of San Carlos Reservoir. Coolidge Dam, which regulates the San Carlos Reservoir, was put into operation November 15, 1928. Before 1928, the closest gaging station in operation was downstream station Gila River at Kelvin. Several ungaged tributaries to the Gila

18
River are present in the reach between Gila River at Kelvin and San Carlos River at Peridot that preclude the use of streamflow records from Gila River at Kelvin to estimate streamflow at San Carlos River at Peridot.
The base period of 1930-86 was selected for the calculation of mean annual streamflow at sites in the study area. This period allows a reliable estimate of mean annual streamflow at points throughout both reservations using systematic streamflow data collected at five streamflow gaging stations. Three of the stations are in the Gila River drainage basin and two are in the Salt River drainage basin. All five stations were in operation throughout the period. Analysis of precipitation and streamflow data for changes in stationarity during 1930-86 did not show statistically significant long-term trends in the data sets. The 57-year period is of sufficient length to minimize the effects of short-term trends in streamflow. The base period contains periods of high flow as well as periods of drought. Periods of record that extend beyond the base period are not used, as in the record before 1930 at Salt River near Roosevelt and Gila River at head of Safford Valley, near Solomon. The period 1930-86 appears to be the most reliable base period because of the availability of data from which to define areal variations of mean annual streamflow in the study area.
Cased Sites
Mean annual streamflow was calculated for 27 of 28 streamflow sites for 1930-86 (table 3, plate 1). Mean annual streamflow at Bonita Creek near Morenci was not calculated because streamflow data were not collected at the site for a minimum of 10 years. Streamflow data were collected for 5 years and, although correlation with downstream gaging station Gila River at head of Safford Valley, near Solomon is high, more data are needed before a reliable extension of record can be made.
For the five streamflow-gaging stations that have data sets that span the base period, calculation of the mean annual streamflow at the gaging station is a straight forward mathematical determination. Annual flows at each gaging station are summed for the base period and divided by 57.
Least-squares linear-regression techniques were used to extend the record at the short-term stations. Regression relations using streamflow data were developed between long-term and short-term gaging stations on the same stream or in an adjacent drainage basin and were used to fill in gaps of missing record at the short-term station. When gaps in the 57-year base period remained after the record had been extended by linear regression, record at the short-term station was further adjusted in proportion to flow at one of the five base stations (table 3).
For example, the short-term station, Eagle Creek near Double Circle Ranch, was in operation from 1944 to 1967 (1945 was the first full year of data collection) and mean annual streamflow for this period was 17.8 ft3 /s. The long-term downstream gaging station, Eagle Creek above pumping plant, near Morenci, was in operation from 1944 through 1986 (1945 was the first full year of data collection). Annual streamflow for the two stations was correlated using the least-squares linear-regression
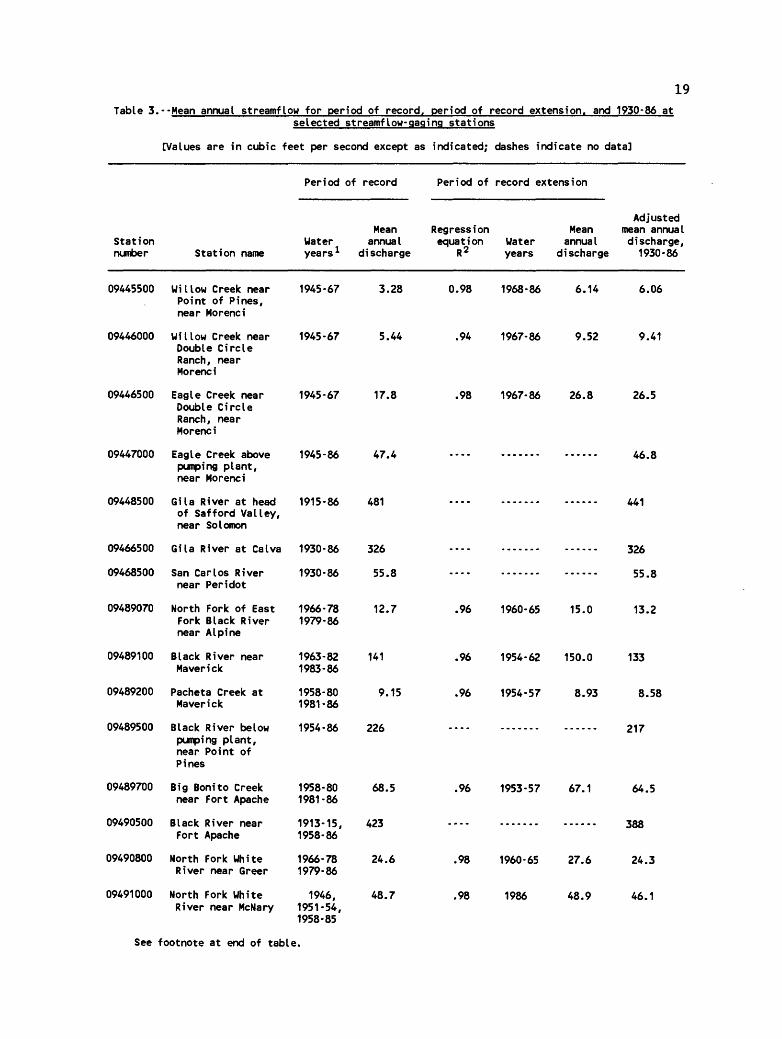
19Table 3.--Mean annual streamflow for period of record, period of record extension, and 1930-86 at
selected streamflowgaging stations
[Values are in cubic feet per second except as indicated; dashes indicate no data]
Period of record Period of record extension
Station number Station name
MeanWater annual years 1 discharge
Regression equation Water
R 2 years
Meanannual
discharge
Adjusted mean annual discharge,
1930-86
09445500 Willow Creek near 1945-67 3.28 Point of Pines, near Morenci
09446000 Willow Creek near 1945-67 5.44 Double Circle Ranch, near Morenci
09446500 Eagle Creek near 1945-67 17.8 Double Circle Ranch, near Morenci
09447000 Eagle Creek above 1945-86 47.4 pumping plant, near Morenci
09448500 Gila River at head 1915-86 481 of Safford Valley, near Solomon
09466500 Gila River at Calva 1930-86 326
09468500 San Carlos River 1930-86 55.8 near Peridot
09489070 North Fork of East 1966-78 12.7 Fork Black River 1979-86 near Alpine
09489100 Black River near 1963-82 141 Maverick 1983-86
09489200 Pacheta Creek at 1958-80 9.15 Maverick 1981-86
09489500 Black River below 1954-86 226 pumping plant, near Point of Pines
09489700 Big Bonito Creek 1958-80 68.5 near Fort Apache 1981-86
09490500 Black River near 1913-15, 423 Fort Apache 1958-86
09490800 North Fork White 1966-78 24.6 River near Greer 1979-86
09491000 North Fork White 1946, 48.7 River near McNary 1951-54,
1958-85
0.98 1968-86 6.14 6.06
.94 1967-86 9.52 9.41
.98 1967-86 26.8 26.5
....... ...... 326
....... ...... 55.8
.96 1960-65 15.0 13.2
.96 1954-62 150.0 133
.96 1954-57 8.93 8.58
... ....... ...... 217
.96 1953-57 67.1 64.5
....... ...... 388
.98 1960-65 27.6 24.3
.98 1986 48.9 46.1
See footnote at end of table.
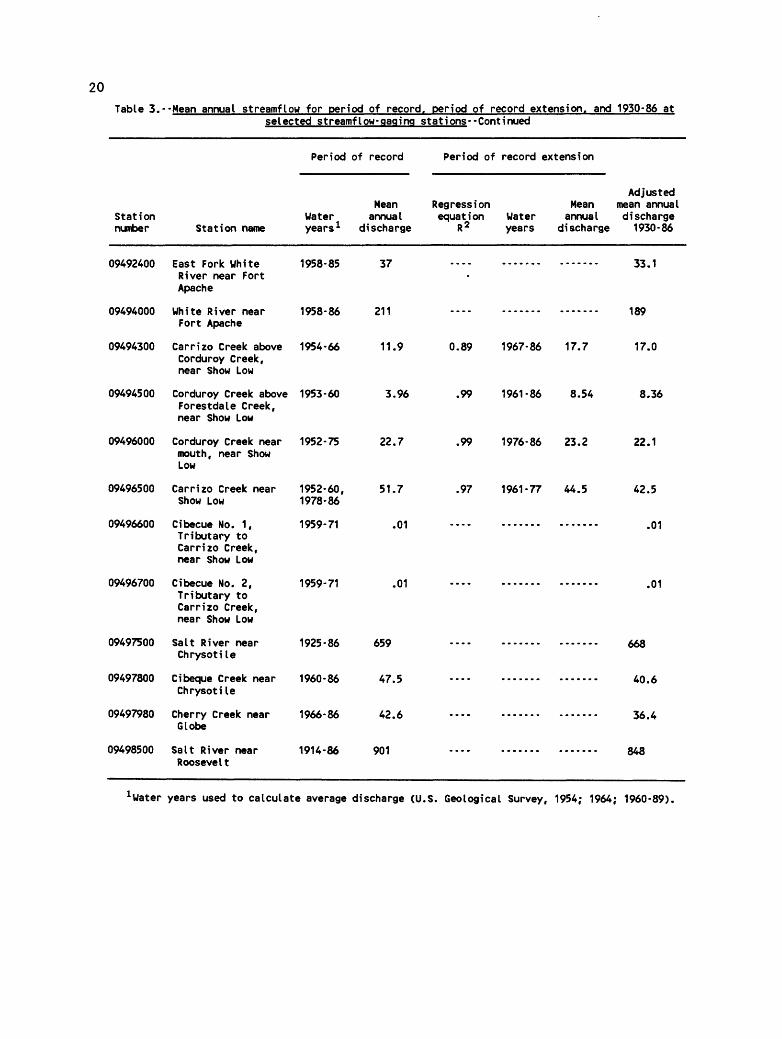
20Table 3.--Mean annual streamflow for period of record, period of record extension, and 1930-86 at
selected streamf low-gaging stations Continued
Stationnumber
09492400
09494000
09494300
09494500
09496000
09496500
09496600
09496700
09497500
09497800
09497980
09498500
Station name
East Fork WhiteRiver near FortApache
Uh i f o Pi wo f* no A f*wn i ic i\ i vei i icaiFort Apache
Carrizo Creek aboveCorduroy Creek,near Show Low
Corduroy Creek aboveForestdale Creek,near Show Low
Corduroy Creek nearmouth, near ShowLow
Carrizo Creek nearShow Low
Cibecue No. 1,Tributary toCarrizo Creek,near Show Low
Cibecue No. 2,Tributary toCarrizo Creek,near Show Low
Salt River nearChrysotile
Cibeque Creek nearChrysotile
Cherry Creek nearGlobe
Salt River nearRoosevelt
Period of record
MeanWater annualyears 1 discharge
1958-85 37
1958-86 211
1954-66 11.9
1953-60 3.96
1952-75 22.7
1952-60, 51.71978-86
1959-71 .01
1959-71 .01
1O3G.QA AGOITM oo oay
1960-86 47.5
1966-86 42.6
1914-86 901
Period of record extension
AdjustedRegression Mean mean annualequation Water annual discharge
R 2 years discharge 1930-86
------- ------- 33.1.
.... ....... ....... 1 AO
0.89 1967-86 17.7 17.0
.99 1961-86 8.54 8.36
.99 1976-86 23.2 22.1
.97 1961-77 44.5 42.5
.... ....... ....... .01
. U 1
.... ....... ....... xA0
.... ....... ....... 40.6
....... ....... 36.4
O/ O.... ....... ....... 848
1 Water years used to calculate average discharge (U.S. Geological Survey, 1954; 1964; 1960-89).
21
techniques for the common period of record. Streamflow for 1968-86 at Eagle Creek near Double Circle Ranch was estimated from the regression using actual streamflow data from the downstream station. Before the regression analysis was made, streamflow data for both stations was adjusted for flow diverted from the Black River into the Eagle Creek drainage. Using values of annual mean flows estimated from the regression analysis for 1968-86, mean annual streamflow for 1945-86 for Eagle Creek near Double Circle Ranch was 26.8 ft3/s. Because available data at both gaging stations did not cover the entire base period 1930-86, mean annual streamflow values at the stations were further adjusted by comparing the quantity of flow at Gila River at head of Safford Valley, near Solomon to that of the station in question. For example, summing the annual mean flows at base station Gila River at head of Safford Valley for 1945-86 yields a figure of 18,759 ft3 /s. Repeating this procedure at the same site for 1930-86 yields a value of 25,154 fts/s. Summing gaged and estimated annual mean flows at Eagle Creek near Double Circle Ranch for 1945-86 yields a value of 1,125 ft 3 /s , and a value, x, was assigned for a comparable figure for 1930-86 at the site. The total quantity of streamflow at Eagle Creek near Double Circle Ranch for 1930-86 was determined by using the known sums of annual mean flows at both sites and solving for x. The mean annual streamflow at the site was then determined by dividing by 57. The sum of annual mean flows for 1945-86 at Eagle Creek above pumping plant, near Morenci was used in a similar manner to determine mean annual flow for 1930-86. Therefore, adjusted mean annual streamflow for 1930-86 is 26.5 ft s /s for Eagle Creek near Double Circle Ranch and 46.8 fts /s for Eagle Creek above pumping plant, near Morenci.
Two transbasin diversions occur in the study area. Forestdale diversion, in operation since May 1953, diverts flow from Show Low Creek in the Little Colorado River basin into the headwaters of Forestdale Creek, which is tributary to the Salt River. Willow Creek diversion, in operation since April 1945, diverts flow from Black River to the headwaters of Willow Creek, which is tributary to Eagle Creek. The quantity of water diverted into Forestdale Creek (and subsequently Corduroy and Carrizo Creeks) and Willow Creek (and subsequently Eagle Creek) was subtracted from the flows at the downstream gaging stations. Mean annual streamflow at gaging stations Salt River at Chrysotile, Salt River near Roosevelt, and Gila River at head of Safford Valley, near Solomon was not adjusted to reflect the diverted flow.
Unerased Sites near Cased Sites
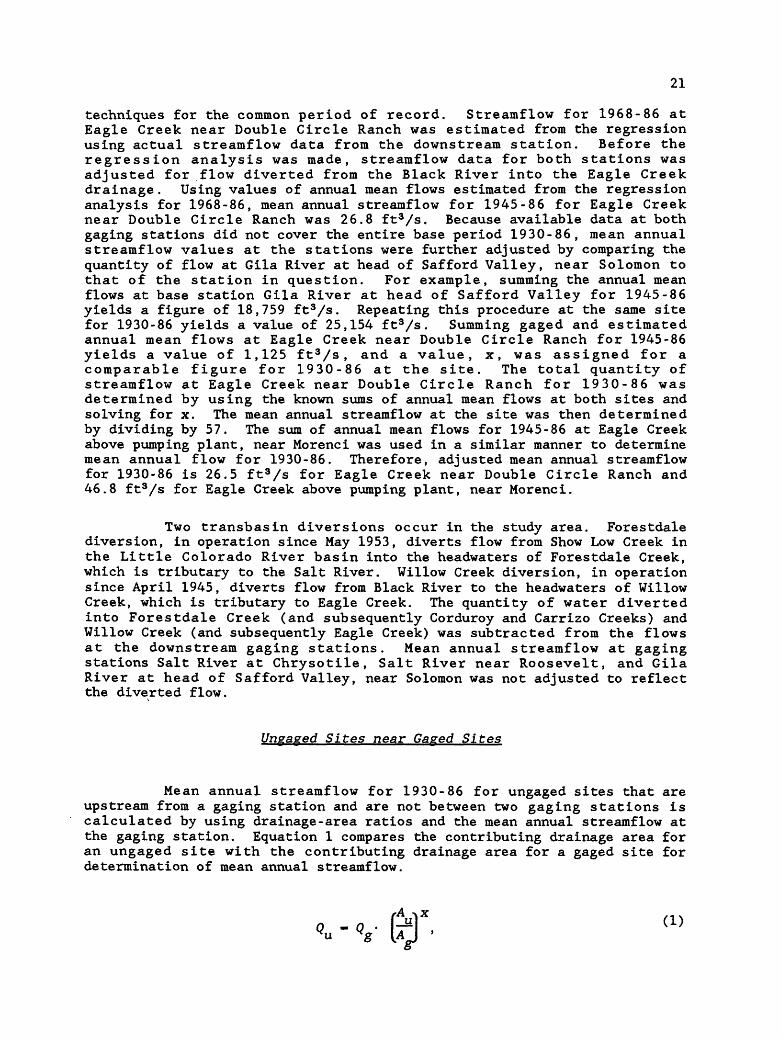
Mean annual streamflow for 1930-86 for ungaged sites that are upstream from a gaging station and are not between two gaging stations is calculated by using drainage-area ratios and the mean annual streamflow at the gaging station. Equation 1 compares the contributing drainage area for an ungaged site with the contributing drainage area for a gaged site for determination of mean annual streamflow.
A
22
where
Q - mean annual discharge, in cubic feet per second, at ungaged U site;
Q - mean annual discharge, in cubic feet per second, at gaged S site;
A - drainage area, in square miles, at ungaged site;
A - drainage area, in square miles, at gaged site; ando
x - exponent.
The exponent, x, was determined by regressing the logarithm of the mean
annual discharge, Q , for the base period against the logarithm of theS
drainage area, A , using equation, Q a (A ) for each of two regionsS s S
where a is the regression constant (Christensen and others, 1986, p. 5).
The two regions were identified by elevations. Stations with mean basin elevations that are more than 7,500 ft (all are in the Salt River basin) composed one region. Stations with mean basin elevations that are less than 7,500 ft composed the second region, which was further divided into Salt River or Gila River basins. Roeske (1978) used a similar separation of gaging stations using a 7,500-ft elevation as the division in the analysis of magnitude and frequency of floods in Arizona. The exponent, x, was 0.88 for Salt River high-elevation basins, 1.04 for Salt River low-elevation basins, and 0.97 for Gila River low-elevation basins. Equation 1, with 0.88 as the exponent, x, value, was used in the Salt River basin for sites upstream from stations 09430000, Carrizo Creek above Corduroy Creek, near Show Low; 09450000, Cibeque Creek near Chrysotile; and 09497980, Cherry Creek near Globe. Equation 1 can be applied to ungaged sites only where the ratio of the area of the ungaged site to that of the area of the gaged site is 0.75 to 1.00 (Christensen and others, 1986, P. 5).
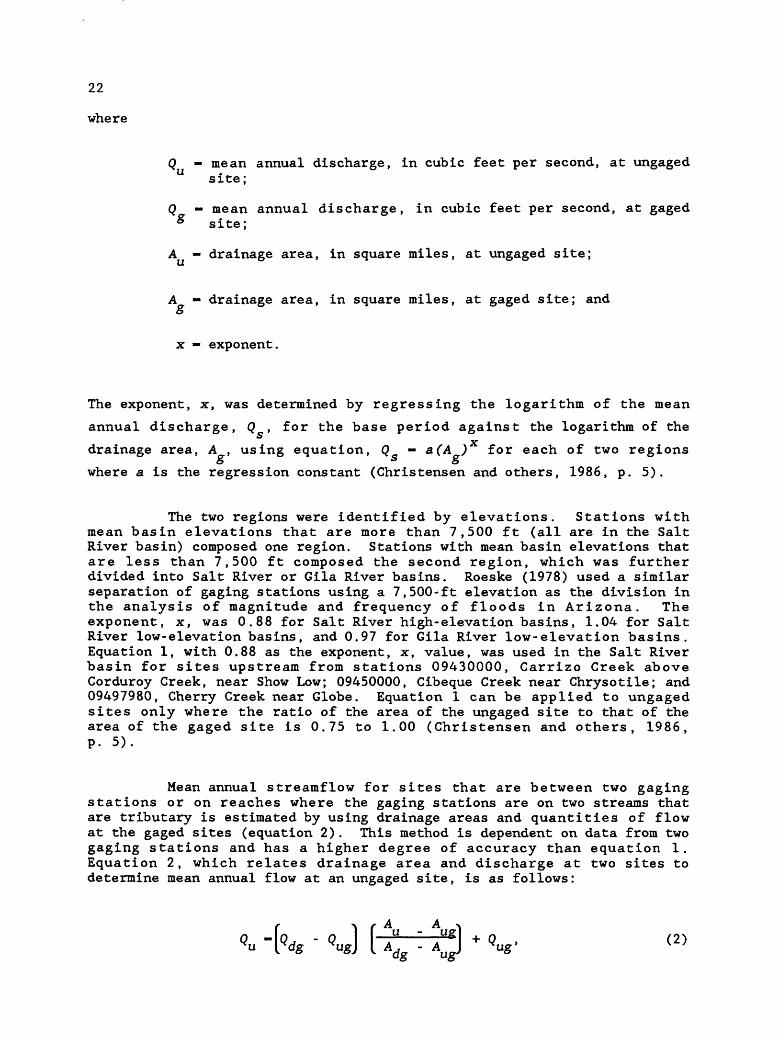
Mean annual streamflow for sites that are between two gaging stations or on reaches where the gaging stations are on two streams that are tributary is estimated by using drainage areas and quantities of flow at the gaged sites (equation 2). This method is dependent on data from two gaging stations and has a higher degree of accuracy than equation 1. Equation 2, which relates drainage area and discharge at two sites to determine mean annual flow at an ungaged site, is as follows:
(2)

23
where
Q - mean annual discharge, in cubic feet per second, at ungaged site between two gaged sites;
Q , - mean annual discharge, in cubic feet per second, at ® downstream gaged site;
Q - mean annual discharge, in cubic feet per second, at ° upstream gaged site;
A, - drainage area, in square miles, at downstream gaged site;
A - drainage area, in square miles, at upstream gaged site; ando
A - drainage area, in square miles, at ungaged site.
Sites on Ungaged Natural Streams
An estimate of the mean annual streamflow for 1930-86 at a site that is not at or near a streamflow-gaging station can be made using 1 of 2 equations determined by regional-regression analyses of streamflow and basin characteristics. Separate equations were derived for the Salt River basin and the Gila River basin. In this study, the regional-regress ion analyses included 25 of the 28 streamflow-gaging stations listed in table 1. The equations should not be used to estimate mean annual streamflow at sites that have upstream diversions of flow or that return excess water to the river. Gaging station 09466500, Gila River at Calva, was excluded from the analyses because of upstream diversions. Gaging station 09448500, Gila River at head of Safford Valley, near Solomon, was excluded because most of the drainage basin is outside the reservation boundaries with basin characteristics dissimilar to those of the lower Gila River drainage basin. Gaging station 09447800, Bonita Creek near Morenci, was excluded because of the short length of record.
Stepwise regression was used to derive the equations by regressing basin characteristics against mean annual streamflow. In the stepwise - regression procedure, explanatory variables (basin characteristics) are added one by one to the model with the criteria that the F statistic for a variable to be added must be significant. The selected level of significance for a variable to be added to the equation was 0.10. Once a variable is added to the equation, all variables in the equation are examined and those variables that do not produce an F statistic at the 0.10 level are removed from the equation. The procedure continues by adding new variables to the equation until all variables in the model are significant and none can be added at the 0.10 level (SAS Institute, Inc., 1982, p. 102). Basin characteristics used in the regression analyses are those computed for the intervening drainage area between two gaging stations on the same stream. Following is an example of mean annual precipitation computed for the intervening basin between two stations on Willow Creek. Mean annual precipitation for the entire Willow
24
Creek near Double Circle Ranch drainage basin is 19.2 in. and that for upstream station Willow Creek near Point of Pines drainage basin is 19.8 in. The computed average annual precipitation assigned to the Willow Creek near Double Circle Ranch for the intervening basin between the two stations using drainage area as a weighting factor is 17.9 in. Mean annual flow quantities for a gaging station downstream from another gaging station were computed by a simple subtraction of the mean annual flow at both sites. A logarithmic base-10 transformation was used on individual basin characteristics before the stepwise regression was applied.
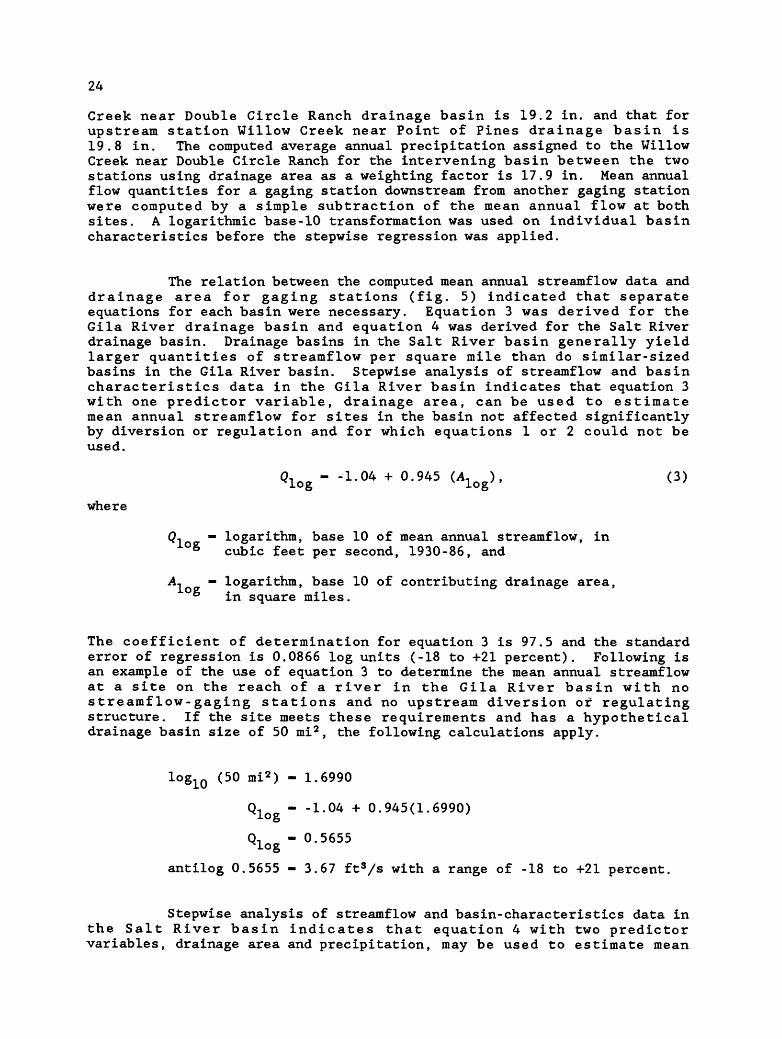
The relation between the computed mean annual streamflow data and drainage area for gaging stations (fig. 5) indicated that separate equations for each basin were necessary. Equation 3 was derived for the Gila River drainage basin and equation 4 was derived for the Salt River drainage basin. Drainage basins in the Salt River basin generally yield larger quantities of streamflow per square mile than do similar-sized basins in the Gila River basin. Stepwise analysis of streamflow and basin characteristics data in the Gila River basin indicates that equation 3 with one predictor variable, drainage area, can be used to estimate mean annual streamflow for sites in the basin not affected significantly by diversion or regulation and for which equations 1 or 2 could not be used.
Qlo - -1-04 + 0.945 (AlQ ), (3)
where
Q, - logarithm, base 10 of mean annual streamflow, in logcubic feet per second, 1930-86, and
A, - logarithm, base 10 of contributing drainage area, ° in square miles.
The coefficient of determination for equation 3 is 97.5 and the standard error of regression is 0.0866 log units (-18 to +21 percent). Following is an example of the use of equation 3 to determine the mean annual streamflow at a site on the reach of a river in the Gila River basin with no streamflow-gaging stations and no upstream diversion of regulating structure. If the site meets these requirements and has a hypothetical drainage basin size of 50 mi 2 , the following calculations apply.
Iog10 (50 mi 2 ) - 1.6990
Qlo - -1.04 + 0.945(1.6990)
Qiog -°- 5655antilog 0.5655 - 3.67 ft3/s with a range of -18 to +21 percent.
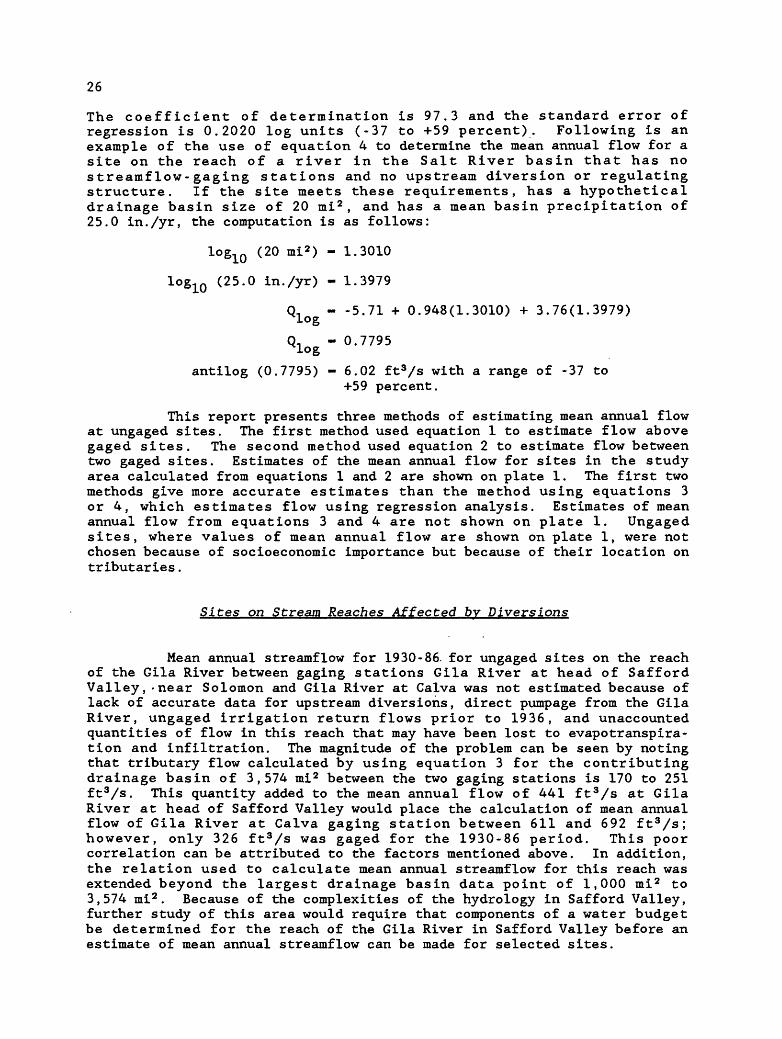
Stepwise analysis of streamflow and basin-characteristics data in the Salt River basin indicates that equation 4 with two predictor variables, drainage area and precipitation, may be used to estimate mean

25
l.UUU
O2 -|
O UJ< ccH- £ z
^ o
g o w 100 5 Q £
I^Hn* CO LU K = £
ls"S2 o < « 2
2 T- -
Ui g 2 10
S^<^ O CO0- H-
1 1
_ i iiiiiiij i i i i i i i i | i i i i i i i i_
! NOTE: Stations 09496600 and 09496700 Inot plotted
O Q
: o o :©
: :
O
" o o ":- © -"
^ O Gaging station in the Salt River basin
© Gaging station in the Gila River basin
i i i i i i i i 1 i i i i i i i i 1 i i i i i i i i0 100 1,000 10.C
COMPUTED DRAINAGE AREA OF STREAMFLOWGAGING STATIONS, ADJUSTED FOR UPSTREAM
GAGING STATIONS, IN SQUARE MILES
Figure 5. Adjusted mean annual streamflow, 1930-86/ and drainage areas for streamflow-gaging stations.
annual streamflow for sites in the basin not affected significantly by diversion or regulation and for which equations 1 or 2 could not be used.
(4)
where
log
log
log
logarithm, base 10 of mean annual streamflow, in cubic feet per second, 1930-86;
logarithm, base 10 of contributing drainage area, in square miles;
logarithm, base 10 of mean annual precipitation, in inches.
26
The coefficient of determination is 97.3 and the standard error of regression is 0.2020 log units (-37 to +59 percent). Following is an example of the use of equation 4 to determine the mean annual flow for a site on the reach of a river in the Salt River basin that has no streamf low-gaging stations and no upstream diversion or regulating structure. If the site meets these requirements, has a hypothetical drainage basin size of 20 mi 2 , and has a mean basin precipitation of 25.0 in./yr, the computation is as follows:
Iog10 (20 mi 2 ) - 1.3010
Iog10 (25.0 in./yr) - 1.3979
Q, - -5.71 + 0.948(1.3010) + 3.76(1.3979) log
Q. - 0.7795 log
antilog (0.7795) - 6.02 fts/s with a range of -37 to+59 percent.
This report presents three methods of estimating mean annual flow at ungaged sites. The first method used equation 1 to estimate flow above gaged sites. The second method used equation 2 to estimate flow between two gaged sites. Estimates of the mean annual flow for sites in the study area calculated from equations 1 and 2 are shown on plate 1. The first two methods give more accurate estimates than the method using equations 3 or 4, which estimates flow using regression analysis. Estimates of mean annual flow from equations 3 and 4 are not shown on plate 1. Ungaged sites, where values of mean annual flow are shown on plate 1, were not chosen because of socioeconomic importance but because of their location on tributaries.
Sites on Stream Reaches Affected by Diversions
Mean annual streamflow for 1930-86. for ungaged sites on the reach of the Gila River between gaging stations Gila River at head of Safford Valley, 'near Solomon and Gila River at Calva was not estimated because of lack of accurate data for upstream diversions, direct pumpage from the Gila River, ungaged irrigation return flows prior to 1936, and unaccounted quantities of flow in this reach that may have been lost to evapotranspira- tion and infiltration. The magnitude of the problem can be seen by noting that tributary flow calculated by using equation 3 for the contributing drainage basin of 3,574 mi 2 between the two gaging stations is 170 to 251 ft s/s. This quantity added to the mean annual flow of 441 ft s /s at Gila River at head of Safford Valley would place the calculation of mean annual flow of Gila River at Calva gaging station between 611 and 692 ft s /s; however, only 326 ft s /s was gaged for the 1930-86 period. This poor correlation can be attributed to the factors mentioned above. In addition, the relation used to calculate mean annual streamflow for this reach was extended beyond the largest drainage basin data point of 1,000 mi 2 to 3,574 mi 2 . Because of the complexities of the hydrology in Safford Valley, further study of this area would require that components of a water budget be determined for the reach of the Gila River in Safford Valley before an estimate of mean annual streamflow can be made for selected sites.
27
SUMMARY
Streamflow characteristics of the Salt and Gila Rivers in the Fort Apache and San Carlos Indian Reservations were appraised because of pending water-resource adjudication by the State of Arizona. Temporal changes in annual streamflow and precipitation through 1986 were evaluated by statistical analyses. The analyses of streamflow and precipitation data did not show a statistically significant long-term change. Statistics of streamflow data collected at 28 streamf low-gaging stations were computed for mean monthly and annual discharges, magnitude and probability of annual low and high flows, magnitude and probability of instantaneous peak flows, and duration of daily mean flows. Mean annual streamflow for a base period of 1930-86 was computed for 27 of the 28 gaging stations and was used to estimate the mean annual discharge throughout the study area. Two regression equations were derived that related mean annual streamflow for 1930-86 to basin characteristics. The regression equation for the Gila River basin has a coefficient of determination of 97.5 and a standard error of regression of -18 to +21 percent. The regression equation for the Salt River basin has a coefficient of determination of 97.3 and a standard error of regression of -37 to +59 percent.
SELECTED REFERENCES
Alley, W.M. , 1988, Exogenous variables in testing for monotonic trends in hydrologic time series: Water Resources Research, v. 24, no. 11, November 1988, p. 1955-1961.
Brown, D.E., Carmony, N.B., and Turner, R.M., compilers, 1981, Drainage map of Arizona showing perennial streams and some important wetlands: Arizona Game and Fish Department map, scale 1:1,000,000.
Chow, V.T., 1964, Handbook of applied hydrology: New York, McGraw-Hill, 1418 p.
Christensen, R.C., Johnson, E.B., and Plantz, G.G., 1986, Manual for estimating selected streamflow characteristics of natural-flow streams in the Colorado River basin in Utah: U.S. Geological Survey Water-Resources Investigations Report 85-4297, 39 p.
Corbett, D.M. , and others, 1943, Stream-gaging procedure A manual describing methods and practices of the Geological Survey: U.S. Geological Survey Water-Supply Paper 888, 245 p.
Harshbarger, J.W., and others, 1966, Arizona water: U.S. Geological Survey Water-Supply Paper 1648, 85 p.
Hedman, E.R. , 1970, Mean annual runoff as related to channel geometry of selected streams in California: U.S. Geological Survey Water- Supply Paper 1999-E, 17 p.
Hirsch, R.M. , and Slack, J.R., 1984, A nonparametric trend test for seasonal data with serial dependence: Water Resources Research, v. 20, no. 6, June 1984, p. 727-732.
28
Iman, R.L., and Conover, W.J., 1983, A modern approach to statistics: New York, John Wiley and Sons, Inc., 497 p.
Kendall, M.G., 1975, Rank correlation methods: London, Charles Griffin & Co., Ltd., 202 p.
Kleinbaum, D.G. , and Kupper, L.L. , 1978, Applied regression analysis and other multivariable methods: Boston, Massachusetts, Duxbury Press, 556 p.
National Oceanic and Atmospheric Administration, 1933-86, Climatological data annual summary, Arizona, 1877-1986: Asheville, North Carolina, National Climatic Data Center, v. 1-90, no. 13, published annually.
Pollard, J.H., 1977, A handbook of numerical and statistical techniques with examples mainly from the life sciences: Cambridge, England, Cambridge University Press, 349 p.
Rantz, S.E. , and others, 1982a, Measurement and computation of streamflow Volume 1. Measurement of stage and discharge: U.S. Geological Survey Water-Supply Paper 2175, 284 p.
________1982b, Measurement and computation of streamflow Volume 2. Computation of discharge: U.S. Geological Survey Water-Supply Paper 2175, 347 p.
Riggs, H.C., 1973, Regional analyses of streamflow characteristics: U.S. Geological Survey Techniques of Water-Resources Investigations, book 4, chap. B3, 15 p.
Roeske, R.H. , 1978, Methods for estimating the magnitude and frequency of floods in Arizona: Arizona Department of Transportation Report ADOT-RS-115(121), 82 p.
SAS Institute, Inc., 1982, SAS users guide: Statistics, 1982 edition: Gary, North Carolina, SAS Institute, Inc., 584 p.
Sellers, W.D., Hill, R.H., and Sanderson-Rae, Margaret, eds., 1985, Arizona climate The first hundred years: Tucson, Arizona, University of Arizona Press, 143 p.
Smith, L.P. , and Stockton, C.W., 1981, Reconstructed stream flow for the Salt and Verde Rivers from tree-ring data: American Water Resources Association, Water Resources Bulletin, v. 17, no. 6, p. 939-947.
University of Arizona, 1965, Normal annual precipitation Normal May- September precipitation 1931-1960, State of Arizona: Tucson, University of Arizona map, scale 1:500,000.
29
U.S. Geological Survey, 1954, Compilation of records of surface waters of the United States through September 1950, Part 9, Colorado River basin: U.S. Geological Survey Water-Supply Paper 1313, 749 p.
_______1964, Compilation of records of surface waters of the United States, October 1950 to September 1960, Part 9, Colorado River basin: U.S. Geological Survey Water-Supply Paper 1733, 586 p.
_______1965-74, Water resources data for Arizona Part 1, Surface-water records: U.S. Geological Survey Water-Resources Data Report (published annually).
________1976-82, Water-resources data for Arizona, water years 1975-80: U.S. Geological Survey Water-Resources Data Reports AZ-75-1 to AZ-81-1, (published annually).
________1977, National handbook of recommended methods for water-data acquisition: U.S. Geological Survey, Office of Water Data Coordination, 2 volumes.
U.S. Interagency Advisory Committee on Water Data, 1982, Guidelines for determining flood flow frequency: U.S. Geological Survey Hydrology Subcommittee Bulletin 17B (revised and corrected), 183 p.
U.S. Soil Conservation Service, 1969, Generalized hydrologic soil map Arizona: U.S. Soil Conservation Service map report, scale 1:1,000,000.
U.S. Weather Bureau, 1967, Arizona 50-year 24-hour precipitation: U.S. Weather Bureau map.
White, N.D., and Garrett, W.B., 1984, Water-resources data for Arizona, water year 1982: U.S. Geological Survey Water-Resources Data Reports AZ-82-1, 440 p.
________1986, Water-resources data for Arizona, water year 1983: U.S. Geological Survey Water-Resources Data Reports AZ-83-1, 387 p.
________1987, Water-resources data for Arizona, water year 1984: U.S. Geological Survey Water-Resources Data Reports AZ-84-1, 385 p.
________1988, Water-resources data for Arizona, water year 1985: U.S. Geological Survey Water-Resources Data Reports AZ-85-1, 343 p.
Wilson, E.D., and Moore, R.T. , 1958, Geologic map of Graham and Greenlee Counties, Arizona: Arizona Bureau of Mines County Geologic Map Series 3-4, scale 1:375,000.
Wilson, E.D., Moore, R.T., and O'Haire, R.T., 1960, Geologic map of Navajo and Apache Counties, Arizona: Arizona Bureau of Mines County Geologic Map Series 3-7, scale 1:375,000.
30
Wilson, E.D., Moore, R.T. , and Pierce, H.W., 1959, Geologic map of Gila County, Arizona: Arizona Bureau of Mines County Geologic Map Series 3-3, scale 1:375,000.
Wilson, R.P, and Garrett, ' W. B. , 1988, Water-resources data for Arizona, water year 1986: U.S. Geological Survey Water-Resources Data Reports AZ-86-1, 341 p.
31
STATISTICAL SUMMARIES
Mean monthly and annual discharges, magnitude and probability of annual low and high flows, magnitude and probability of instantaneous peak flows, and percent of time that a given daily mean flow was exceeded or equaled at selected streamflow-gaging stations in and near the Fort Apache and San Carlos Indian Reservations.
[Ft 3/s, cubic feet per second; years of record may include historic years other than those in period of record]
32
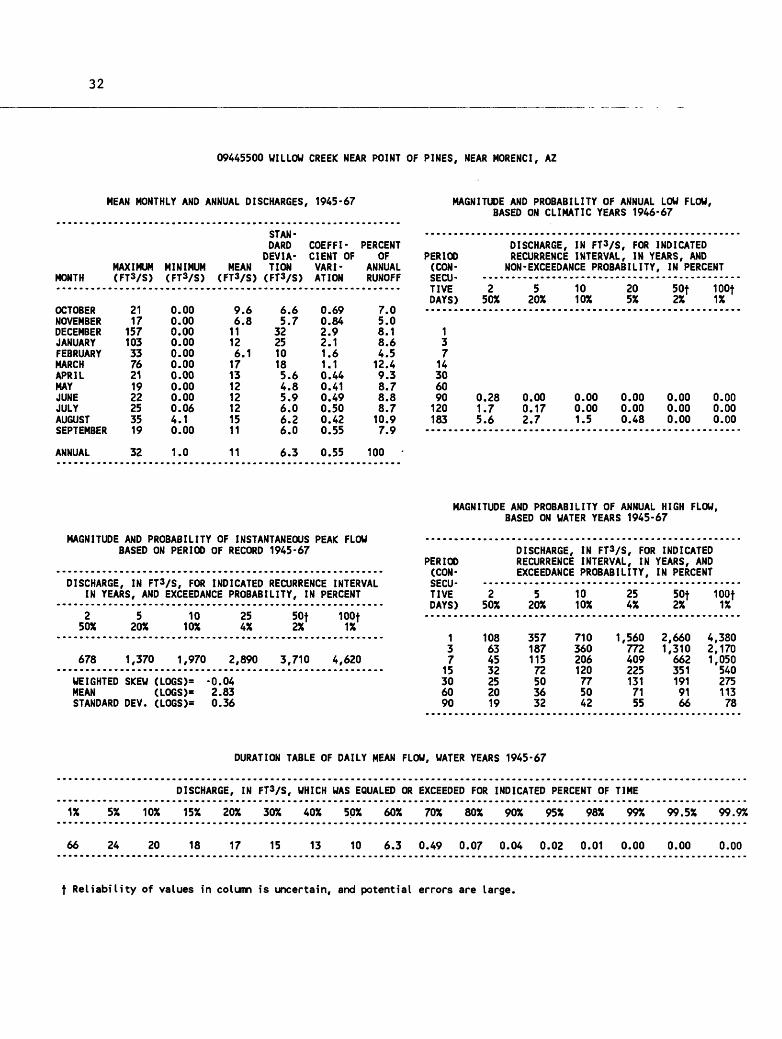
09445500 WILLOW CREEK NEAR POINT OF PINES, NEAR MORENCI, AZ
MEAN MONTHLY AND ANNUAL DISCHARGES, 1945-67
MONTHMAXIMUM MINIMUM (FT3/S) (FT3/S)
STAN DARD COEFFI- PERCENT
DEVIA- CIENT OF OF MEAN TION VARI- ANNUAL
(FT3/S) (FT3/S) ATION RUNOFF
OCTOBERNOVEMBERDECEMBERJANUARYFEBRUARYMARCHAPRILMAYJUNEJULYAUGUSTSEPTEMBER
ANNUAL
2117
1571033376211922253519
32
0.000.000.000.000.000.000.000.000.000.064.10.00
1.0
9.66.8
11126.117131212121511
11
6.65.7
322510185.64.85.96.06.26.0
6.3
0.690.842.92.11.61.10.440.410.490.500.420.55
0.55
7.05.08.18.64.512.49.38.78.88.710.97.9
100
MAGNITUDE AND PROBABILITY OF ANNUAL LOW FLOW, BASED ON CLIMATIC YEARS 1946-67
PERIOD(CONSECU TIVEDAYS)
137
14306090120183
DISCHARGE, IN FT3/S, FOR INDICATED RECURRENCE INTERVAL, IN YEARS, AND
NON- EXCEEDANCE PROBABILITY
250%
0.281.75.6
520%
0.000.172.7
1010%
0.000.001.5
205%
0.000.000.48
, IN PERCENT
50f2%
0.000.000.00
100f1%
0.000.000.00
MAGNITUDE AND PROBABILITY OF INSTANTANEOUS PEAK FLOW BASED ON PERIOD OF RECORD 1945-67
DISCHARGE, IN FT3/S, FOR INDICATED RECURRENCE INTERVAL IN YEARS, AND EXCEEDANCE PROBABILITY, IN PERCENT
2 50%
5 20%
10 10%
25 4%
50f 2%
100f 1%
678 1,370 1,970 2,890 3,710 4,620
WEIGHTED SKEW (LOGS)= -0.04MEAN (LOGS)- 2.83STANDARD DEV. (LOGS)= 0.36
MAGNITUDE AND PROBABILITY OF ANNUAL HIGH FLOW, BASED ON WATER YEARS 1945-67
DISCHARGE, IN FT3/S, FOR INDICATEDPERIOD(CONSECU TIVEDAYS)
137
15306090
RECURRENCE INTERVAL , INEXCEEDANCE PROBABILITY,
250%
108634532252019
5 1020% 10%
357 710 1,187 360115 20672 12050 7736 5032 42
254%
5607724092251317155
YEARS, ANDIN PERCENT
50f 100f2% 1%
2,660 4,3801,310 2,170662 1,050351 540191 27591 11366 78
DURATION TABLE OF DAILY MEAN FLOW, WATER YEARS 1945-67
DISCHARGE, IN
1%
66
5%
24
10%
20
15%
18
20%
17
FT3/S,
30%
15
WHICH WAS EQUALED OR EXCEEDED FOR INDICATED PERCENT OF TIME
40%
13
50%
10
60% 70% 80% 90% 95%
6.3 0.49 0.07 0.04 0.02
98% 99%
0.01 0.00
99.5%
0.00
99.9%
0.00
f Reliability of values in column is uncertain, and potential errors are large.

33
09446000 WILLOW CREEK NEAR DOUBLE CIRCLE RANCH, NEAR MORENCI, AZ
MEAN MONTHLY AND ANNUAL DISCHARGES, 1945-67
MONTHMAXIMUM MINIMUM (FT3/S) (FT3/S)
STAN DARD COEFFI- PERCENT
DEVIA- CIENT OF OF MEAN TION VARI- ANNUAL
(FtVS) (FTVS) AT ION RUNOFF
OCTOBERNOVEMBERDECEMBERJANUARYFEBRUARYMARCHAPRILMAYJUNEJULYAUGUSTSEPTEMBER
ANNUAL
2219
27316336103231920245520
42
0.840.860.930.900.860.790.760.590.030.406.30.43
2.8
108.118197.919131211131911
13
6.15.6
564011235.44.85.75.69.85.4
8.3
0.610.693.12.11.41.20.410.420.510.440.520.48
0.62
6.35.011.211.84.911.88.37.27.07.911.67.0
100
MAGNITUDE AND PROBABILITY OF ANNUAL LOW FLOW, BASED ON CLIMATIC YEARS 1946-67
PERIOD(CONSECU TIVEDAYS)
13714306090120183
DISCHARGE, IN FT3/S, FOR INDICATED RECURRENCE INTERVAL, IN YEARS, ANDNON-EXCEEDANCE PROBABILITY
250%
0.710.770.870.871.01.41.93.06.8
520%
0.190.220.280.320.460.590.941.73.8
1010%
0.020.020.050.100.240.370.691.22.7
205%
0.000.000.000.000.000.250.540.972.0
, IN PERCENT
50f2%
0.000.000.000.000.000.160.430.761.3
100f1%
0.000.000.000.000.000.120.370.651.0
MAGNITUDE AND PROBABILITY OF INSTANTANEOUS PEAK FLOW BASED ON PERIOD OF RECORD 1944-67, 1973
DISCHARGE, IN FTVS, FOR INDICATED RECURRENCE INTERVAL IN YEARS, AND EXCEEDANCE PROBABILITY, IN PERCENT
250%
5 20%
10 10%
254%
50f 2%
100+ 1%
1,430 2,910 4,200 6,210 7,990 10,000
WEIGHTED SKEW (LOGS)- -0.04MEAN (LOGS)= 3.15STANDARD DEV. (IOGS)= 0.37
MAGNITUDE AND PROBABILITY OF ANNUAL HIGH FLOW, BASED ON WATER YEARS 1945-67
PERIOD(CONSECU TIVEDAYS)
137
15306090
250%
181966342312320
DISCHARGE,RECURRENCEEXCEEDANCE
520%
593 1300176106684537
IN FT3/S, FOR INDICATEDINTERVAL , INPROBABILITY,
1010%
,150 2,582 1,3261881146854
254%
40025066837421011283
YEARS,IN
3,2,1,
ANDPERCENT
50f2%
930100100610326158113
631
100f1%
,200,430,760975499222150
DURATION TABLE OF DAILY MEAN FLOW, WATER YEARS 1945-67
DISCHARGE, IN
1% 5%
83 26
10%
21
15%
18
20%
16
FTVS,
30%
14
WHICH WAS EQUALED OR
40%
12
50%
10
60%
7.3
EXCEEDED FOR INDICATED PERCENT OF TIME
70%
2.9
80% 90% 95% 98% 99%
1.4 0.97 0.67 0.27 0.04
99.5%
0.02
99.9%
0.00
f Reliability of values in column is uncertain, and potential errors are large.

34
09446500 EAGLE CREEK NEAR DOUBLE CIRCLE RANCH, NEAR MORENCI, AZ
MEAN MONTHLY AND ANNUAL DISCHARGES, 1945-67 MAGNITUDE AND PROBABILITY OF ANNUAL LOW FLOW, BASED ON CLIMATIC YEARS 1946*67
MONTHMAXIMUM MINIMUM (FTVS) (FT3/S)
STAN DARD COEFFI- PERCENT
DEVIA- CIENT OF OF MEAN TION VARI- ANNUAL
(FTVS) (FT3/S) ATION RUNOFF
OCTOBERNOVEMBERDECEMBERJANUARYFEBRUARYMARCHAPRILMAYJUNEJULYAUGUSTSEPTEMBER
3322
502310101213892525369342
5.75.24.74.74.15.94.35.33.7131311
181436412241271816213820
5.95.3
103762748184.34.66.3
258.8
0.330.382.91.81.21.20.640.240.300.300.660.45
5.74.511.613.37.113.18.95.75.06.712.16.4
ANNUAL 81 11 26 16 0.62 100
PERIOD(CONSECU TIVEDAYS)
13714306090120183
DISCHARGE, IN FTVS, FOR INDICATED RECURRENCE INTERVAL, IN YEARS, AND
NON-EXCEEDANCE PROBABILITY, IN PERCENT
250%
4.14.24.35.15.86.87.59.112
520%
3.13.13.33.94.55.05.46.69.4
1010%
2.72.72.93.44.04.44.65.68.2
205%
2.32.42.63.13.83.94.15.07.3
50f2%
2.02.12.42.83.53.63.64.36.5
100f1%
1.91.92.22.73.43.43.43.96.0
MAGNITUDE AND PROBABILITY OF INSTANTANEOUS PEAK FLOW BASED ON PERIOD OF RECORD 1944-67, 1973
DISCHARGE, IN FT^/S, FOR INDICATED RECURRENCE INTERVAL IN YEARS, AND EXCEEDANCE PROBABILITY, IN PERCENT
250%
520%
10 10%
254%
50f 2%
100f 1%
2,510 5,690 8,760 13,900 18,800 24,600
WEIGHTED SKEW (LOGS)* 0.03MEAN (IOGS)= 3.40STANDARD DEV. (LOGS)= 0.42
MAGNITUDE AND PROBABILITY OF ANNUAL HIGH FLOW, BASED ON WATER YEARS 1945-67
PERIOD (CON SECU TIVE DAYS)
DISCHARGE, IN FT3/S, FOR INDICATED RECURRENCE INTERVAL, IN YEARS, AND EXCEEDANCE PROBABILITY, IN PERCENT
2 50%
520%
10 10%
25 4%
50f 2%
100t 1%
137
15306090
29018112185654839
9085323262151479775
1,7801,000584376238147113
3,8502,0901,140719415238182
6,5503,4601,8101,130608332254
10,8005,5502,7901,720
871454349
DURATION TABLE OF DAILY MEAN FLOW, WATER YEARS 1945-67
DISCHARGE, IN FT^/S,
1% 5%
193 70
10%
38
15%
27
20% 30%
24 20
WHICH WAS EQUALED OR
40% 50%
18 16
60%
14
EXCEEDED FOR INDICATED PERCENT OF
70%
11
80% 90%
7.9 5.6
95% 98%
4.9 4.2
TIME
99%
3.8
99.5%
2.9
99.9%
2.4
f Reliability of values in column is uncertain, and potential errors are large.

35
09447000 EAGLE CREEK ABOVE PUMPING PLANT, NEAR MORENCI, AZ
MEAN MONTHLY AND ANNUAL DISCHARGES, 1945-86
MONTHMAXIMUM MINIMUM (FT3/S) (FT3/S)
STAN DARD COEFFI- PERCENT
DEVIA- CIENT OF OF MEAN TION VARI- ANNUAL
(FT3/S) (FT3/S) ATION RUNOFF
OCTOBERNOVEMBERDECEMBERJANUARYFEBRUARYMARCHAPRILMAYJUNEJULYAUGUSTSEPTEMBER
1,170228884
1,080989700214814098203114
131011111114119.25.3161913
673189969797503023375533
1823217618518013541168.5183919
2.71.02.01.91.91.40.820.520.380.500.720.56
9.54.512.713.713.713.87.14.33.25.27.84.7
ANNUAL 239 17 59 51 0.87 100
MAGNITUDE AND PROBABILITY OF ANNUAL LOW FLOW, BASED ON CLIMATIC YEARS 1945-86
PERIOD(CONSECU TIVEDAYS)
137
14306090120183
DISCHARGE, IN FT3/S, FOR INDICATED RECURRENCE INTERVAL, IN YEARS, AND
NON-EXCEEDANCE PROBABILITY
250%
111112141617182025
520%
6.66.97.68.91012131518
1010%
5.05.35.96.98.39.9
111316
205%
4.04.24.65.56.78.49.5
1115
, IN PERCENT
502%
3.03.23.54.35.37.18.19.513
100f1%
2.52.72.93.64.56.37.38.612
MAGNITUDE AND PROBABILITY OF INSTANTANEOUS PEAK FLOW BASED ON PERIOD OF RECORD 1944-86
DISCHARGE, IN FT3/S, FOR INDICATED RECURRENCE INTERVAL IN YEARS, AND EXCEEDANCE PROBABILITY, IN PERCENT
250%
5 20%
10 10%
25 4%
50 2%
100f 1%
2,770 7,380 12,100 20,100 27,700 36,800
WEIGHTED SKEW (LOGS)= -0.19MEAN (LOGS)= 3.43STANDARD DEV. (LOGS)= 0.52
MAGNITUDE AND PROBABILITY OF ANNUAL HIGH FLOW, BASED ON WATER YEARS 1945-86
PERIOD(CONSECU TIVEDAYS)
137
15306090
DISCHARGE, IN FT3/S, FOR INDICATED RECURRENCE INTERVAL, IN YEARS, ANDEXCEEDANCE PROBABILITY,
250%
6774092591751289376
520%
2,4301,450858524344233182
1010%
4,9002,9701,700988610401307
254%
10,6006,6703,7102,0401,170747561
IN PERCENT
502%
17,70011,5006,3003,3401,8301,150
851
100f1%
28,20019,10010,3005,3002,7701,7201,260
DURATION TABLE OF DAILY MEAN FLOW, WATER YEARS 1945-86
DISCHARGE, IN FT3/S, WHICH WAS EQUALED OR EXCEEDED FOR INDICATED PERCENT OF TIME
1% 5% 10% 15% 20% 30% 40% 50% 60% 70% 80% 90% 95% 98% 99% 99.5% 99.9%
554 156 80 55 45 36 32 27 24 21 18 14 12 9.9 8.8 6.7 4.1
f Reliability of values in column is uncertain, and potential errors are large.

36
09447800 BONITA CREEK NEAR MORENCI, AZ
MEAN MONTHLY AND ANNUAL DISCHARGES, 1982-86
STAN DARD COEFFI- PERCENT
DEVIA- CIENT OF OFMAXIMUM MINIMUM MEAN TION VARI- ANNUAL
MONTH <FT3/S) (FT3/S) (FT3/S) (FT3/S) ATION RUNOFF
MAGNITUDE AND PROBABILITY OF ANNUAL LOW FLOW, BASED ON CLIMATIC YEARS 1983-86
OCTOBERNOVEMBERDECEMBERJANUARYFEBRUARYMARCHAPRILMAYJUNEJULYAUGUSTSEPTEMBER
ANNUAL
1766.5302955457.86.34.68.79.1
11
22
4.63.66.36.54.14.53.32.21.33.75.44.6
5.6
405.6161523164.94.23.15.47.07.2
12
761.29.79.3
21171.81.91.42.01.62.3
6.6
1.90.210.620.620.911.00.360.460.450.370.230.33
0.54
27.23.810.510.315.810.93.32.82.13.64.74.9
100
PERIOD(CONSECU TIVEDAYS)
137
14306090120183
DISCHARGE, IN FT3/S, FOR INDICATED RECURRENCE INTERVAL, IN YEARS, AND
NON-EXCEEDANCE PROBABILITY
250%
1.91.92.02.12.52.93.33.95.4
520X
1.01.11.11.41.51.72.02.74.6
10f10%
0.710.760.820.911.11.21.52.24.2
20f5X
0.490.540.600.720.840.911.21.93.9
, IN PERCENT
50f2X
0.310.350.410.510.620.650.861.53.5
100f1%
0.220.260.320.410.500.520.701.33.3
MAGNITUDE AND PROBABILITY OF INSTANTANEOUS PEAK FLOW BASED ON YEARS OF RECORD
DISCHARGE, IN FT3/S, FOR INDICATED RECURRENCE INTERVAL IN YEARS, AND EXCEEDANCE PROBABILITY, IN PERCENT
250X
5 20X is* 25f
4X50f 2X
100t 1%
WEIGHTED SKEW (LOGS)= ****** MEAN (LOGS)= ****** STANDARD DEV. (LOGS)= ******
MAGNITUDE AND PROBABILITY OF ANNUAL HIGH FLOW, BASED ON WATER YEARS 1982-86
PERIOD(CONSECU TIVEDAYS)
137
15306090
DISCHARGE, IN FT3/S, FOR INDICATED RECURRENCE INTERVAL, IN YEARS, ANDEXCEEDANCE PROBABILITY,
250X
2221339862403023
520%
8555063261871076949
10f10X
2,1401,22066134618010472
25f4X
6,7203,5901,490683317159107
IN PERCENT
50f2X
15,5007,8202,6101,080459207137
100f1%
35,20016,7004,4101,640642262171
DURATION TABLE OF DAILY MEAN FLOW, WATER YEARS 1982-86
DISCHARGE, IN FT3/S, WHICH WAS EQUALED OR EXCEEDED FOR INDICATED PERCENT OF TIME
5X 10X 15X 20X 30X 40X 50X 60X 70X 80X 90X 95X 98% 99% 99.5X 99.9%1X
121 26 13 8.8 7.4 6.7 6.0 5.3 4.7 4.1 3.4 2.4 1.6 1.3 1.2 1.1 0.73
f Reliability of values in column is uncertain, and potential errors are large.
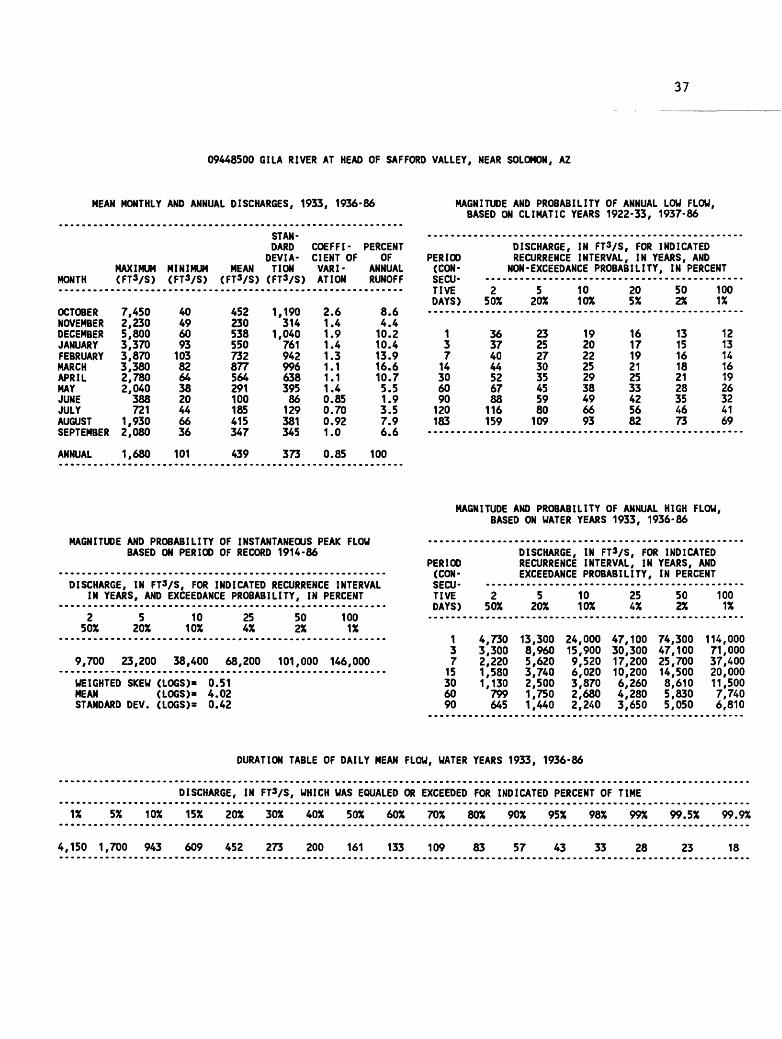
37
09448500 GILA RIVER AT HEAD OF SAFFORD VALLEY, NEAR SOLOMON, AZ
MEAN MONTHLY AND ANNUAL DISCHARGES, 1933, 1936-86 MAGNITUDE AND PROBABILITY OF ANNUAL LOW FLOW, BASED ON CLIMATIC YEARS 1922-33, 1937-86
MONTH
OCTOBERNOVEMBERDECEMBERJANUARYFEBRUARYMARCHAPRILMAYJUNEJULYAUGUSTSEPTEMBER
ANNUAL
MAXIMUM (FT3/S)
7,4502,2305,8003,3703,8703,3802,7802,040388721
1,9302,080
1,680
MINIMUM (FT3/S)
4049609310382643820446636
101
MEAN (FT3/S)
452230538550732877564291100185415347
439
STAN DARD COEFFI-
DEVIA- CIENT OF TION VARI- (FT3/S) AT ION
1,190 2.6314
1,040761942996638395
.4
.9
.4
.3
.1
.1
.486 0.85129 0.70381 0.92345 1.0
373 0.85
PERCENT OF
ANNUAL RUNOFF
8.64.410.210.413.916.610.75.51.93.57.96.6
100
PERIOD(CONSECU TIVEDAYS)
137
14306090120183
DISCHARGE, IN FT3/S, FOR INDICATED RECURRENCE INTERVAL, IN YEARS, AND
NON- EXCEEDANCE PROBABILITY
250%
36374044526788116159
520%
2325273035455980109
1010%
192022252938496693
205%
161719212533425682
, IN PERCENT
502%
131516182128354673
1001%
121314161926324169
MAGNITUDE AND PROBABILITY OF INSTANTANEOUS PEAK FLOW BASED ON PERIOD OF RECORD 1914-86
DISCHARGE, IN FT3/S, FOR INDICATED RECURRENCE INTERVAL IN YEARS, AND EXCEEDANCE PROBABILITY, IN PERCENT
250%
520%
10 10%
25 4%
50 2%
100 1%
9,700 23,200 38,400 68,200 101,000 146,000
WEIGHTED SKEW (LOGS)* 0.51MEAN (LOGS)* 4.02STANDARD DEV. (LOGS)* 0.42
MAGNITUDE AND PROBABILITY OF ANNUAL HIGH FLOW, BASED ON WATER YEARS 1933, 1936-86
PERIOD(CONSECU TIVEDAYS)
137
15306090
DISCHARGE, IN FT3/S, FOR INDICATED RECURRENCE INTERVAL, IN YEARS, ANDEXCEEDANCE PROBABILITY,
250%
4,7303,3002,2201,5801,130799645
520%
13,3008,9605,6203,7402,5001,7501,440
1010%
24,00015,9009,5206,0203,8702,6802,240
254%
47,10030,30017,20010,2006,2604,2803,650
IN PERCENT
502%
74,30047,10025,70014,5008,6105,8305,050
1001%
114,00071,00037,40020,00011,5007,7406,810
DURATION TABLE OF DAILY MEAN FLOW, WATER YEARS 1933, 1936-86
DISCHARGE, IN FT3/S, WHICH WAS EQUALED OR EXCEEDED FOR INDICATED PERCENT OF TIME
1% 5% 10% 15% 20% 30% 40% 50% 60% 70% 80% 90% 95% 98% 99% 99.5% 99.9%
4,150 1,700 943 609 452 273 200 161 133 109 83 57 43 33 28 23 18
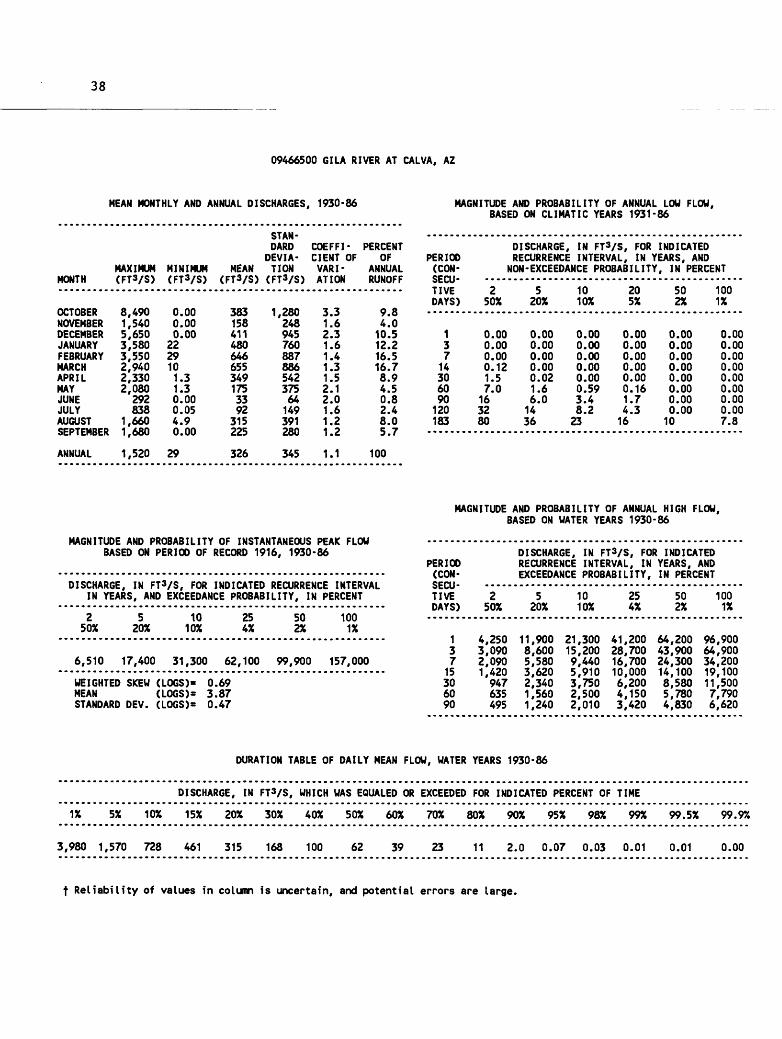
38
09466500 GILA RIVER AT CALVA, AZ
MEAN MONTHLY AND ANNUAL DISCHARGES, 1930-86 MAGNITUDE AND PROBABILITY OF ANNUAL LOW FLOW, BASED ON CLIMATIC YEARS 1931-86
MONTH
OCTOBERNOVEMBERDECEMBERJANUARYFEBRUARYMARCHAPRILMAYJUNEJULYAUGUSTSEPTEMBER
ANNUAL
MAXIMUM(FT3/S)
8,4901,5405,6503,5803,5502,9402,3302,080
292838
1,6601,680
1,520
MINIMUM(FT3/S)
0.000.000.00
2229101.31.30.000.054.90.00
29
MEAN(FT3/S)
3831584114806466553491753392
315225
326
STAN DARD
DEVIATION(FT3/S)
1,28024894576088788654237564149391280
345
COEFFICIENT OFVARIATION
3.31.62.31.61.41.31.52.12.01.61.21.2
1.1
PERCENTOF
ANNUALRUNOFF
9.84.010.512.216.516.78.94.50.82.48.05.7
100
PERIOD(CONSECU TIVEDAYS)
13714306090120183
DISCHARGE, IN FT3/S, FOR INDICATED RECURRENCE INTERVAL, IN YEARS, AND
NON-EXCEEDANCE PROBABILITY, IN PERCENT
250%
0.000.000.000.121.57.0163280
520%
0.000.000.000.000.021.66.01436
1010%
0.000.000.000.000.000.593.48.223
205%
0.000.000.000.000.000.161.74.316
502%
0.000.000.000.000.000.000.000.00
10
1001%
0.000.000.000.000.000.000.000.007.8
MAGNITUDE AND PROBABILITY OF INSTANTANEOUS PEAK FLOW BASED ON PERIOD OF RECORD 1916, 1930-86
DISCHARGE, IN FT3/S, FOR INDICATED RECURRENCE INTERVAL IN YEARS, AND EXCEEDANCE PROBABILITY, IN PERCENT
250%
5 20%
10 10%
25 4%
50 2%
100 1%
6,510 17,400 31,300 62,100 99,900 157,000
WEIGHTED SKEW (LOGS)= 0.69MEAN (LOGS)= 3.87STANDARD DEV. (LOGS)= 0.47
MAGNITUDE AND PROBABILITY OF ANNUAL HIGH FLOW, BASED ON WATER YEARS 1930-86
PERIOD(CONSECU TIVEDAYS)
137
15306090
DISCHARGE, IN FT3/S, FOR INDICATED RECURRENCE INTERVAL, IN YEARS, ANDEXCEEDANCE PROBABILITY,
250%
4,2503,0902,0901,420947635495
520%
11,9008,6005,5803,6202.3401,5601,240
1010%
21.30015,2009,4405,9103,7502,5002,010
254%
41,20028.70016.70010,0006,2004,1503.420
IN PERCENT
502%
64,20043.90024,30014,1008,5805,7804,830
1001%
96,90064,90034,20019,10011,5007,7906,620
DURATION TABLE OF DAILY MEAN FLOW, WATER YEARS 1930-86
DISCHARGE, IN FT3/S, WHICH WAS EQUALED OR EXCEEDED FOR INDICATED PERCENT OF TIME
1% 5% 10% 15% 20% 30% 40% 50% 60% 70% 80% 90% 95% 98% 99% 99.5% 99.9%
3,980 1,570 728 461 315 168 100 62 39 23 11 2.0 0.07 0.03 0.01 0.01 0.00
f Reliability of values in column is uncertain, and potential errors are large.
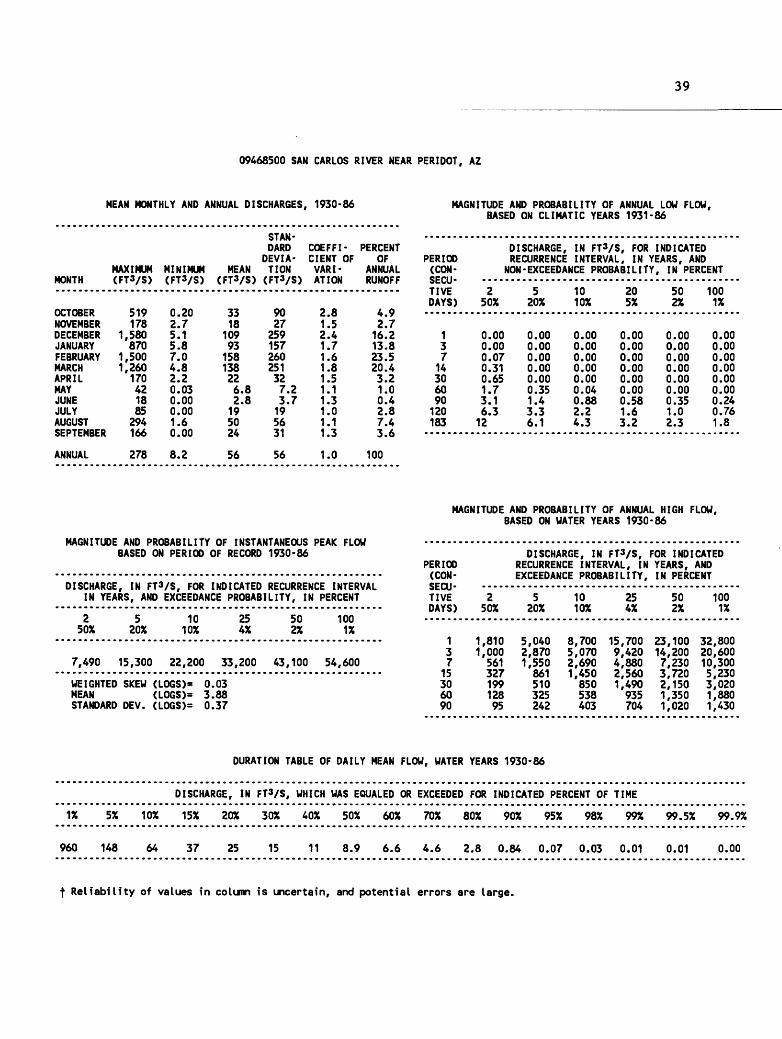
39
09468500 SAN CARLOS RIVER NEAR PERIDOT, AZ
MEAN MONTHLY AND ANNUAL DISCHARGES, 1930-86 MAGNITUDE AND PROBABILITY OF ANNUAL LOW FLOW, BASED ON CLIMATIC YEARS 1931-86
MONTH
OCTOBERNOVEMBERDECEMBERJANUARYFEBRUARYMARCHAPRILMAYJUNEJULYAUGUSTSEPTEMBER
ANNUAL
MAXIMUM(FT3/S)
519178
1,580870
1,5001,260
170421885294166
278
MINIMUM(FT3/S)
0.202.75.15.87.04.82.20.030.000.001.60.00
8.2
MEAN(FT3/S)
3318
10993158138226.82.8195024
56
STAN DARD
DEVIATION(FT3/S)
9027
259157260251327.23.7195631
56
COEFFICIENT OFVARIATION
2.81.52.41.71.61.81.51.11.31.01.11.3
1.0
PERCENTOF
ANNUALRUNOFF
4.92.716.213.823.520.43.21.00.42.87.43.6
100
PERIOD(CONSECU TIVEDAYS)
13714306090120183
DISCHARGE, IN FT3/S, FOR INDICATED RECURRENCE INTERVAL, IN YEARS, AND
NON- EXCEEDANCE PROBABILITY
250%
0.000.000.070.310.651.73.16.312
520%
0.000.000.000.000.000.351.43.36.1
1010%
0.000.000.000.000.000.040.882.24.3
205%
0.000.000.000.000.000.000.581.63.2
, IN PERCENT
502%
0.000.000.000.000.000.000.351.02.3
1001%
0.000.000.000.000.000.000.240.761.8
MAGNITUDE AND PROBABILITY OF INSTANTANEOUS PEAK FLOW BASED ON PERIOD OF RECORD 1930-86
DISCHARGE, IN FT3/S, FOR INDICATED RECURRENCE INTERVAL IN YEARS, AND EXCEEDANCE PROBABILITY, IN PERCENT
250%
520%
10 10%
254X
50 2X
100 1X
7,490 15,300 22,200 33,200 43,100 54,600
WEIGHTED SKEW (LOGS)= 0.03MEAN (LOGS)= 3.88STANDARD DEV. (LOGS)= 0.37
MAGNITUDE AND PROBABILITY OF ANNUAL HIGH FLOW, BASED ON WATER YEARS 1930-86
PERIOD(CONSECU TIVEDAYS)
137
15306090
DISCHARGE, IN FT3/S, RECURRENCE INTERVAL, INEXCEEDANCE PROBABILITY,
250%
1,8101,000
56132719912895
520%
5,0402,8701,550
861510325242
1010%
8,7005,0702,6901,450850538403
254X
15,7009,4204,8802,5601,490935704
FOR INDICATED YEARS, ANDIN PERCENT
502X
23,10014,2007,2303,7202,1501,3501,020
1001%
32,80020,60010,3005,2303,0201,8801,430
DURATION TABLE OF DAILY MEAN FLOW, WATER YEARS 1930-86
DISCHARGE, IN FT3/S, WHICH WAS EQUALED OR EXCEEDED FOR INDICATED PERCENT OF TIME
1X 5X 10% 15% 20% 30% 40% 50% 60% 70% 80% 90% 95% 98% 99% 99.5% 99.9%
960 148 64 37 25 15 11 8.9 6.6 4.6 2.8 0.84 0.07 0.03 0.01 0.01 0.00
f Reliability of values in column is uncertain, and potential errors are large.
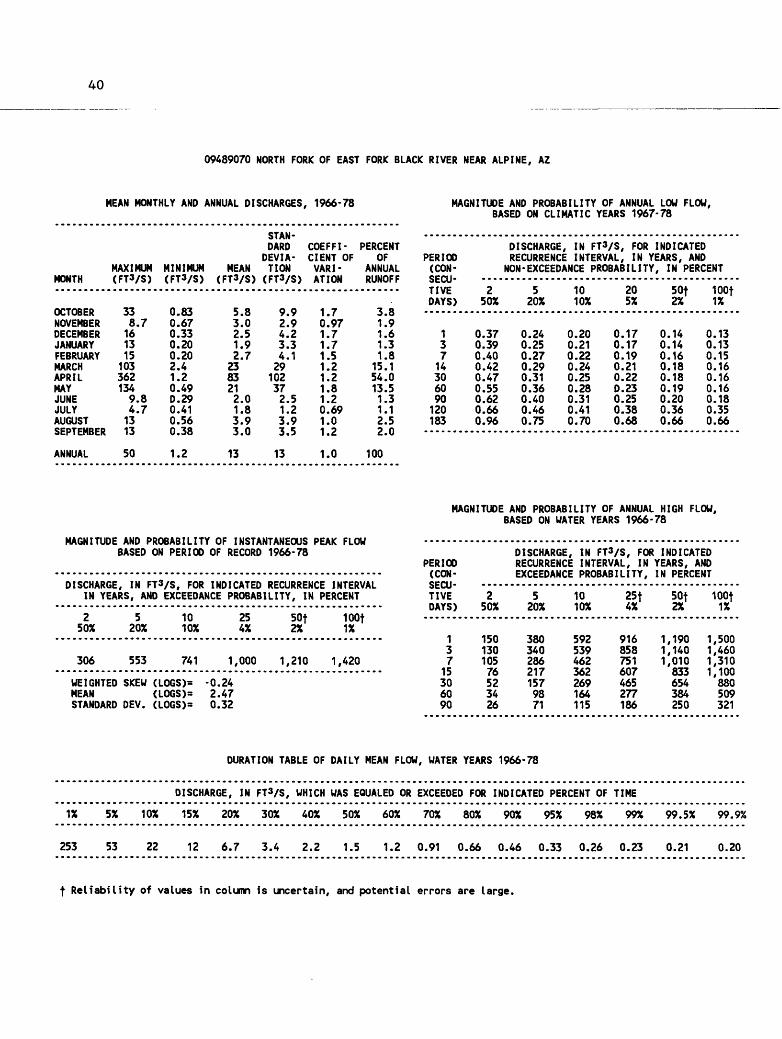
40
09489070 NORTH FORK OF EAST FORK BLACK RIVER NEAR ALPINE, AZ
MEAN MONTHLY AND ANNUAL DISCHARGES, 1966-78
MONTH
OCTOBERNOVEMBERDECEMBERJANUARYFEBRUARYMARCHAPRILMAYJUNEJULYAUGUSTSEPTEMBER
MAXIMUM(FT3/S)
338.7161315
1033621349.84.71313
MINIMUM(FT3/S)
0.830.670.330.200.202.41.20.49D.290.410.560.38
MEAN(FT3/S)
5.83.02.51.92.7
2383212.01.83.93.0
STAN DARD
DEVIATION(FT3/S)
9.92.94.23.34.129102372.51.23.93.5
COEFFICIENT OFVARIATION
1.70.971.71.71.51.21.21.81.20.691.01.2
PERCENTOF
ANNUALRUNOFF
3.81.91.61.31.8
15.154.013.51.31.12.52.0
ANNUAL 50 1.2 13 13 1.0 100
MAGNITUDE AND PROBABILITY OF ANNUAL LOW FLOW, BASED ON CLIMATIC YEARS 1967-78
PERIOD(CONSECU TIVEDAYS)
13714306090120183
DISCHARGE, IN FTVS, FOR RECURRENCE INTERVAL, IN
INDICATED YEARS, AND
NON-EXCEEDANCE PROBABILITY, IN PERCENT
250%
0.370.390.400.420.470.550.620.660.96
520%
0.240.250.270.290.310.360.400.460.75
1010%
0.200.210.220.240.250.280.310.410.70
205%
0.170.170.190.210.22D.230.250.380.68
50f2%
0.140.140.160.180.180.190.200.360.66
100t1%
0.130.130.150.160.160.160.180.350.66
MAGNITUDE AND PROBABILITY OF INSTANTANEOUS PEAK FLOW BASED ON PERIOD OF RECORD 1966-78
DISCHARGE, IN FT3/S, FOR INDICATED RECURRENCE INTERVAL IN YEARS, AND EXCEEDANCE PROBABILITY, IN PERCENT
250%
5 20%
10 10%
25 4%
50f 2%
100f 1%
306 553 741 1,000 1,210 1,420
WEIGHTED SKEW (LOGS)= -0.24MEAN (LOGS)= 2.47STANDARD DEV. (LOGS)= 0.32
MAGNITUDE AND PROBABILITY OF ANNUAL HIGH FLOW, BASED ON WATER YEARS 1966-78
PERIOD(CONSECU TIVEDAYS)
137
15306090
DISCHARGE, IN FT3/S, FOR INDICATED RECURRENCE INTERVAL, IN YEARS, ANDEXCEEDANCE PROBABILITY,
250%
15013010576523426
520%
3803402862171579871
1010%
592539462362269164115
25f4%
916858751607465277186
IN PERCENT
50f2%
1,1901,1401,010833654384250
100f1%
1,5001,4601,3101,100880509321
DURATION TABLE OF DAILY MEAN FLOW, WATER YEARS 1966-78
DISCHARGE, IN FT3/S, WHICH WAS EQUALED OR EXCEEDED FOR INDICATED PERCENT OF TIME
5% 10% 15% 20% 30% 40% 50% 60% 70% 80% 90% 95% 98% 99% 99.5% 99.9%1%
253 53 22 12 6.7 3.4 2.2 1.5 1.2 0.91 0.66 0.46 0.33 0.26 0.23 0.21 0.20
f Reliability of values in column is uncertain, and potential errors are large.
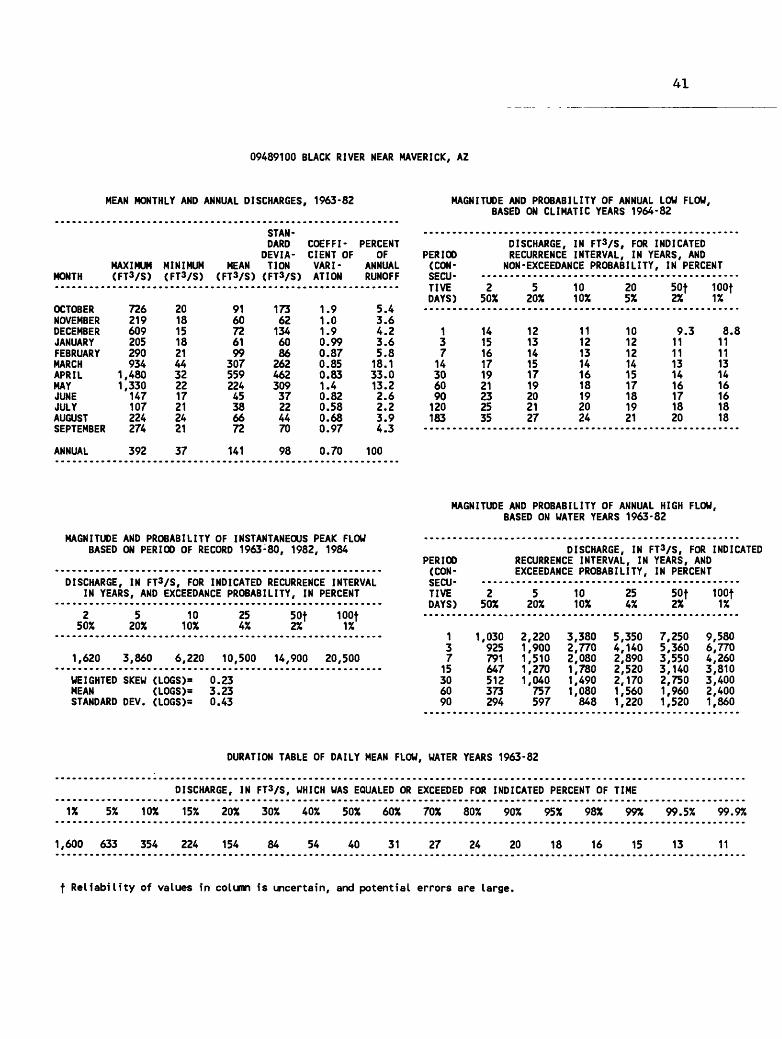
41
09489100 BLACK RIVER NEAR MAVERICK, AZ
MEAN MONTHLY AND ANNUAL DISCHARGES, 1963-82
MONTHMAXIMUM (FTVS)
MINIMUM (FTVS)
STAN DARD
DEVIA- MEAN TION
(FT3/S) (FT3/S)
COEFFI- PERCENT CIENT OF OF VARI- ANNUAL ATION RUNOFF
OCTOBERNOVEMBERDECEMBERJANUARYFEBRUARYMARCHAPRILMAYJUNEJULYAUGUSTSEPTEMBER
726219609205290934
1,4801,330
147107224274
ANNUAL 392
201815182144322217212421
37
916072619930755922445386672
141
17362134608626246230937224470
98
1.91.01.90.990.870.850.831.40.820.580.680.97
0.70
5.43.64.23.65.818.133.013.22.62.23.94.3
100
MAGNITUDE AND PROBABILITY OF ANNUAL LOW FLOW, BASED ON CLIMATIC YEARS 1964-82
PERIOD(CONSECU TIVEDAYS)
13714306090120183
DISCHARGE, IN FT3/S, FOR INDICATED RECURRENCE INTERVAL, IN YEARS, AND
NON-EXCEEDANCE PROBABILITY
250%
141516171921232535
520%
121314151719202127
1010%
111213141618192024
205%
101212141517181921
, IN PERCENT
50f2%
9.31111131416171820
100f1%
8.81111131416161818
MAGNITUDE AND PROBABILITY OF INSTANTANEOUS PEAK FLOW BASED ON PERIOD OF RECORD 1963-80, 1982, 1984
DISCHARGE, IN FT3/S, FOR INDICATED RECURRENCE INTERVAL IN YEARS, AND EXCEEDANCE PROBABILITY, IN PERCENT
250%
5 20%
10 10%
254%
50f 2%
100f 1%
1,620 3,860 6,220 10,500 14,900 20,500
WEIGHTED SKEW (LOGS)= 0.23MEAN (LOGS)= 3.23STANDARD DEV. (LOGS)= 0.43
MAGNITUDE AND PROBABILITY OF ANNUAL HIGH FLOW, BASED ON WATER YEARS 1963-82
PERIOD(CONSECU TIVEDAYS)
137
15306090
DISCHARGE, IN FT3/S, FOR INDICATED RECURRENCE INTERVAL, IN YEARS, ANDEXCEEDANCE PROBABILITY,
250%
1,030925791647512373294
520%
2,2201,9001,5101,2701,040757597
1010%
3,3802,7702,0801,7801,4901,080848
254%
5,3504,1402,8902,5202,1701,5601,220
IN PERCENT
50f2%
7,2505,3603,5503,1402,7501,9601,520
100f1%
9,5806,7704,2603,8103,4002,4001,860
DURATION TABLE OF DAILY MEAN FLOW, WATER YEARS 1963-82
DISCHARGE, IN FT3/S, WHICH WAS EQUALED OR EXCEEDED FOR INDICATED PERCENT OF TIME
1% 5% 10% 15% 20% 30% 40% 50% 60% 70% 80% 90% 95% 98% 99% 99.5% 99.9%
1,600 633 354 224 154 84 54 40 31 27 24 20 18 16 15 13 11
f Reliability of values in column is uncertain, and potential errors are large.
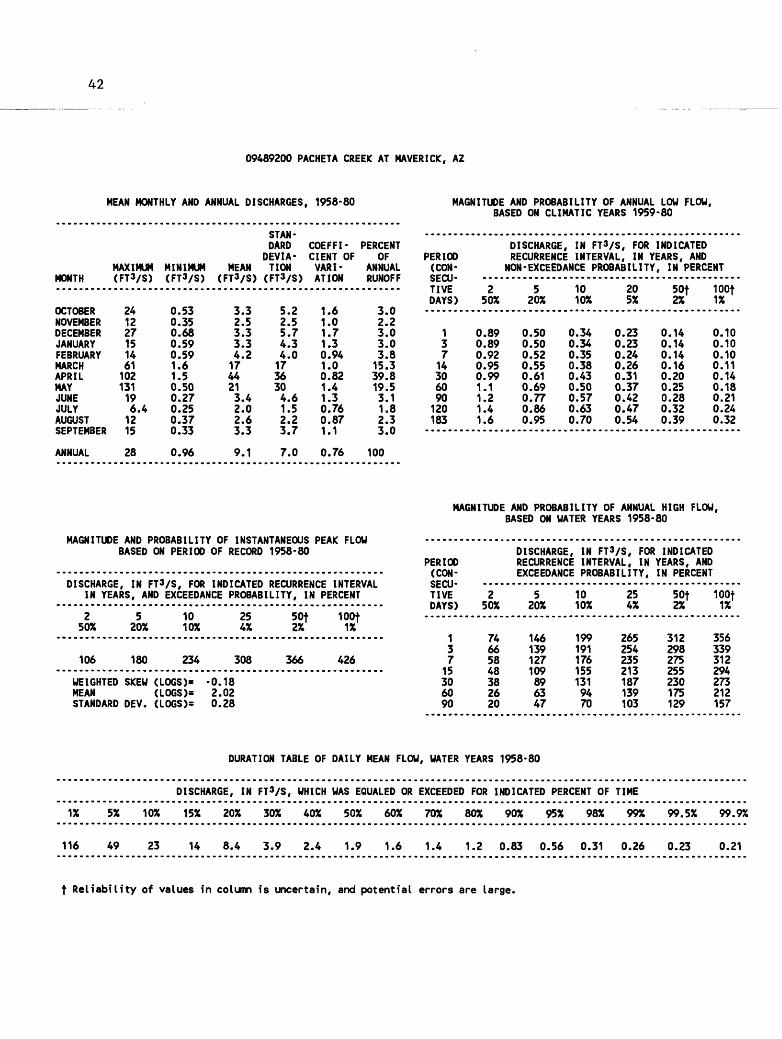
42
09489200 PACHETA CREEK AT MAVERICK, AZ
MEAN MONTHLY AND ANNUAL DISCHARGES, 1958-80 MAGNITUDE AND PROBABILITY OF ANNUAL LOW FLOW, BASED ON CLIMATIC YEARS 1959-80
MONTH
OCTOBERNOVEMBERDECEMBERJANUARYFEBRUARYMARCHAPRILMAYJUNEJULYAUGUSTSEPTEMBER
ANNUAL
MAXIMUM(FT3/S)
241227151461102131196.41215
28
MINIMUM(FT3/S)
0.530.350.680.590.591.61.50.500.270.250.370.33
0.96
MEAN(FT3/S)
3.32.53.33.34.21744213.42.02.63.3
9.1
STAN DARD
DEVIATION(FT3/S)
5.22.55.74.34.01736304.61.52.23.7
7.0
COEFFICIENT OFVARIATION
1.61.01.71.30.941.00.821.41.30.760.871.1
0.76
PERCENTOF
ANNUALRUNOFF
3.02.23.03.03.815.339.819.53.11.82.33.0
100
PERIOD(CONSECU TIVEDAYS)
13714306090120183
DISCHARGE, IN FT3/S, FOR INDICATED RECURRENCE INTERVAL, IN YEARS, AND
NON- EXCEEDANCE PROBABILITY, IN PERCENT
250%
0.890.890.920.950.991.11.21.41.6
520%
0.500.500.520.550.610.690.770.860.95
1010%
0.340.340.350.380.430.500.570.630.70
205%
0.230.230.240.260.310.370.420.470.54
50f2%
0.140.140.140.160.200.250.280.320.39
100f1%
0.100.100.100.110.140.180.210.240.32
MAGNITUDE AND PROBABILITY OF INSTANTANEOUS PEAK FLOW BASED ON PERIOD OF RECORD 1958-80
DISCHARGE, IN FT3/S, FOR INDICATED RECURRENCE INTERVAL IN YEARS, AND EXCEEDANCE PROBABILITY, IN PERCENT
250%
5 20%
10 10%
25 4%
50f 2%
100f 1%
106 180 234 308
WEIGHTED SKEW (LOGS)= -0.18MEAN (LOGS)= 2.02STANDARD DEV. (LOGS)= 0.28
366 426
MAGNITUDE AND PROBABILITY OF ANNUAL HIGH FLOW, BASED ON WATER YEARS 1958-80
PERIOD(CONSECU TIVEDAYS)
13715306090
DISCHARGE, IN FT3/S, FOR INDICATED RECURRENCE INTERVAL, IN YEARS, ANDEXCEEDANCE PROBABILITY,
250%
74665848382620
520%
146139127109896347
1010%
1991911761551319470
254%
265254235213187139103
IN PERCENT
50f2%
312298275255230175129
100f1%
356339312294273212157
DURATION TABLE OF DAILY MEAN FLOW, WATER YEARS 1958-80
DISCHARGE, IN FT3/S, WHICH WAS EQUALED OR EXCEEDED FOR INDICATED PERCENT OF TIME
5% 10% 15% 20% 30% 40% 50% 60% 70% 80% 90% 95% 98% 99% 99.5% 99.9%1%
116 49 23 14 8.4 3.9 2.4 1.9 1.6 1.4 1.2 0.83 0.56 0.31 0.26 0.23 0.21
f Reliability of values in column is uncertain, and potential errors are large.
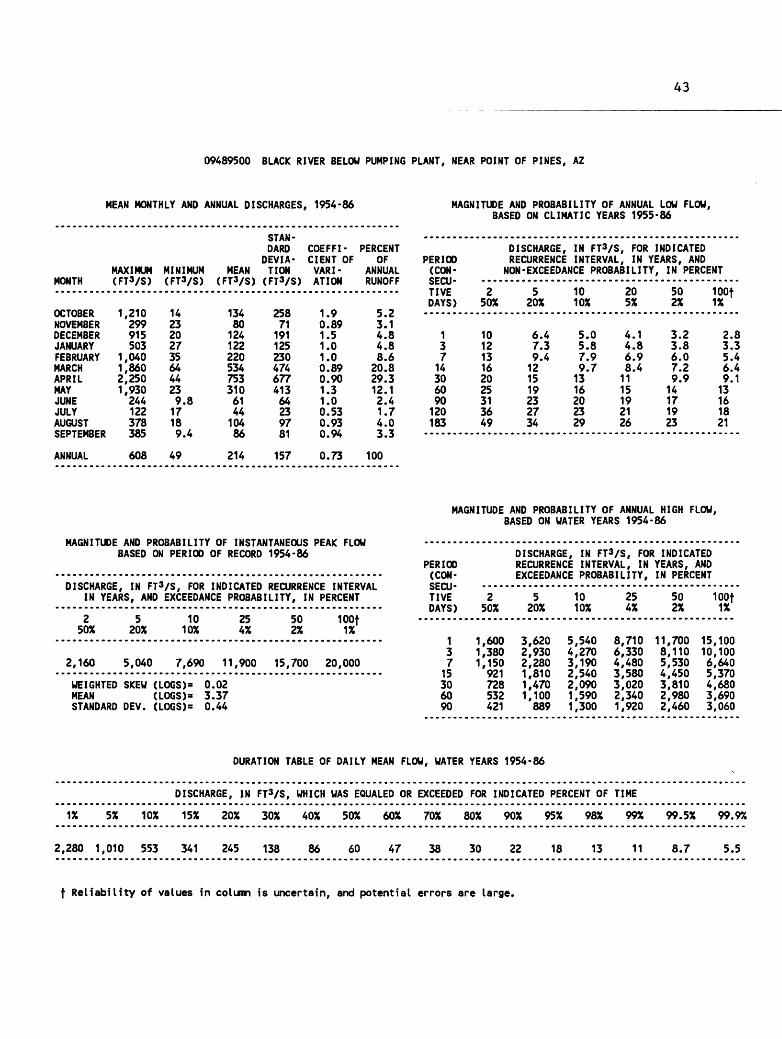
09489500 BLACK RIVER BELOW PUMPING PLANT, NEAR POINT OF PINES, AZ
MEAN MONTHLY AND ANNUAL DISCHARGES, 1954-86
MONTHMAXIMUM MINIMUM (FT3/S) (FT3/S)
STAN DARD COEFFI- PERCENT
DEVIA- CIENT OF OF MEAN TION VARI- ANNUAL
(FT3/S) (FT3/S) ATION RUNOFF
OCTOBERNOVEMBERDECEMBERJANUARYFEBRUARYMARCHAPRILMAYJUNEJULYAUGUSTSEPTEMBER
1,210299915503
1,0401,8602,2501,930244122378385
14232027356444239.817189.4
13480124122220534753310614410486
25871
19112523047467741364239781
1.90.891.51.01.00.890.901.31.00.530.930.94
5.23.14.84.88.620.829.312.12.41.74.03.3
ANNUAL 608 49 214 157 0.73 100
MAGNITUDE AND PROBABILITY OF ANNUAL LOW FLOW, BASED ON CLIMATIC YEARS 1955-86
PERIOD(CONSECU TIVEDAYS)
13714306090120183
DISCHARGE, IN FT3/S, FOR INDICATED RECURRENCE INTERVAL, IN YEARS, AND
NON-EXCEEDANCE PROBABILITY
250X
101213162025313649
520%
6.47.39.4121519232734
1010%
5.05.87.99.71316202329
205%
4.14.86.98.4
1115192126
, IN PERCENT
502%
3.23.86.07.29.914171923
100t1%
2.83.35.46.49.113161821
MAGNITUDE AND PROBABILITY OF INSTANTANEOUS PEAK FLOW BASED ON PERIOD OF RECORD 1954-86
DISCHARGE, IN FT3/S, FOR INDICATED RECURRENCE INTERVAL IN YEARS, AND EXCEEDANCE PROBABILITY, IN PERCENT
2 50%
520%
10 10%
254%
50 2%
100t 1%
2,160 5,040 7,690 11,900 15,700 20,000
WEIGHTED SKEW (LOGS)- 0.02MEAN (LOGS)= 3.37STANDARD DEV. (LOGS)= 0.44
MAGNITUDE AND PROBABILITY OF ANNUAL HIGH FLOW, BASED ON WATER YEARS 1954-86
PERIOD(CONSECU TIVEDAYS)
137
15306090
DISCHARGE, IN FT3/S, FOR INDICATED RECURRENCE INTERVAL, IN YEARS, ANDEXCEEDANCE PROBABILITY,
250%
1,6001,3801,150921728532421
520%
3,6202,9302,2801,8101,4701,100889
1010%
5,5404,2703,1902,5402,0901,5901,300
254%
8,7106,3304,4803,5803,0202,3401,920
IN PERCENT
502%
11,7008,1105,5304,4503,8102,9802,460
100t1%
15,10010,1006,6405,3704,6803,6903,060
DURATION TABLE OF DAILY MEAN FLOW, WATER YEARS 1954-86
DISCHARGE, IN FT3/S, WHICH WAS EQUALED OR EXCEEDED FOR INDICATED PERCENT OF TIME
1% 5% 10% 15% 20% 30% 40% 50% 60% 70% 80% 90% 95% 98% 99% 99.5% 99.9%
2,280 1,010 553 341 245 138 86 60 47 38 30 22 18 13 11 8.7 5.5
f Reliability of values in column is uncertain, and potential errors are large.

44
09489700 BIG BONITO CREEK NEAR FORT APACHE, AZ
MEAN MONTHLY AND ANNUAL DISCHARGES, 1958-80
MONTHMAXIMUM MINIMUM (FT3/S) (FT3/S)
STAN DARD COEFFI- PERCENT
DEVIA- CIENT OF OF MEAN TION VARI- ANNUAL
(FT3/S) (FT3/S) ATION RUNOFF
OCTOBERNOVEMBERDECEMBERJANUARYFEBRUARYMARCHAPRILMAYJUNEJULYAUGUSTSEPTEMBER
ANNUAL
15769
25111531652154061014850122112
167
9.2101111102123116.36.57.87.0
17
302839406513322413834204031
69
401957356811916814939112926
43
1.30.711.50.861.00.900.751.11.10.560.730.83
0.62
3.73.34.84.97.916.227.216.84.12.44.93.8
100
MAGNITUDE AND PROBABILITY OF ANNUAL LOW FLOW, BASED ON CLIMATIC YEARS 1959-81
PERIOD(CONSECU TIVEDAYS)
137
14306090120183
DISCHARGE, IN FT3/S, FOR INDICATED RECURRENCE INTERVAL, IN YEARS, AND
NON- EXCEEDANCE PROBABILITY, IN PERCENT
250%
6.26.77.27.89.0
11131419
520%
4.85.35.66.37.39.0101114
1010%
4.24.64.95.66.48.09.31012
205%
3.84.14.35.05.87.18.69.7
11
50f2%
3.43.73.84.55.16.37.89.39.4
100f1%
3.13.43.54.14.75.77.39.08.7
MAGNITUDE AND PROBABILITY OF INSTANTANEOUS PEAK FLOW BASED ON PERIOD OF RECORD 1958-81
DISCHARGE, IN FT^/S, FOR INDICATED RECURRENCE INTERVAL IN YEARS, AND EXCEEDANCE PROBABILITY, IN PERCENT
250%
5 20%
10 10%
25 4%
50f 2%
100f 1%
629 1,440 2,200 3,470 4,650 6,040
WEIGHTED SKEW (LOGS)- -0.04MEAN (LOGS)= 2.80STANDARD DEV. (LOGS)= 0.43
MAGNITUDE AND PROBABILITY OF ANNUAL HIGH FLOW, BASED ON WATER YEARS 1958-80
PERIOD(CONSECU TIVEDAYS)
13715306090
DISCHARGE, IN FT*/S, FOR INDICATED RECURRENCE INTERVAL, IN YEARS, ANDEXCEEDANCE PROBABILITY,
250%
453391328269219172140
520%
969791623503416330271
1010%
1,4401,140859684576456375
254%
2,1901,6701,190937806638520
IN PERCENT
50f2%
2,8602,1301,4701,140997786638
100f1%
3,6402,6501,7601,3501,200945761
DURATION TABLE OF DAILY MEAN FLOW, WATER YEARS 1958-80
DISCHARGE, IN FT3/S, WHICH WAS EQUALED OR EXCEEDED FOR INDICATED PERCENT OF TIME
1% 5% 10% 15% 20% 30% 40% 50% 60% 70% 80% 90% 95% 98% 99% 99.5% 99.9%
597 293 177 122 87 53 34 24 18 15 12 9.9 8.1 6.4 5.6 5.1 4.4
f Reliability of values in column is uncertain, and potential errors are large.
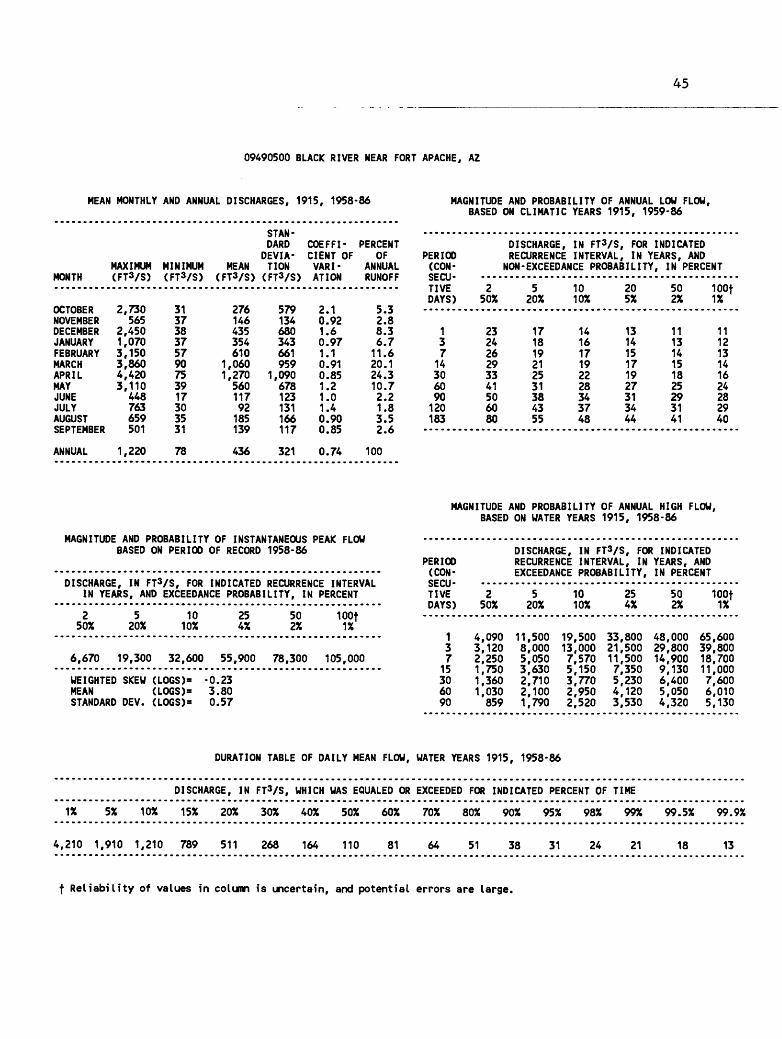
45
09490500 BLACK RIVER NEAR FORT APACHE, AZ
MEAN MONTHLY AND ANNUAL DISCHARGES, 1915, 1958-86
MONTHMAXIMUM MINIMUM (FT3/S) (FWS)
STAN DARD COEFFI- PERCENT
DEVIA- CIENT OF OF MEAN TION VARI- ANNUAL
(FWS) (FWS) AT I ON RUNOFF
OCTOBERNOVEMBERDECEMBERJANUARYFEBRUARYMARCHAPRILMAYJUNEJULYAUGUSTSEPTEMBER
ANNUAL
2,730565
2,4501,0703,1503,8604,4203,110
448763659501
1,220
313738375790753917303531
78
276146435354610
1,0601,27056011792185139
436
579134680343661959
1,090678123131166117
321
2.10.921.60.971.10.910.851.21.01.40.900.85
0.74
5.32.88.36.711.620.124.310.72.21.83.52.6
100
MAGNITUDE AND PROBABILITY OF ANNUAL LOW FLOW, BASED ON CLIMATIC YEARS 1915, 1959-86
PERIOD(CONSECU TIVEDAYS)
13714306090120183
DISCHARGE, IN FT^/S, FOR INDICATED RECURRENCE INTERVAL, IN YEARS, AND
NON-EXCEEDANCE PROBABILITY
250%
232426293341506080
520%
171819212531384355
1010%
141617192228343748
205%
131415171927313444
, IN PERCENT
502%
111314151825293141
100f1%
111213141624282940
MAGNITUDE AND PROBABILITY OF INSTANTANEOUS PEAK FLOW BASED ON PERIOD OF RECORD 1958-86
DISCHARGE, IN FT^/S, FOR INDICATED RECURRENCE INTERVAL IN YEARS, AND EXCEEDANCE PROBABILITY, IN PERCENT
250%
520%
10 10%
25 4%
50 2%
100f 1%
6,670 19,300 32,600 55,900 78,300 105,000
WEIGHTED SKEW (LOGS)= -0.23MEAN (LOGS)= 3.80STANDARD DEV. (LOGS)= 0.57
MAGNITUDE AND PROBABILITY OF ANNUAL HIGH FLOW, BASED ON WATER YEARS 1915, 1958-86
PERIOD(CONSECU TIVEDAYS)
137
15306090
DISCHARGE, IN FT3/S, FOR INDICATED RECURRENCE INTERVAL, IN YEARS, ANDEXCEEDANCE PROBABILITY,
250%
4,0903,1202,2501,7501,3601,030859
520%
11,5008,0005,0503,6302,7102,1001,790
1010%
19,50013,0007,5705,1503,7702,9502,520
254%
33,80021,50011,5007,3505,2304,1203,530
IN PERCENT
502%
48,00029,80014,9009,1306,4005,0504,320
100f1%
65,60039,80018,70011,0007,6006,0105,130
DURATION TABLE OF DAILY MEAN FLOW, WATER YEARS 1915, 1958-86
DISCHARGE, IN FT^/S, WHICH WAS EQUALED OR EXCEEDED FOR INDICATED PERCENT OF TIME
1% 5% 10% 15% 20% 30% 40% 50% 60% 70% 80% 90% 95% 98% 99% 99.5% 99.9%
4,210 1,910 1,210 789 511 268 164 110 81 64 51 38 31 24 21 18 13
f Reliability of values in column is uncertain, and potential errors are large.
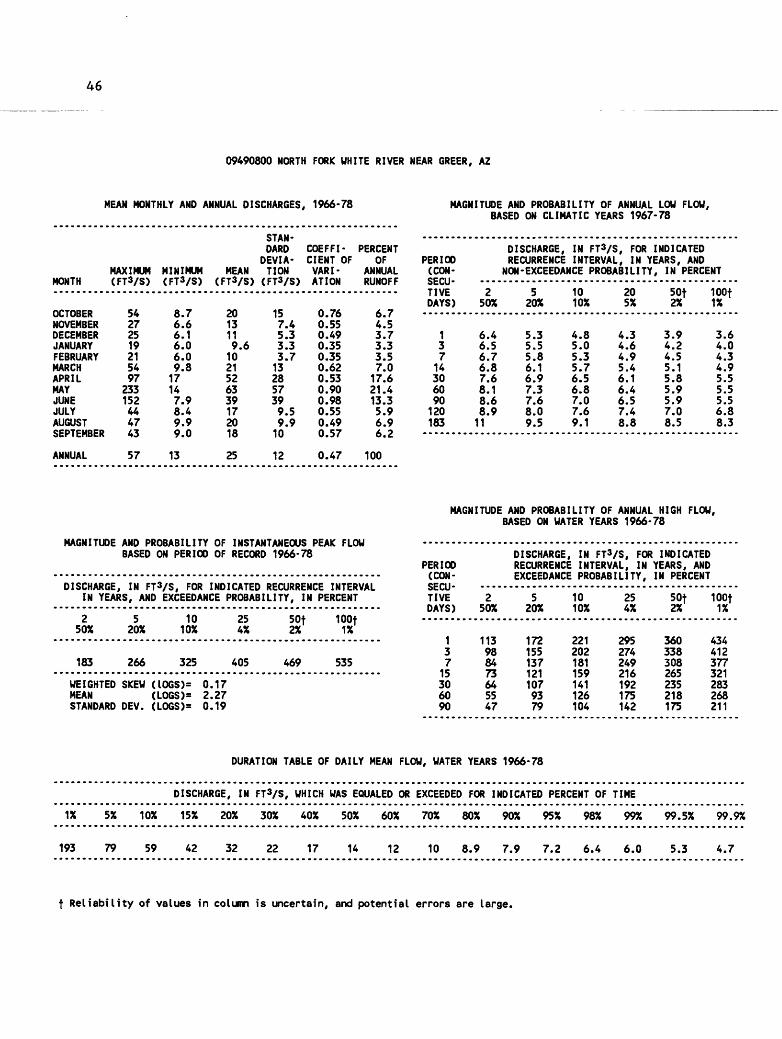
46
09490800 NORTH FORK WHITE RIVER NEAR GREER, AZ
MEAN MONTHLY AND ANNUAL DISCHARGES, 1966-78
MONTHMAXIMUM MINIMUM (FT3/S) (FTVS)
STAN DARD COEFFI- PERCENT
DEVIA- CIENT OF OF MEAN TION VARI- ANNUAL
(FT3/S) (FTVS) ATION RUNOFF
OCTOBERNOVEMBERDECEMBERJANUARYFEBRUARYMARCHAPRILMAYJUNEJULYAUGUSTSEPTEMBER
ANNUAL
54272519215497
233152444743
57
8.76.66.16.06.09.817147.98.49.99.0
13
2013119.61021526339172018
25
157.45.33.33.7132857399.59.910
12
0.760.550.490.350.350.620.530.900.980.550.490.57
0.47
6.74.53.73.33.57.017.621.413.35.96.96.2
100
MAGNITUDE AND PROBABILITY OF ANNUAL LOW FLOW, BASED ON CLIMATIC YEARS 1967-78
PERIOD(CONSECU TIVEDAYS)
13714306090120183
DISCHARGE, IN FT3/S, FOR INDICATED RECURRENCE INTERVAL, IN YEARS, AND
NON- EXCEEDANCE PROBABILITY, IN PERCENT
250%
6.46.56.76.87.68.18.68.9
11
520%
5.35.55.86.16.97.37.68.09.5
1010%
4.85.05.35.76.56.87.07.69.1
205%
4.34.64.95.46.16.46.57.48.8
50t2%
3.94.24.55.15.85.95.97.08.5
100t1%
3.64.04.34.95.55.55.56.88.3
MAGNITUDE AND PROBABILITY OF INSTANTANEOUS PEAK FLOW BASED ON PERIOD OF RECORD 1966-78
DISCHARGE, IN FT3/S, FOR INDICATED RECURRENCE INTERVAL IN YEARS, AND EXCEEDANCE PROBABILITY, IN PERCENT
250%
5 20%
10 10%
25 4%
183 266 325 405
WEIGHTED SKEW (IOGS)= 0.17MEAN (LOGS)- 2.27STANDARD DEV. (LOGS)- 0.19
50f 2%
100f 1%
469 535
MAGNITUDE AND PROBABILITY OF ANNUAL HIGH FLOW, BASED ON WATER YEARS 1966-78
PERIOD(CONSECU TIVEDAYS)
137
15306090
DISCHARGE, IN FT^/S, FOR INDICATED RECURRENCE INTERVAL, IN YEARS, ANDEXCEEDANCE PROBABILITY,
250%
113988473645547
520%
1721551371211079379
1010%
221202181159141126104
254%
295274249216192175142
IN PERCENT
sot2X
360338308265235218175
100t1%
434412377321283268211
DURATION TABLE OF DAILY MEAN FLOW, WATER YEARS 1966-78
DISCHARGE, IN FT3/S, WHICH WAS EQUALED OR EXCEEDED FOR INDICATED PERCENT OF TIME
5X 10% 15% 20% 30% 40% 50% 60% 70% 80% 90% 95% 98% 99% 99.5% 99.9%1%
193 79 59 42 32 22 17 14 12 10 8.9 7.9 7.2 6.4 6.0 5.3 4.7
t Reliability of values in column is uncertain, and potential errors are large.
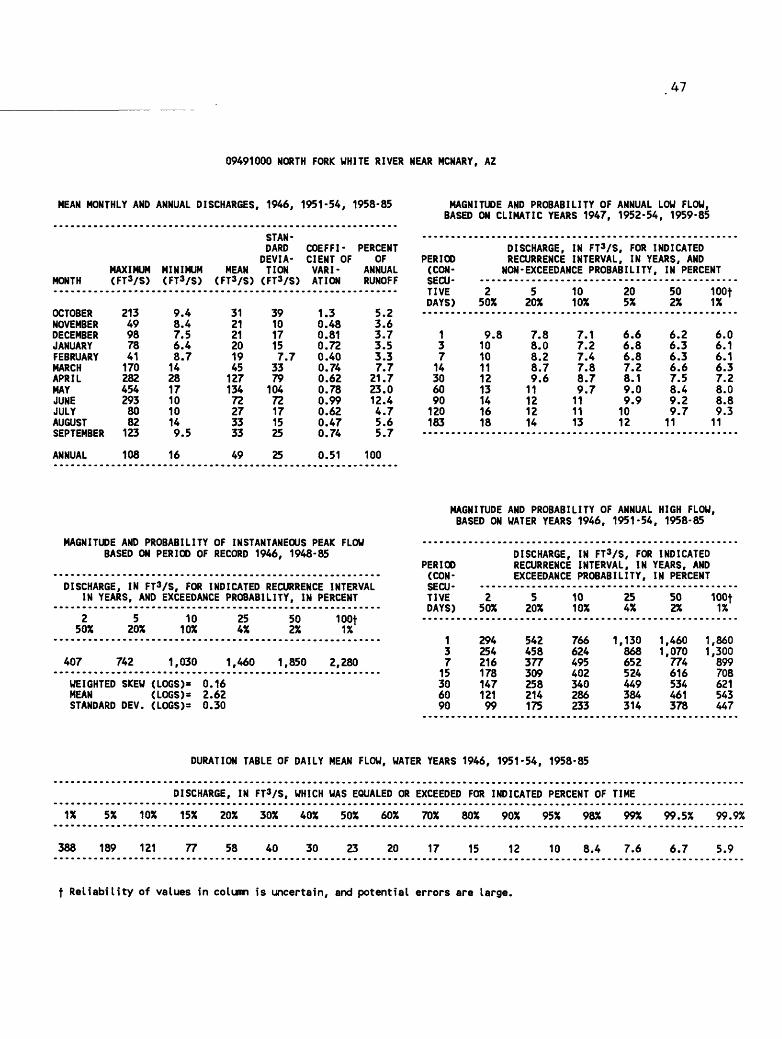
47
09491000 NORTH FORK WHITE RIVER NEAR MCNARY, AZ
MEAN MONTHLY AND ANNUAL DISCHARGES, 1946, 1951-54, 1958-85
MONTHMAXIMUM MINIMUM (FT3/S) (FT3/S)
STAN DARD COEFFI- PERCENT
DEVIA- CIENT OF OF MEAN TION VARI- ANNUAL
(FT3/S) (FT3/S) ATION RUNOFF
OCTOBERNOVEMBERDECEMBERJANUARYFEBRUARYMARCHAPRILMAYJUNEJULYAUGUSTSEPTEMBER
ANNUAL
213499878411702824542938082123
108
9.48.47.56.48.71428171010149.5
16
31212120194512713472273333
49
391017157.7
337910472171525
25
1.30.480.810.720.400.740.620.780.990.620.470.74
0.51
5.23.63.73.53.37.721.723.012.44.75.65.7
100
MAGNITUDE AND PROBABILITY OF ANNUAL LOW FLOW, BASED ON CLIMATIC YEARS 1947, 1952-54, 1959-85
PERIOD(CONSECU TIVEDAYS)
13714306090120183
DISCHARGE, IN FT3/S, FOR INDICATED RECURRENCE INTERVAL, IN YEARS, AND
NON- EXCEEDANCE PROBABILITY
250%
9.81010111213141618
520%
7.88.08.28.79.6
11121214
1010%
7.17.27.47.88.79.7
111113
205%
6.66.86.87.28.19.09.91012
, IN PERCENT
502%
6.26.36.36.67.58.49.29.7
11
100f1%
6.06.16.16.37.28.08.89.3
11
MAGNITUDE AND PROBABILITY OF INSTANTANEOUS PEAK FLOW BASED ON PERIOD OF RECORD 1946, 1948-85
DISCHARGE, IN FT3/S, FOR INDICATED RECURRENCE INTERVAL IN YEARS, AND EXCEEDANCE PROBABILITY, IN PERCENT
2 50%
520%
10 10%
25 4%
50 2%
100t 1%
407 742 1,030 1,460 1,850 2,280
WEIGHTED SKEW (LOGS)= 0.16MEAN (LOGS)= 2.62STANDARD DEV. (LOGS)= 0.30
MAGNITUDE AND PROBABILITY OF ANNUAL HIGH FLOW, BASED ON WATER YEARS 1946, 1951-54, 1958-85
DISCHARGE, IN FT3/S, FOR INDICATEDPERIOD(CONSECU TIVEDAYS)
137
15306090
RECURRENCE INTERVAL , INEXCEEDANCE PROBABILITY,
250%
29425421617814712199
5 1020% 10%
542 766 1,458 624377 495309 402258 340214 286175 233
254%
130868652524449384314
YEARS, ANDIN PERCENT
502%
1,460 11,070 1774616534461378
100f1%
,860,300899708621543447
DURATION TABLE OF DAILY MEAN FLOW, WATER YEARS 1946, 1951-54, 1958-85
DISCHARGE, IN FT3/S, WHICH WAS EQUALED OR EXCEEDED FOR INDICATED PERCENT OF TIME
1% 5% 10% 15% 20% 30% 40% 50% 60% 70% 80% 90% 95% 98% 99% 99.5% 99.9%
388 189 121 77 58 40 30 23 20 17 15 12 10 8.4 7.6 6.7 5.9
f Reliability of values in column is uncertain, and potential errors are large.
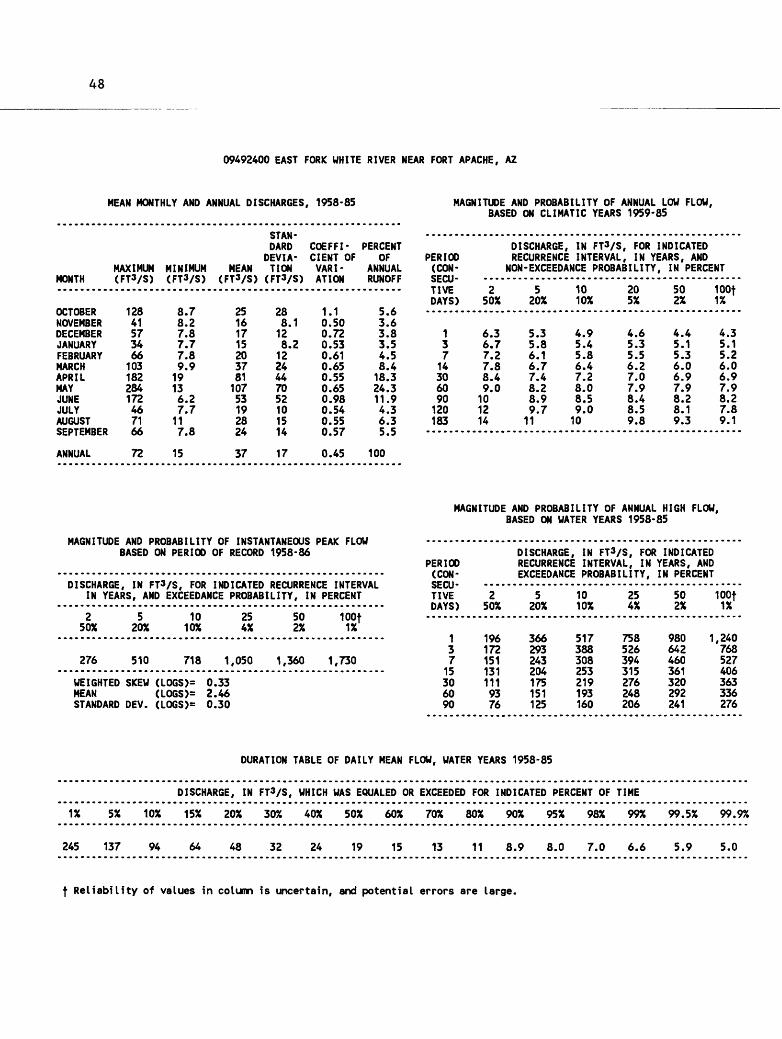
48
09492400 EAST FORK WHITE RIVER NEAR FORT APACHE, AZ
MEAN MONTHLY AND ANNUAL DISCHARGES, 1958-85
MONTHMAXIMUM MINIMUM (FT3/S) (FT3/S)
STAN DARD COEFFI- PERCENT
DEVIA- CIENT OF OF MEAN TION VARI- ANNUAL
(FTVS) (FT3/S) ATION RUNOFF
OCTOBERNOVEMBERDECEMBERJANUARYFEBRUARYMARCHAPRILMAYJUNEJULYAUGUSTSEPTEMBER
ANNUAL
12841573466103182284172467166
72
8.78.27.87.77.89.919136.27.7
117.8
15
2516171520378110753192824
37
288.1128.21224447052101514
17
1.10.500.720.530.610.650.550.650.980.540.550.57
0.45
5.63.63.83.54.58.418.324.311.94.36.35.5
100
MAGNITUDE AND PROBABILITY OF ANNUAL LOW FLOW, BASED ON CLIMATIC YEARS 1959-85
PERIOD(CONSECU TIVEDAYS)
13714306090120183
DISCHARGE, IN FTVS, FOR INDICATED RECURRENCE INTERVAL, IN YEARS, AND
NON- EXCEEDANCE PROBABILITY, IN PERCENT
250%
6.36.77.27.88.49.0101214
520%
5.35.86.16.77.48.28.99.7
11
1010%
4.95.45.86.47.28.08.59.010
205%
4.65.35.56.27.07.98.48.59.8
502%
4.45.15.36.06.97.98.28.19.3
100t1%
4.35.15.26.06.97.98.27.89.1
MAGNITUDE AND PROBABILITY OF INSTANTANEOUS PEAK FLOW BASED ON PERIOD OF RECORD 1958-86
DISCHARGE, IN FT3/S, FOR INDICATED RECURRENCE INTERVAL IN YEARS, AND EXCEEDANCE PROBABILITY, IN PERCENT
250%
5 20%
10 10%
25 4%
50 2%
100t 1%
276 510 718 1,050 1,360 1,730
WEIGHTED SKEW (LOGS)* 0.33MEAN (LOGS)= 2.46STANDARD DEV. (LOGS)= 0.30
MAGNITUDE AND PROBABILITY OF ANNUAL HIGH FLOW, BASED ON WATER YEARS 1958-85
PERIOD(CONSECU TIVEDAYS)
137
15306090
DISCHARGE, IN FT^/S, FOR INDICATED RECURRENCE INTERVAL, IN YEARS, ANDEXCEEDANCE PROBABILITY,
250%
1961721511311119376
520%
366293243204175151125
1010%
517388308253219193160
254%
758526394315276248206
IN PERCENT
502%
980642460361320292241
100t1%
1,240768527406363336276
DURATION TABLE OF DAILY MEAN FLOW, WATER YEARS 1958-85
DISCHARGE, IN FT3/S, WHICH WAS EQUALED OR EXCEEDED FOR INDICATED PERCENT OF TIME
1% 5% 10% 15% 20% 30% 40% 50% 60% 70% 80% 90% 95% 98% 99% 99.5% 99.9%
245 137 94 64 48 32 24 19 15 13 11 8.9 8.0 7.0 6.6 5.9 5.0
f Reliability of values in column is uncertain, and potential errors are large.

49
09494000 WHITE RIVER NEAR FORT APACHE, AZ
MEAN MONTHLY AND ANNUAL DISCHARGES, 1958-86
STAN DARD COEFFI- PERCENT
DEVIA- CIENT OF OFMAXIMUM MINIMUM MEAN TION VARI- ANNUAL
MONTH (FT3/S) (FTVS) (FTVS) (FT3/S) AT ION RUNOFF
MAGNITUDE AND PROBABILITY OF ANNUAL LOW FLOW, BASED ON CLIMATIC YEARS 1959-86
OCTOBERNOVEMBERDECEMBERJANUARYFEBRUARYMARCHAPRILMAYJUNEJULYAUGUSTSEPTEMBER
ANNUAL
774210715333787
1,1601,4502,070602187388262
486
3135353233497731103.92720
54
1258512911416335261147917076122104
211
17154
16188152289408445176487566
124
1.40.641.20.770.930.820.670.931.00.630.610.64
0.59
4.93.45.14.56.413.924.218.96.73.04.84.1
100
PERIOD(CONSECU TIVEDAYS)
137
14306090120183
DISCHARGE, IN FTVS, FOR INDICATED RECURRENCE INTERVAL, IN YEARS, AND
NON-EXCEEDANCE PROBABILITY
250%
192026293239435065
520%
8.69.710131724323847
1010%
5.05.96.57.1
1118283441
205%
2.43.13.64.17.3
14263138
, IN PERCENT
502%
0.000.001.02.14.5
11232935
100f1%
0.000.000.521.23.28.9222834
MAGNITUDE AND PROBABILITY OF INSTANTANEOUS PEAK FLOW BASED ON PERIOD OF RECORD 1958-86
DISCHARGE, IN FTVS, FOR INDICATED RECURRENCE INTERVAL IN YEARS, AND EXCEEDANCE PROBABILITY, IN PERCENT
250%
520%
10 10%
25 4%
502%
100t 1%
3,420 6,110 8,350 11,700 14,600 17,900
WEIGHTED SKEW (LOGS)* 0.13MEAN (LOGS)* 3.54STANDARD DEV. (LOGS)* 0.29
MAGNITUDE AND PROBABILITY OF ANNUAL HIGH FLOW, BASED ON WATER YEARS 1958-86
PERIOD(CONSECU TIVEDAYS)
137
15306090
DISCHARGE, IN FTVS, FOR INDICATED RECURRENCE INTERVAL, IN YEARS, ANDEXCEEDANCE PROBABILITY,
250%
1,4301,170
959789649514426
520%
2,9102,2701,7301,3801,150
923772
1010%
4,3003,2302,3201,8301,5301,2301,030
254%
6,6404,7303,1602,4302,0501,6501,370
IN PERCENT
502%
8,8706,0703,8302,9102,4701,9901,630
100t1%
11,6007,6004,5403,4002,9102,3301,900
DURATION TABLE OF DAILY MEAN FLOW, WATER YEARS 1958-86
DISCHARGE, IN FTVS, WHICH WAS EQUALED OR EXCEEDED FOR INDICATED PERCENT OF TIME
1% 5% 10% 15% 20% 30% 40% 50% 60% 70% 80% 90% 95% 98% 99% 99.5% 99.9%
1,600 821 547 396 291 178 124 91 69 54 45 34 26 15 9.9 7.2 1.5
f Reliability of values in column is uncertain, and potential errors are large.

50
09494300 CARRIZO CREEK ABOVE CORDUROY CREEK, NEAR SHOW LOW, AZ
MEAN MONTHLY AND ANNUAL DISCHARGES, 1954-66
MONTHMAXIMUM MINIMUM (FT3/S) (FT3/S)
STAN DARD COEFFI- PERCENT
DEVIA- CIENT OF OF MEAN TION VARI- ANNUAL
(FT3/S) (FT3/S) ATION RUNOFF
OCTOBERNOVEMBERDECEMBERJANUARYFEBRUARYMARCHAPRILMAYJUNEJULYAUGUSTSEPTEMBER
ANNUAL
6.854
3011354694448.83.59.7
3110
40
0.120.872.03.53.53.83.21.30.010.000.000.00
3.1
2.87.8
35251529124.11.22.06.43.1
12
2.21485391430122.71.32.98.33.4
13
0.771.82.41.60.941.01.00.651.11.41.31.1
1.1
2.05.524.617.510.320.18.22.90.81.44.52.2
100
MAGNITUDE AND PROBABILITY OF ANNUAL LOW FLOW, BASED ON CLIMATIC YEARS 1955-67
PERIOD(CONSECU TIVEDAYS)
13714306090120183
DISCHARGE, IN FWS, FOR INDICATED RECURRENCE INTERVAL, IN YEARS, AND
NON-EXCEEDANCE PROBABILITY
250%
0.010.380.821.63.1
520%
0.000.000.340.721.8
1010%
0.000.000.160.401.1
205%
0.000.000.000.230.71
, IN PERCENT
50f2%
0.000.000.000.110.37
100f1%
0.000.000.000.060.22
MAGNITUDE AND PROBABILITY OF INSTANTANEOUS PEAK FLOW BASED ON PERIOD OF RECORD 1954-67
DISCHARGE, IN FT*/S, FOR INDICATED RECURRENCE INTERVAL IN YEARS, AND EXCEEDANCE PROBABILITY, IN PERCENT
2 50%
520%
10 10%
25 4%
50f 2%
100f 1%
1,870 3,580 5,020 7,220 9,140 11,300
WEIGHTED SKEW (LOGS)= 0.01MEAN (LOGS)= 3.27STANDARD DEV. (LOGS)= 0.33
MAGNITUDE AND PROBABILITY OF ANNUAL HIGH FLOW, BASED ON WATER YEARS 1954-66
PERIOD(CONSECU TIVEDAYS)
137
15306090
DISCHARGE, IN FT3/S, FOR INDICATED RECURRENCE INTERVAL, IN YEARS, ANDEXCEEDANCE PROBABILITY,
250%
2691448351332116
520%
918511267153976146
1010%
1,8001,02050327917910985
254%
3,7602,1601,010538359213169
IN PERCENT
50f2%
6,1403,5401,590834574334271
100f1%
9,6205,5702,4301,250889507421
DURATION TABLE OF DAILY MEAN FLOW, WATER YEARS 1954-66
DISCHARGE, IN FT3/S, WHICH WAS EQUALED OR EXCEEDED FOR INDICATED PERCENT OF TIME
5% 10% 15% 20% 30% 40% 50% 60% 70% 80% 90% 95% 98% 99% 99.5% 99.9%1%
144 37 17 9.7 7.0 5.4 4.4 3.7 2.8 1.7 0.63 0.07 0.04 0.01 0.01 0.00 0.00
f Reliability of values in column is uncertain, and potential errors are large.
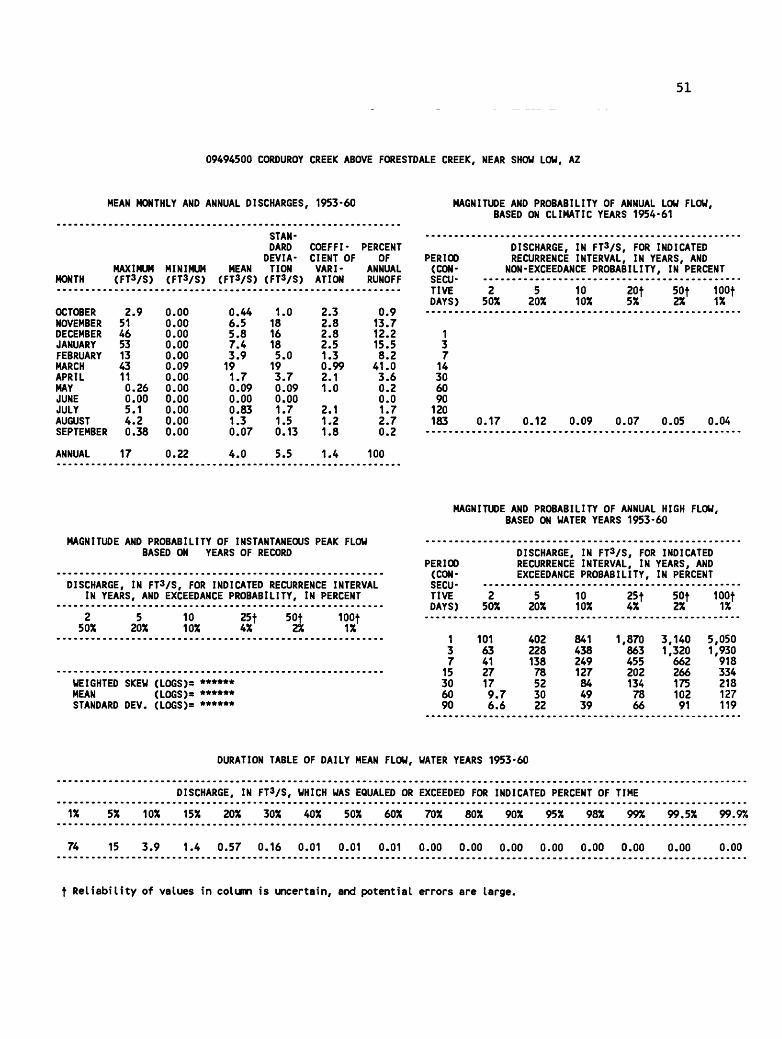
51
09494500 CORDUROY CREEK ABOVE FORESTDALE CREEK, NEAR SHOW LOW, AZ
MEAN MONTHLY AND ANNUAL DISCHARGES, 1953-60
STAN DARD COEFFI- PERCENT
DEVIA- CIENT OF OFMAXIMUM MINIMUM MEAN TION VARI- ANNUAL
MONTH (FT3/S) (FT3/S) (FT3/S) (FTVS) ATION RUNOFF
OCTOBERNOVEMBERDECEMBERJANUARYFEBRUARYMARCHAPRILMAYJUNEJULYAUGUSTSEPTEMBER
ANNUAL
2.95146531343110.260.005.14.20.38
17
0.000.000.000.000.000.090.000.000.000.000.000.00
0.22
0.446.55.87.43.9191.70.090.000.831.30.07
4.0
1.01816185.0193.70.090.001.71.50.13
5.5
2.32.82.82.51.30.992.11.0
2.11.21.8
1.4
0.913.712.215.58.2
41.03.60.20.01.72.70.2
100
MAGNITUDE AND PROBABILITY OF ANNUAL LOW FLOW, BASED ON CLIMATIC YEARS 1954-61
PERIOD (CON SECU TIVE DAYS)
137
14306090120183
DISCHARGE, IN FT3/S, FOR INDICATED RECURRENCE INTERVAL, IN YEARS, AND
NON-EXCEEDANCE PROBABILITY, IN PERCENT
250%
520%
10 10%
20f 5%
50f 2%
100f 1%
0.17 0.12 0.09 0.07 0.05 0.04
MAGNITUDE AND PROBABILITY OF INSTANTANEOUS PEAK FLOW BASED ON YEARS OF RECORD
DISCHARGE, IN FT3/S, FOR INDICATED RECURRENCE INTERVAL IN YEARS, AND EXCEEDANCE PROBABILITY, IN PERCENT
250%
520%
10 10%
25f 4%
50f 2%
100f 1%
WEIGHTED SKEW <LOGS)= ****** MEAN <LOGS)= ****** STANDARD DEV. <LOGS)= ******
MAGNITUDE AND PROBABILITY OF ANNUAL HIGH FLOW, BASED ON WATER YEARS 1953-60
PERIOD(CON-wCUU
TIVEDAYS)
137
15306090
250%
101634127179.76.6
DISCHARGE,RECURRENCEEXCEEDANCE
520%
40222813878523022
IN FT3/S, FOR INDICATEDINTERVAL , INPROBABILITY,
1010%
841 1,438249127844939
25f4%
8708634552021347866
YEARS, ANDIN PERCENT
50f2%
3,140 51,320 166226617510291
100f1%
,050,930918334218127119
DURATION TABLE OF DAILY MEAN FLOW, WATER YEARS 1953-60
DISCHARGE, IN FT3/S, WHICH WAS EQUALED OR EXCEEDED FOR INDICATED PERCENT OF TIME
5% 10% 15% 20% 30% 40% 50% 60% 70% 80% 90% 95% 98% 99% 99.5% 99.9%1%
74 15 3.9 1.4 0.57 0.16 0.01 0.01 0.01 0.00 0.00 0.00 0.00 0.00 0.00 0.00 0.00
f Reliability of values in column is uncertain, and potential errors are large.

52
09496000 CORDUROY CREEK NEAR MOUTH, NEAR SHOW LOW, AZ
MEAN MONTHLY AND ANNUAL DISCHARGES, 1952-75
MONTHMAXIMUM MINIMUM (FT3/S) (FT3/S)
STAN DARD COEFFI- PERCENT
DEVIA- CIENT OF OF MEAN TION VARI- ANNUAL
(FT3/S) (FT3/S) AT I ON RUNOFF
OCTOBERNOVEMBERDECEMBERJANUARYFEBRUARYMARCHAPRILMAYJUNEJULYAUGUSTSEPTEMBER
ANNUAL
16194
3474342604291917228312418
115
1.61.81.21.82.02.01.81.31.31.41.61.5
2.3
13113545406527127.87.87.53.6
23
36248094729143169.28.86.43.5
27
2.82.22.32.11.81.41.61.41.21.10.850.98
1.2
4.64.012.716.314.723.99.84.32.82.82.71.3
100
MAGNITUDE AND PROBABILITY OF ANNUAL LOW FLOW, BASED ON CLIMATIC YEARS 1953-75
PERIOD(CON- cpni-OC1«U
TIVEDAYS)
13714306090120183
DISCHARGE, IN FT3/S, FOR INDICATED RECURRENCE INTERVAL, IN YEARS, AND
NON- EXCEEDANCE PROBABILITY
2 550X 20X
1.3 1.01.31.31.41.61.71.9
.0
.1
.2
.3
.5
.72.1 1.82.4 2.0
1010X
0.900.910.951.01.21.41.61.71.9
205X
0.800.810.850.941.11.31.51.71.8
, IN PERCENT
50f2X
0.700.690.740.840.981.21.51.61.8
100f1%
0.630.620.670.770.901.11.41.51.8
MAGNITUDE AND PROBABILITY OF INSTANTANEOUS PEAK FLOW BASED ON PERIOD OF RECORD 1952-75
DISCHARGE, IN FTVS, FOR INDICATED RECURRENCE INTERVAL IN YEARS, AND EXCEEDANCE PROBABILITY, IN PERCENT
2 50X
5 20X
10 10X
254%
50f 2%
100f 1X
1,070 3,650 6,980 14,000 22,000 33,200
WEIGHTED SKEW (LOGS)= 0.05MEAN (LOGS)= 3.03STANDARD DEV. (LOGS)= 0.63
MAGNITUDE AND PROBABILITY OF ANNUAL HIGH FLOW, BASED ON WATER YEARS 1952-75
PERIOD(CONSECU TIVEDAYS)
137
15306090
DISCHARGE, IN FT3/S, FOR INDICATED RECURRENCE INTERVAL, IN YEARS, ANDEXCEEDANCE PROBABILITY,
250X
28717911071493427
520X
1,29074544127018612398
1010X
2,8301,540893532368240191
254X
6,5103,2801,8601,080756482388
IN PERCENT
50f2X
11,2005,3102,9501,7001,200754612
100f1%
18,1008,1304,4602,5401,8001,120919
DURATION TABLE OF DAILY MEAN FLOW, WATER YEARS 1952-75
DISCHARGE, IN FT3/S, WHICH WAS EQUALED OR EXCEEDED FOR INDICATED PERCENT OF TIME
5X 10X 15X 20X 30X 40X 50X 60X 70X 80X 90X 95X 98X 99X 99.5X 99.9%1X
364 80 35 26 20 7.6 3.2 2.6 2.3 2.1 1.8 1.6 1.4 1.2 1.1 0.98 0.78
f Reliability of values in column is uncertain, and potential errors are large.
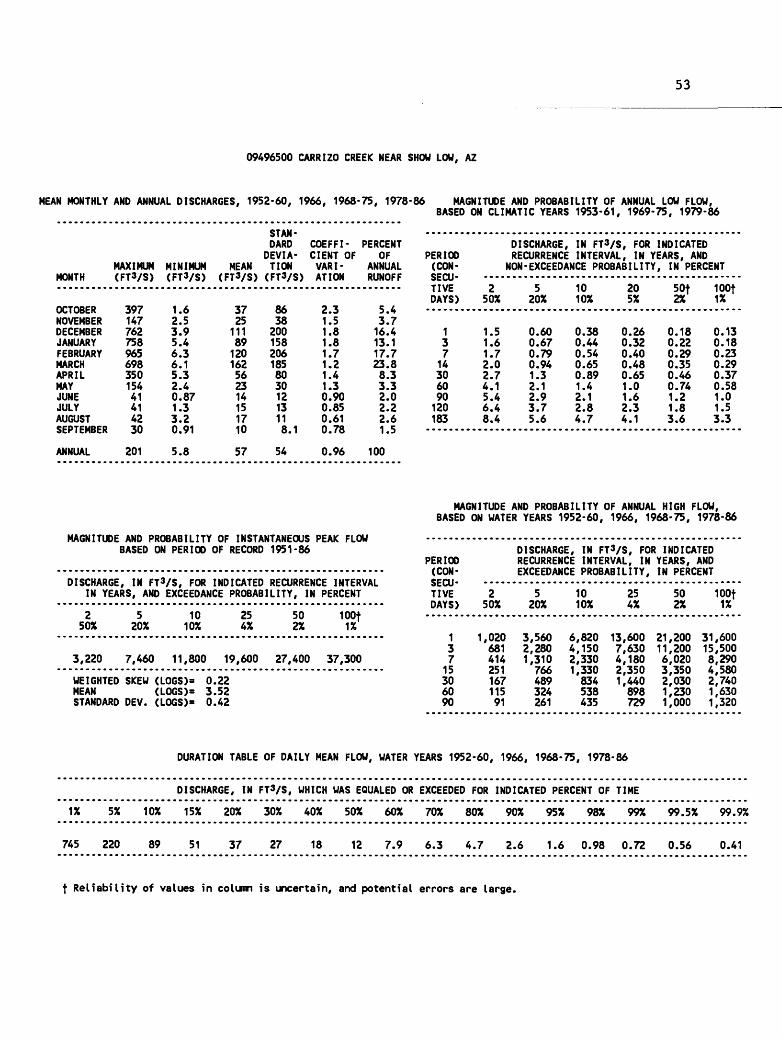
53
09496500 CARRIZO CREEK NEAR SHOW LOW, AZ
MEAN MONTHLY AND ANNUAL DISCHARGES, 1952-60, 1966, 1968-75, 1978-86
MONTHMAXIMUM MINIMUM (FTVS) (FTVS)
STAN DARD COEFFI- PERCENT
DEVIA- CIENT OF OF MEAN TION VARI- ANNUAL
(FTVS) ATION RUNOFF
OCTOBERNOVEMBERDECEMBERJANUARYFEBRUARYMARCHAPRILMAYJUNEJULYAUGUSTSEPTEMBER
ANNUAL
39714776275896569835015441414230
201
1.62.53.95.46.36.15.32.40.871.33.20.91
5.8
3725
11189120162562314151710
57
86 ;38200158206185803012 I13 I11 (8.1 (
54 I
2.3.5.8.8.7.2.4.3).90).85).61).78
).96
5.43.716.413.117.723.88.33.32.02.22.61.5
100
MAGNITUDE AND PROBABILITY OF ANNUAL LOW FLOW, BASED ON CLIMATIC YEARS 1953-61, 1969-75, 1979-86
PERIOD(CONSECU TIVEDAYS)
13714306090120183
DISCHARGE, IN FWS, FOR INDICATED RECURRENCE INTERVAL, IN YEARS, AND
NON- EXCEEDANCE PROBABILITY
250%
1.51.61.72.02.74.15.46.48.4
520%
0.600.670.790.941.32.12.93.75.6
1010%
0.380.440.540.650.891.42.12.84.7
205%
0.260.320.400.480.651.01.62.34.1
, IN PERCENT
50f2%
0.180.220.290.350.460.741.21.83.6
100f1%
0.130.180.230.290.370.581.01.53.3
MAGNITUDE AND PROBABILITY OF INSTANTANEOUS PEAK FLOW BASED ON PERIOD OF RECORD 1951-86
DISCHARGE, IN FTVS, FOR INDICATED RECURRENCE INTERVAL IN YEARS, AND EXCEEDANCE PROBABILITY, IN PERCENT
250%
5 20%
10 10%
25 4%
50 2%
100t 1%
3,220 7,460 11,800 19,600 27,400 37,300
WEIGHTED SKEW (LOGS)= 0.22MEAN (LOGS)= 3.52STANDARD DEV. (LOGS)= 0.42
MAGNITUDE AND PROBABILITY OF ANNUAL HIGH FLOW, BASED ON WATER YEARS 1952-60, 1966, 1968-75, 1978-86
PERIOD(CONSECU TIVEDAYS)
137
15306090
DISCHARGE, IN FT3/S, FOR INDICATED RECURRENCE INTERVAL, IN YEARS, ANDEXCEEDANCE PROBABILITY,
250%
1,02068141425116711591
520%
3,5602,2801,310766489324261
1010%
6,8204,1502,3301,330834538435
254%
13,6007,6304,1802,3501,440898729
IN PERCENT
502%
21,20011,2006,0203,3502,0301,2301,000
100f1%
31,60015,5008,2904,5802,7401,6301,320
DURATION TABLE OF DAILY MEAN FLOW, WATER YEARS 1952-60, 1966, 1968-75, 1978-86
DISCHARGE, IN FTVS, WHICH WAS EQUALED OR EXCEEDED FOR INDICATED PERCENT OF TIME
1% 5% 10% 15% 20% 30% 40% 50% 60% 70% 80% 90% 95% 98% 99% 99.5% 99.9%
745 220 89 51 37 27 18 12 7.9 6.3 4.7 2.6 1.6 0.98 0.72 0.56 0.41
f Reliability of values in column is uncertain, and potential errors are large.
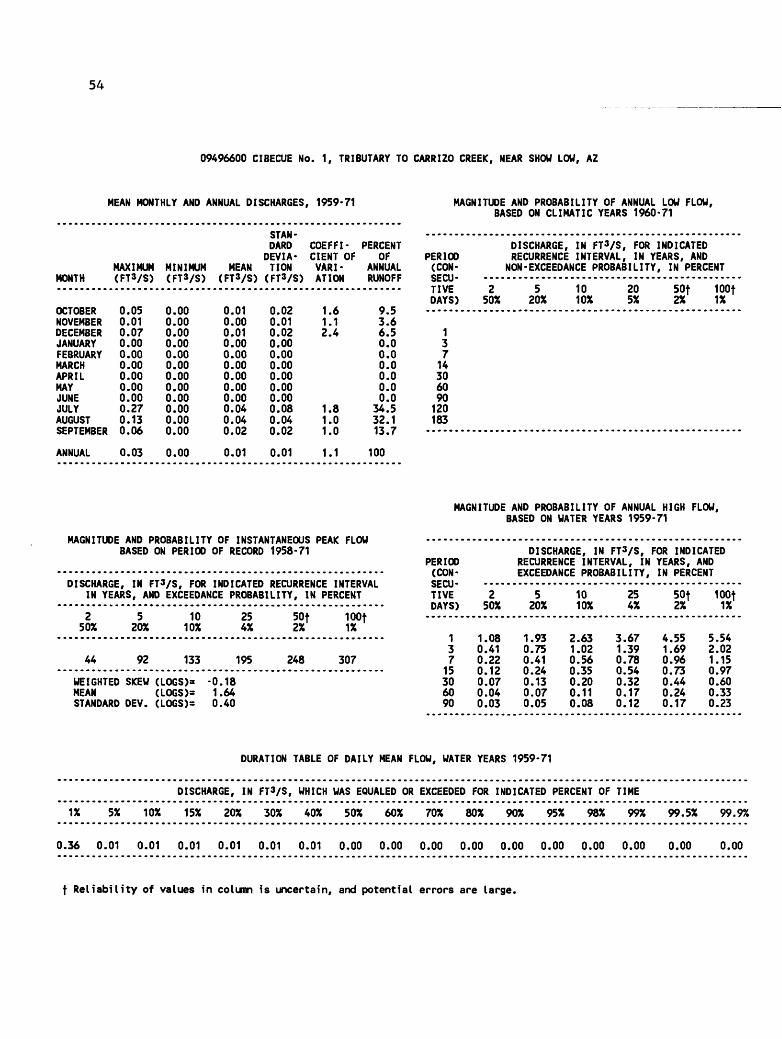
54
09496600 CIBECUE No. 1, TRIBUTARY TO CARRIZO CREEK, NEAR SHOW LOW, AZ
MEAN MONTHLY AND ANNUAL DISCHARGES, 1959-71
MONTH
OCTOBERNOVEMBERDECEMBERJANUARYFEBRUARYMARCHAPRILMAYJUNEJULYAUGUSTSEPTEMBER
ANNUAL
MAXIMUM(FT3/S)
0.050.010.070.000.000.000.000.000.000.270.130.06
0.03
MINIMUM(FT3/S)
0.000.000.000.000.000.000.000.000.000.000.000.00
0.00
MEAN(FT3/S)
0.010.000.010.000.000.000.000.000.000.040.040.02
0.01
STAN DARD
DEVIATION(FT3/S)
0.020.010.020.000.000.000.000.000.000.080.040.02
0.01
COEFFICIENT OFVARIATION
1.61.12.4
1.81.01.0
1.1
PERCENTOF
ANNUALRUNOFF
9.53.66.50.00.00.00.00.00.0
34.532.113.7
100
MAGNITUDE AND PROBABILITY OF ANNUAL LOW FLOW, BASED ON CLIMATIC YEARS 1960-71
PERIOD (CON SECU TIVE DAYS)
13714306090120183
DISCHARGE, IN FT3/S, FOR INDICATED RECURRENCE INTERVAL, IN YEARS, AND
NON-EXCEEDANCE PROBABILITY, IN PERCENT
250X
520X
10 10X
20 5X
50f 2X
100f 1X
MAGNITUDE AND PROBABILITY OF INSTANTANEOUS PEAK FLOW BASED ON PERIOD OF RECORD 1958-71
DISCHARGE, IN FT3/S, FOR INDICATED RECURRENCE INTERVAL IN YEARS, AND EXCEEDANCE PROBABILITY, IN PERCENT
250X
520%
10 10X
25 4X
50f 2X
100f 1X
44 92 133 195
WEIGHTED SKEW (LOGS)= -0.18MEAN (LOGS)- 1.64STANDARD DEV. (LOGS)= 0.40
248 307
MAGNITUDE AND PROBABILITY OF ANNUAL HIGH FLOW, BASED ON WATER YEARS 1959-71
PERIOD (CON SECU TIVE DAYS)
DISCHARGE, IN FT3/S, FOR INDICATED RECURRENCE INTERVAL, IN YEARS, AND EXCEEDANCE PROBABILITY, IN PERCENT
250X
520X
10 10X
254X
50f 2X
100f 1X
1.08 1.93 2.63 3.67 4.55 5.5437
15306090
0.410.220.120.070.040.03
0.750.410.240.130.070.05
1.020.560.350.200.110.08
1.390.780.540.320.170.12
1.690.960.730.440.240.17
2.021.150.970.600.330.23
DURATION TABLE OF DAILY MEAN FLOW, WATER YEARS 1959-71
DISCHARGE, IN FT3/S, WHICH WAS EQUALED OR EXCEEDED FOR INDICATED PERCENT OF TIME
1X 5X 10X 15X 20X 30X 40X 50X 60% 70X 80X 90X 95X 98X 99X 99.5% 99.9%
0.36 0.01 0.01 0.01 0.01 0.01 0.01 0.00 0.00 0.00 0.00 0.00 0.00 0.00 0.00 0.00 0.00
f Reliability of values in column is uncertain, and potential errors are large.
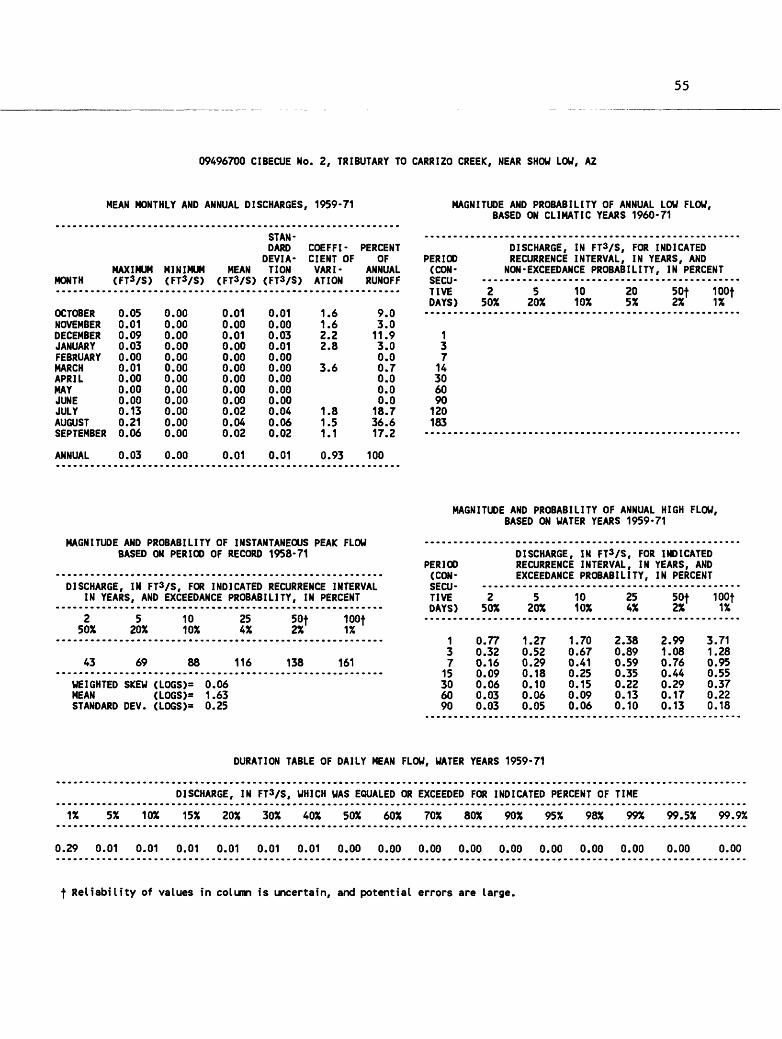
55
09496700 GIBECUE No. 2, TRIBUTARY TO CARRIZO CREEK, NEAR SHOW LOW, AZ
MEAN MONTHLY AND ANNUAL DISCHARGES, 1959-71
MONTHMAXIMUM (FT3/S)
MINIMUM (FT3/S)
STAN DARD
DEVIA- MEAN TION
(FT3/S) (FT3/S)
COEFFI- PERCENT CIENT OF OF VARI- ANNUAL ATION RUNOFF
OCTOBERNOVEMBERDECEMBERJANUARYFEBRUARYMARCHAPRILMAYJUNEJULYAUGUSTSEPTEMBER
0.050.010.090.030.000.010.000.000.000.130.210.06
0.000.000.000.000.000.000.000.000.000.000.000.00
0.010.000.010.00
00000000000204
0.02
0.010.000.030.010.000.000.000.000.000.040.060.02
ANNUAL 0.03 0.00 0.01 0.01
1.6 1.6 2.2 2.8
3.6
1.8 1.5 1.1
0.93
9.03.011.93.00.00.70.00.00.018.736.617.2
100
MAGNITUDE AND PROBABILITY OF ANNUAL LOW FLOW, BASED ON CLIMATIC YEARS 1960-71
PERIOD (CON SECU TIVE DAYS)
137
14306090120183
DISCHARGE, IN FT3/S, FOR INDICATED RECURRENCE INTERVAL, IN YEARS, AND NON-EXCEEDANCE PROBABILITY, IN PERCENT
250%
5 20%
10 10%
20 5%
50f 2%
100f 1%
MAGNITUDE AND PROBABILITY OF INSTANTANEOUS PEAK FLOW BASED ON PERIOD OF RECORD 1958-71
DISCHARGE, IN FT3/S, FOR INDICATED RECURRENCE INTERVAL IN YEARS, AND EXCEEDANCE PROBABILITY, IN PERCENT
250%
5 20%
10 10%
254%
50f 2%
loot1%
43 69 88 116
WEIGHTED SKEW (LOGS)= 0.06MEAN (LOGS)= 1.63STANDARD DEV. (LOGS)= 0.25
138 161
MAGNITUDE AND PROBABILITY OF ANNUAL HIGH FLOW, BASED ON WATER YEARS 1959-71
PERIOD (CON SECU TIVE DAYS)
DISCHARGE, IN FT3/S, FOR INDICATED RECURRENCE INTERVAL, IN YEARS, AND EXCEEDANCE PROBABILITY, IN PERCENT
250%
5 20%
10 10%
254%
50f 2%
100f 1%
1 0.77 1.27 1.70 2.38 2.99 3.7137
15306090
0.320.160.090.060.030.03
0.520.290.180.100.060.05
0.670.410.250.150.090.06
0.890.590.350.220.130.10
1.080.760.440.290.170.13
1.280.950.550.370.220.18
DURATION TABLE OF DAILY MEAN FLOW, WATER YEARS 1959-71
DISCHARGE, IN FT3/S, WHICH WAS EQUALED OR EXCEEDED FOR INDICATED PERCENT OF TIME
1% 5% 10% 15% 20% 30% 40% 50% 60% 70% 80% 90% 95% 98% 99% 99.5% 99.9%
0.29 0.01 0.01 0.01 0.01 0.01 0.01 0.00 0.00 0.00 0.00 0.00 0.00 0.00 0.00 0.00 0.00
f Reliability of values in column is uncertain, and potential errors are large.
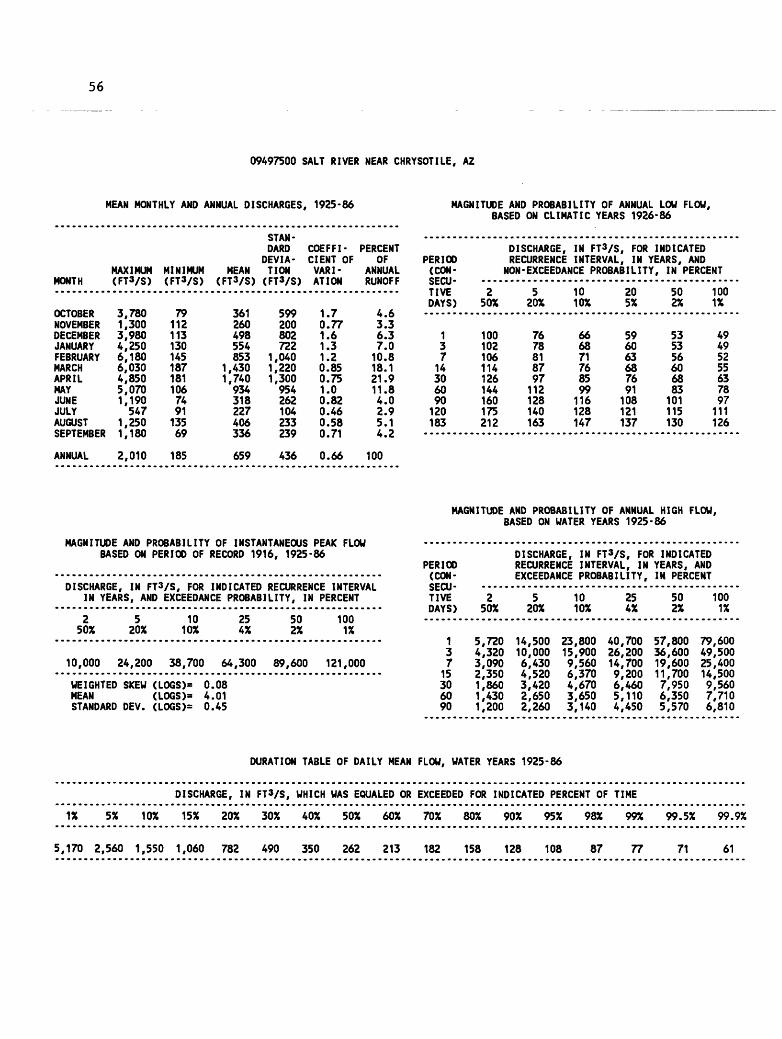
56
09497500 SALT RIVER NEAR CHRYSOTILE, AZ
MEAN MONTHLY AND ANNUAL DISCHARGES, 1925-86
MONTHMAXIMUM MINIMUM (FTVS) (FTVS)
STAN DARD COEFFI- PERCENT
DEVIA- CIENT OF OF MEAN TION VARI- ANNUAL
(FTVS) (FTVS) ATION RUNOFF
OCTOBERNOVEMBERDECEMBERJANUARYFEBRUARYMARCHAPRILMAYJUNEJULYAUGUSTSEPTEMBER
3,7801,3003,9804,2506,1806,0304,8505,0701,190547
1,2501,180
79112113130145187181106749113569
361260498554853
1,4301,740934318227406336
599200802722
1,0401,2201,300954262104233239
1.70.771.61.31.20.850.751.00.820.460.580.71
4.63.36.37.010.818.121.911.84.02.95.14.2
ANNUAL 2,010 185 659 436 0.66 100
MAGNITUDE AND PROBABILITY OF ANNUAL LOW FLOW, BASED ON CLIMATIC YEARS 1926-86
PERIOD(CONSECU TIVEDAYS)
137
14306090120183
DISCHARGE, IN FTVS, FOR INDICATED RECURRENCE INTERVAL, IN YEARS, AND
NON-EXCEEDANCE PROBABILITY, IN PERCENT
250X
100102106114126144160175212
520%
7678818797112128140163
1010%
666871768599116128147
205%
596063687691108121137
502%
535356606883101115130
1001%
49495255637897111126
MAGNITUDE AND PROBABILITY OF INSTANTANEOUS PEAK FLOW BASED ON PERIOD OF RECORD 1916, 1925-86
DISCHARGE, IN FT3/S, FOR INDICATED RECURRENCE INTERVAL IN YEARS, AND EXCEEDANCE PROBABILITY, IN PERCENT
2 50%
520%
10 10X
25 4%
50 2%
100 1%
10,000 24,200 38,700 64,300 89,600 121,000
WEIGHTED SKEW (LOGS)* 0.08MEAN (LOGS)s 4.01STANDARD DEV. (LOGS)= 0.45
MAGNITUDE AND PROBABILITY OF ANNUAL HIGH FLOW, BASED ON WATER YEARS 1925-86
PERIOD(CONSECU TIVEDAYS)
137
15306090
DISCHARGE, IN FT3/S, FOR INDICATED RECURRENCE INTERVAL, IN YEARS, ANDEXCEEDANCE PROBABILITY,
250%
5,7204,3203,0902,3501,8601,4301,200
520%
14,50010,0006,4304,5203,4202,6502,260
1010%
23,80015,9009,5606,3704,6703,6503,140
254%
40,70026,20014,7009,2006,4605,1104,450
IN PERCENT
502%
57,80036,60019,60011,7007,9506,3505,570
1001%
79,60049,50025,40014,5009,5607,7106,810
DURATION TABLE OF DAILY MEAN FLOW, WATER YEARS 1925-86
DISCHARGE, IN FT3/S, WHICH WAS EQUALED OR EXCEEDED FOR INDICATED PERCENT OF TIME
1% 5% 10% 15% 20% 30% 40% 50% 60% 70% 80% 90% 95% 98% 99% 99.5% 99.9%
5,170 2,560 1,550 1,060 782 490 350 262 213 182 158 128 108 87 77 71 61
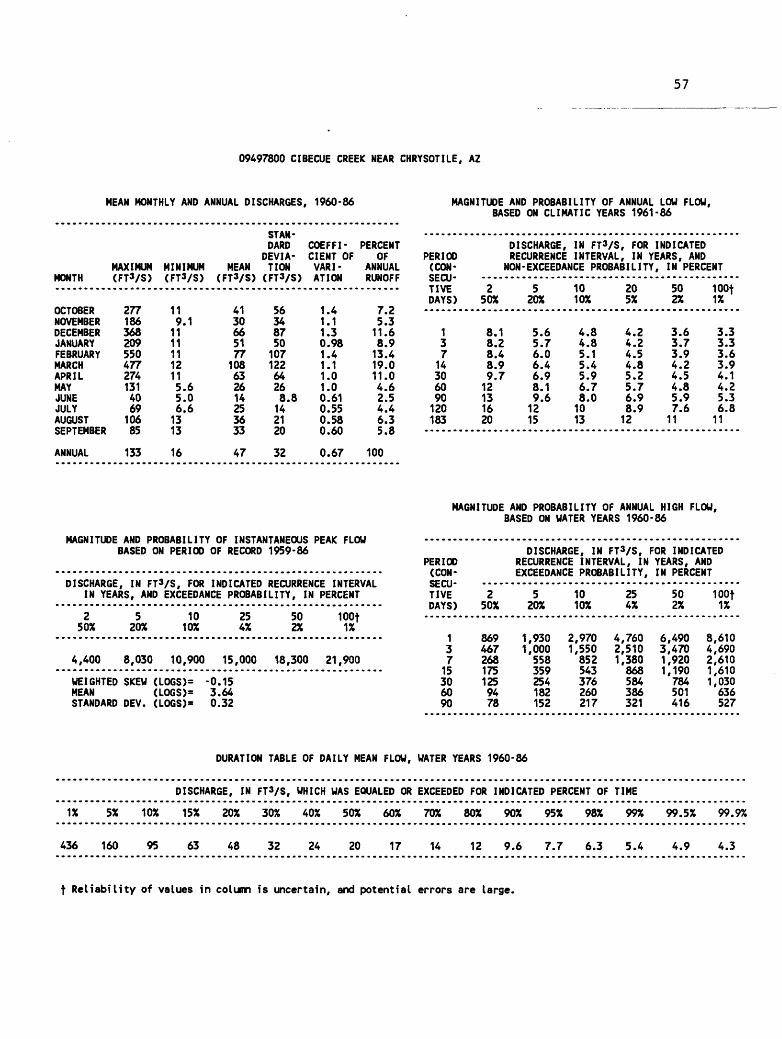
57
09497800 CIBECUE CREEK NEAR CHRYSOTILE, AZ
MEAN MONTHLY AND ANNUAL DISCHARGES, 1960-86
MONTHMAXIMUM MINIMUM (FT3/S) (FT3/S)
STAN DARD COEFFI- PERCENT
DEVIA- CIENT OF OF MEAN TION VARI- ANNUAL
(FT3/S) (FT3/S) ATION RUNOFF
OCTOBERNOVEMBERDECEMBERJANUARYFEBRUARYMARCHAPRILMAYJUNEJULYAUGUSTSEPTEMBER
277166368209550477274131406910685
119.1
11111112115.65.06.61313
4130665177108632614253633
5634875010712264268.8 (14 (21 (20 (
.4
.1
.33.98.4.1.0.03.61).553.583.60
7.25.311.68.913.419.011.04.62.54.46.35.8
ANNUAL 133 16 47 32 0.67 100
MAGNITUDE AND PROBABILITY OF ANNUAL LOU FLOW, BASED ON CLIMATIC YEARS 1961-86
PERIOD(CONSECU TIVEDAYS)
13714306090120183
DISCHARGE, IN FTVS, FOR INDICATED RECURRENCE INTERVAL, IN YEARS, AND
NON-EXCEEDANCE PROBABILITY
250%
8.18.28.48.99.712131620
520%
5.65.76.06.46.98.19.61215
1010%
4.84.85.15.45.96.78.01013
205%
4.24.24.54.85.25.76.98.912
, IN PERCENT
502%
3.63.73.94.24.54.85.97.6
11
100f1%
3.33.33.63.94.14.25.36.8
11
MAGNITUDE AND PROBABILITY OF INSTANTANEOUS PEAK FLOW BASED ON PERIOD OF RECORD 1959-86
DISCHARGE, IN FT3/S, FOR INDICATED RECURRENCE INTERVAL IN YEARS, AND EXCEEDANCE PROBABILITY, IN PERCENT
250%
5 20%
10 10%
25 4%
50 2%
100f 1%
4,400 8,030 10,900 15,000 18,300 21,900
WEIGHTED SKEW (LOGS)= -0.15MEAN (LOGS)= 3.64STANDARD DEV. (LOGS)= 0.32
MAGNITUDE AND PROBABILITY OF ANNUAL HIGH FLOW, BASED ON WATER YEARS 1960-86
PERIOD(CONSECU TIVEDAYS)
13715306090
DISCHARGE, IN FT3/S, FOR INDICATED RECURRENCE INTERVAL, IN YEARS, ANDEXCEEDANCE PROBABILITY,
250%
8694672681751259478
520%
1,9301,000558359254182152
1010%
2,9701,550852543376260217
254%
4,7602,5101,380868584386321
IN PERCENT
502%
6,4903,4701,9201,190784501416
100f1%
8,6104,6902,6101,6101,030636527
DURATION TABLE OF DAILY MEAN FLOW, WATER YEARS 1960-86
DISCHARGE, IN FT3/S, WHICH WAS EQUALED OR EXCEEDED FOR INDICATED PERCENT OF TIME
1% 5% 10% 15% 20% 30% 40% 50% 60% 70% 80% 90% 95% 98% 99% 99.5% 99.9%
436 160 95 63 48 32 24 20 17 14 12 9.6 7.7 6.3 5.4 4.9 4.3
f Reliability of values in column is uncertain, and potential errors are large.

58
09497980 CHERRY CREEK NEAR GLOBE, AZ
MEAN MONTHLY AND ANNUAL DISCHARGES, 1966-78, 1980-86 MAGNITUDE AND PROBABILITY OF ANNUAL LOW FLOW, BASED ON CLIMATIC YEARS 1967-78, 1981-86
MAXIMUM MONTH (FT3/S)
OCTOBERNOVEMBERDECEMBERJANUARYFEBRUARYMARCHAPRILMAYJUNEJULYAUGUSTSEPTEMBER
ANNUAL
29610153717956842319566182335151
130
MINIMUM (FT3/S)
4.64.54.86.76.06.15.34.94.45.65.53.6
8.2
MEAN (FT3/S)
3219734510210131137.7
101418
39
STAN DARD COEFFI-
DEVIA- CIENT OF TION VARI- (FT3/S) AT ION
67 2.124
131481391314414
.3
.8
.1
.4
.3
.4
.03.4 0.444.5 0.447.4 0.51
32 1.8
32 0.84
PERCENT OF
ANNUAL RUNOFF
6.94.115.69.6
21.921.76.72.91.72.23.13.8
100
PERIOD(CONSECU TIVEDAYS)
13714306090120183
DISCHARGE, IN FTVS, FOR INDICATED RECURRENCE INTERVAL, IN YEARS, AND
NON- EXCEEDANCE PROBABILITY, IN PERCENT
250%
5.25.35.45.65.96.56.97.49.1
520%
4.14.34.44.64.95.25.66.27.3
1010%
3.73.94.04.14.54.75.05.76.6
205%
3.43.63.73.84.14.44.65.46.2
50f2%
3.23.43.43.63.84.04.35.15.8
100f1%
3.03.23.33.43.73.84.04.95.5
MAGNITUDE AND PROBABILITY OF INSTANTANEOUS PEAK FLOW BASED ON PERIOD OF RECORD 1966-86
DISCHARGE, IN FT3/S, FOR INDICATED RECURRENCE INTERVAL IN YEARS, AND EXCEEDANCE PROBABILITY, IN PERCENT
250X
5 20X
10 10%
25 4%
50f 2%
100f 1%
2,220 5,340 8,460 13,800 19,000 25,300
WEIGHTED SKEW (LOGS)= 0.02MEAN (LOGS)- 3.35STANDARD DEV. (LOGS)= 0.45
MAGNITUDE AND PROBABILITY OF ANNUAL HIGH FLOW, BASED ON WATER YEARS 1966-78, 1980-86
PERIOD (CON-
DISCHARGE, IN FT3/S, FOR INDICATED RECURRENCE INTERVAL, IN YEARS, AND EXCEEDANCE PROBABILITY, IN PERCENT
TIVE 2 DAYS) 50%
520%
10 10%
25 4%
50f 2%
100f 1%
137
15306090
8015213232061349372
2,3501,400815506326222168
3,9202,2101,260777505341256
6,5203,4401,9201,190788531395
8,8804,4702,4801,5501,040700518
11,6005,5803,0801,9301,320892658
DURATION TABLE OF DAILY MEAN FLOW, WATER YEARS 1966-78, 1980-86
DISCHARGE, IN FT3/S, WHICH WAS EQUALED OR EXCEEDED FOR INDICATED PERCENT OF TIME
1% 5% 10% 15% 20% 30% 40% 50% 60% 70% 80% 90% 95% 98% 99% 99.5% 99.9%
562 151 66 38 26 14 11 9.1 7.9 7.1 6.2 5.4 4.8 4.3 4.1 4.0 3.0
f Reliability of values in column is uncertain, and potential errors are large.
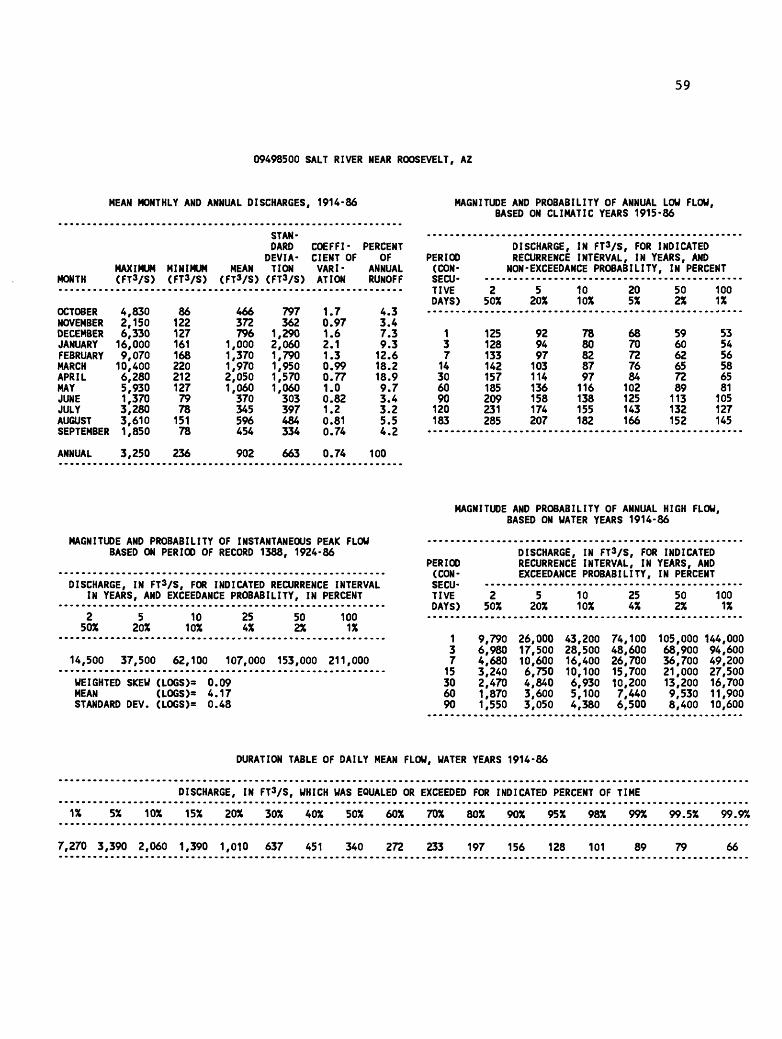
59
09498500 SALT RIVER NEAR ROOSEVELT, AZ
MEAN MONTHLY AND ANNUAL DISCHARGES, 1914-86
MONTHMAXIMUM MINIMUM (FT3/S) (FT3/S)
STAN DARD COEFFI- PERCENT
DEVIA- CIENT OF OF MEAN TION VARI- ANNUAL
(FTVS) (FTVS) ATION RUNOFF
OCTOBERNOVEMBERDECEMBERJANUARYFEBRUARYMARCHAPRILMAYJUNEJULYAUGUSTSEPTEMBER
ANNUAL
4,8302,1506,33016,0009,07010,4006,2805,9301,3703,2803,6101,850
3,250
861221271611682202121277978
15178
236
466372796
1,0001,3701,9702,0501,060370345596454
902
797362
1,2902,0601,7901,9501,5701,060303397484334
663
1.70.971.62.11.30.990.771.00.821.20.810.74
0.74
4.33.47.39.312.618.218.99.73.43.25.54.2
100
MAGNITUDE AND PROBABILITY OF ANNUAL LOW FLOW, BASED ON CLIMATIC YEARS 1915-86
PERIOD(CONSECU TIVEDAYS)
13714306090120183
DISCHARGE, IN FT^/S, FOR INDICATED RECURRENCE INTERVAL, IN YEARS, AND
NON-EXCEEDANCE PROBABILITY, IN PERCENT
250%
125128133142157185209231285
520%
929497103114136158174207
1010%
7880828797116138155182
205%
6870727684102125143166
502%
596062657289113132152
1001%
535456586581105127145
MAGNITUDE AND PROBABILITY OF INSTANTANEOUS PEAK FLOW BASED ON PERIOD OF RECORD 1388, 1924-86
DISCHARGE, IN FTVS, FOR INDICATED RECURRENCE INTERVAL IN YEARS, AND EXCEEDANCE PROBABILITY, IN PERCENT
250%
520%
10 10%
25 4%
50 2%
100 1%
14,500 37,500 62,100 107,000 153,000 211,000
WEIGHTED SKEW (LOGS)= 0.09MEAN (LOGS)- 4.17STANDARD DEV. (LOGS)= 0.48
MAGNITUDE AND PROBABILITY OF ANNUAL HIGH FLOW, BASED ON WATER YEARS 1914-86
PERIOD(CON-
TIVEDAYS)
137
15306090
DISCHARGE, IN FT3/S, FOR INDICATED RECURRENCE INTERVAL, IN YEARS, ANDEXCEEDANCE PROBABILITY,
250%
9,7906,9804,6803,2402,4701,8701,550
520%
26,00017,50010,6006,7504,8403,6003,050
1010%
43,20028,50016,40010,1006,9305,1004,380
254%
74,10048,60026,70015,70010,2007,4406,500
IN PERCENT
502%
105,00068,90036,70021,00013,2009,5308,400
1001%
144,00094,60049,20027,50016,70011,90010,600
DURATION TABLE OF DAILY MEAN FLOW, WATER YEARS 1914-86
DISCHARGE, IN FT^/S, WHICH WAS EQUALED OR EXCEEDED FOR INDICATED PERCENT OF TIME
1% 5% 10% 15% 20% 30% 40% 50% 60% 70% 80% 90% 95% 98% 99% 99.5% 99.9%
7,270 3,390 2,060 1,390 1,010 637 451 340 272 233 197 156 128 101 89 79 66