Flow boiling of ammonia in vertical small diameter tubes: Two phase
12
Flow boiling of ammonia in vertical small diameter tubes: Two phase frictional pressure drop results and assessment of prediction methods M.H. Maqbool, B. Palm * , R. Khodabandeh Royal Institute of Technology, KTH, Dept. Energy Technology, Division of Applied Thermodynamics and Refrigeration, Brinellvägen 68,100 44 Stockholm, Sweden article info Article history: Received 24 February 2011 Received in revised form 22 November 2011 Accepted 24 November 2011 Available online xxx Keywords: Two phase Pressure drop Ammonia Experimental study abstract Two phase pressure drops were measured for ammonia at a wide range of test conditions in two sizes of vertical mini channels. The test sections were made of stainless steel (AISI 316) tubes with internal diameter of 1.70 mm and 1.224 mm and a uniformly heated length of 245 mm. Experiments were conducted at three saturation temperatures of 23 C, 33 C and 43 C, the heat flux ranging from 15 to 355 kW/m 2 and the mass flux ranging from 100 to 500 kg/m 2 s. The effect of the heat flux, the mass flux, the vapour quality, the saturation temperature and the internal diameter on the two phase pressure drop are presented in this article. Some generalized two phase pressure drop correlations suggested for macro and micro scale channels are examined by comparing them with our experimental data. None of the examined correlations agreed well with the test data. A new correlation (modified form of Tran et al. correlation) is proposed which is able to predict the experimental data with MAD of 16% and 86% of the data is within 30% range. Ó 2011 Elsevier Masson SAS. All rights reserved. 1. Introduction The transport phenomena in micro channels have gained importance because micro geometries offer higher cooling capa- bility for micro technologies [1]. The advancement in micro fabri- cation is also important for the application of mini and micro channels. It enables us to precisely manufacture the flow channels ranging from a few micrometres to several hundred micrometres or more [2]. Mini channels offer higher heat transfer capabilities and higher heat transfer coefficients than macro channels [3]. Mini channels can be used for different applications such as electronic cooling, biomedical engineering, automotive industry and compact refrigeration systems etc. Despite many advantages of using mini channels like reduced size, low fluid inventory, reduced cost due to minimum material requirement and compactness, the disadvan- tage may be higher pressure drop if the system is not designed properly. To get higher heat transfer without increasing pressure drop is a major research task for micro geometries. Only few published studies are available for mini and micro channels regarding two phase pressure drop of ammonia, and some of the related studies are mentioned below: Ungar and Cornwell [4] performed flow boiling experiments to investigate two phase pressure drop of ammonia in mini and micro channels. A range of horizontal test sections of diameter 1.46,1.78, 2.58 and 3.15 mm respectively were used. The two phase frictional pressure drop data was compared with several macro scale corre- lations. Apart from the homogeneous model with the viscosity definition of McAdams et al. [5], none of the macro scale correla- tions predicted the data well. Two phase adiabatic pressure drop in a micro channel of 148 mm diameter was investigated by Brandon and Hrnjak [6]. A number of refrigerants like ammonia, propane, R410a and R134a were tested in this study. The measured data was compared with several correlations but only Mishima and Hibiki [7] correlation was in good agreement with the experimental data of Ammonia. The authors proposed a new correlation based on Chisholm interaction parameter. The new correlation predicted the data of all refriger- ants with a Mean Absolute Deviation (MAD) of 12.6%. Kabelac and Buhr [8] performed flow boiling experiments with ammonia in smooth and low finned horizontal test sections of 10 mm internal diameter and a length of 450 mm. The test condi- tions were; mass flux range 50e150 kg/m 2 s, vapour quality range 0e0.9, saturation temperatures 40 to 4 C and a heat flux range of 17e75 kW/m 2 . It was observed that at the same test conditions, the pressure drop of the finned test section was about 50% higher than for the smooth tubes. They compared their experimental data of smooth and finned tubes with many correlations. Among all the * Corresponding author. Tel.: þ46 0 8 790 7453; fax: þ46 0 8 20 4161. E-mail addresses: [email protected] (M.H. Maqbool), [email protected] (B. Palm), [email protected] (R. Khodabandeh). Contents lists available at SciVerse ScienceDirect International Journal of Thermal Sciences journal homepage: www.elsevier.com/locate/ijts 1290-0729/$ e see front matter Ó 2011 Elsevier Masson SAS. All rights reserved. doi:10.1016/j.ijthermalsci.2011.11.018 International Journal of Thermal Sciences xxx (2012) 1e12 Please cite this article in press as: M.H. Maqbool, et al., Flow boiling of ammonia in vertical small diameter tubes: Two phase frictional pressure dropresults and assessmentof prediction methods, International Journal of Thermal Sciences (2012), doi:10.1016/j.ijthermalsci.2011.11.018
Transcript of Flow boiling of ammonia in vertical small diameter tubes: Two phase

at SciVerse ScienceDirect
International Journal of Thermal Sciences xxx (2012) 1e12
Contents lists available
International Journal of Thermal Sciences
journal homepage: www.elsevier .com/locate/ i j ts
Flow boiling of ammonia in vertical small diameter tubes: Two phase frictionalpressure drop results and assessment of prediction methods
M.H. Maqbool, B. Palm*, R. KhodabandehRoyal Institute of Technology, KTH, Dept. Energy Technology, Division of Applied Thermodynamics and Refrigeration, Brinellvägen 68, 100 44 Stockholm, Sweden
a r t i c l e i n f o
Article history:Received 24 February 2011Received in revised form22 November 2011Accepted 24 November 2011Available online xxx
Keywords:Two phasePressure dropAmmoniaExperimental study
* Corresponding author. Tel.: þ46 0 8 790 7453; faE-mail addresses: [email protected] (M.H. Maq
(B. Palm), [email protected] (R. Khodabandeh).
1290-0729/$ e see front matter � 2011 Elsevier Masdoi:10.1016/j.ijthermalsci.2011.11.018
Please cite this article in press as: M.H. Maqbdrop results and assessment of prediction m
a b s t r a c t
Two phase pressure drops were measured for ammonia at a wide range of test conditions in two sizes ofvertical mini channels. The test sections were made of stainless steel (AISI 316) tubes with internaldiameter of 1.70 mm and 1.224 mm and a uniformly heated length of 245 mm. Experiments wereconducted at three saturation temperatures of 23 �C, 33 �C and 43 �C, the heat flux ranging from 15 to355 kW/m2 and the mass flux ranging from 100 to 500 kg/m2s. The effect of the heat flux, the mass flux,the vapour quality, the saturation temperature and the internal diameter on the two phase pressure dropare presented in this article. Some generalized two phase pressure drop correlations suggested for macroand micro scale channels are examined by comparing them with our experimental data. None of theexamined correlations agreed well with the test data. A new correlation (modified form of Tran et al.correlation) is proposed which is able to predict the experimental data with MAD of 16% and 86% of thedata is within �30% range.
� 2011 Elsevier Masson SAS. All rights reserved.
1. Introduction
The transport phenomena in micro channels have gainedimportance because micro geometries offer higher cooling capa-bility for micro technologies [1]. The advancement in micro fabri-cation is also important for the application of mini and microchannels. It enables us to precisely manufacture the flow channelsranging from a fewmicrometres to several hundredmicrometres ormore [2]. Mini channels offer higher heat transfer capabilities andhigher heat transfer coefficients than macro channels [3]. Minichannels can be used for different applications such as electroniccooling, biomedical engineering, automotive industry and compactrefrigeration systems etc. Despite many advantages of using minichannels like reduced size, low fluid inventory, reduced cost due tominimum material requirement and compactness, the disadvan-tage may be higher pressure drop if the system is not designedproperly. To get higher heat transfer without increasing pressuredrop is a major research task for micro geometries.
Only few published studies are available for mini and microchannels regarding two phase pressure drop of ammonia, and someof the related studies are mentioned below:
x: þ46 0 8 20 41 61.bool), [email protected]
son SAS. All rights reserved.
ool, et al., Flow boiling of amethods, International Journa
Ungar and Cornwell [4] performed flow boiling experiments toinvestigate two phase pressure drop of ammonia in mini and microchannels. A range of horizontal test sections of diameter 1.46, 1.78,2.58 and 3.15 mm respectively were used. The two phase frictionalpressure drop data was compared with several macro scale corre-lations. Apart from the homogeneous model with the viscositydefinition of McAdams et al. [5], none of the macro scale correla-tions predicted the data well.
Two phase adiabatic pressure drop in a micro channel of 148 mmdiameter was investigated by Brandon and Hrnjak [6]. A number ofrefrigerants like ammonia, propane, R410a and R134a were testedin this study. The measured data was compared with severalcorrelations but only Mishima and Hibiki [7] correlation was ingood agreement with the experimental data of Ammonia. Theauthors proposed a new correlation based on Chisholm interactionparameter. The new correlation predicted the data of all refriger-ants with a Mean Absolute Deviation (MAD) of 12.6%.
Kabelac and Buhr [8] performed flow boiling experiments withammonia in smooth and low finned horizontal test sections of10 mm internal diameter and a length of 450 mm. The test condi-tions were; mass flux range 50e150 kg/m2s, vapour quality range0e0.9, saturation temperatures�40 to 4 �C and a heat flux range of17e75 kW/m2. It was observed that at the same test conditions, thepressure drop of the finned test section was about 50% higher thanfor the smooth tubes. They compared their experimental data ofsmooth and finned tubes with many correlations. Among all the
monia in vertical small diameter tubes: Two phase frictional pressurel of Thermal Sciences (2012), doi:10.1016/j.ijthermalsci.2011.11.018
M.H. Maqbool et al. / International Journal of Thermal Sciences xxx (2012) 1e122
predictionmethods used, the Chisholm [9] correlationwas found tobe in best agreement with their experimental data.
Da Silva Lima et al. [10] performed experiments to investigateflow patterns and two phase pressure drop of ammonia in a 14 mmdiameter stainless steel tube. The expected trends were observed,i.e. that the two phase pressure drop increases with increasingmass flux and vapour quality. They also compared two phase fric-tional pressure drop in diabatic and adiabatic flows and found nonoticeable influence on frictional pressure drop. Low accuracy ofpredicting methods were observed except for the correlation ofGrönnerud [11] with 93% of the data within an error band of 30%,and the model of Quibén and Thome [12] which best predicted thedata with 89% of all data within 20% error band.
One of the objectives of this study is to add data of ammonia formini and micro channels because of the lack of published data inthe literature. This data is particularly interesting because of thevery different thermo physical properties of ammonia compared toother refrigerants commonly tested in mini channels. To includethe ammonia data will therefore be valuable in the effort toformulate generalised correlations for the prediction of two phasefrictional pressure drop inmini andmicro channels. Another reasonfor understanding the behaviour of two phase flow of the naturalworking fluid ammonia is due to increased concerns of ozonedepletion and global warming, as increased knowledge of theperformance of this refrigerant may contribute to its use asa substitute to HCFC and HFC refrigerants.
2. Experimental set up and test procedure
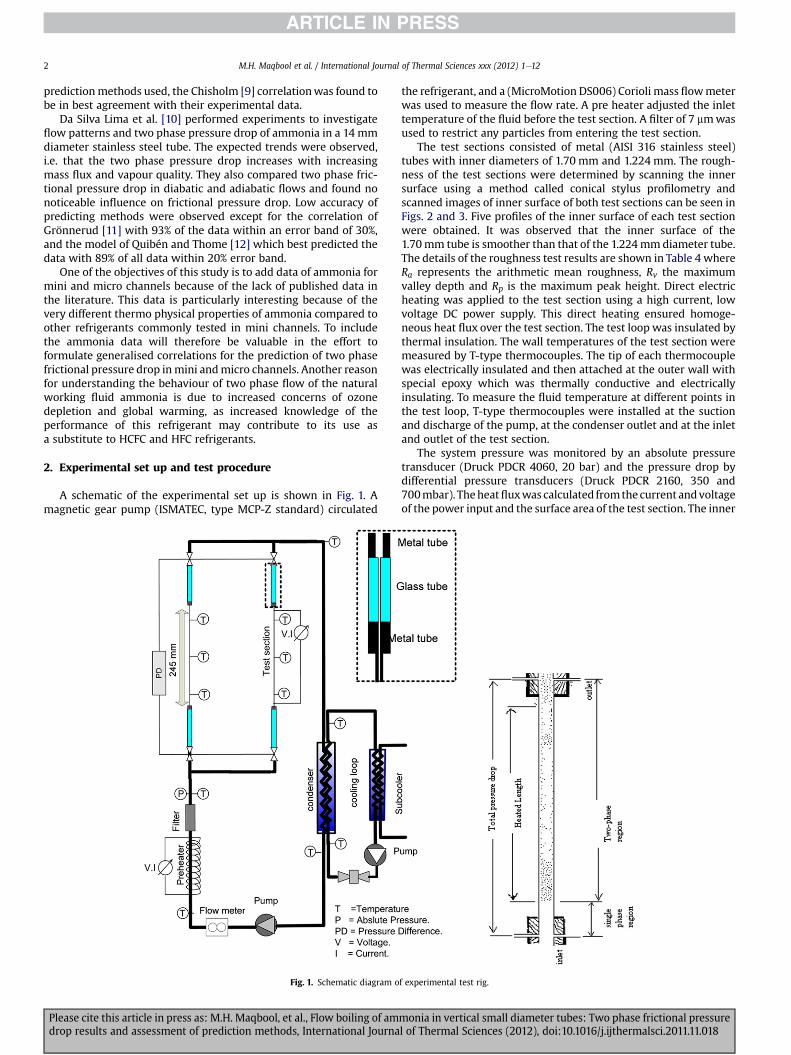
A schematic of the experimental set up is shown in Fig. 1. Amagnetic gear pump (ISMATEC, type MCP-Z standard) circulated
Fig. 1. Schematic diagram o
Please cite this article in press as: M.H. Maqbool, et al., Flow boiling of amdrop results and assessment of prediction methods, International Journa
the refrigerant, and a (MicroMotion DS006) Corioli mass flowmeterwas used to measure the flow rate. A pre heater adjusted the inlettemperature of the fluid before the test section. A filter of 7 mmwasused to restrict any particles from entering the test section.
The test sections consisted of metal (AISI 316 stainless steel)tubes with inner diameters of 1.70 mm and 1.224 mm. The rough-ness of the test sections were determined by scanning the innersurface using a method called conical stylus profilometry andscanned images of inner surface of both test sections can be seen inFigs. 2 and 3. Five profiles of the inner surface of each test sectionwere obtained. It was observed that the inner surface of the1.70mm tube is smoother than that of the 1.224mmdiameter tube.The details of the roughness test results are shown in Table 4 whereRa represents the arithmetic mean roughness, Rv the maximumvalley depth and Rp is the maximum peak height. Direct electricheating was applied to the test section using a high current, lowvoltage DC power supply. This direct heating ensured homoge-neous heat flux over the test section. The test loop was insulated bythermal insulation. The wall temperatures of the test section weremeasured by T-type thermocouples. The tip of each thermocouplewas electrically insulated and then attached at the outer wall withspecial epoxy which was thermally conductive and electricallyinsulating. To measure the fluid temperature at different points inthe test loop, T-type thermocouples were installed at the suctionand discharge of the pump, at the condenser outlet and at the inletand outlet of the test section.
The system pressure was monitored by an absolute pressuretransducer (Druck PDCR 4060, 20 bar) and the pressure drop bydifferential pressure transducers (Druck PDCR 2160, 350 and700mbar). Theheatfluxwas calculated fromthe current andvoltageof the power input and the surface area of the test section. The inner
f experimental test rig.
monia in vertical small diameter tubes: Two phase frictional pressurel of Thermal Sciences (2012), doi:10.1016/j.ijthermalsci.2011.11.018

Fig. 2. Characterisation of inner surface roughness of 1.224 mm tube.
M.H. Maqbool et al. / International Journal of Thermal Sciences xxx (2012) 1e12 3
wall temperatureswere calculatedbycorrecting themeasuredouterwall temperatures using the heat conduction equation. Afterabsorbing heat from the test section, the refrigerant entered thecondenser and was condensed to liquid, then it was cooled in thesub-cooler. Finally the refrigerant entered the pump and the loopwas completed. The uncertainty analysis of the operating parame-ters is tabulated in Table 1.
Heat losses to ambient were experimentally estimated by thefollowing method: Without any fluid flow, the wall temperatureswere set at the desired level by adjusting the electric heating. Thedata was recorded at different heat fluxes and the temperaturedifference between wall and ambient was plotted versus theapplied heat flux. On the basis of the equation of the plot, heat losscalculations were done. For low heat fluxes, the heat loss was 1e2%of the applied power and for high heat fluxes, it was less than 1%.
All tests were performed under steady state conditions. Afterachieving steady state conditions, the data was recorded for almost5 min. The temperatures, the mass flow and the system pressurewere recorded using a data logger connected to a computer. The datawas displayed using HP VEE software. All the thermal and transportproperties including enthalpy, density, viscosity and thermalconductivity of ammonia were calculated using REFPROP 7 devel-oped by NIST (National Institute of Standards and Technology).
3. Data reduction
The thermodynamic vapour quality at any vertical location (z)was calculated as;
xðzÞ ¼ q00$pD$ðz� z+ÞAc$G$ilv
(1)
where q00 is the heat flux which is the ratio of the power applied to
Fig. 3. Characterisation of inner surface roughness of 1.70 mm tube.
Please cite this article in press as: M.H. Maqbool, et al., Flow boiling of amdrop results and assessment of prediction methods, International Journa
the test section and the internal surface area based on the heatedlength, Ac the cross-sectional area and z� is the location on theheated section at which saturated conditions would be reached,calculated as;
z+ ¼ mNH3$Cp$ðTsat � TinÞq’’$pD
(2)
Cp is the specific heat of the fluid, _m the mass flow rate of ammonia,Tsat is the saturation temperature and Tin the inlet temperature ofthe test section.
The single phase friction factor for fully developed laminar flowwas calculated as follows;
If Re< 2000 then flam ¼ 64=Re (3)
For single phase turbulent flow the Blasius [13] correlation wasused:
If Re>2000 then fturb ¼ 0:316=Re0:25 (4)
The measured pressure drop is the sum of inlet contraction,outlet expansion, two phase flow and inlet single phase flowpressure drops.
ðDPÞmeasured ¼ ðDPÞic þ ðDPÞoe þ ðDPÞtp þ ðDPÞsp (5)
In the cases tested, the two phase pressure drop varied from 75to 92% of the total measured pressure drop. The proportion of singlephase pressure drop varied from 3 to 21 %. The proportion of inletcompression and outlet expansion both vary from 1 to 5%.
(DP)ic represents pressure drop due to the contraction at theinlet and can be calculated as [14];
ðDPÞic ¼ xicr�u22 � u21
�2
(6)
where xic ¼ f�lamturb
;A2
A1
�is the drag compression factor
(DP)oe represents pressured drop due to outlet expansion whichcan be calculated as [14];
ðDPÞoe ¼ G2sð1� sÞrL
"x2exitaexit
rLrg
!þ ð1� xexitÞ2
ð1� aexitÞ
#(7)
where s ¼ A1=A2
(DP)sp represents the single phase pressure drop at the inlet oftest section.
ðDPÞsp ¼���ðDPÞsp���fric þ
���ðDPÞsp���grav (8)
where jðDPÞspjgrav ¼ gLsprL
and jðDPÞspjfric ¼ frlu
2
2LspDi
where, if Re < 2000 then flam ¼ 64=Reand if Re > 2000 then fturb ¼ 0:316=Re0:25
Table 1Uncertainty of operating parameters.
Parameter Operating range Uncertainty
D (mm) 1.70, 1.224 �0.007, �0.009G (kg/m2s) 100e500 �3e3.5 %q00 (kW/m2) 15e355 �1.25e3 %dP (mbar) 0e700 �1Tsat (
�C) 23,33,43 �0.1
xth (–) 0e1.1 �3e4%
monia in vertical small diameter tubes: Two phase frictional pressurel of Thermal Sciences (2012), doi:10.1016/j.ijthermalsci.2011.11.018
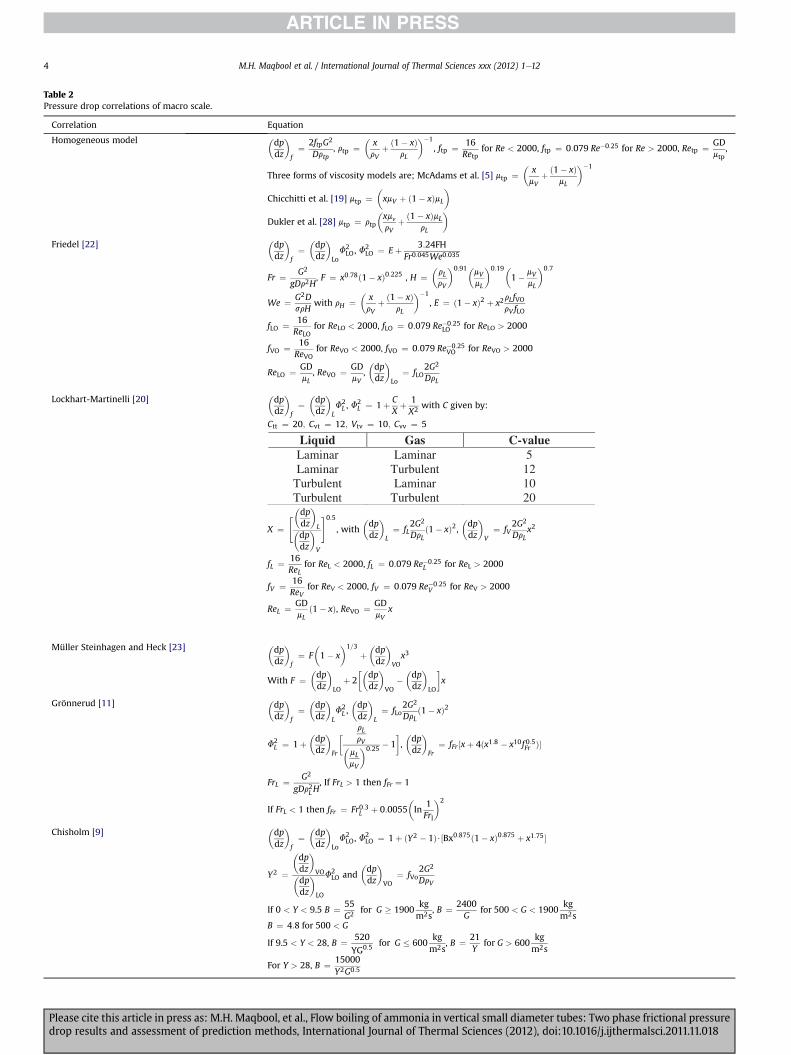
Table 2Pressure drop correlations of macro scale.
Correlation Equation
Homogeneous model �dpdz
�f¼ 2ftpG2
Drtp, rtp ¼
�xrV
þ ð1� xÞrL
��1
, ftp ¼ 16Retp
for Re < 2000, ftp ¼ 0:079 Re�0:25 for Re > 2000, Retp ¼ GDmtp
,
Three forms of viscosity models are; McAdams et al. [5] mtp ¼�
xmV
þ ð1� xÞmL
��1
Chicchitti et al. [19] mtp ¼�xmV þ ð1� xÞmL
�
Dukler et al. [28] mtp ¼ rtp
�xmvrV
þ ð1� xÞmLrL
�
Friedel [22]�dpdz
�f¼�dpdz
�LoF2LO, F
2LO ¼ E þ 3:24FH
Fr0:045We0:035
Fr ¼ G2
gDr2H, F ¼ x0:78ð1� xÞ0:225 , H ¼
�rLrV
�0:91�mVmL
�0:19�1� mV
mL
�0:7
We ¼ G2DsrH
with rH ¼�
xrV
þ ð1� xÞrL
��1
, E ¼ ð1� xÞ2 þ x2rLfVOrV fLO
fLO ¼ 16ReLO
for ReLO < 2000, fLO ¼ 0:079 Re�0:25LO for ReLO > 2000
fVO ¼ 16ReVO
for ReVO < 2000, fVO ¼ 0:079 Re�0:25VO for ReVO > 2000
ReLO ¼ GDmL
, ReVO ¼ GDmV
,�dpdz
�Lo
¼ fLO2G2
DrL
Lockhart-Martinelli [20]�dpdz
�f¼�dpdz
�LF2L , F
2L ¼ 1þ C
Xþ 1X2 with C given by:
Ctt ¼ 20; Cvt ¼ 12; Vtv ¼ 10; Cvv ¼ 5
Liquid Gas C-valueLaminar Laminar 5Laminar Turbulent 12
Turbulent Laminar 10Turbulent Turbulent 20
X ¼"�dp
dz
�L�
dpdz
�V
#0:5, with
�dpdz
�L¼ fL
2G2
DrLð1� xÞ2,
�dpdz
�V
¼ fV2G2
DrLx2
fL ¼ 16ReL
for ReL < 2000, fL ¼ 0:079 Re�0:25L for ReL > 2000
fV ¼ 16ReV
for ReV < 2000, fV ¼ 0:079 Re�0:25V for ReV > 2000
ReL ¼ GDmL
ð1� xÞ, ReVO ¼ GDmV
x
Müller Steinhagen and Heck [23] �dpdz
�f¼ F
�1� x
�1=3
þ�dpdz
�VO
x3
With F ¼�dpdz
�LO
þ 2��
dpdz
�VO
��dpdz
�LO
�x
Grönnerud [11] �dpdz
�f¼�dpdz
�LF2L ,�dpdz
�L¼ fLo
2G2
DrLð1� xÞ2
F2L ¼ 1þ
�dpdz
�Fr
� rLrV�
mLmV
�0:25 � 1�,�dpdz
�Fr
¼ fFr ½xþ 4ðx1:8 � x10f 0:5Fr Þ�
FrL ¼ G2
gDr2LH, If FrL > 1 then fFr ¼ 1
If FrL < 1 then fFr ¼ Fr0:3L þ 0:0055�In
1Frl
�2
Chisholm [9]�dpdz
�f¼�dpdz
�LoF2LO, F
2LO ¼ 1þ ðY2 � 1Þ$½Bx0:875ð1� xÞ0:875 þ x1:75�
Y2 ¼
�dpdz
�VO�
dpdz
�LO
F2LO and
�dpdz
�VO
¼ fVo2G2
DrV
If 0 < Y < 9.5 B ¼ 55G2 for G � 1900
kgm2s
, B ¼ 2400G
for 500 < G < 1900kgm2s
B ¼ 4:8 for 500 < G
If 9.5 < Y < 28, B ¼ 520
YG0:5 for G � 600kgm2s
, B ¼ 21Y
for G > 600kgm2s
For Y > 28, B ¼ 15000Y2G0:5
M.H. Maqbool et al. / International Journal of Thermal Sciences xxx (2012) 1e124
Please cite this article in press as: M.H. Maqbool, et al., Flow boiling of ammonia in vertical small diameter tubes: Two phase frictional pressuredrop results and assessment of prediction methods, International Journal of Thermal Sciences (2012), doi:10.1016/j.ijthermalsci.2011.11.018

Table 3Pressure drop correlations of micro scale.
Correlation Equation
Mishima and Hibiki [7] C ¼ 21ð1� e�319DÞThis C value should be used withLockhart-Martinelli [20] Correlation.
Zhang and Webb [25]�dpdz
�f¼�dpdz
�LoF2LO
F2LO ¼ð1� xÞ2 þ 2:87x2
�P
Pcrit
��1
þ 1:68x0:8ð1� xÞ0:25�
PPcrit
��1:64
Tran et al. [26]�dpdz
�f¼�dpdz
�LoF2LO,
F2LO ¼ 1þ ð4:3Y2 � 1Þ$½Cox0:875ð1� xÞ0:875 þ x1:75�
Co ¼ffiffiffiffiffiffiffiffiffiffiffiffiffiffiffiffiffiffiffiffiffiffiffiffiffiffiffiffiffiffiffiffi
s
D2$g$ðrL � rgÞ
sY2 ¼
�dpdz
�VO�
dpdz
�LO
Fig. 4. Single phase friction factor versus Reynolds number for 1.224 mm tube.
M.H. Maqbool et al. / International Journal of Thermal Sciences xxx (2012) 1e12 5
(DP)tp represents the pressure drop due to two phase flow and itincludes frictional, gravitational and acceleration part;
ðDPÞtp ¼ ðDPÞfric þ ðDPÞgrav þ ðDPÞacc (9)
The two phase gravitational pressure drop is calculated as
���ðDPÞtp���grav ¼ gXi¼n
i¼1Liharg þ ð1� aÞri
ii
(10)
And the acceleration pressure drop as
���ðDPÞtp���acc ¼ G2
rL
"x2exitaexit
rLrg
!þ ð1� xexitÞ2
ð1� aexitÞ� 1
#(11)
where a is defined fromWoldesemayat and Ghajar correlation [15];
a ¼ USg
USg
0@1þ
USlUSg
!�rgrL
�0:11Aþ 2:9
�gDsð1þ cos qÞrL � rg
�rL2
�0:25ð1:22þ 1:22sin qÞ Patm
Psystem
The calculations have also been done using the homogeneousmodel but theWoldesemayat and Ghajar correlation [15] gavemorecoherent results.The frictional two phase pressure drop was esti-mated by subtracting the calculated gravitational and accelerationpressure drops mentioned above from the total two phase pressuredrop. The calculated two phase gravitational and accelerationpressure drops vary from 15 to 30% of the two phase pressure drop.
4. Two phase frictional pressure drop correlations
4.1. Macro scale correlations
The two phase frictional pressure drop can be determined bydifferent models. Generally, these can be divided into homoge-neous and separated flow models.
Table 4Roughness details of test sections.
Tube inner dimension Ra (mm) Rv (mm) Rp (mm)
1.70 mm 0.21 �0.73 0.801.224 mm 2.55 �5.08 9.58
Please cite this article in press as: M.H. Maqbool, et al., Flow boiling of amdrop results and assessment of prediction methods, International Journa
In the homogeneous model, the liquid and gas phases areassumed to have the same velocity. In this model, only one phase,with average properties, is considered. Different definitions ofaverage viscosity are reported in Table 2. The separated flow modelis based on the assumption that the two phases are segregated intoseparated flows that may have different velocities.
The macro scale correlations used in this study are tabulated inTable 2.
4.2. Micro scale correlations
The two phase flow regimes in small diameters tubes are
different from those in macro channels [3]. The flow in smalldiameter tubes is more influenced by surface tension than gravityeffects, which is different from macro channels. Based on thesedifferences, it may be assumed that the predicting methods formacro scale pressure drop may not work well for prediction of twophase pressure drop in micro tubes. Mostly micro scale correlationsare modified forms of macro scale correlations and are developedby incorporating dominant effects of micro flow in macro scalecorrelations. Micro scale correlations used in this study are tabu-lated in Table 3.
5. Experimental results and discussion
To validate the instrumentation and the measurements in thetest rig, single phase experiments were made. The results in termsof single phase friction factor plotted versus Reynolds number forthe 1.224 mm tube are shown in Fig. 4. As can be seen in this figure,the experimental results correspond well to the classical correla-tions. The large error bars in the laminar region is due to the verylow pressure drop in these cases. The accuracy of the pressuretransducer is in this case limiting the accuracy.
monia in vertical small diameter tubes: Two phase frictional pressurel of Thermal Sciences (2012), doi:10.1016/j.ijthermalsci.2011.11.018
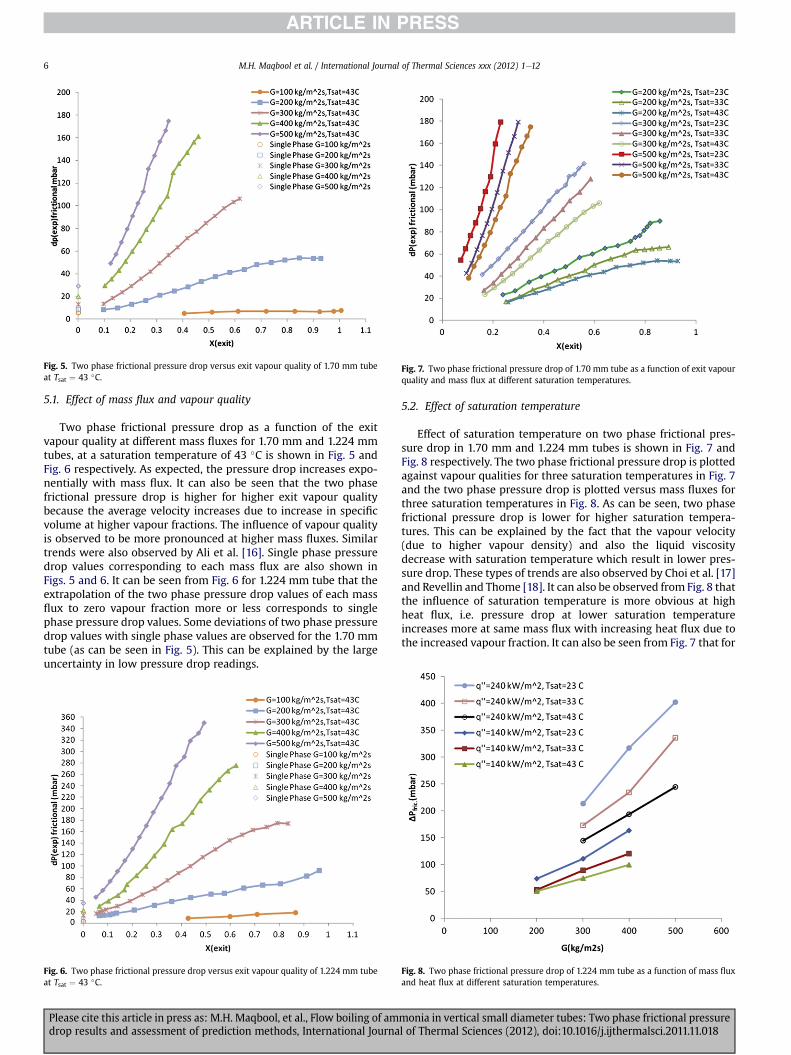
Fig. 7. Two phase frictional pressure drop of 1.70 mm tube as a function of exit vapourquality and mass flux at different saturation temperatures.
Fig. 5. Two phase frictional pressure drop versus exit vapour quality of 1.70 mm tubeat Tsat ¼ 43 �C.
M.H. Maqbool et al. / International Journal of Thermal Sciences xxx (2012) 1e126
5.1. Effect of mass flux and vapour quality
Two phase frictional pressure drop as a function of the exitvapour quality at different mass fluxes for 1.70 mm and 1.224 mmtubes, at a saturation temperature of 43 �C is shown in Fig. 5 andFig. 6 respectively. As expected, the pressure drop increases expo-nentially with mass flux. It can also be seen that the two phasefrictional pressure drop is higher for higher exit vapour qualitybecause the average velocity increases due to increase in specificvolume at higher vapour fractions. The influence of vapour qualityis observed to be more pronounced at higher mass fluxes. Similartrends were also observed by Ali et al. [16]. Single phase pressuredrop values corresponding to each mass flux are also shown inFigs. 5 and 6. It can be seen from Fig. 6 for 1.224 mm tube that theextrapolation of the two phase pressure drop values of each massflux to zero vapour fraction more or less corresponds to singlephase pressure drop values. Some deviations of two phase pressuredrop values with single phase values are observed for the 1.70 mmtube (as can be seen in Fig. 5). This can be explained by the largeuncertainty in low pressure drop readings.
Fig. 6. Two phase frictional pressure drop versus exit vapour quality of 1.224 mm tubeat Tsat ¼ 43 �C.
Please cite this article in press as: M.H. Maqbool, et al., Flow boiling of amdrop results and assessment of prediction methods, International Journa
5.2. Effect of saturation temperature
Effect of saturation temperature on two phase frictional pres-sure drop in 1.70 mm and 1.224 mm tubes is shown in Fig. 7 andFig. 8 respectively. The two phase frictional pressure drop is plottedagainst vapour qualities for three saturation temperatures in Fig. 7and the two phase pressure drop is plotted versus mass fluxes forthree saturation temperatures in Fig. 8. As can be seen, two phasefrictional pressure drop is lower for higher saturation tempera-tures. This can be explained by the fact that the vapour velocity(due to higher vapour density) and also the liquid viscositydecrease with saturation temperature which result in lower pres-sure drop. These types of trends are also observed by Choi et al. [17]and Revellin and Thome [18]. It can also be observed from Fig. 8 thatthe influence of saturation temperature is more obvious at highheat flux, i.e. pressure drop at lower saturation temperatureincreases more at same mass flux with increasing heat flux due tothe increased vapour fraction. It can also be seen from Fig. 7 that for
Fig. 8. Two phase frictional pressure drop of 1.224 mm tube as a function of mass fluxand heat flux at different saturation temperatures.
monia in vertical small diameter tubes: Two phase frictional pressurel of Thermal Sciences (2012), doi:10.1016/j.ijthermalsci.2011.11.018

M.H. Maqbool et al. / International Journal of Thermal Sciences xxx (2012) 1e12 7
a given vapour fraction, the difference between the two phasepressure drop at 23 �C and 33 �C is higher than the differencebetween 33 �C and 43 �C. The difference of liquid to vapour densityratio decreases as we go from lower to higher saturation temper-atures which can be a reason for this non uniform difference.
5.3. Effect of internal diameter
The two phase frictional pressure drop is plotted in Fig. 9 versusexit vapour fraction for the two tube diameters (fluid was alwaysslightly subcooled at the inlet). As can be seen, pressure drop ishigher for the lower diameter tube at equal mass fluxes. The higherpressure drop in the smaller diameter tube is caused by the higherwall shear stress, caused by the higher velocity gradient in this tube.Similar results were also observed by Revellin and Thome [18].
6. Comparison with correlations
The two phase pressure drop is compared with well knowncorrelations from the literature. The details of the presentedcorrelations can be found in Table 2 and Table 3. The two phasefrictional pressure drop gradients are calculated by dividing the testsection in ten segments for each correlation and these local pres-sure drop gradients are summed up to calculate the total two phasefrictional pressure drop.
6.1. Comparison with macro scale correlations
Fig. 10a shows the experimental two phase frictional pressuredrop plotted versus predicted frictional pressure drop by thehomogeneous model using the two phase viscosity definition ofChicchitti et al. [19]. The homogeneous model assumes equalvelocities of vapour and liquid and the fluid is considered as singlephase. This model under predicts the data with a Mean AbsoluteDeviation (MAD) of 27%. Similar trends were also reported byOwhaib et al. [3]. It should be noted that the spread in the results issmall, and that the deviation is linear, indicating that with a changein the leading constant this correlationwould give good predictionsfor all tests.
The predictions of the Lockhart and Martinelli correlation [20]are shown in Fig. 10b.This correlation is based on the separated
Fig. 9. Two phase frictional pressure drop versus exit vapour quality for differentdiameters.
Please cite this article in press as: M.H. Maqbool, et al., Flow boiling of amdrop results and assessment of prediction methods, International Journa
flow model. This is the only correlation used in this study thatpredicts the data well at higher mass fluxes and high outlet vapourbut overall this correlation over predicts the experimental datawith a MAD of 39%, and the spread of the predictions is large.
Many micro scale correlations are modified forms of the Lock-hart and Martinelli correlation [20]. This correlation uses a twophase multiplier to determine the two phase frictional pressuregradient. The two phase multiplier is a function of the Martinelliparameter X and the Chisholm parameter C. The value of C variesfrom 5 to 20 depending on the liquid and gas flow regimes [29]. Inthis study according to the flow regimes in these experiments,mostly the C value of 12 and 20 is used. The two phase multiplierwith different values of C and Martinelli parameter for all satura-tion conditions and diameters are plotted in Fig. 11. The experi-mental data points are also shown in the Fig. 11. From these plots, itcan be observed that if a C value of 4e6 for 1.70 mm tube anda value of 9e12 for 1.224 mm tube are used then the experimentaldata can be predicted quite precisely by Lockhart and MartinelliCorrelation [20]. The C valuemay be calculated by incorporating thefactors which are dominant in micro channels. It has been sug-gested that if the Lockhart and Martinelli correlation [20] is to beused, parameter C should be determined not only from the flowregimes, but also from the channel size [21].
A comparison of the Chisholm correlation [9] with our experi-mental data is presented in Fig. 10c.This correlation was developedfor turbulent flow pressure drop. This correlation over predicts ourexperimental data with a MAD of 100% mainly due to overprediction of the lower pressure drops, for which there are manydata points. The spread of the data is slightly less than for theLockhart-Martinelli correlation [20].
Fig. 10d shows the comparison of experimental two phase fric-tional pressure drop with the Friedel correlation [22]. As theLockhart andMartinelli [20] correlation, this correlation is based onthe separated flow model. This correlation is developed for macroscale channels where the flow is turbulent even at lower massfluxes in contrary to micro scale channels, where the flow islaminar except at the highest mass fluxes. This correlation predictsthe datawithMAD of 25% and in general, the predictions are similarto that of the homogeneous model.
Fig. 10e shows the comparison of the Müller Steinhagen andHeck [23] correlation with the experimental frictional pressuredrop. Tribbe and Müller Steinhagen [24] showed by using aireoil,airewater, steamewater and several refrigerants that this correla-tion is one of the best predicting methods of two phase pressuregradient in macrochannels. This correlation is able to predict ourexperimental results for the two tubes with a MAD of 27% witha small spread of the results, similar to the homogeneous model.
The Grönnerud [11] correlation was developed for refrigerantsin larger diameter tubes. This correlation under predicts ourexperimental data with a MAD of 51% as is shown in Fig. 10f. Also,the spread of the results is large.
Da Silva Lima et al. [10] observed similar predictions of Lockhartand Martinelli [20], Friedel correlation [22] and Müller Steinhagenand Heck [23] when they performed experiments with ammonia ina smooth horizontal macro channel of 14 mm internal diameter.
6.2. Comparison with micro scale correlations
The micro scale correlations are also compared with theexperimental data of ammonia to check their predicting capability.
Predictions of the micro channel correlation suggested by Mis-hima and Hibiki [7] are shown in Fig. 12a. This correlation isa modified form of the Lockhart and Martinelli [20] correlation inwhich a new C value is suggested by incorporating the effect ofchannel diameter. As shown, the spread is very small, but the MAD
monia in vertical small diameter tubes: Two phase frictional pressurel of Thermal Sciences (2012), doi:10.1016/j.ijthermalsci.2011.11.018
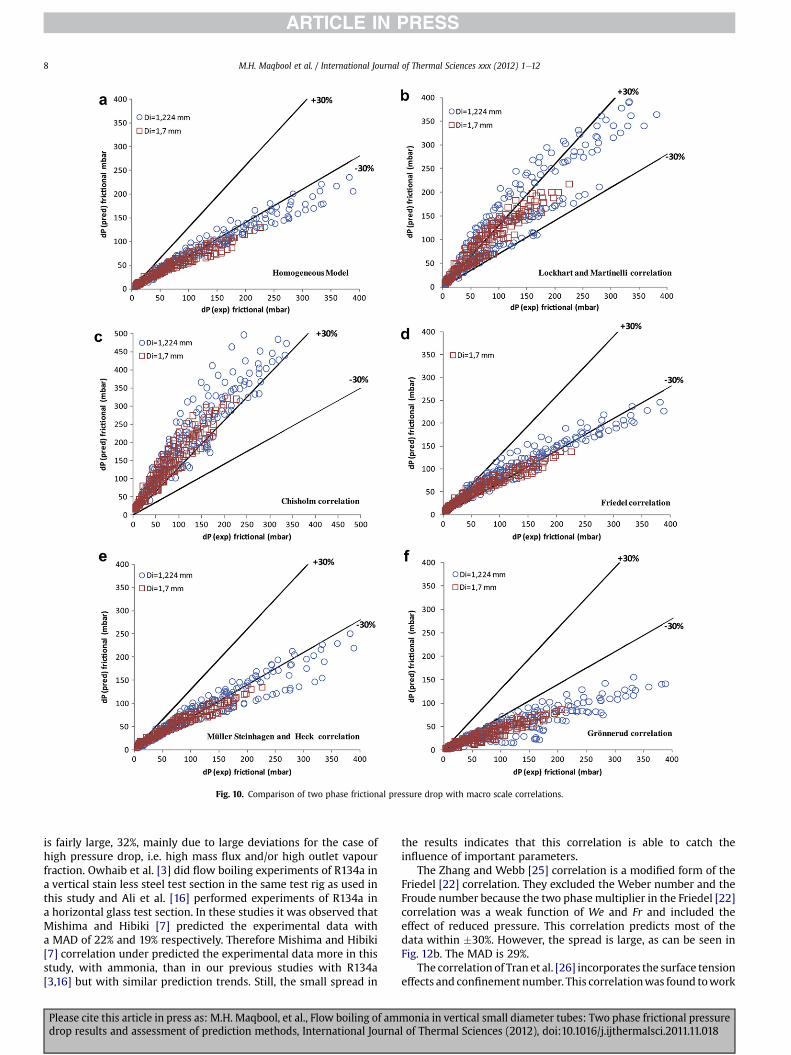
Fig. 10. Comparison of two phase frictional pressure drop with macro scale correlations.
M.H. Maqbool et al. / International Journal of Thermal Sciences xxx (2012) 1e128
is fairly large, 32%, mainly due to large deviations for the case ofhigh pressure drop, i.e. high mass flux and/or high outlet vapourfraction. Owhaib et al. [3] did flow boiling experiments of R134a ina vertical stain less steel test section in the same test rig as used inthis study and Ali et al. [16] performed experiments of R134a ina horizontal glass test section. In these studies it was observed thatMishima and Hibiki [7] predicted the experimental data witha MAD of 22% and 19% respectively. Therefore Mishima and Hibiki[7] correlation under predicted the experimental data more in thisstudy, with ammonia, than in our previous studies with R134a[3,16] but with similar prediction trends. Still, the small spread in
Please cite this article in press as: M.H. Maqbool, et al., Flow boiling of amdrop results and assessment of prediction methods, International Journa
the results indicates that this correlation is able to catch theinfluence of important parameters.
The Zhang and Webb [25] correlation is a modified form of theFriedel [22] correlation. They excluded the Weber number and theFroude number because the two phasemultiplier in the Friedel [22]correlation was a weak function of We and Fr and included theeffect of reduced pressure. This correlation predicts most of thedata within �30%. However, the spread is large, as can be seen inFig. 12b. The MAD is 29%.
The correlation of Tran et al. [26] incorporates the surface tensioneffects and confinement number. This correlationwas found towork
monia in vertical small diameter tubes: Two phase frictional pressurel of Thermal Sciences (2012), doi:10.1016/j.ijthermalsci.2011.11.018

Fig. 11. Two phase multiplier versus Martinelli parameter for the two test sections at all saturation conditions.
M.H. Maqbool et al. / International Journal of Thermal Sciences xxx (2012) 1e12 9
well in our previous study for R134a by Ali et al. [16] but for theammonia data in this study, this correlation over predicts the datawith a MAD of 205%. Also, the deviation is much larger for thesmaller diameter tube. The data is shown in Fig. 12c. Cavallini et al.[27] observed similar predicting trends when they compared theirexperimental data of three refrigerants (R236ea, R134a, R410A) inmultiport mini channels with Tran et al. [26] correlation.
7. New proposed correlation
To develop good prediction method for the two phase pressuredrop in mini and micro channels, there are certain parameters likesurface tension and confinement effects which need to be consid-ered in addition to the parameters normally considered in macro
Please cite this article in press as: M.H. Maqbool, et al., Flow boiling of amdrop results and assessment of prediction methods, International Journa
channels. One way to consider these parameters is to include theConfinement number (Co) defined as;
Co ¼ffiffiffiffiffiffiffiffiffiffiffiffiffiffiffiffiffiffiffiffiffiffiffiffiffiffiffiffiffiffiffiffiffiffi
s
D2$g$rL � rg
�vuut (12)
If Co is greater than one, which is the case in this study then thesurface tension forces becomes important. Tran et al. [26] developeda micro channel correlation with the inclusion of surface tension interms of the Confinement number (Co). The Confinement number ofdifferent fluids vary under the same experimental conditions. Forthe same hydraulic diameter, the Confinement number of ammoniais more than two times that of R134a, R22 and R113 on the basis ofwhich Tran et el [26]. correlation was developed Therefore, in this
monia in vertical small diameter tubes: Two phase frictional pressurel of Thermal Sciences (2012), doi:10.1016/j.ijthermalsci.2011.11.018

Fig. 12. Comparison of two phase frictional pressure drop with micro scale correlations.
M.H. Maqbool et al. / International Journal of Thermal Sciences xxx (2012) 1e1210
study Tran et al. [26] correlation has been modified for the predic-tion of ammonia two phase pressure drop. The new proposedcorrelation, as can be seen in Fig. 13, predicts all the experimentaldatawithMADof 16% and 86%of the experimental data iswithin therange of �30%. The functional form of the proposed correlation(modified form of Tran et al. [26] correlation) is;�dpdz
�f¼�dpdz
�LoF2LO (13)
F2LO ¼ 1þ
4:3Y2�1
�$h0:2Co1:2x0:875ð1�xÞ0:875þx1:75
i(14)
Y2 ¼
�dpdz
�VO�
dpdz
�LO
Fig. 13. Comparison of two phase experimental frictional pressure drop with proposedcorrelation.
8. Conclusions
Two phase pressure drop experiments of ammonia wereperformed in two stainless steel (AISI 316) vertical channels ofinternal diameters of 1.70 mm and 1.224 mm. The tests were doneat three different saturation pressures. Effects of different param-eters on two phase pressure drop were investigated. The mainconclusions are;
Please cite this article in press as: M.H. Maqbool, et al., Flow boiling of amdrop results and assessment of prediction methods, International Journa
➢ The comparison of the experimental data of ammonia withthe existing macro scale correlations shows that none of thecorrelations predicted the data well. The predicting methodswhich give better predictions include homogeneous model,Müller Steinhagen and Heck [23] and Friedel [22], all threeunder predicting the experimental results with a rather smallspread among the data points. The mean absolute deviations,
monia in vertical small diameter tubes: Two phase frictional pressurel of Thermal Sciences (2012), doi:10.1016/j.ijthermalsci.2011.11.018

M.H. Maqbool et al. / International Journal of Thermal Sciences xxx (2012) 1e12 11
MAD, were 27%, 27% and 25% for these correlationsrespectively.
➢ Micro scale correlations like Zhang and Webb [25] and Mis-hima and Hibiki [7] predicted our experimental data witha MAD of 29% and 32% respectively. The spread between thedata points was much smaller for the Mishima and Hibikicorrelation, but this correlation under predicted most data.The Zhang and Webb correlation caught the general trend,but the spread in the data was much larger.
➢ A new proposed correlation, a modified form of Tran et al.[26] correlation, is able to predict all experimental data withMAD of 16% and 86% of the experimental data is within �30%range.
Acknowledgement
The authors gratefully acknowledge the scholarship awarded byHigher Education Commission Pakistan [HEC] to conduct thisresearch as part of PhD studies at Department of Energy Tech-nology, Royal Institute of Technology, KTH, Sweden.
Nomenclature
A heat transfer area, m2
Cp specific heat, J/kg KD diameter, mDC direct currentf friction factor, –G mass flux, kg/m2sg acceleration of gravity, m/s2
I current, Ailv latent heat of vapourization, J/kgk thermal conductivity, W/m KL length, mMAD mean absolute deviation,¼[1/N][SjXpred � Xexpj/Xexp] (%)m mass flow of refrigerant, kg/sP pressure, barPc critical pressure, barPr reduced pressure, –q00 heat flux, W/m2
T temperature, �Cu velocity, m/sUS superficial velocity, m/sV voltage, Vx vapour fraction, –z axial position, mzo position where boiling starts, m
Greek lettersF two-phase flow multiplierm dynamic viscosity, Pa sr density, kg/m3
ΔP pressure difference, mbars surface tension, N/ma void fraction
Subscriptsacc accelerationatm atmosphericc cross-sectionalcrit criticalexp experimentalfric frictionalg gas
Please cite this article in press as: M.H. Maqbool, et al., Flow boiling of amdrop results and assessment of prediction methods, International Journa
grav gravitationalh heatedi insideic inlet contractionin inletL liquidlam laminarlo liquid onlyo outsideoe outlet expansionpred predictedsat saturationsp single phasetp two phaseturb turbulentv vapourvo vapour only
Non-dimensional groups
Co confinement number, ¼ffiffiffiffiffiffiffiffiffiffiffiffiffiffiffiffiffiffiffiffiffiffiffiffiffiffiffiffiffiffiffiffi
s
D2$g$ðrL � rgÞ
s
Fr Froude number, ¼ G2
r2gDi
Re Reynolds number, ¼ GDm
We Weber number, ¼ G2Di
rsX2 Lockhart-Martinelli parameter¼
"ðdpdzÞLðdpdzÞV
#
References
[1] S.S. Bertsch, E.A. Groll, S.V. Garimella, Refrigerant flow boiling heat transfer inparallel micro channels as a function of local vapour quality, InternationalJournal of Heat and Mass Transfer 51 (2008) 4775e4787.
[2] Y.W. Hwang, M.S. Kim, Pressure drop in micro tubes and correlation devel-opment, International Journal of Heat and Mass Transfer 49 (2006)1804e1812.
[3] W. Owhaib, Experimental Heat Transfer, Pressure Drop, and Flow Visualiza-tion Of R-134a in vertical Mini/Micro tubes, Doctoral Thesis in Energy Tech-nology, KTH, Stockholm Sweden (2007) ISBN 978-91-7178-594-7.
[4] E.K. Ungar, J.D. Cornwell, Two phase pressure drop of ammonia in smalldiameter horizontal tubes, AIAA Paper 92 (1992) 3891.
[5] W.H. McAdams, W.K. Woods, R.L. Bryan, Vaporization inside horizontal tubes-II-benzeneeoil mixtures, ASME Transactions 64 (1942) 193.
[6] S. Brandon, P. Hrnjak, Adiabatic two-phase pressure drop of refrigerants insmall channels, Journal of Heat Transfer Engineering 28 (8) (2007) 704e712.
[7] K. Mishima, T. Hibiki, Some characteristics of airewater flow in small diametervertical tubes, International Journal of Multiphase Flow 22 (1996) 703e712.
[8] S. Kabelac, H.J. De Buhr, Flow boiling of ammonia in a plain and a low finnedhorizontal tube, International Journal of Refrigeration 24 (2001) 41e50.
[9] D. Chisholm, Pressure gradients due to friction during the flow of evaporatingtwo-phase mixtures in smooth tubes and channels, International Journal ofHeat and Mass Transfer 16 (1973) 347e348.
[10] R.J. Da Silva Lima, J.M. Quiben, C. Kuhn, T. Boyman, R.J. Thome, Ammonia two-phase flow in a horizontal smooth tube: flow pattern observations, diabaticand adiabatic frictional pressure drops and assessment of prediction methods,International Journal of Heat and Mass Transfer 52 (2009) 2273e2288.
[11] R. Grönnerud, Investigation of liquid hold-up, flow-resistance and heattransfer in circulation type evaporators, part IV: two-phase flow resistance inboiling refrigerants, annexe 1972-I, Bull. De I’Inst. du froid (1979).
[12] J. Moreno Quibén, J.R. Thome, Flow pattern based two-phase frictional pres-sure drop model for horizontal tubes. Part2: new phenomenological model,International Journal of Heat and Fluid Flow 28 (2007) 1060e1072.
[13] H. Blasius, Das Ähnlichkeitsgesetz bei Reibungsvorgäangen in Flüssigkeiten,Forchg. Arb. Ing.- Wes. 131 (1913) (Berlin).
[14] J.G. Collier, J.R. Thome, Convective Boiling and Condensation, third ed. OxfordUniversity Press, 1994.
[15] M.A. Woldesemayat, A.J. Ghajar, Comparison of void fraction correlations fordifferent flow patterns in horizontal and upward inclined pipes, InternationalJournal of Multiphase Flow 33 (2007) 347e370.
[16] R. Ali, B. Palm, M.H. Maqbool, Experimental investigation of two phasepressure drop in a mini channel, Proceedings of the 2nd Micro and NanoFlows Conference West London, UK (September 2009) 1e2.
monia in vertical small diameter tubes: Two phase frictional pressurel of Thermal Sciences (2012), doi:10.1016/j.ijthermalsci.2011.11.018

M.H. Maqbool et al. / International Journal of Thermal Sciences xxx (2012) 1e1212
[17] K.I. Choi, A.S. Pemitran, J.T. Oh, K. Saito, Pressure drop and heat transfer duringtwo phase flow vaporization of propane in horizontal smooth channels,International Journal of Refrigeration 32 (2009) 837e845.
[18] R. Revellin, J.R. Thome, Adiabatic two phase frictional pressure drops in microchannels, Experimental Thermal and Fluid Sciences 31 (2007) 673e685.
[19] C. Chicchitti, M. Lombardi, G. Silvestri, R. Soldaini, Zavattarelli, Two-phasecooling experiments pressure drop, heat transfer and burnout measurements,Nuclear Energy 7 (6) (1960) 407e425.
[20] R.C. Lockhart, R.W. Martinelli, Proposed correlation of data for isothermaltwo-phase, two component flow in pipes, Chemical Engineering Progress 45(1949) 39e48.
[21] H.J. Lee, S.Y. Lee, Pressure drop correlations for two-phase flow within hori-zontal rectangular channels with small heights, International Journal ofMultiphase Flow 27 (2001) 783e796.
[22] L. Friedel, Improved Friction Pressure Drop Correlations for Horizontal andVertical Two- Phase Pipe Flow, European Two-Phase Flow Group Meeting,Ispra, Italy, 1979, paper E2.
[23] H. Müller-Steinhagen, K. Heck, A simple friction pressure drop correlationfor two- phase flow pipes, Chemical Engineering Process 20 (1986)297e308.
Please cite this article in press as: M.H. Maqbool, et al., Flow boiling of amdrop results and assessment of prediction methods, International Journa
[24] C. Tribbe, H.M. Müller Steinhagen, An evaluation of the performance ofphenomenological models for predicting pressure gradient during gas liquidflow in horizontal pipelines, International Journal of Multiphase Flow 26(2000) 1019e1036.
[25] M. Zhang, R.L. Webb, Correlation of two-phase friction for refrigerants insmall-diameter tubes, Experimental Thermal and Fluid Science 25 (2001)131e139.
[26] T.N. Tran, M.C. Chyu, M.W. Wambsganss, D.M. France, Two phase pressuredrop of refrigerants during flow boiling in small channels: an experimentalinvestigation and correlation development, International Journal of Multi-phase Flow 26 (2000) 1739e1754.
[27] A. Cavallini, D.D. Col, L. Doretti, M. Matkovic, L. Rossetto, C. Zilio, Two-phase frictional pressure gradient of R236ea, R134a and R410A insidemulti-port mini-channels, Experimental Thermal and Fluid Science 29(2005) 861e870.
[28] A.E. Dukler, M. Wicks, R.G. Cleveland, Pressure drop and hold-up in two-phaseflow part A e a comparison of existing correlations and part B e an approachthrough similarity analysis, AIChE Journal. 10 (1) (1964) 38e51.
[29] D. Chisholm, A.D.K. Laird, Two-phase flow in rough tubes, Transactions ofASME 80 (2) (1958) 276e283.
monia in vertical small diameter tubes: Two phase frictional pressurel of Thermal Sciences (2012), doi:10.1016/j.ijthermalsci.2011.11.018


![Flow boiling heat transfer of HFO1234yf and HFC32 ... boiling heat transfer of... · boiling heat transfer coefficient is calculated from the pool boiling correlation of Cooper [7].](https://static.fdocuments.in/doc/165x107/6060f16e796df51c036c4972/flow-boiling-heat-transfer-of-hfo1234yf-and-hfc32-boiling-heat-transfer-of.jpg)