Flow Assurance Analyses for Optimum Pipeline ...
12
Petroleum Science and Engineering 2019; 3(1): 17-28 http://www.sciencepublishinggroup.com/j/pse doi: 10.11648/j.pse.20190301.14 ISSN: 2640-4486 (Print); ISSN: 2640-4516 (Online) Flow Assurance Analyses for Optimum Pipeline Transportation of Gas for Use in CNG Vehicles in Nigeria Igbojionu Anthony 1 , Anyadiegwu Charley 1 , Anyanwu Emmanuel 2 , Obah Boniface 1 , Ukwujiagu Chinedu 1 , Muonagor Chukwuemeka 1 1 Department of Petroleum Engineering, Federal University of Technology, Owerri, Nigeria 2 Department of Mechanical Engineering, Federal University of Technology, Owerri, Nigeria Email address: To cite this article: Igbojionu Anthony, Anyadiegwu Charley, Anyanwu Emmanuel, Obah Boniface, Ukwujiagu Chinedu, Muonagor Chukwuemeka. Flow Assurance Analyses for Optimum Pipeline Transportation of Gas for Use in CNG Vehicles in Nigeria. Petroleum Science and Engineering. Vol. 3, No. 1, 2019, pp. 17-28. doi: 10.11648/j.pse.20190301.14 Received: March 21, 2019; Accepted: April 23, 2019; Published: May 23, 2019 Abstract: The objective of this work is to conduct flow assurance analyses for optimum transportation of gas through pipelines for use in CNG vehicles in Nigeria. Port Harcourt – Owerri – Onitsha expressway is used as case. The work is for a pipeline network that would be laid from a gas treatment plant about 10km off the Port Harcourt - Owerri – Onitsha expressway to the five CNG refueling stations installed along the route for refilling the CNG vehicles. Flow assurance analyses include analyses on: condensate drop-out prevention; hydrate formation prevention; erosion prevention; slug formation tendency; and leak detection. They are performed to ensure that solids or liquids do not deposit in the pipeline. Condensate drop-out prevention analysis is conducted to determine the conditions within which hydrocarbon liquids would not form in the pipeline during the transportation of the gas. Hydrate formation is checked to establish the temperatures and pressures at which hydrate would not deposit in the pipeline. Erosion prevention analysis is performed to determine the velocity profile above which erosion cannot occur in the pipe. Slug formation tendency is evaluated to ensure that slugs do not form in the pipe. Pipeline leak is also checked by generating pressure profile that would govern the flow of gas in the pipe and help determine any possible leak of gas from the pipeline. The results of the analyses indicate that: liquid drop-out will not occur in the pipe if the temperature of the gas does not go below 65.73°F; once the temperature and pressure of the gas remain outside the hydrate curve, hydrate will not form in the pipe; the velocity profile along the pipe length is far higher than the erosional velocity therefore the possibility of erosion occurring in the pipe is highly minimal; slugs cannot form in the pipe since the fluid remains in single phase throughout the transportation in the pipe; with the pressure profile generated; leak detection is made easy by installing five pressure gauges at different lengths of the pipe and recording the expected pressures at these lengths. It is further observed from the work that these flow assurance parameters and tests are highly indispensable in gas transportation as the results of the analyses help the engineer to apply all precautionary measures to ensure that solids or liquids do not deposit in the pipeline. Recommendations are also made for the optimum operating conditions based on the flow assurance analyses. Keywords: CNG, Transportation, Pipeline, Hydrate, Erosion, Leak, Condensate, Slug, Phase Envelop 1. Introduction According to [1], natural gas can be described as a gas consisting primarily of methane. It is found associated with other fossil fuels, in coal bed, as methane clathrates, which is a type of physical compound, and is created by methanogenic organisms in marshes, bogs and landfills. It is an important source of fuel, a major feedstock for fertilizers, and a potent greenhouse gas. Before natural gas can be used as CNG fuel energy, it must undergo extensive processing to remove almost all the incompressible components from the gas stream, meaning C 4 – C 7 + would be removed (considered as condensable hydrocarbons). The by- products of that processing include butane, pentane and higher molecular weight hydrocarbons (C 6 – C 7 + ), elemental sulphur, carbon
Transcript of Flow Assurance Analyses for Optimum Pipeline ...

Petroleum Science and Engineering 2019; 3(1): 17-28 http://www.sciencepublishinggroup.com/j/pse doi: 10.11648/j.pse.20190301.14 ISSN: 2640-4486 (Print); ISSN: 2640-4516 (Online)
Flow Assurance Analyses for Optimum Pipeline Transportation of Gas for Use in CNG Vehicles in Nigeria
Igbojionu Anthony1, Anyadiegwu Charley
1, Anyanwu Emmanuel
2, Obah Boniface
1,
Ukwujiagu Chinedu1, Muonagor Chukwuemeka
1
1Department of Petroleum Engineering, Federal University of Technology, Owerri, Nigeria 2Department of Mechanical Engineering, Federal University of Technology, Owerri, Nigeria
Email address:
To cite this article: Igbojionu Anthony, Anyadiegwu Charley, Anyanwu Emmanuel, Obah Boniface, Ukwujiagu Chinedu, Muonagor Chukwuemeka. Flow
Assurance Analyses for Optimum Pipeline Transportation of Gas for Use in CNG Vehicles in Nigeria. Petroleum Science and Engineering.
Vol. 3, No. 1, 2019, pp. 17-28. doi: 10.11648/j.pse.20190301.14
Received: March 21, 2019; Accepted: April 23, 2019; Published: May 23, 2019
Abstract: The objective of this work is to conduct flow assurance analyses for optimum transportation of gas through pipelines for use in CNG vehicles in Nigeria. Port Harcourt – Owerri – Onitsha expressway is used as case. The work is for a pipeline network that would be laid from a gas treatment plant about 10km off the Port Harcourt - Owerri – Onitsha expressway to the five CNG refueling stations installed along the route for refilling the CNG vehicles. Flow assurance analyses include analyses on: condensate drop-out prevention; hydrate formation prevention; erosion prevention; slug formation tendency; and leak detection. They are performed to ensure that solids or liquids do not deposit in the pipeline. Condensate drop-out prevention analysis is conducted to determine the conditions within which hydrocarbon liquids would not form in the pipeline during the transportation of the gas. Hydrate formation is checked to establish the temperatures and pressures at which hydrate would not deposit in the pipeline. Erosion prevention analysis is performed to determine the velocity profile above which erosion cannot occur in the pipe. Slug formation tendency is evaluated to ensure that slugs do not form in the pipe. Pipeline leak is also checked by generating pressure profile that would govern the flow of gas in the pipe and help determine any possible leak of gas from the pipeline. The results of the analyses indicate that: liquid drop-out will not occur in the pipe if the temperature of the gas does not go below 65.73°F; once the temperature and pressure of the gas remain outside the hydrate curve, hydrate will not form in the pipe; the velocity profile along the pipe length is far higher than the erosional velocity therefore the possibility of erosion occurring in the pipe is highly minimal; slugs cannot form in the pipe since the fluid remains in single phase throughout the transportation in the pipe; with the pressure profile generated; leak detection is made easy by installing five pressure gauges at different lengths of the pipe and recording the expected pressures at these lengths. It is further observed from the work that these flow assurance parameters and tests are highly indispensable in gas transportation as the results of the analyses help the engineer to apply all precautionary measures to ensure that solids or liquids do not deposit in the pipeline. Recommendations are also made for the optimum operating conditions based on the flow assurance analyses.
Keywords: CNG, Transportation, Pipeline, Hydrate, Erosion, Leak, Condensate, Slug, Phase Envelop
1. Introduction
According to [1], natural gas can be described as a gas consisting primarily of methane. It is found associated with other fossil fuels, in coal bed, as methane clathrates, which is a type of physical compound, and is created by methanogenic organisms in marshes, bogs and landfills. It is an important
source of fuel, a major feedstock for fertilizers, and a potent greenhouse gas. Before natural gas can be used as CNG fuel energy, it must undergo extensive processing to remove almost all the incompressible components from the gas stream, meaning C4 – C7
+ would be removed (considered as condensable hydrocarbons). The by- products of that processing include butane, pentane and higher molecular weight hydrocarbons (C6 – C7
+), elemental sulphur, carbon

18 Igbojionu Anthony et al.: Flow Assurance Analyses for Optimum Pipeline Transportation of Gas for Use in CNG Vehicles in Nigeria
dioxide, water vapour and sometimes helium and nitrogen are conventionally removed in the stages separator processing. Brown compared sizes of hydrocarbons separator and explained that large capacity separators have more foam
problems and recommended sizeable ones or fractionation type stabilizer units [2]. Figure 1 below schematically shows natural gas components.
Figure 1. Natural Gas Components.
For many decades, Nigeria's economy has been largely mono-cultural, depending essentially on crude oil, that murky substance which Eromosele described as ‘a useless mixture of useful products’ [3]. The volatile nature of the global crude oil prices makes Nigeria’s economy very susceptible to the characteristic vagaries of the international oil market as well as to the dreaded Dutch disease syndrome (DDS). In Nigeria there is incessant scarcity and high cost of energy from existing gasoline and diesel. There are grave environmental issues associated with petroleum fuels. There is thus, the urgent need to find alternative energy to supplement gasoline and diesel as transportation fuel for automobiles in Nigeria.
CNG has been acclaimed as a clean-burning, environmentally friendly and cheap fuel and its use to power vehicles is globally gaining momentum by the day. Therefore, the perennial problems of fuel scarcity and tailpiece pollution in Nigeria will be effectively tackled by utilizing CNG. Gaius-Obaseki observed that given the abundance of gas in Nigeria, the utilization of Compressed Natural Gas (CNG) as automobile fuel provides a clean and environmentally feasible alternative to conventional fuels [4]. He noted that the world over, the transport industry is the single biggest consumer of oil, even as it has been fingered as a major source of total CO2 emissions are from road
transport.
2. Natural gas Treatment and
Transportation
2.1. Natural Gas Treatment and Processing
Hauseh developed a general pressure drop correlation (GPDC) model which is widely used today to size packed tower for water content adjustment in gas processing and conditioning. The flood point is a function of liquid rate, packing characteristics, gas and liquid densities and liquid viscosity [5]. Maddox explained that natural gas is considered sour if hydrogen sulphide (H2S) is present in amounts greater than 5.7 milligrams per normal cubic metres (mg/Nm). That is, 0.25 grams per 100 standard cubic feet (gr/100 Scf). Thus before the gas can be used, the H2S must be removed through a process usually referred to as gas “sweetening” [6]. This is done by absorption of the H2S in amine solution called amine process.
Natural gas from production or storage reservoirs contains some liquid hydrocarbons and unwanted impurities like H2O, H2S, CO2, etc. The effects of these impurities are:
Water vapour (H2O): liquid water condenses to form solid gas hydrates made up of water and hydrocarbons, that block

Petroleum Science and Engineering 2019; 3(1): 17-28 19
pipeline flow, especially flow control systems like valves, fittings, orifices, etc. It also speeds up corrosion in the pipeline.
Hydrogen sulphide (H2S): this is also called ‘sour’ gas. It is toxic and gives sulphur dioxide (SO2) and sulphur trioxide (SO3) which is nuisance to end-users.
Carbon dioxide (CO2): this is a corrosive diluent and reduces the heating value of the gas.
Figure 2 illustrates a natural gas treatment and processing system proposed by Abdel-Aal [7]. It comprises two stages: natural gas treatment or conditioning and natural gas processing.
Figure 2. Natural Gas Treatment and Processing System [7].
Tobin and Shambaugh maintained that natural gas that was not within certain specific gravities, pressures, Btu content range or water content levels would cause operational problems, pipeline deterioration and even pipeline rupture [8]. Mearkeltor observed that for decades to come, natural gas will be the energy source of choice to meet worldwide environmental standards [9].
2.2. Nigeria Natural Gas Pipeline Grid
Advances in technology have enhanced our ability to find, extract, and transport natural gas with greater efficiency and less cost. Emerging technologies have created new applications for natural gas, like natural gas vehicles (NGVs), fuel cells, and new super- efficient boilers for electric generation that will move into the mainstream in the near future. In addition, environmental records of natural gas as well as its cost, availability and efficiency, will make it superior fuel for the near and distant future. The first step to commercialize Nigeria natural gas was taken in 1960 by the then Shell/BP when it entered into an agreement to supply gas to some industries at Aba and the then Electric Corporation of Nigeria (ECN) power plant at Afam. Efforts were made by the same Shell/BP consortium in the mid-1960s to harness Nigeria gas for export to the United Kingdom in the form of liquefied natural gas (LNG). But the
discovery of vast reserves of natural gas in the British sector of the North Sea at about the same period put paid to any plan for a Nigerian LNG project then. By the 1970s, it had become apparent that Nigeria was not only one of Africa’s major producers, but was in fact, a major gas province. Gas development in Nigeria is still at the infancy stage with Nigeria Gas Company (NGC) Limited, a subsidiary of the Nigerian National Petroleum Corporation (NNPC), charged with the responsibility of managing the gas industry has demarcated the country into distribution zones in consonance with international practice aimed at accelerating natural gas development in Nigeria. The NGC was established in 1988 to invest gas transmission infrastructure, which includes, but not limited to, compression stations and high pressure transmission pipelines; take natural gas and derivatives to the industrial users, and utility companies in Nigeria and the neighboring countries. The NGC operates a large share of the transmission network, comprising approximately 1100 km of pipelines [10]. The infrastructure is predominantly located in the southern part of the country. There are two separate networks serving major users in the south-east and south-west of the country. These are shown in Figures 3 and 4; while the proposed/projected Nigeria’s natural gas network covering the entire country is as shown in Figure 5.

20 Igbojionu Anthony et al.: Flow Assurance Analyses for Optimum Pipeline Transportation of Gas for Use in CNG Vehicles in Nigeria
Figure 3. Schematic Diagram of the Eastern Gas Pipeline Network [10].
Figure 4. Schematic Diagram of the Western Gas Pipeline Network [10].
Figure 5. Proposed/projected Nigeria’s natural gas Network [10].
Petroleum Science and Engineering 2019; 3(1): 17-28 21
Gas pipelines are the arteries of the gas transmission
network, bringing energy to where it is needed. They form the backbone of the gas business- connecting the sources of supply to the areas of demand, thereby supporting the needs of producers and consumers and consumers alike. These include main trunk transmission systems and lower-pressure distribution grids. Pipeline transport is the most efficient and safest means of moving natural gas from the point of production to the consumer. Gas transportation by pipeline first came into widespread use in 1949 in the USA, when technology became available for long-distance high-pressure pipelines. By the mid-1960s all of the lower 48 of the USA were connected by a substantial network of transportation pipelines - vital conduits for the movement of energy from the gas -producing areas to the consuming centres. The gas chain includes exploitation, processing, transmission, distribution and marketing. All the phases of the gas chain namely, production, distribution and end-user, are linked and interdependent physically, as well as by information flows over a long time frame. Unlike oil, gas utilization requires a permanent link between the locations of the gas sources and the consumption areas. Hence adequate planning, prior to construction of gas production and transportation facilities is very important in establishing reliable gas supply. Thus large up-front capital investment in long-term marketing infrastructure consisting of transmission and distribution grids is required to link gas-producing areas with the markets. Any of the links can easily become a bottleneck. A broken link in the chain will cause all links downstream to experience gas supply disruptions whilst links upstream will experience liquidity problems resulting from revenue loss and breach of contract. It is therefore, essential that all players in each phase of the gas chain must fulfill their obligations to ensure that no link in the chain is broken in order to derive the expected benefits of gas supply [10].
The eastern pipelines are already in place, having passed through many corridors across three states of Rivers, Abia and Akwa Ibom. The pipeline system has six T offs of 14-inch, 16-inch and 24-inch diameter pipelines at various locations to service the needs of other industrial customers in need of natural gas. Designed for 160 MMScf of gas daily, operating at 60 bar (pressure level), and the pipeline capacity can ultimately be expanded to accommodate 450 MMScf daily at 90 bar [11].
3. Methodology
This work on flow assurance analyses for optimum transportation of gas through pipelines for use in CNG vehicles in Nigeria is an offshoot of a more robust technical project on the introduction of CNG as public transport fuel in Nigeria using Port Harcourt – Owerri – Onitsha expressway as case. The distance from Port Harcourt through Owerri to Onitsha is 194km. Pipelines would have to be laid to convey the treated gas from a gas
treatment plant about 10km off the route to the various CNG refuelling stations installed along the route to refill the CNG vehicles that would be plying the route. It is estimated that about five CNG stations would be installed along the 194km-route at Km 1 (0.621mile) at Port Harcourt, Km 49 (30.43miles) at Elele, Km 97 (60.23miles) at Owerri, Km 146 (90.67miles) at Ihiala and Km 194 (120.47miles) at Onitsha respectively.
For optimum transportation of natural gas from the sales point to the CNG refuelling stations where they are compressed to 3600psi and dispensed to vehicles, analyses have to be performed on the ways of optimizing the transportation and compression systems. These analyses include:
1. Condensate drop-out prevention across the pipeline 2. Hydrate formation prevention across the pipeline 3. Erosion prevention 4. Evaluation of slug formation tendency 5. Leak detection.
3.1. Condensate Drop-out Prevention
Natural gas condensate are low-density mixture of hydrocarbon liquids that are present as gaseous components in the gas. İt can condense out of the gas if the temperature is reduced to below the hydrocarbon dew-point temperature of the raw gas. This condensation can even occur along the transmission lines and the liquid drop-out might reach an extent that they could form slugs and block the pipelines hence preventing flow across the pipelines. This possible condensate drop-out is studied as part of the phase behaviour of the gas. Phase behaviour of the gas describes the state of the gas under any known pressure and temperature conditions. The behaviour of the gas across the pipeline is determined by the shape of its phase envelope and the position of its critical point. The phase envelope of the gas shows the conditions at which there could be change in phase across the transmission lines. İn this work, the phase envelope of the gas is generated using Aspen HYSYS to determine the particular pressure and temperature conditions at which liquid drop-out can occur, and then to make recommendations for operation throughout the transmission system within the range of pressure and temperature that would prevent liquid drop-out from occuring [12].
For more emphasis on flow assurance and optimum transportation, the phase envelop of the transported gas is generated to show the conditions at which the pipeline could be operated to prevent drop-out of liquid in the pipe which can cause flow restriction.
3.2. Hydrate Formation Prevention
Natural gas hydrates are ice-like structures in which gas, most often methane, is trapped inside of water molecules. Gas hydrates occur naturally onshore in permafrost, and at or below the seafloor in sediments where water and gas combine at low

22 Igbojionu Anthony et al.: Flow Assurance Analyses for Optimum Pipeline Transportation of Gas for Use in CNG Vehicles in Nigeria
temperatures and high pressures to form an ice-like solid substance. But they can also occur in transmission lines due to the influence of low ambient temperatures on the inside of the pipelines. Methane, or natural gas, is typically the dominant gas in the hydrate structure. In a gas hydrate, frozen water molecules form a cage-like structure around high concentrations of natural gas. The cage-like structure can clog the pipelines when they must have been generated in large quantities and thus cause restriction to flow of gas across the pipelines. To prevent hydrate formation along the flow lines, hydrate formation conditions are being predicted and the transmission lines operated within the prescribed conditions at which hydrate would not form. Naturally, hydrates form at very low temperatures and high pressures. A reservoir engineering analysis software, PVTP was used to generate the hydrate formation plot to ensure that the pipeline is operated within the prescribed conditions as shown by the plot.
PVTP is Petroleum Experts’ advanced Pressure Volume and Temperature analysis software. It is a thermodynamic fluid characterization tool that can assist the production, reservoir and process engineers in modelling the fluid PVT behaviour and predicting the effect of process conditions on the composition of hydrocarbon mixtures with accuracy and speed. PVTP provides facilities to perform studies concerning flow assurance like wax and hydrates deposition as well as calculation of thermal properties. It was used for the prediction of hydrates deposition using the hydrate formation plot and recommendation was made on operating the pipeline within the range of conditions termed safe as predicted with PVTP [13].
3.3. Erosion Prevention
Erosion in gas pipelines occurs when sand particles impact pipeine walls due to a change in flow direction or any restrictions in the line of flow. İn uninhibited terrains like deep sea, deserts or mountains through which pipelines pass, it is difficult to monitor the pipe fittings and it is important to reliably predict the erosion rates and make suitable design changes to alleviate the problem. The rate at which erosion can occur across the pipe length are estimated using HYSYS and recommendations are made for the flow of the gas across the pipeline to remain higher than this rate which is also called erosional velocity. Once the flow of gas across the pipeline is at higher velocity than the erosional velocity, erosion would not occur.
The use of HYSYS enabled the prediction of the velocity profile of the gas along the pipeline length. This velocity profile shows the gas velocity and the erosional velocity. Above the erosional velocity, gas can flow along the pipe for as long as possible without posing any threat of erosion as all the sand and other impurities are carried with high velocity along the pipe.
3.4. Evaluation of Slug Formation Tendency
Slug in multiphase flow can be defined as a liquid mass travelling in a pipe being driven by the difference in the dynamic pressure between the gas content ahead of, and behind the liquid mass, which covers the entire cross-section of the pipe [14]. In vertical pipelines, slug flow is symmetrical and bullet-shaped of
liquid with dissolved bubbles, whereas in inclined and horizontal pipes the slug is in the upper part of the pipe with liquid film below it with some dissolved bubbles in the liquid forming the slug. The side effects of slugs are that they create significant pressure fluctuations; cause flooding at the receiving end; induce severe mechanical vibrations in the pipeline; and increase hydrate deposition and corrosion.
HYSYS was used to determine the possibility of the gas forming a second phase or slug across the pipeline.
3.5. Leak Detection
The optimization principles and techniques outlined in this chapter include, pipeline design to meet sales (or pipeline) gas specifications, liquid drop-out, hydrate formation, carbon dioxide freeze-out and erosion, preventions across the pipeline. Having designed to prevent the occurrence of all these, the possibility of leak occurring in the pipeline due to corrosion is very low. As a means of long-distance gas transport, pipelines have to meet high demands of safety, reliability and efficiency. With regularly scheduled preventative maintenance (PM), pipelines can offer service for a long time without leaks. Most of the significant gas pipeline leaks that occur these days in Nigeria are as a result of vandalism, sabotage, terrorism and damage by nearby excavation equipment. This does not in any way exculpate the IOCs, who out of sheer culpable maintenance negligence allow their aged gas pipelines to corrode and burst, thereby causing environmental degradation. The American Petroleum Institute noted that if gas pipelines are poorly maintained, corrosion will slowly set in, especially at welded joints, low points where moisture occurs or at locations with imperfections (discontinuities) [15]. This will lead to leak if not detected on time. Leak detection systems (LDS) are installed to assist pipeline controllers in detecting and localizing leaks. LDS, which can be either internally-based or externally-based, provide an alarm and display other related data to the pipeline controllers in order to aid in decision-making [15]. Externally-based systems utilize field instrumentation like infrared radiometers or thermal cameras, vapour sensors, acoustic microphones or fiber-optic cables, to monitor external pipeline parameters; while internally-based systems utilize field instrumentation like flow, pressure, or fluid temperature, sensors to monitor internal pipeline parameters. Internally-based LDS are recommended for this work.
The pressure profile is used in constructing leak detection systems (LDS). The LDS involves the installation of gauges across the length of the pipeline at strategic points. These gauges measure the pressure across the pipeline real time. If at any time the pressure measured by the gauge at a particular length is lower than the pressure generated in the pressure profile for that same length, then there is leakage at that point. The pressure profile is a plot of the pressures along the length of the pipeline versus the lengths.
The pressure at any point on the pipeline is determined by HYSYS and also by using the equation below [16]:
Px = P1 – (P1 – P2)x/L Where, x = point x along the length of the pipeline, mile Px = pressure at point x on the pipeline, psia P1 = pressure at the beginning of the pipeline, psia
Petroleum Science and Engineering 2019; 3(1): 17-28 23
P2 = pressure at the end of the pipeline, psia L = length of the pipeline, mile
4. Presentation of Results
4.1. Generation of Gas Envelop to Prevent Liquid Drop-Out
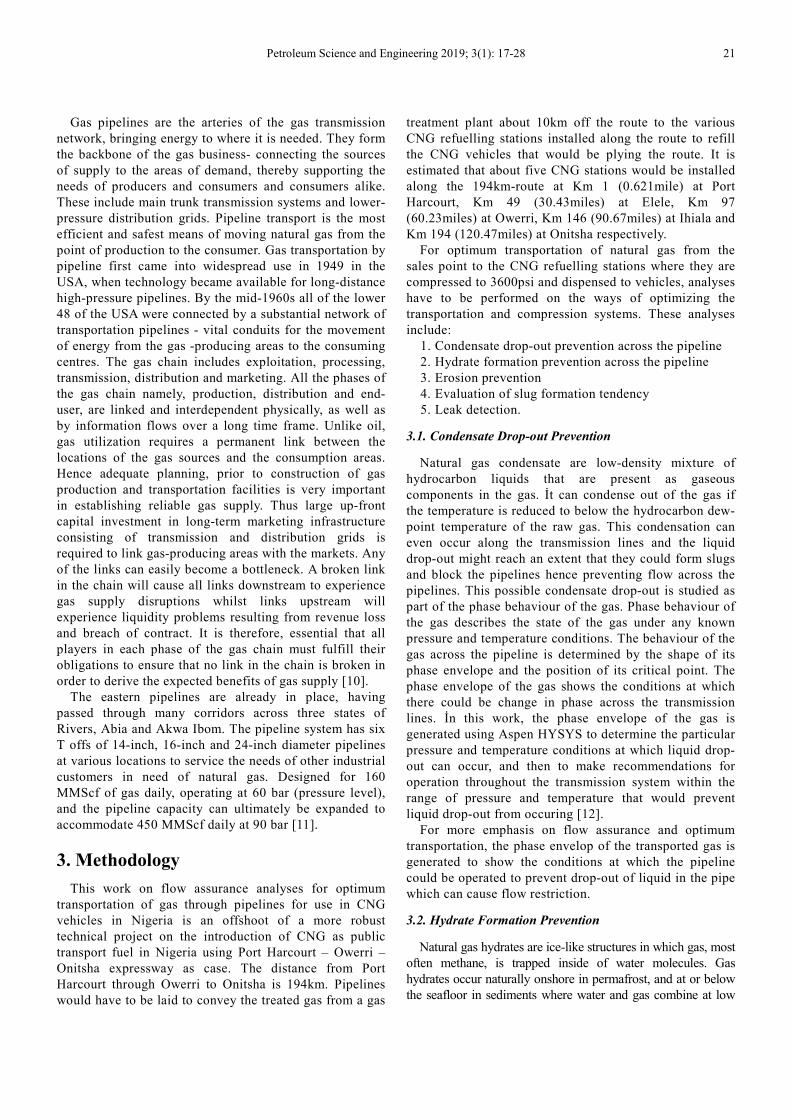
Figure 6 shows the results of the HYSYS determined critical pressure and temperature, critical condensation temperature (cricondentherm) and pressure (cricondenbar).
Figure 6. Results of Critical Condensation Points read from the Phase Envelope
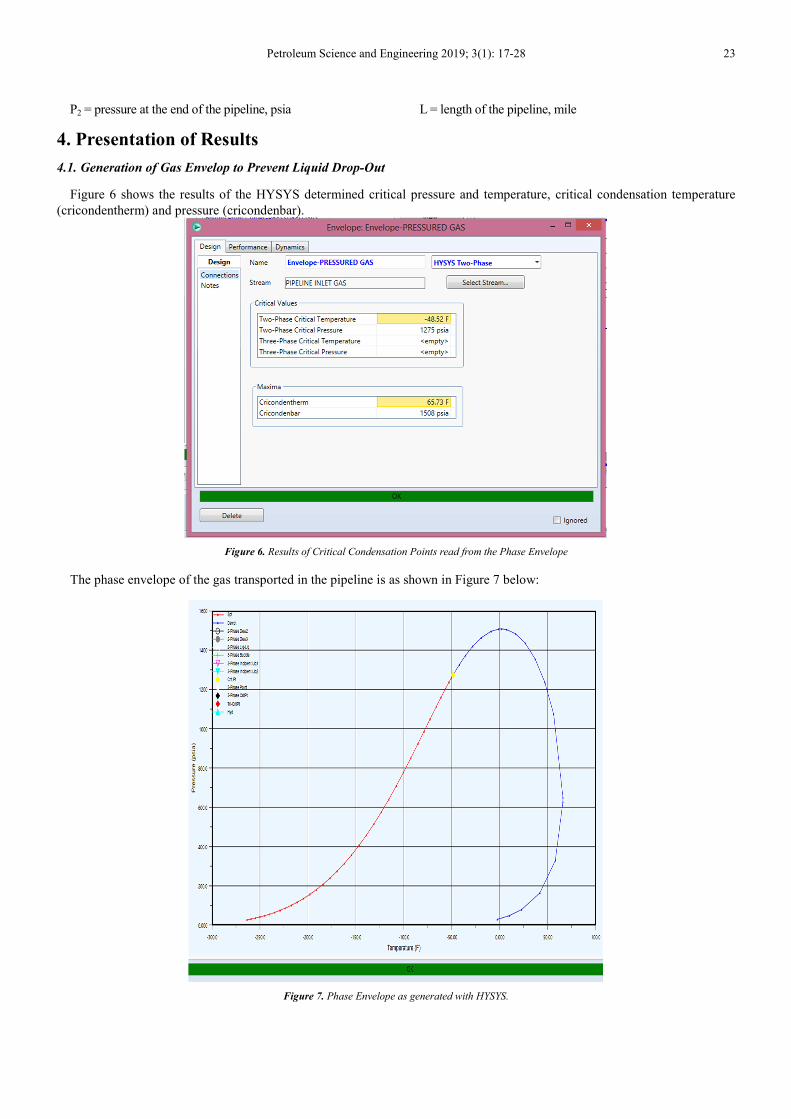
The phase envelope of the gas transported in the pipeline is as shown in Figure 7 below:
Figure 7. Phase Envelope as generated with HYSYS.

24 Igbojionu Anthony et al.: Flow Assurance Analyses for Optimum Pipeline Transportation of Gas for Use in CNG Vehicles in Nigeria
4.2. Generation of Hydrate Formation Plot to Prevent Hydrate Formation
PVTP was used to generate the hydrate formation plot of the gas in the pipeline. Figure 8 shows the PVTP data input interface for the hydrate formation prediction.
Figure 8. PVTP Hydrate Prediction Data Input Interface.
The table of values of hydrate formation pressure against temperature generated with PVTP is as shown in Figure 9.
Figure 9. Hydrate Formation Pressures at various Temperatures.
The hydrate formation plot is as shown in Figure 10 below.

Petroleum Science and Engineering 2019; 3(1): 17-28 25
Figure 10. Hydrate Formation Plot.
4.3. Generation of Velocity Profile Plot to Prevent Pipeline Erosion
Figure 11 shows the velocity profile of the gas along the pipeline together with the erosional velocity of the pipe.
Figure 11. Velocity Profile and Erosional Velocity of the Pipe.
4.4. Evaluation of Slug Formation Tendency
Figure 12 shows that the gas will continue to flow in single phase across the pipeline and no slug would form.
26 Igbojionu Anthony et al.: Flow Assurance Analyses for Optimum Pipeline Transportation of Gas for Use in CNG Vehicles in Nigeria
Figure 12. Slug Analysis.
4.5. Pressure Profile of the Pipeline
Table 1 shows the pressure profile of the pipeline as tabulated.
Table 1. Values of Pressures across the Pipeline.
Distance (ft) Pressure (psia) Temperature (F)
0.0000 32.62 179.9 1.339e+005 32.11 179.9 2.677e+005 31.60 179.9 4.016e+005 31.08 179.9 5.354e+005 30.54 179.9 6.693e+005 30.00 179.9
Figure 13 is the pressure profile plot.
Figure 13. Plot of Pressure Profile along the Pipe Length.

Petroleum Science and Engineering 2019; 3(1): 17-28 27
5. Recommendations Based on the Flow
Assurance Analyses Results
From Figures 6 and 7, the recommendations that can be made are that the pipeline should be insulated to prevent any form of ambient condition influence on the gas inside the pipeline. Any operation within the phase envelope should be avoided. The temperature of the gas is not expected to fall below the cricondentherm which is 65.730F to ensure that 2-phase flow does not occur in the pipeline. Once the temperature of the gas goes below this 65.730F, there would be liquid drop-out in the pipeline.
The recommendations that are made from Figure 10 are that the temperature and pressure of the gas in the pipeline should always be outside the hydrate curve. Any operation within the curve would cause hydrate to form. For example, at the pressure of 153.7psig, the temperature of the gas in the pipeline should be kept above 24.70F to prevent hydrate formation.
From Figure 11, it is easily seen that the erosional velocity is very close to zero while the velocity profile along the pipe length is far higher above the erosional velocity. This is only a guarantee that there is no possibility of erosion occurring in the pipelines since across the pipe length the velocity never falls to the level of the erosional velocity.
From Figure 12, it is seen that slug cannot form at the existing conditions of the pipeline as the status of the gas at various lengths across the pipeline is reported as single phase.
It is also noticed that detection of leaks in pipelines is way too simple, thanks to the application of the pressure profile which represents the normal and supposed pressure the gas would be exerting at any point on the pipeline and makes it easy for the engineer to detect leak once the gauge installed at any point on the pipeline reads pressure that is different from what is obtainable according to the pressure profile. The pressure profile is the red line in Figure 13. From Figure 13 and Table 1, it is easily seen that leak detection is made easier by, installing 5 pressure gauges at 133900ft, 267700ft, 401600ft, 535400ft and 669300ft - five points on the length of the pipe with pressures of 32.11psia, 31.60psia, 31.08psia, 30.54psia and 30psia respectively as seen from Figure 13. If the pressure for instance measured at 267700ft of the length of the pipe is 31.60psia and that measured at 401600ft of pipe length is 30.98psia instead of the 31.08psia read using the pressure profile, then there must have been leakage of gas from the pipeline between 267700ft and that 401600ft.
6. Conclusions
Flow assurance analyses for optimum transportation of gas through pipelines for use in CNG vehicles in Nigeria using Port Harcourt – Onitsha expressway as case was conducted in this work. From the analyses conducted, it can be concluded that: these flow assurance parameters and tests are highly indispensable in gas transportation as the results of the analyses
help the engineer to apply all precautionary measures to ensure that solids or liquids do not deposit in the pipeline; condensate drop-out would not occur within the pipeline so long as the operating conditions remain outside the phase envelop, ie at the operating pressures of the gas in the pipeline, the temperature does not fall below the cricondentherm temperature, 65.730F; the temperature and pressure of the gas in the pipeline should always be outside the hydrate curve to avoid possible hydrate formation; there is no possibility of erosion occurring in the pipelines since across the pipe length the velocity never falls to the level of the erosional velocity; slug cannot form at the existing conditions of the pipeline as the status of the gas at various lengths across the pipeline is reported as single phase; with proper application of the pressure profile, detection of leaks in pipelines is way too simple.
References
[1] Campbell, J. M. (2004). Gas Conditioning and Processing: The Basic Principles. John M. Campbell and Company, vol. 1, 1215 Crossroads Blvd; Norman, Oklahoma, U. S. A. 73072.
[2] Brown, M. R. (1990). Large Capacity Separators More Susceptible to Foam Problem. Report of National Tank Co. Tulsa, OK, 28th September, 60.
[3] Eromosele, N. (1995). Accounting for Petroleum and Petrochemical Operations. The Napter Quarterly Magazine of the NNPC, vol xxvi, No. 1, First Quarter.
[4] Gaius-Obaseki, J. E. (2001). CNG as an Alternative Fuel for Nigeria. A Lead Paper Presented at NAICE of SPE, Abuja, August 6-8.
[5] Hauseh, G. W. (1986). Tower Packing in the Gas Processing Industry. 36th Cond. Conference, 3rd March, 1986, UNI-OKLa, Norman, Oklahoma.
[6] Maddox, R. N (1974). Gas and Liquid Sweetening. 2nd Edition Norman, OK: Campbell Petroleum Series, 1974.
[7] Abdel-Aal, H. K., Aggour, M. &Fahim, M. A. (2003). Petroleum and Gas Field Processing. Marcel Dekker Inc; New York Basel: 317 – 329.
[8] Tobin, J. and Shambaugh, P. (2006). Natural Gas Processing: The Crucial Link between Natural Gas Production and its Transportation to Market. Energy Information Administration EIA), Office of Oil and Gas, January 2006.
[9] Mearkeltor, K. (2011). Natural Gas Sweetening Process Design. School of Doctoral Studies (European Union) Journal, 2011.
[10] NGC (2010). Nigeria Gas Company Limited Report. 2010.
[11] Igbojionu, A. C. and Dosunmu, A. (2001). Utilization of Natural Gas as Automotive Fuel in Nigeria. A Corporate Paper presented at NAICE of SPE, Abuja, Nigeria, August, 6-8.
[12] Aspen HYSYS (2013). HYSYS Version V3.2. Aspen Technology Incorporated, www.aspentech.com.
[13] Petroleum Experts Limited (2013). PVTP – Fluid Thermodynamics Package. PVTP Version 9.5. www.petex.com.

28 Igbojionu Anthony et al.: Flow Assurance Analyses for Optimum Pipeline Transportation of Gas for Use in CNG Vehicles in Nigeria
[14] Muammer, A. A. A. (2013). Slug Velocity Measurement and Flow Regime Recognition by Using Acoustic Emission Technology. PhD Thesis, School of Engineering, Cranfield University College Road, Cranfield MK43 0AL, United Kingdom, July, 2013.
[15] American Petroleum Institute (2007). Pipeline Recommended Practices (RP). Retrieved 2018/09/09 www.api.org.
[16] Ukwujiagu, C. M. (2015). Evaluation of a Depleted Oil Reservoir for Natural Gas Transmission System. Thesis Submitted to the Department of Petroleum Engineering, Federal University of Technology, Owerri, in Partial Fulfillment of the Requirement for the Award of Master of Engineering (M. Eng) Petroleum Engineering.


![Trustworthy analyses of online A/B testshqxu/dae2017/presentations/Lu_Jiannan.pdf · A/B Testing at Scale: Accelerating Software Innovation. SIGIR'17. Experimentation pipeline[3]](https://static.fdocuments.in/doc/165x107/600869353adb86487616ee5c/trustworthy-analyses-of-online-ab-hqxudae2017presentationslujiannanpdf-ab.jpg)