FloTree: A Multi-touch Interactive Simulation of...
4
FloTree: A Multi-touch Interactive Simulation of Evolutionary Processes Abstract We present FloTree, a multi-user simulation that illustrates key dynamic processes underlying evolutionary change. Our intention is to create a informal learning environment that links micro-level evolutionary processes to macro-level outcomes of speciation and biodiversity. On a multi-touch table, the simulation represents change from generation to generation in a population of organisms. By placing hands or arms on the surface, visitors can add environmental barriers, thus interrupting the genetic flow between the separated populations. This results in sub-populations that accumulate genetic differences independently over time, sometimes leading to the formation of new species. Learners can morph the result of the simulation into a corresponding phylogenetic tree. The free-form hand and body touch gestures invite creative input from users, encourages social interaction, and provides an opportunity for deep engagement. Author Keywords Interactive, simulation, population genetics, evolution ACM Classification Keywords H5.2: User Interfaces. - Graphical user interfaces. Permission to make digital or hard copies of all or part of this work for personal or classroom use is granted without fee provided that copies are not made or distributed for profit or commercial advantage and that copies bear this notice and the full citation on the first page. To copy otherwise, or republish, to post on servers or to redistribute to lists, requires prior specific permission and/or a fee. ITS’12, November 11–14, 2012, Cambridge, Massachusetts, USA. Copyright 2012 ACM 978-1-4503-1209-7/12/11...$10.00. Kien Chuan Chua 1, 2 [email protected] Yongqiang Qin 1, 3 [email protected] Florian Block 1 [email protected] Brenda Phillips 1 [email protected] Judy Diamond 4 j[email protected] E. Margaret Evans 5 [email protected] Michael S. Horn 6 [email protected] Chia Shen 1 [email protected] 1 School of Engineering and Applied Sciences, Harvard University Cambridge, 02138 USA. 2 Department of Computer Science, National University of Singapore 117417 Singapore. 3 Department of Computer Science, Tsinghua University Beijing, 100084 China. 4 University of Nebraska State Museum Lincoln, 68588 USA. 5 Center for Human Growth & Development, University of Michigan Ann Arbor, 48109 USA. 6 Computer Science and Learning Sciences, Northwestern University Evanston, 60208 USA Figure 1. FloTree interactively simulates evolutionary processes at the population-level (top), and then links to the species-level (middle). The bottom figure shows visitors interacting with FloTree.
Transcript of FloTree: A Multi-touch Interactive Simulation of...

FloTree: A Multi-touch Interactive Simulation of Evolutionary Processes
Abstract We present FloTree, a multi-user simulation that illustrates key dynamic processes underlying evolutionary change. Our intention is to create a informal learning environment that links micro-level evolutionary processes to macro-level outcomes of speciation and biodiversity. On a multi-touch table, the simulation represents change from generation to generation in a population of organisms. By placing hands or arms on the surface, visitors can add environmental barriers, thus interrupting the genetic flow between the separated populations. This results in sub-populations that accumulate genetic differences independently over time, sometimes leading to the formation of new species. Learners can morph the result of the simulation into a corresponding phylogenetic tree. The free-form hand and body touch gestures invite creative input from users, encourages social interaction, and provides an opportunity for deep engagement.
Author Keywords Interactive, simulation, population genetics, evolution
ACM Classification Keywords H5.2: User Interfaces. - Graphical user interfaces.
Permission to make digital or hard copies of all or part of this work for personal or
classroom use is granted without fee provided that copies are not made or distributed for
profit or commercial advantage and that copies
bear this notice and the full citation on the first page. To copy otherwise, or republish, to post
on servers or to redistribute to lists, requires prior specific permission and/or a fee.
ITS’12,November 11–14, 2012, Cambridge, Massachusetts, USA. Copyright 2012 ACM 978-1-4503-1209-7/12/11...$10.00.
Kien Chuan Chua1, 2 [email protected] Yongqiang Qin1, 3 [email protected] Florian Block1 [email protected] Brenda Phillips1 [email protected] Judy Diamond4 [email protected] E. Margaret Evans5 [email protected] Michael S. Horn6 [email protected] Chia Shen1 [email protected]
1 School of Engineering and Applied Sciences, Harvard University Cambridge, 02138 USA. 2 Department of Computer Science, National University of Singapore 117417 Singapore. 3 Department of Computer Science, Tsinghua University Beijing, 100084 China. 4 University of Nebraska State Museum Lincoln, 68588 USA. 5 Center for Human Growth & Development, University of Michigan Ann Arbor, 48109 USA. 6 Computer Science and Learning Sciences, Northwestern University Evanston, 60208 USA
Figure 1. FloTree interactively simulates evolutionary processes at the population-level (top), and then links to the species-level (middle). The bottom figure shows visitors interacting with FloTree.

General Terms Design, Human Factors
Introduction Conveying concepts of evolutionary biology to the general public is a key feature of many natural history exhibits. One challenge to understanding evolution is grasping how micro-evolution—processes at the population level—and macro-evolution—speciation and biodiversity—are connected [2]. One way in which speciation might occur is through geographic isolation. Over time populations are split, preventing them from interbreeding, which interrupts the exchange of genetic material. Gradually, the separated sub-populations accumulate genetic differences that may eventually result in separate species. These processes lead to the biodiversity seen on earth today, which is often represented by evolutionary trees (Fig. 2).
Although other interactive applications have focused on helping the general public understand population-level processes [1] and speciation [4], conveying the link between micro- and macro-evolution remains a challenge [2].
In this demo, we present FloTree−a collaborative museum exhibit deployed on a multi-touch tabletop. The FloTree allows visitors to experiment with simulated populations to see how such interactions can lead to the emergence of new species. Visitors experience the relationship between micro- and macro-evolutionary processes firsthand. The following sections describe the FloTree exhibit, interaction design and implementation.
The FloTree Exhibit As museum visitors approach the exhibit, they see colorful animated dots spreading across the display (Fig. 1, top). The dots emerge from the bottom of the screen and repeatedly “produce” new lines of dots that steadily “grow” upward. Each dot appears to emerge from a dot in the previous group, to which it stays connected (Fig. 3, bottom).
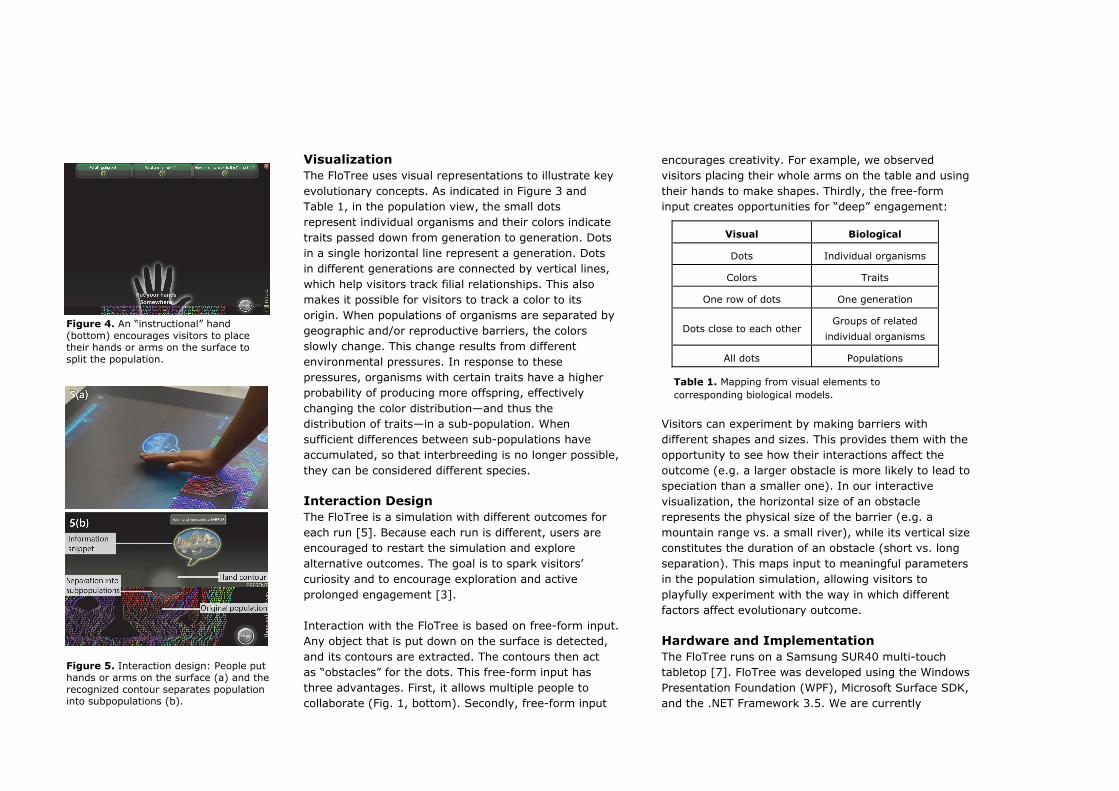
As visitors observe the emerging pattern, virtual “instructional” hands appear on the screen (Fig. 4) encouraging visitors to put their hands or arms somewhere on the surface (Fig. 1, bottom). As visitors’ hands touch the table they split a single column into two—creating two independent groups of growing dots (Fig. 5). As long as groups of dots remain separated, color patterns on each side of the hand start to change. If hands are removed prematurely, both columns of dots merge back into a single population, eventually converging to a uniform color pattern. If the hands remain in place for a time, the color patterns diverge, and the two independent columns will no longer merge, even after the hand are released. This process can be repeated until all columns have reached the top of the screen.
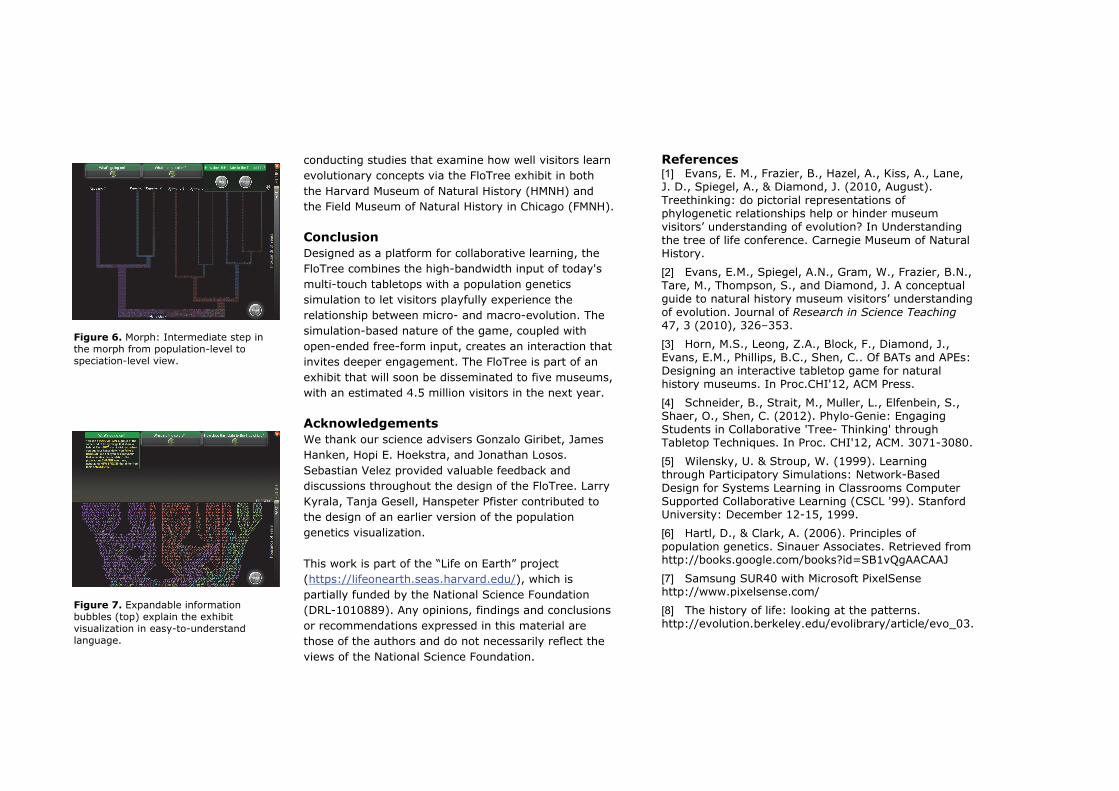
After each simulation run, visitors are presented with a “Tree” button. When the button is pressed, the pattern of dots merge into a solid area (Fig. 6), which then morphs into a phylogenetic tree (Fig. 1, middle). Visitors can then switch back and forth between the “population” view and the “tree” view. Visitors are also presented with expandable information bubbles (Fig. 7) that explain the exhibit visualization (e.g. “What’s going on?”, “What are the colors?”).
Figure 3. Population view: Organisms give birth to new generations that spread upwards on the display. The lines between organisms indicate lineages.
Figure 2. A phylogenetic tree illustrating the macro-evolutionary descent of species.
Visual Biological
Dots Individual organisms
Colors Traits
One row of dots One generation
Dots close to each other Groups of related
individual organisms
All dots Populations
Table 1. Mapping from visual elements to corresponding biological models.
Visualization The FloTree uses visual representations to illustrate key evolutionary concepts. As indicated in Figure 3 and Table 1, in the population view, the small dots represent individual organisms and their colors indicate traits passed down from generation to generation. Dots in a single horizontal line represent a generation. Dots in different generations are connected by vertical lines, which help visitors track filial relationships. This also makes it possible for visitors to track a color to its origin. When populations of organisms are separated by geographic and/or reproductive barriers, the colors slowly change. This change results from different environmental pressures. In response to these pressures, organisms with certain traits have a higher probability of producing more offspring, effectively changing the color distribution—and thus the distribution of traits—in a sub-population. When sufficient differences between sub-populations have accumulated, so that interbreeding is no longer possible, they can be considered different species.
Interaction Design The FloTree is a simulation with different outcomes for each run [5]. Because each run is different, users are encouraged to restart the simulation and explore alternative outcomes. The goal is to spark visitors’ curiosity and to encourage exploration and active prolonged engagement [3].
Interaction with the FloTree is based on free-form input. Any object that is put down on the surface is detected, and its contours are extracted. The contours then act as “obstacles” for the dots. This free-form input has three advantages. First, it allows multiple people to collaborate (Fig. 1, bottom). Secondly, free-form input
encourages creativity. For example, we observed visitors placing their whole arms on the table and using their hands to make shapes. Thirdly, the free-form input creates opportunities for “deep” engagement:
Visitors can experiment by making barriers with different shapes and sizes. This provides them with the opportunity to see how their interactions affect the outcome (e.g. a larger obstacle is more likely to lead to speciation than a smaller one). In our interactive visualization, the horizontal size of an obstacle represents the physical size of the barrier (e.g. a mountain range vs. a small river), while its vertical size constitutes the duration of an obstacle (short vs. long separation). This maps input to meaningful parameters in the population simulation, allowing visitors to playfully experiment with the way in which different factors affect evolutionary outcome.
Hardware and Implementation The FloTree runs on a Samsung SUR40 multi-touch tabletop [7]. FloTree was developed using the Windows Presentation Foundation (WPF), Microsoft Surface SDK, and the .NET Framework 3.5. We are currently
Figure 4. An “instructional” hand (bottom) encourages visitors to place their hands or arms on the surface to split the population.
Figure 5. Interaction design: People put hands or arms on the surface (a) and the recognized contour separates population into subpopulations (b).
conducting studies that examine how well visitors learn evolutionary concepts via the FloTree exhibit in both the Harvard Museum of Natural History (HMNH) and the Field Museum of Natural History in Chicago (FMNH).
Conclusion Designed as a platform for collaborative learning, the FloTree combines the high-bandwidth input of today's multi-touch tabletops with a population genetics simulation to let visitors playfully experience the relationship between micro- and macro-evolution. The simulation-based nature of the game, coupled with open-ended free-form input, creates an interaction that invites deeper engagement. The FloTree is part of an exhibit that will soon be disseminated to five museums, with an estimated 4.5 million visitors in the next year.
Acknowledgements We thank our science advisers Gonzalo Giribet, James Hanken, Hopi E. Hoekstra, and Jonathan Losos. Sebastian Velez provided valuable feedback and discussions throughout the design of the FloTree. Larry Kyrala, Tanja Gesell, Hanspeter Pfister contributed to the design of an earlier version of the population genetics visualization.
This work is part of the “Life on Earth” project (https://lifeonearth.seas.harvard.edu/), which is partially funded by the National Science Foundation (DRL-1010889). Any opinions, findings and conclusions or recommendations expressed in this material are those of the authors and do not necessarily reflect the views of the National Science Foundation.
References [1] Evans, E. M., Frazier, B., Hazel, A., Kiss, A., Lane, J. D., Spiegel, A., & Diamond, J. (2010, August). Treethinking: do pictorial representations of phylogenetic relationships help or hinder museum visitors’ understanding of evolution? In Understanding the tree of life conference. Carnegie Museum of Natural History. [2] Evans, E.M., Spiegel, A.N., Gram, W., Frazier, B.N., Tare, M., Thompson, S., and Diamond, J. A conceptual guide to natural history museum visitors’ understanding of evolution. Journal of Research in Science Teaching 47, 3 (2010), 326–353. [3] Horn, M.S., Leong, Z.A., Block, F., Diamond, J., Evans, E.M., Phillips, B.C., Shen, C.. Of BATs and APEs: Designing an interactive tabletop game for natural history museums. In Proc.CHI'12, ACM Press. [4] Schneider, B., Strait, M., Muller, L., Elfenbein, S., Shaer, O., Shen, C. (2012). Phylo-Genie: Engaging Students in Collaborative 'Tree- Thinking' through Tabletop Techniques. In Proc. CHI'12, ACM. 3071-3080. [5] Wilensky, U. & Stroup, W. (1999). Learning through Participatory Simulations: Network-Based Design for Systems Learning in Classrooms Computer Supported Collaborative Learning (CSCL '99). Stanford University: December 12-15, 1999.
[6] Hartl, D., & Clark, A. (2006). Principles of population genetics. Sinauer Associates. Retrieved from http://books.google.com/books?id=SB1vQgAACAAJ
[7] Samsung SUR40 with Microsoft PixelSense http://www.pixelsense.com/ [8] The history of life: looking at the patterns. http://evolution.berkeley.edu/evolibrary/article/evo_03.
Figure 6. Morph: Intermediate step in the morph from population-level to speciation-level view.
Figure 7. Expandable information bubbles (top) explain the exhibit visualization in easy-to-understand language.