Florida Transit Information System (FTIS) Version...
167
Transcript of Florida Transit Information System (FTIS) Version...


ACKNOWLEDGEMENTS
The development of FTIS is supported by the Public Transit Office (PTO) of the Florida Department of Transportation (FDOT). Ike Ubaka, AICP, of the PTO serves as the project manager and was closely involved in the FTIS software specification and verification. Albert Gan, Assistant Professor of Civil Engineering at the Florida International University (FIU), integrated the multiple-year NTD database and serves as the software designer. Jun Zheng and Kaiyu Liu, both computer specialists with the FIU Lehman Center for Transportation Research (LCTR), performed most of the software coding. Shangling Ding designed the FTIS homepage (http://www.eng.fiu.edu/LCTR/Ftis/ftis.htm). The following graduate students at the LCTR helped with various development tasks, including software testing, help facility development, and data preparation (in alphabetical order): Dong Chen, Eman Gomaa, Sijong Jo, Emani Saraswathi, Joan Shen, Yifei Wu, Allan Yue, Aaron Zhou, and Peng Zhu. The assistance of many individuals who reviewed the software and provided the data and feedback is gratefully acknowledged.

TABLE OF CONTENTS
SECTION 1. INTRODUCTION.................................................................................................1-1
What is FTIS?...........................................................................................................................1-1Why FTIS?...............................................................................................................................1-1FTIS Components and Data.....................................................................................................1-1Distribution...............................................................................................................................1-2Program History, Versions, and Updates.................................................................................1-3What’s New in Version 2003...................................................................................................1-4
INTDAS...............................................................................................................................1-4FTGIS...................................................................................................................................1-4
Installing FTIS..........................................................................................................................1-4
CD-ROM Version................................................................................................................1-4Web Version.........................................................................................................................1-5
Minimum System Requirements..............................................................................................1-6Technical Support and Problem Report...................................................................................1-6User-Interface Conventions......................................................................................................1-6
SECTION 2. INTDAS................................................................................................................2-1
What is NTD?...........................................................................................................................2-1Why INTDAS?.........................................................................................................................2-1INTDAS Features.....................................................................................................................2-2INTDAS Data Variables..........................................................................................................2-2
Original NTD Variables.......................................................................................................2-3Florida Standard Performance Variables.............................................................................2-5User-Defined Variables......................................................................................................2-13
Creating, Modifying, or Deleting a Variable.........................................................................2-14Minimum User Input to Retrieve NTD Data.........................................................................2-16Selecting Data Years and Service Types................................................................................2-18Selecting Transit Systems......................................................................................................2-18
Selecting Transit Systems by System Variables................................................................2-18Selecting Transit Systems by Query..................................................................................2-20Selecting Transit Systems by System Groups....................................................................2-23
iii

Limiting Your Output Systems to a Fixed Number...............................................................2-24Selecting States for Statewide Data.......................................................................................2-26Selecting Data Variables........................................................................................................2-27
Selecting Variables by NTD Forms...................................................................................2-27Selecting Variables by Variable List..................................................................................2-28Selecting Variables by Variable Group..............................................................................2-30
Saving System and Variable Selections.................................................................................2-30Viewing Retrieved NTD Data................................................................................................2-31
Viewing Retrieved Data by NTD Forms............................................................................2-31Viewing Retrieved Data by Standard Reports...................................................................2-32Viewing Retrieved Data by Tables and Graphs.................................................................2-34
Applying Functions in Flat Table View.................................................................................2-35
Sorting Tabulated Data.......................................................................................................2-37Computing Table Statistics................................................................................................2-38Performing Regression Analysis........................................................................................2-38Find Relationships Among All Variables..........................................................................2-39Computing Aggregate Data................................................................................................2-41Creating New Variables.....................................................................................................2-42Adjusting for Inflation........................................................................................................2-43Transferring Tabulated Data..............................................................................................2-44
Creating Cross Tables............................................................................................................2-44Plotting Tabulated Data..........................................................................................................2-47Displaying Thematic Maps for Statewide Data.....................................................................2-48Automated Peer Selection......................................................................................................2-49
Old Florida Peer Selection Method....................................................................................2-50Find Your Peer Systems.....................................................................................................2-52Create Multiple Peer Groups..............................................................................................2-57
SECTION 3. FTGIS...................................................................................................................3-1
Why FTGIS?............................................................................................................................3-1Getting Started..........................................................................................................................3-1FTGIS Functions......................................................................................................................3-3GIS Data Included....................................................................................................................3-4Map Legend, Map View, and Table View...............................................................................3-8Save and Retrieve Workspaces..............................................................................................3-10Map Properties.......................................................................................................................3-12Layer Properties.....................................................................................................................3-13Describe Layer.......................................................................................................................3-15
iv

Remove Active or All Layers.................................................................................................3-15Image Background.................................................................................................................3-16Change Feature Color at Mouse Cursor.................................................................................3-16Toolbar Commands................................................................................................................3-17Map Printing...........................................................................................................................3-18Add Layer...............................................................................................................................3-19Graphics.................................................................................................................................3-20Map Editing............................................................................................................................3-21Set Snapping Tolerance..........................................................................................................3-25Measure Distance...................................................................................................................3-25Identify...................................................................................................................................3-26Find.........................................................................................................................................3-27Buffer Zone Analysis.............................................................................................................3-28Create Charts..........................................................................................................................3-32Create New Variable by Formula Setup................................................................................3-33Create Thematic Maps...........................................................................................................3-34Add Label...............................................................................................................................3-35Clear All.................................................................................................................................3-36Select Features........................................................................................................................3-37
SECTION 4. MISCELLANEOUS COMPONENTS............................................................. 4-1
TAMS.......................................................................................................................................4-1
Working with TAMS Database............................................................................................4-1Submitting Database to FDOT.............................................................................................4-3
FTPLib.....................................................................................................................................4-3FTPLinks..................................................................................................................................4-3Contact.....................................................................................................................................4-4Report Problem........................................................................................................................4-5Help..........................................................................................................................................4-6Exit...........................................................................................................................................4-7
v

SECTION 1 INTRODUCTION
INTRODUCTION
This guide provides detailed guidance on how to use the various component programs in the Florida Transit Information System (FTIS) effectively. It assumes that the user is familiar with the general operation of Microsoft Windows. For general help on using Windows such as managing the environment, the file system and printing, refer to the Microsoft Windows User’s Guide.
What is FTIS?FTIS is a user-friendly software tool that contains two major program components:
A database system for the retrieval and analysis of the 1984-2001 National Transit Database (NTD) for all U.S. transit systems that reported data to the Federal Transit Administration (FTA).
A stand-alone GIS system customized for transit planning for Florida transit systems.
Why FTIS?Transit agencies rely on various sources of data to help plan, manage, and improve transit facilities and services. Examples of these data include the NTD data from the FTA, socioeconomic data from the Census Bureau and planning agencies, transit route and stops data from transit agencies, etc. Although these data are available for use by transit agencies, they are not easily accessible to the general users. FTIS is designed to improve the accessibility of these data by integrating the different data components into a common data depository and developing user-friendly, customized functions for easy data retrieval and analysis.
FTIS Components and DataFTIS consists of the following system components and data:
1-1

SECTION 1 INTRODUCTION
Integrated National Transit Database Analysis System (INTDAS). This component allows easy retrieval and analysis of the 1984-2001 NTD data of all U.S. transit systems that reported to the FTA for the National Transit Database.
Florida Transit Planning Geographic Information System (FTGIS). This component contains the GIS shape files, including streets, routes, stops, TAZ, and census tract, for all Florida transit systems.
Transit Asset Management System (TAMS). This component allows users to enter and submit transit asset data to FDOT.
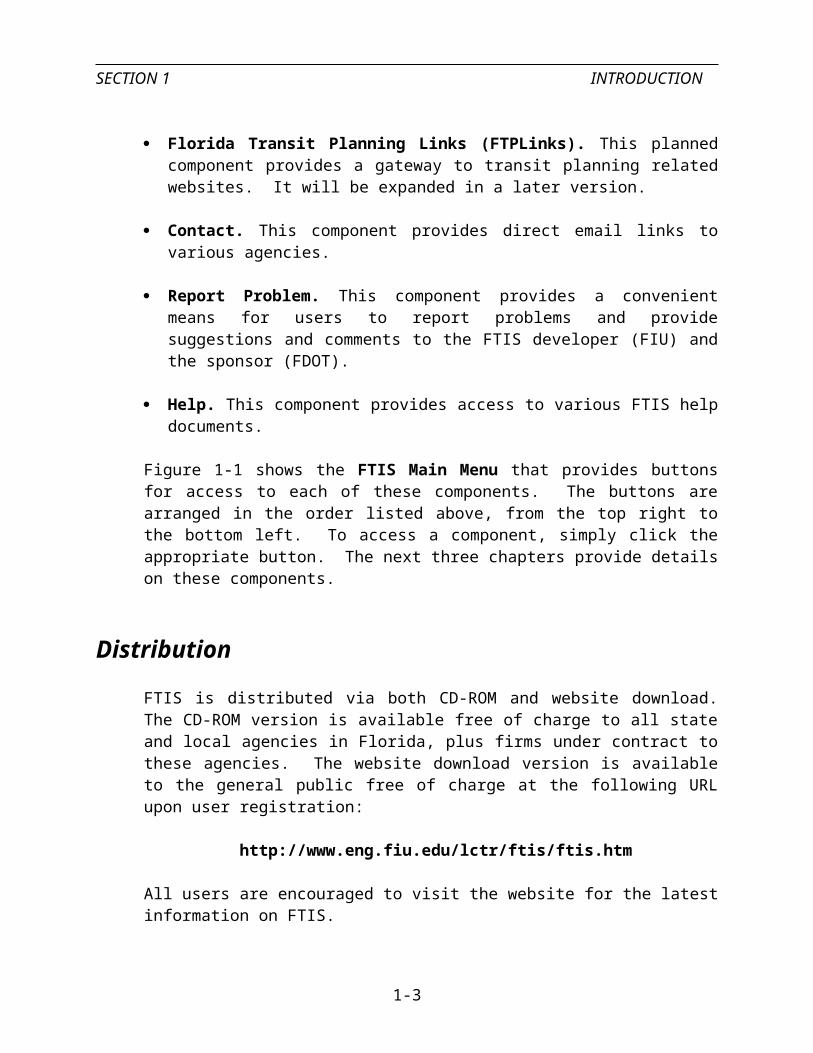
Florida Transit Planning Library (FTPLib). This planned component provides quick access to electronic publications related to transit planning. Only a small number of publications are included in this initial version. It will be expanded in a later version in terms of the number of publications, interface, and functionalities.
Florida Transit Planning Links (FTPLinks). This planned component provides a gateway to transit planning related websites. It will be expanded in a later version.
Contact. This component provides direct email links to various agencies.
Report Problem. This component provides a convenient means for users to report problems and provide suggestions and comments to the FTIS developer (FIU) and the sponsor (FDOT).
Help. This component provides access to various FTIS help documents.
Figure 1-1 shows the FTIS Main Menu that provides buttons for access to each of these components. The buttons are arranged in the order listed above, from the top right to the bottom left. To access a component, simply click the appropriate button. The next three chapters provide details on these components.
DistributionFTIS is distributed via both CD-ROM and website download. The CD-ROM version is available free of charge to all state and local agencies in Florida, plus firms under contract to these agencies. The website download version is available to the general public free of charge at the following URL upon user registration:
http://www.eng.fiu.edu/lctr/ftis/ftis.htm
All users are encouraged to visit the website for the latest information on FTIS.
1-2

SECTION 1 INTRODUCTION
Figure 1-1: FTIS Main Menu
Program History, Versions, and UpdatesFTIS was first released in April 2002 on a CD-ROM. Although the first version contains only up to the year 2000 NTD data, it was titled “FTIS 2001” in order to be consistent with the latest NTD data release year. This has created some confusion for some users who wondered if the version they received in 2002 was already outdated. To avoid this confusion, the second version, released in 2003, is titled “FTIS 2003”.
Current plans call for FTIS to be released annually. Interim versions are available from the FTIS homepage at http://www.eng.fiu.edu/lctr/ftis/ftis.htm. An additional alphabet is added to interim versions. For example, the first interim version for the 2003 release will be “2003a”.
The annual FTIS release date is scheduled to follow the annual release of the NTD data. The exact release date depends on how soon the new NTD data can be incorporated into FTIS, which, in turn, depends on the amount of changes in data structure in the new NTD.
1-3
SECTION 1 INTRODUCTION
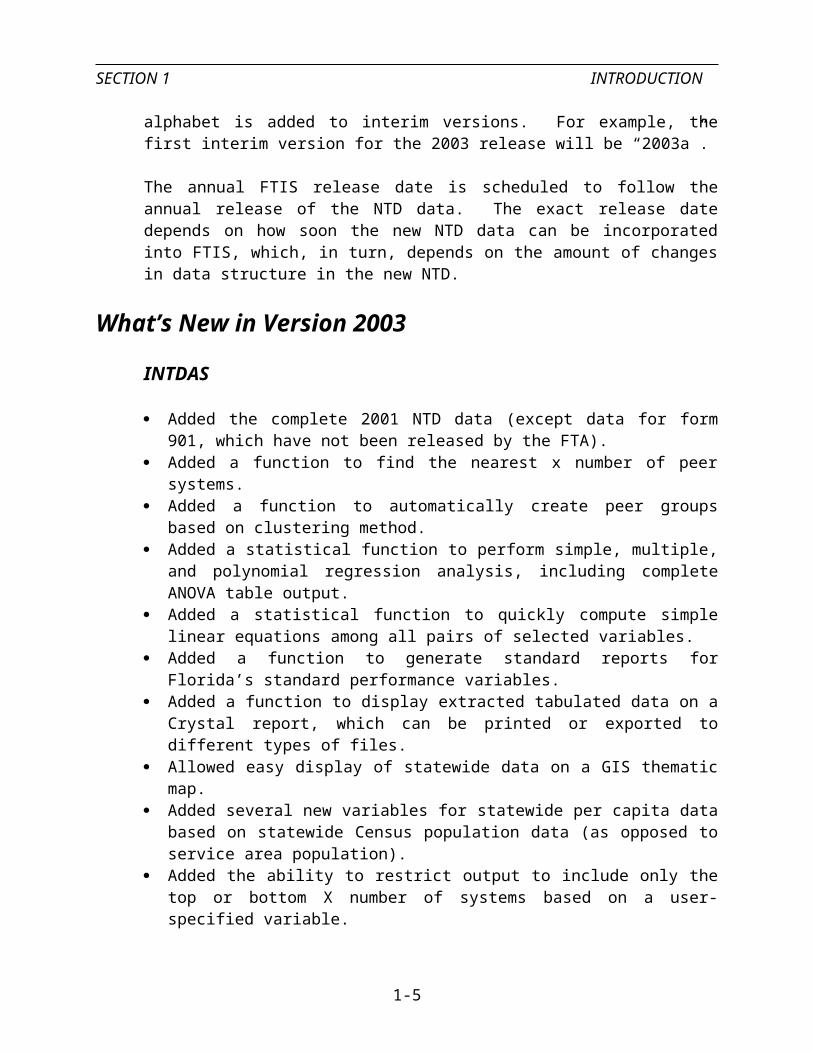
What’s New in Version 2003INTDAS
Added the complete 2001 NTD data (except data for form 901, which have not been released by the FTA).
Added a function to find the nearest x number of peer systems. Added a function to automatically create peer groups based on clustering method. Added a statistical function to perform simple, multiple, and polynomial regression
analysis, including complete ANOVA table output. Added a statistical function to quickly compute simple linear equations among all
pairs of selected variables. Added a function to generate standard reports for Florida’s standard performance
variables. Added a function to display extracted tabulated data on a Crystal report, which can be
printed or exported to different types of files. Allowed easy display of statewide data on a GIS thematic map. Added several new variables for statewide per capita data based on statewide Census
population data (as opposed to service area population). Added the ability to restrict output to include only the top or bottom X number of
systems based on a user-specified variable. Fixed a number of bugs and included miscellaneous other improvements.
FTGIS
Added over 50 socioeconomic variables from Census Summary Tape File No. 3 (STF #3).
Added the capability to save and open workspaces. Added a function to compute new values based on a formula (e.g., divide population
by area to obtain population density). Improved labeling. Added aerial images for all transit service areas in Florida (web version only). Fixed a number of bugs and included miscellaneous other improvements.
Installing FTISCD-ROM Version
Insert your FTIS CD and wait for a few seconds for the FTIS install to automatically start the FTIS setup program. Follow the instructions on the screen to complete the installation. The FTIS install includes the following three install options:
Typical. This option installs the complete FTIS system, including all NTD, GIS, and aerial image data for all transit systems. The aerial image data are included only for
1-4

SECTION 1 INTRODUCTION
the following four transit systems: Broward County Transit, Miami Dade Transit, Tallahassee Transit, and Palm Beach County Transportation Authority. This option requires a minimum of 1.4 GB of disk storage space.
Minimum. This option is similar to the Typical install, except that it does not include aerial image files. This option requires a minimum of 800 MB of disk storage space.
Custom. This option lets you choose the transit systems for which you want to install the GIS and aerial image data. This minimum required disk storage space ranges from 400 MB to 1.3 GB, depending on the number of transit systems you selected.
Note: If your computer is already installed with a version of FTIS, the install will ask if you want to remove or modify the existing version before installing another version of FTIS. It is advisable that you choose to remove the previous version.
Web Version
The web version contains exactly the same program and data as the CD-ROM version—when both are installed in full. Unlike the CD-ROM version, which has three install options, as described above, the web version divides the install files into three file groups:
1. FTIS.ZIP (140 MB): This is a ZIP file that contains all the pertinent setup and database files for the FTIS system. If you are interested in only the INTDAS component of FTIS, you only need to download this file.
2. GIS.EXE (170 MB): This is an optional self-extracting file containing all of the available GIS shape files for Florida transit agencies. If you are only interested in the INTDAS component of FTIS, you do not need this file. If this file is downloaded and resides in the main install folder, the FTIS install will prompt you to install this file.
3. Aerial Image Files: Each compressed file contains multiple aerial image files for a Florida urban area that is served by a transit system. If any of these files are downloaded to the main install folder, the FTIS install will detect the files and prompt you to install them. If you are only interested in the INTDAS component of FTIS, you do not need to download these files.
After the files are downloaded to a folder, you must first unzip the FTIS.ZIP file to the same folder. To start installing FTIS, click SETUP.EXE. Follow screen instructions to complete installation. If you have downloaded GIS.EXE or any of the aerial image files, you will be prompted to install these files. These files must be installed to your FTIS main folder. The default folder is “c:\FTIS 2003”. If you change your folder to, for example, d:\FTIS2003, then you must enter "d:\FTIS2003" in the "Unzip to folder" box when you are prompted the WinZip screen.
Minimum System Requirements
1-5
SECTION 1 INTRODUCTION
FTIS is a typical Windows installation designed to run on all Microsoft Windows operating systems. For successful installation and application of FTIS, your system must have:
A monitor capable of at least 800x600 display resolution. A minimum of 1.4 GB hard disk storage space for a full installation (CD version; web
version varies, depending on the amount of GIS and aerial images downloaded). A minimum of 70 MB storage space on the system drive (usually the C: drive).
Technical Support and Problem ReportIf you need technical support or additional information, please contact the developer through one of the following four channels:
Email your request to [email protected]. Call (305) 348-3116 for Albert Gan. Fax your request to 305 348-2802 (attention: Albert Gan). Send to: Albert Gan
Lehman Center for Transportation ResearchFlorida International UniversityUP Campus, EAS 3680Miami, Florida 33199
Note: You are encouraged to report any problems you encountered while using FTIS. You may do so using the Report Problem button on the FTIS main screen. Your comments and suggestions are also welcome.
User-Interface ConventionsThe following general conventions are used in FTIS:
If a button or a menu item is grayed out, it may be due to one of the following two reasons: (1) the needed input to execute the function has not been completely specified, and (2) the function is not applicable.
A single click on an item on the list box selects the item. Clicking a selected item will deselect the item.
In the GIS system component, a right click will return to the arrow mouse pointer from any other mouse pointers.
1-6

SECTION 2 INTDAS
INTDAS
INTDAS (Integrated National Transit Database Analysis System) is a major FTIS system component designed to facilitate the retrieval and analysis of multi-year, multi-system data from the National Transit Database (NTD).
What is NTD?
Each year, more than 500 of the nation's transit agencies report data to the FTA for inclusion in the NTD—a uniform data set required by the Urban Mass Transportation (UMT) Act as a prerequisite for the nation's transit systems to receive the FTA grant funds. Known formerly as the Section 15 database, NTD includes data on transit organization characteristics, vehicle fleet size and characteristics, revenues and subsidies, operating and maintenance costs, safety and security, vehicle fleet reliability and inventory, and services consumed and supplied. These data have been used extensively to derive values for transit performance measures and have become the sole source of standardized and comprehensive data for use by all constituencies of the transit industry.
Why INTDAS?As a major source of performance data for the transit industry, an important application of NTD has been for use in trend analyses that require multiple years of NTD data. However, accessing multiple years of NTD data is currently a very tedious process. One major reason is because NTD data are collected and distributed annually on separate files. To perform a trend analysis, for example, one must learn about the file structures that may vary from year to year, identify the specific variables of interest from the vast number of potential NTD variables, and then extract the corresponding data values from the specific files for the specific transit systems. For a ten-year trend analysis, for example, this process must be repeated ten times, one for each data year. After the trend values are separately extracted for each of the ten years, they must be entered manually into a spreadsheet or a statistical program for analysis. This process is very cumbersome and is prone to errors. Clearly, a solution to the data accessibility problem is to develop an integrated database system, such as INTDAS, that (1) combines the individual NTD data files from multiple years into a single, standardized database, and (2) provides customized tools for quick and easy data retrieval, visualization, and analysis.
2-1

SECTION 2 INTDAS
INTDAS FeaturesINTDAS is useful for both the practitioners and researchers who use the NTD data to improve transit performance and services. Although INTDAS was developed mainly for Florida, it is fully applicable to users from the other states. Major INTDAS features include:
Original NTD data for all transit systems reported to the NTD program for the 1984-2001 data years.
Statewide and systemwide NTD data for over 60 standard performance variables used in Florida.
Quick and easy retrieval of data for multiple transit systems of multiple years for trend analyses, peer comparisons, and general data inquiries.
SQL query editor for identifying transit systems that meet a certain profile. Automated peer selection process that identifies comparable transit systems for peer
analyses. Automated peer grouping to divide multiple transit systems into similar groups. Easy selection of NTD variables via NTD forms and list boxes. Create new variables from original NTD variables through user-defined formulas. Display retrieved data in tables, forms, reports, and maps. Automated VB and Excel plots. Interactive cross tables to display two variables at a time. Adjustment of financial variables to constant dollars. Create Excel and Crystal reports. Perform data sorting based single or multiple variables. Aggregate data by combinations of data year, transit system (NTD ID), mode code,
and service type. Perform regression analysis and quickly find correlated variables. Convenient data transfer, etc.
INTDAS Data VariablesINTDAS includes the following three basic groups of variables in its database:
Original NTD Variables. These are the variables for which data are submitted each year by transit agencies. Each variable corresponds to one data entry in a NTD form. In FTIS, the names for the original NTD variables are preceded by the respective NTD form numbers in brackets. For example, all variables from NTD Form 001 will be preceded by [001].
Florida Standard Performance Variables. These are the variables used in the FDOT’s annual transit performance analysis. Each of these performance variables was pre-computed based on a formula involving one or more original NTD variables. All Florida Standard Variables are preceded by [FSV].
2-2

SECTION 2 INTDAS
User-defined variables. These are variables created by users using FTIS’ formula setup function. All user-defined variables are preceded by [USER].
Important: Data for the original NTD variables are available at only the (transit) system level. Data for the Florida standard and user-defined variables are available at both the system and statewide levels.
The following subsections introduce the three groups of variables in more detail.
Original NTD Variables
NTD data were reported on a total of 16 different forms for various characteristics associated with individual transit agencies. Two of the forms are further divided into two sub-forms, called pages. The total number of data entries on these forms totals over 1000. In general, data for most of the variables are available for data years that trace back to the 1984. However, because of major changes to NTD forms and some data from different years cannot be converted to fit the latest NTD form format and are thus excluded from the INTDAS database. Table 2-1 lists all the NTD forms and the associated data years for which data are accessible in the current version of FTIS.
The original NTD variables can be divided into two categories. The first category involves variables that are used to identify transit agencies and systems. These are referred to as the system variables. They include:
A unique four-digit ID (i.e., NTD ID) that is used to identify a transit agency. For statewide data, this variable is replaced by the standard two-digit state codes (e.g., “FL” for Florida).
A mode code to identify the transit systems (motorbus, high-speed rail, etc.) operated by the transit agency.
A service type to identify whether the transit service is operated directly by the transit agency or is purchased from another company.
Because INTDAS includes NTD data from multiple years, the data must also be indexed by the NTD data year, which is considered another system variable.
2-3

SECTION 2 INTDAS
Table 2-1: NTD Forms and Available Data Years
NTD FormNumber
NTD Form Name Available Data Years (in FTIS)
001002005103203
300**301321331402403404
405 Page 1405 Page 2
406408901
Transit Agency IdentificationContractual Relationship IdentificationSupplemental InformationCapital FundingOperating FundingOperating Expenses SummaryOperating ExpensesOperators’ WagesFringe BenefitsRevenue Vehicle Maintenance and EnergyTransit Way MileageTransit Agency EmployeeTransit Safety and Security Form: Safety ItemsTransit Safety and Security Form: Security ItemsTransit Agency Service Revenue Vehicle Inventory Federal Funding Allocation Statistics
1984-2001 1993-2001 * 1984-2001 1984-2001 1984-2001 1984-2001 1984-2001 1984-2001 1984-2001 1985-2001 1992-2001 1995-2001 1995-2001*** 1984-2001 1984-2001 1984-2000****
* Data not available from FTA.** NTD reporting manuals treats this as part of Form 301 and names it as Form 301.*** Form 405 Page 2 did not exist before 1995.**** 2001 data not distributed by FTA.
Table 2-2 lists the system variables for each NTD form. This information is important for the users to understand the level of data availability. For example, the data (except total passenger fare revenue) reported in Form 203 are available at the systemwide level only.
The second category of variables consists of over 1000 data attributes that are used to record the various characteristics associated with each transit agency. Examples of these variables include service area population, unlinked passenger trips, etc.
Note: For detailed information on NTD forms and variables, refer to the NTD reporting manuals, which are accessible from the Help|NTD Report Manuals menu item in the INTDAS main menu.
2-4

SECTION 2 INTDAS
Table 2-2: NTD Forms and Stratifying System Variables
NTD Form Stratifying System Variables001002
103* 203**
300301321331402403404
405 Page 1405 Page 2
406408901
Data year, NTD IDData year, NTD IDData year, NTD ID, service typeData year, NTD IDData year, NTD IDData year, NTD ID, mode code, service typeData year, NTD ID, mode codeData year, NTD IDData year, NTD ID, mode code, service typeData year, NTD ID, mode code, service typeData year, NTD ID, mode code, service typeData year, NTD ID, mode code, service typeData year, NTD ID, mode code, service typeData year, NTD ID, mode code, service typeData year, NTD ID, mode code, service typeData year, NTD ID, mode code, service type
* Only “Uses of Capital Funds” is reported by mode code. ** Only directly-operated passenger fare revenue is reported by mode code. The reporting of this information is optional.
Florida Standard Performance Variables
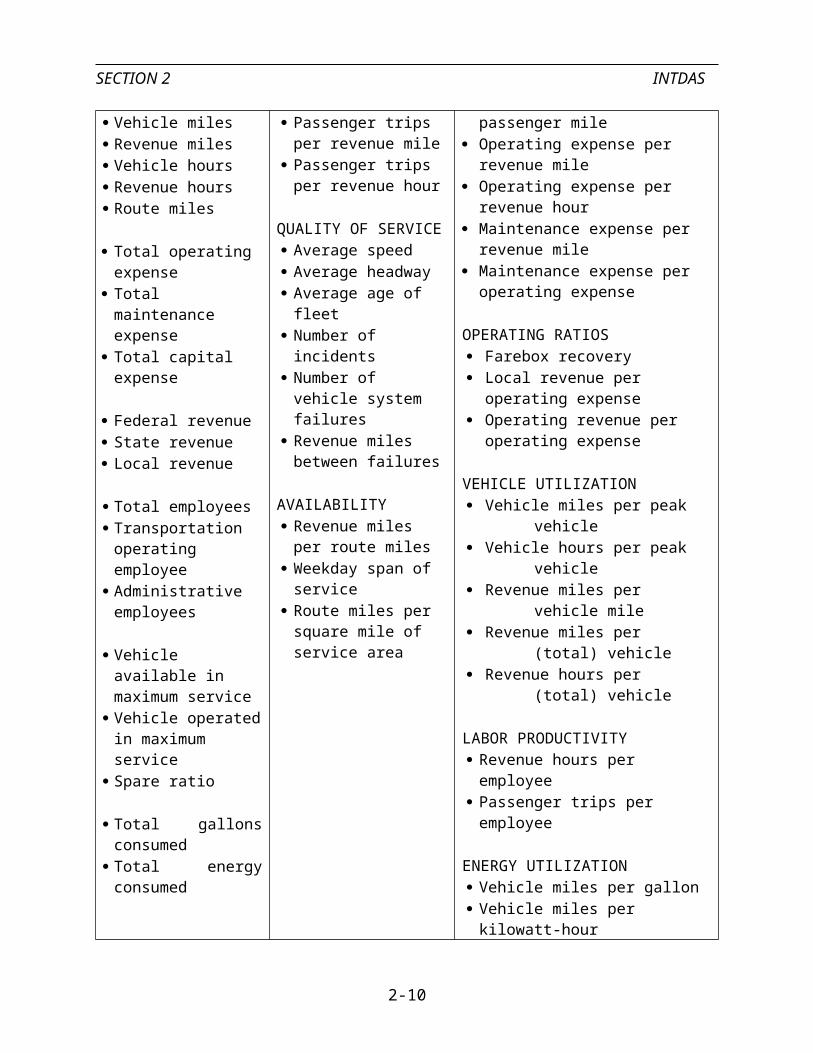
Table 2-3 includes a complete list of the Florida standard performance variables. The variables are divided into three groups: general performance indicators, effectiveness measures, and efficiency measures. The FDOT has been using these variables in its annual performance analysis for the Florida transit systems since 1988. These variables are defined based on one or more original NTD variables. For example, the average headway is computed based on the following NTD variables: directional route miles, revenue miles, revenue hours, and the number of vehicles operated in maximum service. See the section on Defining or Modifying a Formula to learn how to create a new performance variable or edit an existing one.
Note: Since the Florida standard variables (FSV) are computed from the original variables, the available data years for these variables are limited by the available data years shown in Table 2-1. If a formula involves two variables, one is from Form 406 and another from Form 405 Page 2, then the resulting available data years for the formula will be 1995-2000. Refer to Table 2-1 for available data years. In some cases, a particular data item is added to an existing form in a certain data year, in which case the available data years will be based on the data year the item is added, rather than the data years shown in Table 2-1 for an entire form.
2-5

SECTION 2 INTDAS
Table 2-3: Florida Standard Performance Variables
General Performance Indicators
Effectiveness Measures Efficiency Measures
Service area population Service area size
Passenger trips Passenger miles
Vehicle miles Revenue miles Vehicle hours Revenue hours Route miles
Total operating expense Total maintenance
expense Total capital expense
Federal revenue State revenue Local revenue
Total employees Transportation
operating employee Administrative
employees
Vehicle available in maximum service
Vehicle operated in maximum service
Spare ratio
Total gallons consumed Total energy consumed
SERVICE SUPPLY Vehicle miles per capita
SERVICE CONSUMPTION Passenger trips per
capita Passenger trips per
revenue mile Passenger trips per
revenue hour
QUALITY OF SERVICE Average speed Average headway Average age of fleet Number of incidents Number of vehicle
system failures Revenue miles between
failures
AVAILABILITY Revenue miles per route
miles Weekday span of service Route miles per square
mile of service area
COST EFFICIENCY Operating expense per capita Operating expense per peak vehicle Operating expense per passenger trip Operating expense per passenger
mile Operating expense per revenue mile Operating expense per revenue hour Maintenance expense per revenue
mile Maintenance expense per operating
expense
OPERATING RATIOS Farebox recovery Local revenue per operating expense Operating revenue per operating
expense
VEHICLE UTILIZATION Vehicle miles per peak vehicle Vehicle hours per peak vehicle Revenue miles per vehicle mile Revenue miles per (total) vehicle Revenue hours per (total) vehicle
LABOR PRODUCTIVITY Revenue hours per employee Passenger trips per employee
ENERGY UTILIZATION Vehicle miles per gallon Vehicle miles per kilowatt-hour
FARE Average fare
2-6

SECTION 2 INTDAS
The following section provides the definition of each of the variables listed in Table 2-3. Most of these definitions are taken directly from the annual transit performance analysis reports produced by the Center for Urban Transportation Research (CUTR) of the University of South Florida.
General Performance Indicators:
Service Area Population. The population in the service area as defined in the Americans with Disabilities Act (ADA), the U. S. Department of Transportation Federal Register, Vol. 56, No. 173, Rules and Regulations. FTA began requiring transit systems to provide service area population as part of Form 001 in 1992.
Service Area Size. The size of the area as defined in the Americans with Disabilities Act (ADA), the U. S. Department of Transportation Federal Register, Vol. 56, No. 173, Rules and Regulations. FTA began requiring transit systems to provide service area size as part of Form 001 in 1992.
Passenger Trips. Annual number of passenger boardings on the transit vehicles. A trip is counted each time a passenger boards a transit vehicle. Thus, if a passenger has to make one transfer to reach a destination, he/she is counted as making two passenger trips.
Passenger Miles. Number of annual passenger trips multiplied by the system's average trip length (in miles). This number provides a measure of the total number of passenger miles of transportation service consumed.
Vehicle Miles. Total distance traveled annually by revenue service vehicles, including both revenue miles and deadhead miles.
Revenue Miles. Number of annual miles of vehicle operation while in active service (available to pick up revenue passengers). This number is smaller than vehicle miles because of the exclusion of deadhead miles such as vehicle miles from the garage to the start of service, vehicle miles from the end of service to the garage, driver training, and other miscellaneous miles that are not considered to be in direct revenue service.
Vehicle Hours. Total hours of operation by revenue service vehicles including hours consumed in passenger service and deadhead travel.
Revenue Hours. Total hours of operation by revenue service vehicles in active revenue service.
Route Miles. Number of directional route miles as reported in NTD data; defined as the mileage that service operates in each direction over routes traveled by public transportation vehicles in revenue service.
2-7
SECTION 2 INTDAS
Total Operating Expense. Reported total spending on operations, including administration, maintenance, and operation of service vehicles.
Total Maintenance Expense. Sum of all expenses categorized as maintenance expenses; a subset of total operating expense.
Total Capital Expense. Dollar amount of spending related to the purchase of tangible property or other items eligible to be capitalized. Property includes tangible assets with an expected life of more than one year at the time of their installation, and a unit cost greater than $1,000.
Federal Contribution. Financial assistance obtained from the Federal government to assist in paying the operating costs of providing transit service. Such assistance is available from the Urbanized Area Formula Programs of 49 U.S.C. (Formerly Section 9), other transportation grant programs administered by the U.S. Department of Transportation, as well as other Federal agency programs.
State Contribution. Financial assistance obtained from a State government or agency to assist in paying the operating costs of providing transit service.
Total Local Revenue. All revenues originating at the local level (excluding state and federal assistance). This represents the sum of local contribution, directly-generated non-fare revenue, and passenger fare revenue.
Local Contribution. Any financial assistance obtained from a local government or agency (below the State level) to assist in paying the operating costs of providing transit service.
Operating Revenue. All revenues, except passenger fares, generated through the operation of the transit agency. Includes special transit fares, school bus service revenues, freight tariffs, charter service revenues, auxiliary transportation revenues, subsidy from other sectors of operations, and non-transportation revenues.
Passenger Fare Revenue. Revenue generated annually from carrying passengers in regularly scheduled service.
Total Employee FTEs. Total number of payroll employees of the transit agency in terms of full-time equivalents (FTEs). It is useful to note that the increasing tendency to contract out for services may result in some significant differences in this measure between otherwise similar properties. It is important to understand which services are contracted before drawing conclusions based on employee levels. All employees classified as capital are not included.
Transportation Operating Employee FTEs. All employees, in terms of FTEs, classified as operating employees: vehicle drivers, supervisory personnel, direct personnel.
2-8

SECTION 2 INTDAS
Maintenance Employee FTEs. All employees, in terms of FTEs, classified as maintenance employees who are directly or indirectly responsible for vehicle maintenance.
Administrative Employee FTEs. All personnel positions, in terms of FTEs, classified as administrative in nature. It includes all general administration, ticketing/fare collection, and system security employees as classified by FTA in Form 404.
Vehicles Available for Maximum Service. Number of vehicles available for use by the transit agency to meet the annual maximum service requirement. Vehicles available for maximum service include spares, out-of-service vehicles, and vehicles in or awaiting maintenance, but exclude vehicles awaiting sale and emergency contingency vehicles.
Vehicles Operated in Maximum Service. Number of revenue vehicles operated to meet the annual maximum service requirement, i.e., the revenue vehicle count during the peak hours of the peak days/weeks of the peak season (typically the rush period). Vehicles operated in maximum service exclude atypical days or one-time special events.
Spare Ratio. Vehicles operated in maximum service subtracted from vehicles available for maximum service divided by vehicles operated in maximum service. This measure is an indicator of the number of spare vehicles available for service. A spare ratio of approximately 20 percent is considered appropriate in the industry. However, this varies depending on the size and age of fleet as well as the condition of equipment.
Total Gallons Consumed. Total gallons of fuel consumed by the vehicle fleet.
Total Energy Consumed. Kilowatt-hours of propulsion power consumed by a transit system (rail and automated guideway).
Average Age of Fleet. The number of active vehicles of each fleet of the same mode and service type multiplied by their years of manufacture, divided by the total active vehicles.
Number of Incidents. Total number of unforeseen occurrences resulting in casualty (injury/fatality), collision, or property damage in excess of $1,000. For an incident to be reportable, it must involve a transit vehicle or occur on transit property.
Number of Vehicle System Failures. Total number of failures that occur during revenue service, deadheading, and layovers. A failure is classified as the breakdown of either a major or minor element of the revenue vehicle's mechanical system.
2-9

SECTION 2 INTDAS
Failures are tabulated regardless of whether they result in a vehicle completing or not completing its trip.
Weekday Span of Service. The number of hours that transit service is provided on a representative weekday in the operation of the transit agency. This indicator is determined by computing the number of hours between the values reported for average weekday time service begins and time service ends on Form 406. For transit agencies with more than one mode, the system total span of service takes into account the hours of operation for all modes and reports the span of hours that any transit service is provided on a typical weekday.
Effectiveness Measures:
Vehicle Miles Per Service Area Capita. Total number of annual vehicle miles divided by the service area's population. This can be characterized as the number of miles of service provided for each man, woman, and child in the service area and is a measure of the extensiveness of service provided in the service area. Note: for statewide data, this variable is equal to the total number of annual vehicle miles of all transit systems in the state divided by the sum of all service area populations reported by the same systems. Accordingly, population in service areas served by more than one system is double-counted.
Vehicle Miles Per Total State Capita. This variable is available at the statewide level only. It is the total number of annual vehicle miles in the state divided by the total state population as reported by the Census for the specific data year.
Passenger Trips Per Service Area Capita. Average number of transit boardings per person per year. This number is larger in areas where public transportation is emphasized and in areas where there are more transit dependents, and is a measure of the extent to which the public utilizes transit in a given service area. Note: for statewide data, this variable is equal to the total number of transit boardings reported by all transit systems in the state divided by the sum of all service area populations reported by the same systems. Accordingly, population in service areas served by more than one system is double-counted.
Passenger Trips Per Total State Capita. This variable is available at the statewide level only. It is the total number of transit boardings in the state divided by the total state population as reported by the Census for the specific data year.
Passenger Trips Per Revenue Mile. The ratio of passenger trips to revenue miles of service; a key indicator of service effectiveness that is influenced by the levels of demand and the supply of service provided.
Passenger Trips Per Revenue Hour. The ratio of passenger trips to revenue hours of operation; reports on the effectiveness of the service since hours are a better representation of the resources consumed in providing service.
2-10
SECTION 2 INTDAS
Average Speed. Average speed of vehicles in revenue service operation (i.e., not including travel to and from the garage or any other deadhead) calculated by dividing total revenue miles by total revenue hours.
Average Headway. Average headway, in minutes, for the system as a whole that is computed utilizing the following performance indicators: directional route miles, revenue miles, revenue hours, and the number of vehicles operated in maximum service. The equation used to determine this measure first doubles the directional route mileage to produce an estimate of system size in terms of total (non-directional) route miles. The resulting mileage figure is then divided by the system's calculated average speed (revenue miles per revenue hour) to produce an estimate of the time it would take, in hours, to traverse all of the system's total route miles. Finally, this time figure is divided by the system's number of peak vehicles (then multiplied by 60 to convert time in hours to minutes) to determine the number of minutes it takes for a vehicle to complete its portion of the total route miles one time.
Revenue Miles Between Incidents. Number of revenue miles divided by the number of incidents; reports the average interval, in miles, between incidents.
Revenue Miles Between Failures. Number of revenue miles divided by the number of vehicle system failures; an indicator of the average frequency of delays because of a problem with the equipment.
Revenue Miles Per Route Mile. Number of revenue miles divided by the number of directional route miles of service; an indicator of the availability of transit service.
Route Miles Per Square Mile of Service Area. Number of directional route miles of service divided by the service area size (in square miles); another indicator of the availability of transit service within the service area.
Efficiency Measures:
Operating Expense Per Service Area Capita. Annual operating budget divided by the service area population; a measure of the resource commitment to transit by the community. Note: for statewide data, this variable is equal to the sum of operating expenses of all transit systems in the state divided by the sum of all service area populations reported by the same systems. Accordingly, population in service areas served by more than one system is double-counted.
Operating Expense Per Total State Capita. This variable is available at the statewide level only. It is the sum of all operating expenses of all transit systems in the state divided by the total state population as reported by the Census for the specific data year
2-11

SECTION 2 INTDAS
Operating Expense Per Peak Vehicle. Total operating expense per vehicle operated in maximum service (peak vehicle); provides a measure of the resources required per vehicle to have a coach in operation for a year.
Operating Expense Per Passenger Trip. Operating expenditures divided by the total annual ridership; a measure of the efficiency of transporting riders; one of the key indicators of comparative performance of transit properties since it reflects both the efficiency with which service is delivered and the market demands for the service.
Operating Expense Per Passenger Mile. Operating expense divided by the number of passenger miles; takes into account the impact of trip length on performance since some operators provide lengthy trips while others provide short trips.
Operating Expense Per Revenue Mile. Operating expense divided by the number of revenue miles of service; a measure of the efficiency with which service is delivered and is another key comparative indicator.
Operating Expense Per Revenue Hour. Operating expense divided by revenue hours of operation; a key comparative measure which differs from operating expense per vehicle mile in that the vehicle speed is factored out. This is often important since vehicle speed is strongly influenced by local traffic conditions.
Maintenance Expense Per Revenue Mile. Maintenance cost divided by the revenue miles.
Maintenance Expense Per Operating Expense. Calculated by dividing maintenance expense by operating expense; expressed as a percent of total operating expense.
Farebox Recovery. Ratio of passenger fare revenues to total operating expenses; an indicator of the share of total operating costs that is covered by the passengers' fares.
Local Revenue Per Operating Expense. Ratio of total local commitment with respect to total operating expense.
Operating Revenue Per Operating Expense. Ratio of revenue generated through operation of the transit agency (directly - generated non-fare revenue plus passenger fare revenue) with respect to total operating expense. Operating revenue includes passenger fares, special transit fares, school bus service revenues, freight tariffs, charter service revenues, auxiliary transportation revenues, subsidy from other sectors of operations, and non-transportation revenues.
Vehicle Miles Per Peak Vehicle. Vehicle miles divided by the number of vehicles operated in maximum service. It is an indicator of how intensively the equipment is used and is influenced by the bus travel speeds as well as by the levels of service in the off-peak time periods. A more uniform demand for service over the day would result in a higher number.
2-12

SECTION 2 INTDAS
Vehicle Hours Per Peak Vehicle. Substitutes vehicle hours for vehicle miles and again reflects how intensively equipment is utilized.
Revenue Miles Per Vehicle Mile. Reflects how much of the total vehicle operation is in passenger service. Higher ratios are favorable, but garage location, training needs, and other considerations may influence the ratio.
Revenue Miles Per Total Vehicles. Total revenue miles of service that are provided by each vehicle available for maximum service.
Revenue Hours Per Total Vehicles. Total revenue hours of service that are provided by each vehicle available for maximum service.
Revenue Hours Per Employee FTE. Ratio of total revenue hours of service to system total FTEs; reflects overall labor productivity.
Passenger Trips Per Employee FTE. Ratio of total passenger trips to system total FTEs. Another measure of overall labor productivity.
Vehicle Miles Per Gallon. Vehicle miles of service divided by total gallons consumed and is a measure of energy utilization.
Vehicle Miles Per Kilowatt-Hour. Vehicle miles of service divided by total kilowatt-hours consumed and is another measure of energy utilization.
Average Fare. Passenger fare revenues divided by the total number of passenger trips.
User-Defined Variables
INTDAS allows you to define a new variable based on two or more original NTD variables through a user-defined formula. See the section on Defining or Modifying a Formula to learn about how to create a new user-defined variable or edit an existing one.
2-13
SECTION 2 INTDAS
Creating, Modifying, or Deleting a VariableINTDAS allows you to create a variable by setting up a formula that consists of one or more original NTD variables. Existing formulas can be modified or deleted. To do these:
Select Setup|Derived variables... from the INTDAS dropdown menu. The Formula Setup screen shown in Figure 2-1 will pop up. Two tabs are provided, one for the Florida standard variables (FSV) and another for any other user-defined variables.
Select the appropriate tab. The tab you select here will determine the tab that the variable will be listed in the Select Variables tab in the main INTDAS screen.
In either the Florida standard or the User-defined tab, you can select any variable on the Variables list by clicking the variable name. The corresponding formula and the variable definition will be displayed, as shown in Figure 2-1.
Figure 2-1: Main Screen for Formula Setup
2-14

SECTION 2 INTDAS
To create a new variable, simply click the New button.
To modify an existing variable, click the variable in the Variables list box. The variable is highlighted. The existing formula is shown in the Formula box. The definition description for the variable is shown in the Definition box. Click the Modify button.
To delete an existing variable, click the variable in the Variables list box. The variable is highlighted. Click the Delete button and answer Yes when prompted to confirm the deletion.
When the New or the Modify button is clicked, the Formula Editor screen shown in Figure 2-2 will pop up. To start creating a new variable:
1. Enter the name of the formula to be created.
2. Specify the data type for the resulting values from the formula.
3. Specify whether the values are to be calculated for directly operated (DO) only, purchased transportation (PT) only, or both, plus the aggregate values of both (i.e., “DP”). The default is to compute values for DO, PT, and DP. If a variable applies to only purchased transportation, then you should select “PT”. Failing to do so will result in values being calculated for “DO” and “DP”, which is incorrect.
4. Enter a search string to find the target original NTD variable(s).
5. Construct a formula by clicking variables and math operators. The clicked items will be sent to the Formula box.
Note: Instead of using the mouse, the keyboard may be used to edit the formula. However, keyboard input for inserting a variable name is not recommended because of potential typos.
6. (Optional) Enter the definition of the new variable.
7. Click the Save button to execute the formula or the Cancel button to exit without changes. If the formula is valid, INTDAS will compute the values for the new variable according to the formula(s) you entered.
Note: The execution of the Save function may take up to several minutes, depending on the complexity of the formula and, of course, the speed of your computer.
The steps for modifying an existing variable are similar. In this case, all the specifications involved in the above steps will be automatically loaded and available for changes.
2-15

SECTION 2 INTDAS
Figure 2-2: Screen for Formula Editor
Minimum User Input to Retrieve NTD DataINTDAS provides several alternatives for quick and easy data retrieval. To retrieve NTD data, the following four basic selections based on the system variables must be made:
Select the range of NTD data years.
Select the type(s) of service.
Select the transit systems of interest. In the case of statewide data (available for Florida standard and user-defined variables only), select the states of interest.
Select the data variables for which data are to be retrieved.
Note: All four basic selections may be performed in any sequences.
2-16

SECTION 2 INTDAS
Figure 2-3 shows the INTDAS main screen that allows you to make these selections. The left side of the screen lets you identify the transit systems (or states, in the case of statewide data) of interest. The right side of the screen allows you to select the data years, the service types, and the NTD data variables. The number in the brackets next to the list box name indicates the number of systems selected. The bottom of the screen lists the following action buttons that can be executed to retrieve and display data once the above selections are made:
The selection of data variables is not needed when you want to display retrieved data on NTD forms, which, by default, display data for all variables. As soon as a transit system is selected and is listed in the Selected systems list box, you can click the Form button at the bottom of the screen. To apply the Table button, you must select at least one transit system and at least one variable.
The following three sections describe the process of selecting the four basic variables in detail.
Figure 2-3: INTDAS Main Screen
2-17

SECTION 2 INTDAS
Selecting Data Years and Service TypesThe selections of NTD data years and service types are straightforward. Both selections are done at the top-right corner of the INTDAS main screen, as shown in Figure 2-4.
Figure 2-4: Data Years and Service Types
For data years, enter the range of data years for which the data are to be retrieved. The From year must be greater than the To year.
Three check boxes are provided for each of the three service type options: directly operated (DO), purchased transportation (PT), or service aggregate (DP or DO+PT). The service aggregate option is for retrieving records that aggregate the DO and PT values of each transit mode option. At least one service type must be selected.
Note: The “DP” option is available for only the Florida standard and user-defined variables.
You may set your selections for data years and service types as the default by clicking the Save as Default button. When you enter INTDAS the next time, the selections will be automatically loaded.
Selecting Transit SystemsINTDAS provides the following three options to facilitate the selection of transit systems to meet different application needs.
Selecting Transit Systems by System Variables
This option allows you to use the system variables to quickly identify transit systems from a set of list boxes. It is best suited if you already know the specific transit systems you are interested in. Figure 2-5 shows the interface for this option.
2-18

SECTION 2 INTDAS
Figure 2-5: Screen Area for Selecting Transit Systems by System Variables
To select transit systems:
1. Select the Select systems by system variables tab on the INTDAS main screen. It is the default tab when you first enter INTDAS.
2. Select state(s) from the States list box. Select the desired mode codes from the Individual modes list box and the desired mode aggregates from the Mode aggregate list box. The default state is Florida and the default for transit modes is to select “all modes”.
Note: Mode aggregate output records that represent the aggregate values of all modes operated by a transit system. Mode aggregate output is only available for the Florida standard and user-defined variables. The following four aggregate options are available:
2-19

SECTION 2 INTDAS
Systemwide Total (ST): This aggregate option provides aggregated values of all modes of a transit system.
Fixed-Route Total (FT): This aggregate option provides aggregated values of all fixed-route modes of a transit system (i.e., all except demand response).
Rail Total (RT): This aggregate option provides aggregated values of all rail modes (i.e., AG, CC. LR. HR, IP, LR, MO) of a transit system.
Non-Rail Total (NT): This aggregate option provides aggregated values of all none-rail modes (i.e., DR, FB, JT, MB, PB, TB, TR, VP, OR) of a transit system.
3. On each list box, clicking a list item once will select the item. Selected items are highlighted. Clicking a selected item again will unselect the item. All transit systems matching the selected states and have at least one mode matching the selected modes will be listed on the Systems list box.
Note: Items on the Systems list box may be re-ordered by clicking the Sort button, which allows you to sort the list by State, NTD ID, or transit agency name.
4. Select final systems by clicking the transit systems listed on the Systems list box. Selected transit systems will be listed on the Selected systems list box.
To unselect a system:
Click the transit system name on the Systems list box, or
Highlight the transit system name in the Selected systems list box and then click the Delete button.
Selecting Transit Systems by Query
This option allows you to identify and select transit systems by constructing and executing a SQL (Structured Query Language) query. It is best suited if you want to identify systems that fit a certain profile, e.g., all Florida motorbus transit systems that operates less than 10 maximum service vehicles. Figure 2-6 shows the interface for this option.
2-20

SECTION 2 INTDAS
Figure 2-6: Screen Area for Constructing Query for Transit Systems Selection
To apply this option:
1. Select the Select systems by query tab.
2. Either search through the list or type in a keyword in the search box to narrow down the list of variables. By default the list will show the Original NTD variables. To select from the FSV (Florida Standard Variable) list, check the FSV box. Uncheck the box to return to the Original NTD variable list.
3. Identify and select a variable from the variable list box listed below the search box. Click a variable to send the variable to the Query Editor box. All possible data values for a selected variable are listed on the Values box.
Note: The Values box will automatically show all values of a system variable (i.e., variable preceded by “system”). For attribute variables, you must click the Get values button to show the values.
2-21
SECTION 2 INTDAS
4. Click a math operators, such as “=” or “>=”.
5. Click a value from the Values list box or type in the value from the keyboard. Repeat the steps above for more query conditions, which are usually separated by “and” or “or”.
6. Click the Run Query button to run the query to identify transit systems that meet the query conditions. If the query is correctly constructed, the resulting transit systems will be listed in the Selected Systems list box. If the query contains invalid input, an error message will pop up. Edit and re-run the query.
Warning: You may key in any query specifications using the keyboard. However, keying in the variable names is not advisable since most variables are long and are vulnerable to typos.
Notes: All character values must be bounded by double quotations.
All conditions in parentheses are executed together.
The “like” operator allows you to enter a text pattern to search. This option can only be used for text-related variables. For example, to find all the transit systems that have “Miami” as part of the transit system name, you may enter the following query:
[System][Company Name] like “*Miami*”
The quotation marks must be included as part of the query.
Example: You are interested in only the motorbus transit systems in Florida and California that have at least 500 vehicles operated in maximum service. The query will be: ( [System].[State] = "FL" or [System].[State] = "CA" ) and [System_Mode].[Mode Code] = "MB" and [406].[Vehicles Operated in Maximum Service] >= 500
Note: Each variable name on the list box consists of two bracket components. The first set of brackets lists the source of the variable, generally the NTD form of the variable. The name of the variable is listed in the second set of brackets. For system variables, the source is the “System” table in the database. For system attributes, the source is the three-digit NTD form number. For Form 405, which has two pages, “405P1” and “405P2” are used.
Steps for constructing the example query:
2-22

SECTION 2 INTDAS
1. Click the ( button.2. Click the [System].[State] variable (fourth variable on the list) on the Variables list
box.3. Click the = button.4. Click the FL list item on the Value list box, which lists all the available states. 5. Click the or button6. Click the [System].[State] variable again.7. Click the = button.8. Click the CA list item on the Value list box.9. Click the ) button.10. Click the and button.11. Click the [System_Mode].[Mode Code] variable.12. Click the = button.13. Click the MB list item on the Value list box.14. Click the and button.15. In the “Type in a keyword to find” text box, type in an appropriate keyword, or a
partial keyword, to find the variable for maximum vehicles (e.g., type in “max”). The Variable list box should list all the variables that contain the keyword.
16. Click the [406].[Vehicles Operated in Maximum Service] variable.17. Click the >= button.18. Type “500” (without the quotation marks).
Selecting Transit Systems by System Groups
This option allows you to quickly select a pre-defined group of transit systems. The interface for this option is shown in Figure 2-7. To apply this option:
1. Select the Select systems by groups tab
2. Select an item on the Groups list box.
3. Select the desired mode codes from the Individual modes list box and the desired mode aggregates from the Mode aggregate list box. Transit systems belonging in the selected group and serving at least one of the selected modes will be listed in the Selected systems box.
4. To delete an existing system group, highlight the system group name and then click the Delete button on top of the list.
Note: See the section on Saving System and Variable Selections to learn how to create or modify a system group.
2-23

SECTION 2 INTDAS
Figure 2-7: Screen Area for Selecting Transit Systems by System Groups
Limiting Your Output Systems to a Fixed NumberFor certain applications, you may want to limit your output systems to only a certain number of systems, e.g., the top 10 systems. By default, INTADS will output all systems that satisfy a specific set of query conditions. Consequently, your analysis in INTDAS must be based on all the output systems, rather than a specific number of systems. INTDAS provides a convenient way to allow you to limit the number of systems to the top or bottom X number of systems based on the values of a select variable. To access this function, select Setup|Get Highest/Lowest X Systems dropdown menu item. You may access this function on the INTDAS main screen or after you have extracted your data with the Table option. The screen in Figure 2-8 belongs to that of the first option. This option applies when you select systems using the Query Setup option. The later option processes through your extracted table and keep only records for the lowest or highest X systems. To limit the number of systems:
2-24

SECTION 2 INTDAS
1. Select the second radio button.
2. Select either the lowest or highest option.
3. Select the number of systems.
4. If you have chosen the Lowest option, check or uncheck the null/zero option. By default, systems with null or zero cells will be ignored.
5. Click the based on button to select a variable by which its values are to be evaluated to determine the systems to be included. The selected variable will be automatically added to the Selected Variables list.
To “unlimit” the total number of systems, you must select the Setup|Get Highest/Lowest Systems dropdown menu item again, and then select the All systems option.
Notes:
1. The number of output of systems may be greater than X when multiple systems with the same number exist at the cut-off point.
2. Queries may run significantly slower with the limiting option.
Figure 2-8: Screen Area for Selecting Transit Systems by System Groups
2-25

SECTION 2 INTDAS
Selecting States for Statewide DataThis option allows you to select states for which statewide data are to be retrieved. The interface for this option is shown in Figure 2-9. To apply this option:
1. Select the Select states tab
2. Select one or more states from the States list box. The selected states will be displayed in the Selected states list box.
3. Select the desired mode codes from the Individual modes list box and the desired mode aggregates from the Mode aggregate list box.
Note: Statewide data are available for only the Florida standard and user-defined variables.
Figure 2-9: Screen Area for Selecting States for Statewide Data
2-26

SECTION 2 INTDAS
Selecting Data VariablesFor the selection of NTD variables, INTDAS allows you to select variables by forms, by variable list, or by pre-defined variable groups. The following sections describe each option in detail.
Selecting Variables by NTD Forms
This option allows you to select the variables through the emulated NTD forms. It is only available for the selection of the original NTD variables and is especially suitable if you are familiar with the NTD forms. This option is accessible from the Enter Here button on the Original NTD tab shown in Figure 2-10.
Figure 2-10: Screen Area for Entering NTD Forms for Variable Selection
After the Enter Here button is clicked, all the available NTD forms will be displayed, one tab for each form. Figure 2-11 shows the tab for Form 406. To select a variable:
1 Select the NTD form that contains the desired variable.
2 Identify the variable from the form.
3 Click the check box for the variable. Figure 2-11 shows that the following two variables are selected (i.e., checked): total unlinked passenger trips and total passenger miles.
2-27

SECTION 2 INTDAS
Figure 2-11: Tabs for NTD Forms for Variable Selection
You may select all variables on a form by clicking the Select All button. Click the Clear All button will clear all the check boxes in the current form. The selected variables are listed on the Selected variables list box and can be viewed after you click OK to exit to the INTDAS main screen.
To unselect a variable:
Click the variable name on the variable list box, or
Click the Go button to return to the form to uncheck the check box.
Selecting Variables by Variable List
This option allows you to select variables from a list. It is available for all three variable types (i.e., original NTD, Florida standard, and user-defined), as shown in Figure 2-12, which shows one tab for each of the three variable types.
2-28

SECTION 2 INTDAS
Figure 2-12: Screen for Selecting Variables by List
To identify and select a variable:
1. Enter a (or partial) keyword to search for all variables that match the keyword. All matched variables will be listed on the Selected variables list box. In the case of Figure 2-12, the keyword entered is “miles”. Instead of a keyword, you may enter a form number to short-list to variables of a particular form. For example, typing in “406” will cause the list to include only Form 406 variables.
2. Select all variables by clicking the Select All button or any of the listed variables by clicking the specific variable names on the list box. All selected variables are highlighted on the variable list box and are listed on the Selected variables list box.
To unselect a variable:
Click the variable name on the variable list box, or
Highlight the variable name in the Selected variables list box and then click the Delete button.
2-29

SECTION 2 INTDAS
Selecting Variables by Variable Group
This option allows you to quickly select a group of pre-defined variables. It is done by selecting an item on the Groups list box, as shown on the screen in Figure 2-13. To delete an existing variable group, highlight the variable group name and then click the Delete button on top of the list. See the section on Saving System and Variable Selections to learn how to create and modify a variable group.
Figure 2-13: Screen for Selecting Variables by Variable Group
Saving System and Variable SelectionsINTDAS allows selected transit systems or variables to be saved as a group. The ability to save a group of transit systems and a group of variables allows data for trend and peer comparison analyses to be retrieved quickly. The screen shown in Figure 2-14 will pop up when the Save as a group button is clicked.
2-30

SECTION 2 INTDAS
Figure 2-14: Screen for Saving System or Variable Selections
The first bullet allows you to save all the transit systems listed in the Selected systems list box under a new group name.
The second bullet allows you to overwrite an existing system group with the transit systems listed in the Selected systems list box.
Once the selections are saved, the name of the group of transit systems will appear on the System groups tab.
The operations for creating and modifying a variable group are similar.
Viewing Retrieved NTD DataINTDAS allows you to view retrieved data in forms, tables, charts, reports, and maps. The map option is available for statewide data only. The following sections describe each of these options in detail.
Viewing Retrieved Data by NTD Forms
If you are interested in retrieving comprehensive data for a small group of transit systems, you may want to display the data on the emulated NTD forms. As soon as you have selected a transit system, you may click the Form button to apply this function. The screen in Figure 2-15 shows an emulated NTD form (Form 406) that is loaded with data for a selected system. The tab allows you to navigate from one form to another easily. The following functions are available for each emulated NTD form:
2-31

SECTION 2 INTDAS
Use the left, right, up, and down arrow buttons to go to the next, previous, first, and last record, respectively. Alternatively, you can use the Enter key in lieu of a mouse click.
Click the Printer or Email button to print the form on a printer or e-mail the form to a third party. INDTAS will automatically capture the screen, store it as a BMP graphics file, activate your email system if it is not already activated, open a new email, and attach the graphics file as a file attachment.
Figure 2-15: Retrieved Data on NTD Forms
Viewing Retrieved Data by Standard Reports
INTDAS can display three standard reports for each of the three sets of Florida performance variables (i.e., general performance indicators, effectiveness measures, and efficiency measures) for both tread and peer analysis. Once you have selected your systems, you can click on the Report button (at bottom of screen) to retrieve and display data for the selected systems on the standard reports. Figure 2-16 shows an example of the reports. The top of the screen allows you to make the following selections:
2-32

SECTION 2 INTDAS
By default, the trend table is displayed. A trend table can display data for up to a maximum of six years. The last year is always equal to the To year you have selected on the INTDAS main screen. If the total number of years you have selected exceeds six, then only the latest six years will be displayed. For example, if you have selected 1994 and 2000 as your From and To years, respectively, the report will display data from years 1995 to 2000. For peer comparison table, select the Peer radio button and then select a specific data year. The list shows only the data years you have selected on the INTDAS main screen.
The first list box allows you to select a specific type of report, including a Charts report options that display trend or peer data on line or bar charts. You may also use the arrow buttons to navigate from one standard report to another.
The other three list boxes allow you to select each of the three system variables, NTD ID (or State in the case statewide data), mode code and service type. By default, the first list item is selected.
Figure 2-16: Standard Report View and Interface
2-33

SECTION 2 INTDAS
Within the Report view, the following miscellaneous functions are available:
You may edit the report titles by clicking the Edit Report Titles button, which will bring up the screen shown in Figure 2-17. You are allowed to enter a total of three titles for each report. You may also include a note for all three standard reports, or a separate note for each report. Notes are displayed at the bottom of reports.
You may click the Printer button to print the reports.
You may adjust your report to your desired viewing resolution by changing the box for enlargement percentage.
You may click the “Envelop” button to export reports to a file of a select format, which may be saved to a disk or attached to your email system.
You may search for a certain text in the reports by clicking the binocular tool button.
Figure 2-17: Screen for Editing Report Titles
Viewing Retrieved Data by Tables and Graphs
If you are interested in only select variables of multiple years, INTDAS provides three different ways for viewing the retrieved data:
2-34

SECTION 2 INTDAS
Flat Table View: It displays all the retrieved records and variables in a flat table. It is the default table option and is the first screen after you click the Table button.
Cross Table View: It displays attribute values that are cross-classified by any two selected variables.
Plot View: It is similar to the Cross Table view in that it also displays data for any two variables at a time. The only difference is that this one displays data in a graph, while the other in a table.
Map View: It displays attribute values on a GIS thematic map. This option is currently available for statewide data only.
Figure 2-18 shows the tool buttons for accessing the different views. It also shows the tool buttons for a number of functions that can be applied to the data retrieved. The next four sections describe the different views in more detail, including the functions that can be applied within each view.
Figure 2-18: Table Tool Buttons
Open a File
Save As
Cross Table
Flat Table
Email Table
Plot
Agency N
ame
Reset Table
Sort
Transpose
Com
pute Aggregate D
ataA
djust for InflationPerform
Regression
Create Excel R
eport
Help
Exit
Map
Create C
rystal Report
Find Relationships…
Freeze System V
ariables
Applying Functions in Flat Table ViewFigure 2-19 shows a sample flat table for data for select variables for multiple data years of multiple transit systems.
2-35

SECTION 2 INTDAS
Figure 2-19: Sample Flat Table
The following functions may be applied to the flat table:
Freeze. It allows you to toggle between whether to freeze or unfreeze the system variables. When the system variables are “frozen”, they do not move when you scroll the table horizontally to the right. This function is useful when the table contains many variables and you want to be able to always see the system variables when you move to the right of the flat table.
Sort. It sorts the flat table based on one or more variables.
Get Statistics. It computes the general statistics associated with each of the data attributes in the flat table.
Compute Aggregate Data. It computes the total values based on one or more system variables. For example, to find the combined values of both directly operated (DO) and purchased transportation (PT) for a transit system.
Create New Variable. It lets you create a new variable based on a formula.
2-36

SECTION 2 INTDAS
Adjust for Inflation. It converts financial values to the equivalent dollars of a specific year (i.e., constant dollars) based on the standard inflation rates derived from the Consumer Price Indexes (CPIs).
Save. It lets you save a flat or a cross table into either a comma-delimited text file or an Excel file.
Send. It lets you e-mail a flat or a cross table as a file attachment. See Figure 2-18 for the tool buttons for accessing these functions. A corresponding menu item can be found in the drop-down menu for each of the tool buttons. The following sections provide additional details for some of these functions.
Sorting Tabulated Data
INTDAS allows a flat table to be sorted by one or more variables.
To sort the table based on one variable, you can simply click the column header of the variable you want to sort. Clicking the header once will sort the table in the ascending order. Clicking the same variable again will re-sort the table in the descending order.
To sort the table based on more than one variable, select Tools|Sort… or click on the Sort tool button. The screen shown in Figure 2-20 will pop up. The variables available for sorting will be listed on the list box on the left. You can select up to five variables to be sorted in either the ascending or the descending order. Click OK to sort the table in the order of the variables listed.
Figure 2-20: Screen for Specifying Sorting Variable and Sorting Order
2-37

SECTION 2 INTDAS
Computing Table Statistics
INTDAS computes basic statistics for all attribute variables in a flat table. The statistics include maximum, minimum, total, number of records, and average. An example output is shown in Figure 2-21. The next version of INTDAS will include additional statistical capabilities, including regression modeling.
Figure 2-21: Sample Statistical Output
Performing Regression Analysis
INTDAS allows you to perform simple, multiple, and polynomial regression analysis based on the the data you have retrieved. Access this function, select the Tools|Perform Rgeression Analysis menu item. Table 2-22 shows the input screen for specifying the type of regression model, the dependent variable, and the independent variable(s).
Figure 2-22: Regression Analysis Input Screen
2-38

SECTION 2 INTDAS
As an option, you may select to force zero-intercept, i.e., the constant of your model will be zero. To select a variable for the dependent or indepedent variable, first highlight the variable from the variable list and then click the right-arrow button to move the variable to either the Dependent Field or Independent Fields box. To remove a variable, simply highlight the variable and click the left-arrow button. For independent variables, you may also click the up and down arrow buttons to reorder the list of variables. The order of the variables shown on the screen determines the order of the idependent variables in the output regression equation. Figure 2-23 shows a sample regression output.
Figure 2-23: Sample Regression Output
Find Relationships Among All Variables
This function allows you to quickly find the simple linear equations for all possible variable pairs of variables selected. To apply this function, select the Tools|Find Relationships Among All Variables menu item. The output can be shown in either a cross table (see Table 2-24) or a flat table (see Table 2-25), which includes a simple linear equation and the associated R-square value for each variable pair.
2-39

SECTION 2 INTDAS
Figure 2-24: Cross Table Showing Simple Linear Equations for All Variable Pairs
Figure 2-25: Flat Table Showing Simple Linear Equations for All Variable Pairs
2-40

SECTION 2 INTDAS
Computing Aggregate Data
INTDAS allows records in a flat table to be combined to obtain totals for one or more system variables. To apply this function, select Tools|Compute Aggregate Data from the dropdown menu. The screen for specifying the variables for which the flat table is to be summarized is shown in Figure 2-26. Selections are made by checking the system variables that are to remain in the resulting flat table, i.e., the flat table will be stratified by the variables that you checked. Only the check boxes for the system variables that appear in the current flat table can be selected.
Figure 2-26: Input Screen for Computing Totals
Examples:
Leaving all check boxes unchecked and click OK will result in only one record. This tells INTDAS not to stratify the resulting table by any system variables. In this case, INTDAS sums up values for each column.
Checking Year, NTD ID and Mode Code will ask INTDAS to add values for "DO" and "PT" for each transit mode of a transit agency for each NTD year.
Checking only Mode Code will compute totals for each mode code.
Checking all boxes will result in no change to the current flat table. You may click the Reset Table tool button or select the Tools|Reset Table menu item from the dropdown menu to go back to the original flat table.
Creating New Variables
2-41

SECTION 2 INTDAS
This function allows you to create a new variable through a formula, just like in a spreadsheet program. The steps for applying this function are as follows:
1. Select Tools|Create New Variable from the dropdown menu. The screen in Figure 2-27 will pop up. This option is selectable only when you are in the Flat Table view.
2. Enter a name for the variable.
3. (Optional) Type in a keyword to shortlist the variable list.
4. Compose a formula by selecting the listed variables and math operators. In Figure 2-27, the application is to add the total actual vehicle miles and the total train miles to obtain a variable for total actual miles regardless of whether the modes are rail or non-rail.
Figure 2-27: Input Screen for Computing New Variables
Adjusting for Inflation
INTDAS allows you to adjust the financial variables in a flat table for inflation to a specific year from 1984 to the current year (if inflation rate is available) based on the national
2-42

SECTION 2 INTDAS
inflation rate. Inflation-adjusted dollars provide a more accurate representation of spending changes resulting from agency decisions by factoring out the general price inflation. The inflation rate reported is the percentage change in the Consumer Price Index (CPI) for all items (including commodities and services) from year to year.
The steps for applying this function are as follows:
1. Select Tools|Adjustment for Inflation from the dropdown menu. The screen shown in Figure 2-28 will pop up. The screen allows you to select the base year and the financial variable(s) to adjust. Only financial variables are listed.
2. Select the base year you want to convert the dollar values to.
3. Select one or more variables by single-clicking the desired variables. As soon as you have clicked the OK button, INTDAS will start the conversion and a new variable with the equivalent values will be listed side-by-side each of the original variables selected. The name of each adjusted variable will be attached with the equivalent year in parentheses.
Figure 2-28: Screen for Specifying Year and Variables for Inflation Adjustment
A set of standard inflation rates derived from the federal consumer price indexes are defined in INTDAS and are used for the conversion. Although it is generally desirable to use these standard inflation rates, INTDAS allows you to modify them, if necessary, through the following steps:
Select Setup|Inflation Rates from the dropdown menu. The screen shown in Figure 2-29 will pop up.
2-43
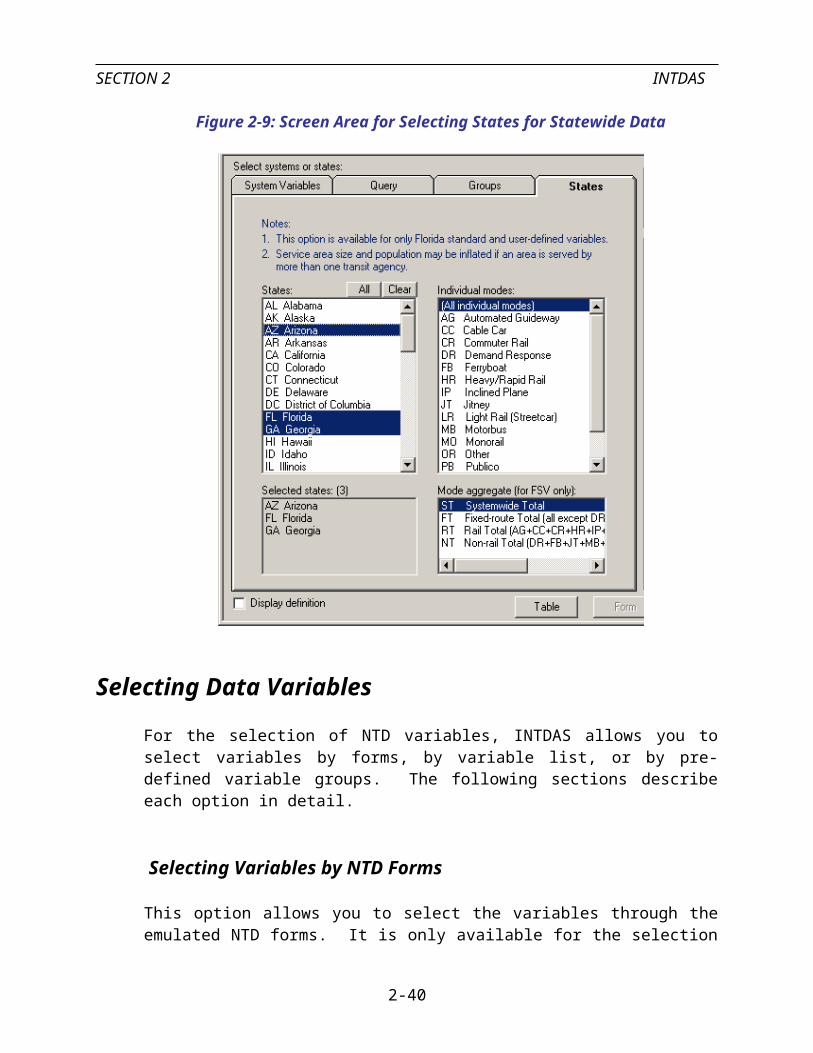
SECTION 2 INTDAS
Figure 2-29: Screen for Specifying Inflation Rates
Click an existing cell to enter a value. This overwrites an existing value.
Click the Add New button to add the inflation rate for a new year.
Click the Close button to exit. All changes or additions are permanent.
Note: You are not allowed to specify an inflation rate for a year beyond the current year.
Transferring Tabulated Data
To ease data transfer, INTDAS allows retrieved data to be saved as an Excel file (*.xls) or a comma-delimited file (*.txt). Forms and plots can be saved as a BMP file. With a mouse click, INTDAS automatically activates the default email system and attaches either a data file or a BMP file to the email.
Creating Cross TablesA cross table allows you to view values cross-classified by two variables at a time. To create a cross table, click the Cross Table tool button or select the View|Cross Table menu item from the dropdown menu. A screen similar to that in Figure 2-30 will appear.
Figure 2-30: Screen for Creating Cross Tables
2-44

SECTION 2 INTDAS
The top of the screen shows five list boxes for system and variable selections. The first four list boxes allows you to select each of the four system variables, namely, year, NTD ID, mode code and service type. The last list box lists all the data attributes.
The second half of the screen shows the cross table that displays data cross-classified by two variables at a time. The cross table is updated instantly accordingly to your selections on the five list boxes, which have the following operational characteristics:
The first two list boxes specify the row and column variables of the cross table. If a variable is selected in one of the two list boxes, it will not be listed in another list box.
The third and fourth list boxes will list all possible values associated with each of the remaining two system variables. One value must be selected on each of these boxes. The default selection in each of these boxes is the first item on the list.
One or more attribute variables may be selected on the fifth list box. To select more than one variable, you must check the Multiple box. When more than one data attribute is selected, as is shown in Figure 2-31, the second list box will list the possible values for one of the system variables, rather than list the system variables. The cross table will be cross-classified by the first and fifth list boxes.
2-45

SECTION 2 INTDAS
Figure 2-31: Cross Table with More Than One Attribute Variable
The following two functions can be applied to a cross table:
You may select whether to include the agency name for each NTD ID by applying the Agency Name function.
You may swap the row and column variables quickly by applying the Transpose function.
2-46

SECTION 2 INTDAS
Plotting Tabulated DataINTDAS provides an interactive plotting capability in the Plot view. The operations of this view are similar to that of the Cross Table view. Instead of displaying the data in a cross table, the Plot view displays data on a graph. Figure 2-32 shows a screen of the Plot view. See Creating a Cross Table for a detailed description of the operations.
Figure 2-32: INTDAS Plotting Screen
In the Plot view, you can customize the color, line width, line type, legend, and label using the dropdown lists at the bottom of the plot. You may also change any of the variables selected on the five list boxes to instantaneously update your plot.
If your computer is installed with MS Excel, you may obtain an equivalent Excel plot by clicking the Excel Plot button at the bottom right of the screen. INTDAS will automatically activate Excel, import data into Excel, and then create an Excel plot, as shown in the example screen in Figure 2-33.
2-47
SECTION 2 INTDAS
Figure 2-33: Excel Plot
Displaying Thematic Maps for Statewide DataYou may create GIS thematic maps for statewide data. To access this function, select the View|Map View menu item. This will take you into a new screen. Figure 2-34 shows an example of such a screen. The map legend is shown on the top left coner and the bottom left corner allows you to select a variable to create a thematic map for a combination of selected data year, mode code, and service type. The resulting thematic map is shown on the right window, which is updated as soon as a different selection is made. You may change the color ramp to apply a different thematic color scheme. The default thematic type is by color, but you may choose to describe the theme by dot density. The toolbar on top provides several basic navigation modes to manipulate the map view, including zoom-in, zoom-out, pan, and map extent. The default mode is the mouse pointer. Clicking any of the tool buttons will take you into the specific navigation mode. To return to the default mouse pointer mode, click the pointer tool button. In this mode, you can point at a specific state to show a map tip of the state name.
2-48

SECTION 2 INTDAS
Figure 2-34: Thematic Map View for Statewide Data
Automated Peer SelectionINTDAS provides three methods for automated peer selection. All three methods allow the users to select one or more performance measures and apply different weighting factors to reflect the relative importance of each measure. The users can choose to include data from certain states (i.e., peer states) and for individual mode and service type combinations.
The first method was originally developed at the University of South Florida. Version 2003 offers two additional methods, one to allow the users to find the closest peers for a specific system, and another to automatically group transit systems into different groups. The newer methods have been designed to replace the older method, which is referred below as the “Old Florida Peer Selection Method.” These methods are described below in greater details.
2-49

SECTION 2 INTDAS
Old Florida Peer Selection Method
The Florida peer selection process attempts to identify comparable transit systems through a point scoring system based on the following eight original or derived variables (or measures): Service area population density Revenue miles Average speed Service area population Vehicles operated in maximum service Passenger trips Revenue hours Total operating expense
The first three variables are considered primary and the rest are secondary. Under the scoring system, primary variables are given extra points. The performance of each of the potential non-Florida peers is compared to the average of the Florida systems for each of the eight measures. A peer receives one point for each measure for which it is within one standard deviation of the Florida systems' mean. One-half point is given for each measure that fell between one and two standard deviations from the Florida systems' mean.
The scoring system can also be based on percentage rather than standard deviation. In the percentage-based method, a peer receives one point for each measure for which it was within 10 percent of the Florida systems' mean. One-half point is given for each measure that fell between 10 and 15 percent from the Florida systems' mean. In both cases, an extra one-half point is given for each of the three primary measures.
Figure 2-35 shows the main INTDAS interface for the old Florida peer selection process. The steps for setting up a peer group are as follows:
1. Select the state (default is Florida) for which its transit systems (i.e., local) are to be compared with peers from the other states.
2. Enter a range for the local grouping variable to find a group of local transit systems that are of comparable size.
3. Click the Get Systems button to find transit systems that satisfy the input conditions.
4. Select a scoring method and the corresponding scores to be assigned to different ranges of standard deviation (or percentage) for both primary and secondary variables.
5. Select one or more peer states. The default peer states are: Alabama, Arkansas, Georgia, Kentucky, Louisiana, Mississippi, North Carolina, South Carolina,
2-50

SECTION 2 INTDAS
Tennessee, Texas, and Virginia. You may reset the default peer states by first selecting your desired states and then click the Set as Default button.
6. Select the mode code(s) that are to be considered. The Select mode code list box lists only those modes available for the selected local systems.
7. Select primary and secondary measures from the list of available variables. This is done by first selecting the measures from the lists of variables and then checking the variables that are to be used as the primary variables. Variables that are unchecked are treated as the secondary variables. See the previous section on the difference between the primary and the secondary variables.
8. Click the Next button at the bottom of the screen to start the peer selection process. When it is completed, the scores for all potential peers are listed, as shown in Figure 2-35. A high score means that the transit system is similar to the local group of transit systems. Select the top transit systems on the list as peers by clicking the corresponding checkboxes. As shown in Figure 2-36, the selected local and peer systems are listed on the two list boxes on the lower half of the screen, respectively. The selected systems can then be saved as a peer group and retrieved as a group.
Figure 2-35: Main Interface for the Florida Peer Selection Method
2-51

SECTION 2 INTDAS
Figure 2-36: List of Ranked Potential Peers for Selection
A wizard-like option of the same peer selection process is also available. It is accessible from the Setup|Old Florida Peer Selection Method|Wizard dropdown menu item. This option takes the user through the selection process step-by-step, with instructions provided for each step. The multiple screens associated with this option perform the very same steps described above.
Find Your Peer Systems
INTDAS implements an easy-to-use procedure for you to quickly find a specific number of peer systems that are considered to be the most similar to your chosen system. The procedure is implemented in the following wizard-like steps:
1. Select the state in which the system resides (see Figure 2-37). All the systems within the selected state will be listed. Idenitify the system of interest and then highlight it. Click Next to go to the next step.
2-52

SECTION 2 INTDAS
Figure 2-37: Step 1: Select Transit System of Interest
2. Select peers states from which the peer systems are to be selected from (see Figure 2-38). You may select your peer states from the list box or from the GIS map. You may also use a combination of the two methods since the selections are synchronized. With the GIS-based selection, you may use different methods to make your selection. To select multiple states from a contiguous region, for example, you may find the “drawing a rectangle” method helpful. After you have selected your peer states, you can set them as the default states so that the next time you use this function, the states will be automatically selected. Click Next to go to the next step or Back to go back to the previous step.
3. Select data year, mode code, and service type (see Figure 2-39). For mode code, you may select either individual modes or aggregate modes (i.e., multiple modes combined). The same applies to the selection of service types. It is important to note that if you do select any of the aaggregate options for mode code or service type, then you are restricted to using only the Florida standard variables (FSV) or user-defined variables for your peer variables (see the next step). Click Next to go to the next step or Back to go back to the previous step.
Figure 2-38: Step 2: Select Peer States
2-53

SECTION 2 INTDAS
Figure 2-39: Step 3: Select Data Year, Mode Code, and Service Type
2-54

SECTION 2 INTDAS
4. Select number of peer systems, peer variables and the associate weights, and treatment of null cells (see Figure 2-40). You may select up to a total of 100 peer systems. The default is five. You may select any number of peer variables from the different variable groups, except for the constraint desribed in the previous step. For each peer variable you selected, you may attach a relative weight to it. The default weight is 1. If you feel that a variable is three times a variable with a weight of 1, you should enter a weight of 3 for the variable. A combination of 9 and 3 for the two variables would have resulted in the same weighting for the two variables. To enter a weight, double click the targeted cell. Hit the Escape or Enter key after you finish entering the value. You may click the Save as a Group button to save your peer variables and weights. A saved group will be added to the Variable Groups tab and can be retrieved qucikly later. The entry for the Null-value Treatment option allows you to specify the minimum percenetage of non-null values that a potential peer system must have to be considered in the peer selection process. For example, if you have selected a total of five peer variables, by the default 50%, a system that has three (out of five) variables with a missing value (i.e., 60% of null values and 40% of non-null values) will not be considered as a potential peer, since 40% does not meet the 50% required minimum. Click Next to go to the next step or Back to go back to the previous step.
Figure 2-40: Step 4: Select Number of Peer Systems, Peer Variables and Weights
2-55

SECTION 2 INTDAS
5. In this step, the X number of peer systems with the corresponding values for each peer variable will be displayed in a table (see Figure 2-41). The first system by default is your chosen system. The other systems are listed from top to bottom, starting with the closest peer. Within this step, you may click Save to save your output systems as a peer group (see Figure 2-42). A saved group will be added to the Groups tab on the INTDAS main screen.
Figure 2-41: Peer Selection Output Screen
Figure 2-42: Screen for Saving a Peer Group
2-56
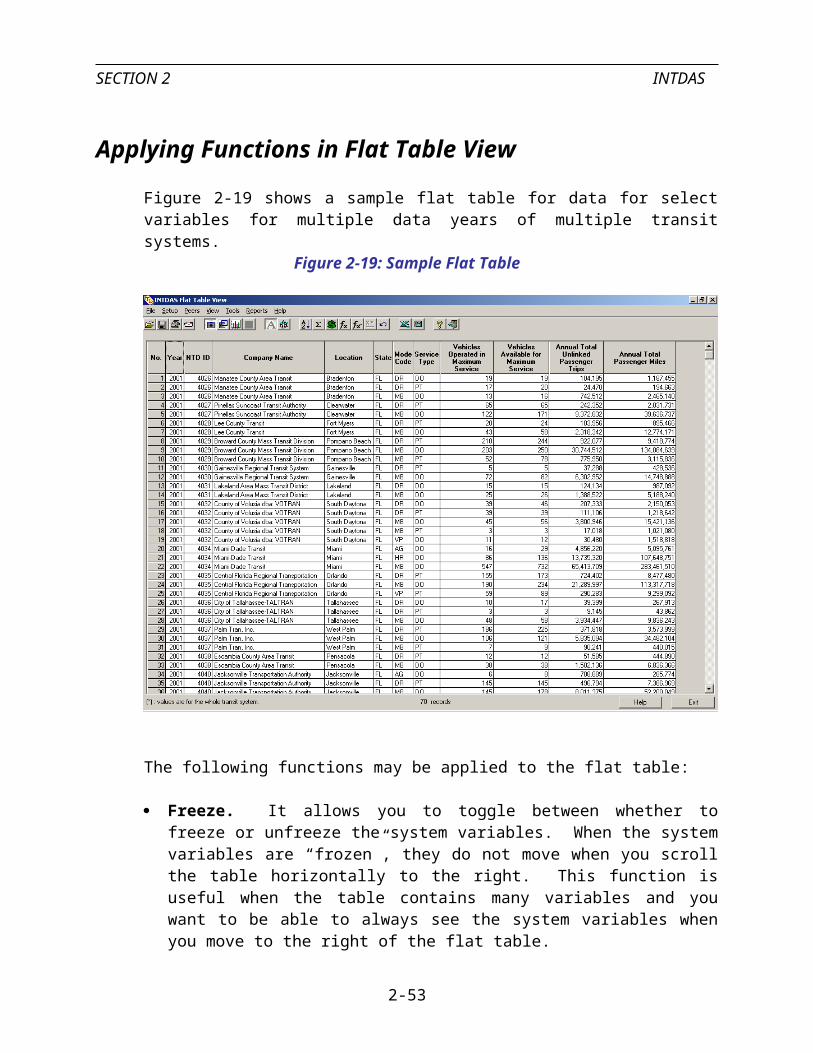
SECTION 2 INTDAS
Create Multiple Peer Groups
INTDAS includes a procedure for you to quickly form groups of similar systems. The procedure is very similar to the one for finding the closest X number of systems, as described in the previous section. Again, the procedure consists of a wizard-like set of steps, as follows:
1. Select peers states from which the peer systems are to be selected (see Figure 2-43). You may select your peer states from the list box or from the GIS map. You may also use a combination of the two methods since the selections are synchronized. With the GIS-based selection, you may use different methods to make your selection. To select multiple states from a contiguous region, for example, you may find the “drawing a rectangle” selection method helpful. After you have selected your peer states, you can set them as the default states so that the next time you use this function, the states will be automatically selected. Click Next to go to the next step or Back to go back to the previous step.
Figure 2-43: Step 1: Select Peer States
2-57

SECTION 2 INTDAS
2. Select data year, mode code, and service type (see Figure 2-44). For mode code, you may select either individual modes or aggregate modes (i.e., multiple modes combined). The same applies to the selection of service types. It is important to note that if you do select any of the aaggregate options for mode code or service type, you are restricted to using only the Florida standard variables (FSV) or user-defined variables for your peer variables (see the next step). Click Next to go to the next step or Back to go back to the previous step.
Figure 2-44: Step 2: Select Data Year, Mode Code, and Service Type
3. Select number of peer groups, peer variables and the associate weights, and treatment of null cells (see Figure 2-45). You may select up to a total of 10 peer groups. The minimum number of peer groups is two. The default is five. You may select any number of peer variables from the different variable groups, except for the one constraint that was desribed in the previous step. For each peer variable you selected, you may attach a relative weight to it. The default weight is 1. If you feel that a variable is three times another variable with a weight of 1, you should enter a weight of 3 for the variable. A combination of 9 and 3 for the two variables would have resulted in the same weighting for the two variables. To enter a weight, double click the targeted cell. Hit the Escape or Enter key after you finish entering the value. You may click the Save as a Group button to save your peer variables and weights. A saved group will be added to the Variable Groups tab. The entry for the Null-
2-58

SECTION 2 INTDAS
value Treatment option allows you to specify the minimum percenetage of non-null values that a potential peer system must have to be considered in the peer selection process. For example, if you have selected a total of five peer variables, by the default 50%, a system with three (out of the five) variables with a missing value (i..e., 60% of null values and 40% of non-null values) will not be considered as a potential peer, since 40% does not meet the 50% required minimum. Click Next to go to the next step or Back to go back to the previous step.
Figure 2-45: Step 3: Select Number of Peer Systems, Peer Variables and Weights
4. In this step, the peer systems in each output group together with the associated peer variable values can be displayed group by group (see Figure 2-46). By default, groups are numbered sequentially and the peer systems for the first group is displayed. To view peer systems in each group, simply click the group name. Within this step, you may click Save to save the output groups, which will be added to the Groups tab on the INTDAS main screen. Before you save your groups, you may rename the default group names using the Edit group name textbox.
Figure 2-46: Automated Peer Grouping Output Screen
2-59

SECTION 2 INTDAS
2-60

SECTION 3 FTGIS
FTGIS
FTGIS (Florida Transit Geographic Information Systems) is a stand-alone GIS component developed using the MapObjects 2.0 library of the ESRI. It is designed to completely replace the previous version of FTGIS developed by the Center for Urban Transportation Research (CUTR). As with the previous version, this version is customized for easy access to several GIS shape files that come with FTGIS for Florida's transit systems. FTGIS includes functions ranging from the very basic zoom-in and zoom-out operations to the highly customized buffer zone analysis.
Why FTGIS?The transit industry has been a major user of GIS because transit facilities and planning information are highly spatial oriented. Good examples of GIS applications by the transit industry include service planning, service evaluation, bus stop inventory, etc. FTGIS serves as a common repository for spatial data important for transit planning. The stand-alone nature of FTGIS provides the users access to a customized GIS system without an expensive commercial GIS system installed in their computer. Because FTGIS is developed at the source-code level with the aid of a GIS library, it has the flexibility of being tailored for specific application needs.
Getting StartedFTGIS is accessible from the FTIS Main Menu screen. Clicking the FTGIS button on the FTIS Main Menu will invoke the screen shown in Figure 3-1.
The first tab lists the transit systems for which GIS data are currently available. Double-click a list item to select a transit system and enter the GIS interface.
The second tab allows you to identify and select a transit system by a map shown in Figure 3-2. Each point on the map corresponds to an urban area where a transit system is located. Double click a city to select a transit system and enter the GIS interface.
3-1

SECTION 3 FTGIS
Figure 3-1: Screen for Selecting a Transit System by List
FTIS provides direct access to two GIS systems: FTGIS and ArcView. The selection is made at the bottom of the screen. The radio button for ArcVirew is active only if your computer is installed with ArcView. The default GIS interface is FTGIS. If, for any reason, you either prefer or need to use ArcView, you can simply select the ArcView option as the interface you want to launch. Refer to ArcView manuals for instructions on how to use ArcView.
As shown in Figure 3-1, the System Selection by List option also allows the list to be modified to either add a new transit system or delete an existing one. Note that update to the list does not automatically update the System Selection by Map option. In other words, any new systems you added can only be accessed by the By list option.
3-2

SECTION 3 FTGIS
Figure 3-2: Screen for Selecting a Transit System by Map
FTGIS FunctionsFTGIS currently supports the following GIS functions:
Map Viewing. It allows maps to be zoomed in, zoomed out, panned, zoomed to the extent of all layers, and zoomed to the extent of the current layer.
Map and Layer Properties. It allows customized map background color, line color, line width, and line style.
Map Legend. It includes an ArcView-like map legend, which allows the users to choose which layers to display and in what order the layers are to be displayed.
Map Labeling. It includes a set of functions to display labels based on a selected variable. The user can change the text color, font type, font size, location, and style.
3-3

SECTION 3 FTGIS
Map Queries. It includes the usual Identity function to retrieve data for a specific spatial unit and a Find function to search for spatial units containing a search text.
Map Workspaces. It allows the current map view to be saved and retrieved quickly. Map Select. It allows the users to select spatial units by point, line, circle, rectangle,
and polygon. Selected items can be saved to a new data layer. Thematic Map. It includes a set of functions for creating different thematic maps. Map Charting. It allows the users to create pie and bar charts on the map based on
one or more data attributes. Map Graphics. It allows the users to add texts, lines, points, circles, rectangles, and
ellipses to the map. Map Editing. It allows the users to edit point and line shapes. The editing functions
include delete a line or a point, move a line or a point, and insert a point. Data Editing: It allows the users to modify the data for a selected feature. Buffer Zone Analysis. It allows the users to perform buffer zone analysis for either
selected features of a layer or for a whole layer. Image Background. It allows display of aerial photographs as the background. Table. It allows the user to view the tabulated data for all records or selected records
only. Selected data can be exported to an Excel or a text file. Formula Setup. It allows up to two new variables to be computed from existing
variables for polygon layers. Miscellaneous other features. Other features include map tips, map printing, add or
delete a layer, etc.
GIS Data IncludedFTGIS currently includes the ArcView shapefiles for the following layers:
Street Transit route Bus stop Census tract Census blockgroup Census block Census Traffic Analysis Zone
Table 3-1 gives the attributes that are currently included in all the census layers. Data for these variables were extracted from Census Summary Tape File #1. Tables 3-2a and 302b give a set of additional attributes that are available only for the census blockgroup and tract layers. Data for these attributes were extracted from Census Summary Tape File #3.
3-4

SECTION 3 FTGIS
Table 3-1: Available Attributes for All Census Layers
Attribute Name DescriptionTOTAL_POP Total populationWHITE Total White populationBLACK Total Black or African American populationINDI_ALASK Total American Indian and Alaska Native populationASIAN Total Asian populationPACIFIC Total Native Hawaiian and Other Pacific Islander populationOTHER_RACE Total population of some other raceMIXED_RACE Population of two or more racesHISPANIC Total population of Hispanic or Latino originMALE Total male populationFEMALE Total female populationAGE_0_4 Number of persons between 0 and 4 years oldAGE_5_9 Number of persons between 5 and 9 years oldAGE_10_14 Number of persons between 10 and 14 years oldAGE_15_17 Number of persons between 15 and 17 years oldAGE_18_19 Number of persons between 18 and 19 years oldAGE_20_24 Number of persons between 20 and 24 years oldAGE_25_29 Number of persons between 25 and 29 years oldAGE_30_39 Number of persons between 30 and 39 years oldAGE_40_49 Number of persons between 40 and 49 years oldAGE_50_59 Number of persons between 50 and 59 years oldAGE_60_69 Number of persons between 60 and 69 years oldAGE_70_79 Number of persons between 70 and 79 years oldAGE80_OVER Number of persons 80 or above years oldMEDIAN_AGE Median ageHOUSE_UNIT Total number of housing unitsOCPIED_HU Number of occupied housing unitsVACENT_HU Number of vacant housing unitsOWNER_HU Number of housing units occupied by ownersRENTER_HU Number of housing units occupied by rentersTOTAL_HH Total number of householdsHH_W1_PERS Households with one personHH_W2_PERS Households with two personsHH_W3_PERS Households with three personsHH_W4_PERS Households with four personsHH_W5_PERS Households with five personsHH_W6_PERS Households with six personsHH_W7_PERS Households with seven or more personsAV_HH_SIZE Average household size
3-5

SECTION 3 FTGIS
Table 3-2: Available Attributes for Census Blockgroup and Tract Layers
Attribute Name DescriptionENG_ONLY Household language: English onlySPAN_ONLY Household language: Spanish onlySPAN+ENG Household language: English and SpanishOTHER_ONLY Household language: Other than English and Spanish onlyOTHER+ENG Household language: Other and EnglishFORGN_BORN Foreign-born populationDRIVEALONE Drive alone to work for workers 16 years or overCARPOOLED Carpooled to work for workers 16 years or overTRANSIT Take transit to work for workers 16 years or overOTHR_MODES Use other modes to work for workers 16 years or overWORKATHOME Work at home for workers 16 years or overTT_LT_15M Travel time to work less than 14 min for workers 16 years or overTT_15_29M Travel time to work is 15-29 min for workers 16 years or overTT_30_59M Travel time to work is 30-59 min for workers 16 years or overTT_GT_60M Travel time to work is 1 hour or more for workers 16 years or overTTT_LT_30M Transit travel time to work is less than 30 min for workers 16 years
or overTTT_30_44M Transit travel time to work is 30-44 min for workers 16 years or
overTTT_45_59M Transit travel time to work is 45-59 min for workers 16 years or
overTTT_GT_59M Transit travel time to work is 1 hour or more for workers 16 years
or overLH_12_459A Time leaving home to work between 12:00 am and 4:59 am for
workers 16 years or overLH_5_559A Time leaving home to work between 5:00 am and 5:59 am for
workers 16 years or overLH_6_659A Time leaving home to work between 6:00 am and 6:59 am for
workers 16 years or overLH_7_759A Time leaving home to work between 7:00 am and 7:59 am for
workers 16 years or overLH_8_859A Time leaving home to work between 8:00 am and 8:59 am for
workers 16 years or overLH_9_1159A Time leaving home to work between 9:00 am and 11:59 am for
workers 16 years or overLH_12_359P Time leaving home to work between 12:00 pm and 3:59 pm for
workers 16 years or overLH_4_1159P Time leaving home to work between 4:00 pm and 11:59 pm for
workers 16 years or over
3-6

SECTION 3 FTGIS
Table 3-2: Available Attributes in Census Blockgroup and Tract Layers (continued)
Attribute Name DescriptionTOTAL_DISB Total population 5 years and over with disabilitiesSENSO_DISB Total population 5 years and over with sensory disabilitiesPHY_DISB Total population 5 years and over with physical disabilitiesMENTL_DISB Total population 5 years and over with mental disabilitiesEMPLY_DISB Total population 5 years and over with employment disabilitiesOTHER_DISB Total population 5 years and over with other disabilitiesEMPLOYED Employed population 16 years or overUNEMPLOYED Unemployed population 16 years or overINC_<10K Household income less than $10,000INC_10<20K Household income from $10,000 to $19,999INC_20<30K Household income from $20,000 to $29,999INC_30<40K Household income from $30,000 to $39,999INC_40<50K Household income from $40,000 to $49,999INC_50<60K Household income from $50,000 to $59,999INC_60<75K Household income from $60,000 to $74,999INC75<100K Household income from $75,000 to $99,999INC_>100K Household income $100,000 or moreAVG_HH_INC Average household incomeHH_W_SOSI Households with social security income in 1999HH_WO_SOSI Households without social security income in 1999HH_W_SSI Households with supplemental security income in 1999HH_WO_SSI Households without supplemental security income in 1999HH_W_PAI Households with public assistance income in 1999HH_WO_PAI Households with public assistance income in 1999HH_W_RI Households with retirement income in 1999HH_WO_RI Households without retirement income in 1999HH_0_VEH Housing units with no vehicleHH_1_VEH Housing units with one vehicleHH_2_VEH Housing units with two vehiclesHH_3_VEH Housing units with three vehiclesHH_>3_VEH Housing units with three or more vehicles
Notes:
Unless specified otherwise, the data are updated to the year 2000 or later.
The street layers were developed based on the 2000 TIGER/Line files.
The route layers were either obtained directly from the transit agencies or were updated from the old route layers using hardcopy route maps provided by transit agencies.
3-7

SECTION 3 FTGIS
Only a few up-to-date bus stop layers have been obtained from transit agencies. Stops layers that have not been updated are labeled “old” as part of the shapefile name.
The census tract, blockgroup, block, and TAZ data were developed based on the 2000 TIGER/Line files and the 2000 Census. The TAZ layers are available for only those urban areas that submitted the TAZ-census equivalency tables to the Census Bureau for inclusion in the 2000 Census.
In addition to the census data, aerial photographs are included for the following transit systems: Broward County Transit, Miami Dade Transit, Tallahassee Transit, and Palm Beach County Transportation Authority.
Map Legend, Map View, and Table ViewOnce you have double-clicked to select a transit system and you have selected FTGIS as your GIS interface, you will enter the FTGIS main screen. All available layers for the selected systems will be automatically loaded. The Street and the Route layers are automatically displayed. By default, the Route layer is displayed on top of the Street layer and has a thicker line width. The viewing area of the screen is made up of map legend on the left and the map view on the right, as shown in Figure 3-3.
The map legend lists all of the available GIS layers by their shapefile names for the selected transit system. In front of each shapefile name (i.e., a layer), a check box allows you to choose the layers you want to display in the map view.
Notes:
The layers with their box checked are displayed in the map view in the same order as listed in the map legend.
To reorder the map layers, for example, to display a route layer above the street layer, drag the route layer in the map legend to a location above the street layer.
Out of all the available layers, there is always a “current” layer, referred to as the active layer. The active layer is one that is highlighted with a raised bar in the legend. Many FTGIS functions are automatically assumed to apply to the active layer.
3-8

SECTION 3 FTGIS
Figure 3-3: FTGIS Map Legend and Map Viewing Areas
The Map view on the right occupies the first of the two tabs, which are accessible from the bottom of the view. The second tab is for the Table view. Figure 3-4 shows an example of a table view. You may switch from one tab to another by clicking the tab.
The Table tab will always display the data table for the active layer. You can switch from one table to another by clicking a new layer (i.e., reset the active layer) in the legend. The Table dropdown menu allows you to select whether to display all records or selected records only. You can save the displayed records as either an Excel file or a comma-delimited text file by selecting the File|Save into a File dropdown menu item.
3-9

SECTION 3 FTGIS
Figure 3-4: FTGIS Table Viewing Area
Save and Retrieve WorkspacesFTGIS allows you to save your current map view as a workspace so that the same view can be retrieved quickly. For example, after you have created a thematic map with customized colors and other setups, you may want to save it so that you can use it in a presentation without repeating the same setups.
To save your current map view, select File|Save Workspace As menu item. The screen in Figure 3-5 will pop up. Enter a name for your workspace. You may optionally enter a description for your workspace.
3-10

SECTION 3 FTGIS
Figure 3-5: Screen for Saving a Workspace
To retrieve a saved workspace, select the File|Open Workspace menu item. The screen in Figure 3-6 will appear. Click a saved workspace on the list and then click Open to retrieve the workspace. By default, the screen will show all the workspaces saved for the current transit system. To retrieve a workspace of another transit system (so that you can quickly go from one system to another, you can select the “all systems” radio button, which will show workspaces that have been saved for all transit systems. To delete a workspace, highlight the workspace name and then click Delete.
Figure 3-6: Screen for Retrieving a Workspace
3-11

SECTION 3 FTGIS
Once a workspace has been opened or saved, it becomes the current workspace. When there is a current workspace, you may select the File|Save Workspace menu item to replace the current workspace with the current map view.
Map PropertiesThe Map Properties screen, as shown in Figure 3-7, allows you to set the properties of the Map view. To access the Map Properties screen, select View|Map Properties from the dropdown menu. The screen allows you to select:
whether to have a map border for the map view,
whether you want the Escape key to take no action, stop drawing all layers, or stop drawing the active layer,
whether you want to have scrollbars on your map view,
whether you want to have depressed map view to create a 3D appearance, and
the color of your map background (the default is plain white).
Figure 3-7: Map Properties Screen
3-12

SECTION 3 FTGIS
Layer PropertiesThe Layer Properties screen allows you to set the appearance of a specific layer for display. Depending on the shapefile type (point, line, or polygon), the property items are slightly different. Figures 3-8, 3-9, and 3-10 show the property setting screens for point, line, and polygon layers, respectively. Settings for point layers include point color, style, and size. Settings for line layers include line color, style, and width. Settings for polygon layers include polygon outline (or border) color, outline width, fill color, and fill style.
Figure 3-8: Screen for Setting Point Layer Properties
Figure 3-9: Screen for Setting Line Layer Properties
Figure 3-10: Screen for Setting Polygon Layer Properties
3-13

SECTION 3 FTGIS
The operations for the three screens are similar. For example, to invoke this screen for a point layer and make changes to the settings:
Double-click the target layer in the legend or select the View|Layer Properties dropdown menu item. The listed layer is the active layer and cannot be changed while you are on the screen.
Click the Marker Color box to invoke the screen in Figure 3-11 to change to a different feature color. Color a color grid and then click OK to select a color.
Figure 3-11: Screen for Defining a Layer Color
Click the Style dropdown list to define a shape for feature display.
3-14

SECTION 3 FTGIS
Click the spinner button to set the line width.
Click Apply to preview the results of your selections.
Click OK to retain changes and exit the screen or click Cancel to exit without changes.
Describe LayerFigure 3-12 shows the screen that gives the basic information for a layer, including the file path to shapefile, shape type, map units, number of records, and data fields and associated data type. The screen is accessible from the View|Describe Layer dropdown menu item.
Figure 3-12: Screen for Describing a Layer
Remove Active or All LayersIf, for any reason, you want to remove the active layer or all the loaded layers, you may select the View|Remove Active Layer or View|Remove All Layers dropdown menu item, respectively.
Image Background
3-15

SECTION 3 FTGIS
FTGIS allows you to display aerial images in the map background. Figure 3-13 shows an example of an image background. To display images, click the Image checkbox at the bottom-right corner of the main screen. To remove images, simple uncheck the checkbox. The checkbox is active only if image files are found in the file folder for the selected transit system. To view information related to the image files, select the View|Image Documentation dropdown menu item.
Figure 3-13: Image Background
Note: When images are displayed, the vertical and horizontal bars of the map window are not available. You must use the Pan button to move from one area to another.
Change Feature Color at Mouse CursorYou can have the color of the feature at the mouse cursor change to a different color to highlight the feature. To activate this function, select the View|Change Feature Color at Mouse Cursor dropdown menu item. The default is not to have the color changed.
Toolbar Commands
3-16
SECTION 3 FTGIS
The common commands in FTGIS are implemented in a toolbar in the main screen. Placing your mouse cursor across a button will reveal a tooltip for the button. The commands in the FTGIS toolbar are shown in Figure 3-14.
Figure 3-14: FTGIS Toolbar
Return to System
Selection
Print Map
Add Layer
Draw
Graphics
Full Map Extent
Start Editing
Measure D
istance
Active Layer Extent
Zoom O
ut
Buffer Zone A
nalysis
Zoom In
Pan
FindIdentify
Stop Buffer Processing
Create C
harts
Create Labels
Create Them
atic Maps
Send Map
Clear A
ll
Help
Formula Setup
Return to System Selection allows you to return to the System Selection screen (see Figures 3-1 and 3-2) to switch to another transit system.
Print Map allows you to print the current map view to your default printer.
Add Layer allows you to add a new layer.
Graphics allows you to invoke the graphics toolbar to write text and draw geometric features on the tacking layer.
Start Editing allows you to invoke the editing toolbar to start editing the active layer.
Measure Distance allows you to draw one or more connected line segments and measure the distance between the starting and ending points.
Map Full extent allows you to change the map extent in the map view to include all features in all map layers
Active Layer Extent allows you to change the map extent to that of the active layer.
3-17

SECTION 3 FTGIS
Zoom In allows you to change the map extent to span two points that you set by dragging the mouse in the map view.
Zoom Out allows you to decrease the map scale by a factor of two, centered on a point you click with the mouse.
Pan allows you to change the map extent of the map view by dragging the mouse from one point to another.
Identify allows you to identify features at or near where you click with the mouse.
Find allows you to invoke the Find Features screen, which allows you to locate features by matching attribute values.
Buffer Zone Analysis allows you to invoke the steps for performing buffer zone analysis.
Stop Processing allows you to stop the buffer zone processing.
Draw Charts allows you to invoke the Draw Charts screen to draw pie or bar charts for the active layer.
Thematic Maps allows you to invoke the Thematic Maps screen to create thematic maps based on attribute values of the active layer.
Label allows you to invoke the Label screen to add label based on attribute values of the active layer.
Clear All allows you to clear all graphics, themes, charts, and labels.
Send Map allows you to email a screen capture of the current map view as a file attachment.
Help allows you to access the FTGIS online help.
The following sections provide additional details for some of these functions.
Map PrintingTo print your map shown in the map view, you click the Print Map tool button or select the File|Print... dropdown menu item to invoke the screen shown in Figure 3-15. The screen will ask you to select a scale to print. For example, 1/2 scale will print to your map to cover half of the page. The default is full scale and will print to cover the full page. After you have selected a print scale, click Next to invoke the standard Windows
3-18

SECTION 3 FTGIS
print screen, which allows you make additional selections, including printer, paper orientation, and number of copies. Click Print to start printing.
Figure 3-15: Screen for Map Printing
Add LayerThe Add Layer function allows you to add a layer or an image file. You may add any files with any of the following extensions:
ESRI Shapefiles (*.shp) ESRI Coverages (*.adf, *.tat, *.pat, *.rat) GRID (hdr.adf) CAD drawings (*.dwg, *.def) VPF (*.pft, *.lat, *.aft, *.tft) Standard and military image formats
Figure 3-16 shows the screen for finding and selecting a layer of a particular file type. It is invoked from the Add Layer tool button or the File|Add Layer dropdown menu item.
3-19

SECTION 3 FTGIS
Figure 3-16: Screen for Adding a Layer
GraphicsThe Graphics function allows you to draw the following graphics on the map view: texts, points, lines, rectangles, polygons, and ellipses. Clicking the Graphics tool button or selecting the Edit|Draw Graphics dropdown menu item will activate the tool buttons shown in Figure 3-17 for drawing each of the graphics.
Figure 3-17: Tool Buttons for Drawing Graphics
To add text, click the first tool button in Figure 3-17, move your mouse cursor to the desired map location, and then left click. The screen shown in Figure 3-18 will pop up. Enter the text label and then click OK.
3-20

SECTION 3 FTGIS
Figure 3-18: Screen for Specifying Text Label
To draw a point, click at the desired location for the point. To draw a line, a rectangle, a polygon, or an ellipse, point your mouse cursor at the desired start location, hold down your left mouse button, drag your mouse cursor to the desired end location, and then release the left mouse button.
Map EditingThe map editing function allows you to edit an existing feature, add a new feature by drawing with the mouse, or select features from another layer and add them to the current layer. This version only allows point and line layers to be edited. To start editing:
Click the Start Editing tool button or select the Edit|Start Editing menu item. This will take you into the editing mode and bring up the Edit tool panel in Figure 3-19.
Figure 3-17: Edit Tools Panel
Select a feature to edit by clicking on it. The selected feature and its associated nodes will be highlighted in red, as shown in Figure 3-20. All applicable buttons in the Edit tool panel will become active.
3-21

SECTION 3 FTGIS
Figure 3-20: Selected Feature
Click one of the tool buttons on the Edit tool panel to select an editing function. The button for the selected function will be depressed. Figure 3-19 shows that the selected editing function is to move a node.
To move a feature, left click a highlighted node (the highlighted node will turn white), hold down the button, and drag the node to a new location. In the case of moving a line, select the Move Line button, place your cursor across the feature, hold down your left mouse button, and then drag it to a new location. Click the Undo button to undo a change.
To add a node, select the Add Node button and then left click at the location where the node is to be added.
To delete a feature, select the feature to delete and then click the Delete Node or Delete Line button. This action cannot be undone.
If you know the specific coordinate for a node, you may want to edit the node coordinate manually. To do so, click the Edit Nodes button. The screen shown in
3-22
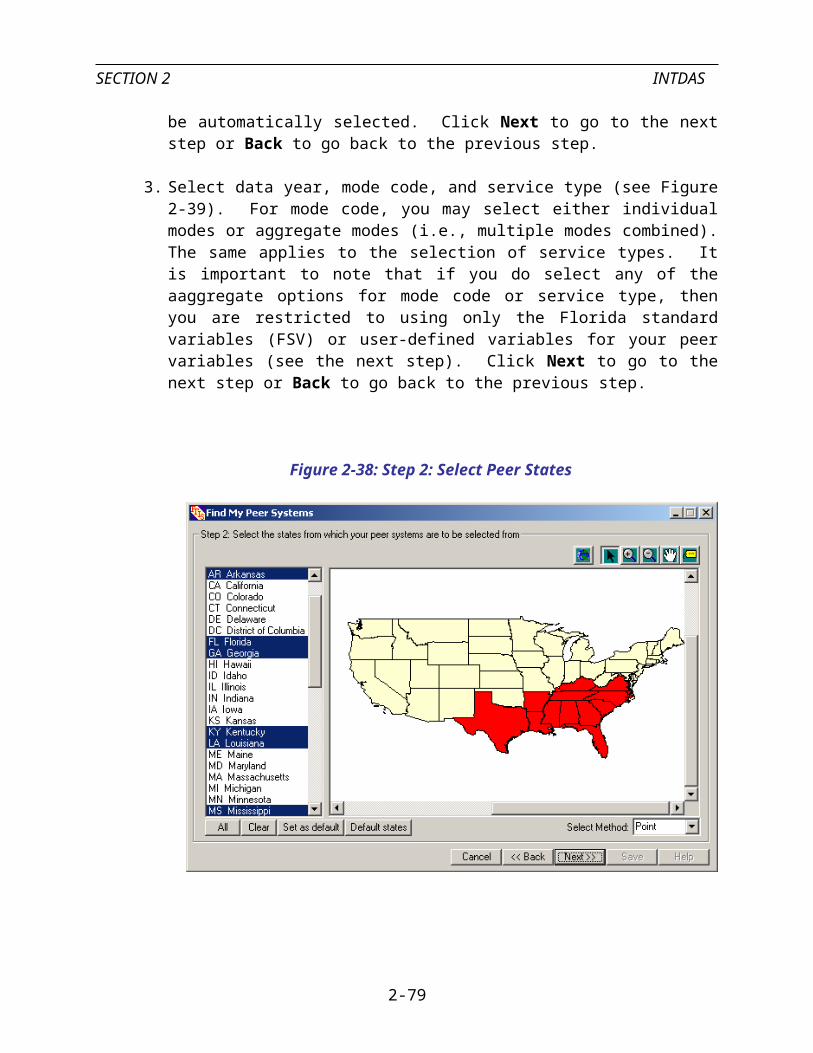
SECTION 3 FTGIS
Figure 3-21 will pop up. The screen lists all the node coordinates. To select a node to edit, click an item on the list. The corresponding feature will blink. Click the Edit button to enter a new coordinate. Click the Delete button to delete the node. Click the Insert button to insert a node.
Figure 3-21: Screen for Editing Nodes Manually
To edit the data associated with a selected feature, click the Edit Fields button. The screen shown in Figure 3-22 will pop up. Double click a Value cell to edit the value.
Figure 3-22: Screen for Editing Feature Data
FTGIS also allows you to add a feature by drawing a line by mouse or select features from another layer and add them to the current layer. To do so:
3-23

SECTION 3 FTGIS
In the Editing mode, select the Edit|Add New Features dropdown menu item. The screen shown in Figure 3-23 will pop up.
Figure 3-23: Screen for Adding Features by Drawing or from Another Layer
Select the first radio button if you want to select features from an existing layer. Once this radio button is selected, the dropdown list will display all the visible layers. Select one visible layer. Instructions on how to proceed from this point will appear at the lower half of the screen. Click OK.
Left click a feature to select it. To select additional features, hold down the Shift key while making the selection. Features must be connected for any successive selections.
Click the Add Line button in the Edit tool panel to add the selected features to the current layer.
To draw a line by mouse:
1. Select the second radio button. Once the button is selected, instructions on how to proceed from this point will appear at the lower half of the screen. Click OK.
2. Start drawing a line. Single left click to draw the beginning and intermediate nodes of a line and double left click to end the line.
3. Click the Add Line button in the Edit tool panel to add the selected features to the current layer.
To stop editing, either click the Start Editing tool button again or select the Edit|Stop Editing dropdown menu item.
3-24

SECTION 3 FTGIS
Set Snapping ToleranceWhen the ends of two adjacent lines come close to within a certain distance during editing, you may want them to be connected by snapping the two ends together. You can set a tolerance for determining whether to snap the nodes by selecting the Edit|Set Snapping Tolerance dropdown menu item, which brings up the screen shown in Figure 3-24. To enable the snapping function, select the Edit|Enable End Snapping dropdown menu item. When this menu item is disabled, the snapping will not take place even when two end nodes come to within the set tolerance.
Figure 3-24: Screen for Setting Snapping Tolerance
Measure DistanceThe Measure Distance function allows you to draw a line of multiple segments and calculate the total distance in feet, meters, and miles. To perform this function:
1. Click the Measure Distance tool button or select the Tools|Measure Distance dropdown menu item.
2. Left click at the location of the starting location.
3. Move the mouse to the second location and left click. Continue this step for additional line segments.
4. Double left-click the last point of the line. The resulting distances in different units will be displayed in a pop-up screen as shown in Figure 3-25.
Figure 3-25: Output Screen from Distance Measurement
3-25

SECTION 3 FTGIS
IdentifyThe Identify function allows you to retrieve and display data attributes associated with all features near the point of a mouse click. An example of the retrieved results is shown in Figure 3-26.
Figure 3-26: Screen Showing Identified Results
The Feature field lists the features in all the visible layers that come close to the location of the mouse click. After you have selected an item from the Feature list, the
3-26

SECTION 3 FTGIS
corresponding feature in the map will blink to signal the feature of which the results are being displayed. The results are displayed in the Attributes list box.
FindThe Find function lets you search for all features that match a search string in the selected layers. To find features:
1. Click the Find tool button or select the Tools|Find... dropdown menu item. The screen shown in Figure 3-27 will pop up.
Figure 3-27: Screen for Finding Features
2. Enter a search string.
3. Check the layers you would like to search or check the Select all layers box to select all layers.
4. Click the Find button to start finding features matching the search string.
3-27

SECTION 3 FTGIS
5. After the search is completed and features are found, click a feature on the Pick a feature list.
6. Click the Highlight button to blink the feature. The feature may or may not be positioned in the visible map extent.
7. Click Insert Pin button to insert a pin at the feature.
8. Click the Pan To button to position the selected feature at the center of the screen.
9. Click the Zoom To button to zoom into the selected feature.
Buffer Zone AnalysisFTGIS allows you to create buffer zones around point or line features. You may also select one or more features or all features (i.e., the whole layer) to buffer. A buffer zone analysis is performed in several steps. A wizard is used to guide you through these steps.
Figure 3-28 shows the screen for the first step. It allows you to choose the layer of which the features are to be used to create buffers. Only visible layers are listed. Instead of creating a buffer around an existing feature, you can also choose to draw a feature using your mouse cursor. You select this option by clicking the second radio button.
Figure 3-28: Screen for Step 1 of Buffer Zone Analysis
3-28

SECTION 3 FTGIS
Figure 3-29 shows the screen for Step 2. It allows you to select a method to select features (to create buffer) from the selected layer.
You may choose to select only some or all features. Choose the first radio button if you want to select only some features. Several methods are available to select features.
You may use your mouse to either point to a feature, draw a line that overlaps the desired features, draw a circle that encloses all features within a certain radius, or draw a rectangle that encloses the desired features.
As soon as you have chosen one of the feature selection methods, some instructions will appear on the screen to guide you through the selection.
To perform multiple selections, hold down your Shift key while making additional selections. Once you have completed your selections, click Next to proceed to Step 3.
Figure 3-29: Screen for Step 2 of Buffer Zone Analysis
Figure 3-30 shows the screen for Step 3. It allows you to specify the width of the buffer in a select unit, whether to dissolve buffer barriers, and to change the buffer zone color. Click Next to proceed to create buffer. Figure 3-31 shows an example of a buffer that is performed for the whole Taltran bus route layer, with buffer barriers resolved. Once the buffer zones are created, the screen shown in Figure 3-32 will pop up.
3-29

SECTION 3 FTGIS
Figure 3-30: Screen for Step 3 of Buffer Zone Analysis
Figure 3-31: Resulting Buffer
3-30
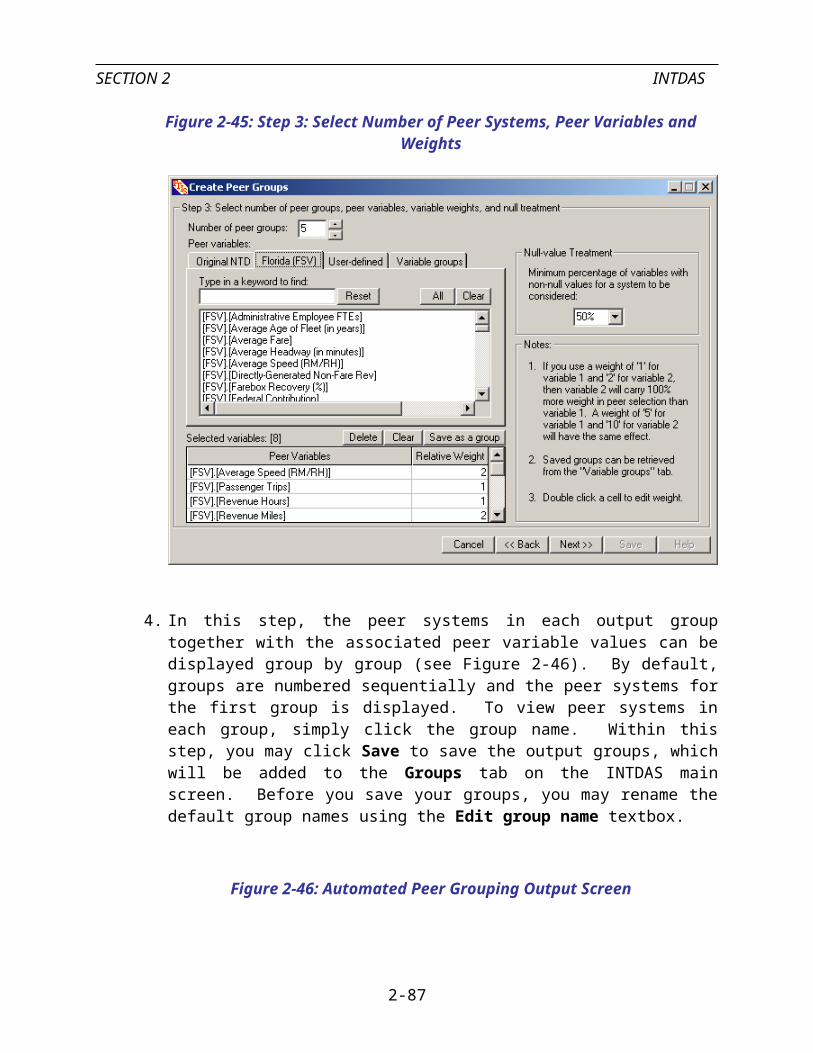
SECTION 3 FTGIS
Figure 3-32: Screen for Selecting and Viewing Buffer Output
In the Buffer Statistics screen you:
1. Select one of the layers to be buffered. All data attributes for the layer will appear in the ‘Total’ variables list box as well as the ‘Average’ variable and the ‘Weighting’ variable dropdown list.
2. Select the variables for which you want to retrieve data from the buffer(s). In the ‘Total’ variable list box, you should select only the variables that are additive (i.e., summation is meaningful) by checking the checkbox in front of each variable. Click Select all to select all variables or click Clear all to clear all selections. For non-additive variables, such as population density, you should select from the dropdown
3-31

SECTION 3 FTGIS
list and specify the corresponding weighting variable. The default weighting variable is AREA, which is suitable for variables weighted by area, such as population density.
3. Click the Get Buffer Statistics button to compute buffer statistics. The output is shown on the bottom half of the screen. The output statistics include Total, Min, Max, Count, and Mean. The Total statistics sum all values from each buffered subareas that make up the total buffer. The Count statistics give the number of subareas in a buffer. The Min and Max statistics give the minimum and maximum values, respectively, among the subareas. The Mean statistics are for only non-additive variables of which total values are not meaningful.
4. In the case when there are multiple buffers, you may select to display the statistics for a specific buffer from the Select buffer dropdown list. The selected buffer on the map will blink to indicate the selected buffer.
5. You may repeat the above steps for another layer.
6. You may click the Save button to save the buffer zones and the associated statistics as a new layer, which will automatically appears on the map legend as soon as they are saved. You may also save the statistics to a text or an Excel file.
Create ChartsThe Create Charts function allows you to create pie or bar charts based on one or more attributes of the active layer. To create a chart:
1. Click the Create Charts tool button or select the Tools|Create Charts dropdown menu item. The screen shown in Figure 3-33 will pop up.
2. Click the radio button to select the chart type.
3. Click one or more variables on the variable list. Click a selected variable to unselect a variable.
4. Drag the Chart Size bar up and down to select a chart size.
5. Uncheck the Draw Outlines? box to remove the chart outlines.
3-32

SECTION 3 FTGIS
Figure 3-33: Screen for Creating Charts
Create New Variable by Formula SetupFTGIS allows you to create up to two new variables through a formula setup. The formula can be a function of several existing table attributes. For example, you may compute the population density by dividing the total population by the total area. This function currently can be applied to existing polygon layers only. Figure 3-34 shows the screen for setting up a formula. To create a new variable:
1. Select an available polygon layer by highlighting the layer name. All table attributes available for the highlighted layer will show up on the right list box. You may type in a key word to short-list the variable list.
2. Click a variable or one of the math operators on the right to send a selection to the formula editing box below. In Figure 3-34, the formula for computing population density is shown. You may enter a description for the formula. Note: The name for a new variable is fixed to either Formula 1 or Formula 2. You may not rename the variable. If you need to find out information about the formula, you may bring up the screen in Figure 3-34 to view the formula and the associated description (if one has been entered).
3-33

SECTION 3 FTGIS
3. After you have completed your formula setup, click Save to start computing values based on the formula. To create a second variable, select the radio button for Formula 2.
Figure 3-34: Screen for Formula Setup
Create Thematic MapsThe Create Thematic Maps function allows you to quickly create a thematic map based on a selected attribute in the active layer. To create a thematic map:
1. Click the Create Thematic Maps tool button or select the Tools|Create Thematic Maps dropdown menu item. The screen shown in Figure 3-35 will pop up.
2. Click the Select Field dropdown list and select an available field for classification. A thematic map will be created instantly.
3. Click the Number of classes dropdown list and select the desired number of classes.
4. A default thematic type is set for you. The Range type divides the field values into the specified number of classes of constant intervals. The Dot Density type plots the number of dots based on the attribute values and the number of classes. The Unique type plots each distinct value with a unique color. The number of unique values in an attribute cannot exceed 100.
3-34

SECTION 3 FTGIS
5. A Color default style is set for you. For point and line layers, you may choose either size or a combination of color and size as your style.
6. If you have chosen Color as your style, a default color ramp is set for you. Click the Start and End color boxes to change the color ramp. If you have chosen Size as your style, a default color is also set for you. Click the color box to change the color
7. Uncheck the Draw outlines box to remove the polygon outlines.
8. Click OK to exit the screen.
Figure 3-35: Screen for Creating Thematic Maps
Add LabelThe Add Label function allows you to label the active layer with a select variable in a preferred format. To create labels:
1. Click the Create Labels tool button or select the Tools|Create Labels dropdown menu item. The screen shown in Figure 3-36 will pop up.
3-35

SECTION 3 FTGIS
Figure 3-36: Screen for Creating Labels
2. Click the Text field dropdown list, and click a field that has the label you want to display.
3. Click the Font button and select the font, style, size, and color for the labels.
4. Select whether to place label on, above, or below a line or point feature.
5. Check whether to draw features and allow duplicates.
6. Check whether to mask lavels with a specific background color.
7. Check whether fix the text size or to vary text size with the current map extent (i.e., scale dependent). You you choose the later, you may adjust the Label Height bar to adjust the text scale.
8. Click Apply to display the lables. You can go back and change some of the settings or click OK to exit the screen.
Clear AllThe Clear All function allows you to clear all labels, themes, and charts, and return to the original map setting.
3-36
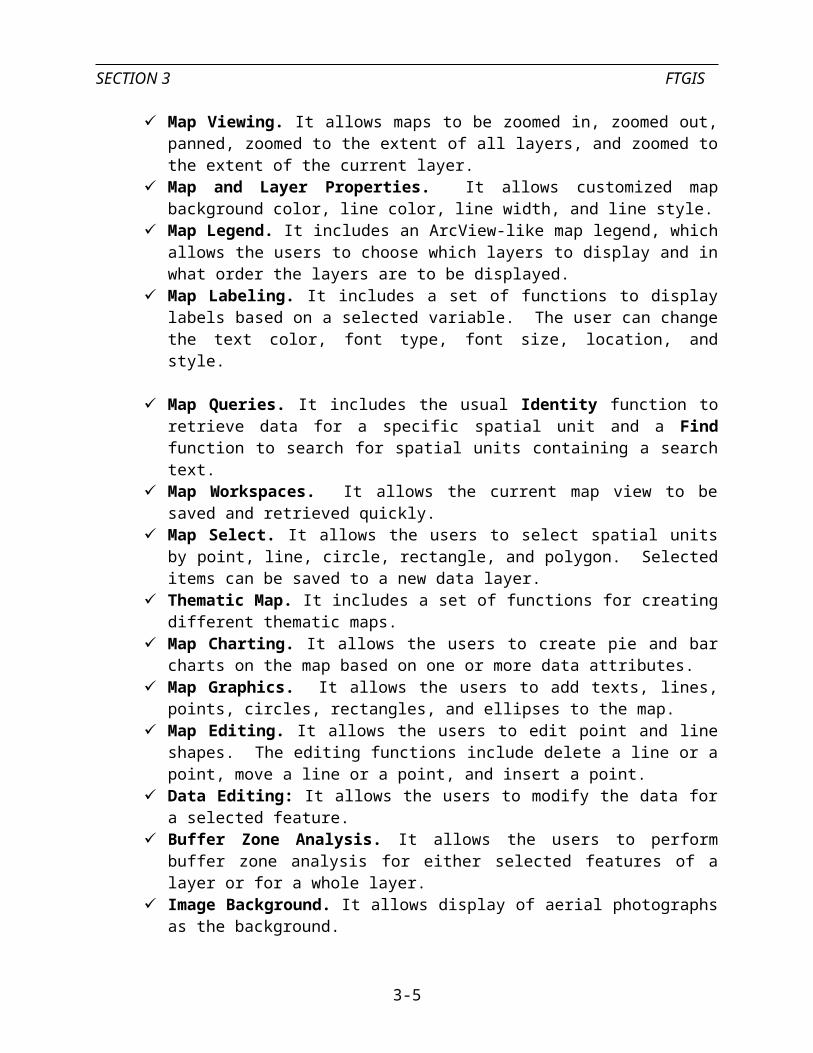
SECTION 3 FTGIS
Select FeaturesThe Spatial Features function allows you to select features by:
pointing at a feature,
drawing a line that intersects one or more features (see Figure 3-37),
drawing a circle that intersects one or more features, or
drawing a rectangle or a polygon that intersects, encloses, or crosses one or more features. For this option, you can also select to enclose, intersect, cross, or contain the centroids of, the features being selected. Figure 3-38 shows selected features based on drawing a rectangle with the cross option.
Selected features may be saved as a new map layer by selecting the Tools|Save Selected Set into a New Shapefile dropdown menu item. Data associated with the selected features may be saved into a text or an Excel file by selecting the Table|Save into a File dropdown menu item. The Table menu is active only when you are in the Table view.
Figure 3-37: Select Features by Drawing a Line
3-37

SECTION 3 FTGIS
Figure 3-38: Select Features by Drawing a Rectangle
3-38

SECTION 4 MISCELLANEOUS COMPONENTS
MISCELLANEOUS COMPONENTS
This chapter introduces all the other components accessible from the FTIS main screen.
TAMSTAMS (Transit Asset Management System) is a FTIS component designed to perform the same tasks as the TimesLink program developed previously by the Center for Urban Transportation Research (CUTR). The program was redesigned to make it work more seamlessly with FTIS. As with TimesLink, TAMS allows transit agencies to electronically transmit PTMS (Public Transportation Management System) data to FDOT. PTMS is designed to collect, analyze, and disseminate information on the condition of Florida's transit assets. PTMS is one of the six management systems previously required by the Intermodal Surface transportation Efficiency Act (ISTEA) of 1991. The National Highway System (NHS) Act of 1995 made the management systems optional to the States. The Florida Department of Transportation intends to continue the collection of PTMS data.
Working with TAMS Database
TAMS is accessible from the third button of the FTIS Main Menu screen (see Figure 1-1). Clicking the TAMS button will invoke the screen shown in Figure 4-1. The screen allows you to specify whether to work on an existing database or to create a new database.
Once a database is selected, TAMS will take you into the screen shown in Figure 4-2. The screen consists of a set of five tabs for entering and displaying different categories of transit assent data. If you have selected an existing database, it will load all the available data onto the fields in each tab. The fields are empty if you have chosen to work on a new database. Enter the data in each field. Use the Tab key to move from one field to another. For fields that take only standard input, TAMS will prompt you a dropdown list to select a list item, as shown in Figure 4-2. After you have completely entered your data, click the Save Record button to save the record. The newly saved record should show in the table grid at the bottom half of the screen. To delete a current record, click the Delete Record button.
4-1

SECTION 4 MISCELLANEOUS COMPONENTS
Figure 4-1: Screen for Selecting a Working Database
Figure 4-2: TAMS Data Entry and Display Screen
Submitting Database to FDOT
4-2
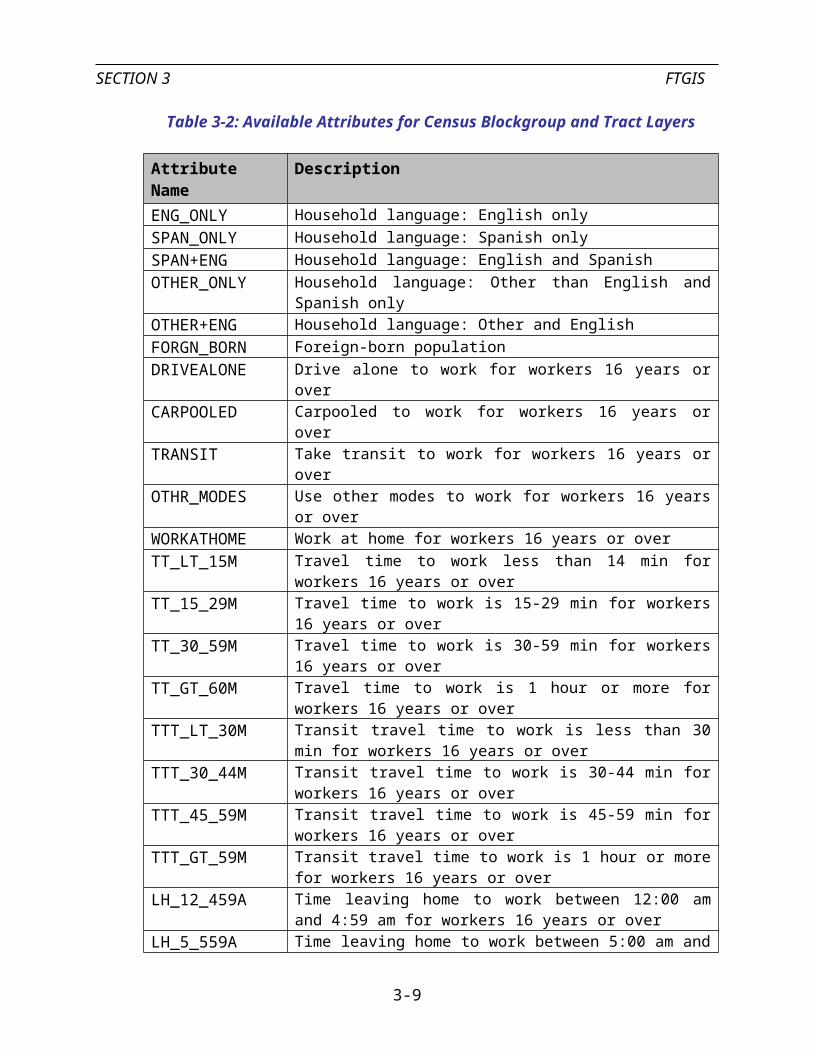
SECTION 4 MISCELLANEOUS COMPONENTS
After you have completed your database and are ready to submit it to the FDOT, click the Transfer Database button in Figure 4-3. The screen shown in Figure 4-3 will pop up. By default the first data entry lists the current database. You may click the Browse button to select another database. The second and the third fields allow you to specify the FTP site and the email address, respectively, to submit the database to. The last entry lets you enter your NTD ID, which is required.
Figure 4-3: Screen for File Submission
FTPLibThis function provides easy access to electronic documents in the transit planning areas. The function is still being developed and it includes only a few simple links in the current version. When completed, it will allow you to search and access a wide variety of transit planning literature.
FTPLinksThis function provides an interface for direct links to the websites of various agencies. The screen for this function is shown in Figure 4-4. You may add a new web link or edit an existing one using the Add and Edit buttons, respectively. To access a specific web site on the list, double click the desired list item to activate your default web browser.
4-3
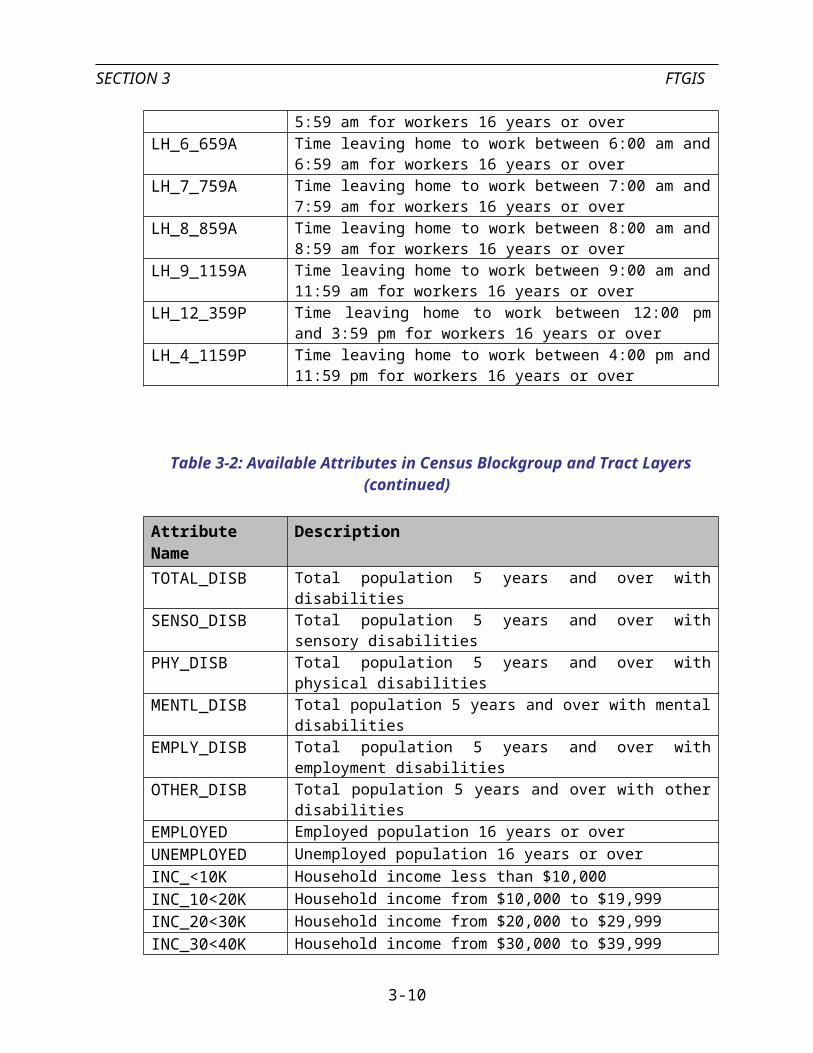
SECTION 4 MISCELLANEOUS COMPONENTS
Figure 4-4: Agency Website List
ContactThis function provides an interface (see Figure 4-5) for direct email links to various agencies. You may add a new email link or edit an existing email link using the Add and Edit buttons, respectively. To email any of the agencies on the list, double click the desired list item to activate your default email system.
4-4

SECTION 4 MISCELLANEOUS COMPONENTS
Figure 4-5: Email Contact List
Report ProblemThis function provides a convenient form for you to record and report to the developer any FTIS problems you encountered while using FTIS. The report form is activated either when you click the Report Problem button on the main screen or when the program encountered an error. In the later case, FTIS will automatically activate the form and insert the error information needed for the developer to pinpoint the source of the problem. In either case, you should complete to your best ability all the fields on the screen. Figure 4-6 shows the screen for the report form. You may click the Save as default button to save the general information you entered so that it will be automatically loaded when the form is reactivated again next time.
In the Problems/Suggestions/Comments box, you may enter all the information you wish to send to the developer. Please provide as much details as you can. The developer may contact you for additional information, if necessary. After you have completed your form, you can click the Print button to print out a hardcopy of the completed form for your record or fax it to the developer. If your computer is connected to the Internet, you
4-5

SECTION 4 MISCELLANEOUS COMPONENTS
may click the Send button to email the report to the developer. The problem report will be automatically attached to the email as a file attachment.
Figure 4-6: FTIS Problem Report Form
HelpThis button provides access to this user's manual, the on-line help, and the About FTIS... box, which is shown in Figure 4-7.
4-6

SECTION 4 MISCELLANEOUS COMPONENTS
Figure 4-7: FTIS’ About Box
ExitThis button allows you to exit from the FTIS completely. It serves the same function as the standard Close button on the top-right corner of the screen.
4-7

SECTION 4 MISCELLANEOUS COMPONENTS
(This page left blank intentionally)
4-8