Florida Statewide Regional Evacuation Study … Statewide Regional Evacuation Study Program Includes...
28
Florida Statewide Regional Evacuation Study Program Includes Hurricane Evacuation Study Technical Data Report Tampa Bay Region Volume 1-8 Executive Summary
Transcript of Florida Statewide Regional Evacuation Study … Statewide Regional Evacuation Study Program Includes...

Florida StatewideRegional Evacuation
Study Program
Includes Hurricane Evacuation Study
TechnicalData
Report
Tampa Bay Region
Volume 1-8
Executive Summary

Statewide Regional Evacuation Studies Program Volume I-8 Tampa Bay
Acknowledgements Volume I: Technical Data Report
CREDITS & ACKNOWLEDGEMENTS
Funding was authorized by the Florida Legislature through House Bill 7121, as a result of the 2004 and 2005 hurricane seasons. Provisions
of this bill require the Division of Emergency Management to update
all Regional Evacuation Studies in the State and inexorably tied the Evacuation Studies and Growth Management. As a result, this study
addresses both Emergency Management and Growth Management data needs. Funds were also provided by the Federal Emergency
Management Agency (FEMA) with all money administered through the
Florida Division of Emergency Management (FDEM), 2555 Shumard Oak Blvd., Tallahassee, 32399. Web site: www.floridadisaster.org.
Local in-kind match was provided by the Hillsborough, Manatee, Pasco and Pinellas counties.
The Council acknowledges and extends its appreciation to the following agencies and people for their
cooperation and assistance in the development of this document:
Regional Planning Council Staff; Federal Emergency Management Agency; NOAA; Florida Division of Emergency Management; Department of Community Affairs – Division of Community Planning; Florida
Emergency Preparedness Association; Kerr & Downs Research; Dr. Earl Jay Baker - Hazards Management Group; Sarasota-Manatee MPO; Pasco County MPO; Pinellas County MPO; Hillsborough County MPO; Florida
Department of Transportation; Wilbur Smith and Associates; National Weather Service – Ruskin Office; and
the counties of Hillsborough, Manatee, Pasco and Pinellas.
Florida Division of Emergency Management David Halstead, Director
Sandy Meyer, Hurricane Program Manager
Richard Butgereit, GIS Manager
Northeast Florida Regional Council Jeffrey Alexander, Statewide Program Manager
County Emergency Management Agencies Larry Gispert, Director, Hillsborough County
Emergency Management
Jim Martin, Director, Pasco County Emergency Management
Sally Bishop, Director, Pinellas County Emergency Management
Laurie Feagans, Director, Manatee County
Emergency Management

Statewide Regional Evacuation Study Program Volume 1-8 Tampa Bay
Executive Summary Page 1
EXECUTIVE SUMMARY
This Executive Summary is provided to state and local governments, volunteer organizations, the media and interested residents to highlight the results of the Statewide Regional Evacuation Study for the Tampa Bay Region (SRES) and to quantify and to illustrate the challenges of evacuation response in the Tampa Bay Region.
A. DEMOGRAPHIC AND LAND USE ANALYSIS Located on the west coast of Florida, the Tampa Bay region is approximately 2,817 square miles (land area) with an additional 818 square miles of water area and is favored with nearly 700 miles of shoreline (including inlets) and 900 miles of coastline.
The region consists of four counties: Hillsborough, Manatee, Pasco and Pinellas counties including 39 municipalities. It is bounded on west by the Gulf of Mexico, on the north by Hernando County, to the east by Polk and Hardee Counties and to the south by Sarasota County. Hillsborough County has the 4th largest population in the state. Pinellas County is the most densely populated county in Florida. Most of the population lives relatively near the coast of the Gulf of Mexico or Tampa Bay. Pasco County’s growth is occurring in the central portion of the county as residents move into the area from Hillsborough County. Similarly, new growth in Manatee County has concentrated in large scale developments in the center portion of the county adjacent to I-75. An explosive growth rate had been experienced fueled by people seeking the combination of ample, quality land opportunities and consistent sun that the Tampa Bay region has to offer. All four counties in the region had consistently experienced increases in density (persons per square mile) since 1970. This trend has slowed since 2007 with the economic downturn and, for the first time, the region experienced a decrease in population in 20091
Chapter I provides a demographic profile of the region and the counties themselves. Specific socio-economic characteristics that may have an impact on evacuation vulnerability, response and mass care were identified using Census data including recent American Community Survey data.
1 2009 Florida Estimates of Population, BEBR
Volume 1-8 Tampa Bay Statewide Regional Evacuation Study
Page 2 Executive Summary
Information includes:
• Overall Population • Group Quarters Population • Housing Units by Type • Occupied Housing Units (Households) • Household Size • Seasonal Dwelling Units • Vehicles per Household • Age Composition • Race / Ethnicity • Place of Birth and Citizenship • Linguistic Isolation
• Labor Force • Poverty Status • Small Area Dwelling Unit and Population Data (TAZ)
The Tampa Bay Region Future Land Use Map is presented on Map I-3. There are 11 categories identified which represent a consolidation of land use categories identified in the (45) local government comprehensive plans in the region (See Table I-17).
� RL Residential Lo (higher than AG < 1DU) � RH Residential High (more than RM and > 12DU) � RM Residential Medium (more than RL, < 13DU) � CONS Conservation, natural and protected � PUB Public/Semi-Public, government, institutional � AG Agriculture - rural land, farms (< 0.5DU) � REC Recreation/Open Space � COM Commercial, office, tourism, marina � MU Mixed Use, activity centers, urban village � WAT Water bodies � IND Industrial, extractive, transportation
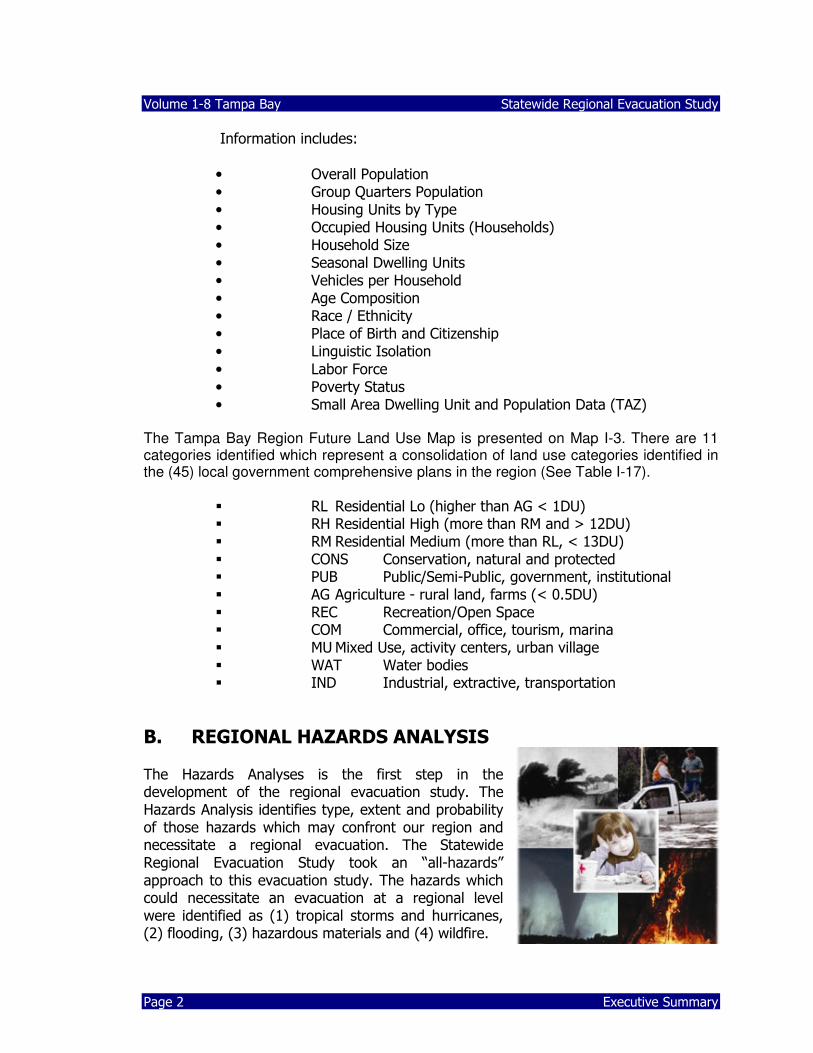
B. REGIONAL HAZARDS ANALYSIS The Hazards Analyses is the first step in the development of the regional evacuation study. The Hazards Analysis identifies type, extent and probability of those hazards which may confront our region and necessitate a regional evacuation. The Statewide Regional Evacuation Study took an “all-hazards” approach to this evacuation study. The hazards which could necessitate an evacuation at a regional level were identified as (1) tropical storms and hurricanes, (2) flooding, (3) hazardous materials and (4) wildfire.

Statewide Regional Evacuation Study Program Volume 1-8 Tampa Bay
Executive Summary Page 3
1. Tropical Storms and Hurricanes Risks from tropical storms and hurricanes include storm surge, high winds, tornadoes and inland flooding. Storm surge, considered the most deadly hazard, was quantified using the National Oceanic and Atmospheric Administration (NOAA) numerical storm surge model, SLOSH2. The SLOSH modeling system consists of the model source code and model basin or grid. SLOSH model grids must be developed for each specific geographic coastal area individually incorporating the unique local bay and river configuration, water depths, bridges, roads and other physical features. In addition to open coastline heights, one of the most valuable outputs of the SLOSH model for evacuation planning is its predictions of surge heights over land which predicts the degree of propagation of the surge into inland areas.
SLOSH provides the maximum amount of surge expected at approximately 3500 points in the region considering different parameters of 12,000 hypothetical storms (strength, track, size and forward speed) and the topography and the bathymetry of the Tampa Bay basin. The newest generation of the SLOSH model basin incorporated in the 2010 Statewide Regional Evacuation Study reflects major improvements, including higher resolution basin data and grid configurations. Faster computer speeds allowed additional hypothetical storms to be run for creation of the MOMs (maximum potential storm surge) values for each category of storm. Storm tracks were run in ten different directions. And for each set of tracks in a specific direction storms were run at forward speeds of 5, 10, 15 and 25 mph. And, for each direction, at each speed, storms were run at two different sizes (20 statute mile radius of maximum winds and 35 statute miles radius of maximum winds.) Finally, each scenario was run at both mean tide and high tide. Both tide levels are now referenced to North American Vertical Datum of 1988 (NAVD88) as opposed to the National Geodetic Vertical Datum of 1929 (NGVD29).
SLOSH and SLOSH related products reference storm surge heights relative to the model vertical datum, in this case NAVD88. In order to determine the inundation depth of surge flooding at a particular location the ground elevation at that location must be subtracted from the potential surge height. As part of the
2SLOSH stands for Sea, Lake and Overland Surges from Hurricanes

Volume 1-8 Tampa Bay Statewide Regional Evacuation Study
Page 4 Executive Summary
Statewide Regional Evacuation Study, all coastal areas as well as areas surrounding Lake Okeechobee were mapped using remote-sensing laser terrain mapping (LIDAR3) providing the most comprehensive, accurate and precise topographic data for this analysis. As a general rule, the vertical accuracy of the laser mapping is within a 15 centimeter tolerance. The LIDAR data was incorporated into the SLOSH basin data and used to subtract the land elevation from the storm surge height to develop the storm tide limits. The result of this storm surge hazard analysis is graphically portrayed in the Storm Tide Atlas which illustrates the storm tide limits based on the maximum storm surge for landfalling categories 1, 2, 3, 4 and 5. The Atlas maps and GIS files are available online at www.tbrpc.org.
While all residents would be susceptible to some extent from the affects of hurricane-force winds, mobile home residents are far more vulnerable than residents in site-built homes. Mobile home and RV Park data was updated using information from the State of Florida Department of Health, property appraiser data and county planning departments. This was augmented by the census data particularly in Hillsborough, Manatee and Pasco counties where there is a significant number of mobile home residents who live outside of designated mobile home parks. Tornadoes are another hazard of tropical storm activity. Because it is impossible to identify where a tornado imbedded in the hurricane wind bands will strike, evacuation does not consider tornado activity, per se. It is recognized, however, that mobile home residents are much more vulnerable to this severe weather event. Therefore, with the evacuation of mobile homes for hurricane winds, it is anticipated that severe injury will also be reduced from any tornado activity. In addition, the public information campaign will include a recommendation that tornado safe rooms (see www.fema.gov) be considered by residents. While inland flooding had not been considered to be life-threatening in the past, it had, over the last twenty years, become a leading cause of hurricane-related deaths until Hurricane Katrina in 2005. The 100-year flood zone, as designated by the Federal Emergency Management Agency (FEMA) National Flood Insurance Program (NFIP), is identified and addressed separately under the Flooding Hazard.
While in Florida counties do not typically evacuate for inland flooding for a hurricane, it is recognized that this may become a major problem during a
3 Light Imaging Detection and Ranging

Statewide Regional Evacuation Study Program Volume 1-8 Tampa Bay
Executive Summary Page 5
hurricane evacuation, after a tropical storm passes or after prolonged rainfall. Evacuation routes within the flood zone are identified in an effort to find alternative routes, if necessary. Public information will stress that after the storm (1) residents do NOT attempt to drive on flooded roadways and (2) children are NOT permitted to swim or play in flood waters. 2. Flooding Both coastal and inland flooding are addressed through FEMA’s NFIP. The 100-year and 500-year floodplain was identified within the region to illustrate the regional and county-level vulnerability to the flood hazard. In addition, communities with repetitive loss properties were identified by building type to provide an overall assessment of the risk. The areas’ risk, historical frequency and estimated population at risk were identified in the hazards and vulnerability analyses. Also identified were dams which could pose a risk to the population which lives below them. 3. Wildfires and the Urban Interface
Florida is home to millions of residents who enjoy the state's beautiful scenery and warm climate. But few people realize that these qualities also create severe wildfire conditions. Each year, thousands of acres of wildland and many homes are destroyed by fires that can erupt at any time of the year from a variety of causes, including arson, lightning and debris burning. Adding to the fire hazard is the growing number of people living in new communities built in areas that were once wildland. This growth places even greater pressure on the state's wildland firefighters. As a result of this growth, fire protection becomes everyone's responsibility (Florida Division of Emergency Management, 2008.
http://www.floridadisaster.org/ bpr/EMTOOLS/wildfire/wildfire.htm )
A wildfire is any fire occurring in the wildlands (i.e., grasslands, forest, brushland, etc). Wildfires have burned across the woodlands of Florida for centuries and are part of the natural management of much of Florida’s ecosystems. (Statewide Hazard Mitigation Plan, 2009)
The risk of potential wildfire to the region’s population was identified using the data provided by the Florida Division of Forestry (FlamMap) and the population living in the high/very high risk areas was estimated.

Volume 1-8 Tampa Bay Statewide Regional Evacuation Study
Page 6 Executive Summary
4. Hazardous Materials A hazardous material is generally considered as any item or agent (biological, chemical, physical) which has the potential to cause harm to humans, animals or the environment, either by itself or through interaction with other factors. Almost every community deals with hazardous materials on a daily basis through transport, use, storage and/or disposal. The benefits Chemicals bring into our lives through their designed uses have become vital to our standard of living. Although major chemical emergencies are extremely rare, there always remains a chance that one will occur. In the State of Florida, the county emergency management agencies plan for hazardous material incidents and coordinate regionally for response through the Local Emergency Planning Committees (LEPCs). While the facilities with extremely hazardous materials were identified, the evacuation planning for incidents involving hazardous materials is addressed in the Regional Hazardous Material Emergency Response Plan. No specific emergency sequence can be isolated as the model for which to plan because each emergency could have different consequences, both in nature and degree. As an alternative to defining a specified emergency, the regional plan identifies various parameters for planning which are based upon knowledge of the possible consequences, timing, and release characteristics of a spectrum of emergencies. The Regional Hazardous Materials Emergency Response Plan then establishes the appropriate response for each level of threat. Therefore, the Statewide Regional Evacuation Study did not specifically address hazardous material incidents.
C. VULNERABILITY ANALYSIS & POPULATION-AT-RISK
Depending upon the strength of the storm, the regional evacuation study calls for the complete evacuation of successively more surge-vulnerable zones inland in addition to all mobile home residents. Using information from the Metropolitan Planning Organizations (MPOs) and the local planning commissions/departments, the population, dwelling unit counts and vehicle data for each zone was developed (see Chapter IV, Regional Vulnerability and Population Analysis). County/ Regional population-at-risk for the years 2010 and 2015 are presented in Tables ES-1 and ES-2 below.

Statewide Regional Evacuation Study Program Volume 1-8 Tampa Bay
Executive Summary Page 7
Table ES-1 Population-at-Risk from Hurricanes by Evacuation Level, 2010
Evacuation
Zone A
Evacuation
Zone B
Evacuation
Zone C
Evacuation
Zone D
Evacuation
Zone E
Hillsborough County
Site-built Homes 81,698 106,164 59,233 65,805 66,996
Mobile/Manuf. Homes 3,677 2,599 1,883 3,065 3,989
TOTAL 85,375 108,763 61,116 68,870 70,985
Manatee County
Site-built Homes 39,227 23,434 28,902 60,097 85,350
Mobile/Manuf. Homes 3,270 2,668 2,043 4,577 4,735
TOTAL 42,497 26,102 30,945 64,674 90,085
Pasco County
Site-built Homes 40,286 47,938 62,409 29,734 21,788
Mobile/Manuf. Homes 4,636 4,462 5,301 3,737 2,452
TOTAL 44,922 52,400 67,710 33,471 24,240
Pinellas County
Site-built Homes 153,436 130,087 124,181 94,025 51,953
Mobile/Manuf. Homes 2,789 6,407 8,335 8,814 1,561
TOTAL 156,225 136,494 132,516 102,839 53,514 Note: Vulnerable population determined using SRESP behavioral data and county provided evacuation zones. Vulnerable population numbers are not inclusive, meaning population numbers listed for a higher zone are not included in the lower zone. For example, vulnerable population listed for Evacuation Zone B does not include vulnerable population listed for Evacuation Zone A.
Table ES-2 Population-at-Risk from Hurricanes by Evacuation Level, 2015
Evacuation
Zone A
Evacuation
Zone B
Evacuation
Zone C
Evacuation
Zone D
Evacuation
Zone E
Hillsborough County
Site-built Homes 89,414 115,711 65,565 70,976 72,318
Mobile/Manuf. Homes 3,677 2,599 1,883 3,065 3,989
TOTAL 93,091 118,310 67,448 74,041 76,307
Manatee County
Site-built Homes 42,313 26,111 32,251 66,237 94,343
Mobile/Manuf. Homes 3,270 2,668 2,043 4,577 4,735
TOTAL 45,583 28,779 34,294 70,814 99,078
Pasco County
Site-built Homes 41,462 49,089 64,442 31,053 22,732
Mobile/Manuf. Homes 4,636 4,462 5,301 3,737 2,452
TOTAL 46,098 53,551 69,743 34,790 25,184
Pinellas County
Site-built Homes 158,203 134,163 128,913 98,345 53,371
Mobile/Manuf. Homes 2,789 6,407 8,335 8,814 1,561
TOTAL 160,992 140,570 137,248 107,159 54,932 Note: Vulnerable population determined using SRESP behavioral data and county provided evacuation zones. Vulnerable population numbers are not inclusive, meaning population numbers listed for a higher zone are not included in the lower zone. For example, vulnerable population listed for Evacuation Zone B does not include vulnerable population listed for Evacuation Zone A.

Volume 1-8 Tampa Bay Statewide Regional Evacuation Study
Page 8 Executive Summary
If everyone who was ordered to evacuate did so and those who were not ordered to evacuate, secured their homes and stayed put, emergency management could use the population-at-risk statistics. This, however, is not the case. Post-hurricane behavioral studies conducted along the Atlantic and Gulf coasts illustrate that many people ordered to evacuate will not and, conversely, people who live in site-built homes far outside the coastal areas will pack up and try to “outrun” the storm (“shadow evacuation”). How we quantify this behavior is key to an accurate transportation analysis. This study used the general response model (HMG, 2010) as well as the surveys conducted in 2009 (see Chapter III, Regional Behavioral Analysis Summary). Volume 2 of the Statewide Regional evacuation Study Program provides the Regional Behavioral Assumptions based upon the General Response Model and the survey results presented in Volume 3, Behavioral Survey Report Using the behavioral assumptions discussed in Chapter III, two scenarios were developed. The Base Scenario population scenario assumes that 100% of the population-at-risk evacuate plus the anticipated “shadow evacuation” from outside the surge vulnerable areas. The scenario is considered the most “conservative” estimate and will be used for growth management purposes. Tables ES-3 and ES-4 present these evacuation population estimates for 2010 and 2015. The second Operational Scenario population estimates apply the participation rates presented in the regional behavioral assumptions. They do not assume that 100% of the population at risk evacuate but do include the “shadow evacuation” expected depending on the strength of the hurricane. Tables ES-5 and ES-6 present the evacuation population estimates and projections for 2010 and 2015.
Table ES-3 Hurricane Population by Evacuation Level, Base Planning Scenario 2010
Hillsborough Manatee Pasco Pinellas Tampa Bay Region
A 267,128 105,009 153,677 311,942 837,756
B 349,123 135,549 187,967 421,681 1,094,320
C 449,331 181,074 259,925 555,722 1,446,052
D 525,386 256,504 288,373 641,696 1,711,959
E 643,792 313,285 312,273 708,156 1,977,506

Statewide Regional Evacuation Study Program Volume 1-8 Tampa Bay
Executive Summary Page 9
Table ES-4 Hurricane Evacuation Population by Evacuation Level, Base Planning Scenarios, 2015
Hillsborough Manatee Pasco Pinellas Tampa Bay Region
A 286,782 113,927 158,331 320,108 879,148
B 376,227 148,875 193,443 433,262 1,151,807
C 486,590 200,872 269,831 571,979 1,529,272
D 568,791 284,687 299,547 661,455 1,814,480
E 697,462 349,537 326,354 729,413 2,102,766
Table ES-1 Hurricane Evacuation Population by Evacuation Level, Operational Scenarios, 2010
Hillsborough Manatee Pasco Pinellas Tampa Bay Region
A 195,993 77,640 108,770 229,103 611,506
B 243,950 101,993 131,151 291,526 768,620
C 362,723 150,862 204,234 433,726 1,151,545
D 457,310 221,645 241,378 539,737 1,460,070
E 603,953 283,023 286,663 656,884 1,830,523

Volume 1-8 Tampa Bay Statewide Regional Evacuation Study
Page 10 Executive Summary
Table ES-6 Hurricane Evacuation Population by Evacuation Level, Operational Scenarios, 2015
Hillsborough Manatee Pasco Pinellas Tampa Bay Region
A 211,770 85,020 112,828 234,821 644,439
B 263,670 112,856 135,622 299,065 811,213
C 393,649 168,076 212,891 445,815 1,220,431
D 495,831 246,618 251,405 555,618 1,549,472
E 654,937 316,373 300,036 676,050 1,947,396
Chapter IV also presents the vulnerability of critical facilities within the region to (1) tropical storms and hurricanes; (2) flooding (100-year and 500-year); and wildfire (high and very high). The County Appendices provide more detailed data and maps for selected critical facilities including health care facilities (hospitals, nursing homes, etc.), assisted living facilities (ALFs), fire and police stations, and other identified facilities.
D. PUBLIC SHELTER DEMAND
As part of the regional evacuation study, the anticipated demand for public shelter was quantified. The public shelter inventories and the capacities within each county were identified and a comparison was made to determine the status within both the county and the region.
The general response model, post-hurricane behavioral surveys of residents in the Tampa Bay region and past experience was used to determine public shelter demand. The number of evacuees who choose public shelter as their evacuation destination is based on demographic characteristics of the population including income and age, risk area and housing (mobile home vs. site built homes). The planning assumptions regarding anticipated shelter use were presented in the Regional Behavioral Analysis (See Chapter III, Appendices III-A, III-B, III-C, III-D), and were applied to the projected Hurricane Evacuation Population estimates for both the Base Planning Scenarios as well as the Operational Scenarios.
As discussed in Chapter IV, the Base Planning Scenarios assume 100% compliance of the vulnerable populations (surge-vulnerable and mobile home residents) plus the “shadow evacuation”. The Operational Scenarios use the participation rates from the behavioral analysis to determine the evacuation rates.

Statewide Regional Evacuation Study Program Volume 1-8 Tampa Bay
Executive Summary Page 11
Table ES-7 Public Shelter Demand for Hurricane Evacuation
Base Scenarios 2010
Evacuation Level
Hillsborough Manatee Pasco Pinellas Region
Capacity4 56,737 26,760 28,285 22,166 133,948
A 15,547 7,061 15,078 22,892 60,578
B 19,185 9,187 16,744 28,795 73,911
C 25,787 12,153 23,449 37,063 98,451
D 35,921 17,551 26,005 43,849 123,327
E 49,641 21,634 28,137 49,806 149,217
Numbers in Red represent a shelter deficit.
Table ES-8 Public Shelter Demand for Hurricane Evacuation
Base Scenarios 2015
Evacuation Level
Hillsborough Manatee Pasco Pinellas Region
Capacity 56,737 26,760 28,285 22,166 133,948
A 16,559 6,825 15,477 23,301 62,162
B 20,504 8,780 17,194 29,374 75,852
C 27,695 11,526 24,359 37,838 101,417
D 38,619 16,558 27,049 44,826 127,051
E 53,447 20,389 29,469 50,888 154,192
Numbers in Red represent a shelter deficit.
4 Capacity is reduced for shelter unusable in Evacuation Levels D and E.

Volume 1-8 Tampa Bay Statewide Regional Evacuation Study
Page 12 Executive Summary
Table ES-9
Public Shelter Demand for Hurricane Evacuation Operational Scenarios 2010
Evacuation Level
Hillsborough Manatee Pasco Pinellas Region
Capacity 56,737 26,760 28,285 22,166 133,948
A 11,866 5,335 10,569 16,389 44,160
B 14,114 7,119 12,212 20,187 53,632
C 21,649 10,260 18,670 29,459 80,038
D 31,972 15,229 21,728 37,074 106,003
E 47,186 19,442 25,654 46,145 138,426
Numbers in Red represent a shelter deficit.
Table ES-10 Public Shelter Demand for Hurricane Evacuation
Operational Scenarios 2015
Evacuation Level
Hillsborough Manatee Pasco Pinellas Region
Capacity 56,737 26,760 28,285 22,166 133,948
A 12,710 5,139 10,930 16,683 45,462
B 15,127 6,791 12,599 20,574 55,091
C 23,295 9,731 19,468 30,061 82,554
D 34,416 14,380 22,666 37,879 109,341
E 50,838 18,343 26,914 47,136 143,231
Numbers in Red represent a shelter deficit.

Statewide Regional Evacuation Study Program Volume 1-8 Tampa Bay
Executive Summary Page 13
Using the behavioral assumptions based on the General Response Model has a significant impact on the potential shelter demand calculations. As noted in Chapter III, Regional Behavioral Analysis, the use of public shelters for residents in site built homes ranges from 5% - 10% depending on age and income. Traditionally, a public shelter use rate of between 10%- 25% was used for planning purposes. However, the trend for less reliance on public shelters has been recognized in past evacuations throughout the Gulf and Atlantic states.
As noted, in Hillsborough and Manatee counties which have experienced significant growth and have constructed new schools with the Enhanced Hurricane Protection Areas (EHPA) standards, there is no shelter deficit. Pasco County has experienced population growth, however, their demographics - including an older population - results in a deficit for the most intense storms. Pinellas County is a virtually built-out community with little growth and faces the most significant challenges as the most densely populated county with a large mobile home and senior population. If the shelter demand is approached regionally, the Tampa Bay area would appear to be in good shape. However, for Pinellas County evacuees to reach Hillsborough County shelters they would need to cross surge vulnerable causeways well inland.
Recognizing the trend toward a reduced reliance on public shelters, the emergency management community remains concerned that the assumption of such as drastic reduction in anticipated need does not take into consideration that many vulnerable residents will choose not to evacuate until there is no longer sufficient time to reach other destinations. This could logically result in a surge of evacuees to the public shelters in the closing hours of the evacuation. In addition if a major hurricane were to impact the region, there would be less capacity in public shelters for those residents who have no home to which to return.
In terms of community resiliency, without the requirement of EHPA standards, new schools may not be built to standards which would insure the schools would survive the hit of major hurricane. In addition the need for more special needs shelters must also be addressed in both State and local plans.
Therefore, local emergency management may use different assumptions for both public and special needs shelters within the operational plans as reflected in the County Comprehensive Emergency Management Plans (CEMPs).
E. EVACUATION TRANSPORTATION ANALYSIS The evacuation transportation analysis discussed in Chapter VI documents the methodology, analysis, and results of the transportation component of the Statewide Regional Evacuation Study Program (SRESP). Among the many analyses required for the SRESP study, transportation analysis is probably one of the most important components in the process. By bringing together storm intensity, transportation network, shelters, and evacuation population, transportation analysis explicitly links people’s behavioral

Volume 1-8 Tampa Bay Statewide Regional Evacuation Study
Page 14 Executive Summary
responses to the regional evacuation infrastructure and helps formulate effective and responsive evacuation policy options. Due to the complex calculations involved and numerous evacuation scenarios that need to be evaluated, the best way to conduct the transportation analysis is through the use of computerized transportation simulation programs, or transportation models. The development of the transportation methodology and framework required coordination and input from all eleven regional planning councils in Florida, along with the Division of Emergency Management, Department of Transportation, Department of Community Affairs, and local county emergency management teams. At the statewide level, the transportation consultant, Wilbur Smith Associates, participated in SRESP Work Group Meetings which were typically held on a monthly basis to discuss the development of the transportation methodology and receive feedback and input from the State agencies and RPCs.
At the local and regional level, Wilbur Smith Associates conducted a series of four regional meetings to coordinate with and receive input from local county emergency management, the regional planning council, local transportation planning agencies and groups, as well as other interested agencies.
1. Transportation Methodology The methodology used in the Tampa Bay RPC Evacuation Transportation Analysis is identical to the methodology used for all eleven Regional Planning Councils and includes the following components:
• Behavioral Assumptions • Zone System and Highway Network • Background Traffic • Evacuation Traffic • Dynamic Traffic Assignment
The regional model developed for the Tampa Bay Region used a series of input data provided by the RPC, including the following:
• Regional Model Network • Regional Zone System • Regional Demographic Characteristics 2. Clearance Times
The evacuation clearance times were defined and calculated as part of the Statewide Regional Evacuation Study Program and the evacuation transportation analysis and represent a series of scenarios and points in time within the evacuation process.

Statewide Regional Evacuation Study Program Volume 1-8 Tampa Bay
Executive Summary Page 15
• Clearance Time to Shelter: The time necessary to safely evacuate
vulnerable residents and visitors to a “point of safety” within the county
based on a specific hazard, behavioral assumptions and evacuation
scenario. Calculated from the point in time when the evacuation order is
given to the point in time when the last vehicle reaches a point of safety
within the county.
• In-County Clearance Time: The time required from the point an
evacuation order is given until the last evacuee can either leave the
evacuation zone or arrive at safe shelter within the County. This does not
include those evacuees leaving the County, on their own.
• Out of County Clearance Time: The time necessary to safely evacuate
vulnerable residents and visitors to a “point of safety” within the county
based on a specific hazard, behavioral assumptions and evacuation
scenario. Calculated from the point an evacuation order is given to the
point in time when the last vehicle assigned an external destination exits
the county.
• Regional Clearance Time: The time necessary to safely evacuate
vulnerable residents and visitors to a “point of safety” within the (RPC)
region based on a specific hazard, behavioral assumptions and evacuation
scenario. Calculated from the point in time when the evacuation order is
given to the point in time when the last vehicle assigned an external
destination exits the region.
Based on the analysis, the Clearance Times for the Base Planning Scenario and Operational Scenarios for 2010 and 2015 are provided below.
Volume 1-8 Tampa Bay Statewide Regional Evacuation Study
Page 16 Executive Summary
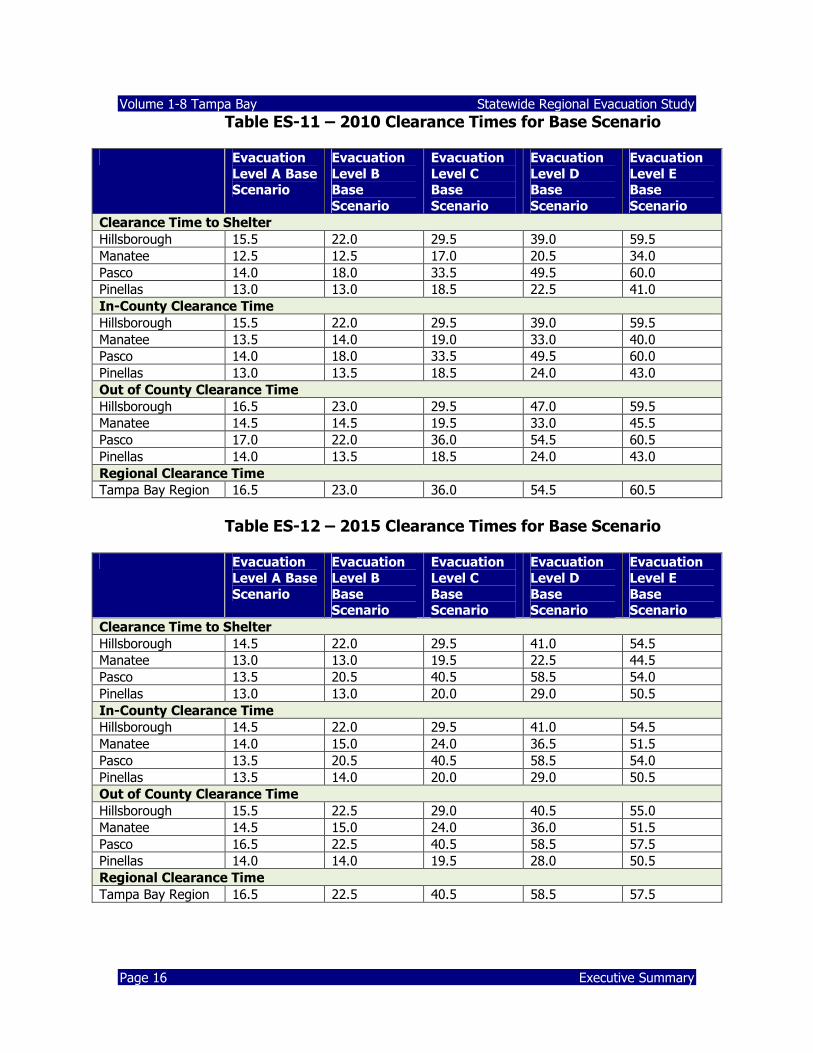
Table ES-11 – 2010 Clearance Times for Base Scenario
Evacuation
Level A Base Scenario
Evacuation
Level B Base
Scenario
Evacuation
Level C Base
Scenario
Evacuation
Level D Base
Scenario
Evacuation
Level E Base
Scenario
Clearance Time to Shelter
Hillsborough 15.5 22.0 29.5 39.0 59.5
Manatee 12.5 12.5 17.0 20.5 34.0
Pasco 14.0 18.0 33.5 49.5 60.0
Pinellas 13.0 13.0 18.5 22.5 41.0
In-County Clearance Time
Hillsborough 15.5 22.0 29.5 39.0 59.5
Manatee 13.5 14.0 19.0 33.0 40.0
Pasco 14.0 18.0 33.5 49.5 60.0
Pinellas 13.0 13.5 18.5 24.0 43.0
Out of County Clearance Time
Hillsborough 16.5 23.0 29.5 47.0 59.5
Manatee 14.5 14.5 19.5 33.0 45.5
Pasco 17.0 22.0 36.0 54.5 60.5
Pinellas 14.0 13.5 18.5 24.0 43.0
Regional Clearance Time
Tampa Bay Region 16.5 23.0 36.0 54.5 60.5
Table ES-12 – 2015 Clearance Times for Base Scenario
Evacuation
Level A Base
Scenario
Evacuation
Level B
Base Scenario
Evacuation
Level C
Base Scenario
Evacuation
Level D
Base Scenario
Evacuation
Level E
Base Scenario
Clearance Time to Shelter
Hillsborough 14.5 22.0 29.5 41.0 54.5
Manatee 13.0 13.0 19.5 22.5 44.5
Pasco 13.5 20.5 40.5 58.5 54.0
Pinellas 13.0 13.0 20.0 29.0 50.5
In-County Clearance Time
Hillsborough 14.5 22.0 29.5 41.0 54.5
Manatee 14.0 15.0 24.0 36.5 51.5
Pasco 13.5 20.5 40.5 58.5 54.0
Pinellas 13.5 14.0 20.0 29.0 50.5
Out of County Clearance Time
Hillsborough 15.5 22.5 29.0 40.5 55.0
Manatee 14.5 15.0 24.0 36.0 51.5
Pasco 16.5 22.5 40.5 58.5 57.5
Pinellas 14.0 14.0 19.5 28.0 50.5
Regional Clearance Time
Tampa Bay Region 16.5 22.5 40.5 58.5 57.5

Statewide Regional Evacuation Study Program Volume 1-8 Tampa Bay
Executive Summary Page 17
Table ES-13 – 2010 Clearance Times for Operational Scenarios
Evacuation
Level A Operational
Scenario
Evacuation
Level B Operational
Scenario
Evacuation
Level C Operational
Scenario
Evacuation
Level D Operational
Scenario
Evacuation
Level E Operational
Scenario
Clearance Time to Shelter
Hillsborough 13.0 15.0 22.0 29.5 59.0
Manatee 10.0 13.0 19.0 28.0 53.0
Pasco 11.0 13.5 21.0 33.5 58.0
Pinellas 10.0 13.0 19.0 25.0 33.5
In-County Clearance Time
Hillsborough 13.0 15.0 22.0 29.5 59.0
Manatee 11.0 14.0 20.0 29.5 53.0
Pasco 11.0 13.5 21.0 33.5 58.0
Pinellas 11.5 14.0 20.5 29.0 58.5
Out of County Clearance Time
Hillsborough 13.0 15.5 22.0 29.0 59.0
Manatee 11.0 14.0 20.0 27.5 52.5
Pasco 11.5 14.5 21.0 34.0 60.0
Pinellas 11.5 13.5 20.0 28.5 58.0
Regional Clearance Time
Tampa Bay Region 13.0 15.5 22.0 34.0 60.0
Table ES-14 – 2015 Clearance Times for Operational Scenarios
Evacuation
Level A
Operational Scenario
Evacuation
Level B
Operational Scenario
Evacuation
Level C
Operational Scenario
Evacuation
Level D
Operational Scenario
Evacuation
Level E
Operational Scenario
Clearance Time to Shelter
Hillsborough 12.0 15.5 26.0 38.0 78.0
Manatee 10.0 13.0 19.0 27.0 69.5
Pasco 12.0 13.5 23.5 40.5 78.5
Pinellas 10.0 13.0 19.5 25.5 71.0
In-County Clearance Time
Hillsborough 12.0 15.5 26.0 38.0 78.0
Manatee 11.0 14.0 20.0 33.5 73.5
Pasco 12.0 14.5 23.5 40.5 78.5
Pinellas 11.0 14.0 20.0 31.0 72.0
Out of County Clearance Time
Hillsborough 12.0 15.5 25.5 38.0 78.0
Manatee 11.0 14.0 20.0 33.0 75.0
Pasco 11.5 14.5 26.0 37.0 78.0
Pinellas 10.5 14.0 20.0 31.0 72.0
Regional Clearance Time
Tampa Bay Region 12.0 15.5 26.0 38.0 78.0

Volume 1-8 Tampa Bay Statewide Regional Evacuation Study
Page 18 Executive Summary
4. TIME User Interface
Wilbur Smith Associates developed the Transportation Interface for Modeling Evacuations (TIME) to make it easier for RPC staff and transportation planners to use the model and implement the evacuation methodology. The TIME interface is based on an ArcGIS platform and is essentially a condensed transportation model, which provides a user friendly means of modifying input variables that would change the clearance times for various evacuation scenarios. The evacuation model variables include a set of distinguishing characteristics that could apply to evacuation scenarios as selection criteria. These following variables may be selected using the TIME interface and allow the user to retrieve the best results from various evacuation alternatives:
• Analysis time period; • Highway network; • Behavioral response; • One-way evacuation
operations;
• University population; • Tourist occupancy rates; • Shelters; • Counties evacuating; • Evacuation level; • Response curve hours; and, • Evacuation Phasing.
It is anticipated that the regional planning council and local governments will be able to use the TIME User Interface to simulate additional scenarios varying behavioral assumptions, reflecting proposed growth in coastal areas, new transportation improvements, etc.
F. GLOSSARY The Glossary at the back of the Technical Data Report contains the definitions of the terms used throughout the document. In many cases, it represents the legal consensus of the definition of terms in statute pertaining to growth management. The Statewide Regional Evacuation Study Program represents a consistent and coordinated approach to provide tools for both the emergency management as well as the planning community in the State of Florida.
G. CONCLUSIONS AND RECOMMENDATIONS
Obviously, the implementation of a successful hurricane evacuation in the Tampa Bay Region will be complex and challenging. It will require a team effort - not just on the

Statewide Regional Evacuation Study Program Volume 1-8 Tampa Bay
Executive Summary Page 19
part of the emergency management and response personnel - but of the entire community. We have come to a point in this metropolitan coastal region that complacency and apathy will have dire consequences.
The update of the Tampa Bay Region Hurricane Evacuation Study illustrates that there have been improvements in hurricane evacuation planning including increased public shelter capacity, assistance for the transit dependent, alternatives for evacuees with pets, special needs shelters, route improvements and growth management mitigation strategies helping to reduce the population-at-risk. However, there remain serious challenges in this region if we are to avoid the loss of life and property and human suffering witnessed in the 2005 hurricane season in Mississippi, Louisiana and Texas. Over the past 30 years, Tampa Bay Regional Planning Council (TBRPC), the State of Florida, County Emergency Management agencies, the American Red Cross and many other agencies have worked together to prepare regionally for a disaster – not just the inevitable strike of a hurricane but the impacts of flooding, hazardous material incidents and terrorist attack. Recent events have tragically demonstrated the power of nature and the horrific results if government and citizens fail to respond appropriately. As public servants and elected officials, it is imperative to address the concerns of our citizens and leaders regarding our ability to manage a major disaster.
1. Public Education
Our citizens’ knowledge and understanding of personal risk and appropriate evacuation response remains a serious challenge. The behavioral surveys indicated that many residents – even those in the most surge-vulnerable areas and mobile homes – believe their home would be safe in a major hurricane, do not have a family disaster plan, and many will not evacuate regardless of the intensity of the storm or government actions. This fact means that those who choose to stay behind in mobile homes and areas vulnerable to storm surge and velocity wave action might not survive a storm. In turn, many residents - well inland of storm surge and in site-built homes - responded that they will try to evacuate -- many out of the region or state. Because of the “shadow evacuation,” resulting clearance times are exceedingly high necessitating the planning of refuge shelters along critical evacuation routes, reverse laning of Interstate systems and the potential of evacuation problems seen in Houston, Texas, with Hurricane Rita (2005).
The hurricane public information program in the Tampa Bay region is a comprehensive program geared toward pre-storm information (Public

Volume 1-8 Tampa Bay Statewide Regional Evacuation Study
Page 20 Executive Summary
Education) as well as prepared emergency public information for use during the emergency (Public Information). The major product of the public education program is the Hurricane Guide, which is printed and distributed every year at the beginning of hurricane season. Approximately 350,000 copies of the guide were printed and distributed in 2010 in 7 counties and 2 languages. In addition, the guide is augmented by local (printed) information, interactive web sites, citizen information lines, public speaking engagements, and information relayed in schools, newspapers, the broadcast media and neighborhood associations throughout the season. In order to elicit an immediate evacuation response, the population-at-risk must be clearly and conclusively convinced that (1) they are indeed residing in a vulnerable area and (2) that a decision not to leave could well mean their loss of life or injury. Post-hurricane studies have shown that the most vital piece of information is the information received from the emergency management personnel and local officials. For the most part, people will respond based upon the urgency and seriousness of the threat as conveyed by the emergency response personnel (HMG, 1999 and 2006). Three key messages have been identified:
• Know your risk (evacuation zone/ mobile homes)
• Make a family plan. • Obtain emergency supplies for at least 3-5 days.
The accurate formulation and comprehensive dissemination of these critical pieces of information to the public in a simple and understandable form is essential for implementation of an effective hurricane evacuation plan. Hopefully, irrational emergency decision-making on the part of the population can be decreased if they determine their vulnerability to a hurricane before the emergency occurs. Residents in the Tampa Bay region are encouraged to become familiar with the county plans for evacuation and to make their "family plans” and business plans ahead of time. The State of Florida has partnered with the Florida Broadcasting Association to encourage the “culture of preparedness” including PSAs and billboards. Partnering at the local level is also needed. Additional notification procedures (of evacuation level) is implemented and repeated throughout the season. The local governments in the region do have programs which provide these services to their residents so it is unclear why so many residents do not know their evacuation level or understand their risk.
• Notification on utility bills (zone designation) • Notification on tax bills (zone designation)

Statewide Regional Evacuation Study Program Volume 1-8 Tampa Bay
Executive Summary Page 21
• Special mailings and deliveries • Interactive Web sites (zone look up) • Citizen Information lines (zone look up)
Perhaps the answer lies in a continued strengthen initiative to partner with all levels of government, the private sector, civic and business associations and non-profit/volunteer agencies and the media to “get the word out” about preparedness and mitigation. Businesses have been increasingly active in developing continuity plans and providing information to their employees. Churches and civic associations, neighborhood associations, crime watch and Community Emergency Response Teams (CERT) can provide direct contact and face-to-face communication. 2. Special Needs Providing shelter for residents with special needs is a critical issue. Partners including the Dept. of Health, home health agencies, hospitals and skilled nursing facilities, to name just a few, must work with local agencies to (1) register and determine the appropriate level of care and appropriate shelter alternative for each resident and (2) provide the facility, staff, equipment and supplies and transportation assistance in an effective manner in a disaster situation. Again, we need to develop strong partnerships with those entities in the community that work with our citizens with special needs on a daily basis to ensure they receive the information and support they need before, during and after a disaster. 3. Mitigation Message As identified, the results of the Statewide Regional Evacuation Study for the Tampa Bay Region highlight the challenges of the emergency management community in a metropolitan coastal area such as Tampa Bay. If people do not respond correctly when an evacuation order is given, there will be serious implications on the entire emergency response. For example, if residents who live in low-lying surge vulnerable areas or mobile homes do not evacuate, they are putting their safety at risk. Conversely, if residents who live in site-built homes outside the surge-vulnerable areas try to evacuate in significant numbers - as they did

Volume 1-8 Tampa Bay Statewide Regional Evacuation Study
Page 22 Executive Summary
during the 1999 Hurricane Floyd evacuation and for Hurricane Rita in 2005 - the resulting traffic congestion may prevent anyone from reaching safety.
The answer is comprehensive consistent public education which focuses on encouraging our residents to do the following (1) know their risk, and (2) plan ahead. Again, key messages include:
• Individual Responsibility – Be disaster resilient. Know your risk, plan ahead and obtain needed supplies.
• Encourage residents to “Flee from Flood; Hide from Wind”. Obviously, coastal residents in surge vulnerable areas and mobile home residents must evacuate; however, the key message is to seek refuge within “tens of miles, not hundreds of miles.”
• Strongly encourage all residents who live in site-built homes outside the surge vulnerable areas to call and invite friends or relatives who must evacuate to come and stay with them if there is a hurricane threat. Once they have committed by inviting their friends or relatives, we will also encourage residents to prepare their homes and mitigate for the potential winds, i.e. window and door protection, braced gable end roofs, and garage doors.
• It is assumed if inland residents take action to protect their homes from wind, they will be less likely to try to “outrun” a hurricane.
4. The Coastal High Hazard Area (CHHA) In 2006 the Florida Legislature passed a bill changing the definition of the coastal high hazard area (CHHA) from the evacuation zone to the “area defined by the SLOSH model to be inundated from a category one hurricane.” This change was welcome as the definition was more defensible tying the land use regulations to a scientific model rather than the zone delineated by roadways and familiar landmarks. However, the limitations of the model must be recognized by the local governments now responsible for its regulation. As discussed, the SLOSH model does not address wave height and other local processes. It also does not incorporate the danger of isolation in areas surrounded by storm surge with limited access such as barrier islands. These two issues are of serious concern and it is recommended that local governments address them within their comprehensive plans and land development regulations.
H. Use of SRES Data in Growth Management While this study is primarily designed for the local emergency management agencies to utilize in the preparation of emergency response, evacuation, sheltering and mitigation plans, Chapter 163.3178 of the Florida Statutes directs growth management planners to

Statewide Regional Evacuation Study Program Volume 1-8 Tampa Bay
Executive Summary Page 23
this study to identify exceedances when determining the impacts of growth on the safety of the public. Therefore, this study is also designed with many features to address growth management issues. Key items included are Coastal High Hazard Areas (CHHA), clearance times, shelter capacity, and tools for determining impacts of growth.
1. Storm Tide Limits and the Coastal High Hazard Area The Statewide Regional Evacuation Study (SRES) contains data which is directly referenced in growth management legislation in the State of Florida and coastal/conservation elements of the Local Government Comprehensive Plans. The Storm Tide Atlas (Volume 7) and the storm tide limits it portrays for each county define the Coastal High Hazard Area (CHHA)5. Section 163.3178(9)(c), Florida Statutes requires local governments to amend their future land use map and coastal management element to include the new definition of the Coastal High Hazard Area and to depict the CHHA on the County’s Future Land Use Map. As indicated in the Hazards Analysis chapter (Volume 1: Technical Data Report, Chapter II), the ultimate amount of storm surge at any given coastal location is determined by a number of factors. It has been demonstrated that storm parameters including the wind speed and profiles, angle of approach, size of radii of maximum winds and the forward speed of the system will have a complex and inter-related affect on the amount of surge at a particular site. For example, Hurricane Ike which struck the Galveston area in 2008 was classified as a Category 2 hurricane on the Saffir Simpson Hurricane Wind Scale yet it produced a 24 – 26 foot storm surge (often associated with a Category 5 Hurricane) due to its large wind field (radius of maximum winds) and angle of approach. 2. Storm Tide Limits and Evacuation Zones
Emergency management officials use many factors in determining County Evacuation Zones, with storm tide limits being a major component. However, it is important to note that the storm tide boundaries are not the only data used in this determination. Local officials use their knowledge of the area and other data such as: areas of repetitive loss, surge depth, freshwater flooding, isolation issues, and debris hazards, and typically choose known landmarks to identify boundaries for public warning and information. As a result, the Evacuation zones largely correspond to the storm tide limits of the Category 1 – 5 hurricanes on the Saffir-Simpson Wind Scale. However, the degree
5 Section 163.3178(2) (h), F.S. “the area below the elevation of the Category 1 storm surge
line as established by a Sea, Lake and Overland Surge from Hurricanes (SLOSH) computerized storm surge model.”

Volume 1-8 Tampa Bay Statewide Regional Evacuation Study
Page 24 Executive Summary
to which any specific zone corresponds to storm tide limits is directly related to the affect other data factors have on the final determination of County Evacuation Zones by local officials. These factors may lead local officials to consolidate zones, add additional zones, expand or contract zones to ensure those threatened by the hazards are appropriately included. The 2010 SRES introduces alphabetic Evacuation Zones/Levels (A-E) across the State for the first time. A map (Figure IV-2) of these zones is located in Chapter IV: Regional Population and Vulnerability Analysis found in Volume 1 of the Study. For purposes of growth management planning, the reference to areas to be evacuated from a Category 1 hurricane should use Evacuation Zone/Level A, reference to evacuation areas to be evacuated in advance of a Category 2 hurricane should use Evacuation Zone/Level B, and reference to areas to be evacuated from a Category 3 hurricane should use Evacuation Zone/Level C. Similarly, in policies which refers to evacuation areas from a Category 4 or 5 hurricane, Evacuation Zones/Levels D or E should be used respectively. Where there are consolidated zones or evacuation levels please refer to the detailed reference information (Chapter IV: Regional Population and Vulnerability Analysis of Volume 1). 3. Evacuation Transportation Two types of scenarios (Base scenarios and Operational scenarios) were defined in the Evacuation Transportation Analysis (Volume 4) for use in the Regional Evacuation Model to derive the evacuating population, evacuation vehicles, clearance times and critical congested roadways. Most pertinent to Growth Management are the base scenarios, which were developed to estimate a worst case scenario in which 100% of the vulnerable population (those found in evacuation zones) evacuate plus the addition of “shadow evacuation”. The standard assumptions utilized as the baseline were identified by the Division of Community Planning (DCP) as best suited for use in growth management analysis. The Base Scenarios (Table VI-9, Chapter VI: Evacuation Transportation Analysis Summary in Volume One) are provided to supply the anticipated time needed to evacuate all vulnerable populations (clearance times are found in tables VI-11 and VI-12, Chapter VI: Evacuation Transportation Analysis Summary in Volume One).The Base Scenarios also supply the baseline data for planning purposes (maximum evacuation population found in tables VI-15 and VI-16, Chapter VI: Evacuation Transportation Analysis Summary in Volume One) . This allows for the evaluation of growth management strategies and provides a consistent statewide measure for clearance time calculations. The ability to alter scenarios is also available, allowing a planner to increase or decrease population, roadway capacities, shelter availability and more; then measure the variations to determine impacts of population, land use or infrastructure changes. The Transportation Interface for Modeling Evacuations (TIME) is the tool developed to allow users to run further scenarios. Built on the Cube Voyager and Cube Avenue software, this interface is a user- friendly interface which provides the ability to run variations on the transportation scenario, without being transportation planners. If needed, a transportation planner familiar with the model’s underlying software can provide a more complex analysis.

Statewide Regional Evacuation Study Program Volume 1-8 Tampa Bay
Executive Summary Page 25
4. Definitions In addition to the data provided, the SRES also defines terms (Volume One: Technical Data Report, Glossary) that are referenced in Florida legislation including various Evacuation Clearance Times (Clearance Time to Shelter, In-County Clearance Time, Out-of-County Clearance Time and Regional Clearance Time). These Clearance Time definitions better clarify the criterion in determining the compliance of Comprehensive Plan Amendments with State coastal high hazard provisions as prescribed in Section 163.3178(9), Florida Statutes. Using the uniform assumptions from the Base Scenarios, the SRES supplies the information to provide a consistent statewide methodology to assess current conditions as well as quantify impacts that may need to be mitigated. 5. Sheltering As indicated in the Hurricane Preparedness Policy Rule (Rule 9J-2.0256 (4), F.A.C.), shelter space surplus and deficits are utilized to determine impacts of Developments of Regional Impacts (DRI). Chapter 5: Regional Shelter Analysis of the Technical Data Report provides general information on sheltering (general population, special needs and pet friendly), listings of all county shelters and their capacity as well as specific public shelter demand (Table V-9 through V-12). Shelter surplus and deficits are outlined in these tables as well. Important to note: shelters listed in the study are divided in two categories, ‘primary’ and ‘other’ shelters. Primary shelters are ARC 4496 compatible and may meet other requirements as well (Enhanced Hurricane Protection Areas). A County’s shelter capacity is based upon these primary shelters. Each study may list ‘other shelter resources’ that are within each County, but these shelters may or may not be utilized during an event.

Funding was provided by the Florida Legislature with funding from the
Federal Emergency Management Agency (FEMA) through the Florida
Division of Emergency Management. Local match was provided by the
Tampa Bay Regional Planning Council and Hillsborough, Manatee, Pasco
and Pinellas Counties.
Florida Division of Emergency Management
David Halstead, Director
2555 Shumard Oak Boulevard, Tallahassee, Florida 32399
Web site: www.floridadisaster.org
Prepared and published by
Tampa Bay Regional Council, 4000 Gateway Centre Blvd., Pinellas Park, Florida 33782.
Tel: (727) 570-5151, Fax: (727) 570-5118, E-mail: [email protected] or [email protected] Web site:
www.tbrpc.org
Study Managers: Betti C. Johnson, AICP, Principal Planner and Marshall Flynn, IT Manager
Statewide Program Manager: Jeffrey Alexander, Northeast Florida Regional Council