
Florida Managed Medical Assistance Program CMS granted temporary extensions of program until...
76
Florida Managed Medical Assistance Program 1115 Research and Demonstration Waiver 4 th Quarter Progress Report (April 1, 2013 – June 30, 2013) Demonstration Year 7 Agency for Health Care Administration
Transcript of Florida Managed Medical Assistance Program CMS granted temporary extensions of program until...

Florida Managed Medical
Assistance Program
1115 Research and Demonstration Waiver
4th Quarter Progress Report (April 1, 2013 – June 30, 2013)
Demonstration Year 7
Agency for Health Care Administration

This page intentionally left blank

i
Table of Contents
I. WAIVER HISTORY ............................................................................................................................1
II. STATUS OF THE DEMONSTRATION ..................................................................................................3
A. HEALTH CARE DELIVERY SYSTEM ........................................................................................................3
1. Health Plan Contracting Process ...................................................................................................................... 3 2. Benefit Package ................................................................................................................................................ 6 3. Health Plan Reported Complaints, Grievances and Appeal Process ............................................................... 10 4. Agency-Received Complaints/Issues Resolution Process ................................................................................ 12 5. Medical Loss Ratio .......................................................................................................................................... 13 6. On-Site Surveys and Desk Reviews ................................................................................................................. 15
B. CHOICE COUNSELING PROGRAM ...................................................................................................... 16
1. Choice Selection Tools .................................................................................................................................... 16 2. Online Enrollment ........................................................................................................................................... 18 3. Call Center ...................................................................................................................................................... 18 4. New Eligible Self-Selection Data ..................................................................................................................... 22
C. ENROLLMENT DATA ...................................................................................................................... 23
1. Medicaid Reform Enrollment Report .............................................................................................................. 23 2. Medicaid Reform Enrollment by County Report ............................................................................................. 25 3. Medicaid Reform Voluntary Population Enrollment Report ........................................................................... 27
D. ENHANCED BENEFITS ACCOUNT PROGRAM ........................................................................................ 29
1. Call Center Activities ....................................................................................................................................... 29 2. Enhanced Benefits Statistics ........................................................................................................................... 31 3. Enhanced Benefits Advisory Panel .................................................................................................................. 31 4. Notice of EBA Program Phase Out .................................................................................................................. 31
E. LOW INCOME POOL ...................................................................................................................... 32
1. Future LIP Council Meetings ........................................................................................................................... 33 2. LIP STCs - Reporting Requirements ................................................................................................................. 33
F. MONITORING BUDGET NEUTRALITY .................................................................................................. 37
G. ENCOUNTER AND UTILIZATION DATA ................................................................................................ 51
H. DEMONSTRATION GOALS ............................................................................................................... 53
I. EVALUATION OF THE DEMONSTRATION ............................................................................................... 60
J. POLICY AND ADMINISTRATIVE ISSUES ................................................................................................. 63
ATTACHMENT I PSN COMPLAINTS/ISSUES ........................................................................................ 67
ATTACHMENT II HMO COMPLAINTS/ISSUES ..................................................................................... 68
ATTACHMENT III 2008 – 2012 MANAGED CARE PERFORMANCE MEASURES ....................................... 70

ii
List of Tables Table 1 Health Plan Applicants ...................................................................................................................................... 4 Table 2 Medicaid Reform Health Plan Contracts ........................................................................................................... 5 Table 3 PSN Conversion to Capitation Timeline ............................................................................................................ 6 Table 4 Number of Co-payments by Type of Service by Demonstration Year .............................................................. 8 Table 5 Number & Percent of Total Benefit Packages Requiring No Co-payments by Demonstration Year ................ 8 Table 6 Number of Benefit Packages Requiring No Co-payments by Target Population & Area .................................. 9 Table 7 Health Plan Reported Complaints ................................................................................................................... 11 Table 8 Grievances and Appeals .................................................................................................................................. 11 Table 9 Medicaid Fair Hearing Requests and Medicaid Fair Hearings Held ................................................................ 12 Table 10 BAP Requests ................................................................................................................................................ 12 Table 11 Agency-Received Complaints/Issues ............................................................................................................. 13 Table 12 Health Plan Medical Loss Ratio Reporting Schedule ..................................................................................... 14 Table 13 On-Site Survey Categories ............................................................................................................................. 15 Table 14 Online Enrollment Statistics .......................................................................................................................... 18 Table 15 Comparison of Call Volume for Fourth Quarter ............................................................................................ 18 Table 16 Number of Referrals and Case Reviews Completed ..................................................................................... 19 Table 17 Choice Counseling Outreach Activities ......................................................................................................... 20 Table 18 Choice Counseling Caller Satisfaction Results ............................................................................................... 21 Table 19 Self-Selection and Auto-Assignment Rate .................................................................................................... 22 Table 20 Medicaid Reform Enrollment Report Column Descriptions .......................................................................... 23 Table 21 Medicaid Reform Enrollment ........................................................................................................................ 24 Table 22 Number of Reform Health Plans in Demonstration Counties ....................................................................... 25 Table 23 Medicaid Reform Enrollment by County Report Descriptions ...................................................................... 25 Table 24 Medicaid Reform Enrollment by County Report ........................................................................................... 26 Table 25 Medicaid Reform Voluntary Population Enrollment Report Descriptions .................................................... 27 Table 26 Medicaid Reform Voluntary Population Enrollment Report ......................................................................... 28 Table 27 Highlights of the Enhanced Benefits Call Center Activities ........................................................................... 30 Table 28 Enhanced Benefits Recipient Complaints ..................................................................................................... 30 Table 29 Enhanced Benefits Account Program Statistics ............................................................................................ 31 Table 30 PCCM Targets ................................................................................................................................................ 40 Table 31 MEG 1 Statistics: SSI Related ........................................................................................................................ 41 Table 32 MEG 2 Statistics: Children and Families ....................................................................................................... 42 Table 33 MEG 1 and 2 Annual Statistics ...................................................................................................................... 45 Table 34 MEG 1 and 2 Cumulative Statistics ............................................................................................................... 48 Table 35 MEG 3 Statistics: Low Income Pool .............................................................................................................. 49 Table 36 MEG 3 Total Expenditures: Low Income Pool .............................................................................................. 49 Table 37 Broward County Number and Type of Plans (Pre-Demonstration 2006) ..................................................... 53 Table 38 Duval County Number and Type of Plans (Pre-Demonstration 2006) .......................................................... 53 Table 39 Broward County Number and Type of Plans ................................................................................................. 53 Table 40 Duval County Number and Type of Plans ..................................................................................................... 53
List of Charts
Chart A Illustration of Choice Selection Tools in Health Track Enrollment System ..................................................... 17 Chart B Choice Tool Use by Type ................................................................................................................................. 17

1
I. Waiver History Background
On October 19, 2005, Florida's 1115 Research and Demonstration Waiver named “Medicaid Reform” was approved by the Centers for Medicare and Medicaid Services (Federal CMS). Medicaid Reform was designed as a comprehensive demonstration with the following key components: comprehensive choice counseling, customized benefit packages, enhanced benefits for participating in healthy behaviors, risk-adjusted premiums based on enrollee health status, and a Low Income Pool. The program was initially implemented in Broward and Duval Counties on July 1, 2006 and expanded to Baker, Clay and Nassau Counties on July 1, 2007. On June 30, 2010, a three-year waiver extension request was submitted to Federal CMS to maintain and continue operations of Medicaid Reform for the period July 1, 2011 through June 30, 2014. Federal CMS granted temporary extensions of program until December 15, 2011, when final approval of the waiver extension request was granted, for the period December 16, 2011 through June 30, 2014. On August 1, 2011, an amendment request was submitted to Federal CMS to implement the Managed Medical Assistance (MMA) program as specified in Part IV of Chapter 409, Florida Statutes (F.S.). The amendment and related documents can be viewed on the Agency’s website at the following link: http://ahca.myflorida.com/Medicaid/statewide_mc/index.shtml#FCA On February 20, 2013, the Agency received a letter from Federal CMS stating an agreement in principle was reached regarding Federal CMS granting the amendment to implement the MMA program. On June 14, 2013, Federal CMS approved the amendment to implement the MMA program along with newly amended Special Terms and Conditions (STCs), waiver and expenditure authorities. The amendment approval documents can be viewed on the Agency’s website at the link provided above. Federal approval of the MMA amendment permits Florida Medicaid to move from a fee-for-service system to the MMA program. The key components of the program include: choice counseling, competitive procurement of managed care plans, customized benefit packages, healthy behavior programs, risk-adjusted premiums based on enrollee health status and a Low Income Pool. The MMA program will increase consumer protections as well as quality of care and access for Floridians in many ways including: • Increases recipient participation on Florida’s Medical Care Advisory Committee and
convenes smaller advisory committees to focus on key special needs populations;
• Ensures the continuation of services until the primary care or behavioral health provider reviews the enrollee’s treatment plan (no more than 60 calendar days after the effective date of enrollment);
• Ensures recipient complaints, grievances and appeals are reviewed immediately for resolution as part of the rapid cycle response system;
• Establishes Healthy Behaviors programs to encourage and reward healthy behaviors and, at a minimum, requires plans offer a medically approved smoking cessation program, a medically directed weight loss program and a substance abuse treatment plan;
2
• Requires Florida’s External Quality Assurance Organization to validate each plan’s encounter data every three years;
• Enhances consumer report cards to ensure recipients have access to understandable summaries of quality, access and timeliness regarding the performance of each participating managed care plan;
• Enhances the plan’s performance improvement projects by focusing on six key areas with the goal of achieving improved patient care, population health and reducing per capita Medicaid expenditures;
• Enhances metrics on plan quality and access to care to improve plan accountability; and
• Creates a comprehensive state quality strategy to implement a comprehensive continuous quality improvement strategy to focus on all aspects of quality improvement in Medicaid.
The existing Medicaid Reform program will be phased out as the MMA program is implemented in each region of the state no later than October 1, 2014 and as approved by Federal CMS. The state authority to operate the Medicaid Reform program is located in Section (s.) 409.91211, F.S., and will sunset October 1, 2014. The reporting requirements for the demonstration are specified in Florida law and newly amended STCs #90 and #91 of the waiver. Newly amended STC #90 requires the state submit a quarterly progress report summarizing the events occurring during the quarter or anticipated to occur in the near future that affect health care delivery, including, but not limited to, approval and contracting with new plans, specifying coverage area, populations served, benefits, enrollment, grievances, and other operational issues. This report is the fourth quarterly report for Demonstration Year Seven covering the period of April 1, 2013 – June 30, 2013. For detailed information about the activities that occurred during previous quarters of the demonstration, refer to the quarterly and annual reports, which can be accessed at: http://ahca.myflorida.com/Medicaid/medicaid_reform/quarterly.shtml Please note the state will continue to report on the Medicaid Reform program until the MMA program is fully implemented.

3
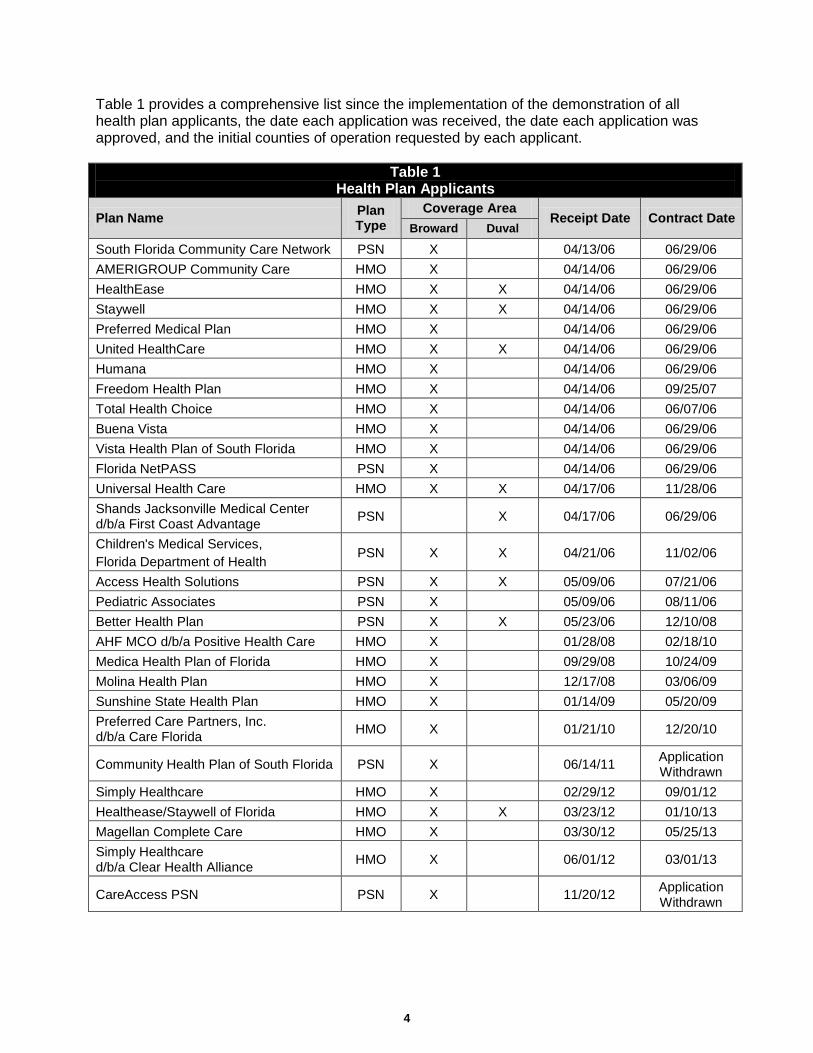
II. Status of the Demonstration A. Health Care Delivery System 1. Health Plan Contracting Process Overview All health plans, including contractors wanting to participate as demonstration health plans, are required to complete a Medicaid health plan application. The Agency uses an open health plan application process with submission guidelines to ensure applicants understand the contract requirements. The application process consists of four areas: (I) organizational and administrative structure; (II) policies and procedures; (III) on-site review; and (IV) contract execution, establishing a provider file in the Florida Medicaid Management Information System (FLMMIS), completing systems testing to ensure the health plan applicant is capable of submitting and retrieving HIPAA-compliant files and submitting accurate provider network files, and ensuring the health plan receives its first membership. Current Activities Health Plan Applications and Expansion Requests Since the implementation of the demonstration, the Agency has received 29 health plan applications [20 health maintenance organizations (HMOs) and nine fee-for-service (FFS) provider service networks (PSNs)], of which 27 applicants sought and received approval to provide services to both the Temporary Assistance for Needy Families (TANF) and the Supplemental Security Income (SSI) populations. Two applications were withdrawn. The following provides an update of the health plan applications and expansion requests during this quarter: • The Agency received no new applications.
• The Magellan Complete Care application to be an HMO in Broward County was approved.
• The Agency continues to review the request from Sunshine HMO to expand into Baker and Nassau Counties.
Remainder of page intentionally left blank.
4
Table 1 provides a comprehensive list since the implementation of the demonstration of all health plan applicants, the date each application was received, the date each application was approved, and the initial counties of operation requested by each applicant.
Table 1 Health Plan Applicants
Plan Name Plan Type
Coverage Area Receipt Date Contract Date
Broward Duval
South Florida Community Care Network PSN X 04/13/06 06/29/06 AMERIGROUP Community Care HMO X 04/14/06 06/29/06 HealthEase HMO X X 04/14/06 06/29/06 Staywell HMO X X 04/14/06 06/29/06 Preferred Medical Plan HMO X 04/14/06 06/29/06 United HealthCare HMO X X 04/14/06 06/29/06 Humana HMO X 04/14/06 06/29/06 Freedom Health Plan HMO X 04/14/06 09/25/07 Total Health Choice HMO X 04/14/06 06/07/06 Buena Vista HMO X 04/14/06 06/29/06 Vista Health Plan of South Florida HMO X 04/14/06 06/29/06 Florida NetPASS PSN X 04/14/06 06/29/06 Universal Health Care HMO X X 04/17/06 11/28/06 Shands Jacksonville Medical Center d/b/a First Coast Advantage PSN X 04/17/06 06/29/06
Children's Medical Services, Florida Department of Health
PSN X X 04/21/06 11/02/06
Access Health Solutions PSN X X 05/09/06 07/21/06 Pediatric Associates PSN X 05/09/06 08/11/06 Better Health Plan PSN X X 05/23/06 12/10/08 AHF MCO d/b/a Positive Health Care HMO X 01/28/08 02/18/10 Medica Health Plan of Florida HMO X 09/29/08 10/24/09 Molina Health Plan HMO X 12/17/08 03/06/09 Sunshine State Health Plan HMO X 01/14/09 05/20/09 Preferred Care Partners, Inc. d/b/a Care Florida HMO X 01/21/10 12/20/10
Community Health Plan of South Florida PSN X 06/14/11 Application Withdrawn
Simply Healthcare HMO X 02/29/12 09/01/12 Healthease/Staywell of Florida HMO X X 03/23/12 01/10/13 Magellan Complete Care HMO X 03/30/12 05/25/13 Simply Healthcare d/b/a Clear Health Alliance HMO X 06/01/12 03/01/13
CareAccess PSN PSN X 11/20/12 Application Withdrawn
5
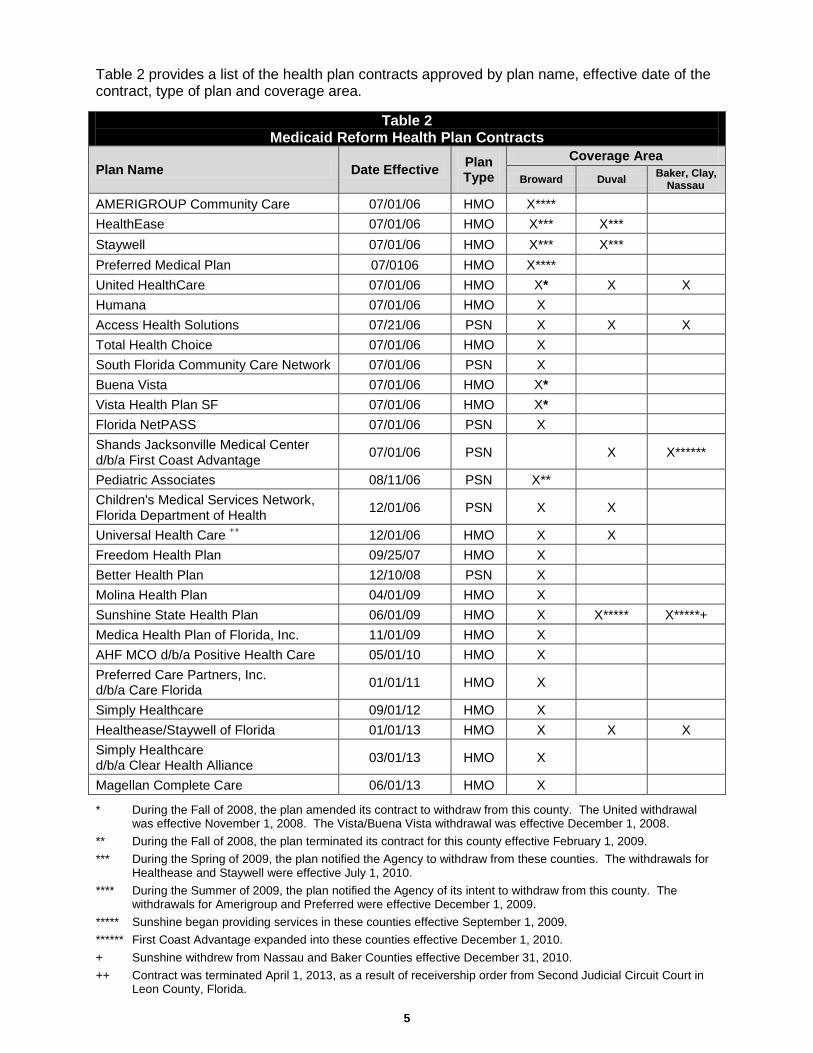
Table 2 provides a list of the health plan contracts approved by plan name, effective date of the contract, type of plan and coverage area.
Table 2 Medicaid Reform Health Plan Contracts
Plan Name Date Effective Plan Type
Coverage Area Broward Duval Baker, Clay,
Nassau
AMERIGROUP Community Care 07/01/06 HMO X**** HealthEase 07/01/06 HMO X*** X*** Staywell 07/01/06 HMO X*** X*** Preferred Medical Plan 07/0106 HMO X**** United HealthCare 07/01/06 HMO X* X X Humana 07/01/06 HMO X Access Health Solutions 07/21/06 PSN X X X Total Health Choice 07/01/06 HMO X South Florida Community Care Network 07/01/06 PSN X Buena Vista 07/01/06 HMO X* Vista Health Plan SF 07/01/06 HMO X* Florida NetPASS 07/01/06 PSN X Shands Jacksonville Medical Center d/b/a First Coast Advantage 07/01/06 PSN X X******
Pediatric Associates 08/11/06 PSN X** Children's Medical Services Network, Florida Department of Health 12/01/06 PSN X X
Universal Health Care ++ 12/01/06 HMO X X Freedom Health Plan 09/25/07 HMO X Better Health Plan 12/10/08 PSN X Molina Health Plan 04/01/09 HMO X Sunshine State Health Plan 06/01/09 HMO X X***** X*****+ Medica Health Plan of Florida, Inc. 11/01/09 HMO X AHF MCO d/b/a Positive Health Care 05/01/10 HMO X Preferred Care Partners, Inc. d/b/a Care Florida 01/01/11 HMO X
Simply Healthcare 09/01/12 HMO X Healthease/Staywell of Florida 01/01/13 HMO X X X Simply Healthcare d/b/a Clear Health Alliance 03/01/13 HMO X
Magellan Complete Care 06/01/13 HMO X
* During the Fall of 2008, the plan amended its contract to withdraw from this county. The United withdrawal was effective November 1, 2008. The Vista/Buena Vista withdrawal was effective December 1, 2008.
** During the Fall of 2008, the plan terminated its contract for this county effective February 1, 2009. *** During the Spring of 2009, the plan notified the Agency to withdraw from these counties. The withdrawals for
Healthease and Staywell were effective July 1, 2010. **** During the Summer of 2009, the plan notified the Agency of its intent to withdraw from this county. The
withdrawals for Amerigroup and Preferred were effective December 1, 2009. ***** Sunshine began providing services in these counties effective September 1, 2009. ****** First Coast Advantage expanded into these counties effective December 1, 2010. + Sunshine withdrew from Nassau and Baker Counties effective December 31, 2010. ++ Contract was terminated April 1, 2013, as a result of receivership order from Second Judicial Circuit Court in
Leon County, Florida.

6
Health Plan Capacity Health plan capacity is monitored on an ongoing basis. Health plans must supply an up-to-date provider network information file each month. The Agency uses the file to monitor the health plans’ compliance with required provider network composition and primary care physician (PCP)-to-member ratios. The choice counseling/enrollment broker contractor loads this information into its system for use as a choice selection tool and to enable PCP selection at the time of voluntary plan enrollment. Additionally, the Agency monitors overall capacity to ensure recipients have a choice of at least two health plans in each demonstration county. Magellan Complete Care (HMO) began providing services in Broward County on June 1, 2013. During this quarter, the Agency approved the request from United Healthcare (HMO) to increase its maximum enrollment levels in Clay and Duval Counties and the request from First Coast Advantage, LLC (PSN), to increase its maximum enrollment level in Duval County. Still under review are previously received requests from Sunshine State Health Plan (HMO) to increase its maximum enrollment level in Duval County and from Children’s Medical Services (PSN) to increase its maximum enrollment level in Broward County. Contract Amendments and Model Contracts
The only contract amendment this quarter was to increase United Healthcare’s (HMO) maximum enrollment level in Duval and Clay Counties. Contract Conversions/Terminations There were no contract conversions or terminations during this quarter. FFS PSN Conversion Process FFS PSNs are required to convert to capitation by the beginning of the final year of operation under the waiver extension, unless the FFS PSN opts to convert to capitation earlier as specified in s. 409.91211(3)(e), F.S. The Agency released an updated FFS PSN conversion application in April 2012 and continues to provide technical assistance to the FFS PSNs regarding conversion. Most FFS PSNs have submitted conversion applications. Table 3 provides the timeline to comply with the FFS PSN conversion-to-capitation requirement.
Table 3 PSN Conversion to Capitation Timeline
Deadline for current FFS PSNs to submit conversion applications to the Agency. 09/01/2013
Successful conversion of applicants and execution of capitated contracts for service begin date of 09/01/2014.
06/30/2014
2. Benefit Package Overview Customized benefit packages are one of the fundamental elements of the demonstration. Medicaid recipients are offered choices in health plan benefit packages customized to provide services that better suit health plan enrollees’ needs. The demonstration authorizes the Agency to allow capitated plans to create a customized benefit package by varying certain services for non-pregnant adults, varying cost-sharing and providing additional services. PSNs that chose a

7
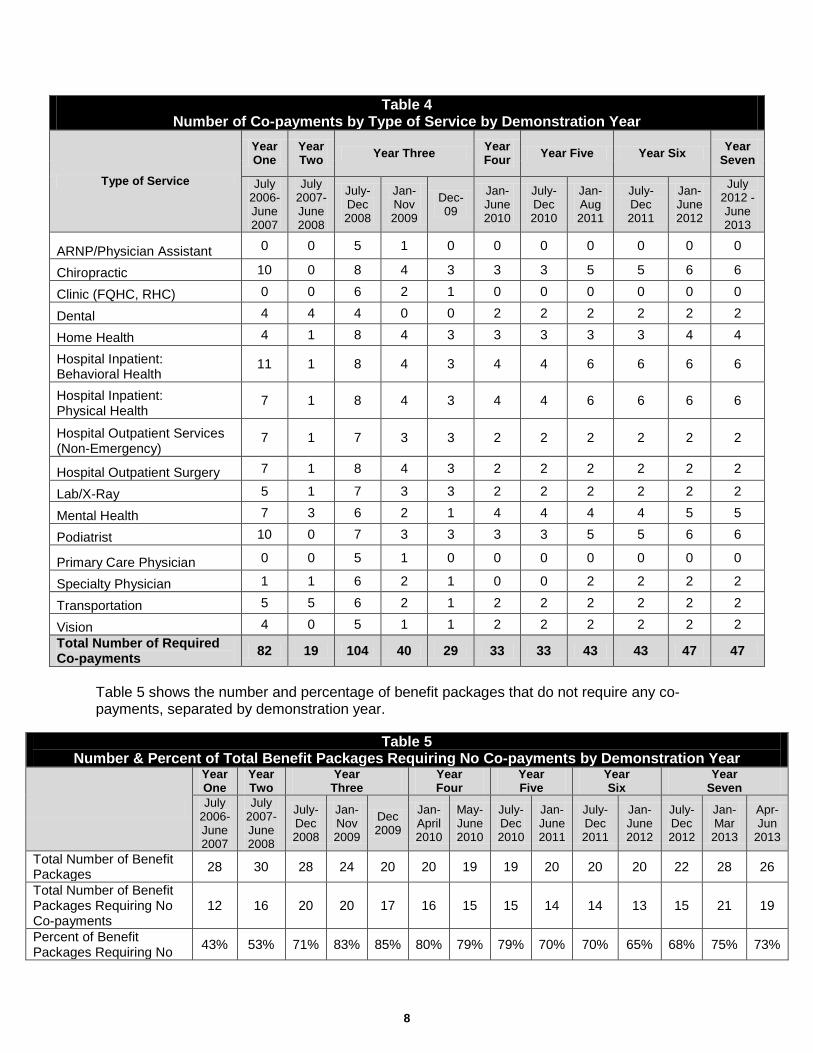
FFS reimbursement payment methodology cannot develop a customized benefit package, but can eliminate or reduce the co-payments and offer additional services. For more information about the design of the customized benefit packages, please refer to the most recent annual report posted on the Agency’s website at the following link: http://ahca.myflorida.com/Medicaid/medicaid_reform/annual.shtml. Current Activities Customized Benefit Packages The customized benefit packages became operational on January 1, 2013 and will remain valid until December 31, 2013, effectively overlapping Year Seven and Year Eight of the demonstration. These benefit packages include 26 customized benefit packages for the HMOs and 10 benefit packages for the FFS PSNs. Table 4 located on the following page lists the number of co-payments for each service type by each Demonstration Year. Benefit packages approved for Year Three of the demonstration were extended until December of 2009 in order to provide adequate notification to the recipients of any changes in their current health plan’s benefit package as well as to allow time for the printing and distribution of the revised choice materials for Demonstration Year Four. As such, in Tables 4 and 5, Demonstration Year Three has been divided into three columns: July 1, 2008 through December 31, 2008; January 1, 2009 through November 30, 2009; and December 2009. These different columns reflect the departure of health plans that ceased operations during Demonstration Year Three. In addition, Table 4 has been updated to reflect the customized benefit packages effective January 1, 2013 – December 31, 2013. During this quarter, Magellan Complete Care (HMO) completed the application process for Broward County, but received enrollment in the next quarter.
Remainder of page intentionally left blank.
8
Table 4 Number of Co-payments by Type of Service by Demonstration Year
Type of Service
Year One
Year Two Year Three Year
Four Year Five Year Six Year Seven
July 2006-June 2007
July 2007-June 2008
July-Dec 2008
Jan-Nov 2009
Dec-09
Jan-June 2010
July-Dec 2010
Jan- Aug 2011
July-Dec 2011
Jan-June 2012
July 2012 - June 2013
ARNP/Physician Assistant 0 0 5 1 0 0 0 0 0 0 0
Chiropractic 10 0 8 4 3 3 3 5 5 6 6
Clinic (FQHC, RHC) 0 0 6 2 1 0 0 0 0 0 0
Dental 4 4 4 0 0 2 2 2 2 2 2
Home Health 4 1 8 4 3 3 3 3 3 4 4
Hospital Inpatient: Behavioral Health
11 1 8 4 3 4 4 6 6 6 6
Hospital Inpatient: Physical Health
7 1 8 4 3 4 4 6 6 6 6
Hospital Outpatient Services (Non-Emergency)
7 1 7 3 3 2 2 2 2 2 2
Hospital Outpatient Surgery 7 1 8 4 3 2 2 2 2 2 2
Lab/X-Ray 5 1 7 3 3 2 2 2 2 2 2
Mental Health 7 3 6 2 1 4 4 4 4 5 5
Podiatrist 10 0 7 3 3 3 3 5 5 6 6
Primary Care Physician 0 0 5 1 0 0 0 0 0 0 0
Specialty Physician 1 1 6 2 1 0 0 2 2 2 2
Transportation 5 5 6 2 1 2 2 2 2 2 2
Vision 4 0 5 1 1 2 2 2 2 2 2 Total Number of Required Co-payments 82 19 104 40 29 33 33 43 43 47 47
Table 5 shows the number and percentage of benefit packages that do not require any co-payments, separated by demonstration year.
Table 5 Number & Percent of Total Benefit Packages Requiring No Co-payments by Demonstration Year
Year One
Year Two
Year Three
Year Four
Year Five
Year Six
Year Seven
July 2006-June 2007
July 2007-June 2008
July-Dec 2008
Jan-Nov 2009
Dec 2009
Jan-April 2010
May-June 2010
July-Dec 2010
Jan-June 2011
July- Dec 2011
Jan-June 2012
July-Dec 2012
Jan-Mar 2013
Apr-Jun
2013
Total Number of Benefit Packages 28 30 28 24 20 20 19 19 20 20 20 22 28 26
Total Number of Benefit Packages Requiring No Co-payments
12 16 20 20 17 16 15 15 14 14 13 15 21 19
Percent of Benefit Packages Requiring No 43% 53% 71% 83% 85% 80% 79% 79% 70% 70% 65% 68% 75% 73%

9
Co-payments Table 6 shows the number of benefit packages for Demonstration Years Four through Seven not requiring co-payments by population and area. Table 6 shows that for each area and target population, there is at least one benefit package to choose from that does not require co-payments.
Table 6 Number of Benefit Packages Requiring No Co-payments by Target Population & Area
Target Population
List of Counties in
Each Demonstration
Area
Number of Benefit Packages Not Requiring Co-payments
Year Four Year Five Year Six Year Seven
Jan May July-Dec Jan July-
June July-Dec
Jan-March
Apr-June
SSI (Aged and Disabled) Duval, Baker, Clay and Nassau
3 3 3 1 1 1 1 1
SSI (Aged and Disabled) Broward 6 5 5 6 6 7 7 8
TANF (Children and Families) Duval, Baker, Clay and Nassau
1 1 1 1 1 1 1 1
TANF (Children and Families) Broward 6 5 5 6 5 6 6 7 Expanded Services In Year Seven of the demonstration, all of the capitated health plans continue to offer expanded or additional benefits that were not previously covered by the state under the Medicaid State Plan in order to meet the needs of new enrollees. In the health plan contract, these are referred to as expanded services. The following is a list of the expanded services currently offered by the capitated health plans of which the over-the-counter drug benefits and adult preventive benefits are the most frequently offered: • Over-the-counter drug benefit – $25 per household per month
• Adult preventive dental
• Circumcisions for male newborns
• Additional adult vision
• Nutritional Counseling. Plan Evaluation Tool (PET) Since the implementation of the demonstration, no changes have been made to the sufficiency thresholds that were established for the first contract period of September 1, 2006 to August 31, 2007. After reviewing the available data – including data related to the plans’ pharmacy benefit limits – the Agency decided to limit the pharmacy benefit in Demonstration Year Three to a monthly script limit only. Prior to Demonstration Year Three, plans had the option of having a monthly script limit or a dollar limit on the pharmacy benefit. This change was made to standardize the mechanism used to limit the pharmacy benefit. The Agency will continue to require the plans to maintain the sufficiency threshold level of pharmacy benefit for SSI and TANF at 98.5%. In addition, the Agency will ensure each plan’s customized benefit

10
package meets or exceeds, and maintains, a minimum threshold of 98.5% for benefits identified as sufficiency tested benefits as required by newly amended STC #31. The PET submission procedure for Demonstration Year Seven was similar to that of the six previous years. The new PET was released by the Agency during the second quarter of Demonstration Year Seven. The health plans’ Year Seven benefit packages were approved during the second quarter of Demonstration Year Seven and became effective January 1, 2013. 3. Health Plan Reported Complaints, Grievances and Appeal Process Overview Health plan contracts include a grievance process, appeal process and Medicaid Fair Hearing (MFH) system. In addition, the health plan contracts include timeframes for submission, plan response and resolution of recipient grievances. This is compliant with federal grievance system requirements located in Subpart F of 42 CFR 438. As defined in the health plan contracts: • Action means the denial or limited authorization of a requested service, including the type or
level of service, pursuant to 42 CFR 438.400(b); the reduction, suspension or termination of a previously authorized service; the denial, in whole or in part, of payment for a service; the failure to provide services in a timely manner, as defined by the state; the failure of the health plan to act within ninety (90) days from the date the health plan receives a grievance, or 45 days from the date the health plan receives an appeal; and for a resident of a rural area with only one (1) managed care entity, the denial of an enrollee’s request to exercise his or her rights to obtain services outside the network.
• Appeal means a request for review of an action, pursuant to 42 CFR 438.400(b).
• Grievance means an expression of dissatisfaction about any matter other than an action. Possible subjects for grievances include, but are not limited to, the quality of care, the quality of services provided and aspects of interpersonal relationships such as rudeness of a provider or employee or failure to respect the enrollee’s rights.
In accordance with s. 409.91211(3)(q), F.S., the Agency provides for an additional grievance resolution process for enrollees, upon completion of the health plan’s internal grievance process, which is referred to as the Beneficiary Assistance Panel (BAP). The BAP will not consider a request that has already been to a MFH. The BAP reviews the requests within the following timeframes: 1. The state panel will review general grievances within 120 days. 2. The state panel will review grievances that the state determines pose an immediate and
serious threat to an enrollee's health within 45 days. 3. The state panel will review grievances that the state determines relate to imminent and
emergent jeopardy to the life of the enrollee within 24 hours. Enrollees in a health plan may file a request for a MFH at any time and are not required to exhaust the plan's internal appeal process or file with the BAP. Current Activities The Agency recognizes the need to understand the nature of all issues, regardless of the level at which they are resolved. To better understand the issues recipients face and how and where they are being resolved, the Agency is reporting all grievances and appeals at the health plan

11
level in the quarterly reports. The Agency also uses this information internally as part of the Agency’s continuous improvement efforts. Health Plan Reported Complaints The health plan contract requires the health plans to report the number of member complaints received by plan by quarter. Table 7 provides the number of complaints reported by plan type for this quarter. The health plan contract defines complaint as: any oral or written expression of dissatisfaction by an enrollee submitted to the health plan or to a state agency and resolved by close of business the following business day. The subjects for complaints include, but are not limited to, the quality of care, the quality of services provided, aspects of interpersonal relationships such as rudeness of a provider or health plan employee, failure to respect the enrollee’s rights, health plan administration, claims practices or provision of services that relate to the quality of care rendered by a provider pursuant to the health plan’s contract. A complaint is an informal component of the grievance system.
Table 7 Health Plan Reported Complaints
(April 1, 2013 – June 30, 2013) Quarter PSN Complaints HMO Complaints
April 1, 2013 – June 30, 2013 161 554
PSN plan reported complaints increased from 80 reported last quarter to 161 in this quarter. HMO plan reported complaints decreased from 623 reported last quarter to 554 in this quarter. Grievances and Appeals Table 8 provides the number of grievances and appeals by health plan type for this quarter.
Table 8 Grievances and Appeals
(April 1, 2013 – June 30, 2013)
Quarter PSN Grievances
PSN Appeals
HMO Grievances
HMO Appeals
April 1, 2013 – June 30, 2013 10 55 238 81
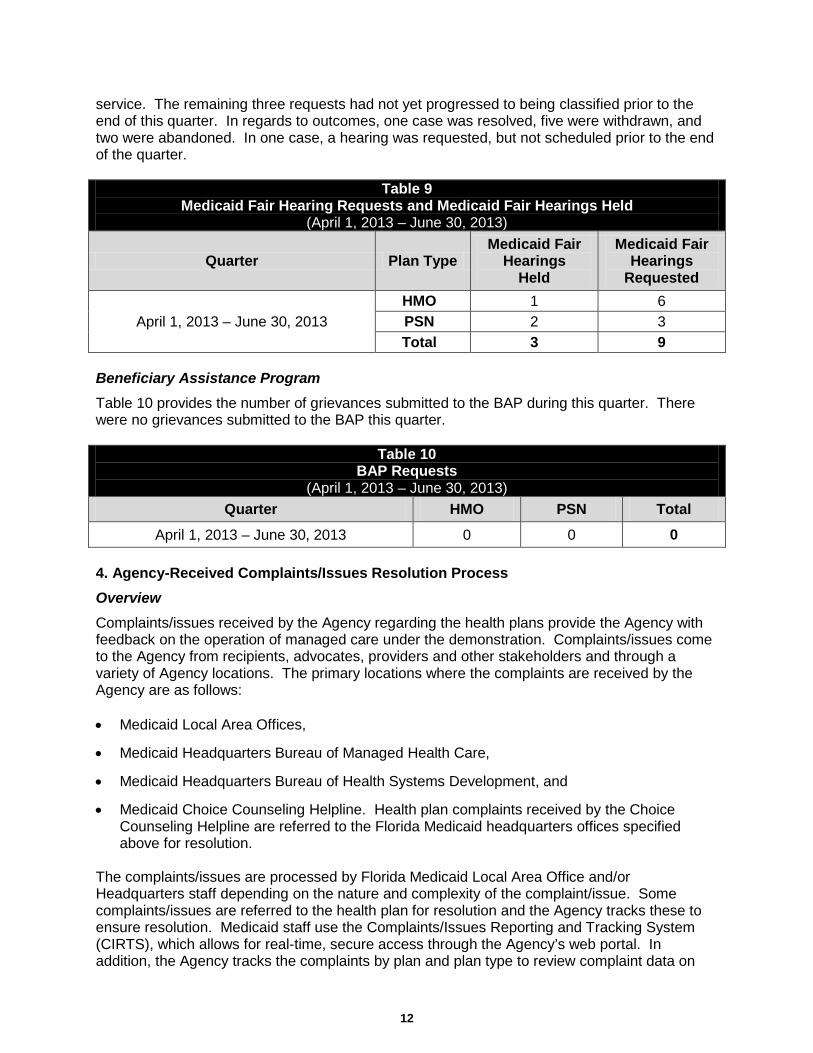
PSN grievances increased from six reported last quarter to ten in this quarter; the PSN appeals increased from 29 reported last quarter to 55 in this quarter. HMO grievances increased from 205 reported last quarter to 238 in this quarter; the HMO appeals increased from 64 reported last quarter to 81 in this quarter. Medicaid Fair Hearings (MFH) Table 9 located on the following page provides the number of MFHs requested and held during this quarter. Medicaid Fair Hearings are conducted through the Florida Department of Children and Families and, as a result, health plans are not required to report the number of fair hearings requested by enrolled members; however, the Agency monitors the MFH process. There were a total of nine MFHs requested this quarter: six for HMOs and three for PSNs. Of the nine MFH requests relating to demonstration participants, two were related to the reduction/suspension/ termination of benefits/services, and four were related to the denial/limitation of a benefit and/or
12
service. The remaining three requests had not yet progressed to being classified prior to the end of this quarter. In regards to outcomes, one case was resolved, five were withdrawn, and two were abandoned. In one case, a hearing was requested, but not scheduled prior to the end of the quarter.
Table 9 Medicaid Fair Hearing Requests and Medicaid Fair Hearings Held
(April 1, 2013 – June 30, 2013)
Quarter Plan Type Medicaid Fair
Hearings Held
Medicaid Fair Hearings
Requested
April 1, 2013 – June 30, 2013 HMO 1 6 PSN 2 3 Total 3 9
Beneficiary Assistance Program Table 10 provides the number of grievances submitted to the BAP during this quarter. There were no grievances submitted to the BAP this quarter.
4. Agency-Received Complaints/Issues Resolution Process Overview Complaints/issues received by the Agency regarding the health plans provide the Agency with feedback on the operation of managed care under the demonstration. Complaints/issues come to the Agency from recipients, advocates, providers and other stakeholders and through a variety of Agency locations. The primary locations where the complaints are received by the Agency are as follows: • Medicaid Local Area Offices,
• Medicaid Headquarters Bureau of Managed Health Care,
• Medicaid Headquarters Bureau of Health Systems Development, and
• Medicaid Choice Counseling Helpline. Health plan complaints received by the Choice Counseling Helpline are referred to the Florida Medicaid headquarters offices specified above for resolution.
The complaints/issues are processed by Florida Medicaid Local Area Office and/or Headquarters staff depending on the nature and complexity of the complaint/issue. Some complaints/issues are referred to the health plan for resolution and the Agency tracks these to ensure resolution. Medicaid staff use the Complaints/Issues Reporting and Tracking System (CIRTS), which allows for real-time, secure access through the Agency’s web portal. In addition, the Agency tracks the complaints by plan and plan type to review complaint data on
Table 10 BAP Requests
(April 1, 2013 – June 30, 2013) Quarter HMO PSN Total
April 1, 2013 – June 30, 2013 0 0 0
13
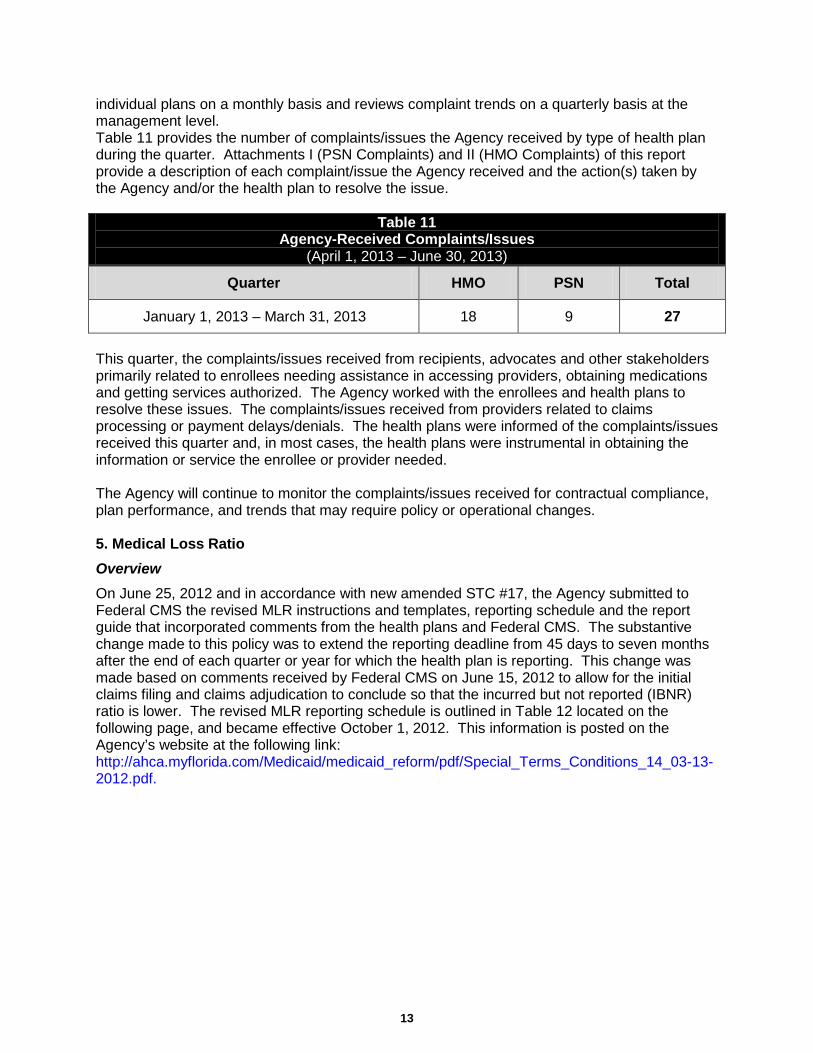
individual plans on a monthly basis and reviews complaint trends on a quarterly basis at the management level. Table 11 provides the number of complaints/issues the Agency received by type of health plan during the quarter. Attachments I (PSN Complaints) and II (HMO Complaints) of this report provide a description of each complaint/issue the Agency received and the action(s) taken by the Agency and/or the health plan to resolve the issue.
Table 11 Agency-Received Complaints/Issues
(April 1, 2013 – June 30, 2013)
Quarter HMO PSN Total
January 1, 2013 – March 31, 2013 18 9 27
This quarter, the complaints/issues received from recipients, advocates and other stakeholders primarily related to enrollees needing assistance in accessing providers, obtaining medications and getting services authorized. The Agency worked with the enrollees and health plans to resolve these issues. The complaints/issues received from providers related to claims processing or payment delays/denials. The health plans were informed of the complaints/issues received this quarter and, in most cases, the health plans were instrumental in obtaining the information or service the enrollee or provider needed. The Agency will continue to monitor the complaints/issues received for contractual compliance, plan performance, and trends that may require policy or operational changes. 5. Medical Loss Ratio Overview
On June 25, 2012 and in accordance with new amended STC #17, the Agency submitted to Federal CMS the revised MLR instructions and templates, reporting schedule and the report guide that incorporated comments from the health plans and Federal CMS. The substantive change made to this policy was to extend the reporting deadline from 45 days to seven months after the end of each quarter or year for which the health plan is reporting. This change was made based on comments received by Federal CMS on June 15, 2012 to allow for the initial claims filing and claims adjudication to conclude so that the incurred but not reported (IBNR) ratio is lower. The revised MLR reporting schedule is outlined in Table 12 located on the following page, and became effective October 1, 2012. This information is posted on the Agency’s website at the following link: http://ahca.myflorida.com/Medicaid/medicaid_reform/pdf/Special_Terms_Conditions_14_03-13-2012.pdf.

14
Table 12 Health Plan Medical Loss Ratio Reporting Schedule
Demonstration Year Quarter Due to Agency Due to CMS
Demonstration Year 7
(07/01/12 – 6/30/13)
Q1: 07/01/12 – 09/30/12 04/30/2013 05/15/2013
Q2: 10/01/12 – 12/31/12 07/31/2013 08/15/2013
Q3: 01/01/13 – 03/31/13 10/31/2013 11/15/2013
Q4: 04/01/13 – 06/30/13 01/30/2014 02/14/2014
DY 7 Annual Report 01/30/2014 02/14/2014
Demonstration Year 8
(07/01/13 – 06/30/14)
Q1: 07/01/13 – 09/30/13 04/30/2014 05/15/2014
Q2: 10/01/13 – 12/31/13 07/31/2014 08/15/2014
Q3: 01/01/14 – 03/31/14 10/31/2014 11/15/2014
Q4: 04/01/14 – 06/30/14 01/30/2015 02/14/2015
DY 8 Annual Report 01/30/2015 02/14/2015
In addition, the draft plan contract amendment language was posted on the Agency’s managed care website and provided to the health plans on July 1, 2012. After reviewing comments from Federal CMS and the health plans, the Agency revised the core contract provisions that became effective September 1, 2012 to reflect the following:
In accordance with the Florida’s Section 1115 Demonstration STCs, capitated health plans shall maintain an annual (July 1 through June 30) MLR of eighty-five percent (85%) for operations in the demonstration counties beginning July 1, 2012. The health plan shall submit data to the Agency quarterly to show ongoing compliance. The Federal CMS will determine the corrective action for non-compliance with this requirement.
Note: The capitated plan’s MLR data is evaluated annually to determine compliance, and quarterly reports are provided primarily for informational purposes. Seasonality and inherent claims volatility may cause MLR results to fluctuate somewhat from quarter to quarter, especially for smaller plans. The updated Health Plan Report Guide was posted July 1, 2012 and became effective 90 days later on October 1, 2012. As provided in the updated Report Guide, health plans will be expected to submit quarterly and annual MLR reports using the Agency supplied template and in accordance with the filing instructions in the draft version of Chapter 38. Quarterly MLR reports will be due to the Agency no later than 7 months following the close of the quarter. The first Annual MLR report, for the waiver Demonstration Year Seven (July 1, 2012 – June 30, 2013), is due to the Agency on January 30, 2014. The MLR calculation shall utilize uniform financial data collected from all capitated health plans operating in the demonstration areas and shall be computed for each plan on a statewide basis. For the purpose of calculating the MLR, “health care covered services” are defined as services provided by the health plan to Medicaid recipients in the demonstration area in accordance with

15
the Health Plan Medicaid Contract and as outlined in Section V, Covered Services, and Section VI, Behavioral Health Care, and Attachment I (see below).
“The method for calculating the MLR shall meet the following criteria: a) Except as provided in paragraphs (b) and (c), expenditures shall be classified in a
manner consistent with 45 CFR Part 158.
b) Funds provided by plans to graduate medical education institutions to underwrite the costs of residency positions shall be classified as medical expenditures, provided the funding is sufficient to sustain the position for the number of years necessary to complete the residency requirements and the residency positions funded by the plans are active providers of care to Medicaid and uninsured patients.
c) Prior to final determination of the medical loss ratio for any period, a plan may contribute to a designated state trust for the purpose of supporting Medicaid and indigent care and have the contribution counted as a medical expenditure for the period.”
Current Activities
The first quarterly MLR report for Demonstration Year Seven was due to the Agency on April 30, 2013 in accordance with newly amended STC #17c. During this quarter, all nine capitated health plans submitted their MLR reports to the Agency on or before the due date of April 30, 2013. The Agency submitted the capitated plan’s MLR results to Federal CMS on May 15, 2013 as outlined in Table 12, the Health Plan Medical Loss Ratio Reporting Schedule. Two of the nine capitated plans reported an MLR below 85% for the reporting period from July 1, 2012 to September 30, 2012. As noted earlier in the report, the capitated plan’s MLR data is evaluated annually to determine compliance, and quarterly reports are provided primarily for informational purposes. Seasonality and inherent claims volatility may cause MLR results to fluctuate somewhat from quarter to quarter, especially for smaller plans. 6. On-Site Surveys and Desk Reviews During this quarter, the Agency did not conduct on-site surveys of the health plans. The Agency continued to conduct desk reviews of health plan provider networks for adequacy; review financial reports; review medical, behavioral health, and fraud and abuse policies and procedures; and review and approve performance improvement projects, quality improvement plans, disease management programs, member and provider materials and handbooks. The Agency did perform a complete readiness review for a new health plan, Magellan Complete Care. Magellan Complete Care is active in Broward County only with membership effective July 1, 2013. Table 13 provides the list of on-site survey categories that may be reviewed during an on-site visit.
Table 13 On-Site Survey Categories
Services Provider Coverage/Services Marketing/Community Outreach Provider Records/Credentialing Utilization Management Claims Process Quality of Care Grievances and Appeals Member Services Financials

16
B. Choice Counseling Program Overview A continual goal of the demonstration is to empower recipients to take responsibility for their own health care by providing information needed to make the most informed decisions about health plan choices. Current Activities 1. Choice Selection Tools The current enrollment system, referred to as Health Track, allows the choice counselor to provide basic information to the recipients on how well each plan meets his or her health needs when making a health plan selection. The system compares the preferred drug list (PDL), as well as primary care physician (PCP), specialist and hospital network information. This feature is also available to recipients by accessing the online enrollment website. A brief description of each choice selection tool is outlined as follows: • PDL Comparison: Each health plan’s PDL is compared against the recipient’s prescribed
drug claims history, as well as any additional list of medications provided to the choice counselor by the recipient.
• PCP Comparison: Each health plan’s provider network file is searched simultaneously for the name of PCPs provided by the recipient.
• Specialist Comparison: Each health plan’s provider network file is searched simultaneously for the name of specialists provided by the recipient.
• Hospital Comparison: Each health plan’s provider network file is searched simultaneously for the name of hospitals provided by the recipient.
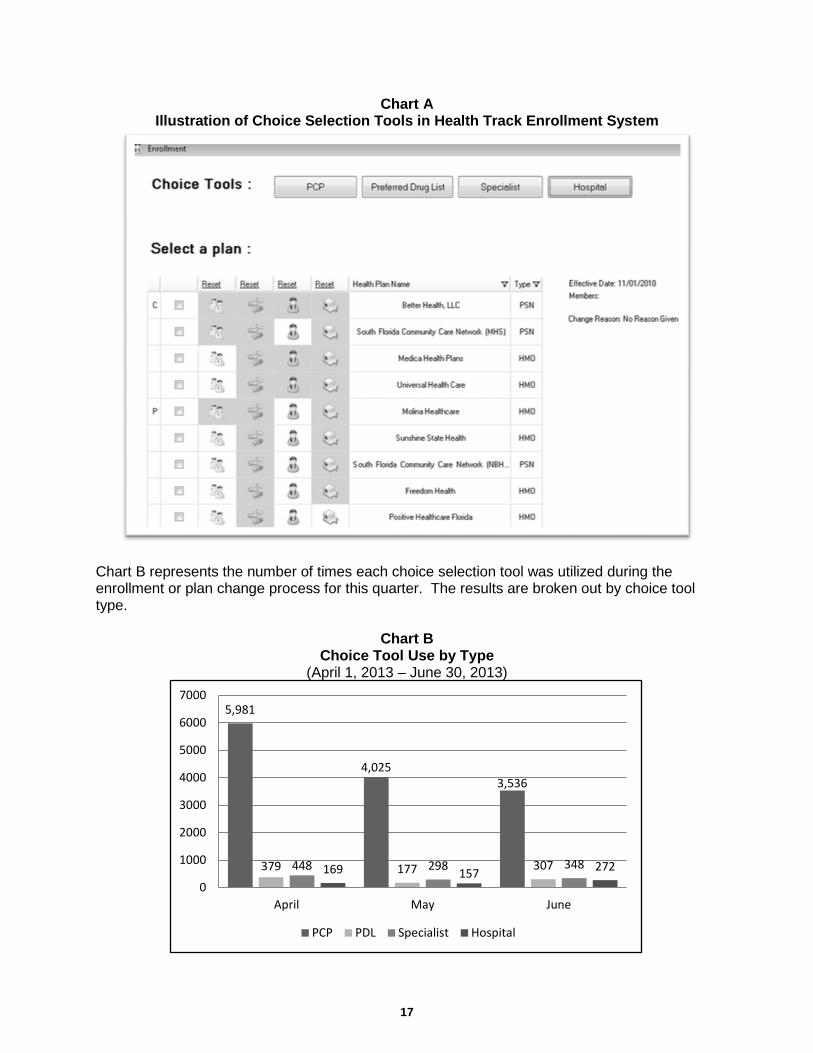
PDL information is updated quarterly, prescription claims information is updated daily and provider network files are updated monthly, at a minimum. Upon entering the search criteria for each choice selection tool, the system returns the results in an easy to read format, which sorts the health plans by those that meet the most of the recipients’ criteria to those that meet the least amount of criteria, as shown in Chart A located on the following page.
Remainder of page intentionally left blank.
17
Chart A Illustration of Choice Selection Tools in Health Track Enrollment System
Chart B represents the number of times each choice selection tool was utilized during the enrollment or plan change process for this quarter. The results are broken out by choice tool type.
Chart B Choice Tool Use by Type
(April 1, 2013 – June 30, 2013)
5,981
4,025 3,536
379 177 307 448 298 348 169 157 272 0
1000
2000
3000
4000
5000
6000
7000
April May June
PCP PDL Specialist Hospital

18
2. Online Enrollment Table 14 shows the number of online enrollments by month for this quarter. The Agency continues to work on increasing recipient awareness of the availability of online enrollment.
Table 14 Online Enrollment Statistics (April 1, 2013 – June 30, 2013)
April May June Enrollments 726 771 949
3. Call Center The choice counseling call center, located in Tallahassee, Florida, operates a toll-free number and a separate toll-free number for the hearing-impaired callers. The call center uses a tele-interpreter language line to assist with calls in over 100 languages. The hours of operation are Monday through Thursday 8:00a.m. – 8:00p.m., and Friday 8:00a.m. – 7:00p.m. During this quarter, the call center had an average of 26 full time equivalent employees who speak English, Spanish and Haitian Creole to answer calls. The choice counseling call center received 49,642 calls during this quarter, which remains within the normal call volume. Table 15 compares the call volume of incoming and outgoing calls during the second quarter of Demonstration Years Six and Seven.
Table 15 Comparison of Call Volume for Fourth Quarter
(Demonstration Years Six and Seven)
Type of Calls April 2012
April 2013
May 2012
May 2013
June 2012
June 2013
Year 6 4th Quarter
Totals
Year 7 4th Quarter
Totals Incoming Calls 16,478 20,047 16,101 15,976 15,400 13,619 47,979 49,642
Outgoing Calls 4,896 2,356 4,407 3,931 4,027 3,034 13,330 9,321
Totals 21,374 22,403 20,508 19,907 19,427 16,653 61,309 58,963 Outbound and Inbound Mail During this quarter, the choice counseling vendor mailroom mailed the following: • New-Eligible Packets
(mandatory and voluntary) 22,060 • Transition Packets
(mandatory and voluntary) 2,846
• Confirmation Letters 21,966 • Plan Transfer Letters (mandatory and voluntary)
0
• Open Enrollment Packets 53,223
When return mail is received with no forwarding address from the post office, staff access the choice counseling vendor’s enrollment system and the FLMMIS to locate a telephone number or a new address in order to contact the recipient. The choice counseling staff re-addresses the packets or letters when possible, with the newly eligible mailings taking top priority.

19
During this quarter, the choice counseling vendor processed the following inbound mail: • Plan Enrollments 746 • Plan Changes 71 The percentage of enrollments processed through the mail-in enrollment forms continues to be slightly less than the historical trend of 2 – 5%. Use of the form may continue to decline with increased use of the Online Enrollment Application. Health Literacy The choice counseling Special Needs Unit has primary responsibility for the health literacy function. The Special Needs Unit has a Registered Nurse and a Licensed Practical Nurse who have both earned their choice counseling certification. Summary of cases taken by the Special Needs Unit A ‘case referral’ is when a choice counselor refers a case to the Special Needs Unit through the choice counseling vendor’s enrollment system (Health Track) or verbally via phone transfer, for follow-up. The Special Needs Unit conducts the research and resolves the referral. A ‘case review’ is when the Special Needs Unit helps with questions from a choice counselor as they are on a call. Most reviews can be handled verbally and quickly. Some case reviews may end up as a referral if there is more research and follow-up required by the Special Needs Unit. During this quarter, the Special Needs Unit documented and reported on the verbal reviews and referrals as shown in Table 16.
Table 16 Number of Referrals and Case Reviews Completed
(April 1, 2013 – June 30, 2013) April May June
Case Referrals 184 133 193 Case Reviews 126 115 168
The Special Needs Unit staff scope of work includes: • Development of additional training for the choice counselors working with and serving the
medically, mentally or physically complex;
• Enhancements to the scripts to educate recipients on how to access care in a managed care environment;
• Development of health related reference guides to increase the choice counselor’s knowledge of Medicaid services (which is ongoing); and
• Participation in the development of the Health Track choice selection tool script.

20
Face-to-Face/Outreach and Education The Outreach Team conducts group sessions and makes choice counselors available after the session to assist recipients in plan choices and, if needed, provides the option for face-to-face choice counseling at the recipient’s convenience. Table 17 provides the outreach activities that were performed this quarter.
Table 17 Choice Counseling Outreach Activities
(April 1, 2013 – June 30, 2013) Field Activities 4th Quarter – Year 7
Group Sessions 236
Private Sessions 22
Home Visits and One-On-One Sessions 34
No Phone List* 229
Outbound Phone List 2,190
Enrollments 3,018
Plan Changes 291
*Attempts made by field choice counselors to contact recipients who do not have a valid phone number in the Health Track System.
The Mental Health Unit The Mental Health Unit is designed to provide direct support to recipients who access mental health services. The Mental Health Unit completed 15 private sessions for a total of 52 attendees and made 25 community partner visits, as well as 70 calls to community partners in an effort to strengthen and build relationships. A total of 17 partner staff members were trained this quarter. The Mental Health Unit has increased the number of community partners to over 200 organizations including the following key partnerships: • Susan B. Anthony Recovery Center in Broward County,
• Bayview Mental Health Facility and Minority Development and Empowerment in Broward County,
• Mental Health Resource Center and River Region Human Services in Duval County,
• Clay County Behavioral Health, and
• Wolfson’s Children’s Hospital/Community Health in Duval County. These groups provide mental health and substance abuse services and have been very receptive to working with the choice counselors. Complaints/Issues A recipient can file a complaint about the Choice Counseling program either through the choice counseling call center, Medicaid headquarters or the Medicaid area office. The choice

21
counseling vendor’s automated recipient survey allows complaints about the Choice Counseling program to be filed and voice comments can be recorded to describe what occurred on the call. There were no complaints received related to the Choice Counseling program during this quarter. The primary contributing factor to the limited number of complaints is directly tied to the stability of the demonstration and the community presence the field choice counselors provide to resolve issues before they become a complaint, as well as efforts taken by the Agency field staff. Quality Improvement Recipient Customer Survey
Every recipient who calls the toll-free choice counseling number is provided the opportunity to complete a survey at the end of the call to rank their satisfaction with the choice counseling call center and the overall service provided by the choice counselors. The call center offers the survey to every recipient who calls to enroll in a plan or to make a plan change. A total of 976 recipients completed the automated survey this quarter. Table 18 shows a list of all questions that are asked during the survey and how recipients ranked their satisfaction (represented in percentages) with the choice counseling call center and the overall service provided by the choice counselors during this quarter. The number of recipients participating in the survey this quarter was as follows: April – 248, May – 370 and June – 358 (totaling 976).
Table 18 Choice Counseling Caller Satisfaction Results
Percentage of Satisfied Callers per Question April 2013 May 2013 June 2013
How helpful do you find this counseling to be 90% 88% 89%
Amount of time you waited 77% 65% 73%
Ease of understanding information 75% 73% 77%
Likelihood to recommend 93% 94% 95%
Overall service provided by counselor 95% 95% 94%
Quickly understood reason 96% 95% 97%
Ability to help choose plan 94% 92% 95%
Ability to explain clearly 95% 92% 96%
Confidence in the information 94% 94% 96%
Being treated respectfully 96% 96% 96%

22
A key component of the Choice Counseling program is a continuous quality improvement effort. One of the primary elements of the quality improvement process involves the automated survey previously mentioned in this report. The survey results and comments help the choice counseling vendor and the Agency improve customer service to Medicaid recipients. During this quarter, the survey results indicate that on average 95% of the respondents are satisfied with the overall service provided by the counselor. In addition, the results indicate that 94% are satisfied with the choice counselor’s ability to clearly explain health plan choices, and 96% felt they were treated respectfully. Survey scores and recipient comments are provided to supervisors and counselors. The positive comments encourage the choice counselor to keep up the good work and the negative comments help to point out possible weaknesses that may require coaching or training. The choice counseling vendor has an internal e-mail box, which enables the Agency and the choice counseling vendor to share information directly to resolve difficult cases and hold regularly scheduled conference calls. 4. New Eligible Self-Selection Data1 From July 2010 to June 2013, 68% of recipients enrolled in the demonstration self-selected a health plan and 32% were auto-assigned. Table 19 shows the current self-selection and auto-assignment rate for the current quarter.
Table 19 Self-Selection and Auto-Assignment Rate
(April 1, 2013 – June 30, 2013) April May June Self-Selected 11,779 10,660 10,617 Auto-Assignment 18,679 6,126 6,136 Total Enrollments 30,458 16,786 16,753 Self-Selected % 39% 64% 63% Auto-Assignment % 61% 36% 37%
Remainder of page intentionally left blank.
1 The Agency revised the terminology used to describe voluntary enrollment data to improve clarity and understanding of how the demonstration is working. Instead of referring to new eligible plan selection rate as “Voluntary Enrollment Rate,” the data is referred to as “New Eligible Self-Selection Rate.” The term “self-selection” is now used to refer to recipients who choose their own plan and the term “assigned” is now used for recipients who do not choose their own plan.

23
C. Enrollment Data Current Activities Monthly Enrollment Reports
The Agency provides a comprehensive monthly enrollment report, which includes the enrollment figures for all health plans in the demonstration. This monthly enrollment data is available on the Agency's website at the following link: http://ahca.myflorida.com/MCHQ/Managed_Health_Care/MHMO/med_data.shtml The following is a summary of the monthly enrollment for this quarter, beginning April 1, 2013 and ending June 30, 2013. This section contains the following enrollment reports: • Medicaid Reform Enrollment Report, • Medicaid Reform Enrollment by County Report, and • Medicaid Reform Voluntary Population Enrollment Report. All health plans located in the five demonstration counties are included in each of the reports. During this quarter, there were a total of 17 health plans – 13 HMOs and four FFS PSNs. There are two categories of Medicaid recipients who are enrolled in the health plans: Temporary Assistance for Needy Families (TANF) and Supplemental Security Income (SSI). The SSI category is broken down further in the enrollment reports, based on the recipients’ eligibility for Medicare. Each enrollment report and the process used to calculate the data it contains are described on the following pages. 1. Medicaid Reform Enrollment Report The Medicaid Reform Enrollment Report is a complete look at the entire enrollment for the demonstration program for the quarter being reported. Table 20 provides a description of each column in Medicaid Reform Enrollment Report.
Table 20 Medicaid Reform Enrollment Report Column Descriptions
Column Name Column Description Plan Name The name of the Medicaid Reform plan Plan Type The plan's type (HMO or PSN) Number of TANF Enrolled The number of TANF recipients enrolled with the plan Number of SSI Enrolled – No Medicare
The number of SSI recipients who are enrolled with the plan and who have no additional Medicare coverage
Number of SSI Enrolled – Medicare Part B
The number of SSI recipients who are enrolled with the plan and who have additional Medicare Part B coverage
Number of SSI Enrolled – Medicare Parts A and B
The number of SSI recipients who are enrolled with the plan and who have additional Medicare Parts A and B coverage
Total Number Enrolled The total number of recipients enrolled with the plan; TANF and SSI combined
Market Share for Reform The percentage of the total Medicaid Reform population that the plan's recipient pool accounts for
Enrolled in Previous Quarter The total number of recipients (TANF and SSI) who were enrolled in the plan during the previous reporting quarter
Percent Change from Previous Quarter
The change in percentage of the plan's enrollment from the previous reporting quarter to the current reporting quarter

24
The information provided in this report is an unduplicated count of the recipients enrolled in each health plan at any time during the quarter. Please refer to Table 21 for the State Fiscal Year 2012-13, Fourth Quarter Medicaid Reform Enrollment Report.
Table 21 Medicaid Reform Enrollment (April 1, 2013 – June 30, 2013)
Plan Name Plan Type
Number of TANF Enrolled
Number of SSI Enrolled Total
Number Enrolled
Market Share
for Reform
Enrolled in
Previous Quarter
Percent Change
from Previous Quarter
No Medicare
Medicare Part B
Medicare Parts A and B
Care Florida HMO
3,132
671
2
106
3,911 1.13%
3,788 3.25%
Clear Health HMO
5
26 - -
31 0.01%
1 3000.00%
Freedom HMO
3,868
611 -
93
4,572 1.32%
4,551 0.46%
Humana HMO
10,361
1,945
12
342
12,660 3.67%
11,471 10.37%
Magellan HMO - - - - - 0.00% - -
Medica HMO
3,934
961
4
158
5,057 1.46%
4,136 22.27%
Molina HMO
27,625
3,715
16
531
31,887 9.24%
31,055 2.68%
Positive HMO
20
212 -
16
248 0.07%
223 11.21%
Simply HMO
1,681
270
3
32
1,986 0.58%
1,347 47.44%
Staywell HMO
14,465
1,511
8
80
16,064 4.65%
4,210 281.57%
Sunshine HMO
84,263
8,753
20
1,041
94,077 27.25%
94,529 -0.48%
United HMO
7,829
1,222
1
141
9,193 2.66%
9,138 0.60%
Universal HMO - - - - - 0.00%
19,248 -100.00%
HMO Total HMO
157,183
19,897
66
2,540
179,686 52.04%
183,697 -2.18%
Better Health PSN
38,544
4,681
6
601
43,832 12.70%
39,653 10.54%
CMS PSN
5,435
3,943 -
22
9,400 2.72%
9,409 -0.10%
FCA PSN
62,570
9,231
7
1,514
73,322 21.24%
74,154 -1.12%
SFCCN PSN
33,889
4,490
8
630
39,017 11.30%
39,223 -0.53%
PSN Total PSN
140,438
22,345
21
2,767
165,571 47.96%
162,439 1.93% Reform Enrollment Totals
297,621
42,242
87
5,307
345,257 100.00%
346,136 -0.25%
The demonstration market share percentage for each plan is calculated once all recipients have been counted and the total number of recipients enrolled is known. The enrollment figures for this quarter reflect those recipients who self-selected a health plan, as well as those who were assigned. In addition, some Medicaid recipients transferred from non-demonstration health plans to demonstration health plans. There were a total of 345,257 recipients enrolled in the demonstration during this quarter. There were 17 demonstration health plans active during this quarter with market shares ranging from 0.01% to 27.25%.

25
2. Medicaid Reform Enrollment by County Report During this quarter, the demonstration remained operational in the five counties: Baker, Broward, Clay, Duval and Nassau. The number of HMOs and PSNs in each of the demonstration counties is listed in Table 22.
Table 22 Number of Reform Health Plans in Demonstration Counties
(April 1, 2013 – June 30, 2013)
County Name Number of Reform HMOs Number of Reform PSNs
Baker 2 1 Broward 11 3 Clay 3 1 Duval 3 2 Nassau 2 1 The Medicaid Reform Enrollment by County Report is similar to the Medicaid Reform Enrollment Report; however, it has been broken down by county. The demonstration counties are listed alphabetically, beginning with Baker County and ending with Nassau County. For each county, HMOs are listed first, followed by PSNs. Table 23 provides a description of each column in the Medicaid Reform Enrollment by County Report.
Table 23 Medicaid Reform Enrollment by County Report Descriptions
Column Name Column Description Plan Name The name of the Medicaid Reform plan Plan Type The plan's type (HMO or PSN)
Plan County The name of the county the plan operates in (Baker, Broward, Clay, Duval or Nassau)
Number of TANF Enrolled The number of TANF recipients enrolled with the plan in the county listed Number of SSI Enrolled - No Medicare
The number of SSI recipients who are enrolled with the plan in the county listed and who have no additional Medicare coverage
Number of SSI Enrolled - Medicare Part B
The number of SSI recipients who are enrolled with the plan in the county listed and who have additional Medicare Part B coverage
Number of SSI Enrolled - Medicare Parts A and B
The number of SSI recipients who are enrolled with the plan in the county listed and who have additional Medicare Parts A and B coverage
Total Number Enrolled The total number of recipients enrolled with the plan in the county listed; TANF and SSI combined
Market Share for Reform by County
The percentage of the demonstration population in the county listed that the plan's recipient pool accounts for
Enrolled in Previous Quarter
The total number of recipients (TANF and SSI) who were enrolled in the plan in the county listed during the previous reporting quarter
Percent Change from Previous Quarter
The change in percentage of the plan's enrollment from the previous reporting quarter to the current reporting quarter (in the county listed)
Table 24 located on the following page lists, by plan and county, for this quarter and compared to last quarter, the total number of TANF and SSI individuals enrolled and the market share for each county. In addition, the total Medicaid Reform enrollment counts are included at the bottom of the report.

26
Table 24 Medicaid Reform Enrollment by County Report
(April 1, 2013 – June 30, 2013)
Plan Name Plan Type
Number of TANF Enrolled
Number of SSI Enrolled Total
Number Enrolled
Market Share for Reform
by County
Enrolled in Previous Quarter
Percent Change
from Previous Quarter
No Medicare
Medicare Part B
Medicare Parts A and B
Baker County
First Coast Advantage PSN 2,626 280 - 21 2,927 80.08% 3,055 -4.19%
Healthease/Staywell HMO 33 6 - 1 40 1.09% 21 90.48%
United HealthCare HMO 587 89 - 12 688 18.82% 659 4.40%
Baker 3,246 375 0 34 3,655 100.00% 3,735 -2.14% Broward County
Better Health PSN 38,544 4,681 6 601 43,832 22.58% 39,653 10.54%
Care Florida HMO 3,132 671 2 106 3,911 2.01% 3,788 3.25%
Clear Health Alliance HMO 5 26 - - 31 0.02% 1 NA
CMS PSN 3,518 2,831 - 19 6,368 3.28% 6,356 0.19%
Freedom Health Plan HMO 3,868 611 - 93 4,572 2.36% 4,551 0.46%
Healthease/Staywell HMO 2,645 219 4 17 2,885 1.49% 757 NA
Humana HMO 10,361 1,945 12 342 12,660 6.52% 11,471 10.37%
Magellan HMO - - - - - - -
Medica HMO 3,934 961 4 158 5,057 2.61% 4,136 22.27%
Molina Health Plan HMO 27,625 3,715 16 531 31,887 16.43% 31,055 2.68%
Positive Health Care HMO 20 212 - 16 248 0.13% 223 11.21%
SFCCN PSN 33,889 4,490 8 630 39,017 20.10% 39,223 -0.53%
Simply Healthcare HMO 1,681 270 3 32 1,986 1.02% 1,347 -
Sunshine HMO 37,682 3,566 12 386 41,646 21.46% 41,825 -0.43%
Universal Health Care HMO - - - - - 0.00% 10,759 -100.00%
Broward 166,904 24,198 67 2,931 194,100 100.00% 195,145 -0.54% Clay County
First Coast Advantage PSN 4,627 444 1 43 5,115 29.88% 5,190 -1.45%
Healthease/Staywell HMO 273 35 - 4 312 1.82% 62 -
Sunshine HMO 7,291 670 - 66 8,027 46.90% 8,207 -2.19%
United HealthCare HMO 3,263 370 - 29 3,662 21.40% 3,664 -0.05%
Clay 15,454 1,519 1 142 17,116 100.00% 17,123 -0.04% Duval County
CMS PSN 1,917 1,112 - 3 3,032 2.45% 3,053 -0.69%
First Coast Advantage PSN 50,874 8,060 6 1,411 60,351 48.82% 60,869 -0.85%
Healthease/Staywell HMO 11,391 1,239 4 58 12,692 10.27% 3,315 282.87%
Sunshine HMO 39,290 4,517 8 589 44,404 35.92% 44,497 -0.21%
United HealthCare HMO 2,494 570 1 63 3,128 2.53% 3,069 1.92%
Universal Health Care HMO - - - - - 0.00% 8,489 -100.00%
Duval 105,966 15,498 19 2,124 123,607 100.00% 123,292 0.26%
Nassau County
First Coast Advantage PSN 4,443 447 - 39 4,929 72.71% 5,040 -2.20%
Staywell HMO 123 12 - - 135 1.99% 55 145.45%
United HealthCare HMO 1,485 193 - 37 1,715 25.30% 1,746 -1.78%
Nassau 6,051 652 0 76 6,779 100.00% 6,841 -0.91% Reform Enrollment Totals 297,621 42,242 87 5,307 345,257 346,136 -0.25%

27
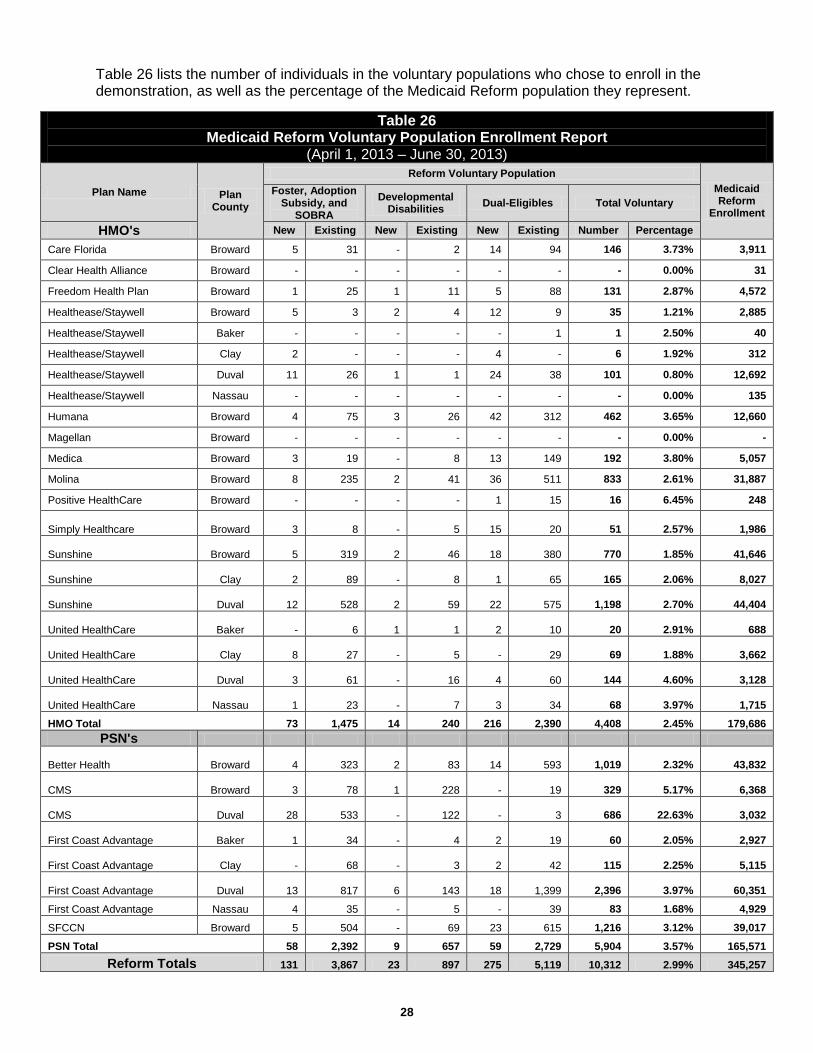
As with the Medicaid Reform Enrollment Report, the number of recipients is extracted from the monthly Medicaid eligibility file and is then counted uniquely based on the most recent month in which the recipient was enrolled in a health plan. The unique recipient counts are separated by the counties in which the plans operate. 3. Medicaid Reform Voluntary Population Enrollment Report The populations identified in Tables 25 and 26 may voluntarily enroll in a Medicaid Reform health plan. The voluntary populations include individuals classified as Foster Care, SOBRA, Refugee, Developmental Disabilities, or Dual-Eligible (enrolled in both Medicaid and Medicare). The Medicaid Reform Voluntary Population Enrollment Report provides a count of both the new and existing recipients in each of these categories who chose to enroll in a Medicaid Reform health plan. “New” enrollees are defined as those recipients who were not part of Medicaid Reform for at least six months prior to the start of the quarter. Table 25 provides a description of each column in this report.
Table 25 Medicaid Reform Voluntary Population Enrollment Report Descriptions
Column Name Column Description Plan Name The name of the Medicaid Reform plan Plan Type The plan's type (HMO or PSN)
Plan County The name of the county the plan operates in (Baker, Broward, Clay, Duval or Nassau)
Foster, SOBRA and Refugee
The number of unique Foster Care, SOBRA, or Refugee recipients who voluntarily enrolled in a plan during the current reporting quarter
Developmental Disabilities
The number of unique recipients diagnosed with a developmental disability who voluntarily enrolled in a plan during the current reporting quarter
Dual-Eligibles The number of unique dual-eligible recipients who voluntarily enrolled in a plan during the current reporting quarter
Total The total number of voluntary population recipients who enrolled in Medicaid Reform during the current reporting quarter
Medicaid Reform Total Enrollment
The total number of Medicaid Reform recipients enrolled in the health plan during the reporting quarter
Remainder of page intentionally left blank.
28
Table 26 lists the number of individuals in the voluntary populations who chose to enroll in the demonstration, as well as the percentage of the Medicaid Reform population they represent.
Table 26
Medicaid Reform Voluntary Population Enrollment Report (April 1, 2013 – June 30, 2013)
Plan Name Plan County
Reform Voluntary Population Medicaid Reform
Enrollment
Foster, Adoption Subsidy, and
SOBRA Developmental
Disabilities Dual-Eligibles Total Voluntary
HMO's New Existing New Existing New Existing Number Percentage
Care Florida Broward 5 31 - 2 14 94 146 3.73% 3,911
Clear Health Alliance Broward - - - - - - - 0.00% 31
Freedom Health Plan Broward 1 25 1 11 5 88 131 2.87% 4,572
Healthease/Staywell Broward 5 3 2 4 12 9 35 1.21% 2,885
Healthease/Staywell Baker - - - - - 1 1 2.50% 40
Healthease/Staywell Clay 2 - - - 4 - 6 1.92% 312
Healthease/Staywell Duval 11 26 1 1 24 38 101 0.80% 12,692
Healthease/Staywell Nassau - - - - - - - 0.00% 135
Humana Broward 4 75 3 26 42 312 462 3.65% 12,660
Magellan Broward - - - - - - - 0.00% -
Medica Broward 3 19 - 8 13 149 192 3.80% 5,057
Molina Broward 8 235 2 41 36 511 833 2.61% 31,887
Positive HealthCare Broward - - - - 1 15 16 6.45% 248
Simply Healthcare Broward
3 8 -
5
15
20 51 2.57% 1,986
Sunshine Broward
5 319 2
46
18
380 770 1.85% 41,646
Sunshine Clay
2 89 -
8
1
65 165 2.06% 8,027
Sunshine Duval
12 528 2
59
22
575 1,198 2.70% 44,404
United HealthCare Baker
- 6 1
1
2
10 20 2.91% 688
United HealthCare Clay
8 27 -
5 -
29 69 1.88% 3,662
United HealthCare Duval
3 61 -
16
4
60 144 4.60% 3,128
United HealthCare Nassau
1 23 -
7
3
34 68 3.97% 1,715
HMO Total 73 1,475 14 240 216 2,390 4,408 2.45% 179,686 PSN's
Better Health Broward
4 323 2
83
14
593 1,019 2.32% 43,832
CMS Broward
3 78 1
228 -
19 329 5.17% 6,368
CMS Duval
28 533 -
122 -
3 686 22.63% 3,032
First Coast Advantage Baker
1 34 -
4
2
19 60 2.05% 2,927
First Coast Advantage Clay
- 68 -
3
2
42 115 2.25% 5,115
First Coast Advantage Duval
13 817 6
143
18
1,399 2,396 3.97% 60,351
First Coast Advantage Nassau 4 35 - 5 - 39 83 1.68% 4,929
SFCCN Broward 5 504 - 69 23 615 1,216 3.12% 39,017
PSN Total 58 2,392 9 657 59 2,729 5,904 3.57% 165,571 Reform Totals 131 3,867 23 897 275 5,119 10,312 2.99% 345,257

29
D. Enhanced Benefits Account Program Overview The Enhanced Benefits Account (EBA) program is designed as an incentive program to promote and reward participation in healthy behaviors. All Medicaid recipients who enroll in a health plan are eligible for the EBA program. No separate application or process is required to enroll in the EBA program. Recipients enrolled in a health plan may earn up to $125.00 of credits per state fiscal year. Credits are posted to individual accounts that are established and maintained within the Florida Medicaid Fiscal Agent's [HP Enterprise Services, LLC (HP)] pharmacy point of sale system, currently maintained and managed by the HP subcontractor, Magellan. Earned credits may be used to purchase approved health related products and supplies at a Medicaid participating pharmacy. Purchases must be made at the pharmacy prescription counter using the recipient's Medicaid Gold Card or Medicaid identification number and a government issued photo ID. The credits earned may be carried forward each demonstration year so the recipient does not lose access to accrued credits. Recipients who have earned credits prior to December 2011, and lose Medicaid eligibility for three consecutive years will lose access to their credits. Beginning January 2012, recipients who have earned credits and lose Medicaid eligibility for one year will lose access to their credits. The Agency approves credits for participation of approved healthy behaviors using date of service, eligibility and approved behavior edits within a database referred to as the Enhanced Benefits Information System (EBIS). All health plans are required to submit monthly reports for their enrollees who have paid claims for an approved healthy behavior within the prior month. These reports are uploaded into the EBIS database for processing and approval. Once a healthy behavior is approved and the appropriate credit is applied, the information is sent to the HP subcontractor, Magellan, to be loaded in the pharmacy point of sale system. Current Activities 1. Call Center Activities The enhanced benefits call center, managed by the choice counseling vendor [Automated Health Systems (AHS)], located in Tallahassee, Florida, operates a toll-free number and a toll-free number for hearing impaired callers. The call center answers all inbound calls relating to program questions, provides enhanced benefits account updates on credits earned/used, and assists recipients with utilizing the web-based over-the-counter product list. The call center is staffed with employees who speak English, Spanish and Haitian Creole. In addition, a language line is used to assist with calls in over 100 languages. The hours of operation are Monday – Thursday 8:00a.m. – 8:00p.m., and Friday 8:00a.m. – 7:00p.m. The Automated Voice Response System (AVRS), implemented in June 2010, provides recipients only balance information. The AVRS continues to be a success as 24,169 calls were handled during this quarter. The call center continues to perform outbound calls to recipients who have not spent any of their enhanced benefits account credits.

30
Table 27 highlights the enhanced benefits call center activities during this quarter.
Table 27 Highlights of the Enhanced Benefits Call Center Activities
(April 1, 2013 – June 30, 2013) Enhanced Benefits Call Center Activity April May June
Calls Received 5,257 4,562 3,661
Calls Answered 4,619 3,947 3,283
Abandonment Rate 12.14% 13.48% 10.33%
Average Talk Time (minutes) 4:11 4:17 4:32
Calls Handled by the AVRS 7,374 8,200 8,595
Outbound Calls 27 17 7
Enhanced Benefits Mailroom Activity
EB Welcome Letters 11,453 17,710 10,454 Healthy Behavior Reports The Agency receives monthly healthy behavior reports from the health plans as scheduled by the tenth day of each month. The reports are uploaded each month as designed for processing and credit approval. The monthly credit report is then made available to recipients who have completed healthy behavior activities during the month. Outreach and Education for Recipients During this quarter, the call center mailed 39,617 welcome letters and 172,330 coupon statements. A flyer or pharmacy billing instructions is periodically included with the coupon statement. The choice counselors continue to provide up-to-date information for recipients regarding their enhanced benefits account balances and the opportunity to earn healthy behavior credits. The choice counseling vendor made 51 outbound calls to recipients who have not utilized their enhanced benefits account credits. Outreach and Education for Pharmacies The pharmacy benefits manager, Magellan, provides ongoing technical assistance to pharmacies as needed related to all billing aspects of the EBA program. Complaints During this quarter, over 24,000 recipients purchased one or more products with their enhanced benefits credits, and the EBA program received one recipient complaint. Table 28 provides a summary of the complaint received and action taken to address this complaint.
Table 28 Enhanced Benefits Recipient Complaints
(April 1, 2013 – June 30, 2013) Recipient Complaint Action Taken
1. A recipient called about their health plan not reporting a healthy behavior.
The Agency contacted the recipient’s health plan to have them report the information to the Agency.

31
2. Enhanced Benefits Statistics As of the end of this quarter, 13,942 recipients lost EBA eligibility resulting in losing EBA credits, totaling $625,313.03. Table 29 provides the EBA program statistics for this quarter.
Table 29 Enhanced Benefits Account Program Statistics
(April 1, 2013 – June 30, 2013) Fourth Quarter Activities – Year Seven April May June
I. Number of plans submitting reports by month in each county 30 30 31
II. Number of enrollees who received credit for healthy behaviors by month 45,134 46,552 37,488
III. Total dollar amount credited to accounts by each month $1,162,012.50 $1,132,497.50 $869,095.00
IV. Total cumulative dollar amount credited through the end each month $66,826,896.16 $67,959,393.66 $68,828,488.66
V. Total dollar amount of credits used each month by date of service $708,807.87 $708,625.71 $746,253.27
VI. Total cumulative dollar amount of credits used through the month by date of service $36,330,207.34 $37,038,833.05 $37,785,086.32
VII. Total unduplicated number of enrollees who used credits each month 24,327 24,126 24,237
3. Enhanced Benefits Advisory Panel There was no EB Advisory Panel meeting held during this quarter. To view information on previous panel meetings, please visit the Agency’s EBA website at the following link: http://ahca.myflorida.com/Medicaid/medicaid_reform/enhab_ben/enhanced_benefits.shtml 4. Notice of EBA Program Phase Out On June 28, 2013, the Agency submitted to Federal CMS the EBA program phase out timeline and sample letters to provide health plans and enrollees with accrued credits notice of the program ending. This information was provided to Federal CMS in accordance with STC #8 of the waiver.
Remainder of page intentionally left blank.

32
E. Low Income Pool Overview One of the fundamental elements of the demonstration is the Low Income Pool (LIP) program. The LIP program was established and maintained by the state to provide government support to safety net providers in the state for the purpose of providing coverage to the Medicaid, underinsured, and uninsured populations. The LIP program is also designed to establish new, or enhance existing, innovative programs that meaningfully enhance the quality of care and the health of low-income populations, as well as increase access for select services for uninsured individuals. The LIP funds are distributed to safety net providers that meet certain state and federal requirements outlined in the STCs of the waiver. The LIP program consists of a capped annual allotment of $1 billion total computable for each year of the demonstration. Availability of funds for the LIP program in the amount of $1 billion per year is contingent upon milestones being met during each demonstration year in order for the state and providers to have access to 100% of LIP funds. Funds in the LIP program are subject to any penalties that are assessed by Federal CMS for the failure to meet the milestones described in the STCs. The milestones established are intended to enhance the delivery of health care to low-income populations in Florida. The LIP permissible expenditures, state authorized expenditures, and entities eligible to receive LIP reimbursement are defined in the Reimbursement and Funding Methodology document (RFMD). The RFMD limits LIP payments to allowable costs incurred by providers and require the state to reconcile LIP payments to auditable costs. By February 1, 2012, and each successive February 1st of the renewal period of the waiver, the state must submit an RFMD protocol to ensure that the payment methodologies for distributing LIP funds to providers support the goals of the LIP and those providers receiving LIP payments do not receive payments in excess of their cost of providing services. The Agency established the LIP Council in accordance with s. 409.911(10), F.S. The LIP Council’s purpose is to advise the Agency and Florida Legislature on the financing and distributions of the LIP and related funds. The 2009 Legislature amended the statutory provisions specific to the LIP Council to increase the number of members appointed, as well as specified criteria for the membership. The LIP Council is statutorily directed to:
• Make recommendations on the financing of the LIP and the disproportionate share
hospital program and the distribution of their funds.
• Advise the Agency on the development of the low-income pool plan required by the federal Centers for Medicare and Medicaid Services pursuant to the Medicaid reform waiver.
• Advise the Agency on the distribution of hospital funds used to adjust inpatient hospital rates, rebase rates, or otherwise exempt hospitals from reimbursement limits as financed by intergovernmental transfers.
• Submit its findings and recommendations to the Governor and the Legislature no later than February 1 of each year.

33
Current Activities 1. Future LIP Council Meetings There were no LIP Council meetings held this quarter. The LIP Council anticipates holding meetings regarding SFY 2014-15 once the LIP Council meetings start up again in the first quarter of Demonstration Year Eight. The LIP Council meetings can be viewed on the Agency’s LIP website at the following link: http://ahca.myflorida.com/Medicaid/medicaid_reform/lip/lip.shtml 2. LIP STCs - Reporting Requirements The following is an abbreviated list of the LIP STCs that required action during the fourth quarter. The newly amended STCs effective June 14, 2013, for the period December 16, 2011 to June 30, 2014, are posted on the Agency’s website at the following link: http://ahca.myflorida.com/Medicaid/statewide_mc/index.shtml#FCA Newly Amended STC #75 – LIP Funds Distributed – All LIP funds must be expended by June 30, 2014. LIP dollars that are lost as a result of penalties or recoupment are surrendered by the state and not recoverable. Newly Amended STC #76 – LIP Reimbursement and Funding Methodology (RFMD)
– DY1 – DY3 LIP Reconciliations Finalized – Federal CMS has determined that payments made to providers are in excess of the allowable costs; therefore, the state is required to return the federal portion of $104,351,578 total computable expenditures claimed in excess of allowable cost and/or in excess of applicable cost limits. This will be achieved through a reduction of the amount available to be claimed under the pool by $104 million the first year of the state’s intended renewal period in the event the demonstration is renewed or, by issuing a disallowance to the state.
– DY4 LIP Reconciliations – The Agency submitted the LIP reconciliations for DY4 to
Federal CMS on May 30, 2012. Federal CMS did not provide the Agency any feedback or request additional information regarding DY4 LIP reconciliations during this quarter.
– DY5 LIP Reconciliations – During this quarter, the Agency submitted the LIP reconciliations for DY5 to Federal CMS on May 31, 2013. Federal CMS did not provide the Agency any feedback or request additional information regarding DY5 LIP reconciliations during this quarter.
– Finalize Modifications to RFMD – By February 1 of each Demonstration Year, the Agency
must submit an RFMD that ensures the payment methodologies for distributing LIP funds to providers supports the goals of the LIP program.
On January 31, 2012, the Agency submitted the revised RFMD for DY6 to Federal CMS, which only included updated references since the results of Federal CMS’s review of DY1-DY3 LIP reconciliations were not available prior to the February 1st submission due date specified in the STCs.
On May 5, 2012 and June 6, 2012, the Agency submitted a revised RFMD for DY6 to Federal CMS. The revisions to the document were made based on comments from Federal CMS.

34
On August 7, 2012, the Agency submitted a revised RFMD for DY6 to Federal CMS. This version included additional changes requested by Federal CMS.
On September 27, 2012, Federal CMS indicated that the final version of the RFMD for DY6 was routing for final approval.
On October 16, 2012, Federal CMS gave written approval of the RFMD for DY6.
On January 29, 2013, the Agency submitted a revised RFMD for DY7 to Federal CMS.
– Claiming LIP Payments – The Agency may claim LIP payments based on the existing methodology during the 60-day reconciliation finalization period. Claims after that period can only be made on the final RFMD for DY6 as approved by Federal CMS. Changes to the RFMD for DY6 requested by the Agency must be approved by Federal CMS and are only applicable for DY6 LIP expenditures.
On October 16, 2012, Federal CMS gave written approval of the RFMD for DY6. The Agency then begun the distribution of DY7 LIP payments.
– RFMD Protocol – By February 1, 2012, and each successive February 1st of the waiver
renewal period, the state must submit an RFMD protocol to ensure that the payment methodologies for distributing LIP funds to providers supports the goals of the LIP.
As noted earlier, on October 16, 2012, Federal CMS gave written approval of the RFMD for DY6.
Newly Amended STC #83 – Aggregate LIP Funding – At the beginning of each demonstration year, $1 billion in LIP funds will be available to the state. These amounts will be reduced by any milestone penalties that are assessed by Federal CMS. Penalties will be determined by December 31st of each demonstration year and assessed to the state in the following demonstration year. Newly Amended STC #84 – LIP Tier-One Milestone
84.a. – Allocation of Funds, Program Development, Implementation for DY7 – DY8 Newly Amended STC #84.a. references $50 million in LIP funds. A total of $35 million appears in the Other Provider Access System category, also known as the non-hospital section, in the SFY 2012-13 General Appropriations Act (GAA) (Primary Care Initiatives per Tier-One Milestone). A total of $20 million will be used for the start-up of new primary care programs and the remaining total of $15 million will be used to meaningfully enhance existing primary care programs. There is a cap of $4 million per grant proposal. The Agency will determine the distribution and requirements for these programs.
The remaining $15 million (Quality Measures) of the $50 million falls under the Special LIP for Hospital Provider Access System category listed in the GAA. This $15 million, or Quality Measures, category is broken down into three smaller amounts. Of the total, $400,000 is provided for the specialty children’s hospitals to be distributed based on an allocation methodology incorporating quality measures that shall be developed by the Agency. The second amount is $7,300,000 and shall be allocated using the core measures as determined by Federal CMS. The remaining amount of $7,300,000 shall be distributed equally using the following six outcome measures:

35
1. Mortality Hospital Risk Adjusted Rate (HRAR) Acute Myocardial Infarction (AMI) without transfers;
2. Mortality HRAR Congestive Heart Failure (CHF);
3. Mortality HRAR Pneumonia;
4. Risk Adjusted Readmission Rate (RARR) AMI;
5. RARR CHF; and
6. RARR Pneumonia.
Hospitals receiving an allocation in the $35 Million Primary Care Award category are required to enhance existing, or initiate new, quality-or-care initiatives to improve their quality measures and identified patient outcomes. Hospitals are also required to provide documentation of this to the Agency.
On June 29, 2012, the Agency posted the LIP Primary Care Application for the $35 million (SFY 2012-13) up for bid on the Agency’s LIP website at: http://ahca.myflorida.com/Medicaid/medicaid_reform/lip/lip.shtml
During the first quarter of Demonstration Year Seven, the Agency received 50 applications for the $35 million LIP Primary Care Award and reviewed the proposals.
During the third quarter of Demonstration Year Seven, the Agency awarded the $35 million LIP Primary Care Award and began the contracting for state share and distributions of the new and enhanced provider projects. For new projects, the Agency awarded seven hospitals, three Federally Qualified Health Centers (FQHCs) and three County Health Departments (CHDs). For enhanced projects, the Agency awarded seven hospitals, five FQHCs and six CHDs.
84.b. – Proposed and Final Schedule for DY6 – DY8 Reconciliations – The state will provide timely submission of all hospital, FQHC and County Health Department LIP reconciliations in the format required per the LIP Reimbursement and Funding Methodology protocol. The state is required to submit to Federal CMS, within 30 days from the date of formal approval of the waiver extension request, a schedule for the completion of the LIP Provider Access Systems (PAS) reconciliations for the 3-year extension period. Federal CMS will provide comments to the state on the reconciliation schedules within 30 days. The state will submit the final reconciliation schedule to CMS within 60 days of the original submission date.
On January 14, 2012, the Agency submitted a proposed schedule to Federal CMS. Federal CMS accepted the proposed schedule with no edits on February 27, 2012.
84.c. – Timely Submission of Deliverables – Timely submission of all demonstration deliverables as described in the STCs including the submission of Quarterly and Annual Reports.
As of June 30, 2013, the Agency submitted all deliverables on schedule as specified in the STCs.
84.d. – Reporting Templates – Within 60 days following the acceptance of the STCs, the state is required to submit templates for the development and submission of an annual “Milestone Statistics and Findings Report” and a “Primary Care and Alternative Delivery Systems Expenditure Report”.

36
On February 9, 2012, the Agency sent the draft templates to Federal CMS.
On March 13, 2012, the Agency submitted the final templates to Federal CMS.
On March 14, 2012, the Agency was notified that Federal CMS had no comments and the final templates were posted on the Agency’s LIP website at: http://ahca.myflorida.com/Medicaid/medicaid_reform/lip/lip.shtml.
The PAS providers are required to submit individual Milestone Reports to the Agency on October 31, 2012. The Agency received all the Milestone Reports. The data was reviewed, compiled and given to University of Florida (UF) for data analysis.
During this quarter, the Agency sent the final annual Milestone Statistics and Findings Report to Federal CMS on April 1, 2013.
The Primary Care and Alternative Delivery Systems Expenditure Report requires that the providers submit reporting to the Agency by August 31, 2013. The Agency will provide this final annual report to Federal CMS by January 1, 2014.
Newly Amended STC #85 – LIP Tier-Two Milestones – This STC requires the top 15 hospitals receiving LIP funds to choose three initiatives that follow the guidelines of the Three-Part Aim. These hospitals must implement new, or enhance existing, health care initiatives, investments, or activities with the goal of meaningfully improving the quality of care and the health of populations served. The three initiatives should focus on: infrastructure development; innovation and redesign; and population-focused improvement.
During the third quarter of Demonstration Year Six, the Agency worked with the top 15 hospitals in developing the Three-Tier Initiatives. Each of the 15 hospitals were required to submit three proposals to the Agency, for a total of 45 proposals.
On April 9, 2012, the Agency submitted 44 proposals to Federal CMS; the 45th proposal was exempted. Federal CMS approved the proposals on June 29, 2012.
On October 15, 2012, the Agency received the first quarter reporting for the 44 Hospital initiatives.
On November 20, 2012, the Agency submitted the first quarter reporting for the 44 Hospital initiatives to Federal CMS.
On December 31, 2012, Federal CMS approved the first quarter reporting for the 44 Hospital initiatives.
During this quarter, the Agency continues to review the second quarter reporting for the 44 Hospital initiatives.

37
F. Monitoring Budget Neutrality Overview In accordance with the requirements of the approved Florida MMA Waiver (previously called the Medicaid Reform Waiver as noted earlier in the report), the state must monitor the status of the program on a fiscal basis. To comply with this requirement, the state will submit waiver templates on the quarterly CMS 64 reports. The submission of the CMS 64 reports will include administrative and service expenditures. For purposes of monitoring the Budget Neutrality of the program, only service expenditures are compared to the projected without-waiver expenditures approved through the waiver. MEGS There are three Medicaid Eligibility Groups established through the Budget Neutrality of waiver. Each of these groups is referred to as a MEG. MEG #1 – SSI Related MEG #2 – Children and Families MEG #3 – Low Income Pool program It should be noted that for MEG 3, the Low Income Pool, there is no specific eligibility group and no per capita measurement. Distributions of funds are made from the Low Income Pool to a variety of Provider Access Systems. Explanation of Budget Neutrality The Budget Neutrality for the waiver is based on closed years of historical data using paid claims for services provided to the eligible populations throughout the state. The data is compiled using a date of service method, which is required for 1115 waivers. Using the templates provided by Federal CMS, the historical expenditures and case-months are inserted into the appropriate fields. The historical data template is pre-formulated to calculate the five-year trend for each MEG. This trend is then applied to the most recent year (5th year), which is known as the base year, and projected forward through the waiver period. Additional negotiations were involved in the final Budget Neutrality calculations set forth in the approved waiver packet. Florida’s Medicaid Reform program provides all services to the specified populations. If a person is eligible for the waiver, he or she is eligible to receive all waiver services that would otherwise be available under the traditional Medicaid program. It is important to note there are a few services and populations excluded from the waiver. To determine if a person is eligible for the waiver, the first step is identifying his or her eligibility category. Each person who applies for and is granted Medicaid eligibility is assigned an eligibility category by the Florida Department of Children and Families. Specific categories are identified for each MEG under the waiver. If the person has one of the identified categories and is not an excluded eligible, he or she is then flagged as eligible for the waiver. Dual eligibles and pregnant women above the TANF eligibility may voluntarily enroll in a Medicaid Reform health plan. All voluntary enrollment member months and expenditures subject to the waiver are included in the reporting and monitoring of Budget Neutrality of the waiver.

38
Medicaid Reform - Excluded Eligibles: • Refugee Eligibles • Dual Eligibles • Medically Needy • Pregnant Women above the TANF eligibility (>27% FPL, SOBRA) • ICF/DD Eligibles • Unborn Children • State Mental Facilities (Over Age 65) • Family Planning Eligibles • Women with breast or cervical cancer • MediKids All expenditures for the flagged eligibles are subject to the Budget Neutrality of the waiver unless the expenditure is identified as one of the following excluded services. These services are specifically excluded from the waiver and the Budget Neutrality calculation. Medicaid Reform - Excluded Services: • AIDS Waiver Services • DD Waiver Services • Home Safe Net (Behavioral Services) • Behavioral Health Overlay Services (BHOS) • ICF/DD Institutional Services • Family and Supported Living Waiver Services • Katie Beckett Model Waiver Services • Brain and Spinal Cord Waiver Services • School Based Administrative Claiming • Healthy Start Waiver Services Expenditure Reporting: The 1115 demonstration waiver requires the Agency to report all expenditures on the quarterly CMS 64 report. Within the report, there are specific templates designed to capture the expenditures by service type paid during the quarter that are subject to the monitoring of the Budget Neutrality. There are three MEGs within the waiver. MEGs 1 and 2 are statewide populations, and MEG 3 is based on Provider Access Systems. Under the design of the waiver, there is a period of transition in which eligibles continue to receive services through Florida's 1915(b) Managed Care Waiver programs. The expenditures for those not enrolled in the Medicaid Reform program, but eligible for the waiver and enrolled in Florida's 1915(b) Managed Care Waiver, are subject to both the monitoring of the 1915(b) Managed Care Waiver and the 1115 demonstration waiver. To identify these eligibles, an additional five templates [one for each of the 1915(b) Managed Care Waiver (MCW) MEGs] have been added to the waiver templates for monitoring purposes.

39
When preparing for the quarterly CMS 64 report, the following method is applied to extract the appropriate expenditures for MEGs 1 and 2: I. Eligibles and enrollee member months are identified;
II. Claims data for included services are identified using the list created through ‘I’ above;
III. The claims data and member months are separated into appropriate categories to report on the waiver forms of the CMS 64 report: a. MEG #1 SSI – Related b. MEG #2 Children and Families c. Reform – Managed Care Waiver SSI – no Medicare d. Reform – Managed Care Waiver TANF e. Reform – Managed Care Waiver SOBRA and Foster Children f. Reform – Managed Care Waiver Age 65 and Older;
IV. Using the paid claims data extracted, the expenditures are identified by service type within each of the groupings in ‘III’ above and inserted on the appropriate line on the CMS 64 waiver templates;
V. Expenditures that are also identified as Home and Community Based (HCBS) Waiver services are identified and the corresponding HCBS waiver template expenditures are adjusted to reflect the hierarchy of the demonstration waiver reporting.
All queries and work papers related to the quarterly reporting of waiver expenditures on the CMS 64 report are maintained by the Agency. In addition, all identified expenditures for waiver and non-waiver services in total are checked against expenditure reports that are generated and provided to the Agency’s Finance and Accounting Unit, which certifies and submits the CMS 64 report. This check sum process allows the state to verify that no expenditures are being duplicated within the multiple templates for waiver and non-waiver services. Statistics tables below show the current status of the program's Per Capita Cost per Month (PCCM) in comparison to the negotiated PCCM as detailed in newly amended STC #106. Definitions: • PCCM - Calculated per capita cost per month which is the total spend divided by the case
months. • WOW PCCM - Is the without waiver (WOW) PCCM. This is the target that the state cannot
exceed in order to maintain Budget Neutrality. • Case months - The months of eligibility for the populations subject to the waiver as defined
as included populations in the waiver. In addition, months of eligibility for voluntary enrollees during the period of enrollment within a Medicaid Reform health plan are also included in the case month count.
• MCW Reform Spend - Expenditures subject to the Reform Budget Neutrality for those not enrolled in a Reform Health Plan but subject to the Reform Waiver [currently all non-dual-eligibles receiving services through the 1915(b) Managed Care Waiver].
• Reform Enrolled & Non-MCW Spend - Expenditures for those enrolled in a Reform Health Plan.
• Total Spend - Total of MCW Medicaid Reform Spend and Medicaid Reform Enrolled Spend.
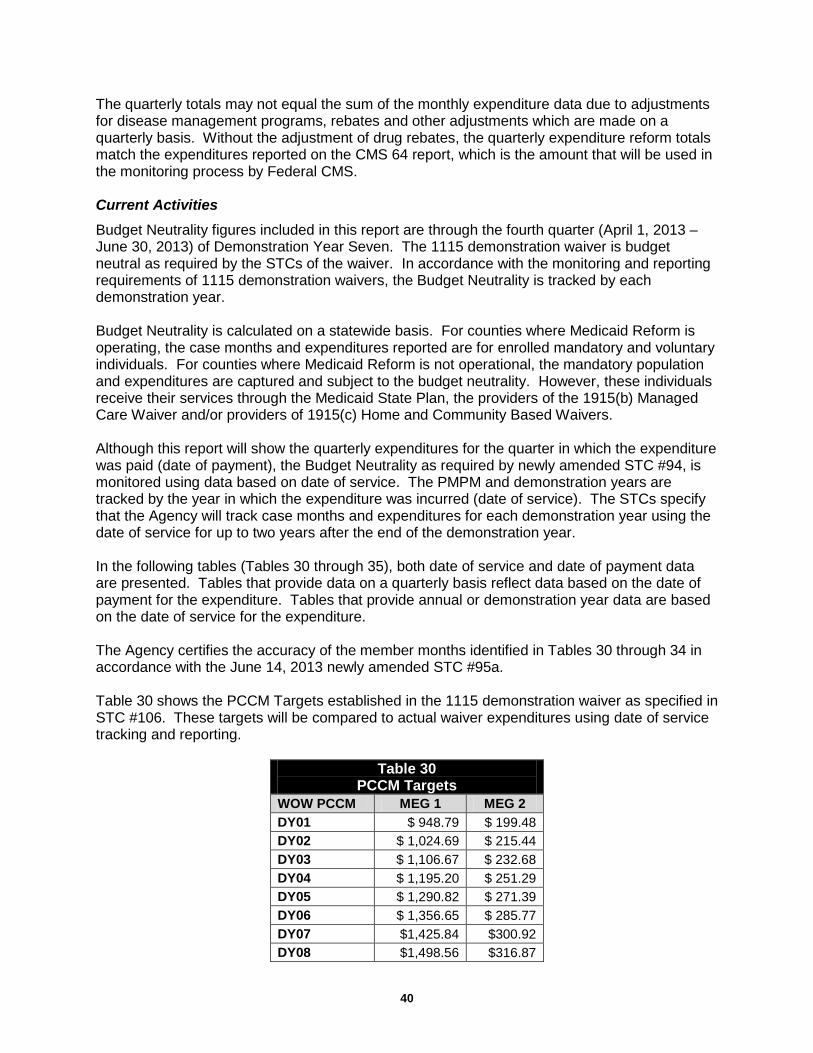
40
The quarterly totals may not equal the sum of the monthly expenditure data due to adjustments for disease management programs, rebates and other adjustments which are made on a quarterly basis. Without the adjustment of drug rebates, the quarterly expenditure reform totals match the expenditures reported on the CMS 64 report, which is the amount that will be used in the monitoring process by Federal CMS. Current Activities
Budget Neutrality figures included in this report are through the fourth quarter (April 1, 2013 – June 30, 2013) of Demonstration Year Seven. The 1115 demonstration waiver is budget neutral as required by the STCs of the waiver. In accordance with the monitoring and reporting requirements of 1115 demonstration waivers, the Budget Neutrality is tracked by each demonstration year. Budget Neutrality is calculated on a statewide basis. For counties where Medicaid Reform is operating, the case months and expenditures reported are for enrolled mandatory and voluntary individuals. For counties where Medicaid Reform is not operational, the mandatory population and expenditures are captured and subject to the budget neutrality. However, these individuals receive their services through the Medicaid State Plan, the providers of the 1915(b) Managed Care Waiver and/or providers of 1915(c) Home and Community Based Waivers. Although this report will show the quarterly expenditures for the quarter in which the expenditure was paid (date of payment), the Budget Neutrality as required by newly amended STC #94, is monitored using data based on date of service. The PMPM and demonstration years are tracked by the year in which the expenditure was incurred (date of service). The STCs specify that the Agency will track case months and expenditures for each demonstration year using the date of service for up to two years after the end of the demonstration year. In the following tables (Tables 30 through 35), both date of service and date of payment data are presented. Tables that provide data on a quarterly basis reflect data based on the date of payment for the expenditure. Tables that provide annual or demonstration year data are based on the date of service for the expenditure. The Agency certifies the accuracy of the member months identified in Tables 30 through 34 in accordance with the June 14, 2013 newly amended STC #95a. Table 30 shows the PCCM Targets established in the 1115 demonstration waiver as specified in STC #106. These targets will be compared to actual waiver expenditures using date of service tracking and reporting.
Table 30 PCCM Targets
WOW PCCM MEG 1 MEG 2 DY01 $ 948.79 $ 199.48 DY02 $ 1,024.69 $ 215.44 DY03 $ 1,106.67 $ 232.68 DY04 $ 1,195.20 $ 251.29 DY05 $ 1,290.82 $ 271.39 DY06 $ 1,356.65 $ 285.77 DY07 $1,425.84 $300.92 DY08 $1,498.56 $316.87

41
Tables 31 through 35 provide the statistics for MEGs 1, 2 and 3 for the period beginning July 1, 2006, and ending June 30, 2013. Case months provided in Tables 31 and 32 for MEGs 1 and 2 are actual eligibility counts as of the last day of each month. The expenditures provided are recorded on a cash basis for the month paid.
Table 31
MEG 1 Statistics: SSI Related
Quarter MCW Reform Reform Enrolled Actual MEG 1 Case months Spend* Spend* Total Spend* PCCM Q1 Total 737,829 $534,465,763 $13,022,287 $547,488,050 $742.03 Q2 Total 741,024 $656,999,737 $40,270,607 $697,270,344 $940.96 Q3 Total 746,739 $627,627,027 $74,363,882 $701,990,909 $940.08 Q4 Total 752,823 $627,040,703 $98,024,915 $725,065,618 $963.13 Q5 Total 755,417 $630,937,251 $101,516,732 $732,453,983 $969.60 Q6 Total 755,837 $648,757,106 $106,374,845 $755,131,951 $999.07 Q7 Total 758,014 $651,490,311 $111,968,931 $763,459,242 $1,007.18 Q8 Total 764,701 $661,690,100 $115,206,649 $776,896,750 $1,015.95 Q9 Total 818,560 $708,946,109 $116,393,637 $825,339,746 $1,008.28 Q10 Total 791,043 $738,232,869 $128,914,992 $867,147,861 $1,096.21 Q11 Total 810,753 $783,046,121 $125,741,442 $908,787,564 $1,120.92 Q12 Total 829,386 $676,381,576 $120,999,077 $797,380,652 $961.41 Q13 Total 826,842 $846,747,351 $153,763,674 $1,000,511,025 $1,216.58 Q14 Total 830,530 $769,968,776 $137,267,631 $907,236,407 $1,092.36 Q15 Total 847,324 $781,783,604 $141,815,963 $923,599,567 $1,090.02 Q16 Total 852,445 $732,226,661 $129,489,247 $861,715,907 $1,010.88 Q17 Total 868,873 $880,557,949 $163,583,238 $1,044,141,187 $1,201.72 Q18 Total 876,564 $823,362,358 $147,720,232 $971,082,591 $1,107.83 Q19 Total 851,488 $793,116,969 $137,115,775 $930,232,743 $1,092.48 Q20 Total 902,833 $730,735,500 $137,409,896 $868,145,395 $961.58 Q21 Total 933,661 $897,184,808 $165,500,587 $1,062,685,395 $1,138.19 Q22 Total 916,713 $780,812,437 $149,928,159 $930,740,596 $1,015.30 Q23 Total 871,050 $806,728,589 $161,201,346 $967,929,935 $1,111.22 Q24 Total 932,443 $878,147,146 $168,609,996 $1,046,757,142 $1,122.60 Q25 Total 939,670 $876,968,622 $168,972,615 $1,045,941,236 $1,113.09 Q26Total 953,518 $865,669,039 $218,704,121 $1,084,373,159 $1,137.24 Q27 Total 964,650 $749,820,061 $229,337,800 $979,157,860 $1,015.04 April 2013 326,137 $269,942,718 $74,397,891 $344,340,609 $1,055.82 May 2013 324,747 $421,765,664 $103,646,815 $525,412,478 $1,617.91 June 2013 322,214 $163,314,895 $57,442,933 $220,757,828 $685.13 Q28 Total 973,098 $855,023,277 $235,487,639 $1,090,510,916 $1,120.66
MEG 1 Total 23,603,828 20,160,417,640 3,564,191,373 23,723,635,916 1,005.08
* Quarterly expenditure totals may not equal the sum of the monthly expenditures due to quarterly adjustments such as disease management payments. The quarterly expenditure totals match the CMS 64 Report submissions without the adjustment of rebates.
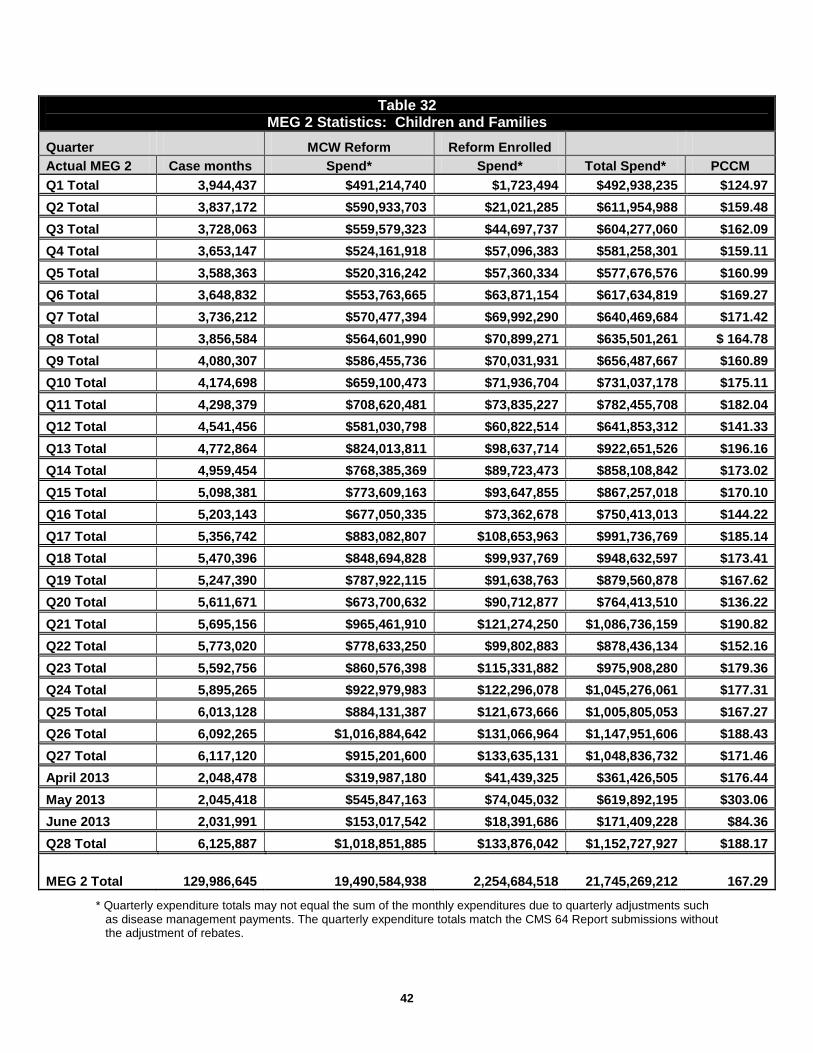
42
Table 32 MEG 2 Statistics: Children and Families
Quarter MCW Reform Reform Enrolled Actual MEG 2 Case months Spend* Spend* Total Spend* PCCM Q1 Total 3,944,437 $491,214,740 $1,723,494 $492,938,235 $124.97 Q2 Total 3,837,172 $590,933,703 $21,021,285 $611,954,988 $159.48 Q3 Total 3,728,063 $559,579,323 $44,697,737 $604,277,060 $162.09 Q4 Total 3,653,147 $524,161,918 $57,096,383 $581,258,301 $159.11 Q5 Total 3,588,363 $520,316,242 $57,360,334 $577,676,576 $160.99 Q6 Total 3,648,832 $553,763,665 $63,871,154 $617,634,819 $169.27 Q7 Total 3,736,212 $570,477,394 $69,992,290 $640,469,684 $171.42 Q8 Total 3,856,584 $564,601,990 $70,899,271 $635,501,261 $ 164.78 Q9 Total 4,080,307 $586,455,736 $70,031,931 $656,487,667 $160.89 Q10 Total 4,174,698 $659,100,473 $71,936,704 $731,037,178 $175.11 Q11 Total 4,298,379 $708,620,481 $73,835,227 $782,455,708 $182.04 Q12 Total 4,541,456 $581,030,798 $60,822,514 $641,853,312 $141.33 Q13 Total 4,772,864 $824,013,811 $98,637,714 $922,651,526 $196.16 Q14 Total 4,959,454 $768,385,369 $89,723,473 $858,108,842 $173.02 Q15 Total 5,098,381 $773,609,163 $93,647,855 $867,257,018 $170.10 Q16 Total 5,203,143 $677,050,335 $73,362,678 $750,413,013 $144.22 Q17 Total 5,356,742 $883,082,807 $108,653,963 $991,736,769 $185.14 Q18 Total 5,470,396 $848,694,828 $99,937,769 $948,632,597 $173.41 Q19 Total 5,247,390 $787,922,115 $91,638,763 $879,560,878 $167.62 Q20 Total 5,611,671 $673,700,632 $90,712,877 $764,413,510 $136.22 Q21 Total 5,695,156 $965,461,910 $121,274,250 $1,086,736,159 $190.82 Q22 Total 5,773,020 $778,633,250 $99,802,883 $878,436,134 $152.16 Q23 Total 5,592,756 $860,576,398 $115,331,882 $975,908,280 $179.36 Q24 Total 5,895,265 $922,979,983 $122,296,078 $1,045,276,061 $177.31 Q25 Total 6,013,128 $884,131,387 $121,673,666 $1,005,805,053 $167.27 Q26 Total 6,092,265 $1,016,884,642 $131,066,964 $1,147,951,606 $188.43 Q27 Total 6,117,120 $915,201,600 $133,635,131 $1,048,836,732 $171.46 April 2013 2,048,478 $319,987,180 $41,439,325 $361,426,505 $176.44 May 2013 2,045,418 $545,847,163 $74,045,032 $619,892,195 $303.06 June 2013 2,031,991 $153,017,542 $18,391,686 $171,409,228 $84.36 Q28 Total 6,125,887 $1,018,851,885 $133,876,042 $1,152,727,927 $188.17
MEG 2 Total 129,986,645 19,490,584,938 2,254,684,518 21,745,269,212 167.29
* Quarterly expenditure totals may not equal the sum of the monthly expenditures due to quarterly adjustments such as disease management payments. The quarterly expenditure totals match the CMS 64 Report submissions without the adjustment of rebates.

43
For Demonstration Year One, MEG 1 has a PCCM of $972.13 (Table 33), compared to WOW of $948.79 (Table 30), which is 102.46% of the target PCCM for MEG 1. MEG 2 has a PCCM of $160.23 (Table 33), compared to WOW of $199.48 (Table 30), which is 80.32% of the target PCCM for MEG 2. For Demonstration Year Two, MEG 1 has a PCCM of $1,022.14 (Table 33), compared to WOW of $1,024.69 (Table 30), which is 99.75% of the target PCCM for MEG 1. MEG 2 has a PCCM of $169.85 (Table 33), compared to WOW of $215.44 (Table 30), which is 78.84% of the target PCCM for MEG 2. For Demonstration Year Three, MEG 1 has a PCCM of $1,057.86 (Table 33), compared to WOW of $1,106.67 (Table 30), which is 95.59% of the target PCCM for MEG 1. MEG 2 has a PCCM of $166.96 (Table 33), compared to WOW of $232.68 (Table 30), which is 71.76% of the target PCCM for MEG 2. For Demonstration Year Four, MEG 1 has a PCCM of 1077.30 (Table 33), compared to WOW of $1,195.20 (Table 30), which is 90.14% of the target PCCM for MEG 1. MEG 2 has a PCCM of $166.91 (Table 33), compared to WOW of $251.29 (Table 30), which is 66.42% of the target PCCM for MEG 2. For Demonstration Year Five, MEG 1 has a PCCM of $1,096.59 (Table 33), compared to WOW of $1,290.82 (Table 30), which is 84.95% of the target PCCM for MEG 1. MEG 2 has a PCCM of $167.11 (Table 33), compared to WOW of $271.39 (Table 30), which is 61.58% of the target PCCM for MEG 2. For Demonstration Year Six, MEG 1 has a PCCM of $1,103.54 (Table 33), compared to WOW of $1,356.65 (Table 30), which is 81.34% of the target PCCM for MEG 1. MEG 2 has a PCCM of $175.89 (Table 33), compared to WOW of $285.77 (Table 30), which is 61.55% of the target PCCM for MEG 2. For Demonstration Year Seven, MEG 1 has a PCCM of $1,015.99 (Table 33), compared to WOW of $1,425.84 (Table 30), which is 71.26% of the target PCCM for MEG 1. MEG 2 has a PCCM of $167.97 (Table 33), compared to WOW of $300.92 (Table 30), which is 55.82% of the target PCCM for MEG 2. Tables 33 and 34 provide cumulative expenditures and case months for the reporting period for each demonstration year. The combined PCCM is calculated by weighting MEGs 1 and 2 using the actual case months. In addition, the PCCM targets as provided in the STCs are also weighted using the actual case months. For Demonstration Year One, the weighted target PCCM for the reporting period using the actual case months and the MEG specific targets in the STCs (Table 34) is $322.50. The actual PCCM weighted for the reporting period using the actual case months and the MEG specific actual PCCM as provided in Table 34 is $293.53. Comparing the calculated weighted averages, the actual PCCM is 91.02% of the target PCCM. For Demonstration Year Two, the weighted target PCCM for the reporting period using the actual case months and the MEG specific targets in the STCs (Table 34) is $352.88. The actual PCCM weighted for the reporting period using the actual case months and the MEG specific actual PCCM as provided in Table 34 is $314.60. Comparing the calculated weighted averages, the actual PCCM is 89.15% of the target PCCM.

44
For Demonstration Year Three, the weighted target PCCM for the reporting period using the actual case months and the MEG specific targets in the STCs (Table 34) is $372.29. The actual PCCM weighted for the reporting period using the actual case months and the MEG specific actual PCCM as provided in Table 34 is $309.27. Comparing the calculated weighted averages, the actual PCCM is 83.07% of the target PCCM. For Demonstration Year Four, the weighted target PCCM for the reporting period using the actual case months and the MEG specific targets in the STCs (Table 34) is $386.76. The actual PCCM weighted for the reporting period using the actual case months and the MEG specific actual PCCM as provided in Table 34 is $297.57. Comparing the calculated weighted averages, the actual PCCM is 76.94% of the target PCCM. For Demonstration Year Five, the weighted target PCCM for the reporting period using the actual case months and the MEG specific targets in the STCs (Table 34) is $413.05. The actual PCCM weighted for the reporting period using the actual case months and the MEG specific actual PCCM as provided in Table 34 is $296.27. Comparing the calculated weighted averages, the actual PCCM is 71.73% of the target PCCM. For Demonstration Year Six, the weighted target PCCM for the reporting period using the actual case months and the MEG specific targets in the STCs (Table 34) is $432.81. The actual PCCM weighted for the reporting period using the actual case months and the MEG specific actual PCCM as provided in Table 34 is $303.27. Comparing the calculated weighted averages, the actual PCCM is 70.07% of the target PCCM. For Demonstration Year Seven, the weighted target PCCM for the reporting period using the actual case months and the MEG specific targets in the STCs (Table 34) is $453.85. The actual PCCM weighted for the reporting period using the actual case months and the MEG specific actual PCCM as provided in Table 34 is $283.26. Comparing the calculated weighted averages, the actual PCCM is 62.41% of the target PCCM.
Remainder of page intentionally left blank.

45
Table 33 MEG 1 and 2 Annual Statistics
DY01 – MEG 1 Actual CM Actual Spend
MCW & Reform Enrolled Total PCCM MEG 1 - DY01 Total 2,978,415 $2,631,566,388 $263,851,544 $2,895,417,932 $972.13 WOW DY1 Total 2,978,415 $2,825,890,368 $948.79 Difference $69,527,564 % of WOW PCCM MEG 1 102.46%
DY01 – MEG 2 Actual CM Actual Spend
MCW & Reform Enrolled Total PCCM MEG 2 - DY01 Total 15,162,819 $2,293,656,191 $135,864,711 $2,429,520,901 $160.23 WOW DY1 Total 15,162,819 $3,024,679,134 $199.48 Difference $(595,158,233) % of WOW PCCM MEG 2 80.32%
DY02 – MEG 1 Actual CM Actual Spend
MCW & Reform Enrolled Total PCCM MEG 1 - DY02 Total 3,033,969 $2,655,180,625 $445,971,300 $3,101,151,925 $1,022.14 WOW DY2 Total 3,033,969 $3,108,877,695 $1,024.69 Difference $(7,725,769) % of WOW PCCM MEG 1 99.75%
DY02 – MEG 2 Actual CM Actual Spend
MCW & Reform Enrolled Total PCCM MEG 2 - DY02 Total 14,829,991 $2,254,071,149 $264,786,465 $2,518,857,614 $169.85 WOW DY2 Total 14,829,991 $3,194,973,261 $215.44 Difference $(676,115,647) % of WOW PCCM MEG 2 78.84%
DY03 – MEG 1 Actual CM Actual Spend
MCW & Reform Enrolled Total PCCM MEG 1 - DY03 Total 3,249,742 $2,937,427,184 $500,344,974 $3,437,772,158 $1,057.86 WOW DY3 Total 3,249,742 $3,596,391,979 $1,106.67 Difference $(158,619,822) % of WOW PCCM MEG 1 95.59%
DY03 – MEG 2 Actual CM Actual Spend
MCW & Reform Enrolled Total PCCM MEG 2 - DY03 Total 17,094,840 $2,572,390,668 $281,844,467 $2,854,235,134 $166.96 WOW DY3 Total 17,094,840 $3,977,627,371 $232.68 Difference $(1,123,392,237) % of WOW PCCM MEG 2
71.76%

46
Table 33 MEG 1 and 2 Annual Statistics
DY04 – MEG 1 Actual CM Actual Spend
MCW & Reform Enrolled Total PCCM MEG 1 - DY04 Total 3,357,141 $3,066,429,103 $550,235,443 $3,616,664,546 $1,077.30 WOW DY4 Total 3,357,141 $4,012,454,923 $1,195.20 Difference $(395,790,377) % of WOW PCCM MEG 1 90.14%
DY04 – MEG 2 Actual CM Actual Spend
MCW & Reform Enrolled Total PCCM MEG 2 - DY04 Total 20,033,842 $2,992,091,000 $351,770,759 $3,343,861,760 $166.91 WOW DY4 Total 20,033,842 $5,034,304,156 $251.29 Difference $(1,690,442,397) % of WOW PCCM MEG 2 66.42%
DY05 – MEG 1 Actual CM Actual Spend
MCW & Reform Enrolled Total PCCM MEG 1 - DY05 Total 3,499,758 $3,247,599,951 $590,194,459 $3,837,794,411 $1,096.59 WOW DY5 Total 3,499,758 $4,517,557,622 $1,290.82 Difference $(679,763,211) % of WOW PCCM MEG 1 84.95%
DY05 – MEG 2 Actual CM Actual Spend
MCW & Reform Enrolled Total PCCM MEG 2 - DY05 Total 21,686,199 $3,225,551,490 $398,406,833 $3,623,958,323 $167.11 WOW DY5 Total 21,686,199 $5,885,417,547 $271.39 Difference $(2,261,459,223) % of WOW PCCM MEG 2 61.58%
DY06 – MEG 1 Actual CM Actual Spend
MCW & Reform Enrolled Total PCCM MEG 1 - DY06 Total 3,653,867 $3,383,148,738 $649,023,510 $4,032,172,248 $1,103.54 WOW DY6 Total 3,653,867 $4,957,018,666 $1,356.65 Difference $(924,846,417) % of WOW PCCM MEG 1 81.34%
DY06 – MEG 2 Actual CM Actual Spend
MCW & Reform Enrolled Total PCCM MEG 2 - DY06 Total 22,956,197 $3,539,069,082 $498,749,513 $4,037,818,595 $175.89 WOW DY6 Total 22,956,197 $6,560,192,417 $285.77 Difference $(2,522,373,822) % of WOW PCCM MEG 2
61.55%

47
Table 33 MEG 1 and 2 Annual Statistics
DY07 – MEG 1 Actual CM Actual Spend
MCW & Reform Enrolled Total PCCM MEG 1 - DY07 Total 3,830,936 $3,093,115,831 $799,084,683 $3,892,200,514 $1,015.99 WOW DY7 Total 3,830,936 $5,462,301,786 $1,425.84 Difference
$(1,570,101,272)
% of WOW PCCM MEG 1
71.26%
DY07– MEG 2 Actual CM Actual Spend
MCW & Reform Enrolled Total PCCM MEG 2 - DY07 Total 24,348,400 $3,632,607,000
$457,137,568 $4,089,744,568 $2,979,697,929 $167.97
WOW DY7 Total 24,348,400 $7,326,920,528 $300.92 Difference $(3,237,175,960) % of WOW PCCM MEG 2
55.82%
Remainder of page intentionally left blank.

48
Table 34 MEG 1 and 2 Cumulative Statistics
DY 01 Actual CM MEG 1 & 2 Actual Spend MCW & Reform Enrolled Total PCCM
Meg 1 & 2 18,141,234 $4,925,222,579 $399,716,255 $5,324,938,833 $293.53 WOW 18,141,234 $5,850,569,502 $322.50 Difference $(525,630,669) % Of WOW 91.02%
DY 02 Actual CM MEG 1 & 2 Actual Spend MCW & Reform Enrolled Total PCCM
Meg 1 & 2 17,863,960 $4,909,251,774 $710,757,766 $5,620,009,540 $314.60 WOW 17,863,960 $6,303,850,956 $352.88 Difference $(683,841,416) % Of WOW 89.15%
DY 03 Actual CM MEG 1 & 2 Actual Spend MCW & Reform Enrolled Total PCCM
Meg 1 & 2 20,344,582 $5,509,817,851 $782,189,441 $6,292,007,292 $309.27 WOW 20,344,582 $7,574,019,350 $372.29 Difference $(1,282,012,059) % Of WOW 83.07%
DY 04 Actual CM MEG 1 & 2 Actual Spend MCW & Reform Enrolled Total PCCM
Meg 1 & 2 23,390,983 $6,058,520,103 $902,006,202 $6,960,526,306 $297.57 WOW 23,390,983 $9,046,759,079 $386.76 Difference $(2,086,232,774) % Of WOW 76.94%
DY 05 Actual CM MEG 1 & 2 Actual Spend MCW & Reform Enrolled Total PCCM
Meg 1 & 2 25,185,957 $6,473,151,442 $988,601,293 $7,461,752,734 $296.27 WOW 25,185,957
$10,402,975,168 $413.05
Difference
$(2,941,222,434) % Of WOW
71.73%
DY 06 Actual CM MEG 1 & 2 Actual Spend MCW & Reform Enrolled Total PCCM
Meg 1 & 2 26,610,064 $6,922,217,820 $1,147,773,023 $8,069,990,843 $303.27 WOW 26,610,064
$11,517,211,082 $432.81
Difference
$(3,447,220,239) % Of WOW
70.07%
DY 07 Actual CM MEG 1 & 2 Actual Spend MCW & Reform Enrolled Total PCCM
Meg 1 & 2 28,179,336 $6,725,722,831 $1,256,222,251 $7,981,945,082 $283.26 WOW 28,179,336
$12,789,222,314 $453.85
Difference
$(4,807,277,232) % Of WOW
62.41%
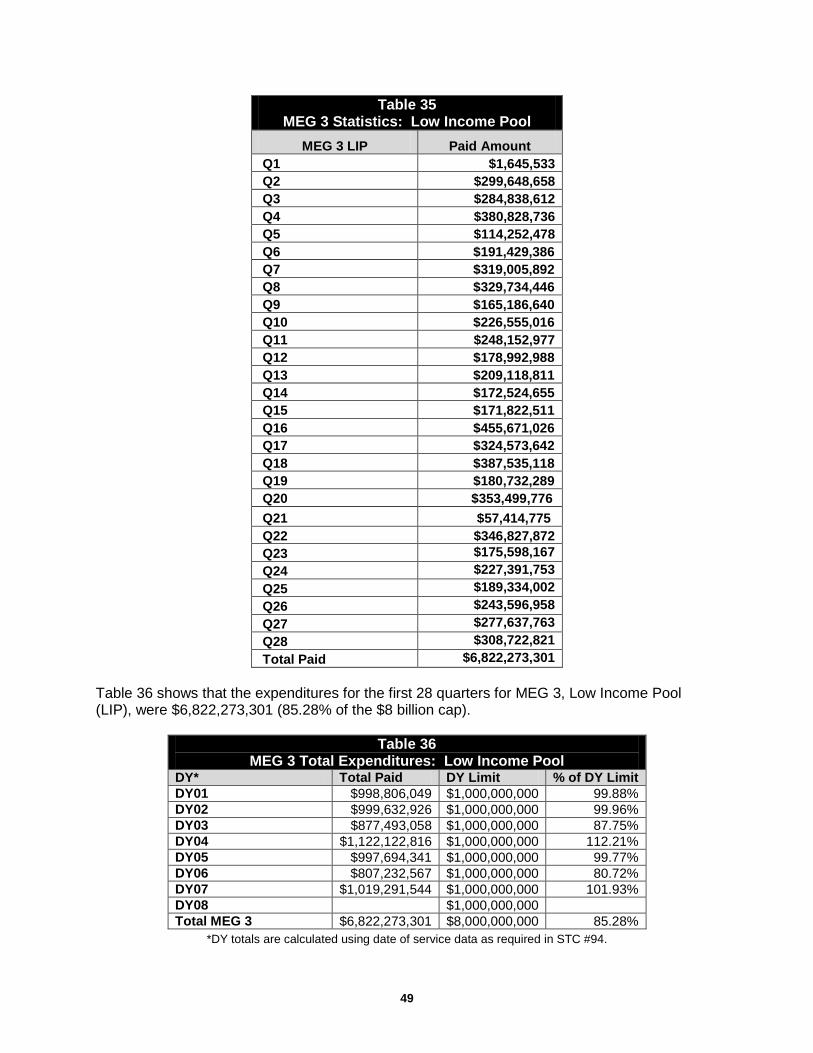
49
Table 35 MEG 3 Statistics: Low Income Pool
MEG 3 LIP Paid Amount Q1 $1,645,533 Q2 $299,648,658 Q3 $284,838,612 Q4 $380,828,736 Q5 $114,252,478 Q6 $191,429,386 Q7 $319,005,892 Q8 $329,734,446 Q9 $165,186,640 Q10 $226,555,016 Q11 $248,152,977 Q12 $178,992,988 Q13 $209,118,811 Q14 $172,524,655 Q15 $171,822,511 Q16 $455,671,026 Q17 $324,573,642 Q18 $387,535,118 Q19 $180,732,289 Q20 $353,499,776 Q21 $57,414,775 Q22 $346,827,872 Q23 $175,598,167 Q24 $227,391,753 Q25 $189,334,002 Q26 $243,596,958 Q27 $277,637,763 Q28 $308,722,821 Total Paid $6,822,273,301
Table 36 shows that the expenditures for the first 28 quarters for MEG 3, Low Income Pool (LIP), were $6,822,273,301 (85.28% of the $8 billion cap).
Table 36 MEG 3 Total Expenditures: Low Income Pool
DY* Total Paid DY Limit % of DY Limit DY01 $998,806,049 $1,000,000,000 99.88% DY02 $999,632,926 $1,000,000,000 99.96% DY03 $877,493,058 $1,000,000,000 87.75% DY04 $1,122,122,816 $1,000,000,000 112.21% DY05 $997,694,341 $1,000,000,000 99.77% DY06 $807,232,567 $1,000,000,000 80.72% DY07 $1,019,291,544 $1,000,000,000 101.93% DY08 $1,000,000,000 Total MEG 3 $6,822,273,301 $8,000,000,000 85.28%
*DY totals are calculated using date of service data as required in STC #94.

50
During Demonstration Year Three, the Florida Legislature directed the Agency to carry forward approximately $123 million dollars from the Demonstration Year Three LIP appropriation until an amendment of the STC #105 could be negotiated. Upon approval of the amendment, approximately $123 million dollars in carry forward funding was provided to the Agency through appropriations for Demonstration Year Four. The appropriations for Demonstration Year Four totaled $1,001,250,000 plus the $123,577,163 of carry forward LIP funds for a grand total of $1,124,827,163. Due to the payment process and the reporting period, payments made after June 30, 2010, were not captured in the Fourth Quarter report of Year Four or the Year Four Annual Report. The report for the first quarter of Demonstration Year Five included the final LIP payment totals for Demonstration Year Four.
Remainder of page intentionally left blank.

51
G. Encounter and Utilization Data Overview The Agency is required to capture medical services encounter data for all Medicaid covered services in compliance with Title XIX of the Social Security Act, the Balanced Budget Act of 1997, 42 CFR 438, and Chapters 409 and 641, F.S. In addition, s. 409.91211(3)(p), F.S., requires a risk-adjusted methodology be a component of the rate setting process for capitated payments to the demonstration health plans. Risk adjustment was phased in over a period of three years, using the Medicaid Rx (MedRx) model. Current Activities Encounter Data The Encounter Data Compliance Report uses analytical measures to report the completeness, accuracy, and timeliness of encounter data submissions. The processes for analysis undergo iterative reviews and validation checks. The reports are modified, as needed to address any issues and incorporate additional functionality. During this quarter, Encounter Data Compliance Reports were distributed to managed care organizations in March and April. The March distribution included reports for encounters processed in December 2012 and January 2013. The April distribution included reports for encounters processed in January 2013 and February 2013. Each month, dialogue with the managed care stakeholders initiate refinements that were applied to the measures and to the narrative. The March 2013 Encounter Data Compliance Report was distributed the second week of June. The April 2013 Encounter Data Compliance Report was distributed June 28, 2013. Enforcing encounter data timeliness compliance requires the ability to accurately distinguish encounter data resubmissions from original submissions. This was accomplished through the design and construction of an encounter data lexicon which uses an arithmetical approach to the elements in the data fields. Encounter data analyses in the Fourth Quarter of Demonstration Year Seven showed a very low number of resubmissions; therefore, the process is being re-evaluated. Isolating resubmitted claims from original claims continues to be a topic in brainstorming sessions with Agency staff, the fiscal agent, health plan stakeholders, and Medicaid offices in other states. On April 16, 2013, a workshop with health plans was held, focusing on provider errors. Staff from the bureaus of Medicaid Program Analysis and Medicaid Contract Management addressed challenges relative to successful submission of encounter transactions with representatives from 17 health plans. As a means of determining encounter submission completeness and establishing an encounter volumetric that predicts Medicaid recipient encounter volume, to that actually submitted by a health plan, the Chronic Disability and Illness Payment System (CDPS) has been adapted to compute a predicted encounter volumetric, reported by health plans on a month-over-month period. The Medicaid CDPS+Rx v5.3, developed and distributed by the University of California, San Diego, customized for the State of Florida, provides insight into medical service utilization for individuals having common chronic illnesses by age, gender and aid categories. The diseases are identified through diagnosis codes and National Drug Codes (NDC) existing in medical and pharmacy claims and encounter transactions. The CDPS model, together with an Auto Regressive Integrated Moving Average (ARIMA), a multivariate statistical analysis model, tracks actual health plan submissions using up to 15 data points to predict encounter volume. The volumetric results of the two methods are being cross-validated. Additionally, the computation of CDPS risk scores is being validated against the risk scores produced by the

52
Agency’s actuaries for Medicaid Rx, a service utilization model that uses only pharmacy claims data. During the third quarter of Demonstration Year Seven, the CDPS methodology was validated for model fit and predictability using multiple statistical methods and, during this quarter, was implemented in the March 2013 health plan Encounter Data Compliance Reports. In January and February 2013, the analysis on specialty care access (see Objective 2 in Section H of this report) grouped specialty services by health plan. The specialty services reported are: dermatology, neurology and orthopedics. The health plan Encounter Data Compliance reports beginning in March 2013 include analyses on these specialty care services. Rate Setting/Risk Adjustment Hospital outpatient encounter data was incorporated in the September 2012 through August 2013 rate setting process. Hospital inpatient, pharmacy and mental health encounter data continue to be utilized for rate setting. During this quarter, the National Council for Prescription Drug Program (NCPDP) pharmacy encounter claims for the October 1, 2011 – September 30, 2012 measurement period (paid through December 31, 2012) were provided to the Agency’s actuary for use in the MedRx model to generate risk scores for June, July and August 2013.

53
H. Demonstration Goals Objective 1: To ensure there is an increase in the number of plans from which an individual may choose, an increase in the different type of plans, and increased patient satisfaction.
Broward and Duval Counties Tables 37 and 38 provide the number and types of health plans the Agency contracted with prior to the implementation of the demonstration.
Table 37 Broward County
Number and Type of Plans (Pre-Demonstration 2006)
Type of Plan Number of Plans
HMOs 8 PSNs 1 Total 9
Table 38 Duval County
Number and Type of Plans (Pre-Demonstration 2006)
Type of Plan Number of Plans
HMOs 2 PSNs 0 Total 2
The Agency also contracted with a Pediatric Emergency Room (ER) Diversion program and two Minority Physician Networks (MPNs) that operated as prepaid ambulatory health plans offering enhanced medical management services to recipients enrolled in MediPass, Florida's primary care case management program. One MPN operated in Duval County, and both MPNs operated in Broward County. The Pediatric ER Diversion program operated only in Broward County. Tables 39 and 40 provide the number and types of health plans the Agency currently has under contract in Broward and Duval Counties.
Table 39 Broward County
Number and Type of Plans (January 1, 2013 – March 31, 2013)
Type of Plan Number of Plans
HMOs 11 PSNs 3 Total 14
Table 40 Duval County
Number and Type of Plans (January 1, 2013 – March 31, 2013)
Type of Plan Number of Plans
HMOs 3 PSNs 2 Total 5
Baker, Clay and Nassau Counties Prior to expansion of the demonstration into Baker, Clay and Nassau Counties on July 1, 2007, the Agency contracted with one MPN that operated in all three counties as a prepaid ambulatory health plan. The Agency had no contracts with HMOs, PSNs or the Pediatric ER Diversion program in these counties. Currently, the Agency contracts with three HMOs and one PSN, for a total of four health plans in Baker, Clay and/or Nassau Counties.

54
Health Plan Applications and Expansion Requests During this quarter, one health plan application was approved and one health plan request to expand into Baker and Nassau Counties remains under Agency review. See Section A.1 of this report for additional information on health plan applications and expansion requests. Please note that patient satisfaction is addressed in Objective 4. Objective 2: To ensure that there is access to services not previously covered and improved access to specialists. Access to Services Not Previously Covered In Year Seven of the demonstration, all of the capitated health plans continue to offer expanded or additional benefits that were not previously covered under Florida’s Medicaid State Plan in order to meet the needs of new enrollees. The customized benefit packages and expanded benefits became operational on January 1, 2013 and will remain valid until December 31, 2013, effectively overlapping Years Seven and Eight of the demonstration. These benefit packages include 26 customized benefit packages for the HMOs and 10 benefit packages for the FFS PSNs. The following is a list of the expanded benefits currently offered by the capitated health plans of which the over-the-counter drug benefits and adult preventive benefits are the most frequently offered: • Over-the-counter drug benefit – $25 per household per month
• Adult preventive dental
• Circumcisions for male newborns
• Additional adult vision
• Nutritional counseling.
Improving Access to Specialists The demonstration is designed to improve access to specialty care for recipients. Through the contracting process, each health plan is required to provide documentation to the Agency of a network of providers (including specialists) that will guarantee access to care for recipients. As Demonstration Year One ended, the Agency began the first intensive review of the health plan provider network files to evaluate the effectiveness of the demonstration in improving access to specialists. The analysis included the following steps: 1. Identifying the number of unduplicated providers that participate in the demonstration,
2. Identifying providers that were not fee-for-service providers, but now serve recipients as a part of the demonstration,
3. Comparison of plan networks that were operational prior to the demonstration with the demonstration health plan networks at the end of Year One of the waiver, and
4. Comparison of demonstration provider networks to the active FFS providers.
During the third quarter of Demonstration Year Two, the Agency began additional provider network analysis of the Medicaid health plans. Beginning in October 2007, the Agency directed
55
all Medicaid health plans to update their web-based and paper provider directories and to certify the provider network files that they submit to the Agency on a monthly basis. In addition to listing the providers’ types and specialties, these provider network files must include any restrictions on recipient access to providers (e.g., if the provider only accepts current patients, or if they only treat children and women, etc.). Specialties identified by the Florida Medicaid Area Offices as areas of potential concern regarding access to care were subject to focused reviews of provider network files and provider surveys in Demonstration Year Two through Year Five. Results of these reviews and surveys are provided in earlier quarterly and annual reports. In Demonstration Year Six, the Agency began developing additional ways to analyze health plan encounter data to assess health care access. The most recent analyses focused on three types of specialty care: orthopedics, neurology and dermatology. The analyses used encounter data to target the number of recipients receiving these specialty services in demonstration counties. This measure calculates the recipient utilization per 1,000 eligible recipients. During the first quarter of Demonstration Year Seven, the Agency reviewed and documented methodologies for analyses begun in the last quarter of Year Six, intended for future analytics of access to care and a basis for identifying opportunities for MCO performance improvements. Encounter data improvements intended to enhance the analyses are ongoing. Planning has begun to reach out to the health plans with a performance improvement initiative. Health plans will be encouraged to educate and retrain providers to complete provider detail in the appropriate fields on encounter transactions. The accurate completion of specialty fields pertaining to the providers will provide necessary detail and enhance the analyses. The baselines for SFY 2009-10 and SFY 2010-11 are revised using enhanced analyses and the Annual Reports will demonstrate access to specialists using the refined measures. These enhancements show improvements to the measures due to two factors: (1) Increase in volume of encounter data in the database; and (2) Improvement in filtering and stratifying data to target reform health plan enrollees. Objective 3: To improve enrollee outcomes as demonstrated by: (a) improvement in the overall health status of enrollees for select health indicators, (b) reduction in ambulatory sensitive hospitalizations, and (c) decreased utilization of emergency room care.
(3)(a) Improvement in the overall health status of enrollees for selected health indicators. The Agency received the fifth year of performance measure submissions from the health plans during the first quarter of Demonstration Year Seven. Results of the fifth year of performance measures can be viewed in Attachment III of this report and the following provides highlights of the fifth year of performance measures: • Of the 34 HEDIS measures for which plans may need to do Performance Measure Action
Plans (PMAPs), the statewide average results for the demonstration plans improved for 15 of the measures compared to the previous year. A statewide weighted average for one measure was not calculated for the demonstration plans as only three of the 13 plans had sufficient eligible members to report the measure. Thus, only 33 of the measures have statewide averages for the demonstration plans.
• Demonstration plans’ rates for 11 of the measures stayed about the same, while their performance on seven of the measures dropped.
56
• For 22 of the 33 measures, the statewide average results for the demonstration plans were higher than the average results for the non-demonstration plans. Performance measures with notable improvement include:
– Well-Child Visits in the First 15 Months – 6 or more: the statewide weighted average for demonstration plans increased from 46.5% in 2011 (representing measurement year 2010) to 58.4% in 2012 (representing measurement year 2011).
– Controlling Blood Pressure: the statewide weighted average for demonstration plans increased from 46.3% in 2011 to 52.9% in 2012.
– Frequency of Prenatal Care: the statewide weighted average for demonstration plans increased from 44% in 2011 to 54.4% in 2012.
– Diabetes – HbA1c Poor Control: the statewide weighted average for demonstration plans dropped from 48.6% in 2011 to 43.6% in 2012. Please note that this is an inverse measure, meaning that a lower rate is more desirable.
– Lead Screening in Children: the statewide weighted average for demonstration plans increased from 54.1% in 2011 to 59.6% in 2012.
During the second quarter of Demonstration Year Seven, the Agency sent lists of measures requiring PMAPs to the health plans. The PMAPs are required for all measures that scored below the 50th percentile as identified in the National Committee for Quality Assurance’s (NCQA) National Means and Percentiles for Medicaid plans. The health plans submitted their PMAPs to the Agency in December 2012 and Agency staff reviewed them. During the third quarter of Year Seven, the Agency obtained the most recent National Means and Percentiles from NCQA in order to compare the Florida Medicaid health plans’ performance measure rates to the 2012 Means and Percentiles. On average, the demonstration plans performed better than the national mean for a number of measures. • For three of the Comprehensive Diabetes Care measure components, the statewide
weighted average for demonstration plans was higher than the national mean.
– LDL Screening: the national mean was 74.9% while the weighted average for demonstration plans was 81.9%.
– LDL Control: the national mean was 35.2% while the weighted average for demonstration plans was 37.8%.
– Medical Attention for Nephropathy: the national mean was 77.8% while the weighted average for demonstration plans was 82.3%.
• For the measure Well Child Visits in the 3rd-6th years of life, the weighted average for demonstration plans was 75.5%, which exceeds the national mean of 71.9%.
• For both of the Antidepressant Medication Management rates (acute and continuation), the demonstration plans’ weighted averages (57.4% and 43.1%, respectively) exceeded the national means of 51.1% and 34.4%, respectively.
• For the Breast Cancer Screening measure, the demonstration plans’ weighted average was 52.3%, while the national mean was 50.4%.

57
• For the Follow-up Care for Children Prescribed ADHD Medication – Initiation measure, the demonstration plans’ weighted average was 44.4% while the national mean was 38.8%.
During this quarter, the health plans submitted PMAP progress reports and Agency staff reviewed them. Health plans began submitting their performance measure reports at the end of the quarter, as they are due to the Agency on July 1, 2013. Agency staff will review the performance measure reports and compile the results during the first quarter of Demonstration Year Eight. (3)(b) Reduction in ambulatory sensitive hospitalizations. The Agency continues to run its model to analyze the utilization of Ambulatory Care Sensitive Conditions (ASCS) using the Agency for Healthcare Research and Quality (AHRQ) quality indicators (QI). The model enables us to analyze the prevalence of ACSCs that lead to preventable hospitalizations. Aggregation of utilization data across multiple fee-for-service and managed care delivery systems enables a comparison by county or by plan. The reports include morbidity scoring (MedRx), utilization by per member per month normalized to report per 1,000 recipients, and a distribution by category of the QI’s for statewide (FFS & managed care), reform, non-reform, and per-MCO basis. The model has been updated to support the latest version (4.4) provided by AHRQ. Reports can be generated for designated Florida counties possessing similar Standard Metropolitan Statistical Areas (SMSA) characteristics, classified as small rural, medium rural, medium urban and large urban. Reports are also generated for a plan to plan comparison. (3)(c) Decreased utilization of emergency room care. The Agency uses a model to analyze the utilization of emergency departments (ED) based on the New York University ED algorithm. The model is set up to process data, generating comparable results across the fee-for-service recipients and managed care enrollees. The reports include a volumetric with morbidity scoring (MedRx), utilization per member per month per 1,000 recipients, and distribution by reporting ED utilization category on a statewide (FFS & managed care), reform, non-reform and per-MCO basis. Portions of the report are designed to produce a county comparison based on managed care eligible recipient utilization or according to plan member utilization. The model is being updated to support the latest version 2.0 provided by New York University. The algorithm developed by New York University is used to identify conditions for which an emergency department visit may have been avoided, either through earlier primary care intervention or through access to non-emergency department care settings. Objective 4: To ensure that patient satisfaction increases.
The Agency continues to contract with the University of Florida (UF) to conduct patient satisfaction surveys of recipients enrolled in the demonstration. The survey instrument used by UF is based on the Consumer Assessment of Healthcare Providers and Systems (CAHPS) Survey. The CAHPS Survey is one of a family of standardized instruments used widely in the health care industry to assess enrollees’ experiences and satisfaction with their health care. UF has adapted the CAHPS telephone survey component by adding questions specific to the demonstration.

58
During the second quarter of Demonstration Year Seven, UF submitted a comprehensive draft report on CAHPS Survey results to the Agency based on the SFY 2011-12 surveys. This draft report included survey results for both the demonstration and non-demonstration health plans. During the third and fourth quarters of Demonstration Year Seven, the Agency provided feedback to UF on the report and UF made the final revisions. During this quarter, UF submitted a draft trend analysis report on CAHPS Survey results, as well as a preliminary version of an evaluation report that includes the CAHPS Survey results through Demonstration Year Six. In the next quarter, the Agency will provide feedback to UF on the evaluation report so the UF may make revisions and finalize the report. The results of all other evaluation reports conducted by UF can be viewed at: http://ahca.myflorida.com/Medicaid/quality_management/mrp/contracts/med027/index.shtml. Objective 5: To evaluate the impact of the low income pool on increased access for uninsured individuals.
Prior to the implementation of the demonstration, Florida's State Plan included a hospital Upper Payment Limit (UPL) program that allowed for special Medicaid payments to hospitals for their services to the Medicaid population. The demonstration created the LIP program, which provides for payments to Provider Access Systems (PAS), which may include hospital and non-hospital providers. The inclusion of the new PAS providers allows for increased access to services for the Medicaid, underinsured and uninsured populations. For information on activities that occurred prior to this quarter, please see the previous quarterly and annual reports posted on the Agency’s website at: http://ahca.myflorida.com/Medicaid/medicaid_reform/index.shtml. Current Activities Newly Amended STC #84 – Tier-One Milestone Two reports correspond to this STC: • The Milestone Statistics and Findings Report covering SFY 2011-12. The Agency collected
milestone data for this report from the PAS providers. The final deadline for the PAS providers to submit their milestone data to the Agency was on October 31, 2012. During this quarter, the Agency submitted to Federal CMS the final annual Milestone Statistics and Findings Report on April 1, 2013.
• The Primary Care and Alternative Delivery Systems Expenditure Report. There are many different primary care and alternative delivery systems operating with LIP funds. Programs range from: Recipients Outreach; Emergency Room Diversion; Insurance Products; Primary Care Extensions; and Disease Management Initiatives. Although each program contains certain measures and reporting that are similar (i.e., Number of recipients served, Number of services provided, Program expenditures), there are also measures that will be unique for each program. These programs are required to submit reporting to the Agency on August 31, 2013. The Agency will submit the data to Federal CMS on January 1, 2014.
Both the Milestone Statistics and Findings Report and the Primary Care and Alternative Delivery Systems Report will show the increased access to medical care for this population in Florida. Newly Amended STC #85 – Tier-Two Milestone This STC requires that the top 15 LIP hospitals, which are allocated the largest annual amounts in LIP funding, participate in initiatives that broadly drive from the three overarching goals of Federal CMS’ Three-Part Aim:

59
a) Better care for individuals including safety, effectiveness, patient centeredness, timeliness, efficiency, and equity;
b) Better health for populations by addressing areas such as poor nutrition, physical inactivity, and substance abuse; and
c) Reducing per-capita costs. These initiatives focus on: infrastructure development; innovation and redesign; and population focused improvement. Participating facilities have implemented new, or enhanced existing, health care initiatives, investments, or activities with the goal of meaningfully improving the quality of care and the health of populations served (including low income populations) and meet established hospital specific targets, to receive 100 percent of allocated LIP funding. Tier-Two milestones apply to facilities that receive the largest annual allocations of LIP funds and put at risk 3.5 percent of each of these facilities’ annual LIP allocation. The milestones apply to the 15 hospitals which are allocated the largest annual amounts in LIP funding. If the total annual LIP funds allocated for the 15 hospitals do not total at least $700 million, then the population of hospitals must be expanded until $700 million is reached. The top 15 hospitals were required to select and participate in three initiatives. Federal CMS exempted one facility from providing three initiatives, and required only two initiatives bringing the total number of initiatives required for the top 15 to 44 initiatives or programs. All 44 initiatives were submitted to Federal CMS on April 10, 2012, and the Agency received Federal CMS approval for the 44 initiatives on June 29, 2012. On October 15, 2012, the Agency received the first quarter reporting for the 44 Hospital initiatives and submitted the reports to Federal CMS on November 20, 2012. On December 31, 2012, Federal CMS approved the first quarter reporting for the 44 Hospital initiatives. The Agency is currently reviewing the third quarter reporting. The Agency will submit second, third and fourth quarter reporting to Federal CMS on September 30, 2013 for the 44 hospital initiatives. Final Evaluation Plan The required demonstration evaluation will include specific studies regarding access to care and quality of care as affected by the Tier-One and Tier-Two initiatives in accordance with the STCs of the waiver. On October 30, 2012, Federal CMS approved the Agency’s final evaluation design. When available, the results of the evaluation will be reported under Section I, Evaluation of the Demonstration, of this report.

60
I. Evaluation of the Demonstration Overview The evaluation of the demonstration is an ongoing process to be conducted during the life of the demonstration. The Agency is required to complete an evaluation design that includes a discussion of the goals, objectives and specific hypotheses that are being tested to determine the impact of the demonstration during the period of approval. In 2005, the Agency contracted for the initial demonstration evaluation for the period July 1, 2006-June 30, 2011, with an independent entity, the University of Florida (UF). This initial evaluation was a five-year “over-arching” study that presented its major findings in the Final Evaluation Report that was submitted to Federal CMS on December 15, 2011. The report can be viewed on the Agency’s website at the following link: http://ahca.myflorida.com/Medicaid/quality_management/mrp/contracts/med027/FL_1115_Final_UF_Eval_Report_12-15-11.pdf. With the renewal of the demonstration on December 15, 2011, the Agency is required to conduct an evaluation of the demonstration during the renewal period, December 16, 2011 – June 30, 2014. STC #80 (effective December 15, 2011 until June 14, 2013) required the Agency to submit a draft evaluation design to Federal CMS 120 days (April 14, 2012) after receiving approval to renew the demonstration. STC #81 (effective December 15, 2011 until June 14, 2013) required Federal CMS to provide comments within 60 days (June 20, 2012) of receiving the draft evaluation design and for the Agency to submit the final evaluation plan to Federal CMS within 60 days (August 11, 2012) of receiving comments from Federal CMS. The Agency submitted the final evaluation design to Federal CMS on August 9, 2012. Federal CMS approved the Agency’s final evaluation design on October 30, 2012. Following approval, the final evaluation design was posted on the Agency’s website. The final evaluation design included a discussion of the goals, objectives and specific hypotheses that are being tested, including those that focus specifically on target populations for the demonstration. The Agency’s contract with UF for the evaluation of domains i, ii, iii, and v-ix (per the STCs) was executed at the end of October 2012. Due to the contract being executed later than was initially anticipated, Agency staff worked with UF to establish new due dates for several deliverables in the SFY 2012-13. During the third quarter of Year Seven, the Agency executed a contract with Florida International University (FIU) for the evaluation of domain iv (per the STCs). Researchers from FIU came to the Agency and met with staff to discuss the evaluation of the impact of the demonstration as a deterrent to fraud and abuse. Current Activities During this quarter, FIU submitted a preliminary and an annual report on their review of a sample of Reform health plans’ fraud and abuse plans. These reports have been approved and will be posted on the Agency’s website in the next quarter. During this quarter, UF submitted a preliminary report of their evaluation of the LIP-related evaluation domains (v-ix, per the STCs), and received Agency feedback. UF also submitted preliminary evaluation reports regarding domains i and ii (per the STCs, regarding quality, access to, and cost of care, and the impact of customized benefits) and domain iii (regarding the

61
Enhanced Benefits Account program). The Agency will be providing feedback to UF on these reports so they may be finalized in the next quarter. On June 14, 2013, Federal CMS added new STC #110 that the Agency submit for approval, within 120 days of approval of the MMA amendment, a draft evaluation design update that builds and improves on the evaluation design approved October 31, 2012. At a minimum, the draft design must include a discussion of the goals, objectives and specific testable hypotheses, including those that focus specifically on target populations for the demonstration, and more generally on beneficiaries, providers, plans, market areas and public expenditures. The analysis plan must cover all elements in new STC #112. The updated design should accommodate and reflect the staggered implementation of the MMA program to produce more reliable estimates of program impacts. The design, including the budget and adequacy of approach, to assure the evaluation meets the requirements of STC #112(a), is subject to CMS approval. The following are the requirements added in new STC #112 effective June 14, 2013: a) Domains of Focus – The Agency must propose as least one research question that it will investigate within each of the domains listed in the following items i-xiii. The research questions should focus on processes and outcomes that relate to the CMS Three-Part Aim of better care, better health, and reducing costs. With respect to domains vii, viii, and ix, the state must propose two research questions under each domain (one each from Tier-One and Tier-Two milestones).
i. The effect of managed care on access to care, quality and efficiency of care, and the cost of care;
ii. The effect of customized benefit plans on beneficiaries’ choice of plans, access to care, or quality of care;
iii. Participation in the Enhanced Benefits Account Program (EBAP) and the MMA plans’ Healthy Behaviors programs (upon implementation of the MMA program) and its effect on participant behavior or health status;
iv. The impact of the demonstration as a deterrent against Medicaid fraud and abuse; v. The effect of LIP funding on the number of uninsured and underinsured, and rate of
uninsurance; vi. The effect of LIP funding on disparities in the provision of healthcare services, both
geographically and by population groups; vii. The impact of Tier-One and Tier-Two milestone initiatives on access to care and quality
of care (including safety, effectiveness, patient centeredness, timeliness, efficiency, and equity);
viii. The impact of Tier-One and Tier-Two milestone initiatives on population health; ix. The impact of Tier-One and Tier-Two milestone initiatives on per-capita costs (including
Medicaid, uninsured, and underinsured populations) and the cost-effectiveness of care; x. The effect of having separate managed care programs for acute care and LTC services
on access to care, care coordination, quality, efficiency of care, and the cost of care. Baseline data to evaluate this domain will be collected prior to June 30, 2014;
xi. The effect of having separate managed care programs for acute care and LTC services on the demonstration’s impact as a deterrent against Medicaid fraud and abuse. Baseline data to evaluate this domain will be collected prior to June 30, 2014;
xii. The effect of transitioning the EBAP program from direct state operation to the MMA plans’ Healthy Behaviors programs; and,
xiii. The impact of efforts to align with Medicare and improving beneficiary experiences and outcomes for dual-eligible individuals.

62
b) Measures. The draft evaluation design must discuss the outcome measures that shall be used in evaluating the impact of the demonstration during the period of approval, including:
i. A description of each outcome measure selected, including clearly defined numerators and denominators, and National Quality Forum (NQF) numbers (as applicable);
ii. The measure steward;
iii. The baseline value for each measure;
iv. The sampling methodology for assessing these outcomes; and
v. The methods of data collection. c) Sources of Measures. Federal CMS recommends use of measures from nationally-recognized sources and those from national measures sets (including CMS’s Core Set of Health Care Quality Measures for Children in Medicaid and CHIP, and the Initial Core Set of Health Care Quality Measures for Medicaid-Eligible Adults). d) The evaluation design is required to also discuss the data sources used, including the use of Medicaid encounter data, enrollment data, EHR data, and consumer and provider surveys. The draft evaluation design must include a detailed analysis plan that describes how the effects of the demonstration shall be isolated from other initiatives occurring in the state. The evaluation designs proposed for each question may include analysis at the beneficiary, provider, and aggregate program level, as appropriate, and include population stratifications to the extent feasible, for further depth and to glean potential non-equivalent effects on different sub-groups. The following requirements were added in new STC #113 effective June 14, 2013 regarding the Final Evaluation Design and Implementation. Federal CMS will provide comments on the draft design and the draft MMA evaluation strategy within 60 days of receipt, and the Agency is required to submit a final design within 60 days of receipt of Federal CMS’ comments. The Agency must implement the evaluation design and submit its progress in each of the quarterly and annual progress reports. The Agency must submit to Federal CMS a draft of the evaluation final report by October 31, 2014. The Agency is to submit the final report within 60 days after receipt of Federal CMS’ comments. The Agency is required to submit to Federal CMS a draft of the evaluation final report by October 31, 2014. The final report must include the following:
a. An executive summary;
b. A description of the demonstration, including programmatic goals, interventions implemented, and resulting impact of these interventions;
c. A summary of the evaluation design employed, including hypotheses, study design, measures, data sources, and analyses;
d. A description of the population included in the evaluation (by age, gender, race/ethnicity, etc.);
e. Final evaluation findings, including a discussion of the findings (interpretation and policy context); and
f. Successes, challenges, and lessons learned.

63
J. Policy and Administrative Issues Current Activities The Agency continues to identify and resolve various operational issues for capitated health plans and FFS PSNs. During this quarter, the Agency's internal and external communication processes continue to play a key role in managing and resolving issues effectively and efficiently. Policy, administrative and operational issues are generally addressed by six different processes: • Technical Advisory Panel regular meetings
The Technical Advisory Panel (TAP) was created by the 2005 Florida Legislature, and appointed by the Agency with the directive of advising the Agency on various implementation issues relative to the demonstration.
• Policy transmittals and “Dear Provider” letters and e-mails
Policy transmittals and “Dear Provider” letters and e-mails are used to send key policy and operational information to health plans.
• Health Plan Technical and Operational Issues conference calls
These conference calls are used to communicate the Agency’s response to issues addressed at a higher level in the TAP meetings and to respond to plan questions posed through e-mail, telephone inquiries and previous technical calls. Previously, these calls occurred biweekly, but with the demonstration being fully operational, the need for biweekly calls has significantly lessened. As discussed with the health plans in June 2010, a decision was made to change to monthly calls beginning in July 2010. Unless a particular need arises for calls to occur more often, the Technical and Operational Issues conference calls are now monthly.
All health plans are invited to participate, whether they are currently operating in the demonstration counties. Additionally, the calls are publicly noticed in the Florida Administrative Register to allow all interested parties to participate. The Agency staffs these calls with administrative experts in all areas of the demonstration and participants include a variety of stakeholders, such as health plan chief executive staff, government relations and compliance managers, health plan information systems managers, and health plan subcontractors.
• PSN Systems Implementation monthly conference calls
These conference calls provide a forum for discussing claims processes and enrollment file issues that are unique to the FFS PSN model. The PSNs are encouraged to submit questions and/or issues in advance in order for systems research to occur internally at the Agency (or between the Agency and the Agency’s Medicaid Fiscal Agent). Agency participants included management and key technical staff of the Agency’s PSN Policy and Contracting Unit, Data Unit, Bureau of Contract Management, Area Office staff, and Bureau of Managed Health Care staff responsible for monitoring the health plans. PSN participants included managing staff as well as key staff responsible for oversight of claims processing functions and key staff at the PSNs’ contracted Third Party Administrators. Unresolved issues include those that are in the systems change queue for implementation and anecdotal issues pending examples to be submitted from PSNs for Agency research. While these calls were originally bi-weekly, then monthly, they now

64
occur on an as-needed basis. If there is nothing new to report or discuss, then the monthly call is cancelled.
• General amendment/contract overview calls
When new contract changes are being considered or are implemented, the Agency holds conference calls with the health plans to discuss the changes. These calls are periodic in nature, depending on the particular items needing discussion.
• Fraud and abuse meetings
As an effort to enhance the program integrity function required by contract, the Agency typically holds quarterly meetings with the health plans and other state agencies involved with health care fraud and abuse in order to discuss fraud and abuse initiatives and current health plan processes.
These forums continue to provide excellent discussion and feedback on proposed processes, and provide finalized policy in the form of our “Dear Provider” letters and policy transmittals. Through these forums, the Agency continues its initiatives on process and program improvement. In conference call forums, the focus during this quarter has been on operational updates and information exchange. Medicaid Reform Technical Advisory Panel (TAP) The seven-member TAP did not meet this quarter. Policy Transmittals and “Dear Provider” Letters During this quarter, there were two policy transmittals and one “Dear Provider” letter released to the health plans. The policy transmittals advised health plans regarding the following: • Changes in submittal and processing requirements for certain inpatient hospital claims and
outpatient hospital claims.
• Information regarding the Affordable Care Act requirements that prohibit payments for provider-preventable conditions (PPCs); the identification and reporting of PPCs, including payments expended in facility settings for such services and encounter data requirements; and provider subcontract requirements.
The “Dear Provider” letter advised health plans of updated information regarding the two-year payment increases to certain providers for primary care services as specified in the Affordable Care Act and 42 CFR sections 438 and 447, and how to notice effected providers regarding retroactive eligibility. There were also several “Dear Provider” e-mails sent to provide updated information on the Medicaid program. Issues addressed in the “Dear Provider” e-mails included the following: • Information regarding changes in FFS provider payment rates;
• Information regarding quarterly changes to the electronic Report Guide for the contract covering the period September 1, 2012 through August 31, 2015;
• Guidance related to unique identification of providers for encounter data, including physician

65
attestation information regarding the Affordable Care Act primary care physician fee increase to Medicare levels;
• Clarification regarding Florida Medicaid percentiles against which the health plans’ Performance Measure Reports will be compared;
• Notice regarding the mass transferring of Universal Health Care, Inc. recipients for May 2013;
• Notice to FFS PSNs regarding changes in remittance advice file formats and testing related to such; and
• Notices regarding upcoming meetings relative to rate setting for the 2013-14 contract year. Technical and Operational Issues Conference Calls During this quarter, the Agency conducted two Technical and Operational Issues conference calls with health plans and health plan applicants. Approximately 20 participants attended in person and the popularity of these calls continues to be shown by over 150 phone lines in active use on the calls. The agenda items discussed on this quarter’s calls were as follows: • Direct secure messaging update;
• Legislative update;
• Diagnosis-Related Groups (DRG) implementation updates;
• Encounter data technical assistance update;
• 2013-14 contract year capitation rate development update;
• Update regarding the transition of Universal Health Care, Inc., enrollment;
• Statewide Medicaid Managed Care long-term care regional implementation update;
• Universal Health Care, Inc., transition of enrollment update; and
• Updates on the implementation of the Affordable Care Act primary care physician fee increase.
FFS PSN Systems Implementation Issues Conference Calls There were four calls held during this quarter, attended by over 40 participants. A summary of key items addressed on this call included the following: • Revisions requested by the PSNs in terms of the electronic remittance advice that they
receive and testing of the new file format; and
• Claims processing changes currently in the queue. In addition to these calls, the Agency continued to coordinate technical assistance between specific providers and their PSNs to assist providers in getting their claims issues addressed. However, while this function is still available, it has been needed only occasionally. Modification of the current claims process (to streamline the claims processing function) for FFS PSNs remains under consideration.

66
General Amendment/Contract Overview/Training Calls and Meetings During this quarter, the Agency held several meetings/training calls regarding the Medicaid Health Plan Contract: • Statewide managed care behavioral health meeting held April 24, 2013, regarding national
outcome measures, assisted living facility issues, court-ordered inpatient admissions, emergency admissions and transition of service authorizations;
• Webinar on June 9, 2013, with Medicaid health plans to discuss provider preventable conditions and how these are treated under FFS Medicaid;
• Webinar presentation on May 13, 2013, of contract highlights related to fraud and abuse prevention; and
• Quarterly fraud and abuse meeting as discussed below.
Fraud and Abuse Meetings The Agency held a fraud and abuse meeting on June 13, 2013 for all health plans. The training was located in Tallahassee, Florida, at the Agency’s headquarters. The fraud and abuse meeting included the following: • Presentations by the Agency on current program integrity projects, Medicaid Health Plan
Contract provisions and reporting requirements;
• Government agencies sharing about processes that are integral to the health plans’ anti-fraud efforts;
• Discussion about operational issues (Agency site visits, provision of information regarding terminated providers, provider registration processes);
• Health plan best practices; and
• Health plans sharing concerns or needs about more effectively addressing fraud. Over 65 persons attended the training, with representation from most Medicaid health plans. The next meeting is tentatively scheduled for September 2013 in Tampa, Florida.
Remainder of page intentionally left blank.

67
Attachment I PSN Complaints/Issues
PSN Complaints/Issues (April 1, 2013 – June 30, 2013)
PSN Informal Issue Action Taken 1. A PSN enrollee experienced issues in obtaining
a timely appointment. The PSN contacted the enrollee’s Primary Care Provider (PCP) and made arrangements for an appointment.
2. A PSN enrollee was unable to receive authorization for a specialized procedure.
The PSN authorized the procedure.
3. A PSN enrollee complained about authorization for necessary dental services.
The PSN authorized the services and made arrangements for an appointment.
4. A PSN enrollee complained that they were being balance billed for services.
The PSN found an error in the member’s files, corrected the files and withdrew charges to the enrollee.
5. A PSN enrollee experienced difficulty in obtaining authorization for services.
The PSN contacted the enrollee and clarified that the enrollee had exceeded the number of allowed visits per year.
6. A PSN enrollee needed assistance in having medical equipment repaired.
The PSN made arrangements to have the equipment repaired, but was unable to contact the enrollee prior to the time of the repair.
7. A provider complained that a PSN had not paid claims.
The PSN contacted the provider and clarified that claims had been paid.
8. A PSN enrollee experienced difficulty in obtaining new medical equipment after their current equipment was lost during an emergency hospital visit.
The PSN made arrangements for replacement equipment prior to the enrollee’s discharge from the hospital.
9. A PSN enrollee complained that after being unexpectedly switched to a new plan, their new PCP was inadequate.
The PSN authorized the use of the enrollee’s former PCP.

68
Attachment II HMO Complaints/Issues
HMO Complaints/Issues (April 1, 2013 – June 30, 2013)
HMO Informal Issue Action Taken 1. An HMO enrollee was unable to obtain
medication. The HMO contacted the enrollee and authorized the medication.
2. The parent of an HMO enrollee needed assistance in finding an in-network dental provider.
The HMO contacted the parent and gave contact information for three dental providers in their network.
3. An HMO enrollee complained about being unexpectedly placed into a new plan under which their PCP does not participate.
The HMO authorized the use of the PCP under the current plan.
4. The parent of an HMO enrollee complained that they were being billed by a hospital for services.
The HMO contacted the hospital and ended the billing to the parent.
5. An HMO enrollee was unable to receive authorization for surgery.
The HMO assisted the enrollee in obtaining medical appointments and in filing for an authorization.
6. An HMO enrollee complained about obtaining authorization for dental services.
The HMO authorized the services.
7. An HMO enrollee needed assistance in receiving authorization for a surgical procedure.
The HMO attempted to reach out to the enrollee, but was unsuccessful. There were no authorization requests on file for the enrollee.
8. An HMO enrollee was denied refills of medication.
The HMO authorized the refill of medication.
9. An HMO enrollee was billed by a hospital for services.
The HMO corrected the enrollee’s files and advised the enrollee that it was unnecessary to pay the bill.
10. An HMO enrollee complained that they were switched to a new plan under which their current PCP was not authorized.
The HMO authorized the use of the enrollee’s current PCP.
11. An HMO enrollee was unable to receive authorization for necessary services.
The HMO attempted to assist the enrollee, but the complaint was closed because the enrollee was non-compliant.
12. An HMO enrollee needed assistance in obtaining medical appointments with a specialist.
The HMO assisted the enrollee in scheduling an appointment.
13. The parent of an HMO enrollee was incorrectly billed for services.
The HMO corrected the enrollee’s files and adjusted the bill.

69
HMO Complaints/Issues (April 1, 2013 – June 30, 2013)
HMO Informal Issue Action Taken 14. An HMO enrollee complained that they were
unable to receive authorization for a necessary dental procedure.
The HMO authorized the dental procedure.
15. An HMO enrollee complained about being billed for services.
The HMO contacted the provider and processed the claims for payment.
16. An HMO complained that they were unexpectedly switched to a new plan and were unable to obtain appointments with their current PCP.
The HMO authorized the PCP under the new plan.
17. Upon hospitalization, an HMO enrollee was concerned that they would be switched to an out-of-state hospital for a special procedure.
The HMO verified that the enrollee would be able to remain in-state to obtain the procedure.
18. An HMO enrollee needed assistance in receiving a medical scan for a heart condition.
The HMO assisted the enrollee in scheduling an appointment for the scan.

70
Attachment III 2008 – 2012 Managed Care Performance Measures
Non-Reform Plans* Reform Plans*
Measure 2008 2009 2010 2011 2012 Trend 2008 2009 2010 2011 2012 Trend National
Mean** Annual Dental Visit*** n/a n/a n/a 16.1% 17.6% increase 15.2% 28.5% 33.4% 34.0% 35.3% increase 45.8% Adolescent Well-Care 41.9% 46.0% 45.7% 49.2% 48.2% drop 44.2% 46.5% 46.3% 46.2% 47.6% increase 49.7% Controlling Blood Pressure 52.7% 51.6% 53.0% 54.3% 51.5% flat 46.3% 55.9% 53.4% 46.3% 52.9% increase 56.8% Cervical Cancer Screening 56.6% 53.8% 55.3% 55.6% 55.0% flat 48.2% 52.2% 50.8% 53.2% 56.8% increase 66.6% Diabetes - HbA1c Testing 74.7% 75.1% 76.4% 79.6% 77.3% drop 78.9% 80.1% 82.8% 81.9% 82.2% flat 82.4% Diabetes - HbA1c Poor Control (INVERSE) 48.5% 51.7% 46.4% 42.5% 46.6% drop 48.3% 46.8% 44.9% 48.6% 43.6% increase 43.2% Diabetes - HbA1c Good Control 31.7% 41.4% 44.6% 49.6% 45.5% drop 32.2% 48.0% 47.5% 43.7% 47.9% increase 48.0% Diabetes - Eye Exam 36.3% 41.9% 48.3% 52.1% 45.2% drop 35.7% 44.0% 45.4% 49.3% 50.2% flat 53.2% Diabetes - LDL Screening 75.6% 76.3% 77.9% 80.0% 77.4% drop 80.0% 80.2% 83.5% 81.8% 81.9% flat 74.9% Diabetes - LDL Control 29.5% 29.4% 33.8% 32.8% 34.2% increase 29.3% 35.5% 36.1% 36.9% 37.8% flat 35.2% Diabetes - Nephropathy 77.1% 76.1% 77.1% 79.0% 77.7% drop 79.2% 80.3% 81.9% 83.1% 82.3% flat 77.8% Follow-up after Hospitalization for Mental Illness - 7 day 30.5% 37.0% 24.2% 28.4% 37.5% increase 20.6% 29.3% 25.4% 23.1% 22.7% flat 46.5% Follow-up after Hospitalization for Mental Illness - 30 day 47.0% 51.9% 41.4% 47.9% 56.5% increase 35.5% 46.6% 41.3% 44.3% 41.2% drop 65.0% Prenatal Care 71.7% 69.1% 69.5% 71.7% 73.1% increase 66.6% 67.4% 75.2% 68.4% 72.1% increase 82.7% Postpartum Care 58.5% 50.1% 52.7% 54.6% 51.8% drop 53.0% 51.5% 52.1% 49.3% 52.9% increase 64.1% Well-Child First 15 Months. - 0 Visits (INVERSE) 2.8% 3.0% 4.2% 3.3% 3.2% flat 4.9% 1.6% 6.0% 3.0% 2.1% increase 2.0% Well-Child First 15 Mos. - 6(+) Visits 44.0% 51.0% 46.1% 51.2% 56.2% increase 44.4% 49.3% 35.4% 46.5% 58.4% increase 61.7% Well-Child 3-6 Years 71.1% 72.5% 74.9% 74.8% 75.6% flat 71.3% 75.7% 72.7% 75.0% 75.5% flat 71.9% Adults' Access to Preventive Care - 20-44 Years n/a 69.1% 67.9% 68.1% 66.2% drop n/a 71.8% 71.2% 71.2% 69.8% drop 79.9% Adults' Access to Preventive Care - 45-64 Years n/a 82.2% 81.2% 81.5% 80.5% drop n/a 84.7% 84.9% 85.5% 84.9% flat 85.9% Adults' Access to Preventive Care - 65+ Years n/a 74.7% 66.9% 69.9% 64.1% drop n/a 83.6% 83.7% 84.2% 73.9% drop 83.3%

71
Non-Reform Plans* Reform Plans*
Measure 2008 2009 2010 2011 2012 Trend 2008 2009 2010 2011 2012 Trend National
Mean** Adults' Access to Preventive Care - total n/a 73.7% 71.5% 71.9% 69.9% drop n/a 77.2% 77.6% 77.0% 75.0% drop 81.8% Antidepressant Medication Mgmt - Acute n/a 45.6% 46.8% 47.0% 50.4% increase n/a 52.0% 56.3% 56.3% 57.4% increase 51.1% Antidepressant Medication Mgmt - Continuation n/a 31.2% 29.2% 31.4% 33.6% increase n/a 29.8% 43.8% 44.0% 43.1% flat 34.4% Appropriate Medications for Asthma**** n/a 87.0% 87.0% 86.6% 82.1% drop n/a 83.6% 87.6% 86.0% 81.1% drop 85.0% Breast Cancer Screening n/a 47.5% 50.1% 50.9% 50.1% flat n/a 51.4% 56.9% 59.2% 52.3% drop 50.4% Childhood Immunization Combo 2 n/a 61.8% 71.4% 73.8% 79.1% increase n/a 63.6% 70.0% 74.0% 74.8% flat 74.5% Childhood Immunization Combo 3 n/a 52.0% 63.7% 67.6% 72.8% increase n/a 53.8% 62.7% 66.9% 69.2% increase 70.7% Frequency of Prenatal Care n/a 51.6% 54.3% 60.6% 60.2% flat n/a 52.6% 46.9% 44.0% 54.4% increase 60.9% Lead Screening in Children n/a 46.0% 53.1% 53.5% 59.5% increase n/a 54.8% 52.0% 54.1% 59.6% increase 67.7% Adult BMI Assessment n/a n/a 31.2% 48.3% 58.6% increase n/a n/a 41.9% 52.7% 47.9% drop 52.6% Follow-up Care for Children Prescribed ADHD Medication - Initiation n/a n/a 37.8% 37.1% 40.8% increase n/a n/a 43.6% 44.5% 44.4% flat 38.8% Follow-up Care for Children Prescribed ADHD Medication - Continuation***** n/a n/a 46.6% 46.7% 54.8% increase n/a n/a n/a n/a n/a N/A 45.9% Immunizations for Adolescents Combo 1 n/a n/a 43.9% 50.2% 56.1% increase n/a n/a 44.1% 43.6% 47.3% increase 60.4%
* Data are submitted to the Agency by HMOs and PSNs and are audited by NCQA-certified HEDIS auditors. Data do not include Medicaid FFS or MediPass. Each rate presented for Non-Reform (and for Reform) is the weighted mean across Non-Reform (and Reform) health plans, weighted by the number of eligible members each plan has per measure.
** National Mean as published by NCQA, Medicaid product line. The National Mean that is presented is the National Mean for 2012.
*** Annual Dental Visits - only seven of 21 Non-Reform plans cover dental services. Only six of the plans had sufficient denominators to report on this measure in 2012.
**** The specifications for the Appropriate Medications for People with Asthma measure changed this year; therefore, it may not be appropriate to compare results reported in 2012 to prior years.
*****Follow-up Care for Children Prescribed ADHD Medication - Continuation: only three of the 13 Reform plans had sufficient eligible members to report this measure; therefore, no weighted mean has been calculated.

This page intentionally left blank


