Rebuild Florida CDBG-Mitigation General Infrastructure Program

Florida DEO Irma CDBG-DR CDBG-DR Application Form DR-IIN01
LOCAL GOVERNMENT INFORMATION
Local Government Applicant:Eligible
County:
Local Contact: DUNS #:
Title: E‐mail:
Mailing Street Address:Phone
Number
City: State: Zip Code:
Executive Official with
Authority to Sign Application:
Phone
Number
Title: E‐mail:
Executive Official Address
(if different):
City: State: Zip Code:
Yes: No: APPLICATION PREPARER INFORMATION
Application Preparation
Agency or Firm:
Contact:
Address:
Phone Number: Email:
Private Firm: Government Agency: Regional Planning Council: Other, specify:
APPLICATION INFORMATION
Yes: No: Yes: No: Please confirm the proposed activities are consistent with the local
comprehensive plan?
Please confirm the local government covered by the National Flood
Insurance Program?
Please confirm you submited a signed resolution authorizing Executive
Official to sign application and certifications.
List jurisdictions for proposed recovery activities
(municipalities, Tribal governments, unincorporated areas):
APPLICANT INFORMATION FORM
Check Type of Agency
Preparing Application:
Total CDBG‐DR $ Requested:
Please list any other UGLG members of this Application
Team, if any:Contact Person: Email Address:
73C-23.0081, FACPage 1 of 1
Florida DEO Irma CDBG-DR Application Form DR-IIN01
Date:
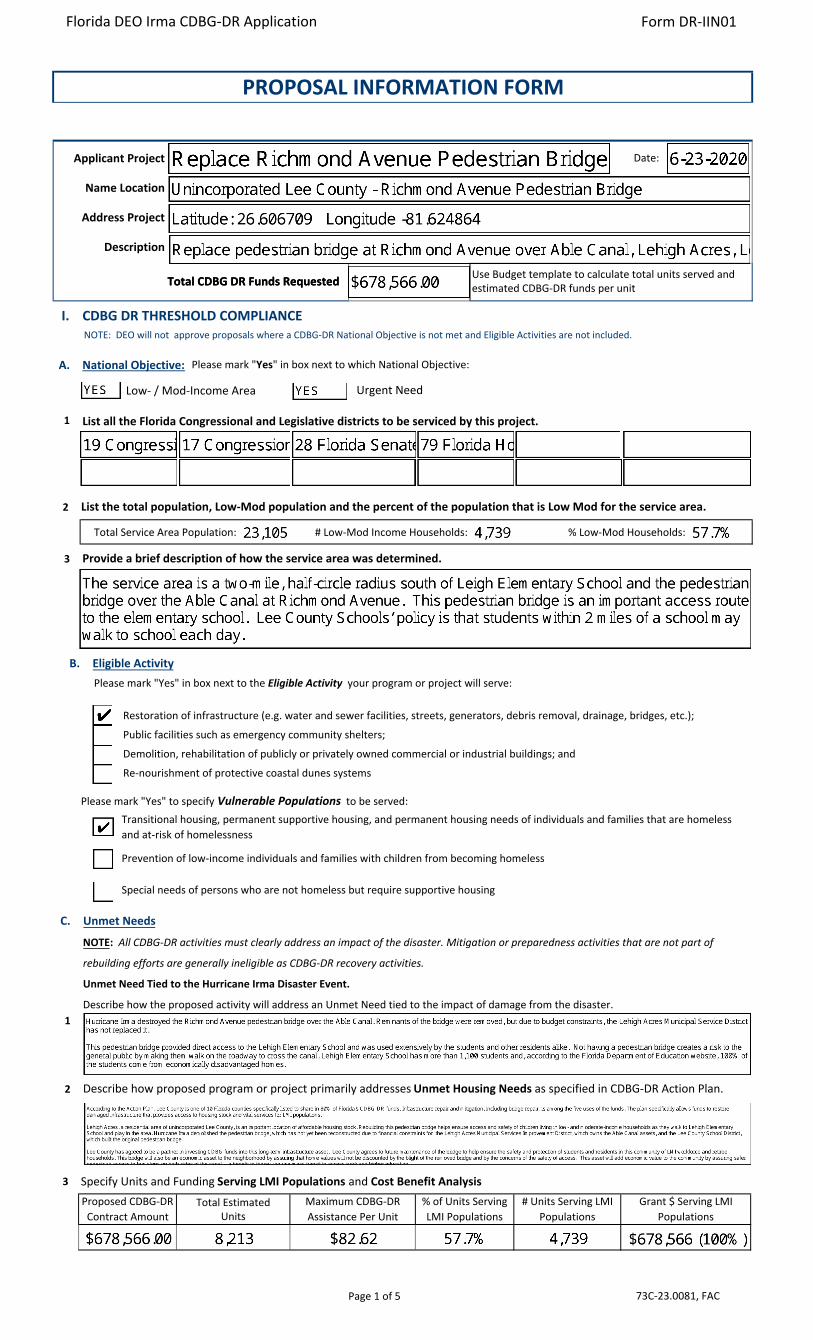
A. National Objective:
Low‐ / Mod‐Income Area Urgent Need
1
2
Total Service Area Population: # Low‐Mod Income Households: % Low‐Mod Households:
3
Please mark "Yes" to specify Vulnerable Populations to be served:
Restoration of infrastructure (e.g. water and sewer facilities, streets, generators, debris removal, drainage, bridges, etc.);
Public facilities such as emergency community shelters;
Demolition, rehabilitation of publicly or privately owned commercial or industrial buildings; and
Re‐nourishment of protective coastal dunes systems
Transitional housing, permanent supportive housing, and permanent housing needs of individuals and families that are homeless
and at‐risk of homelessness
Prevention of low‐income individuals and families with children from becoming homeless
Special needs of persons who are not homeless but require supportive housing
B. Eligible ActivityPlease mark "Yes" in box next to the Eligible Activity your program or project will serve:
List the total population, Low‐Mod population and the percent of the population that is Low Mod for the service area.
Provide a brief description of how the service area was determined.
Use Budget template to calculate total units served and estimated CDBG-DR funds per unit
I. CDBG DR THRESHOLD COMPLIANCE
Please mark "Yes" in box next to which National Objective:
List all the Florida Congressional and Legislative districts to be serviced by this project.
PROPOSAL INFORMATION FORM
73C-23.0081, FACPage 1 of 5
I I
I I
n
Total Total CDBGCDBG DRDR FundsFunds RequestedRequested
Applicant Project
Name Location
Address Project
Description
NOTE: DEO will not approve proposals where a CDBG-DR National Objective is not met and Eligible Activities are not included.
C.
1
2 Describe how proposed program or project primarily addresses Unmet Housing Needs as specified in CDBG‐DR Action Plan.
Unmet Needs
NOTE: All CDBG‐DR activities must clearly address an impact of the disaster. Mitigation or preparedness activities that are not part of
rebuilding efforts are generally ineligible as CDBG‐DR recovery activities.
Unmet Need Tied to the Hurricane Irma Disaster Event.
Describe how the proposed activity will address an Unmet Need tied to the impact of damage from the disaster.
3 Specify Units and Funding Serving LMI Populations and Cost Benefit AnalysisProposed CDBG‐DR
Contract AmountTotal Estimated
Units
Maximum CDBG‐DR
Assistance Per Unit
% of Units Serving
LMI Populations
# Units Serving LMI
Populations
Grant $ Serving LMI
Populations
Florida DEO Irma CDBG-DR Application Form DR-IIN01
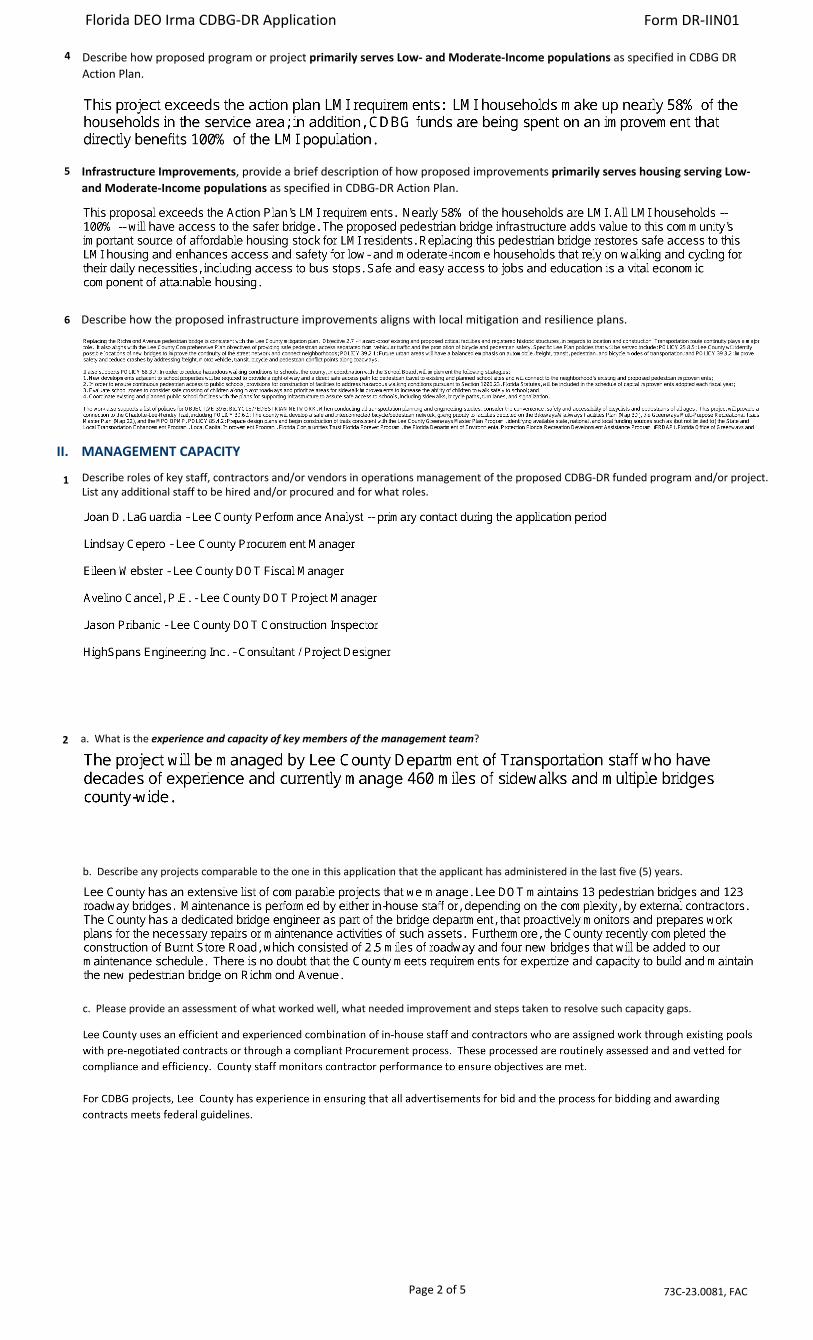
4
5
Describe how the proposed infrastructure improvements aligns with local mitigation and resilience plans.
Describe how proposed program or project primarily serves Low‐ and Moderate‐Income populations as specified in CDBG DR Action Plan.
Infrastructure Improvements, provide a brief description of how proposed improvements primarily serves housing serving Low‐
and Moderate‐Income populations as specified in CDBG‐DR Action Plan.
73C-23.0081, FACPage 2 of 5
I I I
II.
1
MANAGEMENT CAPACITY
Describe roles of key staff, contractors and/or vendors in operations management of the proposed CDBG-DR funded program and/or project. List any additional staff to be hired and/or procured and for what roles.
2 a. What is the experience and capacity of key members of the management team?
b. Describe any projects comparable to the one in this application that the applicant has administered in the last five (5) years.
6
c. Please provide an assessment of what worked well, what needed improvement and steps taken to resolve such capacity gaps.
Florida DEO Irma CDBG-DR Application Form DR-IIN01
3
4
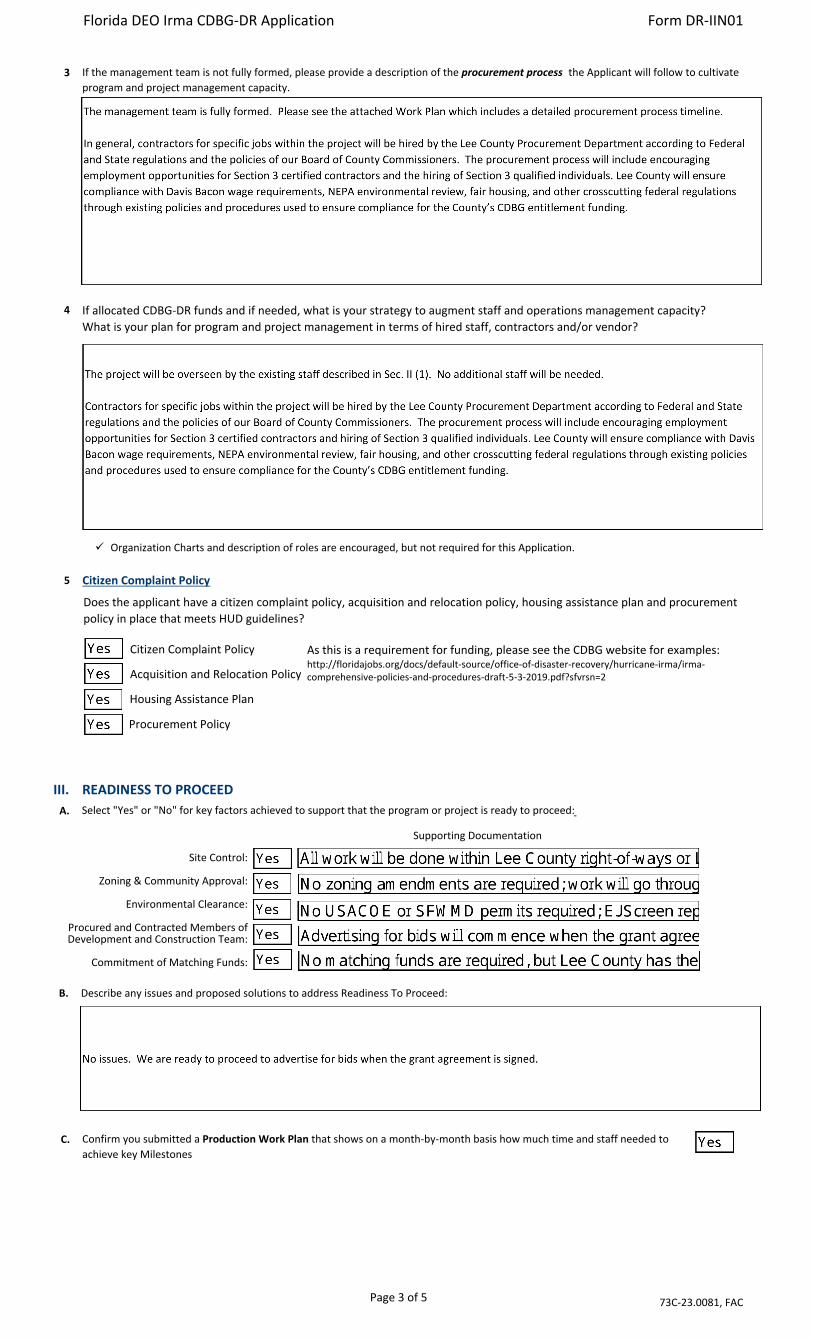
5 Citizen Complaint Policy
If the management team is not fully formed, please provide a description of the procurement process the Applicant will follow to cultivate program and project management capacity.
If allocated CDBG‐DR funds and if needed, what is your strategy to augment staff and operations management capacity?
What is your plan for program and project management in terms of hired staff, contractors and/or vendor?
73C-23.0081, FACPage 3 of 5
Citizen Complaint Policy
Acquisition and Relocation Policy
Housing Assistance Plan
Procurement Policy
Does the applicant have a citizen complaint policy, acquisition and relocation policy, housing assistance plan and procurement
policy in place that meets HUD guidelines?
As this is a requirement for funding, please see the CDBG website for examples:http://floridajobs.org/docs/default-source/office-of-disaster-recovery/hurricane-irma/irma-comprehensive-policies-and-procedures-draft-5-3-2019.pdf?sfvrsn=2
III. READINESS TO PROCEEDA. Select "Yes" or "No" for key factors achieved to support that the program or project is ready to proceed:
Site Control:
Zoning & Community Approval:
Environmental Clearance:
Procured and Contracted Members of Development and Construction Team:
Commitment of Matching Funds:
Supporting Documentation
B. Describe any issues and proposed solutions to address Readiness To Proceed:
C. Confirm you submitted a Production Work Plan that shows on a month‐by‐month basis how much time and staff needed to
achieve key Milestones
Organization Charts and description of roles are encouraged, but not required for this Application.
Florida DEO Irma CDBG-DR Application Form DR-IIN01
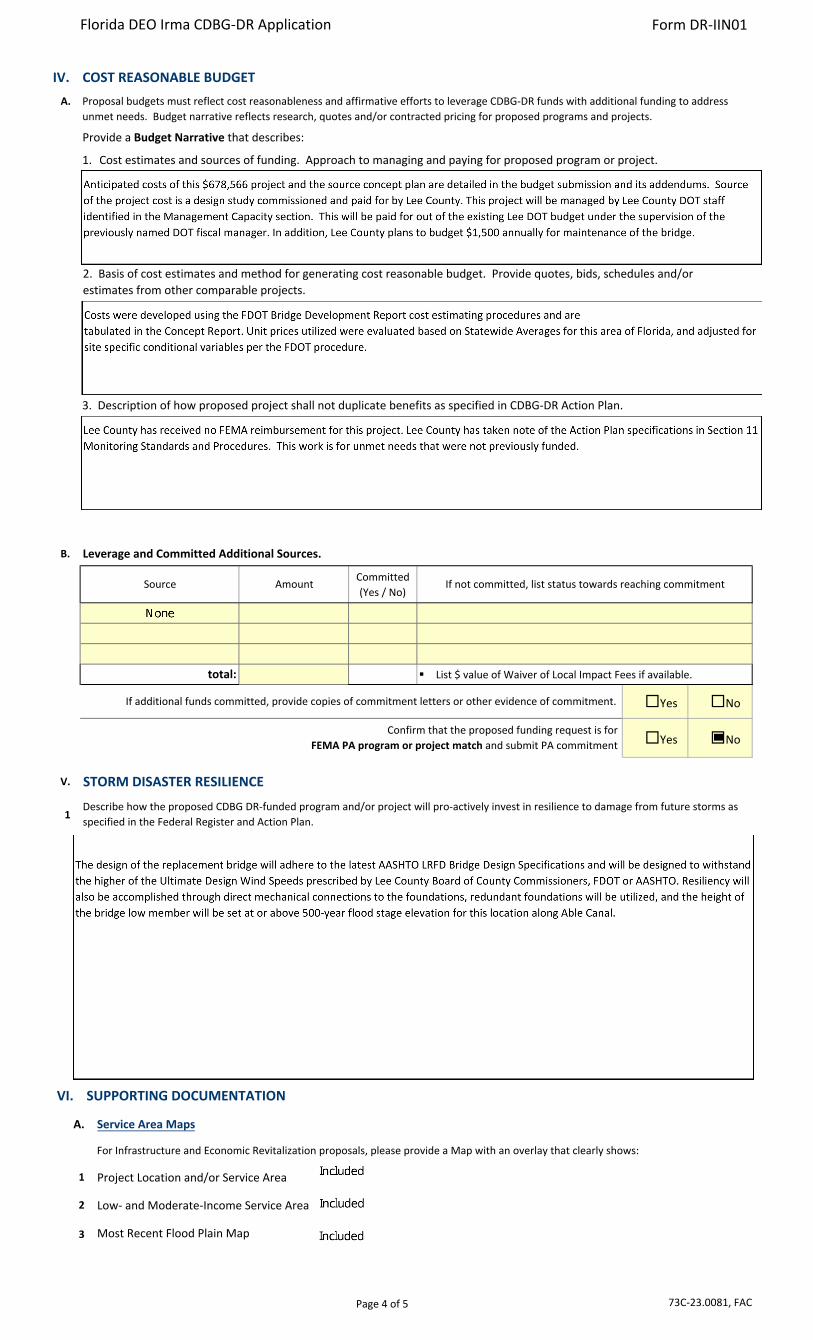
IV. COST REASONABLE BUDGETA.
B. Leverage and Committed Additional Sources.
Committed
(Yes / No)
List $ value of Waiver of Local Impact Fees if available.
Yes No
Yes No
total:
If additional funds committed, provide copies of commitment letters or other evidence of commitment.
Confirm that the proposed funding request is for
FEMA PA program or project match and submit PA commitment
Source Amount If not committed, list status towards reaching commitment
Proposal budgets must reflect cost reasonableness and affirmative efforts to leverage CDBG‐DR funds with additional funding to address
unmet needs. Budget narrative reflects research, quotes and/or contracted pricing for proposed programs and projects.
Provide a Budget Narrative that describes:
1. Cost estimates and sources of funding. Approach to managing and paying for proposed program or project.
73C-23.0081, FACPage 4 of 5
I I
3. Description of how proposed project shall not duplicate benefits as specified in CDBG‐DR Action Plan.
2. Basis of cost estimates and method for generating cost reasonable budget. Provide quotes, bids, schedules and/or
estimates from other comparable projects.
V.
1
STORM DISASTER RESILIENCE
Describe how the proposed CDBG DR‐funded program and/or project will pro‐actively invest in resilience to damage from future storms as specified in the Federal Register and Action Plan.
VI. SUPPORTING DOCUMENTATION
A.
1
2
3
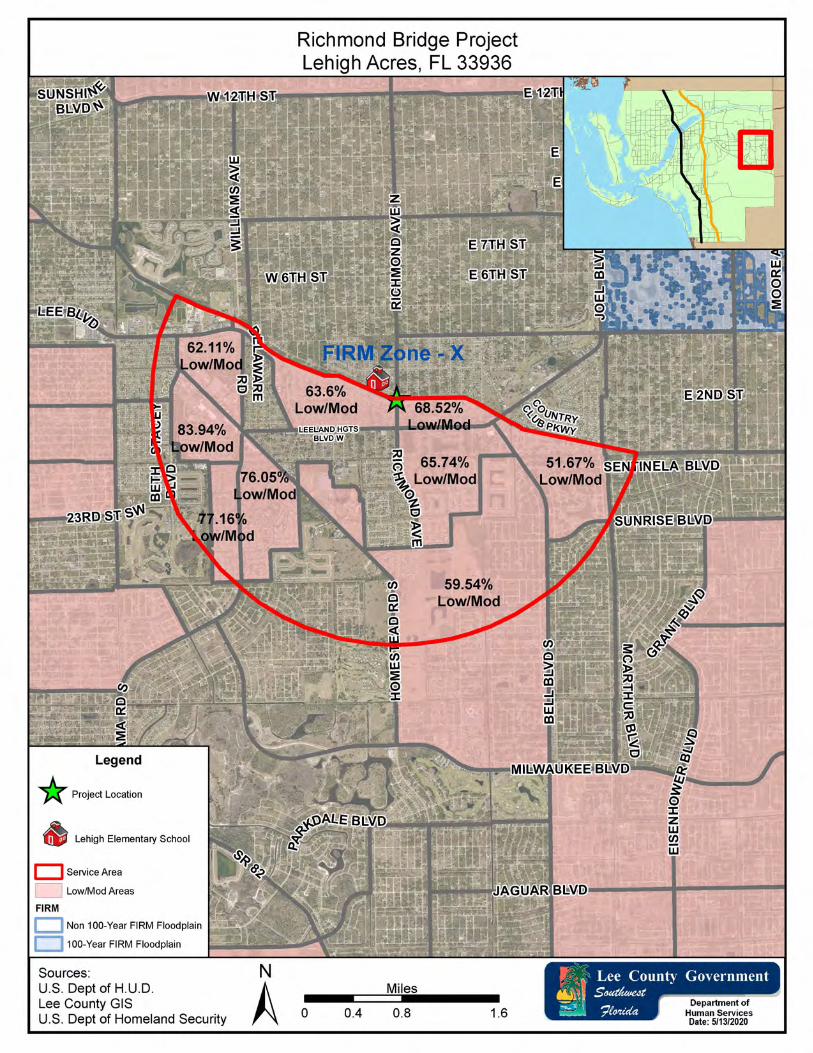
Service Area Maps
For Infrastructure and Economic Revitalization proposals, please provide a Map with an overlay that clearly shows:
Project Location and/or Service Area
Low- and Moderate-Income Service Area
Most Recent Flood Plain Map

Sign :
Name: Date
Describe any other regulatory reviews such as Federal or State review or regulatory system which may have jurisdiction over the proposed
activity(s), such as, federal programs of the Corps of Engineers and the Environmental Protection Agency; and State programs.
As authorized Executive Officer, I certify that staff, contractors, vendors and community partners of our storm recovery initiative:
Will comply with all HUD and Florida requirements in the administration of the proposed CDBG DR funded activities;
Will work in a cooperative manner to execute the Subrecipient Agreement that provides the pathway for successful CDBG DR
program(s) and/or project(s) and;
Certify that all information submitted in this Application is true and accurate.
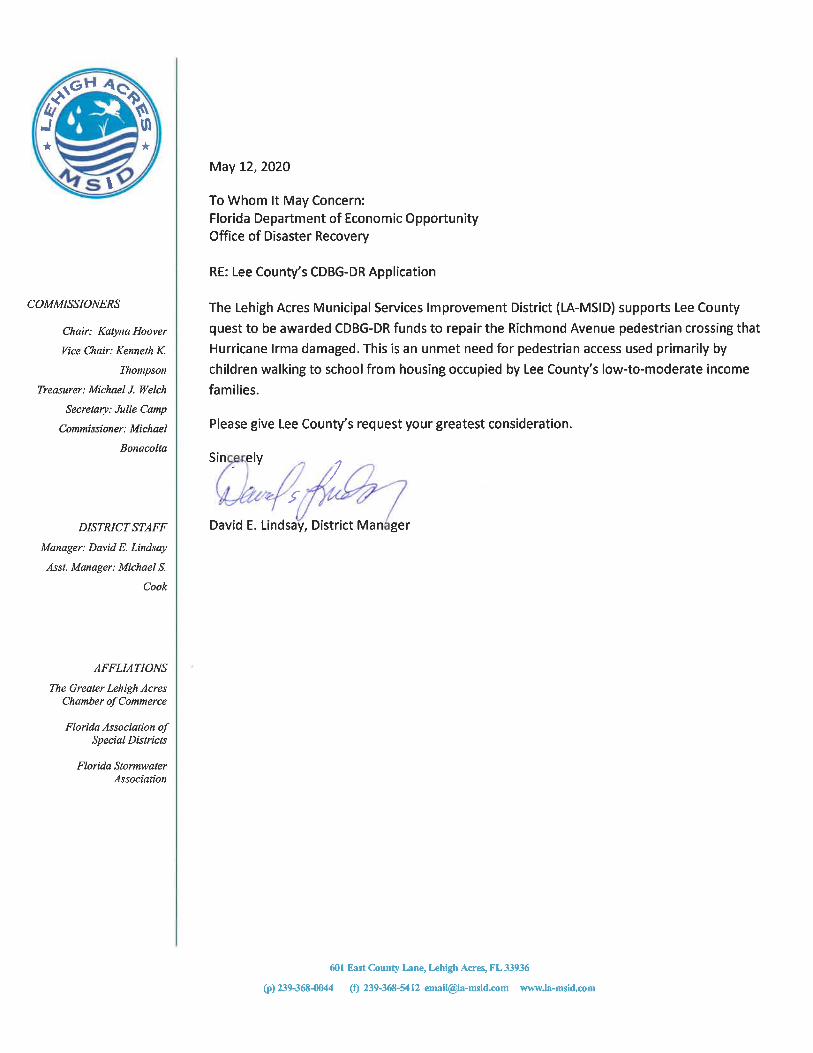
The bridge is owned by the Lehigh Acres Municipal Services Improvement District, an independent authority. Lee County has agreed to take responsibility for maintenance of the bridge. The County, LAMSID and Lee County Schools District will negotiate to cover the cost of future capital needs. A LETTER OF SUPPORT FROM LAMSID IS SUBMITTED AS AN ADDENDUM TO THIS PROPOSAL FORM.
Roger DesjarlaisDigitally signed by Roger DesjarlaisDate: 2020.06.24 12:00:38 -04'00'
6/24/20
Roger Desjarlais

State
Percentile
EPA Region
Percentile
USA
Percentile
1/3
Selected Variables
EJ Index for PM2.5
EJ Index for Ozone
EJ Index for NATA* Diesel PM
EJ Index for Wastewater Discharge Indicator
EJ Indexes
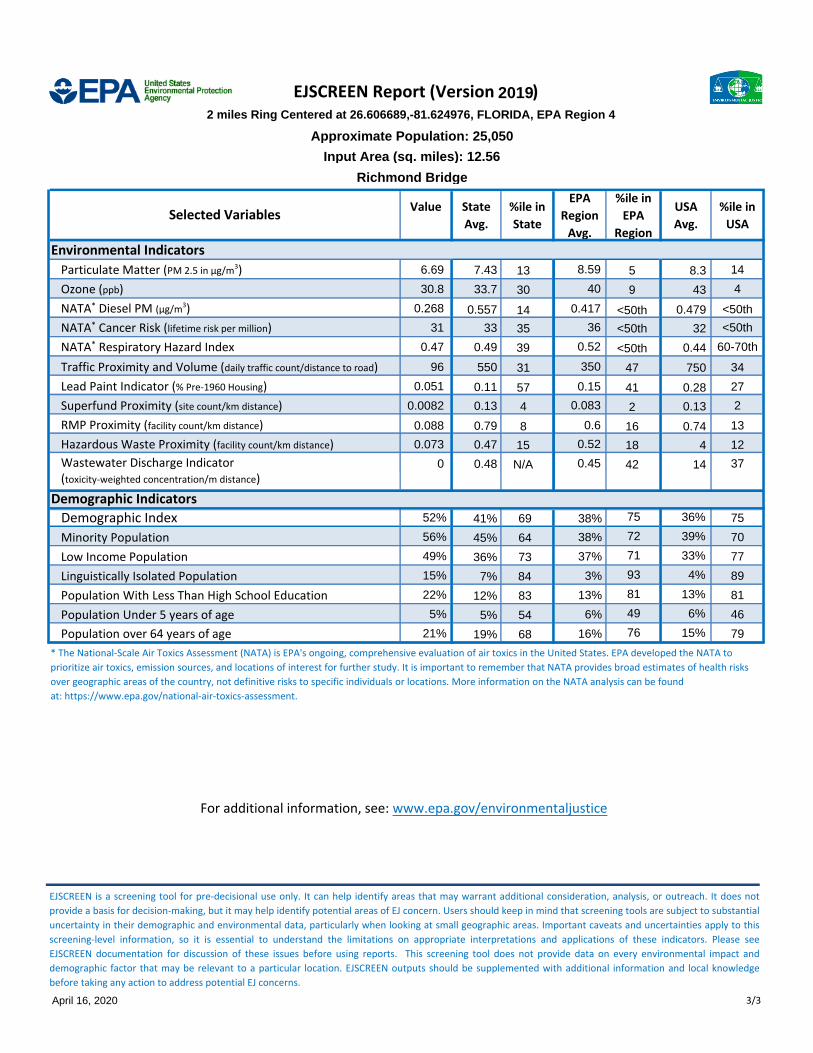
This report shows the values for environmental and demographic indicators and EJSCREEN indexes. It shows environmental and demographic raw data (e.g., the estimated concentration of ozone in the air), and also shows what percentile each raw data value represents. These percentiles provide perspective on how the selected block group or buffer area compares to the entire state, EPA region, or nation. For example, if a given location is at the 95th percentile nationwide, this means that only 5 percent of the US population has a higher block group value than the average person in the location being analyzed. The years for which the data are available, and the methods used, vary across these indicators. Important caveats and uncertainties apply to this screening-level information, so it is essential to understand the limitations on appropriate interpretations and applications of these indicators. Please see EJSCREEN documentation for discussion of these issues before using reports.
EJ Index for NATA* Air Toxics Cancer Risk
EJ Index for NATA* Respiratory Hazard Index
EJ Index for Traffic Proximity and Volume
EJ Index for Lead Paint Indicator
EJ Index for Superfund Proximity
EJ Index for RMP Proximity
EJ Index for Hazardous Waste Proximity
EJSCREEN Report (Version )
66
61
66
66
66
61
73
N/A
58
55
52
72
72
71
71
73
72
73
74
66
64
61
76
72
73
74
77
69
71
74
64
65
63
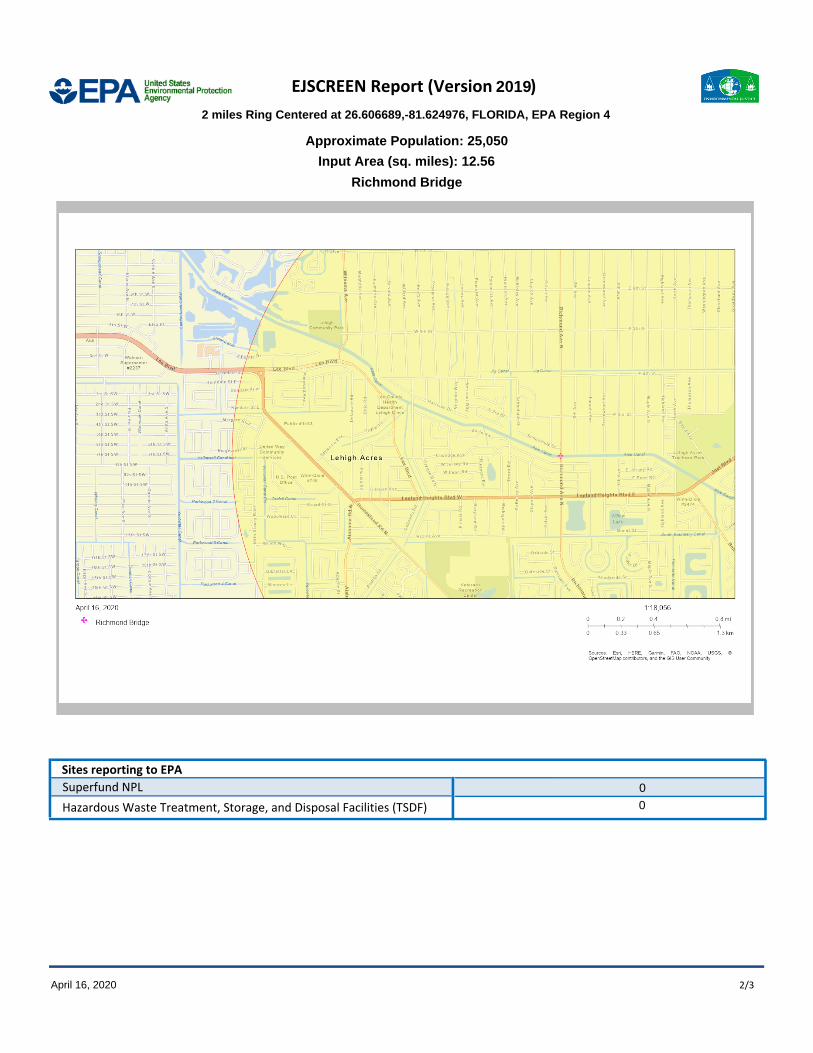
2 miles Ring Centered at 26.606689,-81.624976, FLORIDA, EPA Region 4
Approximate Population: 25,050
Richmond Bridge
April 16, 2020
Input Area (sq. miles): 12.56
2019
2/3
EJSCREEN Report (Version )
Superfund NPLHazardous Waste Treatment, Storage, and Disposal Facilities (TSDF)
Sites reporting to EPA
2 miles Ring Centered at 26.606689,-81.624976, FLORIDA, EPA Region 4
Approximate Population: 25,050
Richmond Bridge
April 16, 2020
Input Area (sq. miles): 12.56
2019
00
EJSCREEN Report (Version )
Value State
Avg.
%ile in
State
EPA
Region
Avg.
%ile in
EPA
Region
USA
Avg.
%ile in
USA
3/3
RMP Proximity (facility count/km distance)Hazardous Waste Proximity (facility count/km distance)Wastewater Discharge Indicator (toxicity-weighted concentration/m distance)
Demographic Index
Population over 64 years of age
Minority PopulationLow Income PopulationLinguistically Isolated PopulationPopulation With Less Than High School EducationPopulation Under 5 years of age
Demographic Indicators
EJSCREEN is a screening tool for pre-decisional use only. It can help identify areas that may warrant additional consideration, analysis, or outreach. It does not provide a basis for decision-making, but it may help identify potential areas of EJ concern. Users should keep in mind that screening tools are subject to substantial uncertainty in their demographic and environmental data, particularly when looking at small geographic areas. Important caveats and uncertainties apply to this screening-level information, so it is essential to understand the limitations on appropriate interpretations and applications of these indicators. Please see EJSCREEN documentation for discussion of these issues before using reports. This screening tool does not provide data on every environmental impact and demographic factor that may be relevant to a particular location. EJSCREEN outputs should be supplemented with additional information and local knowledge before taking any action to address potential EJ concerns.
For additional information, see: www.epa.gov/environmentaljustice
Selected Variables
Environmental Indicators
Particulate Matter (PM 2.5 in µg/m3)Ozone (ppb)NATA* Diesel PM (µg/m3)NATA* Cancer Risk (lifetime risk per million)NATA* Respiratory Hazard IndexTraffic Proximity and Volume (daily traffic count/distance to road)Lead Paint Indicator (% Pre-1960 Housing)Superfund Proximity (site count/km distance)
* The National-Scale Air Toxics Assessment (NATA) is EPA's ongoing, comprehensive evaluation of air toxics in the United States. EPA developed the NATA to prioritize air toxics, emission sources, and locations of interest for further study. It is important to remember that NATA provides broad estimates of health risks over geographic areas of the country, not definitive risks to specific individuals or locations. More information on the NATA analysis can be found at: https://www.epa.gov/national-air-toxics-assessment.
Demographic Indicators
2 miles Ring Centered at 26.606689,-81.624976, FLORIDA, EPA Region 4
Approximate Population: 25,050
Richmond Bridge
April 16, 2020
Input Area (sq. miles): 12.56
2019
30.8
6.69
0.268
0
0.073
0.088
0.0082
0.051
96
0.47
31
52%
56%
21%
5%
22%
15%
49%
33.7
7.43
0.557
0.48
0.47
0.79
0.13
0.11
550
0.49
33
41%
45%
36%
7%
12%
5%
19%
38%
38%
37%
3%
13%
6%
16%
36%
39%
33%
4%
13%
6%
15%
40
8.59
0.417
0.45
0.52
0.6
0.083
0.15
350
0.52
36
43
8.3
0.479
14
4
0.74
0.13
0.28
750
0.44
32
30
13
14
N/A
15
8
4
57
31
39
35
69
64
73
84
83
54
68
75
72
71
93
81
49
76
75
70
77
89
81
46
79
9
5
<50th
42
18
16
2
41
47
<50th
<50th
4
14
<50th
37
12
13
2
27
34
60-70th
<50th
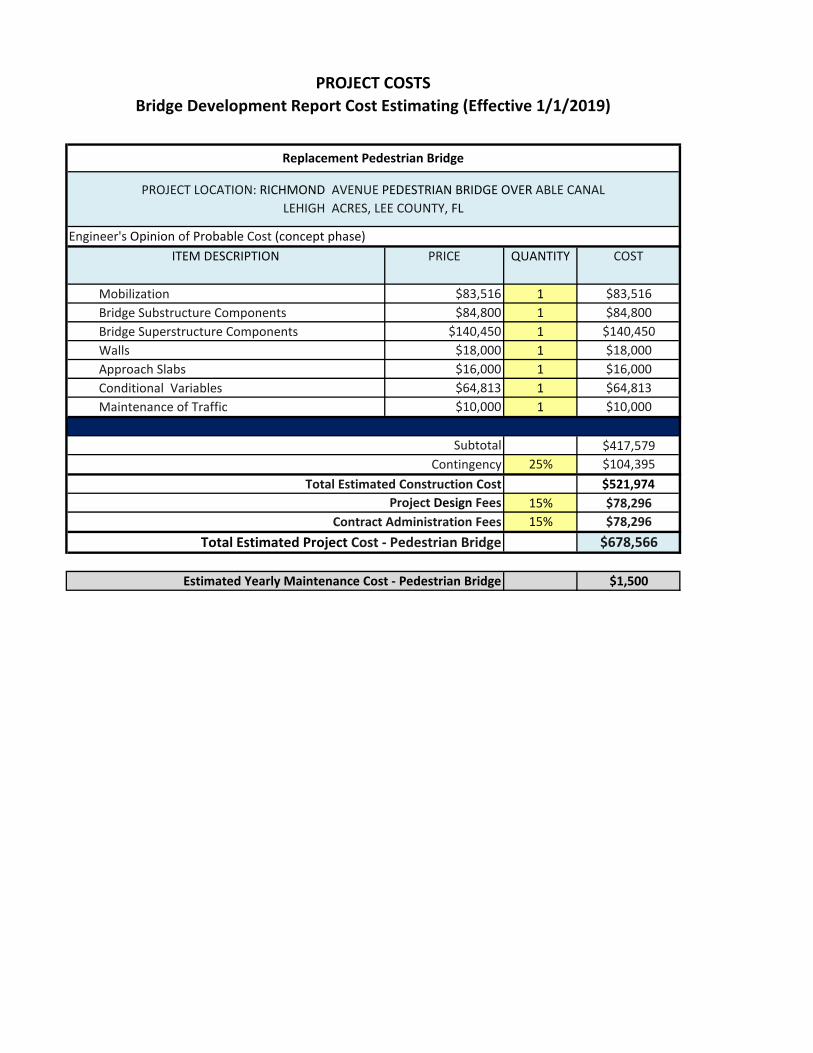
ITEM DESCRIPTION PRICE QUANTITY COST
Mobilization $83,516 1 $83,516Bridge Substructure Components $84,800 1 $84,800Bridge Superstructure Components $140,450 1 $140,450Walls $18,000 1 $18,000Approach Slabs $16,000 1 $16,000Conditional Variables $64,813 1 $64,813Maintenance of Traffic $10,000 1 $10,000
$417,57925% $104,395
$521,97415% $78,29615% $78,296
$678,566
$1,500
PROJECT COSTSBridge Development Report Cost Estimating (Effective 1/1/2019)
Engineer's Opinion of Probable Cost (concept phase)
Total Estimated Construction CostProject Design Fees
PROJECT LOCATION: RICHMOND AVENUE PEDESTRIAN BRIDGE OVER ABLE CANAL LEHIGH ACRES, LEE COUNTY, FL
Contingency
Estimated Yearly Maintenance Cost - Pedestrian Bridge
Replacement Pedestrian Bridge
Subtotal
Contract Administration FeesTotal Estimated Project Cost - Pedestrian Bridge
Page 1 of 11
Richmond Ave. Pedestrian Bridge
Bridge Concept Report
Performed for:
Lee County DOT Operations
4-2020
Vince Zaliauskas, PE 60524
HighSpans Engineering Inc.
FBPE Registry#. 27559
2121 McGregor Blvd. #200
Fort Myers, FL 33901
239-433-3000
Page 2 of 11
Table of Contents Richmond Ave. Pedestrian Bridge .................................................................................................. 1
Bridge Concept Report ................................................................................................................... 1
1. Summary .............................................................................................................................. 3
2. Project Location and Hurricane Irma Path........................................................................... 4
3. Photo of Existing Bridge (post-Irma) .................................................................................. 5
4. Concept Plans....................................................................................................................... 6
5. Summary of Anticipated Costs ............................................................................................ 9
6. Bridge Development Report Cost Details.......................................................................... 11
Page 3 of 11
1. Summary
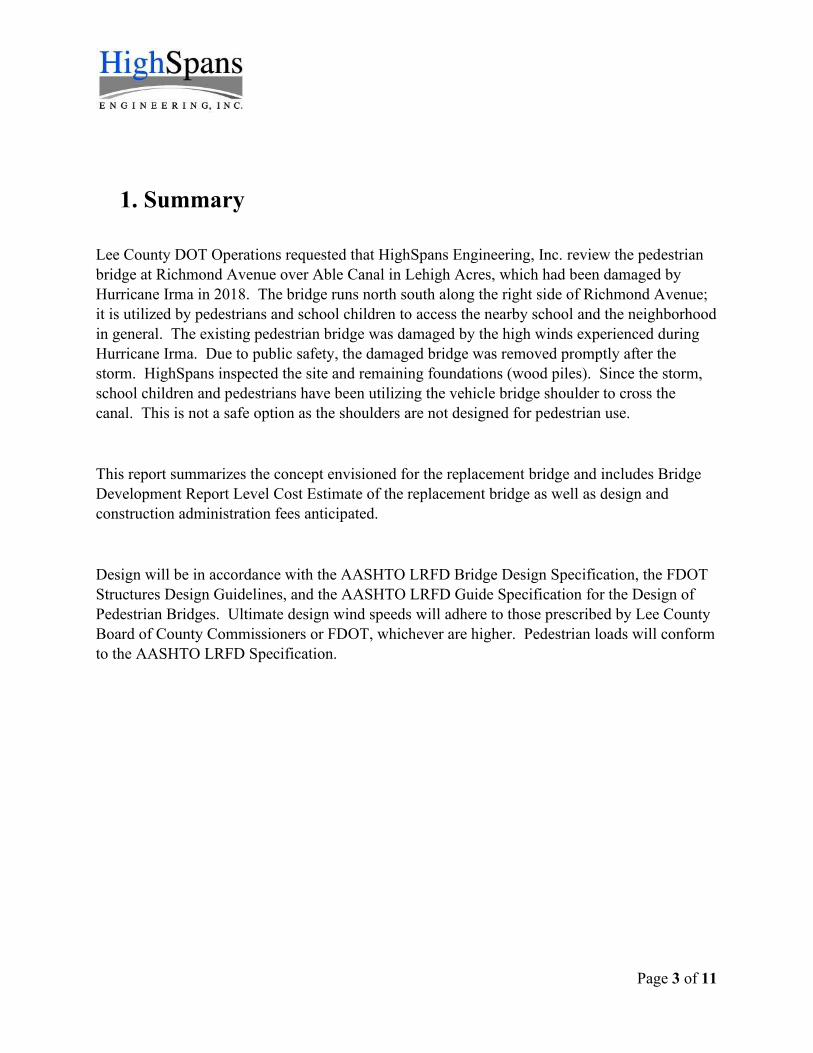
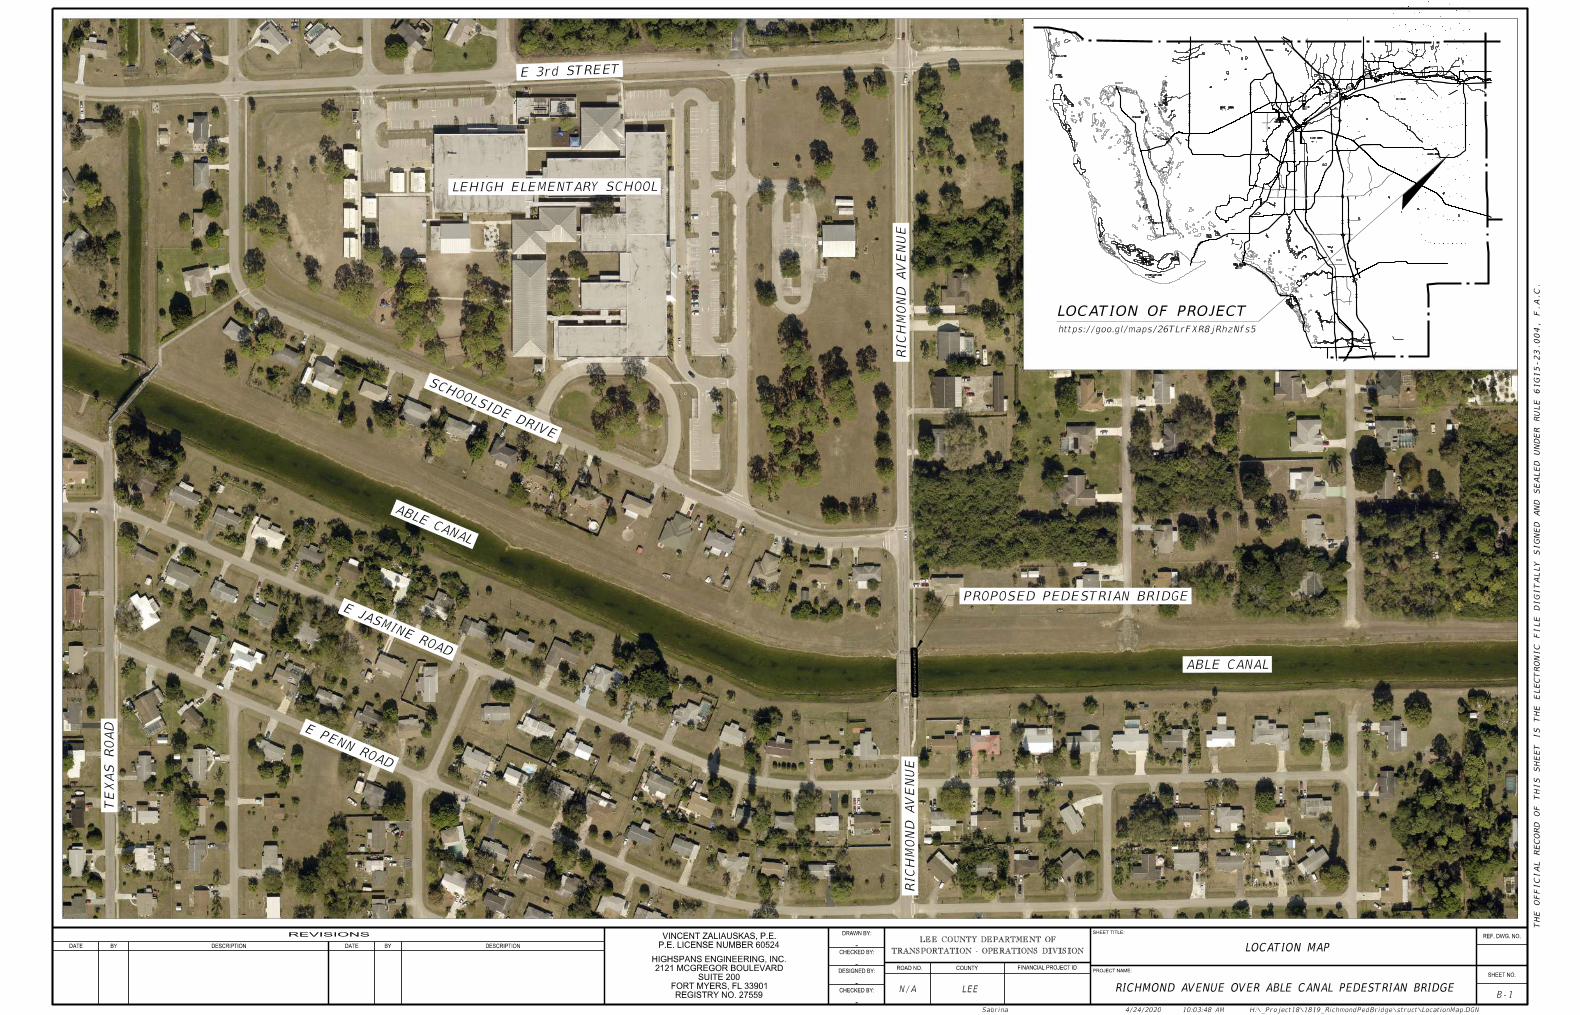
Lee County DOT Operations requested that HighSpans Engineering, Inc. review the pedestrian
bridge at Richmond Avenue over Able Canal in Lehigh Acres, which had been damaged by
Hurricane Irma in 2018. The bridge runs north south along the right side of Richmond Avenue;
it is utilized by pedestrians and school children to access the nearby school and the neighborhood
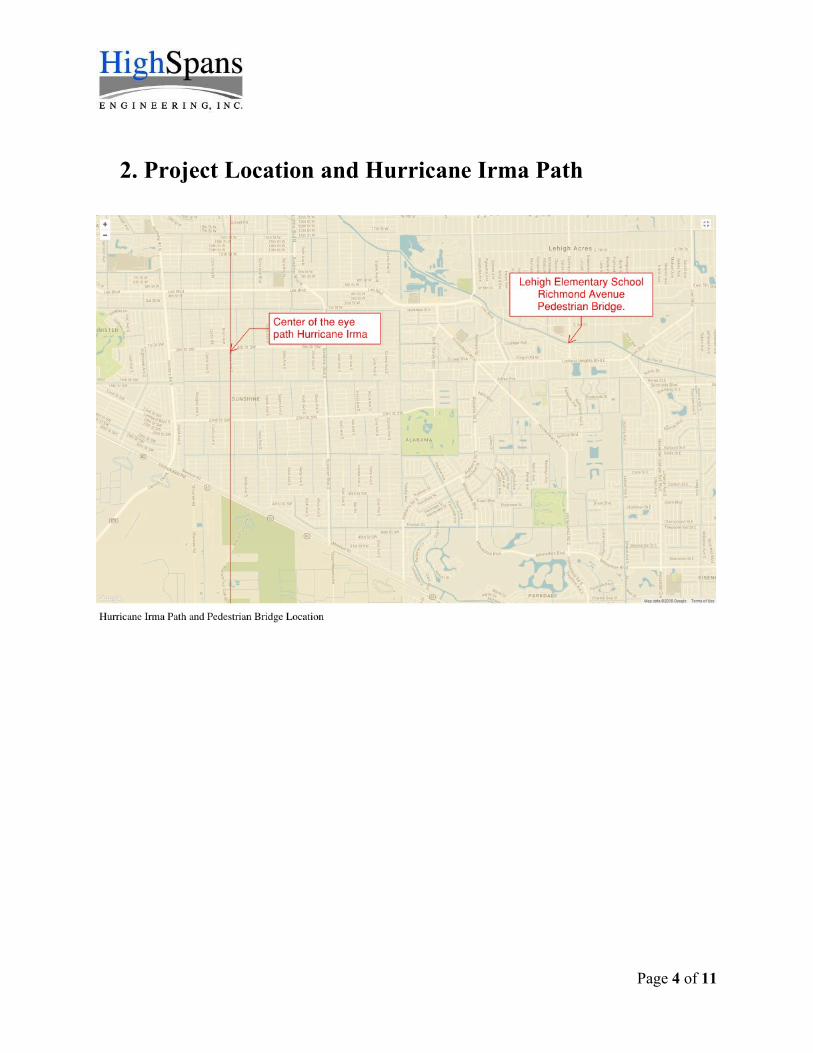
in general. The existing pedestrian bridge was damaged by the high winds experienced during
Hurricane Irma. Due to public safety, the damaged bridge was removed promptly after the
storm. HighSpans inspected the site and remaining foundations (wood piles). Since the storm,
school children and pedestrians have been utilizing the vehicle bridge shoulder to cross the
canal. This is not a safe option as the shoulders are not designed for pedestrian use.
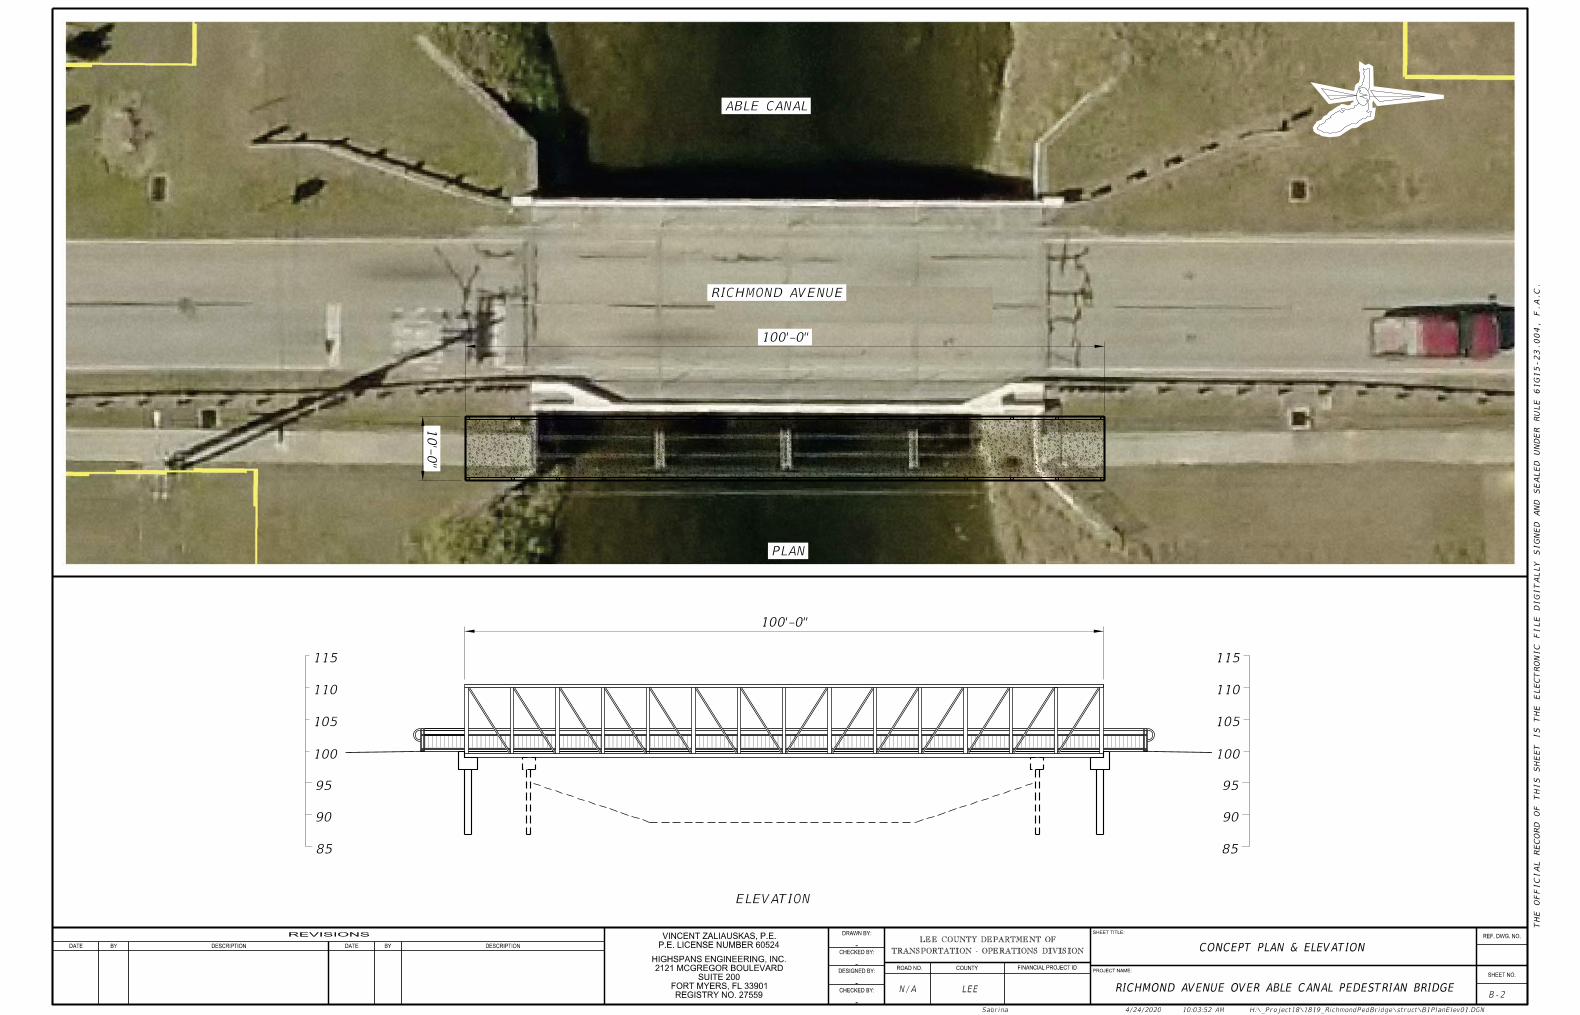
This report summarizes the concept envisioned for the replacement bridge and includes Bridge
Development Report Level Cost Estimate of the replacement bridge as well as design and
construction administration fees anticipated.
Design will be in accordance with the AASHTO LRFD Bridge Design Specification, the FDOT
Structures Design Guidelines, and the AASHTO LRFD Guide Specification for the Design of
Pedestrian Bridges. Ultimate design wind speeds will adhere to those prescribed by Lee County
Board of County Commissioners or FDOT, whichever are higher. Pedestrian loads will conform
to the AASHTO LRFD Specification.
Page 4 of 11
2. Project Location and Hurricane Irma Path
Page 5 of 11
3. Photo of Existing Bridge (post-Irma)

Page 6 of 11
4. Concept Plans
TH
E
OF
FI
CI
AL
RE
CO
RD
OF
THI
S
SH
EE
T I
S
TH
E
EL
EC
TR
ONI
C
FI
LE
DI
GI
TA
LL
Y
SI
GN
ED
AN
D
SE
AL
ED
UN
DE
R
RU
LE 61
G15-23.004,
F.
A.
C.
P.E. LICENSE NUMBER 60524
VINCENT ZALIAUSKAS, P.E.
REGISTRY NO. 27559
FORT MYERS, FL 33901
SUITE 200
2121 MCGREGOR BOULEVARD
HIGHSPANS ENGINEERING, INC.
BOCA GRANDE
BOKEELIA
ALVA
PortBoca
Grande
RASSA
Iona
North
Fort Myers
Salavista
Bayshore
ManorTICE
Olga
Buckingham
Lakeville
C a n a l
D o g
Slough
Canal
Pop. 102,286
ESTERO
BONITA SPRINGS
FORT MYERSBEACH
CAPE CORAL
FORT MYERS
Bayshore
MATLACHA
SANIBELISLAND
Gator
LEHIGH ACRES
CAPTIVA
ST. JAMES CITY
Pop. 6,064
Pop. 6,561
Pop. 48,208
Island Canal
Big
PUNTA
Big
Dead
Cr.
Pop. 32,797
PINELAND
ABLE CANAL
RIC
HM
ON
D
AV
EN
UE
ABLE CANAL
SCHOOLSIDE DRIVE
E 3rd STREET
E JASMINE ROAD
E PENN ROAD
TE
XA
S R
OA
D
LOCATION OF PROJECT
https://goo.gl/maps/26TLrFXR8jRhzNfs5
RIC
HM
ON
D
AV
EN
UE
B-1
LOCATION MAP
PROPOSED PEDESTRIAN BRIDGE
LEHIGH ELEMENTARY SCHOOL
-
-
-
-
TRANSPORTATION - OPERATIONS DIVISION
LEE COUNTY DEPARTMENT OFREF. DWG. NO.
SHEET NO.
SHEET TITLE:
PROJECT NAME:
DRAWN BY:
CHECKED BY:
DESIGNED BY:
CHECKED BY:
ROAD NO. COUNTY FINANCIAL PROJECT ID
REVISIONS
DATE BY DESCRIPTION DATE BY DESCRIPTION
N/A LEE
Sabrina 4/24/2020 10:03:48 AM H:\_Project18\1819_RichmondPedBridge\struct\LocationMap.DGN
RICHMOND AVENUE OVER ABLE CANAL PEDESTRIAN BRIDGE
TH
E
OF
FI
CI
AL
RE
CO
RD
OF
THI
S
SH
EE
T I
S
TH
E
EL
EC
TR
ONI
C
FI
LE
DI
GI
TA
LL
Y
SI
GN
ED
AN
D
SE
AL
ED
UN
DE
R
RU
LE 61
G15-23.004,
F.
A.
C.
P.E. LICENSE NUMBER 60524
VINCENT ZALIAUSKAS, P.E.
REGISTRY NO. 27559
FORT MYERS, FL 33901
SUITE 200
2121 MCGREGOR BOULEVARD
HIGHSPANS ENGINEERING, INC.
CONCEPT PLAN & ELEVATION
PLAN
ABLE CANAL
ELEVATION
85
90
95
100
105
110
115
85
90
95
100
105
110
115
RICHMOND AVENUE
10'-
0"
100'-0"
100'-0"
B-2
-
-
-
-
TRANSPORTATION - OPERATIONS DIVISION
LEE COUNTY DEPARTMENT OFREF. DWG. NO.
SHEET NO.
SHEET TITLE:
PROJECT NAME:
DRAWN BY:
CHECKED BY:
DESIGNED BY:
CHECKED BY:
ROAD NO. COUNTY FINANCIAL PROJECT ID
REVISIONS
DATE BY DESCRIPTION DATE BY DESCRIPTION
N/A LEE
Sabrina 4/24/2020 10:03:52 AM H:\_Project18\1819_RichmondPedBridge\struct\B1PlanElev01.DGN
RICHMOND AVENUE OVER ABLE CANAL PEDESTRIAN BRIDGE
Page 9 of 11
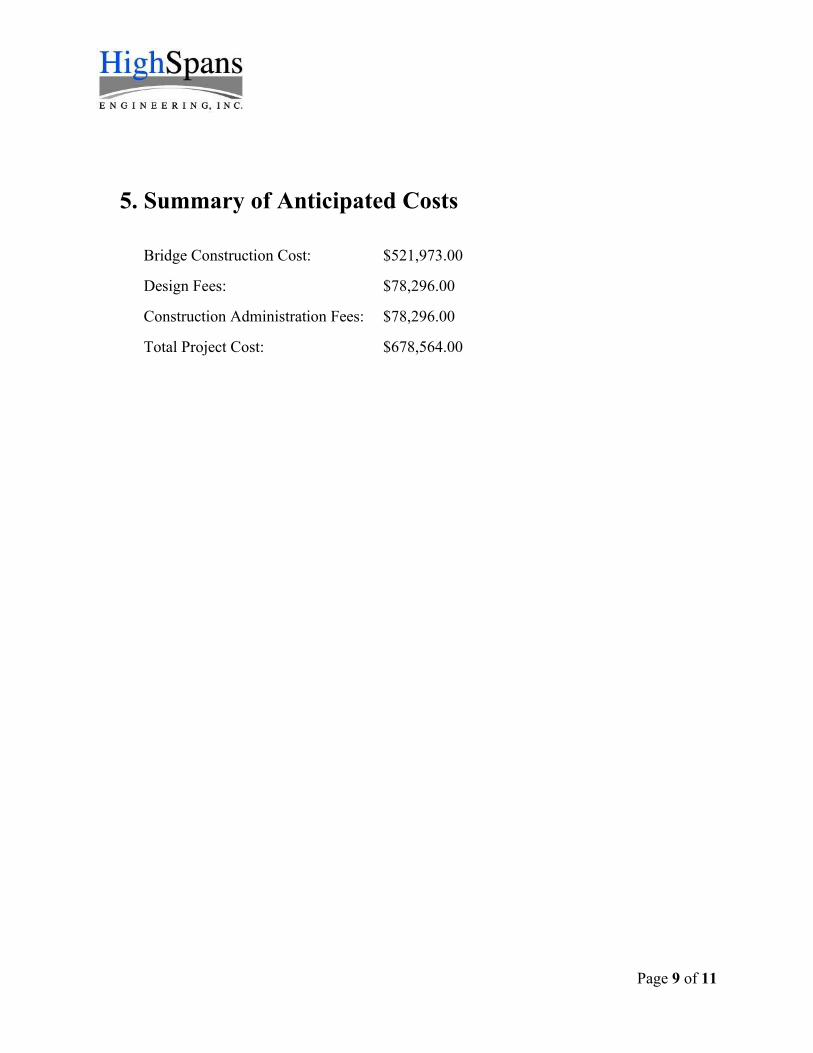
5. Summary of Anticipated Costs
Bridge Construction Cost: $521,973.00
Design Fees: $78,296.00
Construction Administration Fees: $78,296.00
Total Project Cost: $678,564.00
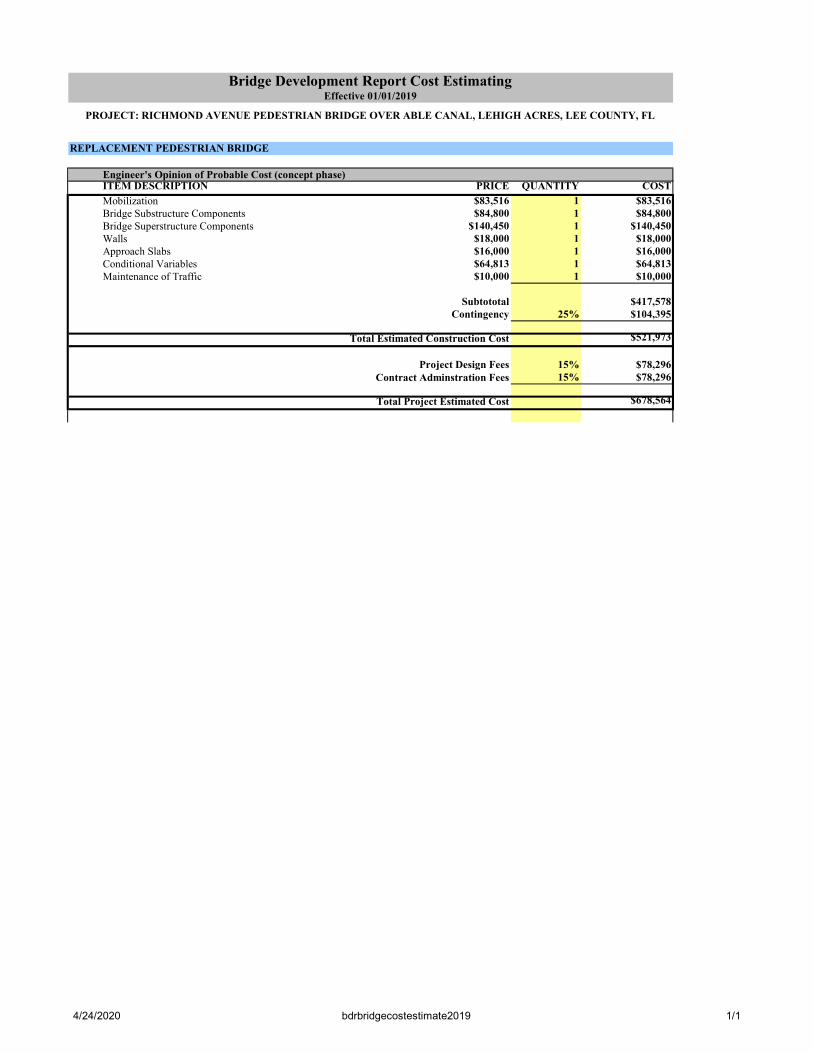
REPLACEMENT PEDESTRIAN BRIDGE
ITEM DESCRIPTION PRICE QUANTITY COST
Mobilization $83,516 1 $83,516Bridge Substructure Components $84,800 1 $84,800Bridge Superstructure Components $140,450 1 $140,450Walls $18,000 1 $18,000Approach Slabs $16,000 1 $16,000Conditional Variables $64,813 1 $64,813Maintenance of Traffic $10,000 1 $10,000
Subtototal $417,578Contingency 25% $104,395
$521,973
Project Design Fees 15% $78,29615% $78,296
$678,564
Total Estimated Construction Cost
Total Project Estimated Cost
Contract Adminstration Fees
Bridge Development Report Cost EstimatingEffective 01/01/2019
PROJECT: RICHMOND AVENUE PEDESTRIAN BRIDGE OVER ABLE CANAL, LEHIGH ACRES, LEE COUNTY, FL
Engineer's Opinion of Probable Cost (concept phase)
4/24/2020 bdrbridgecostestimate2019 1/1

Page 11 of 11
6. Bridge Development Report Cost Details
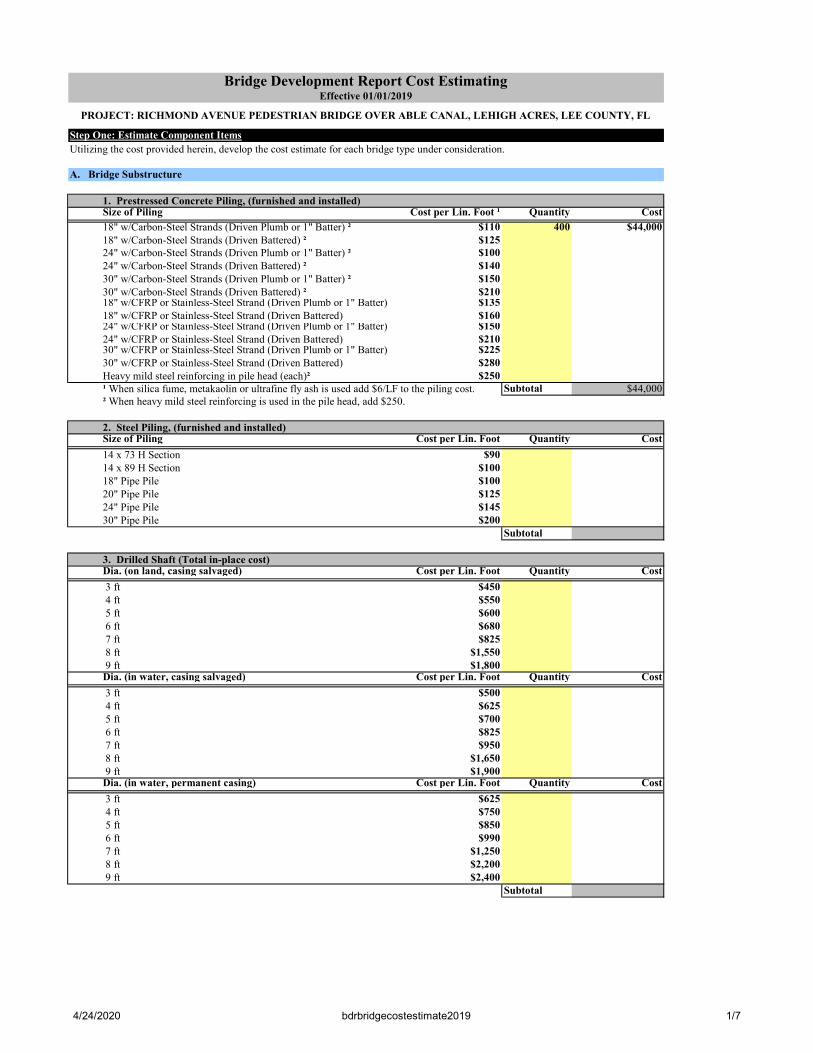
Step One: Estimate Component Items
A. Bridge Substructure
Size of Piling Cost per Lin. Foot ¹ Quantity Cost
18" w/Carbon-Steel Strands (Driven Plumb or 1" Batter) ² $110 400 $44,00018" w/Carbon-Steel Strands (Driven Battered) ² $12524" w/Carbon-Steel Strands (Driven Plumb or 1" Batter) ² $10024" w/Carbon-Steel Strands (Driven Battered) ² $14030" w/Carbon-Steel Strands (Driven Plumb or 1" Batter) ² $15030" w/Carbon-Steel Strands (Driven Battered) ² $21018" w/CFRP or Stainless-Steel Strand (Driven Plumb or 1" Batter) $13518" w/CFRP or Stainless-Steel Strand (Driven Battered) $16024" w/CFRP or Stainless-Steel Strand (Driven Plumb or 1" Batter) $15024" w/CFRP or Stainless-Steel Strand (Driven Battered) $21030" w/CFRP or Stainless-Steel Strand (Driven Plumb or 1" Batter) $22530" w/CFRP or Stainless-Steel Strand (Driven Battered) $280Heavy mild steel reinforcing in pile head (each)² $250
Subtotal $44,000
Size of Piling Cost per Lin. Foot Quantity Cost
14 x 73 H Section $9014 x 89 H Section $10018" Pipe Pile $10020" Pipe Pile $12524" Pipe Pile $14530" Pipe Pile $200
Subtotal
Dia. (on land, casing salvaged) Cost per Lin. Foot Quantity Cost
3 ft $450 4 ft $550 5 ft $600 6 ft $680 7 ft $825 8 ft $1,550 9 ft $1,800Dia. (in water, casing salvaged) Cost per Lin. Foot Quantity Cost
3 ft $500 4 ft $625 5 ft $700 6 ft $825 7 ft $950 8 ft $1,650 9 ft $1,900Dia. (in water, permanent casing) Cost per Lin. Foot Quantity Cost
3 ft $625 4 ft $750 5 ft $850 6 ft $990 7 ft $1,250 8 ft $2,200 9 ft $2,400
Subtotal
Bridge Development Report Cost Estimating
Utilizing the cost provided herein, develop the cost estimate for each bridge type under consideration.
1. Prestressed Concrete Piling, (furnished and installed)
¹ When silica fume, metakaolin or ultrafine fly ash is used add $6/LF to the piling cost.² When heavy mild steel reinforcing is used in the pile head, add $250.
Effective 01/01/2019
2. Steel Piling, (furnished and installed)
3. Drilled Shaft (Total in-place cost)
PROJECT: RICHMOND AVENUE PEDESTRIAN BRIDGE OVER ABLE CANAL, LEHIGH ACRES, LEE COUNTY, FL
4/24/2020 bdrbridgecostestimate2019 1/7
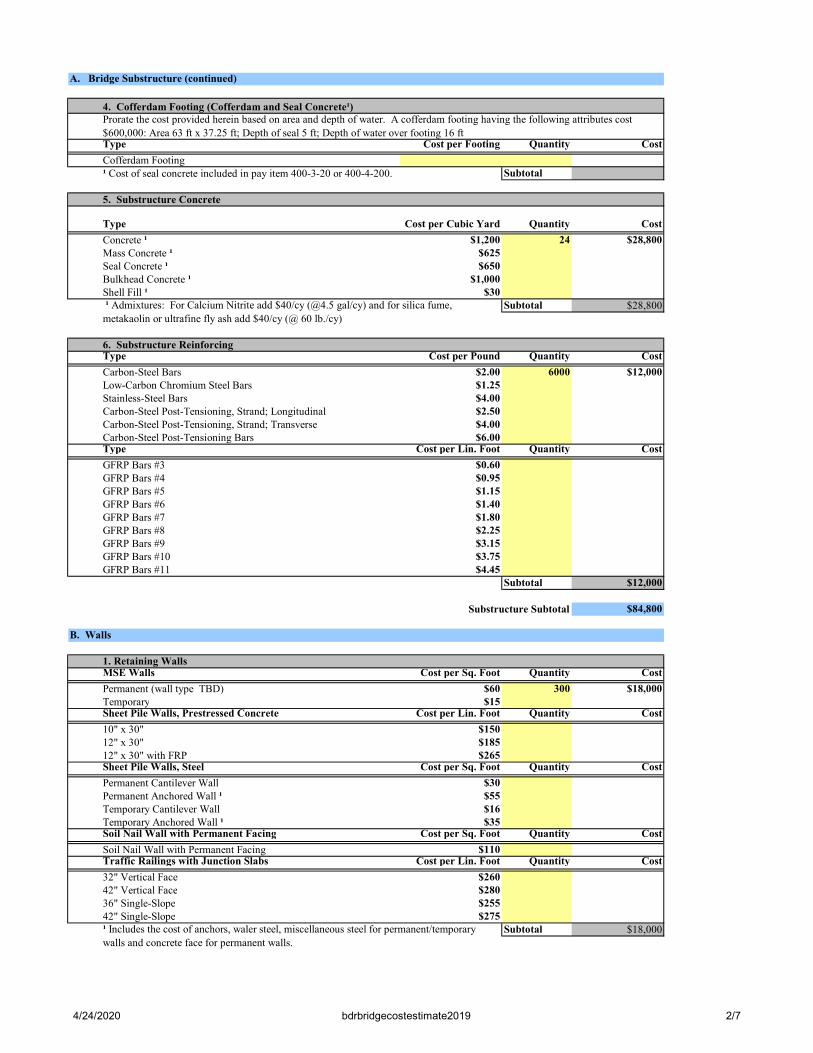
A. Bridge Substructure (continued)
Type Cost per Footing Quantity Cost
Cofferdam FootingSubtotal
Type Cost per Cubic Yard Quantity Cost
Concrete ¹ $1,200 24 $28,800Mass Concrete ¹ $625Seal Concrete ¹ $650Bulkhead Concrete ¹ $1,000Shell Fill ¹ $30
Subtotal $28,800
Type Cost per Pound Quantity Cost
Carbon-Steel Bars $2.00 6000 $12,000Low-Carbon Chromium Steel Bars $1.25Stainless-Steel Bars $4.00Carbon-Steel Post-Tensioning, Strand; Longitudinal $2.50Carbon-Steel Post-Tensioning, Strand; Transverse $4.00Carbon-Steel Post-Tensioning Bars $6.00Type Cost per Lin. Foot Quantity Cost
GFRP Bars #3 $0.60GFRP Bars #4 $0.95GFRP Bars #5 $1.15GFRP Bars #6 $1.40GFRP Bars #7 $1.80GFRP Bars #8 $2.25GFRP Bars #9 $3.15GFRP Bars #10 $3.75GFRP Bars #11 $4.45
Subtotal $12,000
Substructure Subtotal $84,800
B. Walls
1. Retaining WallsMSE Walls Cost per Sq. Foot Quantity Cost
Permanent (wall type TBD) $60 300 $18,000Temporary $15Sheet Pile Walls, Prestressed Concrete Cost per Lin. Foot Quantity Cost
10" x 30" $15012" x 30" $18512" x 30" with FRP $265Sheet Pile Walls, Steel Cost per Sq. Foot Quantity Cost
Permanent Cantilever Wall $30Permanent Anchored Wall ¹ $55Temporary Cantilever Wall $16Temporary Anchored Wall ¹ $35Soil Nail Wall with Permanent Facing Cost per Sq. Foot Quantity Cost
Soil Nail Wall with Permanent Facing $110Traffic Railings with Junction Slabs Cost per Lin. Foot Quantity Cost
32" Vertical Face $26042" Vertical Face $28036" Single-Slope $25542" Single-Slope $275
Subtotal $18,000¹ Includes the cost of anchors, waler steel, miscellaneous steel for permanent/temporary walls and concrete face for permanent walls.
4. Cofferdam Footing (Cofferdam and Seal Concrete¹)Prorate the cost provided herein based on area and depth of water. A cofferdam footing having the following attributes cost $600,000: Area 63 ft x 37.25 ft; Depth of seal 5 ft; Depth of water over footing 16 ft
5. Substructure Concrete
¹ Cost of seal concrete included in pay item 400-3-20 or 400-4-200.
¹ Admixtures: For Calcium Nitrite add $40/cy (@4.5 gal/cy) and for silica fume, metakaolin or ultrafine fly ash add $40/cy (@ 60 lb./cy)
6. Substructure Reinforcing
4/24/2020 bdrbridgecostestimate2019 2/7
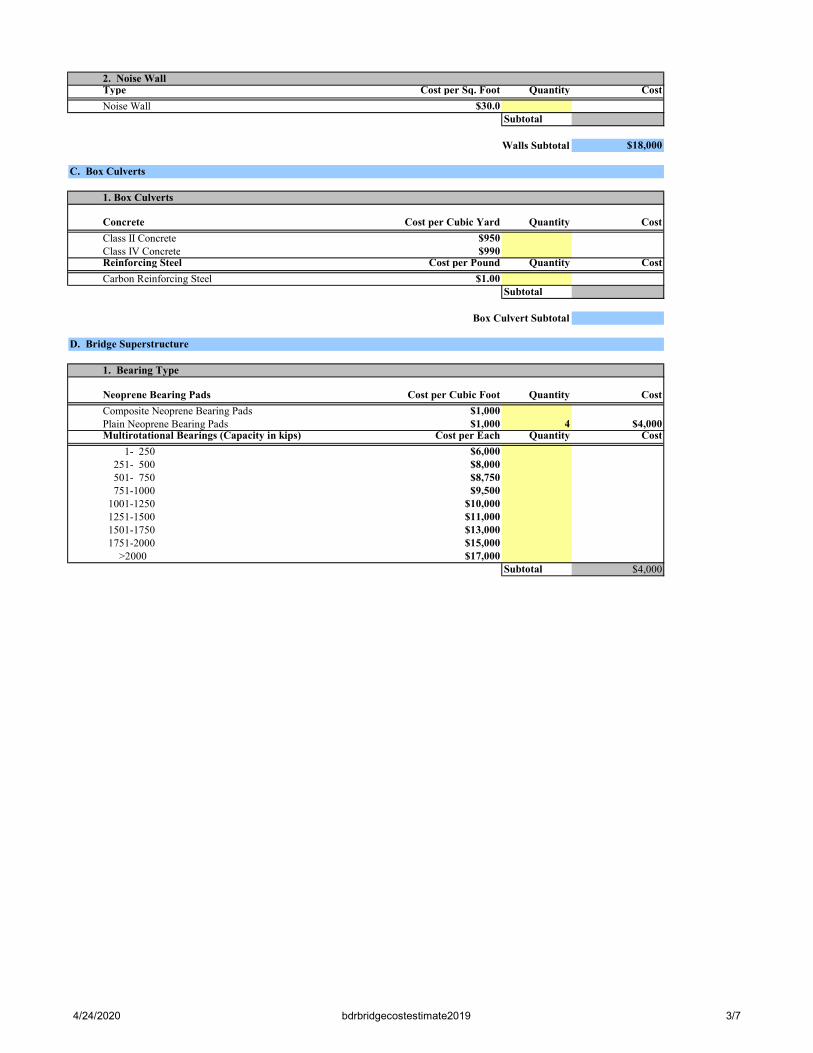
2. Noise WallType Cost per Sq. Foot Quantity Cost
Noise Wall $30.0Subtotal
Walls Subtotal $18,000
C. Box Culverts
1. Box Culverts
Concrete Cost per Cubic Yard Quantity Cost
Class II Concrete $950Class IV Concrete $990Reinforcing Steel Cost per Pound Quantity Cost
Carbon Reinforcing Steel $1.00Subtotal
Box Culvert Subtotal
D. Bridge Superstructure
1. Bearing Type
Neoprene Bearing Pads Cost per Cubic Foot Quantity Cost
Composite Neoprene Bearing Pads $1,000Plain Neoprene Bearing Pads $1,000 4 $4,000Multirotational Bearings (Capacity in kips) Cost per Each Quantity Cost
1- 250 $6,000 251- 500 $8,000 501- 750 $8,750 751-1000 $9,500 1001-1250 $10,000 1251-1500 $11,000 1501-1750 $13,000 1751-2000 $15,000 >2000 $17,000
Subtotal $4,000
4/24/2020 bdrbridgecostestimate2019 3/7
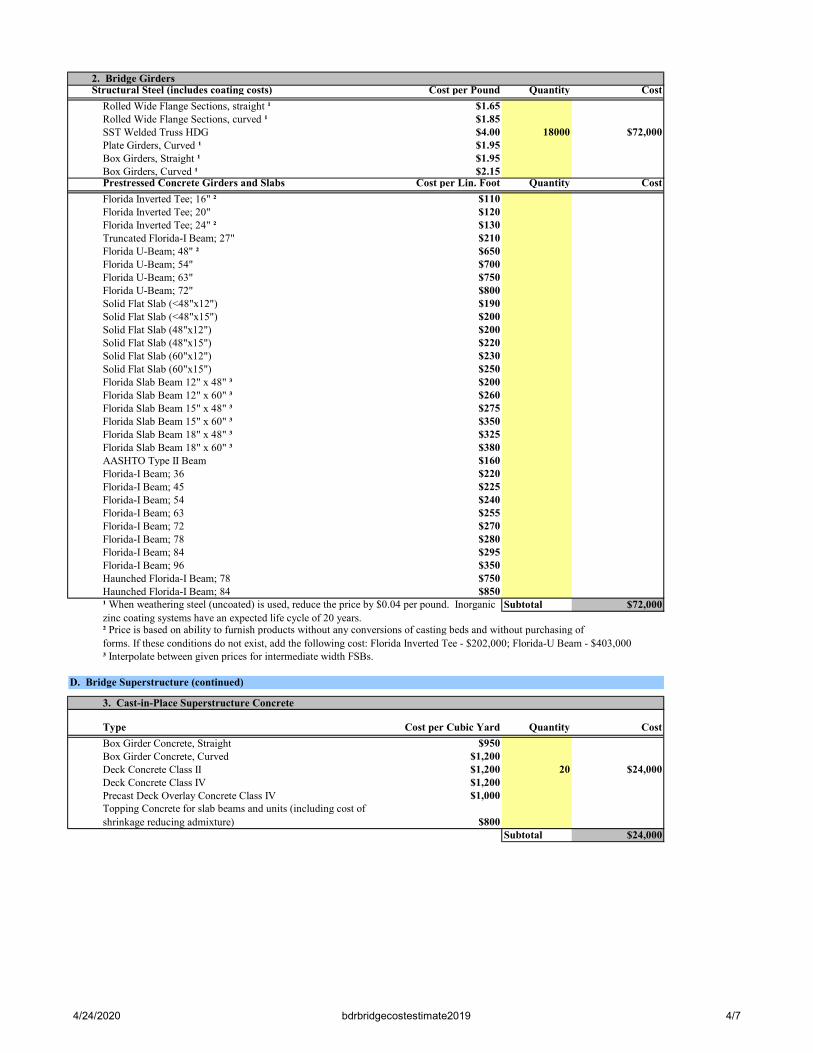
2. Bridge GirdersStructural Steel (includes coating costs) Cost per Pound Quantity Cost
Rolled Wide Flange Sections, straight ¹ $1.65Rolled Wide Flange Sections, curved ¹ $1.85SST Welded Truss HDG $4.00 18000 $72,000Plate Girders, Curved ¹ $1.95Box Girders, Straight ¹ $1.95Box Girders, Curved ¹ $2.15Prestressed Concrete Girders and Slabs Cost per Lin. Foot Quantity Cost
Florida Inverted Tee; 16" ² $110Florida Inverted Tee; 20" $120Florida Inverted Tee; 24" ² $130Truncated Florida-I Beam; 27" $210Florida U-Beam; 48" ² $650Florida U-Beam; 54" $700Florida U-Beam; 63" $750Florida U-Beam; 72" $800Solid Flat Slab (<48"x12") $190Solid Flat Slab (<48"x15") $200Solid Flat Slab (48"x12") $200Solid Flat Slab (48"x15") $220Solid Flat Slab (60"x12") $230Solid Flat Slab (60"x15") $250Florida Slab Beam 12" x 48" ³ $200Florida Slab Beam 12" x 60" ³ $260Florida Slab Beam 15" x 48" ³ $275Florida Slab Beam 15" x 60" ³ $350Florida Slab Beam 18" x 48" ³ $325Florida Slab Beam 18" x 60" ³ $380AASHTO Type II Beam $160Florida-I Beam; 36 $220Florida-I Beam; 45 $225Florida-I Beam; 54 $240Florida-I Beam; 63 $255Florida-I Beam; 72 $270Florida-I Beam; 78 $280Florida-I Beam; 84 $295Florida-I Beam; 96 $350Haunched Florida-I Beam; 78 $750Haunched Florida-I Beam; 84 $850
Subtotal $72,000
D. Bridge Superstructure (continued)
Type Cost per Cubic Yard Quantity Cost
Box Girder Concrete, Straight $950Box Girder Concrete, Curved $1,200Deck Concrete Class II $1,200 20 $24,000Deck Concrete Class IV $1,200Precast Deck Overlay Concrete Class IV $1,000Topping Concrete for slab beams and units (including cost of shrinkage reducing admixture) $800
Subtotal $24,000
3. Cast-in-Place Superstructure Concrete
³ Interpolate between given prices for intermediate width FSBs.
² Price is based on ability to furnish products without any conversions of casting beds and without purchasing offorms. If these conditions do not exist, add the following cost: Florida Inverted Tee - $202,000; Florida-U Beam - $403,000
¹ When weathering steel (uncoated) is used, reduce the price by $0.04 per pound. Inorganic zinc coating systems have an expected life cycle of 20 years.
4/24/2020 bdrbridgecostestimate2019 4/7
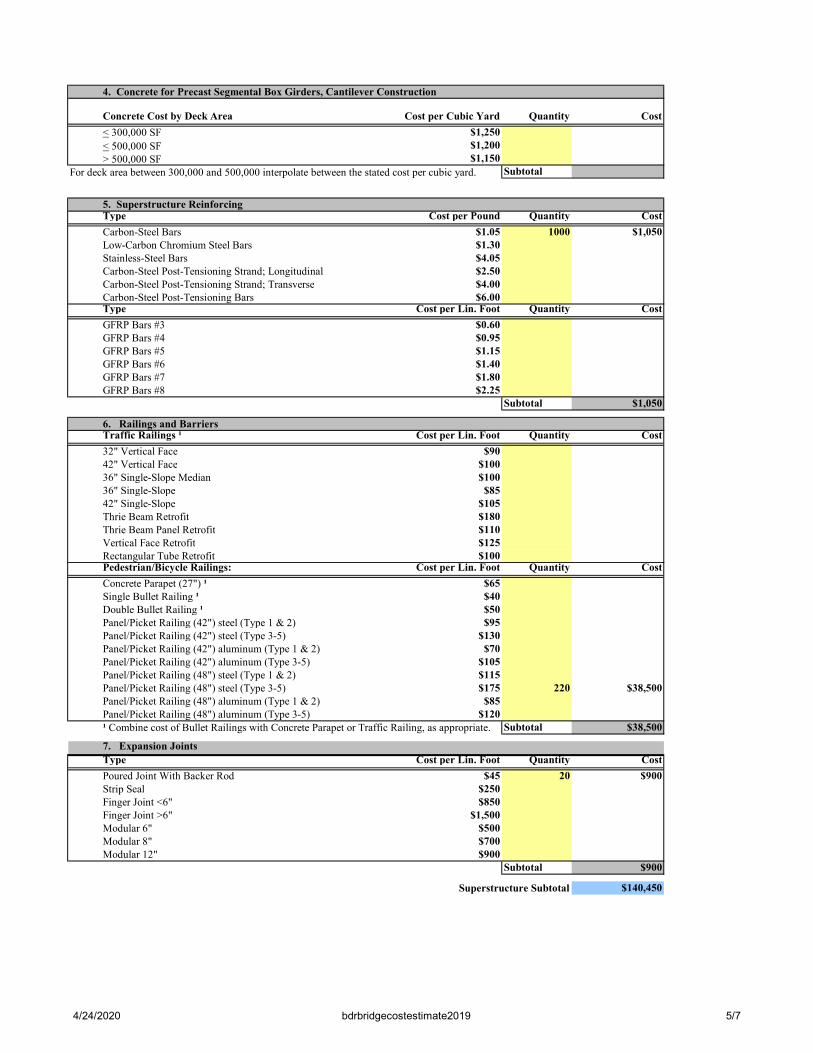
Concrete Cost by Deck Area Cost per Cubic Yard Quantity Cost
< 300,000 SF $1,250< 500,000 SF $1,200> 500,000 SF $1,150
Subtotal
5. Superstructure Reinforcing Type Cost per Pound Quantity Cost
Carbon-Steel Bars $1.05 1000 $1,050Low-Carbon Chromium Steel Bars $1.30Stainless-Steel Bars $4.05Carbon-Steel Post-Tensioning Strand; Longitudinal $2.50Carbon-Steel Post-Tensioning Strand; Transverse $4.00Carbon-Steel Post-Tensioning Bars $6.00Type Cost per Lin. Foot Quantity Cost
GFRP Bars #3 $0.60GFRP Bars #4 $0.95GFRP Bars #5 $1.15GFRP Bars #6 $1.40GFRP Bars #7 $1.80GFRP Bars #8 $2.25
Subtotal $1,050
Traffic Railings ¹ Cost per Lin. Foot Quantity Cost
32" Vertical Face $9042" Vertical Face $10036" Single-Slope Median $10036" Single-Slope $8542" Single-Slope $105Thrie Beam Retrofit $180Thrie Beam Panel Retrofit $110Vertical Face Retrofit $125Rectangular Tube Retrofit $100Pedestrian/Bicycle Railings: Cost per Lin. Foot Quantity Cost
Concrete Parapet (27") ¹ $65Single Bullet Railing ¹ $40Double Bullet Railing ¹ $50Panel/Picket Railing (42") steel (Type 1 & 2) $95Panel/Picket Railing (42") steel (Type 3-5) $130Panel/Picket Railing (42") aluminum (Type 1 & 2) $70Panel/Picket Railing (42") aluminum (Type 3-5) $105Panel/Picket Railing (48") steel (Type 1 & 2) $115Panel/Picket Railing (48") steel (Type 3-5) $175 220 $38,500Panel/Picket Railing (48") aluminum (Type 1 & 2) $85Panel/Picket Railing (48") aluminum (Type 3-5) $120
Subtotal $38,500
7. Expansion JointsType Cost per Lin. Foot Quantity Cost
Poured Joint With Backer Rod $45 20 $900Strip Seal $250Finger Joint <6" $850Finger Joint >6" $1,500Modular 6" $500Modular 8" $700Modular 12" $900
Subtotal $900
Superstructure Subtotal $140,450
6. Railings and Barriers
¹ Combine cost of Bullet Railings with Concrete Parapet or Traffic Railing, as appropriate.
4. Concrete for Precast Segmental Box Girders, Cantilever Construction
For deck area between 300,000 and 500,000 interpolate between the stated cost per cubic yard.
4/24/2020 bdrbridgecostestimate2019 5/7
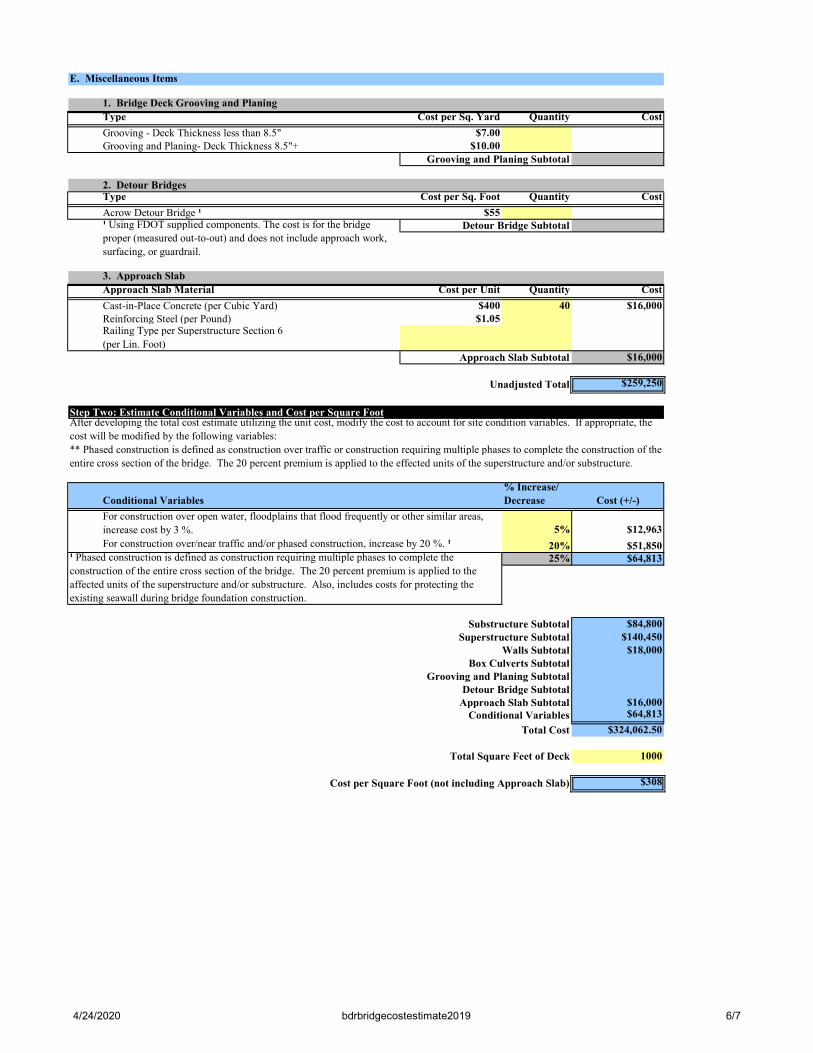
E. Miscellaneous Items
1. Bridge Deck Grooving and PlaningType Cost per Sq. Yard Quantity Cost
Grooving - Deck Thickness less than 8.5" $7.00Grooving and Planing- Deck Thickness 8.5"+ $10.00
Grooving and Planing Subtotal
2. Detour BridgesType Cost per Sq. Foot Quantity Cost
Acrow Detour Bridge ¹ $55Detour Bridge Subtotal
3. Approach SlabApproach Slab Material Cost per Unit Quantity Cost
Cast-in-Place Concrete (per Cubic Yard) $400 40 $16,000Reinforcing Steel (per Pound) $1.05Railing Type per Superstructure Section 6(per Lin. Foot)
Approach Slab Subtotal $16,000
Unadjusted Total $259,250
Step Two: Estimate Conditional Variables and Cost per Square Foot
Conditional Variables% Increase/Decrease Cost (+/-)
5% $12,963
20% $51,85025% $64,813
Substructure Subtotal $84,800Superstructure Subtotal $140,450
Walls Subtotal $18,000Box Culverts Subtotal
Grooving and Planing SubtotalDetour Bridge Subtotal
Approach Slab Subtotal $16,000Conditional Variables $64,813
Total Cost $324,062.50
Total Square Feet of Deck 1000
Cost per Square Foot (not including Approach Slab) $308
¹ Using FDOT supplied components. The cost is for the bridge proper (measured out-to-out) and does not include approach work, surfacing, or guardrail.
¹ Phased construction is defined as construction requiring multiple phases to complete the construction of the entire cross section of the bridge. The 20 percent premium is applied to the affected units of the superstructure and/or substructure. Also, includes costs for protecting the existing seawall during bridge foundation construction.
For construction over/near traffic and/or phased construction, increase by 20 %. ¹
After developing the total cost estimate utilizing the unit cost, modify the cost to account for site condition variables. If appropriate, the cost will be modified by the following variables:** Phased construction is defined as construction over traffic or construction requiring multiple phases to complete the construction of the entire cross section of the bridge. The 20 percent premium is applied to the effected units of the superstructure and/or substructure.
For construction over open water, floodplains that flood frequently or other similar areas, increase cost by 3 %.
4/24/2020 bdrbridgecostestimate2019 6/7

LocationPounds of Steel per
Cubic Yard Cubic Yds. Tot. Pounds
Pile Abutments 135Pile Bents 145 Single Column Piers >25' 210Single Column Piers <25' 150
Multiple Column Piers >25' 215Multiple Column Piers <25' 195Bascule Piers 110
Standard Deck Slabs 205Isotropic Deck Slabs 125
Concrete Box Girders, Pier Segment 225Concrete Box Girders, Typical Segment 165C.I.P. Flat Slabs @ 30ft & 15" Deep 220
Approach Slab 200
Bridge Superstructure Type Low High
Short Span Bridges:Reinforced Concrete Flat Slab- Simple Span ¹ $115 $160Pre-cast Concrete Slab - Simple Span ¹ $110 $200Medium Span Bridges:Concrete Deck / Steel Girder - Simple Span ¹ $125 $142Concrete Deck / Steel Girder - Continuous Span ¹ $135 $170Concrete Deck / Prestressed Girder - Simple Span $105 $145Concrete Deck / Prestressed Girder - Continuous Span $110 $211Concrete Deck / Steel Box Girder - $140 $180 Span range from 150' to 280' (for curvature, add 15% premium)Segmental Concrete Box Girders - Cantilever Construction $140 $160 Span range from 150' to 280'Movable Bridge - Bascule Spans & Piers $1,800 $2,000Demolition Costs:Typical $35 $60Bascule $90 $110Project Type
Widening (Construction Only) $125 $180Widening Removal Work $85 $160
¹ Increase the cost by twenty percent for phased construction
Estimated Cost per Square Foot $308
Total Cost per Square Foot
Step Three: Cost Estimate Comparison to Historical Bridge Cost
In the absence of better information, use the following quantities of reinforcing steel pounds per cubic yard of concrete.
Design Aid for Determination of Reinforcing Steel
The final step is a comparison of the cost estimate by comparison with historic bridge cost based on a cost per square foot. These total cost numbers are calculated exclusively for the bridge cost as defined in the General Section of this chapter. Price computed by Steps 1 and 2 should be generally within the range of cost as supplied herein. If the cost falls outside the provided range, good justification must be provided.
4/24/2020 bdrbridgecostestimate2019 7/7
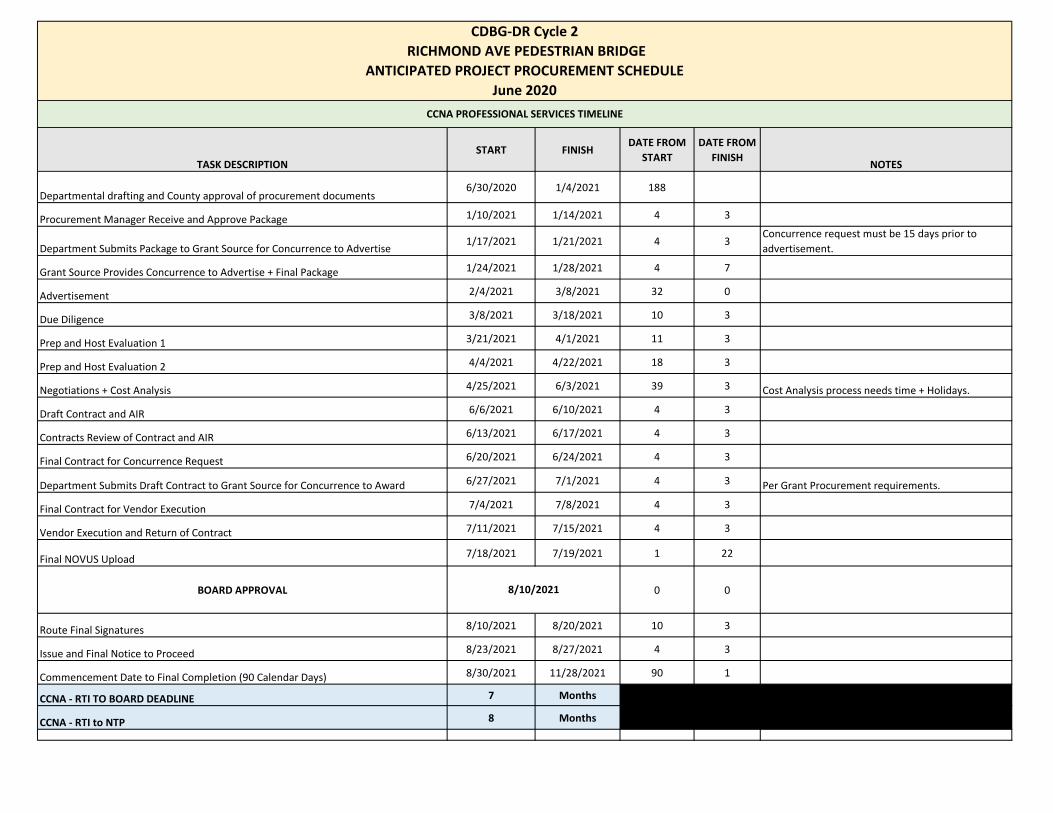
TASK DESCRIPTIONSTART FINISH
DATE FROM START
DATE FROM FINISH NOTES
Departmental drafting and County approval of procurement documents6/30/2020 1/4/2021 188
Procurement Manager Receive and Approve Package 1/10/2021 1/14/2021 4 3
Department Submits Package to Grant Source for Concurrence to Advertise1/17/2021 1/21/2021 4 3
Concurrence request must be 15 days prior to advertisement.
Grant Source Provides Concurrence to Advertise + Final Package 1/24/2021 1/28/2021 4 7
Advertisement 2/4/2021 3/8/2021 32 0
Due Diligence 3/8/2021 3/18/2021 10 3
Prep and Host Evaluation 1 3/21/2021 4/1/2021 11 3
Prep and Host Evaluation 2 4/4/2021 4/22/2021 18 3
Negotiations + Cost Analysis 4/25/2021 6/3/2021 39 3 Cost Analysis process needs time + Holidays.
Draft Contract and AIR 6/6/2021 6/10/2021 4 3
Contracts Review of Contract and AIR 6/13/2021 6/17/2021 4 3
Final Contract for Concurrence Request 6/20/2021 6/24/2021 4 3
Department Submits Draft Contract to Grant Source for Concurrence to Award 6/27/2021 7/1/2021 4 3 Per Grant Procurement requirements.
Final Contract for Vendor Execution 7/4/2021 7/8/2021 4 3
Vendor Execution and Return of Contract 7/11/2021 7/15/2021 4 3
Final NOVUS Upload 7/18/2021 7/19/2021 1 22
BOARD APPROVAL 0 0
Route Final Signatures 8/10/2021 8/20/2021 10 3
Issue and Final Notice to Proceed 8/23/2021 8/27/2021 4 3
Commencement Date to Final Completion (90 Calendar Days) 8/30/2021 11/28/2021 90 1
CCNA - RTI TO BOARD DEADLINE 7 Months
CCNA - RTI to NTP 8 Months
CDBG-DR Cycle 2 RICHMOND AVE PEDESTRIAN BRIDGE
ANTICIPATED PROJECT PROCUREMENT SCHEDULEJune 2020
CCNA PROFESSIONAL SERVICES TIMELINE
8/10/2021
TASK DESCRIPTIONSTART FINISH
DATE FROM START
DATE FROM FINISH NOTES
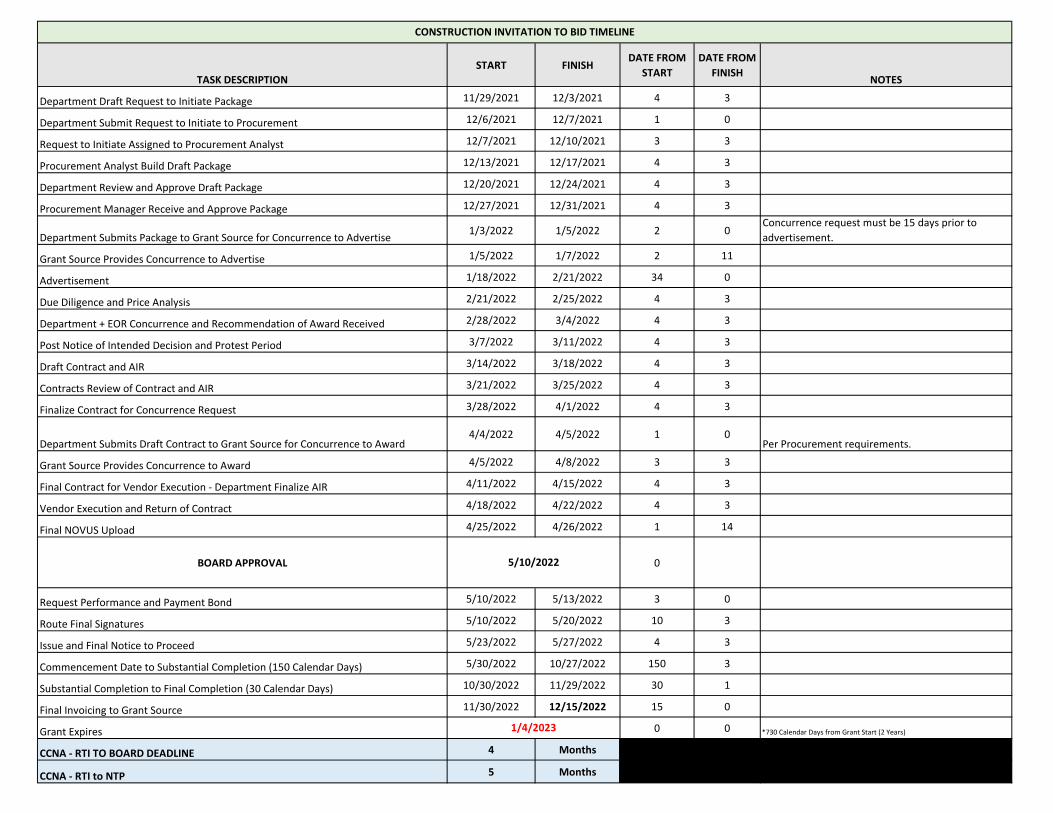
Department Draft Request to Initiate Package 11/29/2021 12/3/2021 4 3
Department Submit Request to Initiate to Procurement 12/6/2021 12/7/2021 1 0
Request to Initiate Assigned to Procurement Analyst 12/7/2021 12/10/2021 3 3
Procurement Analyst Build Draft Package 12/13/2021 12/17/2021 4 3
Department Review and Approve Draft Package 12/20/2021 12/24/2021 4 3
Procurement Manager Receive and Approve Package 12/27/2021 12/31/2021 4 3
Department Submits Package to Grant Source for Concurrence to Advertise 1/3/2022 1/5/2022 2 0Concurrence request must be 15 days prior to advertisement.
Grant Source Provides Concurrence to Advertise 1/5/2022 1/7/2022 2 11
Advertisement 1/18/2022 2/21/2022 34 0
Due Diligence and Price Analysis 2/21/2022 2/25/2022 4 3
Department + EOR Concurrence and Recommendation of Award Received 2/28/2022 3/4/2022 4 3
Post Notice of Intended Decision and Protest Period 3/7/2022 3/11/2022 4 3
Draft Contract and AIR 3/14/2022 3/18/2022 4 3
Contracts Review of Contract and AIR 3/21/2022 3/25/2022 4 3
Finalize Contract for Concurrence Request 3/28/2022 4/1/2022 4 3
Department Submits Draft Contract to Grant Source for Concurrence to Award4/4/2022 4/5/2022 1 0
Per Procurement requirements.
Grant Source Provides Concurrence to Award 4/5/2022 4/8/2022 3 3
Final Contract for Vendor Execution - Department Finalize AIR 4/11/2022 4/15/2022 4 3
Vendor Execution and Return of Contract 4/18/2022 4/22/2022 4 3
Final NOVUS Upload 4/25/2022 4/26/2022 1 14
BOARD APPROVAL 0
Request Performance and Payment Bond 5/10/2022 5/13/2022 3 0
Route Final Signatures 5/10/2022 5/20/2022 10 3
Issue and Final Notice to Proceed 5/23/2022 5/27/2022 4 3
Commencement Date to Substantial Completion (150 Calendar Days) 5/30/2022 10/27/2022 150 3
Substantial Completion to Final Completion (30 Calendar Days) 10/30/2022 11/29/2022 30 1
Final Invoicing to Grant Source 11/30/2022 12/15/2022 15 0
Grant Expires 0 0 *730 Calendar Days from Grant Start (2 Years)
CCNA - RTI TO BOARD DEADLINE 4 Months
CCNA - RTI to NTP 5 Months
1/4/2023
5/10/2022
CONSTRUCTION INVITATION TO BID TIMELINE
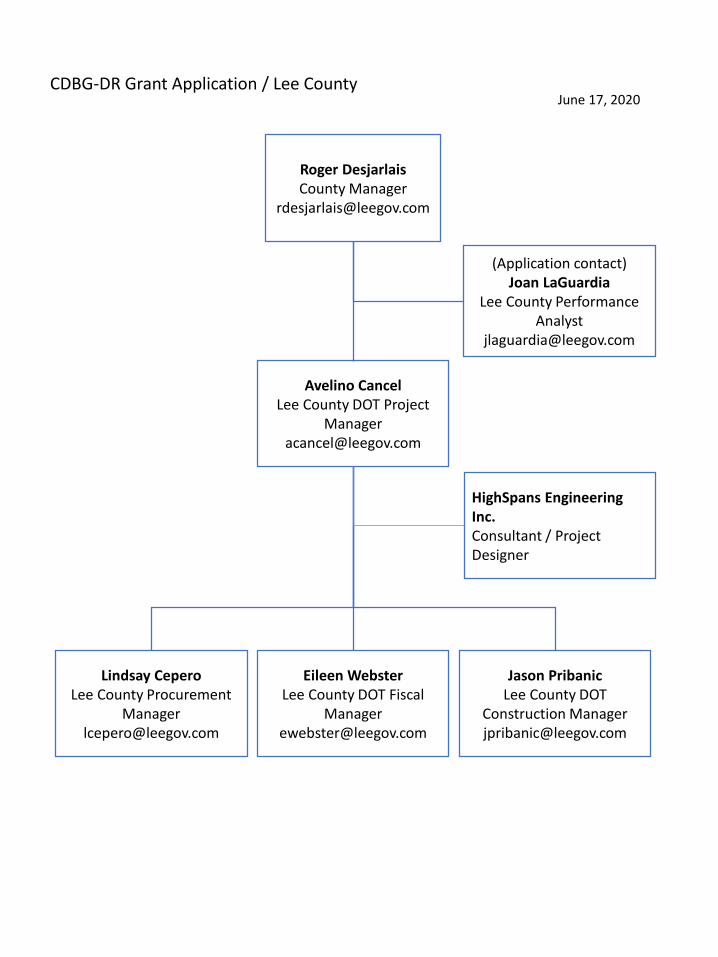
Avelino CancelLee County DOT Project
Lindsay CeperoLee County Procurement
Eileen WebsterLee County DOT Fiscal
Jason PribanicLee County DOT
Construction [email protected]
(Application contact)Joan LaGuardia
Lee County Performance Analyst
Roger DesjarlaisCounty Manager
CDBG-DR Grant Application / Lee CountyJune 17, 2020
HighSpans Engineering Inc. Consultant / Project Designer