Florida Commission on Hurricane Loss Projection Methodology · Florida Commission on Hurricane Loss...
48
Florida Commission on Hurricane Loss Projection Methodology Hurricane Rita NOAA Professional Team Report 2 2 0 0 0 0 5 5 S S t t a a n n d d a a r r d d s s Risk Management Solutions, Inc. On-Site Review May 1 – 3, 2006 Additional Verification Review May 15, 2006
Transcript of Florida Commission on Hurricane Loss Projection Methodology · Florida Commission on Hurricane Loss...
Florida Commission on Hurricane Loss
Projection Methodology
Hurricane Rita NOAA
Professional Team Report
22000055 SSttaannddaarrddss
RRiisskk MMaannaaggeemmeenntt SSoolluuttiioonnss,, IInncc..
On-Site Review May 1 – 3, 2006
Additional Verification Review
May 15, 2006
Professional Team Report – Risk Management Solutions, Inc. May 1-3, 2006 & May 15, 2006
2
On May 1-3, 2006 the Professional Team visited on-site at Risk Management Solutions, Inc. (RMS) in Newark, California. The following individuals participated in the review. RMS Richard R. Anderson, FCAS, MAAA, Chief Actuary, Actuarial and Financial Modeling Enrica Bellone, Ph.D., Senior Statistician Auguste Boissonnade, Ph.D., Vice President, Model Development, Weather Risk Michael Drayton, Ph.D. – Consultant, Director, Three Letters Ltd. Uday K. Eyunni, Software Development Manager, Model Services Philip LeGrone, P.E., CSP, CFPS, Claims Research Director Paul MacManus, Ph.D., Senior Financial Modeler, Actuarial and Financial Modeling Guy C. Morrow, S.E., Vice President, Model Development Rohit Prakash Mehta, Senior Engineer, Model Development and Implementation Matthew Nielsen, Analyst, Model Management Adam O’Shay, Ph.D., Senior Tropical Cyclone Modeler, Climate Hazard and Model Development Mohsen Rahnama, Ph.D., Vice President – Engineering & Model Development, Product Development John Reiter, Vice President, Software Core and Model Services Agustin Rodriquez, Senior Vulnerability Engineer Mitch Satler, Vice President Public Policy Pane Stojanovski, Ph.D., Vice President, Model Development Operations Jim Tomcik, Vice President Catastrophe Applications, Product Quality & Release Management Michael Young, M.E.Sc., P.E., Lead Wind Vulnerability Engineer, Product Development Professional Team Jenni Evans, Ph.D., Meteorologist Paul Fishwick, Ph.D., Computer Scientist Mark Johnson, Ph.D., Statistician, Team Leader Marty Simons, ACAS, Actuary Fred Stolaski, P.E., Structural Engineer Donna Sirmons, Staff The review began with introductions and an overview of the audit process. Discussed and reviewed the following corrections to be made in the submission that will be provided to the Commission prior to the May 16-18, 2006 meetings.
• Page 23, G-1.2, revised to include correct number of building classifications and to update Table 1 for mobile home year bands.
• Pages 39-40, G-2.2A, revised to update Table 2 to include Dr. Rex Britter. • Page 67, G-2.2B, revised to include new employees previously omitted. • Page 68, G-2.2C, Figure 5 revised to reflect workflow diagram for all model
development. • Page 69, G-2.2D, Table 7 revised to correct Dr. Timothy Reinhold’s affiliation. • Pages 77-87, Forms G-1 through G-6 with updated signatures after revisions made to
the original February 28, 2006 submission. • Page 91, M-2.1 revised to indicate correspondence of specific datasets with hurricane
characteristics.
Professional Team Report – Risk Management Solutions, Inc. May 1-3, 2006 & May 15, 2006
3
• Page 95, M-2.7, Figure 6 revised to update stochastic counts to account for multiple landfalls.
• Page 98, M-3.3, revised to include all modeled characteristics. • Page 99, M-4.1, revised to include more information. • Page 101, M-5.1, revised to correct filling rate description. • Pages 103-104, M-5.5, corrected Figure 9. • Pages 106-107, Form M-1 revised to correctly account for historical and modeled
occurrence rates, to account for Hurricane Rita, and to provide response to C. • Page 108, Form M-2 revised to provide modeled maximum wind speed over Florida. • Page 119, V-1.5, Table 12 updated to include mobile home year bands. • Page 123, Form V-1 revised to correct Part B percentages. • Pages 148-149, A-9.2, Table 15, A-9.3, and A-9.4 revised using corrected annual
deductible calculation. • Page 153, Form A-2, revised using corrected annual deductible calculation. • Pages 172-223, A-9.5, Form A-7 revised using corrected annual deductible
calculation. • Pages 224-225, A-9.6, Form A-8 revised using corrected annual deductible
calculation. • Pages 172-223, Form A-7, Output Ranges revised to correct deductible amounts. • Pages 224-225, Form A-8, revised after rerun of Output Ranges. • Page 228, S-1, revised to reflect truncation of Rmax distribution. • Page 234, S-1.6, Figure 29, revised with updated p-values. • Page 248, S-5, revised after update to Property Claims Services loss estimates. • Page 250, S-5.1, Tables 22 & 23, revised after update to Property Claims Services
loss estimates. Reviewed and discussed additional information RMS anticipates including in their presentation to the Commission at the May model review meetings including the Trade Secret List information. In the course of this audit, RMS reported a self-discovered bug that invalidated the Output Ranges as submitted in February 2006. This bug related to the adjustment factor for annual deductibles. Since the updated Output Ranges could not be produced during the on-site visit, the following Standards directly related to this bug were therefore not verified: A-5, A-6, and A-9. Forms A-2, A-7, and A-8 must be re-submitted. Moreover, the identification of this issue demonstrated that certain Computer Standards could not be verified, indicating a necessary revision to the procedures to preclude a re-occurrence of such an event. The Computer Standards not verified are C-4, C-5, and C-6. As indicated in the Professional Team report, the verification of several other Standards are contingent on the satisfactory completion of Forms A-7 and A-8. Other Standards can be readily verified upon receipt of corrected pages, as indicated in the report. ******************************************************************************
Additional Verification Review – May 15, 2006
RMS submitted corrections to the original February 28, 2006 model submission under the 2005 Standards on May 10, 2006. A subset of the Professional Team completed the additional verification review on May 15, 2006. All Standards are now verified.
Professional Team Report – Risk Management Solutions, Inc. May 1-3, 2006 & May 15, 2006
4
The following participated in the additional verification review. RMS Richard R. Anderson, FCAS, MAAA, Chief Actuary, Actuarial and Financial Modeling Guy C. Morrow, S.E., Vice President, Model Development Jonathan Moss, Lead Risk Quantification Researcher (via phone) John Reiter, Vice President, Software Core and Model Services Mitch Satler, Vice President Public Policy Michael Young, M.E.Sc., P.E., Lead Wind Vulnerability Engineer, Product Development Professional Team Paul Fishwick, Ph.D., Computer Scientist Mark Johnson, Ph.D., Statistician, Team Leader Marty Simons, ACAS, Actuary Donna Sirmons, Staff
Professional Team Report – Risk Management Solutions, Inc. May 1-3, 2006 & May 15, 2006
5
GENERAL STANDARDS – Mark Johnson, Leader
G-1 Scope of the Computer Model and Its Implementation
The computer model shall project loss costs for personal lines residential property from hurricane events.
Audit 1. The main intent of the audit is to determine the capabilities of the model and to assess its
implementation for purposes of Florida projected loss costs. Copies of all representative or primary technical papers that describe the underlying model theory shall be made available.
2. Software located within the model, used to compile data used by the model, used to validate
the model, and used to project model loss costs will be reviewed interactively. 3. Databases or data files relevant to the modeler’s submission will be reviewed.
Pre-Visit Letter 1. G-1, Disclosure 2, page 22 – Be prepared to discuss why no further update to mobile home
vulnerability, although rapid revisions took place after 2004 season. 2. G-1, Disclosure 2, page 23 – Be prepared to discuss new building vulnerability classes
added. Verified: YES, Contingent upon additional documentation provided to the Commission Additional documentation received Professional Team Comments: Discussed how historical frequencies are applied in developing the stochastic storm set and the combined effect of multiple storms affecting a location for the calculation of annual deductibles. Discussed the land use land cover database and the use of ASTER data. Discussed the updates to the mobile home vulnerability data made in the previous submission and the focus this past year on other parts of the model, specifically commercial and residential vulnerability functions. Discussed claims data analyzed from the 2004 storm season and the assumptions made concerning reserves, etc. Discussed communications with the companies after receiving claims data to determine their progression through the claims development process.
Professional Team Report – Risk Management Solutions, Inc. May 1-3, 2006 & May 15, 2006
6
Discussed the new building vulnerability classes including changes to their primary building classes for residential, introduction of new year bands as a primary variable instead of as a modifier, introduction of a new vulnerability region for South Florida, merging of steel/concrete, and introduction of roof deck material. Reviewed increase in vulnerability functions due to additional breakdown by years built for all the different classes of vulnerability functions. Discussed application of the building classifications to different vulnerability regions. Revised response to be provided to the Commission:
• G-1.2, page 23, revised to correct number of building classifications and to update Table 1 for mobile home year bands.
********** Revised response to G-1.2 received and reviewed by the Professional Team. G-2 Qualifications of Modeler Personnel and Consultants
A. Model construction, testing, and evaluation shall be performed by
modeler personnel or consultants who possess the necessary skills, formal education, or experience to develop the relevant components for hurricane loss projection methodologies.
B. The model or any modifications to an accepted model shall be reviewed
by either modeler personnel or consultants in the following professional disciplines: structural/wind engineering (licensed Professional Engineer), statistics (advanced degree), actuarial science (Associate or Fellow of Casualty Actuarial Society), meteorology (advanced degree), and computer/information science (advanced degree). These individuals shall be signatories on Forms G-1 through G-6 as applicable and shall abide by the standards of professional conduct if adopted by their profession.
Audit 1. The professional vitae of modeler personnel and consultants responsible for the current model
and information on their predecessors if different than current personnel will be reviewed. Background information on individuals providing testimonial letters in the submission shall be provided.
2. Forms G-1, G-2, G-3, G-4, G-5, G-6, and all independent peer reviews of the model will be
reviewed.
Professional Team Report – Risk Management Solutions, Inc. May 1-3, 2006 & May 15, 2006
7
3. Discuss any known incidents where modeler personnel or consultants have been found to have failed to abide by the standards of professional conduct adopted by their profession.
Pre-Visit Letter 3. G-2, Disclosure 2, pages 39-42 – Review list of employees no longer with firm. 4. G-2, Disclosure 2, page 42 – Provide vita of Dr. Enrica Bellone who signed Form G-5 (page
85). The Professional Team will interview Dr. Bellone regarding the details of the review. 5. G-2, Disclosure 2.B, page 67 – List of new employees does not include Dr. Enrica Bellone
and Mr. Sameer Khandekar.
6. G-2, Disclosure 2.C, page 68 – The meteorology and the meteorological scientists in Table 2 (page 39) appear not to be part of the Flowchart in Figure 5 and/or the note below the figure. Be prepared to explain.
7. G-2, Disclosure 2.D, page 69 – Dr. Rex Britter in Table 7 is not mentioned in previous tables
provided for Disclosure 2. Verified: YES, Contingent upon additional documentation provided to the Commission Additional documentation received Professional Team Comments:
***Initial Review Comments*** Discussed personnel no longer with RMS and redirection of their responsibilities to other employees or new employees. Discussed new personnel involved in the model and reviewed the resumes for the following personnel:
• Enrica Bellone, Ph.D. in Statistics, University of Washington, Seattle, WA; B.S. in Economics, Universita di Pavia, Italy
• Rex E. Britter, Ph.D., Monash University • Aman Bhardwaj, Post Graduation in Computer Application, Institute of
Management Technology, India; B.S. Physics, Chemistry, Mathematics, Meerut College, India
• Vijaya Saradhi Divakaruni, MCA, Andhra University, India; B.S. in Electronics, Nagarjuna University, India
• Kalpana Ganesan, M.S. Computer Science, University of Nebraska, Lincoln, NE; B.E. Computer Science, University of Madras, India
• David Glaubman, Graduate Study in Mathematics, Northeastern University, Boston, MA; B.S. Mathematics, Northeastern University, Boston, MA
• Nathalie Grima, M.S. Mathematics, San Jose State University, San Jose, CA; B.S. in Applied Mathematics, University of Paris IX Dauphine, France
• Jason Lin, Ph.D., Department of Aerodynamics, Nanjing University of Aeronautics & Astronautics, China; M.E.Sc. Department of Aerodynamics,

Professional Team Report – Risk Management Solutions, Inc. May 1-3, 2006 & May 15, 2006
8
Nanjing University of Aeronautics & Astronautics, China; B.Eng. Department of Aircraft Engineering, Nanjing University of Aeronautics & Astronautics, China
• Charles Alexander Menun, Ph.D. Structural Engineering, Mechanics and Materials, University of California at Berkeley; M.A.Sc. Structural Engineering, University of British Columbia; B.A.Sc. Civil Engineering, University of British Columbia
• Paul MacManus, Ph.D. in Mathematics, Complex and Harmonic Analysis, Yale University; M.Sc. Analysis and Statistics, National University of Ireland; B.Sc. Mathematics and Mathematical Physics, National University of Ireland
• Kannan Narayanan, B.S. Chartered Accountant, Cost and Management Accountant
• Matthew J. Nielsen, M.S. Atmospheric Science, Colorado State University; B.A. in Physics, Ripon College, Ripon, WI
• Adam J. O’Shay, Ph.D. in Tropical Meteorology, Florida State University, Tallahassee, FL; M.S. in Meteorology, Florida State University, Tallahassee, FL; B.S. in Atmospheric Sciences, Cornell University, Ithaca, NY
• Ghanshyam Parasram, Bachelor of Technology, Jawahar Lal Nehru Technological University, India
• Agustin Rodriguez, M.S. in Structural Engineering, University of California at Berkeley, Berkeley, CA; B.S. in Civil Engineering Structures, Stanford University, Stanford, CA
• William D. Suchland, B.A. in Geography, University of Washington • Jianmin Lee, M.S. in Computer Science, University of Akron; MS. In
Meteorology, University of Oklahoma, B.S. in Environmental Science, Nanjing University, China
Discussed process for when a user reports a problem through problem verification and solution identified as indicated in the flowchart in Figure 5 on page 68. Discussed the independent peer reviews performed on the model and their relevance to the current submission. Discussed the importance of including only timely reviews in the submission. Revised responses to be provided to the Commission:
• G-2.2A, pages 39-40, Table 2 updated to include Dr. Rex Britter. • G-2.2B, page 67, to include new employees previously omitted. • G-2.2C, page 68, Figure 5 updated to reflect workflow diagram for all model
development. • G-2.2D, page 69, Table 7 updated to show Dr. Timothy Reinhold’s correct
affiliation. • Forms G-1 through G-6, pages 77-87, with updated signatures after revisions
made to the original February 28, 2006 submission. ********** Revised responses to G-2.2A, G-2.2B, G-2.2C, G-2.2D, and Forms G-1 through G-6 received and reviewed by the Professional Team.
Professional Team Report – Risk Management Solutions, Inc. May 1-3, 2006 & May 15, 2006
9
***Additional Verification Review Comments*** Reviewed resumes for the following personnel:
• Jonathan Moss, B.A. Mathematics, St. Norbert College, DePere, WI; Graduate Statistics, University of Arizona, Tucson, AZ
• Cindy Kuan, B.S. in Electrical Engineering and Computer Science, University of California, Berkeley, CA
G-3 Risk Location
A. ZIP Codes used in the model shall be updated at least every 24 months using information originating from the United States Postal Service. The United States Postal Service issue date of the updated information shall be reasonable.
B. ZIP Code centroids, when used in the model, shall be based on
population data.
C. ZIP Code information purchased by the modeler shall be verified by the modeler for accuracy and appropriateness.
Audit 1. Provide geographic displays for all ZIP Codes. The location of specific centroids will be
reviewed. 2. Provide the third party vendor, if applicable, and a complete description of the process used to
validate ZIP Code information.
Pre-Visit Letter 8. G-3, page 73 – Be prepared to review the entire process of ZIP Code updating, testing,
verification, and how this updating might affect other ZIP Code-based databases. Verified: YES Professional Team Comments: Discussed the process for reviewing and validating updates to ZIP Code information. Reviewed maps showing changes in the ZIP Code boundaries from the previous year. Reviewed the VRG (variable resolution grid) and the process for geocoding exposure. Reviewed the test plan and execution for geocoding implementation at various resolutions to ensure correct geocoding of locations at the ZIP code level.

Professional Team Report – Risk Management Solutions, Inc. May 1-3, 2006 & May 15, 2006
10
G-4 Submission Specifications* (*Significant Revision)
A. All units of measurement for model inputs and outputs shall be clearly identified.
B. All model outputs of length, wind speed, and pressure shall be in units
of statute miles, statute miles per hour, and millibars, respectively.
C. Unless otherwise specified, wind fields generated by the model shall be used for completing relevant Forms and Tables in the submission.
Audit 1. The appropriateness of the units of measurement will be reviewed. 2. The information used in completing Forms and Tables in the submission will be reviewed.
Verified: YES Professional Team Comments: Verified appropriate units of measurement used throughout the submission and exhibits. G-5 Independence of Model Components
The meteorological, vulnerability, and actuarial components of the model shall each be theoretically sound without compensation for potential bias from the other two components. Relationships within the model among the meteorological, vulnerability, and actuarial components shall be reasonable.
Audit 1. Demonstrate that the model components adequately portray hurricane phenomena and effects
(damage and loss costs). Attention will be paid to an assessment of (1) the theoretical soundness of each component and (2) the basis of their integration. For example, a model would not meet this Standard if an artificial calibration adjustment had been made to improve the match of historical and model results for a specific hurricane.
2. Describe all changes in the model since the previous submission that might impact the
independence of the model components.

Professional Team Report – Risk Management Solutions, Inc. May 1-3, 2006 & May 15, 2006
11
Verified: YES, CONTINGENT UPON REVIEW OF THE OUTPUT RANGES TO BE PROVIDED TO THE COMMISSION Professional Team Comments:
***Initial Review Comments*** The independence of the meteorology, vulnerability, and actuarial components and their theoretical soundness was verified in the course of the review. Changes developed in the model during the previous year did not invalidate the independence of the different model components. Final verification of this Standard requires a review of the additional material that is to be provided to the Commission.
***Additional Verification Review Comments*** Reviewed resubmitted material provided to the Commission and verified the independence of the meteorology, vulnerability, and actuarial components.
METEOROLOGICAL STANDARDS – Jenni Evans, Leader M-1 Base Hurricane Storm Set* (*Significant Revision)
For validation of landfall and by-passing storm frequency in the stochastic storm set, the modeler shall use the latest updated Official Hurricane Set or the National Hurricane Center HURDAT as of June 1, 2005 or later. Complete additional season increments based on updates to HURDAT approved by the Tropical Prediction Center/National Hurricane Center are acceptable modifications to these storm sets. Peer reviewed atmospheric science literature can be used to justify modifications to the Base Hurricane Storm Set.
Audit 1. The modeler’s Base Hurricane Storm Set will be reviewed.
Pre-Visit Letter 9. Be prepared to describe how multiple event years are treated in the model. Is there any
feedback to surface roughness?

Professional Team Report – Risk Management Solutions, Inc. May 1-3, 2006 & May 15, 2006
12
Verified: YES Professional Team Comments: Verified that there Is no feedback to surface roughness for multiple events. Discussed updates to the 2006 stochastic event rates through the 2005 hurricane season and corrections made to 6 storms for changes to central pressure in line with updates to the Official Hurricane Set. Reviewed plots and underlying data for the central pressure corrections. Discussed gate orientation for coastal gates and gate extensions and handling of by-passing storms. Reviewed the process for smoothing the gate counts in the historical record. Reviewed the changes in loss costs by county as a result of the update to the event rates considering the 2004 and 2005 hurricane seasons combined with other storm updates. Discussed data source for the 2005 storms included and reviewed data file for Hurricane Rita.
M-2 Hurricane Characteristics
Methods for depicting all modeled hurricane characteristics, including but not limited to wind speed, radial distributions of wind and pressure, minimum central pressure, radius of maximum winds, strike probabilities, tracks, the spatial and time variant wind fields, and conversion factors, shall be based on information documented by currently accepted scientific literature.
Audit 1. All hurricane characteristics used in the model will be reviewed.
2. Prepare graphical depictions of hurricane characteristics as used in the model. Describe and
justify: • the data set basis for the fitted distributions, • the modeled dependencies among correlated characteristics in the wind field
component and how they are represented, • the asymmetric nature of hurricanes, • the fitting methods used and any smoothing techniques employed.
3. The goodness-of-fit of distributions to historical data will be reviewed.
Professional Team Report – Risk Management Solutions, Inc. May 1-3, 2006 & May 15, 2006
13
4. The modeler will present time-based contour animations (capable of being paused) of wind and pressure fields to demonstrate scientifically reasonable wind field characteristics.
5. The treatment of uncertainties associated with the conversion of gradient winds to surface
winds will be compared with currently accepted literature. Variation of the conversion factor with storm intensity will be reviewed.
6. All modeler-specific scientific literature provided in Standard G-1 will be reviewed to determine acceptability.
7. Identify all external data sources that affect model generated wind fields.
Pre-Visit Letter 10. M-2, page 90 – What are the meteorological parameters in your model that are most critical
in terms of loss sensitivity? What is their relative importance and how is this assessed? Show example calculations of such an assessment.
11. M-2, page 90 – The analysis of far field pressure, Penv, in a recent report “suggests a value of
1011 or 1012 rather than the commonly used 1013 mb value.” However, when the analysis is further restricted to storms affected Florida, this conclusion is modified to be, “A case can be made that if a single value is to be used for Penv, 1010 mb or 1011 mb is more reasonable than 1013 mb.” What is the value of this parameter in the model and how does it vary? If this parameter does not vary, its effects will be wrapped into a shape or profile parameter. How is the variation of this profile parameter determined?
12. M-2, page 91 – Describe the “RMS analysis of empirical wind field data” used in
determining the wind field model. 13. M-2, Disclosure 3, page 92 – Be prepared to discuss the variation of the gradient to surface
winds conversion factor. 14. M-2, Disclosure 9, page 96 – Be prepared to discuss the treatment of hurricane intensity at
and immediately after landfall. 15. M-2, Disclosure 7, page 95 – Provide description of analyses performed relative to apparent
understatement of small storms as shown in Figure 6. Verified: YES, Contingent upon additional documentation provided to the Commission Additional documentation received Professional Team Comments: Discussed the meteorological variables in the model that are most critical to the characterization of hurricanes. Discussed the pressure profile coefficient. Discussed the use of a constant far field pressure in the model and the distribution of the pressure profile coefficient.

Professional Team Report – Risk Management Solutions, Inc. May 1-3, 2006 & May 15, 2006
14
Discussed update to the Rmax function and compared the Rmax relationships between last year and this year. Discussed use of H*Wind fields for determination of the adjustments to the Rmax distribution and RMS’ analysis of the H*Wind datasets. Reviewed plot of modeled Rmax and observed Rmax versus central pressure. Reviewed the Kolmogorov-Smirnov and Chi-Square tests on Rmax and a CDF plot of the confidence interval for Rmax. Discussed the gradient to surface wind conversion factor and the function used based on H*Wind surface wind field analyses from 1998 to 2001. Reviewed computer code for pressure profile coefficient. Discussed Bob Simpson’s review provided in Appendix C and its relevance to the current model in light of the answer provided in M-2.9. Discussed description of weakening over land on page 96 and on page 101. Revised responses to be provided to the Commission:
• M-2.1, page 91, to indicate correspondence of specific datasets with hurricane characteristics.
• M-2.7, page 95, Figure 6 revised to update stochastic counts to account for multiple landfalls per event.
********** Revised responses to M-2.1 and M-2.7 received and reviewed by the Professional Team.

Professional Team Report – Risk Management Solutions, Inc. May 1-3, 2006 & May 15, 2006
15
M-3 Landfall Intensity
Models shall use maximum one-minute sustained 10-meter wind speed when defining hurricane landfall intensity. This applies both to the Base Hurricane Storm Set used to develop landfall strike probabilities as a function of coastal location and to the modeled winds in each hurricane which causes damage. The associated maximum one-minute sustained 10-meter wind speed shall be within the range of wind speeds (in statute miles per hour) categorized by the Saffir-Simpson scale.
Saffir-Simpson Hurricane Scale:
Category Winds (mph) Damage
1 74 - 95 Minimal
2 96 - 110 Moderate
3 111 - 130 Extensive
4 131 - 155 Extreme
5 Over 155 Catastrophic Audit Demonstrate that the hurricane intensity at landfall is consistent with the Saffir-Simpson wind range for the stochastic storm set. Pre-Visit Letter 16. M-3, Disclosure 3, page 98 - The new disclosure reads “Provide all modeled characteristics
of the Florida hurricane in the stochastic storm set with the greatest over water intensity at the time of landfall.” This has not been done. As given in Standard G-1 of the RMS report (page 20), in addition to maximum wind speed, the “key storm parameters used in wind speed calculations include: central pressure, radius to maximum wind, wind profile, forward speed, direction, landfall location, and track.” These should all be disclosed for the single most intense (over water) hurricane that affected Florida. Data for individual Saffir Simpson categories are no longer required.
Verified: YES, Contingent upon additional documentation provided to the Commission Additional documentation received Professional Team Comments: Verified that event definition is consistent with Standard A-1.
Professional Team Report – Risk Management Solutions, Inc. May 1-3, 2006 & May 15, 2006
16
Reviewed the hurricane characteristics for the strongest storm upper limit wind speed affecting Florida produced by the model. Revised response to be provided to the Commission:
• M-3.3, page 98, revised to include all modeled characteristics rather than just the wind speed.
********** Revised response to M-3.3 received and reviewed by the Professional Team. M-4 Hurricane Probabilities
A. Modeled probability distributions for hurricane intensity, forward speed, radii for maximum winds, and storm heading shall be consistent with historical hurricanes in the Atlantic basin.
B. Modeled hurricane probabilities shall reasonably reflect the Base
Hurricane Storm Set used for category 1 to 5 hurricanes and shall be consistent with those observed for each coastal segment of Florida and neighboring states (Alabama, Georgia, and Mississippi).
Audit 1. Modeled probabilities are compared with observed hurricane frequency using methods
documented in currently accepted scientific literature. The goodness-of-fit of modeled to historical hurricane frequencies for the four regions of Florida and overall as provided in Form M-1 will be reviewed.
2. Demonstrate that the quality of fit extends beyond the Florida border by showing results for appropriate coastal segments in Alabama, Georgia, and Mississippi.
3. Describe and support the method of selecting stochastic storm tracks.
4. Describe and support the method of selecting storm track strike intervals. If strike locations are on a discrete set, show the landfall points for major metropolitan areas in Florida.
5. Provide any modeler specific research performed to develop the functions used for simulating model variables or to develop databases.
Verified: YES, Contingent upon additional documentation provided to the Commission Additional documentation received Professional Team Comments: Discussed assumptions used in creating the hurricane characteristics databases.
Professional Team Report – Risk Management Solutions, Inc. May 1-3, 2006 & May 15, 2006
17
Reviewed handling of by-passing storms in Form M-1, Figure 10. Verified that the 10-meter 1-minute sustained wind is used for determining storm category in the stochastic set. Revised responses to be provided to the Commission:
• M-4.1, page 99, to include more information. • Form M-1 and Figure 10, pages 106-107 to be corrected.
********** Revised responses to M-4.1, Form M-1 and Figure 10 received and reviewed by the Professional Team. M-5 Land Friction and Weakening* (*Significant Revision due to Disclosures)
A. The magnitude of land friction coefficients shall be consistent with currently accepted scientific literature relevant to current geographic surface roughness distributions and shall be implemented with appropriate geographic information system data.
B. The hurricane overland weakening rate methodology used by the model
shall be reasonable in comparison to historical records. Audit 1. Identify other variables in the model that affect over land wind speed estimation.
2. Maps depicting land friction effects are required. Describe the representation of land friction
effects in the model. Describe the variation in decay rate over land used in the model. 3. Comparisons of the model’s weakening rates to weakening rates for historical Florida
hurricanes will be reviewed.
4. Transition of winds from over water to over land (i.e. landfall) will be reviewed.
5. Form M-2 will be reviewed. Pre-Visit Letter 17. M-5, Disclosure 4, page 102 – Be prepared to discuss what fraction of the state has been
updated for land use land cover (LULC) using the more recent Aster data. What is the timeline for a complete statewide update for the LULC dataset?
18. M-5, Disclosure 5, page 103 – Be prepared to show agreement between observations and
windfields generated with your standard model for historical storm cases over land. It is acceptable to adjust the observed winds to the same averaging time assumed by the model,
Professional Team Report – Risk Management Solutions, Inc. May 1-3, 2006 & May 15, 2006
18
provided the same method of adjustment is used for all comparisons. It is not acceptable to refer to the Kaplan DeMaria decay rate without observed winds for the storms in question. The spatial distribution of winds should be compared for individual storms. Be prepared to explain any instances of poor agreement with reference to the meteorology of the case being considered.
19. M-5, Disclosure 5, page 104 – Be prepared to discuss sensitivity and uncertainty analysis
comparing the historical decay rates to the decay rates possible for modeled storms. Review Figure 9 in detail.
20. Form M-2.C, page 108 – The model produced maximum wind speed over Florida is required.
Provide this information. Verified: YES, Contingent upon additional documentation provided to the Commission Additional documentation received Professional Team Comments: Discussed use of ASTER data for updating the land use land cover data and the ASTER imagery collection dates. Discussed filling rate model description here and on page 96. Discussed analyses performed on wind observations versus spatial variation on stochastic model winds for modeling filling and wind speed decay rates. Reviewed examples of a range of model filling rates versus observed for Hurricane Charley and Hurricane Jeanne. Revised responses to be provided to the Commission:
• M-5.1, page 101, to correct filling rate description. • M-5.5, pages 103-104, to correct Figure 9 and provide more details in
explanation. • Form M-2, page 108, updated to include maximum wind speed over Florida
produced by the model. ********** Revised responses to M-5.1, M-5.5, and Form M-2 received and reviewed by the Professional Team. M-6 Logical Relationships of Hurricane Characteristics
A. The magnitude of asymmetry shall increase as the translation speed increases, all other factors held constant.
B. The wind speed shall decrease with increasing surface roughness
(friction), all other factors held constant.

Professional Team Report – Risk Management Solutions, Inc. May 1-3, 2006 & May 15, 2006
19
Audit 1. Form M-3 and the modeler’s sensitivity analyses provide the information used in auditing
this Standard. 2. Justify the relationship between central pressure and radius of maximum winds. Verified: YES Professional Team Comments: Reviewed Form M-3 and the treatment of Rmax in the model.
VULNERABILITY STANDARDS – Fred Stolaski, Leader V-1 Derivation of Vulnerability Functions
A. Development of the vulnerability functions is to be based on a combination of the following: (1) historical data, (2) tests, (3) structural calculations, (4) expert opinion, or (5) site inspections. Any development of the vulnerability functions based on structural calculations or expert opinion shall be supported by tests, site inspections, or historical data.
B. The method of derivation of the vulnerability functions shall be
theoretically sound.
C. Any modification factors/functions to the vulnerability functions or structural characteristics and their corresponding effects shall be clearly defined and be theoretically sound.
D. Construction type and construction characteristics shall be used in the
derivation and application of vulnerability functions.
E. In the derivation and application of vulnerability functions, assumptions concerning building code revisions and building code enforcement shall be reasonable and be theoretically sound.
F. Vulnerability functions shall be separately derived for building
structures, mobile homes, appurtenant structures, contents, and additional living expense.
G. The minimum wind speed that generates damage shall be reasonable.

Professional Team Report – Risk Management Solutions, Inc. May 1-3, 2006 & May 15, 2006
20
Audit 1. Historical data should be available in the original form with explanations for any changes
made and descriptions of how missing or incorrect data were handled. To the extent that historical data are used to develop vulnerability functions, demonstrate the goodness-of-fit of the data to fitted models. Complete reports detailing loading conditions and damage suffered are required for any test data used. Complete structural calculations shall be presented so that a variety of different structure types and construction characteristics may be selected for review. The basis for expert opinion and original site inspection reports should be available for review.
2. Copies of any papers, reports, and studies used in the development of the vulnerability
functions should be available for review. Copies of all public record documents used may be requested for review.
3. Multiple samples of vulnerability functions for building structures, mobile homes, appurtenant structures, contents, and additional living expense should be available. The magnitude of logical changes among these items for a given wind speed shall be explained and validation materials should be available.
4. Justify the construction types and characteristics used, and provide validation of the range
and direction of the variations in damage. 5. Document and justify all modifications to the vulnerability functions due to building codes
and their enforcement. 6. Provide validation material for the disclosed minimum wind speed. Provide the computer
code showing the inclusion of the minimum wind speed at which damage occurs. 7. Describe how the duration of wind speeds at a particular location over the life of a hurricane
is considered. 8. Form V-1 will be reviewed. Pre-Visit Letter 21. V-1, page 111 – Be prepared to describe any changes made to the vulnerability functions in
the past five years based upon engineering site inspections, insurance company claim data, etc.
22. V-1, Disclosure 1, page 114 – Be prepared to describe the process and software used in the
procedures provided in Figure 14. 23. V-1, Disclosure 2, page 115 – Provide summary of exposures and loss data sets referenced to
be shown to the Professional Team. • Summaries of exposure and loss data sets and their use in the development of
vulnerability functions will be available for on-site review by the Professional Team. 24. V-1, Disclosure 2, page 117 – Figure 15 seems to be the same figure provided in last year’s
submission even though the vulnerability functions have been updated.

Professional Team Report – Risk Management Solutions, Inc. May 1-3, 2006 & May 15, 2006
21
25. V-1, Disclosure 3, page 118 – Provide samples of reports and data collected in post-storm site inspections for 2004 and 2005 hurricanes.
26. V-1, Disclosure 5, page 119 – Be prepared to explain the large increase in the number of
categories of building classes relative to last year’s submission. Explain the reasons, methods, and provide examples of new classes and vulnerability model development.
27. V-1, Disclosure 5, page 119 – Be prepared to discuss the reason for not including 1976 and
1994 in the year bands given in Table 12 as there were code changes for mobile homes in those years.
28. V-1, Disclosure 7, page 120 – Provide more details on effects of duration of wind speeds as
provided in this disclosure. 29. Form V-1, Part B, page 123 – Provide an explanation for why the Part B values for each
construction class have not changed even though the estimated damage for wind speed ranges have changed relative to last year’s submission.
Verified: YES, Contingent upon additional documentation provided to the Commission Additional documentation received Professional Team Comments: Reviewed changes to the vulnerability module that included:
• Development of vulnerability curves for specific year bands rather than applying a year modifier.
• Implementation of age distributions for unknown year of construction. • Introduction of separate vulnerability regions for South Florida and the rest of the
state. • Revision of structure-content relationship for 2 story buildings after examining
recent claims data. • Changes to modeled uncertainty given a mean damage ratio. • Update to wood frame and masonry vulnerability curves based on loss data from
the 2004 and 2005 hurricanes. Discussed the vulnerability development and implementation process as provided in the flowchart in Figure 14, page 114. Discussed the process and documentation for analyzing the claims data and site inspections for use in modifying and validating the vulnerability functions. Reviewed survey of wind and surge damage site inspection reports from Hurricane Katrina. Documentation reviewed:
Hurricane Katrina: Profile of a Super Cat, Lessons and Implications for Catastrophe Risk Management, August 25-31, 2005
Professional Team Report – Risk Management Solutions, Inc. May 1-3, 2006 & May 15, 2006
22
Discussed basis for selection of areas to be covered for field site inspections and the information collected. Reviewed actual survey forms and engineering notes from several site inspections. Reviewed arial photos of damaged areas. Reviewed plot validating changes to the vulnerability function year bands comparing masonry claims data sorted by year band versus the previous model. Reviewed plots of the mean damage ratios for South Florida versus the rest of the state validating the development of a new South Florida vulnerability region. Reviewed plots of the mean damage ratios for structural loss versus contents loss validating the revision to the structure-content relationship for 2 or more story buildings. Discussed the impact of this new relationship on the renters and condo owners loss costs in the output ranges. Discussed the implementation of, and the basis for, the age distribution in the vulnerability model. Reviewed plot showing building population percentage by year built. Reviewed primary damage curves by region in Florida for contents loss by wind speed. Reviewed the computer code and “write vulnerability damage curve” macros for taking data from Excel spreadsheet and importing into ASCII data file. Discussed the process for validating the model output. Reviewed example of this process with three primary damage curves. Documentation reviewed:
• Gurley, K. (2005), “Post 2004 Hurricane Field Survey – an Evaluation of the Relative Performance of the Standard Building Code and the Florida Building Code”, Tenth Americas Conference on Wind Engineering, Baton Rouge, LA May 2005.
• FEMA (2005), “Summary Report on Building Performance: 2004 Hurricane Season”, Federal Emergency Management Agency, FEMA 490, March 2005.
Discussed partial damage from recent storms affecting subsequent storm damage. Discussed effects of duration of wind speeds and reviewed plots of the mean damage ratio versus duration for Hurricanes Georges, Hugo, and Andrew. Reviewed SQL scripts for data aggregation in vulnerability curves. Reviewed summary of exposure and claims data used for development and validation of vulnerability curves. Reviewed plot of the mean damage ratio versus peak gust wind speed for wood frame claims data showing the subtle change in the updates to the vulnerability curve.
Professional Team Report – Risk Management Solutions, Inc. May 1-3, 2006 & May 15, 2006
23
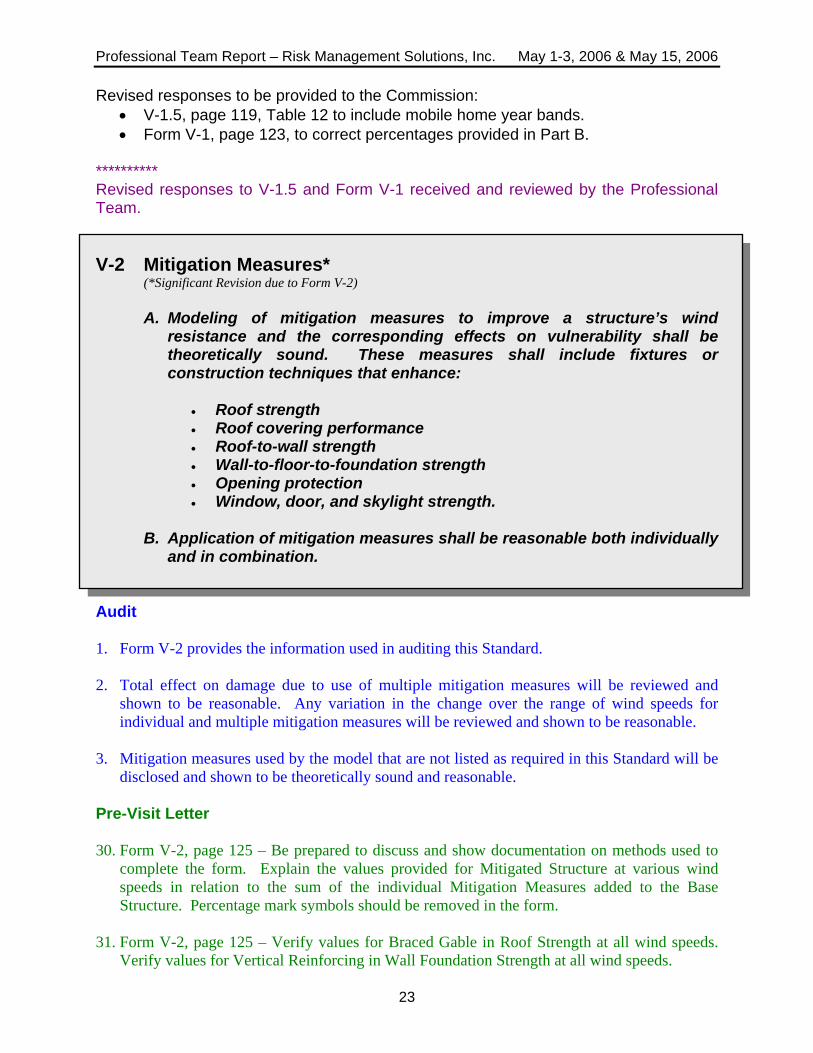
Revised responses to be provided to the Commission: • V-1.5, page 119, Table 12 to include mobile home year bands. • Form V-1, page 123, to correct percentages provided in Part B.
********** Revised responses to V-1.5 and Form V-1 received and reviewed by the Professional Team. V-2 Mitigation Measures*
(*Significant Revision due to Form V-2)
A. Modeling of mitigation measures to improve a structure’s wind resistance and the corresponding effects on vulnerability shall be theoretically sound. These measures shall include fixtures or construction techniques that enhance:
• Roof strength • Roof covering performance • Roof-to-wall strength • Wall-to-floor-to-foundation strength • Opening protection • Window, door, and skylight strength.
B. Application of mitigation measures shall be reasonable both individually
and in combination.
Audit 1. Form V-2 provides the information used in auditing this Standard. 2. Total effect on damage due to use of multiple mitigation measures will be reviewed and
shown to be reasonable. Any variation in the change over the range of wind speeds for individual and multiple mitigation measures will be reviewed and shown to be reasonable.
3. Mitigation measures used by the model that are not listed as required in this Standard will be
disclosed and shown to be theoretically sound and reasonable. Pre-Visit Letter 30. Form V-2, page 125 – Be prepared to discuss and show documentation on methods used to
complete the form. Explain the values provided for Mitigated Structure at various wind speeds in relation to the sum of the individual Mitigation Measures added to the Base Structure. Percentage mark symbols should be removed in the form.
31. Form V-2, page 125 – Verify values for Braced Gable in Roof Strength at all wind speeds.
Verify values for Vertical Reinforcing in Wall Foundation Strength at all wind speeds.

Professional Team Report – Risk Management Solutions, Inc. May 1-3, 2006 & May 15, 2006
24
Verified: YES
rofessional Team Comments:
eviewed percentage change in Form V-2 for damage rates at different wind speeds
iscussed in detail the effect of multiple mitigation measures on the change in damage
eviewed data flow diagram and macro flow diagram of process for creating the values
ACTUARIAL STANDARDS – Marty Simons, Leader
-1 Modeled Loss Costs*
odeled loss costs shall reflect all damages from storms that reach
udit
. The model will be reviewed to determine that the definition of an event in the model is
. The model will be reviewed to determine that by-passing storms and their effects are
erified: YES
rofessional Team Comments:
iscussed the definition of an event in the model, including the handling of by-passing
P Rwith mitigation features including roof covering, roof deck attachment, roof anchorage, and window protection individually and then all four mitigation features together on the base structure. Discussed values for percentage changes in Form V-2 for unbraced and braced gable ends. Dat the higher wind speeds. Rto be input into Form V-2.
A(*Significant Revision) Mhurricane strength and produce minimum damaging wind speeds or greater on land in Florida.
A 1
consistent with Standard A-1.
2considered in a manner that is consistent with Standard A-1.
V P Dstorms.

Professional Team Report – Risk Management Solutions, Inc. May 1-3, 2006 & May 15, 2006
25
A-2 Underwriting Assumptions
A. When used in the modeling process or for verification purposes, adjustments, edits, inclusions, or deletions to insurance company input data used by the modeler shall be based upon accepted actuarial, underwriting, and statistical procedures.
B. For loss cost estimates derived from or validated with historical insured
hurricane losses, the assumptions in the derivations concerning (1) construction characteristics, (2) policy provisions, (3) claim payment practices, and (4) relevant underwriting practices underlying those losses, as well as any actuarial modifications, shall be reasonable and appropriate.
Audit
Demonstrate how the claim practices of insurance companies are accounted for when claims data for those insurance companies are used to develop or to verify model calculations. For example, the level of damage the insurer considers a loss to be a “total loss.” Provide the methods used to delineate among the insurer claim practices in the use of historical claims data to verify model outputs.
Pre-Visit Letter 32. A-2.A, page 128 – Provide analyses of insurance data from 2004 storms. 33. A-2, Disclosure 2, page 128 – Describe how storm surge damage to the infrastructure “as not
excluded in calibrating wind-based ALE loss functions.” Describe how the effects of storm surge damage to the infrastructure on ALE losses are included.
Verified: YES Professional Team Comments: Reviewed summary of exposure and loss data sets and summary of claims data used for development and validation of vulnerability functions. Reviewed processes used for examining, adjusting, and including or excluding claims data for modeling and the impact of adjustments on the modeled loss costs. Reviewed adjustments made to claims data:
• from actual cash value to replacement cost value, • due to the timeliness of the claims data reporting, • for claims reported outside of the storm footprint area, • for demand surge.
Professional Team Report – Risk Management Solutions, Inc. May 1-3, 2006 & May 15, 2006
26
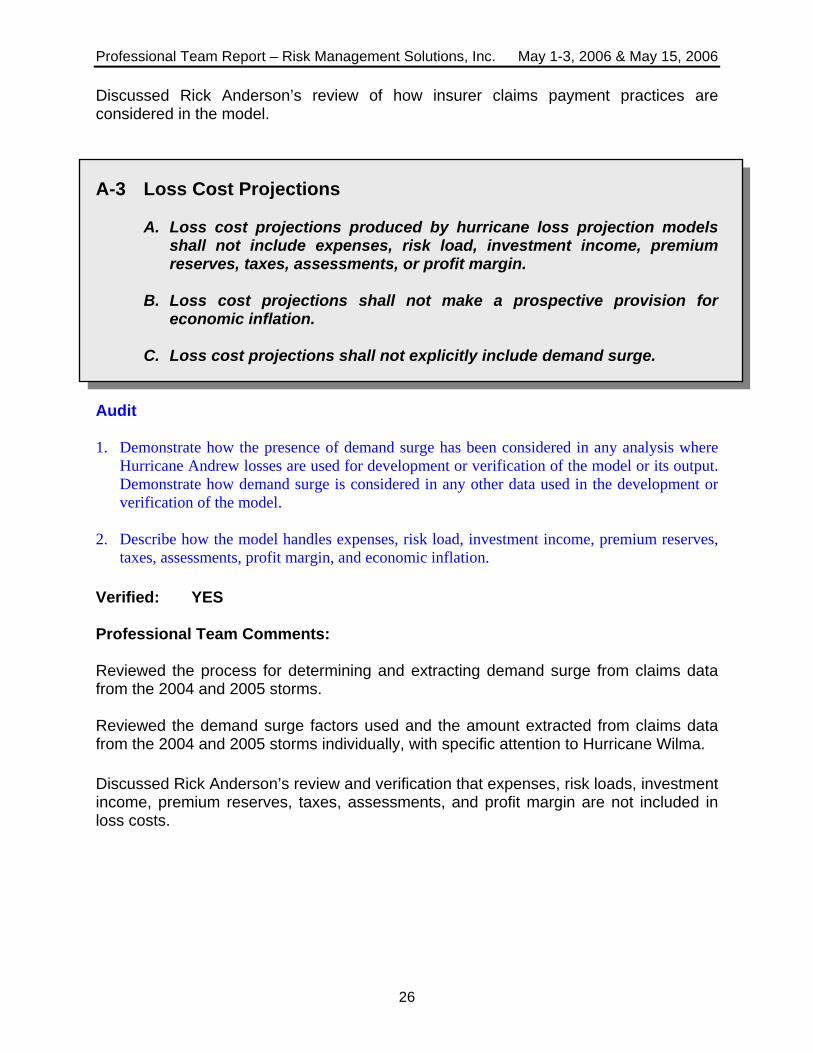
Discussed Rick Anderson’s review of how insurer claims payment practices are considered in the model. A-3 Loss Cost Projections
A. Loss cost projections produced by hurricane loss projection models shall not include expenses, risk load, investment income, premium reserves, taxes, assessments, or profit margin.
B. Loss cost projections shall not make a prospective provision for
economic inflation. C. Loss cost projections shall not explicitly include demand surge.
Audit 1. Demonstrate how the presence of demand surge has been considered in any analysis where
Hurricane Andrew losses are used for development or verification of the model or its output. Demonstrate how demand surge is considered in any other data used in the development or verification of the model.
2. Describe how the model handles expenses, risk load, investment income, premium reserves,
taxes, assessments, profit margin, and economic inflation. Verified: YES Professional Team Comments: Reviewed the process for determining and extracting demand surge from claims data from the 2004 and 2005 storms. Reviewed the demand surge factors used and the amount extracted from claims data from the 2004 and 2005 storms individually, with specific attention to Hurricane Wilma. Discussed Rick Anderson’s review and verification that expenses, risk loads, investment income, premium reserves, taxes, assessments, and profit margin are not included in loss costs.

Professional Team Report – Risk Management Solutions, Inc. May 1-3, 2006 & May 15, 2006
27
A-4 User Inputs
All modifications, adjustments, assumptions, and defaults necessary to use the inputs in the model shall be actuarially sound and included with the model output. Treatment of missing values for user inputs required to run the model shall be actuarially sound and described with the model output.
Audit 1. Quality assurance procedures should include methods to assure accuracy of insurance data.
Compliance with this Standard will be readily demonstrated through documented rules and procedures.
2. All insurer inputs and assumptions will be reviewed.
Verified: YES Professional Team Comments: Discussed quality assurance procedures for verifying the accuracy of insurance company data being used and methods used when insurance data is determined to be inappropriate. Discussed Rick Anderson’s review of assumptions made regarding inputs in the model. Reviewed communications with insurance companies on the development of their claims data.
Professional Team Report – Risk Management Solutions, Inc. May 1-3, 2006 & May 15, 2006
28
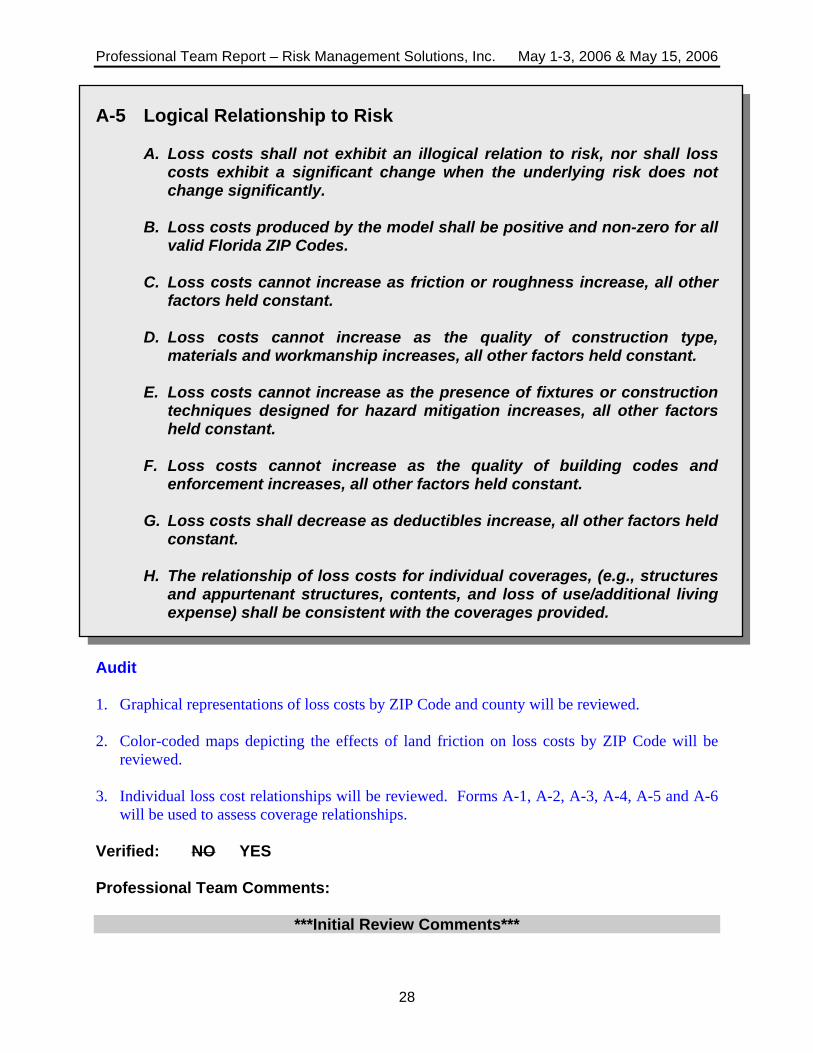
A-5 Logical Relationship to Risk
A. Loss costs shall not exhibit an illogical relation to risk, nor shall loss costs exhibit a significant change when the underlying risk does not change significantly.
B. Loss costs produced by the model shall be positive and non-zero for all
valid Florida ZIP Codes.
C. Loss costs cannot increase as friction or roughness increase, all other factors held constant.
D. Loss costs cannot increase as the quality of construction type,
materials and workmanship increases, all other factors held constant.
E. Loss costs cannot increase as the presence of fixtures or construction techniques designed for hazard mitigation increases, all other factors held constant.
F. Loss costs cannot increase as the quality of building codes and
enforcement increases, all other factors held constant.
G. Loss costs shall decrease as deductibles increase, all other factors held constant.
H. The relationship of loss costs for individual coverages, (e.g., structures
and appurtenant structures, contents, and loss of use/additional living expense) shall be consistent with the coverages provided.
Audit 1. Graphical representations of loss costs by ZIP Code and county will be reviewed.
2. Color-coded maps depicting the effects of land friction on loss costs by ZIP Code will be
reviewed.
3. Individual loss cost relationships will be reviewed. Forms A-1, A-2, A-3, A-4, A-5 and A-6 will be used to assess coverage relationships.
Verified: NO YES Professional Team Comments:
***Initial Review Comments***

Professional Team Report – Risk Management Solutions, Inc. May 1-3, 2006 & May 15, 2006
29
Discussed Rick Anderson’s review of the process for completing and verifying the information provided in Forms A-1 through A-6. Form A-2 to be resubmitted using corrected annual deductible calculation.
***Additional Verification Review Comments*** Reviewed revised Form A-2 with updated loss costs. A-6 Deductibles and Policy Limits*
(*Significant Revision)
A. The methods used in the development of mathematical distributions to reflect the effects of deductibles and policy limits shall be actuarially sound.
B. The relationship among the modeled deductible loss costs shall be
reasonable. C. Deductible loss costs shall be calculated in accordance with s.
627.701(5)(a), F.S.
Audit
The actuary for the modeler may be asked to attest to the actuarial soundness of the procedure for handling deductibles and policy limits. To the extent that historical data are used to develop mathematical depictions of deductibles and policy limit functions, demonstrate the goodness-of-fit of the data to fitted models. Justify changes from the prior submission in the relativities among corresponding deductible amounts for the same coverage. Pre-Visit Letter 34. A-6, page 139 – Provide a detailed description of the process used to ensure that deductibles
are calculated in accordance with s. 627.701(5)(a), Florida Statutes. Verified: NO YES Professional Team Comments:
***Initial Review Comments*** Reviewed the process for how the occurrence deductible and the average annual deductible are calculated and applied. Reviewed quality assurance tests and results. Reviewed the code in the software where the annual or occurrence deductible is calculated and applied.

Professional Team Report – Risk Management Solutions, Inc. May 1-3, 2006 & May 15, 2006
30
Reviewed presentation by individual who developed the process of calculating the annual deductible credits. RMS informed Professional Team of a bug detected in the software that incorrectly applied the annual deductible. Discussed in detail the steps undertaken to correct the error in the software. RMS to review and appropriately amend responses in submission for A-6.1 through A-6.3.
***Additional Verification Review Comments*** Reviewed calculation of hurricane and non-hurricane deductibles. Verified no revisions were required to the responses provided under Standard A-6. A-7 Contents
A. The methods used in the development of contents loss costs shall be actuarially sound.
B. The relationship between the modeled structure and contents loss costs
shall be reasonable, based on the relationship between historical structure and contents losses.
Audit
The actuary for the modeler may be asked to attest to the actuarial soundness of the procedure for calculating loss costs for contents coverage. To the extent that historical data are used to develop mathematical depictions of contents functions, demonstrate the goodness-of-fit of the data to fitted models. Justify changes from the prior submission in the relativities between loss costs for structures and the corresponding loss costs for contents.
Pre-Visit Letter 35. A-7, Disclosure 1, page 143 – Provide axis definitions for Figure 18 to the Professional
Team. Verified: YES, CONTINGENT UPON REVIEW OF THE OUTPUT RANGES TO BE PROVIDED TO THE COMMISSION Professional Team Comments:
***Initial Review Comments***

Professional Team Report – Risk Management Solutions, Inc. May 1-3, 2006 & May 15, 2006
31
Reviewed plot of structure and contents damage ratios from actual claims data. Verified no change in the methodology for handling contents losses.
***Additional Verification Review Comments*** Reviewed revised Form A-7, Output Ranges. A-8 Additional Living Expense (ALE)*
(*Significant Revision)
A. The methods used in the development of Additional Living Expense (ALE) loss costs shall be actuarially sound.
B. ALE loss cost derivations shall consider the estimated time required to
repair or replace the property.
C. The relationship between the modeled structure and ALE loss costs shall be reasonable, based on the relationship between historical structure and ALE losses.
D. ALE loss costs produced by the model shall appropriately consider ALE
claims arising from damage to the infrastructure.
Audit 1. The actuary for the modeler may be asked to attest to the actuarial soundness of the
procedure for calculating loss costs for ALE coverage. Documentation and justification of the following will be reviewed:
a. The method of derivation and data on which the ALE vulnerability function is based; b. Validation data specifically applicable to ALE; c. Assumptions regarding the coding of ALE losses by insurers; d. The effects of demand surge on ALE for Hurricane Andrew; e. Assumptions regarding the variability of ALE by size of property; f. Statewide application of ALE assumptions; g. Assumptions regarding ALE for mobile homes, tenants, and condo unit owners
exposure; h. The methods used to incorporate the estimated time required to repair or replace the
property; i. The methodology and available validation for determining the extent of infrastructure
damage and its effect on ALE costs. 2. To the extent that historical data are used to develop mathematical depictions of ALE
functions, demonstrate the goodness-of-fit of the data to fitted models.

Professional Team Report – Risk Management Solutions, Inc. May 1-3, 2006 & May 15, 2006
32
3. Justify the differences in the relationship of structure and ALE loss costs from those previously found acceptable.
Verified: YES, CONTINGENT UPON REVIEW OF THE OUTPUT RANGES TO BE PROVIDED TO THE COMMISSION Professional Team Comments:
***Initial Review Comments*** Verified no changes were made to the methodology for handling ALE.
***Additional Verification Review Comments*** Reviewed revised Form A-7, Output Ranges. A-9 Output Ranges
A. Output Ranges shall be logical and any deviations supported. B. All other factors held constant:
1. Output ranges produced by the model shall reflect lower loss costs
for masonry construction versus frame construction.
2. Output ranges produced by the model shall reflect lower loss costs for residential risk exposure versus mobile home risk exposure.
3. Output ranges produced by the model shall reflect lower loss costs,
in general, for inland counties versus coastal counties.
4. Output ranges produced by the model shall reflect lower loss costs, in general, for northern counties versus southern counties.
Audit 1. Forms A-7, A-8, and A-9 will be reviewed. 2. The modeler will be required to justify the following:
a. Changes from the prior submission of greater than five percent in weighted average loss costs for any county.
b. Changes from the prior submission of five percent or less in weighted average loss costs for any county.

Professional Team Report – Risk Management Solutions, Inc. May 1-3, 2006 & May 15, 2006
33
3. Output Ranges will be reviewed to ensure appropriate differentials among deductibles, coverage, and construction types.
4. Anomalies in the output range data will be reviewed and shall be justified. Pre-Visit Letter 36. A-9, Disclosure 2, page 148 – Describe how each change contributes to the percentages listed
in Form A-8. 37. A-9, Disclosure 2, page 148 – Review the updating of the Rmax distributions. 38. A-9, Disclosure 2, page 149 – Review intermediate values provided in Table 15. Show
samples of how values were obtained. 39. A-9, Disclosure 2, page 149 – Provide detailed description of underlying causes for the
results shown for Franklin County. 40. Form A-8, pages 224-225 – Verify values provided for Mobile Homes, Frame Condos, and
Masonry Condos for 1%, 2%, and 5%. Be prepared to review the Contents increases. Provide examples of how the values were obtained for sample categories such as Frame Owners/Inland at all deductible amounts.
41. Form A-9, page 226 – Discuss changes to Franklin and Monroe Counties as well as the
logical relationship to risk from Nassau to Duval to St. Johns and Flagler. • Review the updating of the Rmax distributions. (Include the decisions on other hurricane
characteristics not updated – for example, all the new tracks.) Verified: NO YES Professional Team Comments:
***Initial Review Comments*** Discussed in detail the process followed to complete Forms A-7 and A-8 in light of the error detected in the computer software for annual deductibles. Output Ranges will be rerun and corrections made to all affected Standards, Disclosures, and Forms. Revised responses to be provided to the Commission:
• A-9.2, pages 148-149, Table 15 • A-9.3, page 149 • A-9.4, page 149 • A-9.5, Form A-7, pages 172-223 • A-9.6, Form A-8, pages 224-225
Professional Team Report – Risk Management Solutions, Inc. May 1-3, 2006 & May 15, 2006
34
***Additional Verification Review Comments*** Reviewed change in loss cost by county brought about by update to the hazard and vulnerability components and in total. Reviewed Form A-8 and discussed the high percentage increases for renters and condos. Reviewed the relative change in loss costs for Duval, Flagler, Nassau, and Saint Johns counties. Reviewed revised Forms A-7 and A-8 with updated loss costs.
STATISTICAL STANDARDS – Mark Johnson, Leader
S-1 Modeled Results and Goodness-of-Fit
A. The use of historical data in developing the model shall be supported by
rigorous methods published in currently accepted scientific literature.
B. Modeled and historical results shall reflect agreement using currently accepted scientific and statistical methods.
Audit 1. Forms S-1 and S-2 will be reviewed. 2. The modeler’s characterization of uncertainty for wind speed, damage estimates, annual loss,
and loss costs will be reviewed. Pre-Visit Letter 42. S-1, page 228 – Explain the use of goodness-of-fit tests applied to a smoothed empirical
distribution. Verified: YES, Contingent upon additional documentation provided to the Commission Additional documentation received Professional Team Comments: Discussed the goodness-of-fit test applied to a smoothed empirical distribution. Discussed Enrica Bellone’s review of the statistical comparisons between historical and modeled data for central pressure, Rmax, and landfall rate.

Professional Team Report – Risk Management Solutions, Inc. May 1-3, 2006 & May 15, 2006
35
Reviewed results provided in Figures 26-28, pages 231-233, on the uncertainty in the loss costs due to the uncertainty in the central pressure, Rmax and forward velocity cumulative distribution functions. Reviewed the goodness-of-fit test plots and p-values on comparisons of historical versus modeled central pressure, forward speed, and Rmax cumulative distribution functions. Investigated the log Rmax distribution as a function of pressure difference and latitude. Revised responses to be provided to the Commission:
• S-1, page 228, to reflect truncation of Rmax distribution • S-1.6, page 234, Figure 29 to update p-values
********** Revised responses to S-1 and S-1.6 received and reviewed by the Professional Team. S-2 Sensitivity Analysis for Model Output
The modeler shall have assessed the sensitivity of temporal and spatial outputs with respect to the simultaneous variation of input variables using currently accepted scientific and statistical methods and have taken appropriate action.
Audit
1. The modeler’s sensitivity analysis will be reviewed in detail. Statistical techniques used to perform sensitivity analysis shall be explicitly stated. The results of the sensitivity analysis displayed in graphical format (e.g., contour plots with temporal animation) will be reviewed.
2. Form S-5 will be reviewed for new modeling companies which have not previously provided
the Commission with this analysis. Verified: YES Professional Team Comments: Discussed change in loss costs due to a 1% change in central pressure difference, Rmax, and forward speed variables. Discussed Enrica Bellone’s review of the sensitivity study results.
Professional Team Report – Risk Management Solutions, Inc. May 1-3, 2006 & May 15, 2006
36
S-3 Uncertainty Analysis for Model Output
The modeler shall have performed an uncertainty analysis on the temporal and spatial outputs of the model using currently accepted scientific and statistical methods and have taken appropriate action. The analysis shall identify and quantify the extent that input variables impact the uncertainty in model output as the input variables are simultaneously varied.
Audit
1. The modeler’s uncertainty analysis will be reviewed in detail. Statistical techniques used to perform uncertainty analysis shall be explicitly stated. The results of the uncertainty analysis displayed in graphical format (e.g., contour plots with temporal animation) will be reviewed.
2. Form S-5 will be reviewed for new modeling companies which have not previously provided
the Commission with this analysis. Verified: YES Professional Team Comments: Discussed the change in loss costs due to changing the central pressure difference, Rmax, and forward speed variables to the 5% and 95% confidence bounds. Discussed Enrica Bellone’s review of the uncertainty study results. S-4 County Level Aggregation
At the county level of aggregation, the contribution to the error in loss cost estimates attributable to the sampling process shall be negligible.
Audit
Provide a graph assessing the accuracy associated with a low impact area such as Nassau County. We would expect that if the contribution error in an area such as Nassau County is small, the error in the other areas would be small as well. Assess where appropriate, the contribution of simulation uncertainty via confidence intervals.
Verified: YES
Professional Team Report – Risk Management Solutions, Inc. May 1-3, 2006 & May 15, 2006
37
Professional Team Comments: Reviewed the process and results of the sampling of the stochastic storm set using approximately 100,000 years and the effect on the average annual loss of reducing the number of years by 5%. S-5 Replication of Known Hurricane Losses
The model shall reasonably replicate incurred losses in an unbiased manner on a sufficient body of past hurricane events from more than one company, including the most current data available to the modeler. This Standard applies separately to personal residential and, to the extent data are available, to mobile homes. Personal residential experience may be used to replicate structure-only and contents-only losses. The replications shall be produced on an objective body of loss data by county or an appropriate level of geographic detail.
Audit 1. The following information for each insurer and hurricane will be reviewed:
a. The validity of the model assessed by comparing expected losses produced by the model to actual observed losses incurred by insurers at both the state and county level,
b. The version of the model used to calculate modeled losses for each hurricane provided, c. A general description of the data and its source, d. A disclosure of any material mismatch of exposure and loss data problems, or other
material consideration, e. The date of the exposures used for modeling and the date of the hurricane, f. An explanation of differences in the actual and modeled hurricane parameters, g. A listing of the departures, if any, in the wind field applied to a particular hurricane for
the purpose of validation and the wind field used in the model under consideration, h. The type of property used in each hurricane to address:
a. Personal versus commercial b. Residential structures c. Mobile homes d. Condominiums e. Structures only f. Contents only,
i. The inclusion of demand surge, storm surge, loss adjustment expenses, or law and ordinance coverage in the actual losses, or the modeled losses.
2. The following documentation will be reviewed:
a. Publicly available documentation referenced in the submission, b. The data sources excluded from validation and the reasons for excluding the data from
review by the Commission (if any), c. An analysis that identifies and explains anomalies observed in the validation data,

Professional Team Report – Risk Management Solutions, Inc. May 1-3, 2006 & May 15, 2006
38
d. User input sheets for each insurer and hurricane detailing specific assumptions made with regard to exposed property.
3. The confidence intervals used to gauge the comparison between historical and modeled
losses will be reviewed.
4. Form S-3 will be reviewed. 5. The results of one hurricane event for more than one insurance company and the results from
one insurance company for more than one hurricane event will be reviewed to the extent data are available.
Pre-Visit Letter 43. S-5, Disclosure 1, page 250 – Review the estimated and actual losses from the 2004 season in
detail. Verified: YES, Contingent upon additional documentation provided to the Commission Additional documentation received Professional Team Comments: Reviewed claims data from Hurricane Ivan and the effect of storm surge on the reported losses. Reviewed actual client loss data comparison provided in Table 22, page 250. Revised responses to be provided to the Commission:
• S-5, Figure 37, page 248, revised to update Property Claims Services estimates and modeled estimates of residential losses.
• S-5.1, Table 22 & 23, page 250, revised to update Property Claims Services estimates and modeled loss estimates.
********** Revised responses to S-5 and S-5.1 received and reviewed by the Professional Team. S-6 Comparison of Projected Hurricane Loss Costs
The difference, due to uncertainty, between historical and modeled annual average statewide loss costs shall be reasonable, given the body of data, by established statistical expectations and norms.
Audit 1. Form S-4 will be reviewed.
Professional Team Report – Risk Management Solutions, Inc. May 1-3, 2006 & May 15, 2006
39
2. Justify the following: a. Meteorological parameters, b. The effect of by-passing storms, c. The effect of actual hurricanes that had two landfalls impacting Florida, d. The departures, if any, from the wind field, vulnerability functions, or insurance functions
applied to the actual hurricanes for the purposes of this test and those used in the model under consideration, and
e. Exposure assumptions.
Verified: YES Professional Team Comments: Reviewed results provided in Form S-4. Discussed Rick Anderson’s and Enrica Bellone’s review of Form S-4 results.
COMPUTER STANDARDS – Paul Fishwick, Leader C-1 Documentation
A. The modeler shall maintain a primary document binder, containing a complete set of documents specifying the model structure, detailed software description, and functionality. Development of each section shall be indicative of accepted software engineering practices.
B. All computer software (i.e., user interface, scientific, engineering,
actuarial, data preparation, and validation) relevant to the modeler’s submission shall be consistently documented and dated.
C. Documentation shall be created separately from the source code.
Audit 1. The primary document binder, in either electronic or physical form, and its maintenance
process will be reviewed. The binder shall contain fully documented sections for each Computer Standard.
2. All documentation shall be easily accessible from a central location. 3. Complete user documentation, including all recent updates, will be reviewed.

Professional Team Report – Risk Management Solutions, Inc. May 1-3, 2006 & May 15, 2006
40
4. Modeler personnel, or their designated proxies, responsible for each aspect of the software (i.e. user interface, quality assurance, engineering, actuarial) shall be present when the Computer Standards are being audited. Internal users of the software will be interviewed.
5. Provide verification that documentation is created separately from the source code. Pre-Visit Letter 44. Pages 263-279 – Provide all documents, binders, etc. referenced to be made available to the
Professional Team. • Page 263, C-1.A – A Computer Standards primary document binder in electronic
form has been prepared by RMS and is available for on-site review by the Professional Team.
• Page 263, C-1.B – Appropriate personnel for software, data preparation and validation, as well as internal users of the software, will be available to the Professional Team when the Computer Standards are being audited.
Verified: YES Professional Team Comments: Reviewed the primary document binder maintained in electronic format with folder hierarchy indexes for material by standard. Reviewed user documentation included in RiskLink DLM 5.1 User Guide, September 2005. Reviewed documentation on the derivation of the method for handling annual deductibles. C-2 Requirements
The modeler shall maintain a complete set of requirements for each software component as well as for each database or data file accessed by a component.
Audit
Provide confirmation that a complete set of requirements for each software component, as well as for each database or data file accessed by a component, has been maintained and documented. Pre-Visit Letter 44. Pages 263-279 – Provide all documents, binders, etc. referenced to be made available to the
Professional Team.
Professional Team Report – Risk Management Solutions, Inc. May 1-3, 2006 & May 15, 2006
41
• Page 264, C-2 – This documentation, which is described in the response to disclosure C-2, is available for on-site review by the Professional Team.
• Page 264, C-2.1 – Requirements documentation available for on-site review by the Professional Team includes: o RiskLink System Administration Guide… o RiskLink DLM User Guide… o Coding Standards… o Market Requirements… o Functional Specifications… o Project Management Documents… o Visual SourceSafe 6.0… o Information Technology Security Documents… o Quality Assurance Test Plans…
Verified: YES Professional Team Comments: Reviewed the requirements documentation for updating and implementing the changes to Rmax and the annual deductible. Reviewed requirements documentation for Fortran coding guidelines, Hurricane Model Development Tools, April 2005. Discussed quality assurance test plans in light of the bug detected in the annual deductible software program. Documentation reviewed:
• Test Plan for USHU Model Implementation, 2006, RiskLink Release 5.1a C-3 Model Architecture and Component Design
The modeler shall maintain and document (1) detailed control and data flow diagrams and interface specifications for each software component, and (2) schema definitions for each database and data file. Documentation shall be to the level of components that make significant contributions to the model output.
Audit 1. The following will be reviewed:
a. Detailed control and data flow diagrams, completely and sufficiently labeled for each component,
b. Interface specifications for all components in the model, c. Documentation for schemas for all data files, along with field type definitions,
Professional Team Report – Risk Management Solutions, Inc. May 1-3, 2006 & May 15, 2006
d. Each network diagram including components, sub-component diagrams, arcs, and labels.
2. A model component custodian, or designated proxy, should be available for the review of each component.
Pre-Visit Letter 44. Pages 263-279 – Provide all documents, binders, etc. referenced to be made available to the
Professional Team. • Page 266, C-3 – This internal model architecture and component design
documentation, as well as the developers or modelers responsible for each component, are available for on-site review by the Professional Team.
Verified: YES Professional Team Comments: Reviewed schema definition for vulnerability curve data file. Reviewed RiskLink software developer table by area of model component responsibility and verified the participation of individuals named. Reviewed vulnerability summary flow diagram. Reviewed dataflow diagram for the vulnerability damage curve aggregation.
C-4 Implementation
A. The modeler shall maintain a complete procedure of coding guidelines consistent with accepted software engineering practices.
B. The modeler shall maintain a complete procedure used in creating,
deriving, or procuring and verifying databases or data files accessed by components.
C. All components shall be traceable, through explicit component
identification in the flow diagrams, down to the code level. D. The modeler shall maintain a table of all software components affecting
loss costs, with the following table columns: (1) Component name, (2) Number of lines of code, minus blank and comment lines; and (3) Number of explanatory comment lines.
E. Each component shall be sufficiently and consistently commented so
that a software engineer unfamiliar with the code shall be able to comprehend the component logic at a reasonable level of abstraction.
Professional Team Report – Risk Management Solutions, Inc. May 1-3, 2006 & May 15, 2006
43
Audit
1. The interfaces and the coupling assumptions will be reviewed. 2. Provide the documented coding guidelines and confirm that these guidelines are uniformly
implemented. 3. The procedure used in creating, deriving, or procuring and verifying databases or data files
accessed by components will be reviewed. 4. The traceability among components at all levels of representation will be reviewed. 5. The following information shall be available and will be reviewed for each component, either
in a header comment block, source control database, or the documentation: component name, date created, dates modified and by whom, purpose or function of the component, and input and output parameter definitions.
6. The table of all software components as specified in C-4.D will be reviewed. 7. Model components and the method of mapping to elements in the computer program will be
reviewed. 8. Comments within components will be examined for sufficiency, consistency, and
explanatory quality. Pre-Visit Letter 44. Pages 263-279 – Provide all documents, binders, etc. referenced to be made available to the
Professional Team. • Page 268, C-4.C – Detailed data flow diagrams of the model components will be
available for review by the Professional Team. Verified: NO YES Professional Team Comments:
***Initial Review Comments*** Reviewed metrics table of software components for statistics code and Rmax scaling. Reviewed code for Rmax scaling. Reviewed vulnerability SQL script for claims data tables and code explanation comments. Reviewed code for gradient to surface wind conversion. Reviewed a macro for preparing an ASCII file for storing the vulnerability damage curves in database form.
Professional Team Report – Risk Management Solutions, Inc. May 1-3, 2006 & May 15, 2006
44
Reviewed the implementation of the annual deductible calculation. Revisions to be reviewed by the Professional Team:
• A new table of components, which will include the annual deductible code.
***Additional Verification Review Comments*** Reviewed new table of components for the annual deductible source and validation code. Reviewed correction made in annual deductible source code. Reviewed QA testing procedures and results. Reviewed additional annual deductible documentation:
• Technical Specifications [Seasonal Deductibles Feature] Revision 1.0 • Annual Deductible Program Users Guide • Visual Intercept Incident log for the bug review • Annual Deductible QA Test Report • Annual Deductible QA Test Results • Simulation Functional Spec

Professional Team Report – Risk Management Solutions, Inc. May 1-3, 2006 & May 15, 2006
45
C-5 Verification
A. General
For each component, the modeler shall maintain procedures for verification, such as code inspections, reviews, calculation crosschecks, and walkthroughs, sufficient to demonstrate code correctness.
B. Component Testing
1. The modeler shall use testing software to assist in documenting and analyzing all components.
2. Unit tests shall be performed and documented for each component. 3. Regression tests shall be performed and documented on incremental
builds. 4. Aggregation tests shall be performed and documented to ensure the
correctness of all model components. Sufficient testing shall be performed to ensure that all components have been executed at least once.
C. Data Testing
1. The modeler shall use testing software to assist in documenting and
analyzing all databases and data files accessed by components. 2. The modeler shall perform and document integrity, consistency, and
correctness checks on all databases and data files accessed by the components.
Audit
1. The components will be reviewed for containment of sufficient logical assertions, exception-
handling mechanisms, and flag-triggered output statements to test the correct values for key variables that might be subject to modification.
2. The testing software used by the modeler will be reviewed.
3. The component (unit, regression, aggregation) and data test processes and documentation
will be reviewed.
Professional Team Report – Risk Management Solutions, Inc. May 1-3, 2006 & May 15, 2006
46
Pre-Visit Letter 45. C-5.B-4, page 271 – Demonstrate that sufficient testing has been performed to ensure that all
components have been executed at least once. Verified: NO YES Professional Team Comments:
***Initial Review Comments*** Discussed automated test coverage tool that runs all relevant tests and tracks code execution down to the line level and the issues associated with this approach. Discussed quality assurance test coverage monitoring on all new or modified components and all previously existing functional specifications. Discussed continuous review of reported problems and actions taken to prevent problems of reoccurrence without detection. Reviewed sign-off documentation of quality assurance test results by functional area Discussed testing of all databases and data files supplied and the schema. Reviewed a unit test for a macro defined for creating an ASCII file to be imported into the database relating to vulnerability damage curve processing. Reviewed test of the annual deductible approach by company a pure numerical simulation approach with the mathematical modeling method used for the model. The discussion included a bug found in the calculation affecting the loss costs. Regarding the annual deductible code:
(1) Testing software was constructed but its use prior to the model submission was not documented.
(2) Testing was reported to have taken place prior to the submission, but not on the model being audited (RiskLink 5.1a).
Revisions to be reviewed by the Professional Team:
• A revised documented business workflow process to ensure that the risk of future software or data errors is mitigated. This workflow should be broad enough to encompass all code and data referred to in Standard G-1, Audit item 2.
***Additional Verification Review Comments***
Reviewed summary of unit testing for the annual deductible code. Reviewed business workflow process to ensure complete coverage including education of employees and auditing of deliverables.

Professional Team Report – Risk Management Solutions, Inc. May 1-3, 2006 & May 15, 2006
47
Reviewed Test Plan for VI#16226: Loss Costs Updates for Annual Deductibles for RiskLink Release 5.1a. C-6 Model Maintenance and Revision
A. The modeler shall maintain a clearly written policy for model revision,
including verification and validation of revised components, databases, and data files.
B. A revision to any portion of the model that results in a change in any
Florida residential hurricane loss cost shall result in a new model version number.
C. The modeler shall use tracking software to identify all errors, as well as
modifications to code, data, and documentation.
Audit
1. All policies and procedures used to maintain the code, data, and documentation will be
reviewed. For each component in the system decomposition, the modeler should provide the installation date under configuration control, the current version number, and the date of the most recent change(s).
2. The policy for model revision will be reviewed. 3. The tracking software will be reviewed. Pre-Visit Letter 44. Pages 263-279 – Provide all documents, binders, etc. referenced to be made available to the
Professional Team. • Page 277, C-6.1 – These systems and procedures are available for detailed review by
the Professional Team. Verified: NO YES Professional Team Comments:
***Initial Review Comments*** Reviewed the policy for revisions made to the model including upgrades of the model development tools. Discussed tracking software processes and how the error in the annual deductible software code was not detected or documented.
Professional Team Report – Risk Management Solutions, Inc. May 1-3, 2006 & May 15, 2006
48
With regard to the annual deductible code, tracking software was not used prior to the model submission. Its first documented use was April 28, 2006. Revisions to be reviewed by the Professional Team:
As stated in Standard G-1, Audit item 2, all model code, databases, data files, and any codes used in developing these are covered by the Computer Standards. A modified policy of model revision that includes this scope will be provided.
***Additional Verification Review Comments***
Reviewed additional material provided in presentation to Professional Team as well as copies of memorandums describing the implementation of the revised quality assurance scope. C-7 Security
The modeler shall have implemented and fully documented security procedures for: (1) secure access to individual computers where the software components or data can be created or modified, (2) secure operation of the model by clients, if relevant, to ensure that the correct software operation cannot be compromised, (3) anti-virus software installation for all machines where all components and data are being accessed, and (4) secure access to documentation, software, and data in the event of a catastrophe.
Audit 1. The written policy for all procedures and methods used to ensure the security of code, data,
and documentation will be reviewed. Specify all security procedures. 2. Documented security procedures for access, client model use, anti-virus software installation,
and off-site procedures in the event of a catastrophe will be reviewed. Verified: YES Professional Team Comments: Reviewed the policy and procedures for ensuring security of the computer code, data, and documentation including use of user login identifications and passwords. Reviewed internal correspondence on virus, access, and backup policies. Documentation reviewed:
• Information Security Policy & Procedures, December 30, 2005