Florida Building Code Cost and Loss Reduction Benefit ... Main report.pdf · Florida Building Code...
54
Florida Building Code Cost and Loss Reduction Benefit Comparison Study Prepared for: Florida Department of Community Affairs 2555 Shumard Oak Blvd. Tallahassee, Florida 32399 Prepared by: Shimberg Center for Affordable Housing University of Florida P.O. Box 115703 Gainesville, Florida 32611 and Applied Research Associates, Inc. 811 Spring Forest Road, Suite 100 Raleigh, NC 27609 January 2002 Contract Number 01-RC-11-12-00-22-002
Transcript of Florida Building Code Cost and Loss Reduction Benefit ... Main report.pdf · Florida Building Code...

Florida Building Code Cost and Loss Reduction Benefit Comparison Study
Prepared for:
Florida Department of Community Affairs 2555 Shumard Oak Blvd.
Tallahassee, Florida 32399
Prepared by:
Shimberg Center for Affordable Housing University of Florida
P.O. Box 115703 Gainesville, Florida 32611
and
Applied Research Associates, Inc. 811 Spring Forest Road, Suite 100
Raleigh, NC 27609
January 2002
Contract Number 01-RC-11-12-00-22-002

EXECUTIVE SUMMARY
Under Section 110 of Chapter 2000-141, Laws of Florida, the Department of Community Affairs is directed to undertake a demonstration and education project to illustrate the true cost impact on residential single-family house building associated with the implementation of the Florida Building Code (FBC). The project was initiated last fiscal year, 2000/2001, under Contract # 01-RC-11-12-00-22-002 with the University of Florida, and was expected to yield 12 houses placed in various locations throughout the State. Due to time constraints and builder participation difficulties, only 3 of the 12 houses were physically built. Collected cost data for the three houses presents a very limited basis for evaluating the impact of the FBC; therefore, given the present time constraints of providing information to the Florida Legislature in January 2002, computer modeling was utilized for the design and evaluation process of the three houses for 25 other locations within the State. The analyses were performed by Applied Research Associates, Inc. (ARA) under Contract # 020-RC-11-14-00-22-005.
The Florida Home Builders identified the builders that constructed the three houses actually built in the program. Two of the houses have masonry exterior walls and range in size from 2,200 to 2,900 total square feet, and are located in Brevard County, and Lee County (House A and B). A third upscale three-story wood frame house with more than 4,800 total square feet was constructed in Walton County (House C). Because this house was not representative of the majority of wood frame houses in Florida, it was replaced with a single-story 2,200 square foot wood frame house (House D) for the computer modeling portion of the project.
Ten categories of new requirements of the FBC were identified that will likely affect construction costs: wind loads, termites, concrete slabs, gable end-walls, screen enclosures, swimming pool, energy code, mechanical code, plumbing code, and general requirements that are not building specific. Considerations within the wind loads category are: wind speed, exposure classification, enclosure classification, walls, windows, sliding glass doors, wind borne debris protection, entrance and garage doors, roof covering, and roof structure. Cost impact estimates were made for each of the ten categories. Some of the costs that could be attributed to the FBC are actually due to changes that would have occurred under the State Minimum Building Codes (the Building Codes) law which mandates the adoption of the latest edition of the Standard Building Codes. For example, as mandated by Section 553.19, Florida Statutes, the latest edition of the National Electrical Code “1999” was adopted on September 19, 1999 and also was adopted by reference in the FBC as the minimum electrical code for the state. These types of costs were not included in the study.
The Standard Building Code (SBC) was used as the reference to determine the cost impact of the FBC. The SBC is the model building code that was used in much of Florida (except those counties that use the South Florida Building Code (SFBC)). Because the SBC was used as the reference code and the fact that none of the three original houses were located in Southeast Florida (Miami-Dade and Broward counties), the scope of this study did not address the cost impact from the SFBC to the FBC. Such cost impacts are expected to be insignificant since the hurricane protection standards of the FBC for Southeast Florida are very similar to those previously incorporated into the SFBC.
The FBC includes a new design wind speed map that measures wind speed differently than in the past (Figure 1). Under the SBC, wind speeds were measured in terms of “fastest mile” and
ii
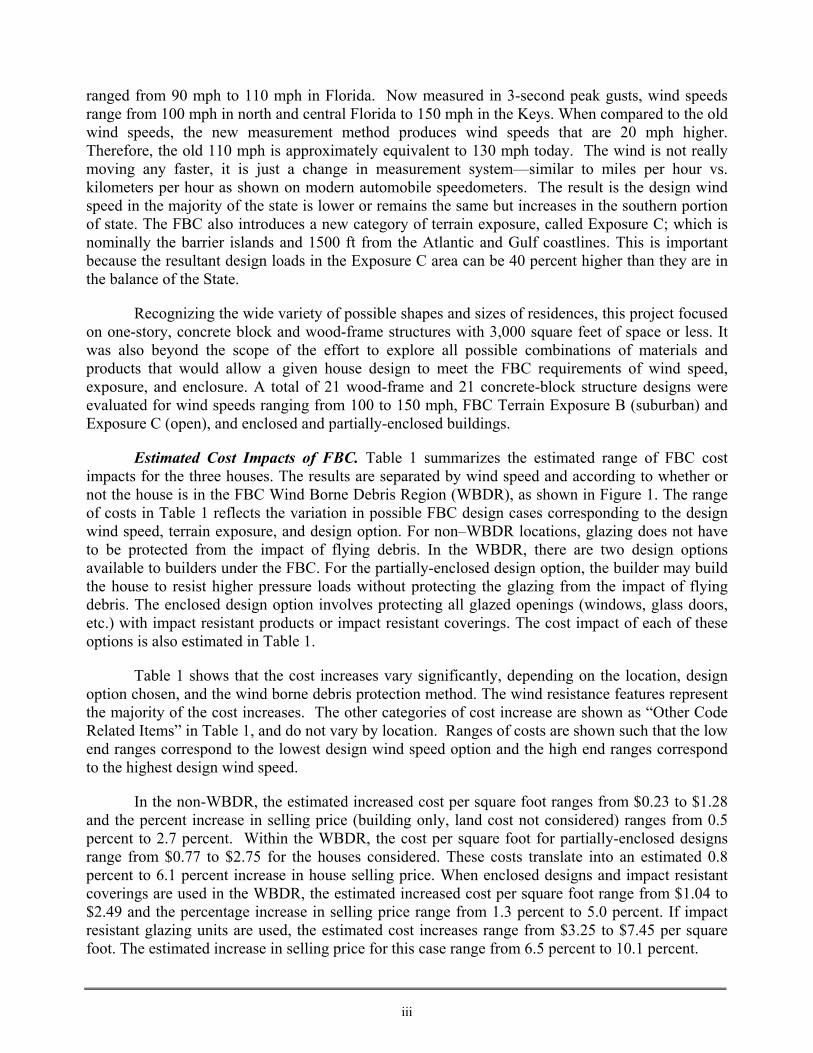
ranged from 90 mph to 110 mph in Florida. Now measured in 3-second peak gusts, wind speeds range from 100 mph in north and central Florida to 150 mph in the Keys. When compared to the old wind speeds, the new measurement method produces wind speeds that are 20 mph higher. Therefore, the old 110 mph is approximately equivalent to 130 mph today. The wind is not really moving any faster, it is just a change in measurement system—similar to miles per hour vs. kilometers per hour as shown on modern automobile speedometers. The result is the design wind speed in the majority of the state is lower or remains the same but increases in the southern portion of state. The FBC also introduces a new category of terrain exposure, called Exposure C; which is nominally the barrier islands and 1500 ft from the Atlantic and Gulf coastlines. This is important because the resultant design loads in the Exposure C area can be 40 percent higher than they are in the balance of the State.
Recognizing the wide variety of possible shapes and sizes of residences, this project focused on one-story, concrete block and wood-frame structures with 3,000 square feet of space or less. It was also beyond the scope of the effort to explore all possible combinations of materials and products that would allow a given house design to meet the FBC requirements of wind speed, exposure, and enclosure. A total of 21 wood-frame and 21 concrete-block structure designs were evaluated for wind speeds ranging from 100 to 150 mph, FBC Terrain Exposure B (suburban) and Exposure C (open), and enclosed and partially-enclosed buildings.
Estimated Cost Impacts of FBC. Table 1 summarizes the estimated range of FBC cost impacts for the three houses. The results are separated by wind speed and according to whether or not the house is in the FBC Wind Borne Debris Region (WBDR), as shown in Figure 1. The range of costs in Table 1 reflects the variation in possible FBC design cases corresponding to the design wind speed, terrain exposure, and design option. For non–WBDR locations, glazing does not have to be protected from the impact of flying debris. In the WBDR, there are two design options available to builders under the FBC. For the partially-enclosed design option, the builder may build the house to resist higher pressure loads without protecting the glazing from the impact of flying debris. The enclosed design option involves protecting all glazed openings (windows, glass doors, etc.) with impact resistant products or impact resistant coverings. The cost impact of each of these options is also estimated in Table 1.
Table 1 shows that the cost increases vary significantly, depending on the location, design option chosen, and the wind borne debris protection method. The wind resistance features represent the majority of the cost increases. The other categories of cost increase are shown as “Other Code Related Items” in Table 1, and do not vary by location. Ranges of costs are shown such that the low end ranges correspond to the lowest design wind speed option and the high end ranges correspond to the highest design wind speed.
In the non-WBDR, the estimated increased cost per square foot ranges from $0.23 to $1.28 and the percent increase in selling price (building only, land cost not considered) ranges from 0.5 percent to 2.7 percent. Within the WBDR, the cost per square foot for partially-enclosed designs range from $0.77 to $2.75 for the houses considered. These costs translate into an estimated 0.8 percent to 6.1 percent increase in house selling price. When enclosed designs and impact resistant coverings are used in the WBDR, the estimated increased cost per square foot range from $1.04 to $2.49 and the percentage increase in selling price range from 1.3 percent to 5.0 percent. If impact resistant glazing units are used, the estimated cost increases range from $3.25 to $7.45 per square foot. The estimated increase in selling price for this case range from 6.5 percent to 10.1 percent.
iii

Table 1. Summary of Estimated Cost Increases of FBC Compared to SBC Enclosed Design (without Impact Protection )
Wind Speed (mph) House A - Masonry House B - Masonry House D - Wood
Wind Resistance Features $ 87 to $ 1,186 $ 661 to $ 1,068 $ 109 to $ 1,114 Other Code Required Items $ 425 $ 905 $ 425 Total Cost $ 512 to $ 1,611 $ 1,566 to $ 1,973 $ 534 to $ 1,569 Cost per Square Foot $ 0.23 to $ 0.73 $ 0.54 to $ 0.68 $ 0.24 to $ 0.71
100-120
% of Selling Price 0.51 % to 1.62 % 0.73 % to 0.92 % 0.60 % to 2.57 % Wind Resistance Features $ 1,307 to $ 2,276 $ 1,858 to $ 2,816 $ 1,256 to $ 1,823 Other Code Required Items $ 425 $905 $ 425 Total Cost $ 1,732 to $ 2,701 $ 2,763 to $ 3,721 $ 1,681 to $ 2,248 Cost per Square Foot $ 0.79 to $ 1.21 $ 0.95 to $ 1.28 $ 0.76 to $ 1.02 N
on- W
ind
Bor
ne D
ebri
s Reg
ion
130-140
% of Selling Price 1.74 % to 2.71 % 1.29 % to 1.73 % 1.89 % to 2.53 % Partially Enclosed (without Impact Protection)
Wind Speed (mph) House A - Masonry House B - Masonry House D - Wood
Wind Resistance Features $ 1,553 to $ 3,251 $ 1,317 to $ 2,900 $ 1,502 to $ 3,180 Other Code Required Items $ 425 $ 905 $ 425 Total Cost $ 1978 to $ 3,676 $ 2,222 to $ 3,805 $ 1,927 to $ 3,605 Cost per Square Foot $ 0.90 to $ 1.67 $ 0.77 to $ 1.31 $ 0.88 to $ 1.64
120-130
% of Selling Price 2.0 % to 3.7 % 1.03 % to 1.77 % 2.17 % to 4.05 % Wind Resistance Features $ 2,838 to $ 5,622 $ 3,838 to $ 6,817 $ 2,763 to $ 5,849 Other Code Required Items $ 425 $ 905 $ 425 Total Cost $ 3,263 to $ 6,047 $ 4,743 to $ 7,722 $ 3,186 to $ 6,274 Cost per Square Foot $ 1.48 to $ 2.75 $ 1.64 to $ 2.66 $ 1.45 to $ 2.85
140-150
% of Selling Price 3.28 to 6.08 2.21 % to 3.9 % 3.58 % to 7.05 % Enclosed with Impact Covering
Wind Speed (mph) House A - Masonry House B - Masonry House D - Wood
Wind Resistance Features $ 1,902 to $ 3,069 $ 2,592 to $ 3,941 $ 1,860 to $ 3,077 Other Code Required Items $ 425 $ 905 $ 425 Total Cost $ 2,327 to $ 3,494 $ 3,497 to $ 4,846 $ 2,285 to $ 3,502 Cost per Square Foot $ 1.06 to $ 1.59 $ 1.21 to $ 1.67 $ 1.04 to $ 1.59
120-130
% of Selling Price 2.34 to 3.57 1.63 % to 2.25 % 2.57 to 3.93 Wind Resistance Features $ 2,993 to $ 3,942 $ 4,340 to $ 6,322 $ 2,540 to $ 3,970 Other Code Required Items $ 425 $ 905 $ 425 Total Cost $ 3,418 to $ 4,367 $ 5,245 to $ 7,227 $ 2,965 to $ 4,395 Cost per Square Foot $ 1.55 to $ 1.99 $ 1.81 to $ 2.49 $ 1.35 to $ 2.00
140-150
% of Selling Price 3.44 % to 4.39 % 2.44 % to 3.36 % 3.33 % to 4.94 % Enclosed with Impact Glazing
Wind Speed (mph) House A - Masonry House B - Masonry House D - Wood
Wind Resistance Features $ 6,759 to $ 7,589 $ 17,279 to $ 18,563 $ 6,717 to $ 7,597 Other Code Required Items $ 425 $ 905 $ 425 Total Cost $ 7,184 to $ 8,014 $ 18,184 to $ 19,468 $ 7,142 to $ 8,022 Cost per Square Foot $ 3.27 to $ 3.67 $ 6.27 to $ 6.71 $ 3.25 to $ 3.65
120-130
% of Selling Price 7.22 % to 8.05 % 8.46 % to 9.05 % 8.02 % to 9.01 % Wind Resistance Features $ 7,578 to $ 8,568 $ 18,877 to $ 20,690 $ 7,125 to $ 8,596 Other Code Required Items $ 425 $ 905 $ 425 Total Cost $ 8,003 to $ 8,993 $ 19,782 to $ 21,595 $ 7,550 to $ 9,021 Cost per Square Foot $ 3.64 to$ 4.09 $ 6.82 to $ 7.45 $ 3.43 to $ 4.10
Win
d B
orne
Deb
ris R
egio
n
140-150
% of Selling Price 8.04 % to 9.04 % 9.20 % to 10.04 % 8.45 % to 10.14 %
iv

Figure 1. Wind Regions in FBC
These summary values are supported by the detailed cost estimates shown in the Appendices of the report. These details are based on products available in the Florida market during the last half of 2001. It is reasonable to expect that additional products will be available in the future to meet the demands for higher wind pressures required by the FBC.
The results in Table 1 should not be averaged into a single number because they represent only three houses and do not reflect market conditions once many houses are being built to the FBC. Also, the study found that supplier quotes were highly variable and clearly the understanding of the FBC requirements varies significantly at this point. Hence, while the results in Table 1 are the best estimates that can be made at this time for a few houses, they should be viewed simply as “ball park” estimates of the cost impact of the code. As houses are built to the FBC, there will clearly be examples of cost impacts that are lower as well as higher than those shown in Table 1.
Estimated Benefits of Wind Load Provisions of FBC. The second part of this project dealt with estimating the benefits of improved design and construction to the wind load provisions of the FBC. The benefits of improved wind load design and construction were estimated by evaluating how these FBC built houses would perform in hurricanes compared to the same houses built to the SBC. To the extent that the FBC houses would be damaged less often and less severely than SBC houses, these repair costs could be quantified and averaged over many years of simulated hurricane
v

activity in the state. The approach used all the past hurricanes that have struck Florida in a hurricane model to estimate the future hurricane risk and damage to each of the modeled buildings at each of the 25 locations.
The hurricane loss reductions achieved by the new FBC minimal load designs are substantial when compared to the SBC minimum designs. Table 2 summarizes the results of the benefit analysis in terms of the expected reduction in losses of FBC houses compared to the SBC houses. Table 2 indicates that residential construction in accordance with the FBC will result in stronger houses and lower losses from hurricanes. Loss reductions range from 26 percent to 61 percent depending on the design option. These results are the average loss reductions from the analysis of these houses at 7 non-WBDR locations and 19 WBDR locations. Enclosed-designs, while generally more costly (see Table 1), provide greater loss reduction benefits than partially-enclosed designs in the WBDR. It should also be noted that the House A has a much lower percentage glazing than an average house and, hence, the difference in loss reduction between partially-enclosed and enclosed is less than a typical house. The loss reduction benefits of enclosed versus partially-enclosed designs for House B in WBDR is much more typical.
Table 2. Reduction in Expected Hurricane Losses of FBC Study Houses Compared to SBC
Enclosed Design without Impact Protection House A - Masonry House B - Masonry House D - Wood Average (%) 52.4 48.8 53.1
Non
- WB
DR
Range (%) 47 - 61 44 - 57 48 - 61
Partially-Enclosed Design House A - Masonry House B - Masonry House D - Wood Average (%) 48.7 44.6 50.1 Range (%) 39 - 54 26 - 50 42 - 56
Enclosed Design Using Impact Resistant Coverings or Glazing House A - Masonry House B - Masonry House D - Wood Average (%) 53.8 55.5 54.1
WB
DR
Range (%) 46 - 61 41 - 60 47 - 61
A second benefit-cost analysis was performed from the homeowner perspective. This was also a “ball park” assessment with many necessary assumptions. The increased construction costs were converted to an increase in monthly mortgage payment (8 percent loan over 30 years). These increases were compared to the following benefits to the homeowner: reductions in insurance rates, reductions in homeowner deductible costs, and the future value of FBC improvements. An estimate of the reduced insurance rates was computed from the average loss statistics based on s.627.0626, F.S., which requires insurance credits for wind mitigation. Stronger houses also mean that the homeowner will not have to pay for hurricane losses up to his insurance deductible limit as often. This benefit was quantified through a deductible analysis of the average annual losses. This analysis also has assumed that the increased costs associated with the FBC will be reflected in the final market price of the house.
The results are clearly dependent on the economic assumption made, but show essentially a break-even condition in the non-WBDR. That is, the increased initial cost of construction to the
vi
FBC is offset by the estimated economic benefits of FBC construction. In the WBDR, the results indicate the potential for a break-even or possibly a reduction in equivalent long-term costs to the homeowner for the enclosed design with impact resistant coverings. The partially-enclosed design also reduced the theoretical long-term homeowner cost, however, not as much as the enclosed design case. Hence, the FBC will benefit Florida homeowners and the initial construction cost differential may potentially be offset with reduced deductible costs, insurance costs, and recouped market value of the FBC improvements.
One should not extrapolate or try to generalize these results too much. They are based on only three houses. The results do not include other loss reduction benefits, such as reduced government costs, improved safety, reduced loss of homeowner irreplaceable possessions, etc. Hence, the hurricane loss reduction benefits are clearly lower bound estimates. Also, the analysis did not quantify the effort and time to close impact resistant coverings versus the benefits of permanent in-place protection of impact resistant openings.
In summary, this study indicates that the FBC is a strong step in the right direction. The changes made by the code will have large payoffs in reducing future windstorm-related property losses and improving the lives of residents throughout the state. The initial cost impacts are reasonable and there are clearly long-term economic benefits of reduced damage and loss for residences built to the FBC.
vii

TABLE OF CONTENTS
EXECUTIVE SUMMARY................................................................................................................ii
TABLE OF CONTENTS............................................................................................................... viii
LIST OF ACRONYMS.....................................................................................................................xi
AUTHORIZATION .........................................................................................................................xii
1 INTRODUCTION........................................................................................................................1
2 METHODOLOGY.......................................................................................................................4 2.1 Overall Approach....................................................................................................................4
2.1.1 Part I Methodology.......................................................................................................4 2.1.2 Part II Methodology .....................................................................................................4
2.2 Loss Reduction Benefit Assessment .......................................................................................5 2.2.1 HURLOSS Model ........................................................................................................5 2.2.2 Key Variables ...............................................................................................................6 2.2.3 Outputs .........................................................................................................................6 2.2.4 Financial Analysis ........................................................................................................7
3 COST IMPACT..........................................................................................................................10 3.1 Discussion of Cost Impacts...................................................................................................10
Category 1: General Changes (Non Building Specific) ......................................................10 Category 2: Wind Load Requirements................................................................................10
Category 2(a) - Wind Speed Map Changes.......................................................................10 Category 2(b) - Exposure Classification ...........................................................................12 Category 2(c) - Enclosure Classification...........................................................................13 Category 2(d) - Walls: Wood or Masonry.........................................................................15 Category 2(e) - Windows and Sliding Glass Doors ..........................................................17 Category 2(f) - Wind Borne Debris Protection .................................................................18 Category 2(g) - Doors: Entrance and Garage ...................................................................21 Category 2(h) - Roof Coverings ........................................................................................21 Category 2(i) - Roof Structure: Roof Deck, Trusses and Tie-Down Connections............22
Category 3: Termites ...........................................................................................................23 Category 4: Concrete Slab...................................................................................................23 Category 5: Gable End-Walls .............................................................................................23 Category 6: Screen Enclosures............................................................................................23 Category 7: Swimming Pools..............................................................................................24 Category 8: Energy Code ....................................................................................................24 Category 9: Mechanical Code .............................................................................................25 Category 10: Plumbing Code ..............................................................................................26
3.2 Summary of Cost Impacts.....................................................................................................26
viii

4 LOSS ANALYSIS ......................................................................................................................28 4.1 Modeled Design Parameters and Locations..........................................................................28 4.2 Loss Reduction Evaluation ...................................................................................................28 4.3 Discussion of Damage Mechanisms .....................................................................................30 4.4 All Stakeholders Benefit-Cost Summary (Hurricane FBC Improvements Only) ................33 4.5 Homeowner Benefit-Cost Summary.....................................................................................36 4.6 Summary ...............................................................................................................................40
5 REFERENCES AND SOURCES .............................................................................................40 5.1 References.............................................................................................................................41 5.2 Sources..................................................................................................................................42
APPENDIX A: Mercedes Masonry House..................................................................................A-1 A.1 Construction Features and Documentation.........................................................................A-2 A.2 Wind Load Design ..............................................................................................................A-2 A.3 Cost Determination .............................................................................................................A-5
A.3.1 Summary of Cost by Design Case............................................................................A-6 A.3.2 Cost Breakdown for all design cases: ......................................................................A-8 A.3.3 Costs for Truss and Tie-down packages ................................................................A-38 A.3.4 Wall and Roof Deck Design Details ......................................................................A-51 A.3.5 Opening Design Pressure and Pricing....................................................................A-52 A.3.6 Options to meet 2001 Energy Code .......................................................................A-54 A.3.7 Impact resistant covering (Shutters) Pricing ..........................................................A-56
APPENDIX B: Aubuchon Masonry House ................................................................................B-1 B.1 Construction Features and Documentation.........................................................................B-2 B.2 Wind Load Design ..............................................................................................................B-4 B.3 Cost Determination .............................................................................................................B-5
B.3.1 Summary of Cost by Design Case............................................................................B-5 B.3.2 Cost Breakdown for all design cases: ......................................................................B-8 B.3.3 Costs for Truss and Tie-down packages ................................................................B-38 B.3.4 Wall and Roof Deck Design Details ......................................................................B-45 B.3.5 Opening Design Pressure and Pricing....................................................................B-46 B.3.6 Options to meet 2001 Energy Code .......................................................................B-51 B.3.7 Impact resistant covering (Shutters) Pricing ..........................................................B-52 B.3.8 Screen Enclosure ....................................................................................................B-53
APPENDIX C: Dalton Wood house ............................................................................................C-1 C.0 Case Study Status................................................................................................................C-2 C.1 Construction Features and Documentation.........................................................................C-2 C.2 Wind Load Design ..............................................................................................................C-3 C.3 Cost Differential Documentation........................................................................................C-5 C.4 Loss Reduction and Cost Benefit Analysis.........................................................................C-6
C.4.1 Hurricane Risks ........................................................................................................C-6 C.4.2 Analysis of Loss Reduction......................................................................................C-7 C.4.3 All Stakeholders (Total) Cost-Benefit Analysis.......................................................C-8 C.4.4 Cost Benefit Analysis from Homeowner’s Perspective ...........................................C-9
ix

APPENDIX D: Mercedes Wood House.......................................................................................D-1 D.1 Construction Features and Documentation.........................................................................D-2 D.2 Wind Load Design ..............................................................................................................D-3 D.3 Cost Determination .............................................................................................................D-3
D.3.1 Summary of Cost by Design Case............................................................................D-4 D.3.2 Cost Dreakdown for all design cases: ......................................................................D-6 D.3.3 Costs for Truss and Tie-down packages ................................................................D-36 D.3.4 Wall and Roof Deck Design Details ......................................................................D-49 D.3.5 Opening Design Pressure and Pricing....................................................................D-49 D.3.6 Options to meet 2001 Energy Code .......................................................................D-53 D.3.7 Impact resistant covering (Shutters) Pricing ..........................................................D-54
Appendix E: List of Changes........................................................................................................E-1
Appendix F: Building Officials Input..........................................................................................F-1
Appendix G: Information from Truss Companies.................................................................... G-1
Appendix H: List of Plumbing Changes .................................................................................... H-1
Appendix I: HURLOSS Hurricane Model...................................................................................I-1
Appendix J: Example of Design Calculations for Mercedes House Using FBC ................................................................................................ J-1
Appendix K: Example of Design Calculations for Mercedes House Using SBC............................................................................................... K-1
x
LIST OF ACRONYMS
AAF - Aluminum Association of Florida AAL - Average Annual Loss ARA - Applied Research Associates, Inc. ASCE 7-98 - American Society of Civil Engineers: Standard 7 Minimum Design Loads for
Buildings and Other Structures ASTM - American Society for Testing and Materials C&C - Components and Cladding Loads DCA - Department of Community Affairs, Florida DP - Design Pressure for windows, doors, garage doors, etc. FBC - Florida Building Code FEMA - Federal Emergency Management Agency FWUA - Florida Windstorm Underwriting Association HURLOSS - Applied Research Associates’ hurricane simulation model MWFRS - Main Wind Force Resisting System Loads NPV - Net Present Value PSF - Pounds per square foot SBC - Standard Building Code 1997 Edition SBCCI - Southern Building Code Congress International SFBC - South Florida Building Code SPF - Spruce Pine Fir SSTD - Southern Standards Technical Document SYP - Southern Yellow Pine WBDR - Wind Borne Debris Region
xi

AUTHORIZATION
House Bill 219, Section 111.
(1) (a) The Department of Community Affairs shall undertake a demonstration and education project to demonstrate the true cost associated with the implementation of the Florida Building Code. The project shall consist of the construction of 12 residential single-family homes in various regions of the state to the standards of the Florida Building Code. These project homes shall be used to determine the material and labor cost differential between the Florida Building Code and the current state minimum building code. The cost differential data shall be determined by two categories: those costs associated with compliance with ASCE-7-98 and those costs associated with other incremental costs associated with other compliance provisions of the Florida Building Code. The department shall provide the resources to offset any increased cost of building to the Florida Building Code, and shall provide an analysis and accounting of such additional costs prepared by an appropriate engineering firm and accounting firm. These homes shall be used for educational purposes in the local community and shall be utilized as a demonstration project available for inspection and education training as determined by the Residential Mitigation Construction Advisory Council.
(b) The results of the accounting and analysis shall be forwarded by the department to the Florida Building Commission for use in reviewing the Florida Building Code and to the Department of Insurance.
(c) The department shall implement this project following the effective date of this act.
(d) The Residential Mitigation Construction Advisory Council, with the department, shall serve as the advisory group for this project. Decisions regarding the conduct of the project and contracting with the appropriate engineering group and accounting group shall be made by consensus of the advisory group.
(2) The department shall issue a report of its findings to the Governor, the President of the Senate, and the Speaker of the House of Representatives upon completion of the construction and data collection.
xii

1 INTRODUCTION
The Florida Building Code (FBC) takes effect on March 1, 2002. The code includes many new provisions and, in particular, has substantial changes for wind load design. The majority of the FBC is derived from base codes and standards, such as the Standard Building Code (SBC) and the American Society of Civil Engineers (ASCE) Standard 7-98. Many questions and concerns have been raised regarding the impact of these code provisions on the construction costs for single-family houses. In order to quantify the increased costs, the Florida Legislature authorized a project to build 12 houses in accordance with the FBC. Due to time constraints, only three builders participated in the program; that fact limited the cost data that could be collected. DCA initiated a Part II for the project for analysis of state wide cost differentials and benefits. In the Part II project, houses were designed for wind speeds from 110 mph to 150 mph for all enclosure and exposure conditions (not including Miami-Dade and Broward Counties). Computer modeling for the various design options was completed and costs were estimated for each option.
The Florida statutes that enacted the FBC also require insurance credits, discounts, or other rate differentials for fixtures or construction techniques that meet the minimum requirements of the FBC. These include roof strength, roof-to-wall connections, wall-to-floor connections, and opening protection. The rationale for coupling insurance discounts with wind damage mitigation features results from the fact that the FBC requires certain wind resistant construction features. Hence, the risk of damage and loss from wind will be reduced for buildings with these features. That is, stronger buildings will result in reduced damage from hurricanes and, hence, reduced loss costs for insurers. It is important to note that the South Florida Building Code (SFBC) has also required certain wind resistant construction features since 1994. In addition, there are many existing houses throughout the state that have one or more of the wind resistant features required in the FBC 2001.
The scope of the Part II work was to first identify the specific requirements of the FBC that will likely affect cost and, once identified, to quantify the cost implications. (Again, the houses evaluated are not in the High Velocity Hurricane Zone and no attempt has been made to address Miami-Dade or Broward Counties in this report.) Review of the FBC reveals a number of items with potential cost impacts on one and two family houses. (See Appendix E for the detailed list developed by ARA and DCA, and reviewed by the Florida Home Builders Association). The complete list of changes was consolidated into the ten categories identified in Table 1-1. Costs have been reported for each item as appropriate where information is available from suppliers, contractors and sub-contractors.
The three builders who participated in Part I of this project were: Mercedes Homes, Melbourne, FL (House A), Aubuchon Homes in Cape Coral (House B), and Dalton Brothers Construction in Santa Rosa Beach (House C) (See locations in Figure 1-1). Detailed descriptions of the houses built with relevant costs and comments are presented in Appendices A, B, and C respectively for each house. It should be noted that the Dalton Brothers house is a three-story wood frame structure and not representative of typical Florida construction. Therefore, in Part II of the project the Dalton house was replaced by a Mercedes wood frame version (House D) of their masonry house to represent a typical wood frame house for evaluation. The Part I results of the Dalton house are retained in Appendix C.
1

Table 1-1: Categories of Changes in FBC that will Impact Construction Costs
Category Description 1 General changes—those changes that are not building specific 2 Wind load requirements—changes related to changes in hurricane resistance (a) Wind speed (b) Exposure classification (near coast vs. inland) (c) Enclosure classification: Open structure, enclosed structure or partially-enclosed structure (d) Walls—wood or masonry (e) Windows and sliding glass doors (f) Wind borne debris protection (g) Doors (entrance and garage doors) (h) Roof covering (i) Roof structure (trusses and tie-down connections) 3 Termite protection 4 Concrete slab construction 5 Gable end-wall construction 6 Screen enclosures 7 Swimming pool 8 Energy Code changes 9 Mechanical Code changes 10 Plumbing Code changes
Appendices A, B, and D correspond to House A, B, and D and summarize cost data by house type (masonry or wood) and wind design considerations (wind speed, exposure, enclosure and method of protecting glazed openings, if required). The remainder of this report will reference the study building by builder and wall construction, i.e., Mercedes masonry.
Section 4 of this report provides loss reduction analysis and the loss relativities for each wind design case; these data were developed using ARA’s HURLOSS model. The HURLOSS model is a Monte Carlo simulation that models the effects of hurricanes on buildings and the losses that may occur as a result of the damage experienced. This section identifies projected losses from hurricanes and relative losses of the new design vs. the SBC design.
2

House C Dalton
House A Mercedes (Masonry)
House B Aubuchon
House D Mercedes (Wood)
Figure 1-1: Location of Houses Constructed by the 3 Builders in this Program (wind speed
contours are from FBC peak gust 10m open terrain design wind speeds)
3

2 METHODOLOGY
2.1 Overall Approach
This project involved multiple tasks and the detailed scope evolved through meetings with builders, suppliers, design professionals, the Department Community Affairs and University of Florida personnel. The project was divided into two parts as outlined in the following sections.
2.1.1 Part I Methodology
Building Design and Compliance with FBC. Participating builders provided the University of Florida with architectural drawings and other materials routinely prepared when applying for a building permit: floor plan, elevations, plumbing & electrical layouts, and Florida Energy Efficiency Code for Building Construction Energy Performance Index calculations. Specific plans and specifications for termite treatment, truss design, plumbing system, mechanical system, electrical system, swimming pool are prepared and submitted as required by and for local government review and approval during the construction of the building by the appropriate licensed contractors. The information supplied by the builder was transmitted to the Southern Building Code Congress International (SBCCI) for review of compliance with the FBC. The design review reports produced by the SBCCI were returned to the University of Florida and copies were forwarded to the appropriate builders, ARA, and the DCA. ARA reviewed the builder’s detailed construction documents and individual SBCCI design review report for each house and provided assistance to each builder to help them determine what changes were necessary to comply with the FBC. The process involved ARA engineers, local building department personnel, the builder, the builder’s architect/engineer, and the builder’s specialty subcontractors such as plumbing, electrical, mechanical, and truss producers. This team compared the submitted building plans with the SBCCI plan review report to insure that all identified provisions of the FBC had been incorporated. Clarifications were required to interpret the code requirements related to enclosed vs. partially-enclosed design considerations, and wind borne debris protection options. The staff of the DCA Building Codes and Standards office provided clarification.
Site Visits. ARA made several visits to each building site to take photographs of the construction progress and techniques. Additionally, ARA helped the builders work with suppliers of roofing materials, windows, doors, sliding glass doors, and garage doors to determine availability and pricing for products to meet the FBC. As construction progressed, ARA met with each builder involved in the project to review changes mandated by the FBC and to obtain answers from the DCA Building Codes and Standards office to any questions that arose.
Loss Reduction Benefit Assessment. Each house was analyzed for expected performance in hurricanes and the damage and losses to the buildings were estimated. The reduction in loss was quantified as the expected annual loss, averaged over 300,000 years of simulated hurricanes to obtain stable estimates of benefits. The loss reduction benefit assessment considered the benefits from improved wind resistance only. No attempt was made to quantify the benefits resulting from the other code changes such as plumbing, mechanical, etc. This assessment compared the SBC and FBC design at the location of the actual building.
4

2.1.2 Part II Methodology
In part II of the project ARA worked with several design professionals to determine the design requirements for 3 houses in various wind climates around the state. (110 mph to 150 mph for all applicable exposure and enclosure conditions). Once the design parameters were determined, detailed pricing for each option was developed using quotations and estimates from suppliers, contractors, sub-contractors and judgment, where necessary. Many options exist for designs and there are numerous alternative products available for the builder and designers to consider; most of these options will affect the final cost of the buildings and can result in a wide range of cost impact as demonstrated in the data presented.
Additionally in Part II of the project, working with DCA, ARA developed a comprehensive list of changes mandated by the FBC (Appendix E). Those changes are summarized into the 10 categories identified in Table 1-1 and identified in Section 3.1.
Cost Documentation. ARA audited the builders’ cost documentation and developed the list of costs shown in Appendices A, B, C and D. The cost comparisons were made with respect to the minimum requirements of the SBC.
Loss Reduction Benefit Assessment. The loss reduction benefit assessment from Part I was repeated for Houses A, B, and D at each of the 25 study locations around the state.
2.2 Loss Reduction Benefit Assessment
The loss reduction benefit assessment focuses solely on losses resulting from damage to the building, contents, and additional living expenses resulting from loss of use of the building. ARA used its HURLOSS technology to calculate the risk of failure for each of the buildings in this study. The HURLOSS model, which is approved by the Florida Commission on Hurricane Loss Projection Methodology, produces estimates of loss that the building may experience as a result of the actual hurricane climate in the part of the state where the house is located. The losses included building, contents, and additional living expenses, which are elements of the standard insurance coverage for a house. These losses occur when the building is damaged by the wind pressures, wind borne debris, and when the rain water that accompanies hurricanes enters the building.
No attempt has been made to quantify all the benefits of the improved wind resistant construction provided by the FBC. For example, buildings that fail less often will reduce the government’s disaster recovery costs. Homeowners will be displaced from their homes less often and the government will have reduced shelter requirements. Homeowners will not lose irreplaceable personal possessions as often. The state’s tax base will be more robust and the economy will be disrupted less often and less severely, etc. Hence, the loss reduction benefit assessment used herein is fairly simple, focusing on the more quantifiable aspects of improved hurricane resistance, and represents an understatement of the true economic benefits of more resistant buildings.
2.2.1 HURLOSS Model
The HURLOSS model is a Monte Carlo simulation that models the effects of hurricanes on buildings and the losses that may occur as a result of the damage experienced. The model has been developed from multiple disciplines including: meteorology, wind engineering, structural engineering, actuarial science, and statistical science. The wind field component of the HURLOSS
5

model was used to derive the wind speed contour maps of ASCE 7-98 (thus the FBC). Appendix I contains a brief description of the HURLOSS modeling technology. Briefly, the key modeling components are:
1. Hurricane Simulation – simulates the hurricane wind speeds at the site. ARA has simulated 300,000 years of hurricanes that affect the sites in this study.
2. Damage Simulation – simulates the range of damage that a building may suffer as a result of the hurricane. Probabilistic engineering models simulate the loads and resistances of the key components in the building envelope. Failures to components are quantified for each component for each simulated storm. Progressive failures are modeled for the full duration of the storm and include the effects of changes in wind direction as the storm moves, wind speeds, and turbulence intensity.
3. Loss Simulation – estimates the cost of repair to the structure, replacement of damaged contents, and cost associated with loss of use (additional living expenses). These loss estimates are derived from simulated damage statistics and estimations of internal damage. For example, if the roof sheathing is lost, the estimate includes the cost of replacing the damaged roof as well as the damage to the interior of the structure. The process is similar to how an insurance adjustor would estimate the cost of repair and replacement. Comparing the predicted losses with actual insurance claim data from multiple storms and insurance company data files has validated the loss components.
2.2.2 Key Variables
Because the losses suffered from a hurricane are directly related to preventing water from entering the house, the HURLOSS model focuses on the integrity of the building envelope. The key variables that were simulated in this study include:
• Wind pressures and wind borne debris impacts,
• Impact resistance and shutter protection of glazed openings,
• Roof deck attachment details (nail size and spacing),
• Roof-to-wall connection strength,
• Roof covering performance, and
• Wall failures
Whole roof failures were included as part of the roof-to-wall connection analyses.
2.2.3 Outputs
Average Annual Loss. The results of the HURLOSS simulation methodology produce loss estimates for each simulated hurricane. These results can be analyzed in many ways. However, the most relevant measure is a statistical value called the Average Annual Loss (AAL). AAL is the average or mean loss expected over many years of exposure to hurricane risk. AAL depends on the structure’s resistance to wind pressures and wind borne debris. It also depends on the hurricane risk, which is defined by the strength of the winds where the building is located, and the type of terrain.
6

AAL is used in cost-benefit analysis to determine the cost effectiveness of mitigation. For example, the FEMA cost-benefit methodology computes the benefits as the reduction in AAL when compared to the AAL for the unmitigated building. The reduction in AAL is the annual benefit (in dollars) expected over the long term. AAL is a statistical average as there will be many years with no storms (hence, zero benefit) that are averaged with large loss reduction for those years with intense storms. Hence, AAL is the key measure used herein as part of the cost-benefit analysis to quantify the estimated benefits of the new FBC.
Reduced Insurance Risks. AAL is also a fundamental concept in property insurance rate determination. For a given building, AAL is used by the insurance industry to determine the amount of premium that would have to be collected for a risk (house) to cover the anticipated catastrophic losses that could be sustained by the property. The total AAL is the total amount of loss to the property. However, the risk of loss is divided between the property owner, and the insurance company based on the “deductible” for the policy. A deductible is the amount that the property owner will pay for the first “x” dollars or “y” percent of the loss, and the insurance company will pay for the portion of losses that exceed the deductible, up to the policy limit. The choice of the deductible level can have a great affect on the amount of premium that a property owner must pay, and the dollars of loss to which the property owner is exposed. For the purpose of this study, a typical hurricane insurance deductible limit of 2% of the building value (without land) has been assumed. HURLOSS produces estimates of the property owner’s portion of the AAL and the insurance company’s portion of the AAL. These two numbers are used in the financial analysis described in Section 2.5.4.
2.2.4 Financial Analysis
A simple analysis of the costs and benefits of each of the design cases under the FBC has been prepared from two perspectives:
• All Stakeholders (owner, insurer, government), and • The property owner.
All Stakeholders Perspective: From the All Stakeholders perspective, three items have been considered:
1. The increase in initial construction costs,
2. The expected future savings from the reduction in total AAL, and
3. The salvage value of the increased construction costs. This term estimates the value of the code improvements at a future time. Generally, the value of these improvements increases by an average construction cost inflation term each year. However, the present time value of this expected future value must be discounted by an annual discount or interest rate. Therefore, for purposes of the benefit-cost analysis, the salvage value of the construction cost differential reduces over time.
ARA has not attempted to quantify costs or benefits from the builder’s perspective. Since all builders must meet the FBC requirements, it has been assumed that the added construction costs will be passed on to the buyer (owner).
7

Interest Rates Used
B 1 B 2 B 3 B 4 B30
0 1 2 3 4 30 years Time
C = Initial Cost Differential (Compared to SBC)
Discount Rate = 5%
Construction CostInflation Rate = 2%
… Benefits = Average Annual LossReduction vs SBC97 min …
Interest Rates Used
B 1 B 2 B 3 B 4 B30
0 1 2 3 4 30 years Time
C = Initial Cost Differential Benefits = Future Salvage Value of Code Improvements Cost Differential
Discount Rate = 5%
Construction CostInflation Rate = 2%
… Benefits = Average Annual LossReduction vs SBC97 min …
Figure 2-1: Economic Time Line of Benefit-Cost Analysis
Figure 2-1 illustrates the economic time line of the All Stakeholders benefit-cost analysis. Each of these savings and costs has been compared through an economic Present Value calculation. Present Value analysis is a method of converting a future series of payments and revenue back to an equivalent present day value. The technique allows comparison of different design scenarios and comparison of the net benefit of each design scenario with other competing designs. This method is commonly used in FEMA studies to evaluate mitigation options and the cost effectiveness of mitigation (Ref. 2).
The following assumptions have been made in these calculations: 1. An annual discount interest rate of 5.0% is used. 2. An estimate of cost of construction will increase 2% annually. 3. The life of the building is assumed to be 30 years.
A summary of the financial results for each house is presented in Appendices A, B and C.
Homeowner Perspective: From the property owner’s perspective, we have considered these components:
1. The cost of an increase in a mortgage payment created as a result of the increased purchase price due to increased cost of construction to FBC.
2. The assumed savings resulting from reduced hurricane insurance per Florida Statute 627.0629.
3. Reductions in homeowner deductible costs when hurricanes damage the house.
4. Change in value of house due to hurricane improvements per FBC.
8
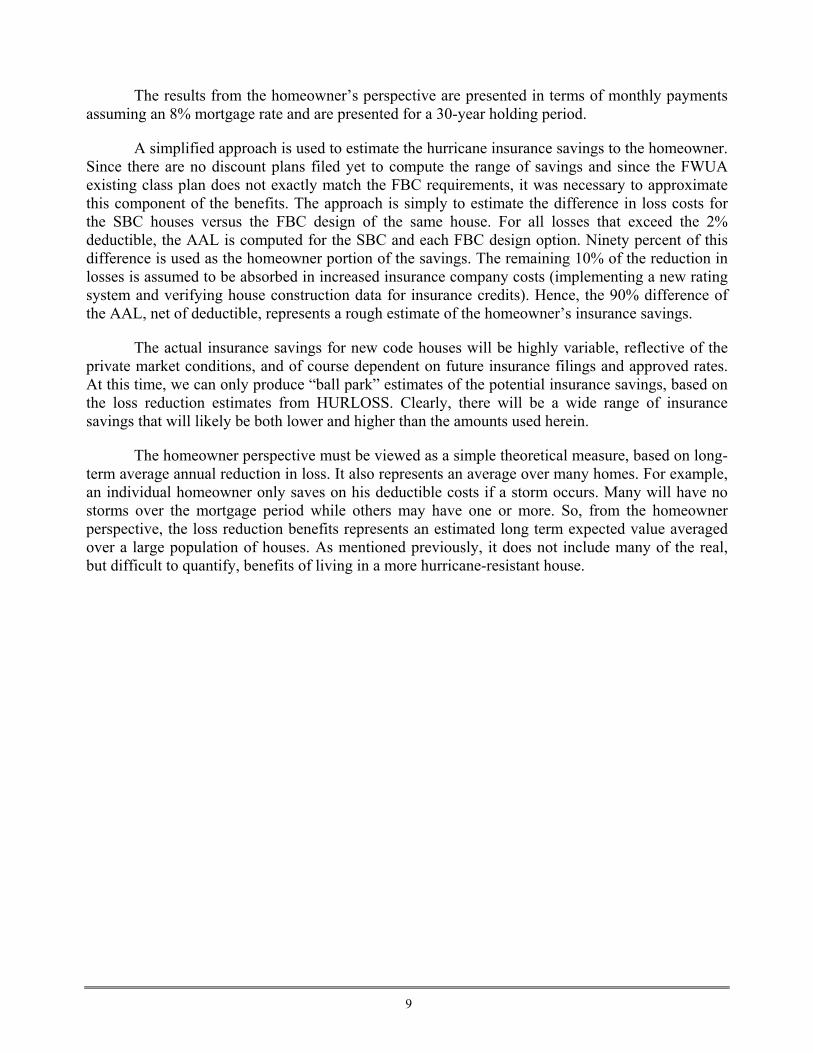
The results from the homeowner’s perspective are presented in terms of monthly payments assuming an 8% mortgage rate and are presented for a 30-year holding period.
A simplified approach is used to estimate the hurricane insurance savings to the homeowner. Since there are no discount plans filed yet to compute the range of savings and since the FWUA existing class plan does not exactly match the FBC requirements, it was necessary to approximate this component of the benefits. The approach is simply to estimate the difference in loss costs for the SBC houses versus the FBC design of the same house. For all losses that exceed the 2% deductible, the AAL is computed for the SBC and each FBC design option. Ninety percent of this difference is used as the homeowner portion of the savings. The remaining 10% of the reduction in losses is assumed to be absorbed in increased insurance company costs (implementing a new rating system and verifying house construction data for insurance credits). Hence, the 90% difference of the AAL, net of deductible, represents a rough estimate of the homeowner’s insurance savings.
The actual insurance savings for new code houses will be highly variable, reflective of the private market conditions, and of course dependent on future insurance filings and approved rates. At this time, we can only produce “ball park” estimates of the potential insurance savings, based on the loss reduction estimates from HURLOSS. Clearly, there will be a wide range of insurance savings that will likely be both lower and higher than the amounts used herein.
The homeowner perspective must be viewed as a simple theoretical measure, based on long- term average annual reduction in loss. It also represents an average over many homes. For example, an individual homeowner only saves on his deductible costs if a storm occurs. Many will have no storms over the mortgage period while others may have one or more. So, from the homeowner perspective, the loss reduction benefits represents an estimated long term expected value averaged over a large population of houses. As mentioned previously, it does not include many of the real, but difficult to quantify, benefits of living in a more hurricane-resistant house.
9
3 COST IMPACT
The following section discusses the research and data that was obtained for the specific cost categories identified in Table 1-1.
3.1 Discussion of Cost Impacts
Each of the following sections covers the research and data for the List of Changes identified in Table 1-1 and Appendix E.
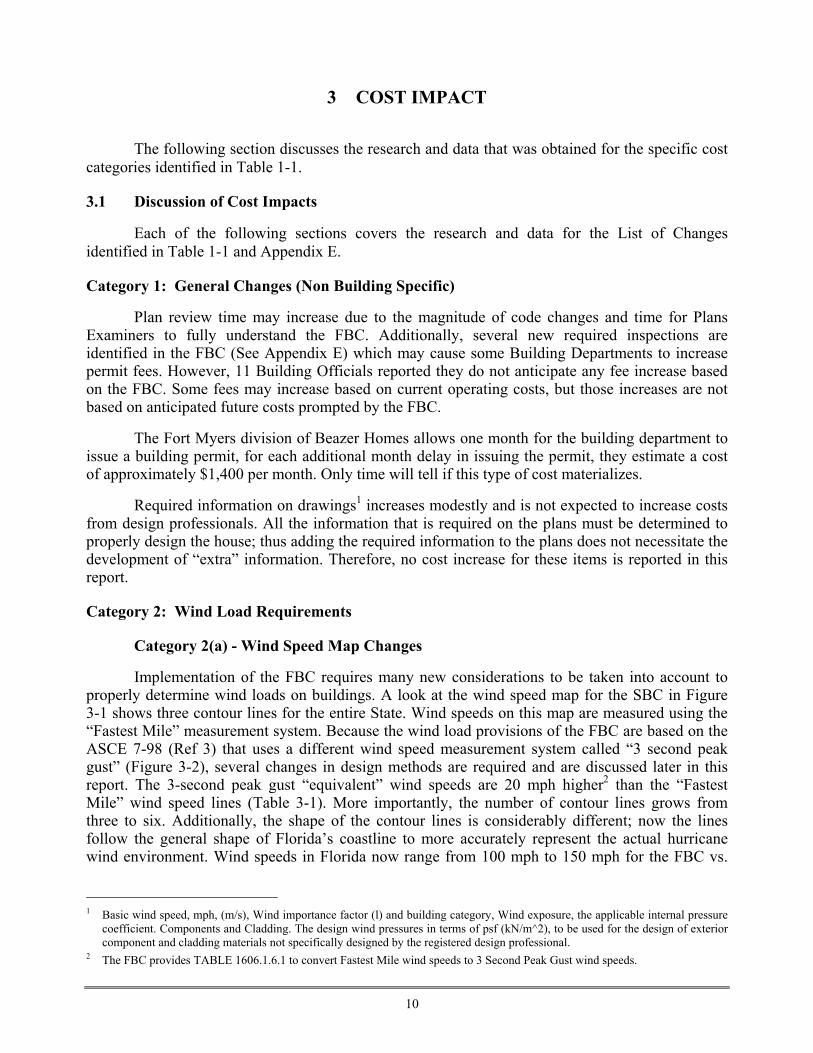
Category 1: General Changes (Non Building Specific)
Plan review time may increase due to the magnitude of code changes and time for Plans Examiners to fully understand the FBC. Additionally, several new required inspections are identified in the FBC (See Appendix E) which may cause some Building Departments to increase permit fees. However, 11 Building Officials reported they do not anticipate any fee increase based on the FBC. Some fees may increase based on current operating costs, but those increases are not based on anticipated future costs prompted by the FBC.
The Fort Myers division of Beazer Homes allows one month for the building department to issue a building permit, for each additional month delay in issuing the permit, they estimate a cost of approximately $1,400 per month. Only time will tell if this type of cost materializes.
Required information on drawings1 increases modestly and is not expected to increase costs from design professionals. All the information that is required on the plans must be determined to properly design the house; thus adding the required information to the plans does not necessitate the development of “extra” information. Therefore, no cost increase for these items is reported in this report.
Category 2: Wind Load Requirements
Category 2(a) - Wind Speed Map Changes
Implementation of the FBC requires many new considerations to be taken into account to properly determine wind loads on buildings. A look at the wind speed map for the SBC in Figure 3-1 shows three contour lines for the entire State. Wind speeds on this map are measured using the “Fastest Mile” measurement system. Because the wind load provisions of the FBC are based on the ASCE 7-98 (Ref 3) that uses a different wind speed measurement system called “3 second peak gust” (Figure 3-2), several changes in design methods are required and are discussed later in this report. The 3-second peak gust “equivalent” wind speeds are 20 mph higher2 than the “Fastest Mile” wind speed lines (Table 3-1). More importantly, the number of contour lines grows from three to six. Additionally, the shape of the contour lines is considerably different; now the lines follow the general shape of Florida’s coastline to more accurately represent the actual hurricane wind environment. Wind speeds in Florida now range from 100 mph to 150 mph for the FBC vs. 1 Basic wind speed, mph, (m/s), Wind importance factor (l) and building category, Wind exposure, the applicable internal pressure
coefficient. Components and Cladding. The design wind pressures in terms of psf (kN/m^2), to be used for the design of exterior component and cladding materials not specifically designed by the registered design professional.
2 The FBC provides TABLE 1606.1.6.1 to convert Fastest Mile wind speeds to 3 Second Peak Gust wind speeds.
10

State of Florida
Standard Building Code (1997) -Fastest Mile Wind Speeds (mph)
90
100
110
100
90
Figure 3-1: Fastest Mile Wind Speed Map for SBC
Figure 3-2: Three-Second Peak Gust Wind Speed Map for FBC
11

Table 3-1: Equivalent Basic Wind Speeds in SBC and FBC
FBC Wind Speed (3-second gust, mph) 85 90 100 105 110 120 125 130 140 145 150
SBC Wind Speed (Fastest Mile, mph) 70 75 80 85 90 100 105 110 120 125 130
current wind speeds (Fastest-Mile speeds converted to FBC 3-second-peak-gust speeds) of 110 mph to 130 mph for the SBC.
However, calculated wind loads using FBC wind speeds are basically equivalent to the wind loads determined for the corresponding wind speeds using the SBC. In other words, the fastest mile wind speed of 100 mph – converted to 3-second peak gust yields 120 mph and, when determining the loads for roof trusses, the results are essentially the same with both methods. Note, however, that the FBC has changed the amount of dead load that may be used in design calculation to resist uplift. What was formerly the full weight of the roof structure is now limited to 60% of the full weight. Thus, although the impact on the truss design is minimal, the design of the roof straps is significantly different. (See letters from truss designers included in Appendix G). Therefore, increased costs for trusses for wind speeds up to 130 mph should be minimal, as indicated in Appendices A, B, and D.
It must be recognized that the houses studied are single-story, 2,200 to 2,900 square feet houses. Many variables exist when determining costs of construction: size (not only length and width, height is important when determining costs), locations with respect to the coast and location within Florida.
Because of increased numbers and changes in geographic location of the wind speed contour lines (Figure 3-1 vs. Figure 3-2), some areas of Florida will have design wind speeds and loads that will be lower in relation to current building code requirements, some will remain the same, and some will see increases ranging from minor to major. Table 3-2 provides a sample listing of wind speed comparisons for a number of Florida cities and demonstrates the various changes in design wind speeds that exist throughout the State. The 25 locations in Table 3-2 and Figure 3-3 were the sites for the HURLOSS simulations described later.
This change in the wind speed map generally means that wind speeds for low wind areas, such as interior areas of Florida, will now be designed for lower wind speeds than before. Whereas, the high wind speed areas in the south will see increased design wind speeds.
There are several new definitions in the FBC that warrant discussion with respect to wind loads. The first is the FBC definition of “exposure categories”; and the second is the “enclosure classification” and how that affects the assumption of enclosed vs. partially-enclosed designs.
Category 2(b) - Exposure Classification
“Exposure” is the term given to describe the area surrounding the building in question with regard to the ability of wind to blow directly on the structure. ASCE 7-98 provides definitions for Exposures A, B, C and D; however, Florida has adopted a different definition of Exposure B and C than appears in the text of ASCE 7-98. Exposure C, (known as the open country exposure in
12

Table 3-2: Comparisons of Wind Speeds Under SBC and FBC
Location ID
County
Location Name
SBC Wind Speed
(FM mph)1
FM
Converted to 3 sec (mph)
FBC Wind Speed (3 sec, mph)
Change in Wind
Speed (mph)
FBC Exposure
1 Alachua Gainesville 90 110 100 -10 B 2 Lake Leesburg 95 115 100 -15 B 3 Wakulla Wakulla 95 115 110 -5 B 4 Clay Orange Park 90 110 110 0 B 5 Seminole Oviedo 95 115 110 -5 B 6 Hillsborough Brandon 100 120 110 -10 B 7 Santa Rosa Century 90 110 120 10 B 8 Okaloosa Niceville 95 115 130 15 B 9 Duval West Jacksonville 90 110 120 10 B
10 Brevard Cocoa West 95 115 120 5 B 11 Lee Fort Myers Shores 100 120 120 0 B 12 Hillsborough Tampa 100 120 120 0 B 13 Wakulla Carabelle 100 120 120 0 C 14 Hernando Spring Hill 100 120 120 0 C 15 St. Johns St. Augustine 90 110 120 10 C 16 Martin Indiantown 100 120 130 10 B 17 Collier East Naples 110 130 130 0 B 18 Bay Panama City 100 120 130 10 C 19 Brevard Palm Bay 100 120 130 10 C 20 Sarasota South Venice 110 130 130 0 C 21 Palm Beach Royal Palm Beach 110 130 140 10 B 22 Santa Rosa Gulf Breeze 95 115 140 25 C 23 Indian River Vero Beach 100 120 140 20 C 24 Palm Beach Palm Beach 110 130 145 15 C 25 Monroe Key West 120 140 150 10 C • Exposure is included in this table to fully define FBC design conditions for Section 4.0
the Standard) is known in the FBC as only Miami-Dade and Broward counties, barrier islands3, and land within 1500 ft of the coastline in the rest of the state. All other buildings will be designed for Exposure B, (known as urban and suburban areas with many single family, or similar sized buildings for a distance of 1500′) regardless of whether the structure is in the middle of a field or in the middle of a suburb.4 The comparisons prepared here of FBC and SBC wind speeds have taken this deviation from the ASCE 7-98 definition into account.
Category 2(c) - Enclosure Classification
“Enclosure” is a term used to describe how a building is treated for opening protection and internal design pressures in the WBDR of the state. Under SBC all buildings are designed as 3 On barrier islands, Exposure Category C shall be applicable to the coastal building zone set forth in s.161.55 (4), Florida Statutes.
Section 161.55 (4) defines the coastal building zone as the land area from the seasonal high water line to a line 5000 ft. landward from the Coastal Construction Control line.
4 There are still locations in Florida where Exposure D applies and also some locations where topographic speed-ups may need to be considered.
13

#Y
#Y#Y
#Y#Y
#Y
#Y#Y
#Y#Y
#Y#Y
#Y
#Y
#Y
#Y
#Y #Y
#Y
#Y
#Y
#Y
#Y#Y
#Y
Name of Nearest City/TownTampa
Oviedo
Century
Wakulla
Brandon
Leesburg
Palm Bay
Key West
Niceville
Carabelle
Cocoa West
Vero Beach
Indiantown
Palm Beach
Gulf BreezePanama City
Orange Park
Gainesville
East Naples
Spring Hill
South Venice
St. Augustine
Royal Palm Beach
West Jacksonville
Fory Myers Shores
Figure 3-3: Map of Study Locations for Loss Benefit Analysis
“enclosed” structures where the window and doors are expected to remain intact during a storm. By contrast, ASCE 7-98 and the FBC requires the designer in WBDR to consider all exterior glazing to be open (thus the building is designed to withstand increased internal wind pressure when an opening occurs) unless impact resistant or protected with impact resistant materials. This means that for those buildings in the WBDR the structure must have some form of impact protection on all glazed openings, or alternatively be designed as a partially-enclosed structure. Designing for the partially-enclosed condition means that all design pressures are increased as a result of potentially higher internal pressure loads that the structure may experience.5 This includes loads on the roof deck, roof trusses, windows and doors, as well as all other parts of the structure.
When comparing a design under SBC with a design under FBC, it is important to apply these definitions appropriately. Thus, this study compares an enclosed design under FBC with an enclosed design under SBC; and likewise compares a partially-enclosed design under FBC with the SBC enclosed design. A comparison of the SBC partially-enclosed design to the FBC partially-enclosed design was not made because the SBC partially-enclosed case is not typically used in residential construction.
3 Higher in an absolute sense applied to both positive and negative pressures.
14

A note should be made here regarding the reference to “glazing” in the FBC opening definition. Strictly speaking, several door “openings” escape the impact rating requirements because the definition of openings is phrased in terms of “glazed” openings. ARA clarified the definition of glazed openings with DCA to mean any door or window containing glass6. Thus, outside the High Velocity Hurricane Zone, garage doors and entrance doors without windows only have to meet wind pressure requirements in the WBDR; they do not have to meet any of the referenced impact standards.
To help explore potential increased cost of construction for various wind conditions throughout the state, ARA determined the various wind speed, exposure and enclosure combinations available under Chapter 16 of the FBC. These combinations are shown in Table 3-3.
Once the wind speeds, exposure and enclosure classifications were determined, calculations were performed to determine velocity and design pressures for each design condition for each house. The Aubuchon house is masonry, one Mercedes house is masonry and another Mercedes house is wood frame. All were designed for wind loads for the appropriate cases listed in Table 3-3. (For the second part of this project it was determined that the Dalton house was an unusual design (three story wood frame) and was not representative of construction in other parts of Florida. Therefore, the wood frame model house from Mercedes was added to the study to replace the Dalton house.) The resultant design pressures for all the houses are included in Appendices A, B and D. Design pressures for each building vary not only due to design wind speed, exposure and enclosure conditions, but also due to the size of the component (window, door, etc.) and location on the building (corner or interior).
Category 2(d) - Walls: Wood or Masonry
Once the design pressures were determined, the exterior walls were designed to withstand the appropriate loads produced. It is important to recognize at this point that for the three houses used for this study both masonry have wall heights under 10′ and the wood frame house has 8′ high walls. This dimension is important because the design conditions change for different wall heights (stud lengths and vertical reinforcement in masonry walls). In many of the higher wind speed areas, design pressures and wall height may limit the design case’s use of 2×4 studs when “minimum sheathing material” is used. Options to handle specific cases include reducing spacing from 16″ on centers to 12″, or use of 2×6 lumber, use of wood structural panels for exterior sheathing (routinely done already with 7/16 inch OSB panels) or a stronger grade or species of lumber. Selection of lumber grade and species can be facilitated through the use of the span tables from the Wood Frame Construction Manual for One and Two-Family Dwellings (Ref 9).
In general, the cost increase for masonry is more than the cost increase for frame construction because the design of the masonry walls calls for extra fill cells under the new wind load provisions. However, note that the reverse is true for the Exposure C design cases in 130, 140, and 150 mph. In these cases, the truss tie down becomes more complicated on wood frame than on masonry structures. The larger strap loads requires more detailing of the wood frame wall to carry the larger uplift loads to the foundation. This extra detailing includes extra jack studs, and additional metal straps at the top plate, and bottom plate, and special anchors to anchor the bottom plate to the foundation. These extra elements force the increase in cost for wood frame structures in high wind areas to be slightly more than masonry structures as indicated in Appendices A, B, and D. 6 ASCE7-98 Defines Glazing as “Glass or transparent or translucent plastic sheet used in windows, doors or skylights.”
15

Table 3-3: Design Cases for FBC
Design No.
FBC Wind Speed
FBC Terrain Exposure
Enclosed/Partially Enclosed WBDR Protection
D-1 100 B E Non WBDR D-2 110 B E Non WBDR D-3 120 B E Impact units D-4 120 B E Impact coverings D-5 120 B E Non WBDR D-6 120 B PE Not Required D-7 120 C E Impact units D-8 120 C E Impact coverings D-9 120 C PE Not Required
D-10 130 B E Impact units D-11 130 B E Impact coverings D-12 130 B E Non WBDR D-13 130 B PE Not Required D-14 130 C E Impact units D-15 130 C E Impact coverings D-16 130 C PE Not Required D-17 140 B E Impact units D-18 140 B E Impact coverings D-19 140 B E Non WBDR D-20 140 B PE Not Required D-21 140 C E Impact units D-22 140 C E Impact coverings D-23 140 C PE Not Required D-24 150 B E Impact units D-25 150 B E Impact coverings D-26 150 B PE Not Required D-27 150 C E Impact units D-28 150 C E Impact coverings D-29 150 C PE Not Required
One may also notice a slight inconsistency for the 130 mph, Exposure C, partially-enclosed design case, in that the cost increase for the wood frame in this case does not exceed the cost increase for the masonry structure. This is inconsistent with the fact that the 130 mph Exposure C, Enclosed case does cost more in wood than masonry. Examination of the design data provided by the truss manufacturer indicated that the wind loads reported from their truss design package in the partially-enclosed case were slightly inconsistent with the expected trend. The truss manufacturer was pursuing this issue with the software designer, and unfortunately no resolution was available at the time of this report. The effect of this issue on the final cost numbers is relatively minor.
Design calculations (Appendix K) for the stud spacing, length, species and lumber grade were completed for the frame house in this study; none of the changes identified above were required to “build” this house in all areas of the state. Due to the complex nature of these options for
16

larger houses, this report does not address additional costs that may be required to build wood frame buildings (or parts of buildings, i.e., second floor walls) with wall heights greater than 8′.
Some options do exist for the builders who use wood framing with ceiling heights greater than 8′ to 10′. First, the studs can be changed from 2×4s to 2×6s or sheathing can be changed to thicker material to help strengthen the walls. While these options were not required for the houses in this project, included for information is Table 3-4 that shows a price comparison of different sheathing options for various thickness of plywood that can be used for sheathing. Builders can use this information to analyze their own designs for cost increases.
Table 3-4: Wall Sheathing Material Prices
Material Thickness
(in.) Price each $/sq. ft. Total Cost2$ Increase vs. OSB
% Increase vs. OSB
Relative Cost vs. OSB
OSB 7/16 $ 5.98 $0.19 $224 Plywood 3/8 $ 8.99 $0.28 $337 $113 50% 1.5
1/2 $10.98 $0.34 $412 $188 84% 1.8 1/21 $11.48 $0.36 $431 $206 92% 1.9 5/8 $13.97 $0.44 $524 $300 134% 2.3 3/4 $17.98 $0.56 $674 $450 201% 3.0 3/41 $18.97 $0.59 $711 $487 217% 3.2
1 4 ply plywood 2 Wall area of 1200 square feet
Calculations were also performed to determine the requirements for the masonry walls to withstand wind loads. Masonry is used for much of Florida’s house building and the costs will not change much due to wind loading. The only changes necessary were to increase the number of required fill cells (vertical cells in the concrete block walls with reinforcing rod from foundation to tie-beam that are filled with concrete). Spacing of fill cells was reduced from 9′4″ for low wind speed design to 6′ for higher wind speeds; thus requiring more filled cells for a given wall length. Detailed design information is presented in Appendices A, B, and D for each building. According to one of the builders involved with the project, the cost estimate for an 8′ fill cell is $8.50 each. Costs reported reflect this estimate. Price calculations for the increased number of cells required for each house are shown in the appropriate appendix also. One should note that these costs increased by less than $70.00 in the highest wind load conditions for these houses. However, larger houses will likely experience greater cost increases due to longer and/or higher walls.
Category 2(e) - Windows and Sliding Glass Doors
To allow for the most economical selection of appropriate products, the designer must determine the Design Pressure (DP) requirements for each opening (window, door, etc.). Once the individual window DP is determined, one must select from the available products to determine what will be used in the building. For this study, individual opening design pressures were calculated for 29 different design conditions shown in Table 3-3. The results of these calculations for all conditions are shown in Appendices A, B and D. Specific information on availability of windows and sliding glass doors to meet the required DP ratings has been difficult to obtain. However, the Miami-Dade product approval website (www.buildingcodeonline.com) lists many approved products by numerous manufacturers. Some windows are wind pressure rated only, which means
17

they require debris protection if used on enclosed structures in the WBDR, while many other windows are impact rated. For this study we used available information from PGT Industries; they have an extensive line of windows, sliding glass doors and glass entry doors that match the needs for the houses examined. Depending on style and size of the unit, design pressure ratings for standard windows and doors on the market today (not impact rated or high-wind design) range up to 100 psf with the majority of units rated under 70 psf.7
Figure 3-4 shows the changes in design pressure requirements of various design wind speeds and exposure classifications. The choice of which design option to use could be made based on the fenestration (windows and doors) produce availability. For example, if a builder plans to design in the wind-borne debris region for 120 mph, Exposure B and wants to use windows rated at –40 psf, he will have to construct an enclosed building. The figure shows that the design pressure requirement (at 120 mph) for an enclosed building is approximately –35 psf, therefore, the windows are acceptable. However, for a partially-enclosed building, the design pressure requirement is approximately –43 psf; therefore, the –40 rated window cannot be used. For windows and doors larger than 10 SF, a lower DP than that listed in Figure 3-4 or Table 3-5 may be calculated from ASCE 7-98.
As shown in Appendices A, B and D, prices for windows increase as design pressure ratings go up. In some cases simply changing from standard annealed glass to thicker or stronger glass will provide the necessary design pressure rating. In other cases, stronger glass and window frames are needed. In high wind design cases, combining thicker and heat-treated glass along with stronger frames will be required to meet the DP requirements. Prices for windows reflect the required manufacturing changes to meet the calculated DP needs. (Prices shown reflect a 15% discount from list prices in PGT Industries published catalog.)
Further review of Appendix B shows that some cases were encountered in the 150 mph wind speed examples where we were unable to locate some high DP rated doors and circular-head windows at this time. In some cases builders will be able to replace large windows (53″ wide) with two smaller (26.5″ wide) to handle the design load requirements. In other cases the use of laminated glass units may be suitable to achieve the design pressure needed; this is often a more costly option due to the cost of laminated glass units. Further analysis of options is needed, but beyond the scope of this project.
Installation costs for windows and doors under the FBC in many instances will be higher due to load transfer requirements and prescriptive fastening methods dictated by the FBC (1707.4.4). An additional cost of $35.00 per unit is anticipated (per PGT Industries) and is included in the cost data as “Installation”.
Category 2(f) - Wind Borne Debris Protection
Wind borne debris protection requirements of the FBC have probably been the most misunderstood and misquoted subject of all. This study is concerned with single family residential construction and no attempt is made to address wind borne debris in other than single family buildings with a mean roof height under 30′.
7 Anderson Corporation “Product Design Pressure Performance Ratings” and PGT Industries product catalog.
18

-100-90-80-70-60-50-40-30-20-10
080 100 120 140 160
Design Wind Speed in MPH
Desi
gn P
ress
ure
in P
SF Exposure CPartially Enclosed
Exposure CEnclosed
Exposure BPartially Enclosed
Exposure BEnclosed
Figure 3-4: Design Pressure Chart for Various Design Scenarios (DP based on ASCE 7-98 parameters outlined in Table 3-5)
Table 3-5: Comparison of Peak Negative Design Wind Pressures for Residential Structures
Design Wind Speed
Exposure B Enclosed
Exposure B Partially-Enclosed
Exposure C Enclosed
Exposure C Partially-Enclosed
90 -19.5 -24.1 -27.3 -33.7 100 -24.1 -29.7 -33.7 -41.6 110 -29.1 -36.0 -40.8 -50.3 120 -34.7 -42.8 -48.5 -59.9 130 -40.7 -50.2 -56.9 -70.3 140 -47.2 -58.3 -66.0 -81.5 150 -54.2 -66.9 -75.8 -93.6
* Calculated in accordance with ASCE 7-98, Table 1606.2B; Exposure B, Zone 5, Enclosed Structure, Roof slope = 100 to 300 ( 2:12 to 7:12 slope), wind area = 10 square feet
Paragraph 1606.1.4 of the FBC reads:
Protection of openings. In windborne debris regions, exterior glazing that receives positive pressure in the lower 60 feet (18.3 m) in buildings shall be assumed to be openings unless such glazing is impact resistant or protected with an impact resistant covering meeting the requirements of SSTD 12, ASTM E 1886 and ASTM E 1996, or Miami-Dade PA 201, 202 and 203 referenced therein as follows:
1. Glazed openings located within 30 feet (9.1 m) of grade shall meet the requirements of the Large Missile Test.
2. Glazed openings located more than 30 feet (9.1 m) above grade shall meet the provisions of the Small Missile Test.
EXCEPTION: Wood structural panels with a minimum thickness of 7/16 inch (11.1 mm) and maximum panel span of 8 feet (2438 mm) shall be permitted for opening protection in one-and two-story buildings. Panels shall be precut to cover the glazed openings with attachment hardware provided. Attachments shall be
19

designed to resist the components and cladding loads determined in accordance with Table 1606.2B. Attachment in accordance with Table 1606.1.4 is permitted for buildings with mean roof height of 33 feet (10 m) or less where wind speeds do not exceed 130 mph (58 m/s).
Wind borne debris protection is required in Florida in all of Miami-Dade and Broward Counties, and IF THE BUILDING IS DESIGNED AS AN ENCLOSED STRUCTURE it is required where the design wind speed is greater than 120 mph as shown on the map in Figure 1606 of the FBC. Also in areas where the design wind speed is less than 120 mph but greater than 110 mph, the WBDR extends inland for one mile from the coast. However, in the Panhandle region (from the Wakulla/Franklin County line to the western edge of Escambia County) regardless of wind speed, the WBDR is the barrier islands (as limited by Florida Statutes) and the land within one mile of the Gulf coast.
As described above, wind-borne debris protection can be provided by tested impact rated glazed units, an impact resistant covering or 7/16 inch structural panels (with limits per paragraph 1606.1.4). For each case where debris protection is required, the option of impact rated glazed units or protection with an impact resistant covering is provided. The two most common test standards for large missile impact testing are the SBCCI and the Miami-Dade test protocols listed above. A new test standard, ASTM E 1886 and ASTM E 1996, is also acceptable under the FBC. It should be noted however, that the ASTM standard introduces an additional “Large Missile” size that is acceptable at 130 mph and lower wind speeds for “Large Missile” impact testing. A good comparison of the three test standards has been published by the Institute for Business and Home Safety (Ref. 8). Many products approved for large missile impact by one of these agencies can be used wherever debris protection is required in the State regardless of the design wind speed. Roll shutters are the most effected by various pressure requirements. These shutters are manufactured with several different materials for “slats” and each of these materials has its own performance characteristics. Slat materials range from plastic to extruded aluminum and the width of shutter that will pass testing varies significantly based on slat material (and other construction variations) and design pressure requirements. Unlike other shutter types, when specifying roll shutters, one must consider design pressures of the opening as well as the impact testing approvals. Roll shutters have not been considered in this study. Prices will vary based on market conditions, however no attempt has been made to index prices with locations. The International Hurricane Protection Association in Miami provided prices shown in Appendices A, B and D. It should be noted that installation costs will vary based on exterior wall construction methods and other considerations. Protection devices require suitable anchoring for the fasteners that often must attach to the building’s structural members to perform in accordance with the product approval and test conditions. Where brick veneer is used over wood or masonry framing, shutter installation costs can double over costs for direct mount installations. (Steel Storm Panels were used in the cost estimates for impact resistant covering protection.)
Shown in Appendices A, B and D are four options for providing Miami-Dade County approved impact protection. There are numerous options for exterior protection of openings and these tables identify some of the least costly systems and methods.
1. Option one is to use “direct mount” steel storm panels (least expensive shutter system in many cases depending on installation requirements).
2. Option two is the addition of mounting “Tracks” for the steel panels.
20

3. Option three is the use of “direct mounted” aluminum panels.
4. Option four is the addition of mounting “Tracks” for the aluminum panels.
As noted above, the FBC allows the use of 7/16 inch thick wood structural panels on buildings with a mean roof height of 33′ in a WBDR with a design wind speed of 130 mph and less. Included in the appendix are price calculations for this system for the Mercedes house. For the Aubuchon house wood panels are not allowed for some openings due to an 8′ panel size limit in the FBC. Many options could be determined to use various combinations of products for all houses and it is beyond the scope of this project to identify more of them.
Category 2(g) - Doors: Entrance and Garage
Standard 6′8″ high entrance doors without glass are available to meet all design pressure requirements determined in this study. Prices are reported in the detail sheets and show little cost variation for increased pressure requirements. It is important to note that these prices are for doors without windows, once glazing is added to the door pricing can vary considerably and once the height of the door reaches 8′, price variations are more dramatic. The Mercedes houses have 6′8” doors and the Aubuchon house has both 6′8″ and 8′ high doors.
Garage doors are available to meet the various pressure requirements for all design combinations in this study. Development of impact resistant garage doors for the South Florida market has lead to high DP rated doors from several manufacturers. A review of the design pressures presented in Appendices A, B and D shows, for example, that the required pressure rating on the standard double car garage door varies from –17 psf (pounds per square foot) at 100 mph (Exposure B, enclosed) to –61.7 psf at 150 mph (Exposure C, partially-enclosed). Unit prices for these doors vary from $625 to $1,450.
We should point out that impact tests so far have shown that no garage door with windows can pass the impact testing. Therefore if a builder wants to install a garage door with windows in a house located in the WBDR, the house will have to be designed as a partially-enclosed building (for internal pressures) or provide an impact protection device for the garage door.
Category 2(h) - Roof Coverings
Failure of roof coverings in hurricanes has been a recurring problem that results in extensive damage to houses. Currently, most asphalt shingles are rated for a wind speed of 60 mph. The SFBC has required higher rated shingles for a number of years and with the implementation of the FBC, shingles will have to be tested to either the Miami-Dade standard (PA 107-95) or ASTM D 3161 (modified to 110 mph). Costs to move to a “rated” shingle will vary depending on what product builders are using today. Many builders do not use the least expensive products available and may find a code-approved product available for little or no increased cost. Roof shingles used in this study show a modest increase in cost as shown in the summary reports. Where wind speeds are below 110 mph, the FBC requires 4 fasteners per shingle, where the wind speed is 110 mph or greater, fastening must be per the test data and will generally require 6 fasteners per shingle. Many municipalities currently require six fasteners per shingle so no price increase is expected in these areas. While the FBC does have specific requirements for other types of roof coverings, the houses in this study used shingles.
21

Category 2(i) - Roof Structure: Roof Deck, Trusses and Tie-Down Connections
Other than the installation of wind borne debris protection (impact rated units or protection devices) the roof structure changes will contribute most to increased cost of construction. Detailed analysis was performed for the truss designs for all three houses to determine what has to be done to build each house in the various wind speed environments as shown in Table 3-3. Appendices A, B and D contain a truss-by-truss load analysis along with the tie-down system costs. It should be noted that none of these houses have long span trusses (more than 45′); therefore the vaulted ceiling designs did not have to be changed. As the designs for 12 wind speeds, exposures, and enclosure combinations were completed for the Mercedes houses, it became obvious to the truss designer that he had reached the point where only a small additional increase in truss span would mandate a lowering of the vaulted ceiling to allow sufficient strength of the trusses to carry the imposed loads. Builders of larger houses will have to determine the impact of changes in wind loads on the designs for their individual designs. As pointed out earlier, some areas of the state will see lower wind loads, some will be approximately the same, and others will be higher.
As noted earlier, several truss design/manufacturing companies have reported that costs for truss systems for houses designed at 120 and 130 mph, Exposure B, enclosed, will not cost more than the trusses they are designing and delivering today. This statement is consistent with design calculations performed for this study. (See Appendix G.)
While truss tie-down costs increase proportionately with the loads on the roof system one must be sure to carefully check wood frame walls to assure an adequate load path is obtained. In the higher wind speed design cases, wood tie-down straps are not available for some of the design loads determined by this study. In these instances, several options to transfer loads exist: use of closer spaced studs and or heavier exterior sheathing and use of threaded rod tie-down systems to adequately secure the wall top plate to the structure below (footing or tie beam for second floor wood on top of masonry first floor). Connections for the trusses to top plates are available, however, the difficulty is with the intermediate connections between the top plates and the foundation.
To provide the proper uplift resistance, roof deck nailing will have to be installed with less spacing between the nails. While Mercedes’ framer quoted no increase in price, Aubuchon’s framing sub-contractor estimated $90 to change the pattern from 6/12 (6″ on the edges/12″ in the middle) to 6/8, and another $90 to go to 6/6. Therefore, it would cost $180 for Aubuchon’s 2900 square foot house to reduce the nail spacing to the lowest required level for the 150 mph design. That translates to approximately 6¢ per square foot.
For this study truss load calculations were performed under the rules of ASCE 7-98 with the roof system designed for Components and Cladding (C&C) loads. This method (vs. designed as Main Wind Force Resisting System--MWFRS) yields uplift loads that are higher than MWFRS calculations; it was decided to use this more conservative method because ASCE 7-98 indicates that trusses should be checked for both C&C and MWFRS loads. It should be noted while there is no universal agreement among designers on this subject; the truss design companies involved in this project use the C&C method. In the highest load wind/exposure/ enclosure conditions, providing an acceptable “load path” to transfer roof uplift loads to the foundation on wood frame walls may require additional wall framing or strengthening. Comments are provided in the truss information in Appendices A, B and D.
22

Category 3: Termites
Damage prevention is an obvious goal of the FBC. If soil treatments are used, there are specific requirements for treatment and re-treating disturbed previously treated soil. This may cause increased costs to builders who use soil treatment methods today. Additional treatments and re-treatments will cost $75 to $300, depending on the contract between the builder and termite treatment company and related roof downspout and condensate discharge requirements. (Al Hoffer’s Pest Protection in Coral Springs, and Department of Community Affairs).
It should be noted however, that alternative systems to soil treatment are available. New “Bait” systems that are now on the market eliminate the need for soil treatment by placing bait/monitoring stations around the building to control termite infestation. These stations are installed after all construction activity is completed thus eliminating the need for several treatments and re-treatments. A cost analysis for a 3,000 square foot house showed a cost of $600 to $700 for soil treatment and $755 for a bait system. Builders may wish to explore both methods for their specific houses. According to the Florida Home Builders Association, use of the bait products requires local building official approval.
Category 4: Concrete Slab
Construction of concrete slabs in single-family houses must include either fiber reinforcing in the concrete mix or welded wire mesh in the slab. The FBC requires the wire mesh to be supported off the ground to assure the reinforcement is located in the vertical center of the slab. Prices should be approximately 4 to 5¢ psf of the slab.8
Category 5: Gable End-Walls
Construction requirements for gable end-walls have changed by the FBC, however none of the gable end-walls on the houses in the study required any changes. Costs will vary based on construction material, size, and number of gable walls with cathedral ceilings behind them. These walls are now required to have continuous framing (concrete, masonry, wood or light weight steel) between points of lateral support.
Category 6: Screen Enclosures
The FBC definition of a screen enclosure is: A building or part thereof, in whole or in part self-supporting, and having walls of insect screening with or without removable vinyl or acrylic wind break panels and a roof of insect screening, plastic, aluminum or similar lightweight material. These “enclosures” must now be designed as structures with low hazard to human life (Table 1606 FBC). Additionally, the minimum thickness of aluminum must be 0.040″. As a result, costs are expected to increase from 15 to 50% for an average screen enclosure. It should be noted that many areas of Florida do not currently require “engineered” screen enclosures while other areas do. This is important because those areas without the engineering requirements today are likely to see cost increases near the upper limit shown above, while those already requiring designed structures are likely to be at the lower end of the range.
8 Source: Mercedes Homes, Jacksonville, FL.
23

Details provided in the “Guide to Aluminum Construction in High-Wind Areas”, published by the Aluminum Association of Florida (AAF) (Ref 10), result in a reduction in allowable spans for aluminum structural members thus potentially increasing the number and size of supports to construct an enclosure. For example: under the current code, a standard 21′ × 36′ enclosure with mansard roof would have three 2 × 6 roof frames on 2 × 3 posts: whereas under the FBC with a design wind speed of 110 mph, the same enclosure would have four 2 × 7 roof frames on 2×4 posts with more bracing and brackets. With a design wind speed of 150 mph the same number of roof frames is acceptable but the posts would have to be upgraded to 2 × 6 heavy wall posts. (See Appendix B for details and estimates from contractor.)
Additionally, fastening and bracing requirements for joints have changed considerably requiring more material and labor to assemble and install screen enclosures. Installation time is expected to increase up to 40% due to more of the structure to be built of heavier material and increased fastening requirements. The FBC also stipulates a maximum 20 × 20 screen mesh (number of threads per inch in the vertical and horizontal directions); this is not generally a change in most areas because 18 × 14 mesh is used today. Some areas do use finer screening and changes will be required. None of the builders involved in this project were impacted by the changes due to the fact that neither the builder nor the screen enclosure contractor that provided the Aubuchon enclosure was unaware of the extent of required changes (The AAF Guide was published in September 2001). Aubuchon’s project manager was aware that his screen enclosure was “engineered” and thought that was what was needed to comply with the FBC. (Prices for the screen enclosures for the Aubuchon house were estimated using increases ranging from 15% to 35% depending on wind load requirements.)
Category 7: Swimming Pools
Several changes to swimming pools are mandated by the FBC and additional changes are required by the Residential Swimming Pool Safety Act (Chapter 515 FS). It is important to note that the only building code related swimming pool change examined during this project is the installation of a duel drain. Other pool safety act related changes are beyond the scope of this project and were not considered.
Category 8: Energy Code
Changes to the energy code in FBC will impact many builders due to changes in baseline window, air conditioner SEER Rating and other items. Under the FBC, the baseline window has been increased to a double pane window with a solar heat gain coefficient of 0.40 for all three climate zones. A minimum efficiency heat pump (10SEER/6.8HSPF) replaces electric strip heating of the Central and Southern climate zones. The net effect is that builders who previously met the E-ratio under the SBC will no longer meet the energy requirements under the FBC.
Both builders involved with this project currently build their houses with sufficient energy efficiency features in excess of the SBC that allow them to also meet the new energy requirements of the FBC; therefore, there are no cost increases for these houses to meet the new requirements.
For illustrative purposes only, Appendices A, B, and D contain an analysis of each house that explores what could be done to comply with the FBC, if these study houses had been built with only minimal energy related features. Exact prices for changes can only be determined with specific
24

designs and analysis to determine what must be done (if anything) to comply with the new code. Builders may have to consider one or more of the following to change their existing designs to comply with the new energy requirements:
1. Reduce heat gain from the attic by adding R30 insulation.
2. Install energy efficient windows with tinting, double pane, and/or low-e glass.
3. Increase heat pump SEER, cost for increasing SEER rating is approximately $250 per point. (To go from an SEER of 10 to 12 would cost about $500, per Mercedes Homes and Paul Blanchard of Air Flow Designs in Orlando.)
4. Install a programmable thermostat ($50 to $100 from The Home Depot).
5. Provide Airtight Duct System.
6. Use a white roof covering.
7. Provide a radiant barrier in the attic.
8. Provide a factory sealed air handling unit.
9. Locate air handling unit in conditioned space.
Again, because the existing houses already meet the FBC energy requirements, no energy related cost increases appear in the final cost summary of this report.
Category 9: Mechanical Code
Changes in mechanical code requirements include mandating all toilet rooms and bathing rooms to have mechanical exhausts even if there is an operable window in the room. Cost estimates for these fans are between $50 and $100 per fan depending on location and difficulty of installation (Mercedes Homes). However, Chapter 12 of the FBC allows toilet rooms that have operable windows to not have mechanical ventilation9. Table M403.3 (Required Outdoor Ventilation Air) in the mechanical code requires private dwellings, single and multiple, toilet rooms and bathrooms to have mechanical exhaust with a capacity of 50 cubic feet per minute, intermittent, or 20 cubic feet per minute continuous. This study assumed the more stringent requirement of the two sections of the FBC.
Balanced air system requirements will dictate changes in return air systems and since most houses built today do not have return air provisions for each room, costs will increase as noted below. The required balanced system can be achieved through the use of one or more of the following10:
1. Ducted return system (estimated at $150 per room when the whole house is done).
2. Transfer grills in wall above doors (estimated cost $35 per room).
3. Transfer with “U” shaped duct above ceiling (estimated cost $75 each).
4. “Hi-Lo” grill near floor in room and grill near ceiling in “return room” (estimated cost $50 to $80 per room, includes 3.5 × 10 duct in wall).
9 1203.4.2 Every toilet room shall have windows as specified for habitable rooms providing in no case less than 3 sq ft (0.28 m^2)
of open space, or shall have approved equivalent mechanical ventilation. 10 Per Air Flow Designs, Orlando
25
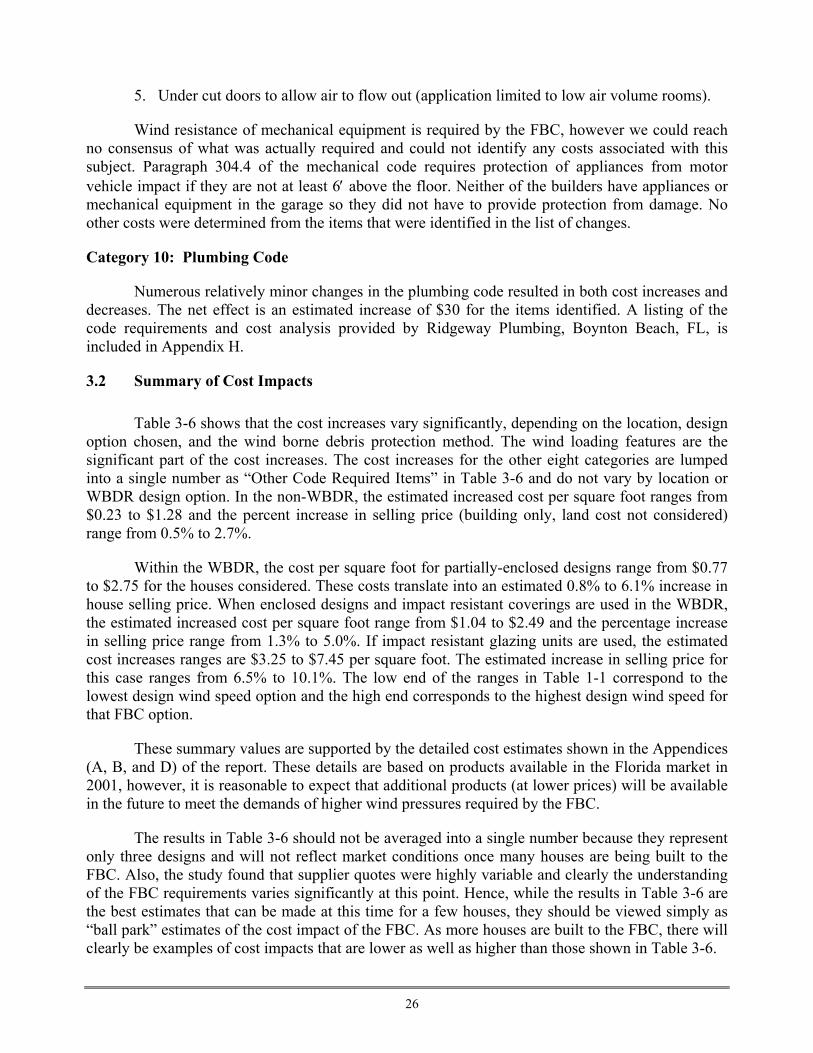
5. Under cut doors to allow air to flow out (application limited to low air volume rooms).
Wind resistance of mechanical equipment is required by the FBC, however we could reach no consensus of what was actually required and could not identify any costs associated with this subject. Paragraph 304.4 of the mechanical code requires protection of appliances from motor vehicle impact if they are not at least 6′ above the floor. Neither of the builders have appliances or mechanical equipment in the garage so they did not have to provide protection from damage. No other costs were determined from the items that were identified in the list of changes.
Category 10: Plumbing Code
Numerous relatively minor changes in the plumbing code resulted in both cost increases and decreases. The net effect is an estimated increase of $30 for the items identified. A listing of the code requirements and cost analysis provided by Ridgeway Plumbing, Boynton Beach, FL, is included in Appendix H.
3.2 Summary of Cost Impacts
Table 3-6 shows that the cost increases vary significantly, depending on the location, design option chosen, and the wind borne debris protection method. The wind loading features are the significant part of the cost increases. The cost increases for the other eight categories are lumped into a single number as “Other Code Required Items” in Table 3-6 and do not vary by location or WBDR design option. In the non-WBDR, the estimated increased cost per square foot ranges from $0.23 to $1.28 and the percent increase in selling price (building only, land cost not considered) range from 0.5% to 2.7%.
Within the WBDR, the cost per square foot for partially-enclosed designs range from $0.77 to $2.75 for the houses considered. These costs translate into an estimated 0.8% to 6.1% increase in house selling price. When enclosed designs and impact resistant coverings are used in the WBDR, the estimated increased cost per square foot range from $1.04 to $2.49 and the percentage increase in selling price range from 1.3% to 5.0%. If impact resistant glazing units are used, the estimated cost increases ranges are $3.25 to $7.45 per square foot. The estimated increase in selling price for this case ranges from 6.5% to 10.1%. The low end of the ranges in Table 1-1 correspond to the lowest design wind speed option and the high end corresponds to the highest design wind speed for that FBC option.
These summary values are supported by the detailed cost estimates shown in the Appendices (A, B, and D) of the report. These details are based on products available in the Florida market in 2001, however, it is reasonable to expect that additional products (at lower prices) will be available in the future to meet the demands of higher wind pressures required by the FBC.
The results in Table 3-6 should not be averaged into a single number because they represent only three designs and will not reflect market conditions once many houses are being built to the FBC. Also, the study found that supplier quotes were highly variable and clearly the understanding of the FBC requirements varies significantly at this point. Hence, while the results in Table 3-6 are the best estimates that can be made at this time for a few houses, they should be viewed simply as “ball park” estimates of the cost impact of the FBC. As more houses are built to the FBC, there will clearly be examples of cost impacts that are lower as well as higher than those shown in Table 3-6.
26

Table 3-6: Summary of Estimated Cost Increases of FBC Compared to SBC Enclosed Design (without Impact Protection )
Wind Speed (mph) House A - Masonry House B - Masonry House D - Wood
Wind Resistance Features $ 87 to $ 1,186 $ 661 to $ 1,068 $ 109 to $ 1,114 Other Code Required Items $ 425 $ 905 $ 425 Total Cost $ 512 to $ 1,611 $ 1,566 to $ 1,973 $ 534 to $ 1,569 Cost per Square Foot $ 0.23 to $ 0.73 $ 0.54 to $ 0.68 $ 0.24 to $ 0.71
100-120
% of Selling Price 0.51 % to 1.62 % 0.73 % to 0.92 % 0.60 % to 2.57 % Wind Resistance Features $ 1,307 to $ 2,276 $ 1,858 to $ 2,816 $ 1,256 to $ 1,823 Other Code Required Items $ 425 $905 $ 425 Total Cost $ 1,732 to $ 2,701 $ 2,763 to $ 3,721 $ 1,681 to $ 2,248 Cost per Square Foot $ 0.79 to $ 1.21 $ 0.95 to $ 1.28 $ 0.76 to $ 1.02 N
on- W
ind
Bor
ne D
ebri
s Reg
ion
130-140
% of Selling Price 1.74 % to 2.71 % 1.29 % to 1.73 % 1.89 % to 2.53 % Partially Enclosed (without Impact Protection)
Wind Speed (mph) House A - Masonry House B - Masonry House D - Wood
Wind Resistance Features $ 1,553 to $ 3,251 $ 1,317 to $ 2,900 $ 1,502 to $ 3,180 Other Code Required Items $ 425 $ 905 $ 425 Total Cost $ 1978 to $ 3,676 $ 2,222 to $ 3,805 $ 1,927 to $ 3,605 Cost per Square Foot $ 0.90 to $ 1.67 $ 0.77 to $ 1.31 $ 0.88 to $ 1.64
120-130
% of Selling Price 2.0 % to 3.7 % 1.03 % to 1.77 % 2.17 % to 4.05 % Wind Resistance Features $ 2,838 to $ 5,622 $ 3,838 to $ 6,817 $ 2,763 to $ 5,849 Other Code Required Items $ 425 $ 905 $ 425 Total Cost $ 3,263 to $ 6,047 $ 4,743 to $ 7,722 $ 3,186 to $ 6,274 Cost per Square Foot $ 1.48 to $ 2.75 $ 1.64 to $ 2.66 $ 1.45 to $ 2.85
140-150
% of Selling Price 3.28 to 6.08 2.21 % to 3.9 % 3.58 % to 7.05 % Enclosed with Impact Covering
Wind Speed (mph) House A - Masonry House B - Masonry House D - Wood
Wind Resistance Features $ 1,902 to $ 3,069 $ 2,592 to $ 3,941 $ 1,860 to $ 3,077 Other Code Required Items $ 425 $ 905 $ 425 Total Cost $ 2,327 to $ 3,494 $ 3,497 to $ 4,846 $ 2,285 to $ 3,502 Cost per Square Foot $ 1.06 to $ 1.59 $ 1.21 to $ 1.67 $ 1.04 to $ 1.59
120-130
% of Selling Price 2.34 to 3.57 1.63 % to 2.25 % 2.57 to 3.93 Wind Resistance Features $ 2,993 to $ 3,942 $ 4,340 to $ 6,322 $ 2,540 to $ 3,970 Other Code Required Items $ 425 $ 905 $ 425 Total Cost $ 3,418 to $ 4,367 $ 5,245 to $ 7,227 $ 2,965 to $ 4,395 Cost per Square Foot $ 1.55 to $ 1.99 $ 1.81 to $ 2.49 $ 1.35 to $ 2.00
140-150
% of Selling Price 3.44 % to 4.39 % 2.44 % to 3.36 % 3.33 % to 4.94 % Enclosed with Impact Glazing
Wind Speed (mph) House A - Masonry House B - Masonry House D - Wood
Wind Resistance Features $ 6,759 to $ 7,589 $ 17,279 to $ 18,563 $ 6,717 to $ 7,597 Other Code Required Items $ 425 $ 905 $ 425 Total Cost $ 7,184 to $ 8,014 $ 18,184 to $ 19,468 $ 7,142 to $ 8,022 Cost per Square Foot $ 3.27 to $ 3.67 $ 6.27 to $ 6.71 $ 3.25 to $ 3.65
120-130
% of Selling Price 7.22 % to 8.05 % 8.46 % to 9.05 % 8.02 % to 9.01 % Wind Resistance Features $ 7,578 to $ 8,568 $ 18,877 to $ 20,690 $ 7,125 to $ 8,596 Other Code Required Items $ 425 $ 905 $ 425 Total Cost $ 8,003 to $ 8,993 $ 19,782 to $ 21,595 $ 7,550 to $ 9,021 Cost per Square Foot $ 3.64 to$ 4.09 $ 6.82 to $ 7.45 $ 3.43 to $ 4.10
Win
d B
orne
Deb
ris R
egio
n
140-150
% of Selling Price 8.04 % to 9.04 % 9.20 % to 10.04 % 8.45 % to 10.14 %
27

4 LOSS ANALYSIS
4.1 Modeled Design Parameters and Locations
For each of the 25 study locations, the three houses were designed with the wind speed, exposure, and enclosure parameters listed in Table 3-2. Design calculations according to SBC were also completed. All of the design results are summarized for each house in Appendices A, B and D. As an example, the FBC design calculations for one of the houses at 130 mph design wind speed are shown in Appendix J. These calculations were repeated for the wind speed/exposure combinations at each of the 25 points in this study listed in Table 3-2 and Figure 3-3. Design calculations for the same house under SBC are given in Appendix K.
The design calculations indicate that a minimum nail size of 8d should be used throughout the state. The nailing pattern for the roof varies from the standard 6″/12″ pattern in the low wind speed zones in the state, to the 6″/6″ spacing in the high wind zone areas. In all of these designs, the nailing pattern at the edge of the roof is assumed to drop to a 4-inch spacing next to the gable end (if appropriate). The nailing pattern has been determined based on Zone 2 pressures. This nailing pattern has been applied uniformly across the entire roof.
The hurricane strap size has been calculated for trusses using C&C loads. Both end zone trusses and interior trusses were calculated for each building. Because the FBC now uses a load combination of 60% of the dead load of the roof to resist uplift, the design values of the straps are larger than they were for the SBC.
This study has only considered shingle roof coverings. Other roof coverings such as clay and concrete tile can be more resistive to wind damage, but significantly more expensive to replace, and therefore the loss estimates in this study cannot be extrapolated to these types of construction.
4.2 Loss Reduction Evaluation
By using these design results in the HURLOSS model, the average annual loss (AAL) was computed for the house designed according to the SBC, and compared to the average annual loss for the house designed by the appropriate FBC design scenario listed in Table 3-2. The difference in AAL is reported here as the loss reduction percentage. For example, the hurricane losses for the FBC design of the Aubuchon Wood house located at Location ID 2 (see Table 3-2) can be expected to be 54% less on average than the losses for the same house designed according to the SBC.
An example of the variation by location of the relative loss ratios is given in Figure 4-1. Note that the first 8 study locations are in the Non-WBDR, and as such, would not normally be designed as partially-enclosed structures. The other 17 locations are in the WBDR, and have two design options: enclosed (with impact resistant units or coverings) or partially enclosed. Notice that there is some variation in the loss reduction factors from one location to another. This variation is caused by differences in climatology of each site (storm intensity, distance inland, exposure) and the relative change in design wind speed resulting from the new wind speed map, as discussed in Section 3.1.
28

Aubuchon Masonry
0%
20%
40%
60%
80%
100%
1 2 3 4 5 6 7 8 9 10 11 12 13 14 15 16 17 18 19 20 21 22 23 24 25Location ID
Perc
ent L
oss
Red
uctio
n fr
om S
BC
97FBC EnclosedFBC PartEnclosed
Figure 4-1: Example of Loss Reduction of FBC Designs Compared to SBC Design
(Locations 1-8 are Non-WBDR)
Table 4-1 shows the average loss reduction by design scenario. In the Non-WBDR, the loss reduction is approximately 50% compared to the SBC. Examination of the failure rates in the simulations indicated that these savings are largely attributed to the new roof covering requirements for the FBC, as discussed in the next section. For the WBDR, Table 4-1 indicates that the FBC enclosed scenario yields larger reductions in losses than the partially-enclosed scenario. The main difference between the two design scenarios is the addition of impact resistance coverings or glazing to the enclosed designs. This result is consistent with the concept that keeping the building envelope intact is more important than strengthening some or all of the connections of the structural system.
Table 4-1: Loss Reductions Averaged Across All Locations
House Value FBC Enclosed Non-WBDR
FBC Enclosed WBDR
FBC Part Enclosed WBDR
Average 48.8% 55.5% 44.6% Aubuchon Masonry Range 44 – 57% 41 – 60% 26 – 50%
Average 53.1% 54.1% 50.1% Mercedes Wood Range 48 – 61% 47 – 61% 42 – 56%
Average 52.4% 53.8% 48.7% Mercedes Masonry Range 47 – 61% 46 – 61% 39 – 54%
Notice that the effect of the impact resistant covering is more pronounced for the Aubuchon home than the Mercedes home. The Aubuchon home is a more expensive home (per square foot) than the Mercedes homes, and also has more glazing (approximately 21% of the wall area as opposed to 14% on Mercedes). The fact that there are more windows, means that shutters become more important in reducing losses.
29

One may also note that the partially-enclosed case shows a definite reduction in loss costs of about 45%. This loss reduction is affected by the strengthening of several components, but, like the locations in the Non-WBDR, is largely attributed to the new roof covering standards in the FBC.
4.3 Discussion of Damage Mechanisms
The HURLOSS methodology considers many failure mechanisms in its simulation. The main failure types include the following:
• Roof Covering,
• Roof Deck,
• Whole Roof – trusses and deck and roof covering lift off the entire structure,
• Wall Failure, and
• Fenestration Failures (windows, doors, sliding glass doors, garage doors).
The charts in Figure 4-2 show the typical interaction between the main damage modes that are simulated in the HURLOSS methodology. These charts compare the failure rates for the Aubuchon house designed according to SBC and FBC at location 19. At this location, the SBC design speed is 100 mph fastest mile, and the FBC design wind speed is 130 mph gust. The key parameters for the simulation are summarized in Table 4-2. Notice that almost all of the FBC components listed in Table 4-2 are stronger than the SBC versions, and the FBC enclosed design is the only one with impact protection.
Figure 4-2 (a) and (b) indicates that both of the FBC cases exhibit a reduction in roof covering and roof deck damage relative to the SBC case. Note that the whole roof failures (Figure 4-2 (c)), where the entire roof is separated from the walls as one unit, are virtually non-existent for all three design cases, and therefore the contribution of larger hurricane straps is minimal. Also note that the wall failure rates (Figure 4-2 (e)) are negligible as well and any differences introduced in the FBC do not affect the loss costs. The fenestration failure curve (Figure 4-2 (d)) which indicates how often windows/doors/sliders/garage doors are failing, shows a dramatic difference between the FBC enclosed case and the other two design cases because of the effect of the impact protection.
Table 4-2: Key Parameters for HURLOSS Simulations of Aubuchon House at Location 19
Design Feature
SBC FBC Enclosed
FBC Part. Enclosed
Design Wind Speed/ Exposure (gust) 120 130 / C 130 / C Max Window/Door/Slider Design Pressure (psf) Zone 5 +26 / -28 +36 / -49 +48 / -60 Impact Protection No Yes No Roof Deck Thickness ½″ plywood ½″plywood ½″ plywood Nail Size 6d common 8d common 8d common Nail Spacing in Field of Roof 6″/12″ 6″/9.6″ 6″/9.6″ Roof Straps (lbf) a 646 1542 2050 Roof Covering 60 mph shingle 110 mph shingle 110 mph shingle a Roof Strap on center truss of building
30

0102030405060708090
100
65 85 105 125 145 165 185 205Max. Gust Produced During Storm (mph)
Perc
ent D
amag
eAverage Percentage of Roof Cover Damage
0102030405060708090
100
65 85 105 125 145 165 185 205Max. Gust Produced During Storm (mph)
Perc
ent D
amag
e
Average Percentage of Roof Deck Damage
(a) (b)
0102030405060708090
100
65 85 105 125 145 165 185 205Max. Gust Produced During Storm (mph)
Perc
ent o
f Sto
rms
Percentage of Storms Producing Whole Roof Damage
0102030405060708090
100
65 85 105 125 145 165 185 205Max. Gust Produced During Storm (mph)
Perc
ent D
amag
e
Average Percentage of Failed Fenestrations
(c) (d)
0102030405060708090
100
65 85 105 125 145 165 185 205Max. Gust Produced During Storm (mph)
Perc
ent D
amag
e
Average Percentage of Whole Wall Damage
SBC DesignFBC Enclosed DesignFBC Part. Encl. Design
(e)
Figure 4-2: Typical Damage Curves for Various Failure Modes of Aubuchon House at Location 19
31

ARA analyzed the different wall design parameters with our HURLOSS model and found that the type of wall construction hardly affects the loss costs. Although our models show that the failure rates of the walls designed for low wind loads are more than those designed for high wind loads, the model also indicates that the wall failures are correlated with whole roof failures. The wall failures generally only occur after the whole roof has lifted off the structure leaving the wall unbraced. Thus since the whole roof failure already makes the structure a total loss, the effect of the wall construction type on loss costs is minimal.
The HURLOSS model is able to determine which of the damage mechanisms dominate the losses for a given design of a house. Figure 4-3 shows the relative frequency of the major failure mechanisms for the Aubuchon house. Note that the loss costs are driven largely by the roof covering failures and the fenestration failures. The improved roof covering required by the FBC makes a dramatic difference to the loss costs. Thus, the reduction in loss costs for the partially- enclosed case is mainly a result of improved roof covering. The FBC enclosed design attains even greater reductions in loss cost by addressing the other major failure mode – the unprotected fenestrations. Note that this report has only examined shingle roof coverings. Tile roof coverings were not considered in this study.
0.0%
0.5%
1.0%
1.5%
2.0%
2.5%
3.0%
3.5%
4.0%
At Least 5%Roof Cover
At Least OneRoof Deck Panel
At Least OneWhole Roof
Section
At Least OneWhole Wall
Section
At Least OneFenestration
At Least OneSkylight
Failure Mode
Freq
uenc
y of
Dam
age
per S
torm
SBCFBC EnclosedFBC Part Enclosed
Figure 4-3: Relative Frequency of Damage Modes for Aubuchon House (Location 19)
32

4.4 All Stakeholders Benefit-Cost Summary (Hurricane FBC Improvements Only)
The total “All Stakeholders” (owner, government, insurer) cost-benefit perspective includes all costs and benefits, regardless of the stakeholder that receives the benefits. For this purpose, consider the extra cost of construction required as a result of these design changes and compare them to the value of the reduced losses that are created as a result of the changes. Note that we have not attempted to quantify benefits such as improved safety and protection of irreplaceable homeowner possessions, or government differential costs of evacuation, shelters, clean-up, etc. that results from damaged houses.
For this house, Table 4-3 shows an example of a Net Present Value (NPV) analysis of the three design scenarios for a 30-year building life. The example is for the Aubuchon house at Location 16. Thirty years is selected since most buildings have a useful life of at least 30 years. NPV analysis is a method of converting a series of cash flows into a number in today’s dollars such that a comparison of the costs and benefits can be made for each design scenario. Three components were considered in the NPV analysis; the cost of construction, the salvage value of the differential costs of the code improvements, and the savings resulting from reduced losses (AAL) estimated by HURLOSS. More details of the NPV analysis technique appear in Section 2.2.4.
These results assume that construction costs increase at 2% per year and that the increased cost for the FBC are reflected in the future value of the house. Reductions in future hurricane losses and future salvage value of improvements are discounted back to present time using an interest rate of 5%.
Positive NPV means that the increased cost of constructing to the FBC is offset by the expected future reductions in loss from hurricanes. The higher the NPV the more the loss reduction benefits offset the added initial cost of construction. Figure 4-4 thru Figure 4-6 present bar charts that summarize the net present value calculation results for each of the study locations.
Table 4-3: Example of Details of Net Present Value Analysis for Aubuchon House at Location 16
FBC Enclosed Cost-Benefit
Parameter
SBC Impact Glazing
Impact Covering
FBC Partially-Enclosed
Increase in Cost of Construction ($) 0 18,874 4,288 3,837 Future Salvage Value of FBC Cost Differentials ($)1 0 34,189 7,766 6,950 Estimated Savings in AAL (annually) ($) 0 617 617 518 Net Present Value (analyzed over 30 years) Increase in Cost of Construction ($) 0 -18,874 -4,288 -3,837 Present Salvage Value of FBC Cost Differentials ($)2 0 7,911 1,797 1,608 Present Value of AAL Reductions ($)2 0 11,938 11,938 10,026 Total NPV ($) 0 947 9,447 7,797
1 Assumes that construction costs increase at 2% per year 2 Assumes a discount factor of 5% per year. 3 Positive Total NPV indicates design option benefits outweigh cost.
33

Within the Non-WBDR (Locations 1-8), the NPV are all positive, indicating that the estimated changes in benefits resulting from the FBC design outweigh the increased cost of construction. For the WBDR, with the exception of Location 14, the NPVs are positive for all three houses designed as Enclosed buildings with impact resistant coverings. The increased cost of the impact protection and the other changes to the structure, are more than compensated by the benefit of reducing the losses. Now, if the glazed openings were replaced with the more expensive impact resistant glazing units, then the NPVs are positive only for the strongest of the wind climates like Location 25 in Key West where the benefits of protecting the openings are very high.
When one compares the Mercedes NPVs in Figure 4-4 and Figure 4-5 with the Aubuchon NPVs in Figure 4-6, it can be seen that the Aubuchon NPVs are significantly higher than the Mercedes cases at identical locations. The NPVs for the enclosed with impact glazing design are also positive more often in the former because the Aubuchon house has more windows than the Mercedes and is also more expensive per square foot. Both of these features mean that the benefits of protecting the glazing will be higher relative to the unprotected case.
One should not extrapolate or try to generalize these results. They are based on only three houses at each of these specific sites, two of which are identical with respect to loss analysis. The results do not include other loss reduction benefits such as reduced government costs, reduced loss of irreplaceable possessions, etc. Hence, the hurricane loss reduction benefits are clearly lower-bound estimates. Also, the benefits do not quantify the effort and time to close impact resistant coverings versus the permanent in-place protection of impact-resistant glazing. Some homeowners will clearly associate benefits with not having to close shutters for every storm threat.
These results indicate that the FBC is clearly a step in the right direction. If the FBC had produced over-designed buildings (i.e., too strong for the wind climate), the NPVs would all tend to be negative. The negative NPVs indicate that the increase in cost would not be offset by the expected future reduction in losses resulting from the stronger designs. Clearly this only occurs when the more expensive impact resistant glazing is used instead of shutters.
34

Aubuchon Masonry
-$10,000
-$5,000
$0
$5,000
$10,000
$15,000
L-01
L-02
L-03
L-04
L-05
L-06
L-07
L-08
L-09
L-10
L-11
L-12
L-13
L-14
L-15
L-16
L-17
L-18
L-19
L-20
L-21
L-22
L-23
L-24
L-25
Location ID
Net
Pre
sent
Val
ue ($
)EnclosedEnclosed - Impact Glazing
Part. Enclosed
Part Enclosed
Figure 4-4: Net Present Value of FBC Design Options Compared to SBC Design at Study Locations for Aubuchon Masonry House (Locations 1-8 are Non-WBDR)
Mercedes Masonry
-$10,000
-$5,000
$0
$5,000
$10,000
$15,000
L-01
L-02
L-03
L-04
L-05
L-06
L-07
L-08
L-09
L-10
L-11
L-12
L-13
L-14
L-15
L-16
L-17
L-18
L-19
L-20
L-21
L-22
L-23
L-24
L-25
Location ID
Net
Pre
sent
Val
ue ($
)
EnclosedEnclosed - Impact
Figure 4-5: Net Present Value of FBC Design Options Compared to SBC Design at Study Locations for Mercedes Masonry House (Locations 1-8 are Non-WBDR)
35
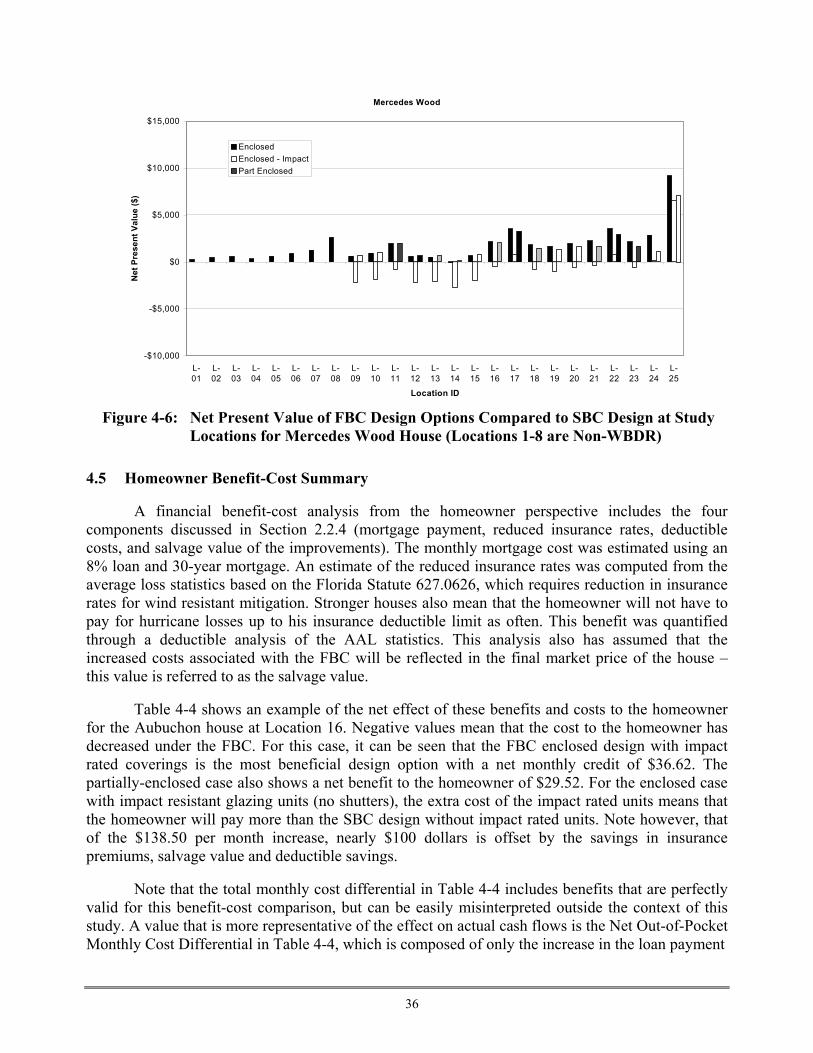
Mercedes Wood
-$10,000
-$5,000
$0
$5,000
$10,000
$15,000
L-01
L-02
L-03
L-04
L-05
L-06
L-07
L-08
L-09
L-10
L-11
L-12
L-13
L-14
L-15
L-16
L-17
L-18
L-19
L-20
L-21
L-22
L-23
L-24
L-25
Location ID
Net
Pre
sent
Val
ue ($
)EnclosedEnclosed - Impact
Part Enclosed
Figure 4-6: Net Present Value of FBC Design Options Compared to SBC Design at Study Locations for Mercedes Wood House (Locations 1-8 are Non-WBDR)
4.5 Homeowner Benefit-Cost Summary
A financial benefit-cost analysis from the homeowner perspective includes the four components discussed in Section 2.2.4 (mortgage payment, reduced insurance rates, deductible costs, and salvage value of the improvements). The monthly mortgage cost was estimated using an 8% loan and 30-year mortgage. An estimate of the reduced insurance rates was computed from the average loss statistics based on the Florida Statute 627.0626, which requires reduction in insurance rates for wind resistant mitigation. Stronger houses also mean that the homeowner will not have to pay for hurricane losses up to his insurance deductible limit as often. This benefit was quantified through a deductible analysis of the AAL statistics. This analysis also has assumed that the increased costs associated with the FBC will be reflected in the final market price of the house – this value is referred to as the salvage value.
Table 4-4 shows an example of the net effect of these benefits and costs to the homeowner for the Aubuchon house at Location 16. Negative values mean that the cost to the homeowner has decreased under the FBC. For this case, it can be seen that the FBC enclosed design with impact rated coverings is the most beneficial design option with a net monthly credit of $36.62. The partially-enclosed case also shows a net benefit to the homeowner of $29.52. For the enclosed case with impact resistant glazing units (no shutters), the extra cost of the impact rated units means that the homeowner will pay more than the SBC design without impact rated units. Note however, that of the $138.50 per month increase, nearly $100 dollars is offset by the savings in insurance premiums, salvage value and deductible savings.
Note that the total monthly cost differential in Table 4-4 includes benefits that are perfectly valid for this benefit-cost comparison, but can be easily misinterpreted outside the context of this study. A value that is more representative of the effect on actual cash flows is the Net Out-of-Pocket Monthly Cost Differential in Table 4-4, which is composed of only the increase in the loan payment
36

Table 4-4: Example of Details of Financial Analysis from the Homeowner’s Perspective for 30 Year Holding Period – Aubuchon House at Location 16
FBC Enclosed SBC Impact
Glazing Impact
Covering
FBC Partially-Enclosed
Basic Data Increase in Cost of Construction ($) 0 +18,875 +4,287 +3,837 Estimated Reduction in Insurance Premium (annual) ($)1 0 - 462 - 462 - 390 Reduction in Owner portion of AAL (annual) ($) 0 - 103 - 103 - 85 Salvage Value after 30 yrs2 ($) 0 - 34,189 - 7,766 - 6,950 Equivalent Monthly Changes Change in Loan Payment (monthly) ($)3 0 + 138.50 + 31.46 + 28.16 Change in Insurance Premium (monthly) ($)2 0 - 48.00 - 48.00 - 40.53 Net Out-of-Pocket Monthly Cost Differential ($) 0 + 90.50 - 16.54 - 12.37 Other Equivalent Monthly Benefits Change in owners’ AAL portion 0 - 10.75 - 10.75 - 8.79 Monthly Equivalent of Salvage Value after 30 yrs2 0 - 41.08 - 9.33 - 8.35 Total Monthly Cost Differential ($)4 0 +38.66 - 36.62 - 29.52 1 Computed at 90% of AAL reduction net of 2% deductible. 2 Assuming that costs increase on average by 2% per year. All future benefits/costs are discounted using a rate of 5% and converted to a
monthly benefit/cost. 3 Principal and interest cost mortgage payments are based on a 8% interest rate on an ordinary 30 year loan. 4 Negative Monthly Cost Differential indicates a savings to Homeowner.
and the estimate of insurance reductions. For example, for the enclosed design with impact coverings, the net effect of the FBC changes on the homeowner cash flow is a savings of $16.54 per month. However the net effect considering the other benefits is $36.62.
In Figure 4-7 thru Figure 4-9, the Total Monthly Cost Differential to the homeowner is shown by study location for each of the study houses. The figures show that the enclosed with shutters option and the partially enclosed design options of the FBC produce negative values or small positive values both inside and outside the WBDR. The more expensive impact glazing design incurs an increase in monthly cost of anywhere from $20 to $60 dollars. Note that in the highest wind climate, Key West at Location 25, the benefits of protecting the windows are so large that they offset the cost of the more expensive impact resistant glazing.
Table 4-5 shows the results summarized by design scenario. From the homeowner’s perspective, Table 4-5 shows that the benefits of the loss reduction for the FBC enclosed design with impact coverings and partially-enclosed designs actually reduce monthly costs or produce break-even conditions. However, the additional cost of the impact glazing option in the WBDR cannot be fully offset by insurance savings or other benefits. Some homeowners may consider that the added cost is justified by the added convenience of the impact rated units.
The results indicate that although it does cost more to construct a building using the FBC enclosed design scenario, the increase in cost tends to be offset by the benefits. Also, there is not a large difference between the FBC partially-enclosed case and the FBC enclosed case. Damage and loss are always lower for the enclosed scenario and it makes sense for homeowner’s to encourage builders to build according to the FBC enclosed design case.
37

Aubuchon Masonry
-$150
-$100
-$50
$0
$50
$100
L-01
L-02
L-03
L-04
L-05
L-06
L-07
L-08
L-09
L-10
L-11
L-12
L-13
L-14
L-15
L-16
L-17
L-18
L-19
L-20
L-21
L-22
L-23
L-24
L-25
Location ID
Tota
l Mon
thly
Cos
t Diff
eren
tial (
$)
EnclosedEnclosed - Impact GlazingPart. Enclosed
Negative Values Indicate Savings to Homeowner
Figure 4-7: Total Monthly Cost Differenial for Homeowner at Study Locations for Aubuchon
Masonry Home (Locations 1-8 are Non-WBDR)
Mercedes Masonry
-$150
-$100
-$50
$0
$50
$100
L-01
L-02
L-03
L-04
L-05
L-06
L-07
L-08
L-09
L-10
L-11
L-12
L-13
L-14
L-15
L-16
L-17
L-18
L-19
L-20
L-21
L-22
L-23
L-24
L-25
Location ID
Tota
l Mon
thly
Cos
t Diff
eren
tial (
$)
EnclosedEnclosed- Impact GlazingPart. Enclosed Negative Values Indicate Savings to Homowner
Figure 4-8: Total Monthly Cost Differenial for Homeowner at Study Locations for Mercedes
Masonry Home (Locations 1-8 are Non-WBDR)
38

Mercedes Wood
-150
-100
-50
0
50
100
L-01
L-02
L-03
L-04
L-05
L-06
L-07
L-08
L-09
L-10
L-11
L-12
L-13
L-14
L-15
L-16
L-17
L-18
L-19
L-20
L-21
L-22
L-23
L-24
L-25
Location ID
Tota
l Mon
thly
Cos
t Diff
eren
tial (
$)
EnclosedEnclosed- Impact GlazingPart. Enclosed
Negative Values Indicate Savings to Homowner
Figure 4-9: Total Monthly Cost Differenial for Homeowner at Study Locations for Mercedes
Wood Home (Locations 1-8 are Non-WBDR)
Table 4-5: Summary of Net Change to Homeowner’s Monthly Cost1 Enclosed Without Impact Protection
Mercedes Masonry Mercedes Wood Aubuchon Masonry Average ($) - 1.27 - 1.51 - 10.25 Max ($) - 5.80 - 7.74 - 37.99 N
on- W
ind
Bor
ne D
ebri
s R
egio
n
Min ($) + 1.28 +1.32 +2.41 Partially – Enclosed Design
Mercedes Masonry Mercedes Wood Aubuchon Masonry Average ($) - 0.99 - 1.46 - 24.32 Max ($) - 19.57 - 19.68 - 80.53 Min ($) + 8.62 + 9.00 - 0.89
Enclosed Design using Impact Resistant Coverings Mercedes Masonry Mercedes Wood Aubuchon Masonry Average ($) - 3.39 - 3.44 -33.58 Max ($) - 34.77 - 34.52 - 121.70 Min ($) + 6.55 + 6.37 - 0.70
Enclosed Design using Impact Resistant Glazing Mercedes Masonry Mercedes Wood Aubuchon Masonry Average ($) + 20.62 +20.56 + 41.65 Max ($) - 10.90 - 10.65 - 47.54
Win
d B
orne
Deb
ris R
egio
n
Min ($) + 29.92 + 29.74 + 74.77 1 Negative value indicates decrease in monthly payment; positive indicates increase in payment.
39

4.6 Summary
In summary, the modeling of the three houses in this study has shown that the FBC designs are beneficial both to the individual homeowner as well as society as a whole. Comparisons of the enclosed designs (with impact protection) and the SBC show that this technique, although slightly more expensive than the partially-enclosed option, is the most effective at reducing the expected loss during a hurricane. By adopting the FBC, reductions in losses from hurricanes will decrease by about 50-55% relative to a house designed to the minimum standards of the SBC. Note however that many builders already build to a higher standard, such that they may already approach or exceed the requirements of the FBC. As such, it would be foolish to state that the FBC reduces losses by 50% uniformly. Reality lies somewhere between this value of 50% and 0%.
After further examination of the failure mechanisms, it was determined that much of the loss reduction can be attributed to the new requirements for roof covering in most of the state. Thus the 50% savings reported by the partially-enclosed case is largely attributed to the new roof covering, and not to the stronger structure. This study shows that it is more important to have the entire envelope protected, than to strengthen only parts of the structure. An enclosed building design with impact resistant coverings is the preferred design option.
40

5 REFERENCES AND SOURCES
5.1 References
1. The Florida Building Commission Code Comparison, www.floridabuilding.org, 2001.
2. Geotell and Horner, Inc., Benefit-Cost Analysis of Hazard Mitigation Projects, Vol. 4: Hurricane Wind, Federal Emergency Management Agency, Washington, DC, 1995.
3. ASCE 7-98, Minimum Design Loads for Buildings and Other Structures, American Society of Civil Engineers, New York, NY, 2000.
4. Standard Building Code 1997 Edition, Southern Building Code Congress International, Inc., Birmingham, AL, 1997.
5. Florida Building Code 2001, State of Florida, Tallahassee, FL, 2001.
6. Applied Research Associates, Inc., “Florida Commission on Hurricane Loss Projection Methodology,” Florida Hurricane Commission, Tallahassee, FL, February 2001.
7. RSMeans CostBooks 2000, RSMeans Company, Inc., Construction Publishers & Consultants, Kingston, MA, 1999.
8. “Natural Hazards Insights” Vol. No. 12, Institute for Business and Home Safety, Tampa, FL February 2000; available at www.ibhs.org
9. “Wood Frame Construction Manual for One and Two Family Dwellings, 1995 SBC High Wind Edition”, American Forest and Paper Association, 1996.
10. “Guide to Aluminum Construction in High-Wind Areas” Aluminum Association of Florida, September 2001.
41

5.2 Sources
ARA wishes to acknowledge and thank the following individuals and organizations for assisting on this project. Without the help and support of all parties, gathering this information would have been impossible.
Company Individual Al Hoffer’s Pest Protection, Coral Springs, Fl Al Hoffer Aluminum Association of South Florida, Boca Raton, FL David Miller Aubuchon Homes, Cape Coral, FL Darryl Aubuchon Beazer Homes, Ft. Myers, FL Christin Cupp Building Officials of Florida, Various members Cape Coral Lumbar, Cape Coral, Fl Walter Barlatta Carpenters Contractors of America, Ft. Myers, FL Leighton Gray Causeway Lumbar Company, Ft. Lauderdale, FL Mike Coleman Custom Built Screen Enclosures of Lee County, Cape Coral, FL David Hamel Dalton Brothers Homes, Santa Rosa, FL John Dalton Florida Department of Community Affairs, Tallahassee, FL Michael Ashworth, Mo Madani, Ann Stanton Florida Home Builders Association, Tallahassee, FL Jack Glen HNTB – Engineers, Tampa, FL Stan Darby, P.E. International Hurricane Protection Association, Miami, FL Frank Storms Marco Doors, West Palm Beach, FL Wade Wojtylko Mercedes Homes, Melbourne and Jacksonville, FL Kirk Malone, Mel Temmel PGT Industries, Nokomis, FL Don Olmstead Simpson Strong-Tie, McKinney, TX Randy Shackelford, P.E. Space Coast Truss Company, Cocoa, FL Steve Kastner, P.E., Sam Bordwine, Jr. Storm Smart System, Ft. Myers, FL Pat Cornelison
42