FLOODsite Project Report
239
FLOODsite is co-funded by the European Community Sixth Framework Programme for European Research and Technological Development (2002-2006) FLOODsite is an Integrated Project in the Global Change and Eco-systems Sub-Priority Start date March 2004, duration 5 Years Document Dissemination Level PU Public Vulnerability and flooding: a re-analysis of FHRC data COUNTRY REPORT ENGLAND AND WALES Report Number T11-07-11 Revision Number 1_3_P10 Co-ordinator: HR Wallingford, UK Project Contract No: GOCE-CT-2004-505420 Project website: www.FLOODsite.net Integrated Flood Risk Analysis and Management Methodologies Date June 2007 Task Leader Partner Name Annett Steinführer MU/FHRC
Transcript of FLOODsite Project Report

FLOODsite is co-funded by the European CommunitySixth Framework Programme for European Research and Technological
Development (2002-2006)FLOODsite is an Integrated Project in the Global Change and Eco-systems Sub-
PriorityStart date March 2004, duration 5 Years
Document Dissemination Level
PU Public
Vulnerability and flooding: a re-analysis of FHRC dataCOUNTRY REPORT ENGLAND AND WALES
Report Number T11-07-11Revision Number 1_3_P10
Co-ordinator: HR Wallingford, UKProject Contract No: GOCE-CT-2004-505420Project website: www.FLOODsite.net
Integrated Flood Risk Analysisand Management Methodologies
Date June 2007
Task Leader Partner NameAnnett Steinführer MU/FHRC

FLOODsite Project Report Contract No:GOCE-CT-2004-505420
DOCUMENT INFORMATION
Title Vulnerability and flooding: a re-analysis of FHRC dataLead Author Sylvia TunstallContributors Sue Tapsell, Amalia Fernandez-BilbaoDistribution Project TeamDocument Reference T11-07-11
DOCUMENT HISTORY
Date Revision Prepared by Organisation Approved by Notes20/11/06 1_0_P10 S.Tunstall
(Chapter 1.1-1.2 in collaboration with Annett Steinführer, Christian Kuhlicke, Bruna De Marchi, Anna Scolobig)
FHRC (p10) S.Tapsell
20/03/07 1_1_P10 S.Tunstall and S.Tapsell FHRC (p.10) S.Tapsell30/05/07 1_2_P10 S.Tapsell FHRC (p10) S.Tapsell29/06/07 1_3_P10 S.Tapsell FHRC (p10) S.Tapsell
ACKNOWLEDGEMENT
The work described in this publication was supported by the European Community’s Sixth Framework Programme through the grant to the budget of the Integrated Project FLOODsite, Contract GOCE-CT-2004-505420.
The authors would also like to thank the many participants who took part in the various surveys reported here and staff at the Environment Agency and Defra for their assistance.
DISCLAIMER
This document reflects only the authors’ views and not those of the European Community. This work may rely on data from sources external to the FLOODsite project Consortium. Members of the Consortium do not accept liability for loss or damage suffered by any third party as a result of errors or inaccuracies in such data. The information in this document is provided “as is” and no guarantee or warranty is given that the information is fit for any particular purpose. The user thereof uses the information at its sole risk and neither the European Community nor any member of the FLOODsite Consortium is liable for any use that may be made of the information.
© FLOODsite Consortium
document.doc 29/06/07I

FLOODsite Project Report Contract No:GOCE-CT-2004-505420
Summary
The focus of FHRC for this study has been on re-analysing, or further secondary analysis of, data from some of our earlier studies, rather than collecting new survey data. The three existing recent data sets collected between 2002 and 2005 which have been reanalysed to address the aims and objectives of this task, are the:
‘Intangibles’ data set of both flooded and ‘at risk’ samples ‘Warnings’ data set of flooded sample ‘Lower Thames‘ data set of flooded sample.
The first two UK data sets listed cover a range of locations (up to 30) and many different flood events in England and Wales. However, the third data set was focused on a particular location along the River Thames and a single key flood event. The data offered in the data sets are thus very different from the case study data of our German and Italian partners, as they were originally collected and analysed for other purposes. The major objectives of FLOODsite Task 11 that this research aimed to address were:
to characterise types of communities with regard to their preparedness, vulnerability and resilience related to flood events;
to understand the driving forces of human behaviour before, during, and after floods; to learn lessons from case studies in Germany, Italy and the U.K.
However, the FHRC studies focused on individuals and households rather than upon communities. Moreover, there is very little data on flood risk constructions across the three surveys. The main independent variables used in the analysis for this report are the most appropriate available from the earlier studies which address the aims of Task 11 with a view to providing some comparisons with the German and Italian data.
The population samples studied differed in terms of characteristics such as gender, age, social grade and income, tenure, flood experience and awareness, length of residence, and other demographic and social factors. They also differed in terms of the characteristics of the flood events and levels of impacts experienced. These differences were in turn seen to influence preparedness for living with flood risk and responding to flood events, and individual and household vulnerability and resilience related to flooding.
A number of driving forces of human behaviour were identified before, during and after flooding which were seen to affect people’s levels of preparedness, vulnerability and resilience related to flood events. For example, flood awareness and preparedness actions before and during flooding were seen to be affected by the extent and frequency of previous flood experience; river bank location, tenure arrangements and length of residence in the area; and the receipt of flood warnings. Taking out insurance was a common form of pre-flood preparedness measure taken by residents in the flood affected areas which was seen to be influenced by personal characteristics such as age, gender, tenure, social grade and income, illness and disability. Another common measure taken to prepare for flooding was to move valuables, personal property and cars to safety. Households containing children aged under 10 gave this measure specific priority.
Overall, the data help us to further understand the impacts of flooding and the factors influencing human behaviour before, during and after the flood events. They also allow lessons to be learned (albeit in the context of specific populations and locations) on how individuals and households may be able to increase their resilience to flood impacts and capacity to recover. The results will be of use to other people living in flood risk areas and to those agencies with a responsibility to respond to flooding in order to improve pre-flood preparedness and post-flood recovery.
document.doc 29/06/07II

FLOODsite Project Report Contract No:GOCE-CT-2004-505420
CONTENTS
Document Information IDocument History IAcknowledgement IDisclaimer ISummary IIContents III
1. Introduction 1
1.1 Objectives of Task 11 11.2 Theoretical approaches and main concepts 2
1.2.1 Social vulnerability 21.2.2 Social capital and social networks 41.2.3 Risk construction 6
2 Research Methods and Limitations 9
2.1 The ‘Intangibles’ data set 102.2 The ‘Warnings’ data set 102.3 The ‘Lower Thames’ data set 112.4 Qualitative research and pilot testing 112.5 Main survey methods 11
2.5.1 Selection of survey areas and samples 132.5.2 Questionnaires 142.5.3 Fieldwork 142.5.4 Data processing and checking 152.5.5 Analysis 15
2.6 Summary 15
3. Demographic and socio-economic structure of the population samples 18
3.1 Gender and age 193.2 Household types 193.3 Socio-economic stratification 20
3.3.1 Social grade classification 203.3.2 Household income 223.3.3 Tenure and length of residence 253.3.4 Area House prices 26
3.4 Prior health and long-term illness and disability 283.5 Summary 30
4. Flood events, experiences and perceptions 32
4.1 The flood events 324.1.1 Easter 1998 324.1.2 Autumn 2000 324.1.3 Thames 2003 33
4.2 Flood events and experience in the surveys 334.3 Depth and duration of the survey flood events 344.4 Flood risk constructions and awareness 35
4.4.1 Flood risk constructions 354.4.2 Flood awareness 354.4.3 Flood risk constructions: the Lower Thames Survey 37
document.doc 29/06/07III

FLOODsite Project Report Contract No:GOCE-CT-2004-505420
4.4.4 Flood warnings 394.4.5 Who receives a warning? 414.4.6 Reliance on authorities for warnings: Lower Thames Survey 44
4.5 Summary 45
5. Human behaviour before, during and after a flood 47
5.1 Drivers of human behaviour before, during and after a flood 475.2 Flood preparedness and preventative actions 48
5.2.1 Automatic Voice Messaging system (AVM) 485.2.2 Insurance 495.2.3 Preparedness measures taken before the event: Warnings Survey 525.2.4 Preparedness measures after the flood and for a future event:
Warnings Survey 565.2.5 Preparedness measures taken at some stage: Intangibles Survey 565.2.6 Preparedness measures taken at some stage: Lower Thames Survey 575.2.7 Actions taken at the time of a flood event: Warnings Survey 60
5.3 Social resources and help outside the home 625.3.1 Who gets help from outside the household? 645.3.2 Help and protective action 65
5.4 Evacuation and disruption 655.4.1 Introduction 655.4.2 Evacuation behaviour 675.4.3 Flood event characteristics as drivers of evacuation behaviour 685.4.4 Other flood characteristics 695.4.5 Social characteristics and material resources 70
5.5 Worry about future flooding 725.6 Summary 74
6. The impacts of flooding 78
6.1 Subjective severity of impacts 786.2 Resilience and vulnerability 80
6.2.1 Measures of vulnerability and resilience 836.2.2 Background to the General Health Questionnaire 836.2.3 Response to the vulnerability variables 856.2.4 Correlations between vulnerability variables 856.2.5 Stage at which the health and other impacts of flooding were worst 866.2.6 Comparison between Intangibles Survey data and 1998 Health
Survey for England: current GHQ12 results 886.2.7 Comparison between the ‘flooded’ and the ‘at risk’ samples
in the Intangibles Survey on Current GHQ12 88
6.3 Factors that may influence vulnerability and resilience 896.3.1 Social characteristics and health 906.3.2 Flood event characteristics 976.3.3 Flood warnings, rate of onset and duration of flood 996.3.4 Tenure and housing characteristics 996.3.5 Other factors in the aftermath of flooding 102
6.4 Multivariate Analysis 1106.4.1 Multi-variate analyse: flood characteristics and vulnerability 1106.4.2 Multi-variate analyse: social characteristics and vulnerability 1146.4.3 Post flood intervening factors 119
document.doc 29/06/07IV

FLOODsite Project Report Contract No:GOCE-CT-2004-505420
6.5 Summary and conclusion on vulnerability and resilience 122
7 Conclusions 1247.1 Social vulnerability and the drivers of human behaviour before,
during and after flooding 1247.2 The impacts of flooding and social vulnerability 1287.3 Key lessons and further research 129
References 131Appendix 1 Locations of Intangibles and Warnings Surveys 141Appendix 2 GHQ12 Questionnaires 146
TablesTable 2.1: Main survey methods used to collect the data sets 12Table 2.2: Main independent variables used in the analysis 17Table 3.1: Social structure and housing/residence characteristics of
the samples 18Table 3.2 Household size: Intangibles Survey and Warnings Survey 20Table 3.3: Social grade classification 21Table 3.4: Socio-economic status and housing/residence characteristics
of the samples 22Table 3.5: Percentage of respondents with a gross monthly household
income level for one person and multiple person households 23Table 3.6: Details of area house price rating: Intangibles Survey 28Table 3.7 Area house price rating and social grade: Intangibles Survey 28Table 3.8: Prior health by age group – Intangibles Survey 29Table 4.1: Experience of flooding 33Table 4.2: Maximum depth of flooding and duration of flooding
inside the home: Intangibles Survey and Warnings Survey 34Table 4.3: Awareness of flood risk: Intangibles, Warnings and Lower
Thames Surveys 35Table 4.4: Perception of likelihood of future flooding in next 5 years 37Table 4.5: Perception of likelihood of future flooding in next 50 years 38Table 4.6: Sources of information about flood risk: Lower Thames Survey 38Table 4.7: Flood warnings received 40Table 4.8: Receipt of a warning and warning lead time according to the
perceived speed of onset of flooding. Intangibles Survey 42Table 5.1: Proportion of respondents with insurance cover according
to gross monthly Household income: Warnings Survey 52Table 5.2: Awareness of flood risk and length of residence and number
of preparedness actions undertaken 55Table 5.3: “Have you undertaken any of these flood prevention
measures?” according to experience of flooding: Intangibles Survey 57Table 5.4: Actions taken by respondents to prepare for flooding and
to protect property: Warnings Survey 61Table 5.5: Help received from outside the households: Intangibles and
Warnings Survey 63Table 5.6: Actions taken to prepare for flooding and to protect
property according to help received: Warnings Survey 66Table 5.7: Evacuation and depth of flooding: Intangibles Survey 69Table 5.8: Type of rooms flooded and evacuation: Intangibles Survey 69Table 5.9: Evacuation by gross monthly household income 71Table 5.10: Worry about flooding by those flooded and not flooded: Lower
document.doc 29/06/07V

FLOODsite Project Report Contract No:GOCE-CT-2004-505420
Thames Survey 73Table 5.11: Worry about flooding by gender: Intangibles Survey 74Table 6.1: Subjective rating of the severity of the effects of flooding
on the household: Intangibles Survey 79Table 6.2: Correlations between the subjective severity scores: Intangibles
Survey 80Table 6.3: Correlations between current and worst GHQ12 scores and other 86Table 6.4: Mean scores on vulnerability variables according to the
reported worst stage: Intangibles Survey 87Table 6.5: Percentage with high scores on current GHQ12 and mean scores
on overall severity of the flood by prior health: Intangibles Survey 95Table 6.6: Mean scores on vulnerability variables by doctor consultations:
Intangibles Survey 97Table 6.7: Correlations between depth and number of rooms and
vulnerability variables: Intangibles Survey 97Table 6.8: Correlations between vulnerability variables and problems
with builders and insurers: Intangibles Survey 102Table 6.9: Correlations between vulnerability variables and worry:
Intangibles Survey 103Table 6.10: Insured and uninsured damages incurred: Intangibles Survey 104Table 6.11: Insured damaged incurred by the number of main rooms flooded:
Intangibles Survey 104Table 6.12: Insured damaged incurred by maximum depth of main rooms
flooding: Intangibles Survey 105Table 6.13: Correlations between uninsured costs (normalised and not) and
vulnerability variables 105Table 6.14: Correlations between number of days taken off work and
vulnerability variables: Intangibles Survey 106Table 6.15: Correlations between length of disruption and vulnerability
variables: Intangibles Survey 109Table 6.16: High GHQ12 scores and length of disruption 110Table 6.17: Variable from bi-variate analyses significantly associated
with vulnerability measures 111Table 6.18: Flood event characteristics and GHQ12 likert scores 113Table 6.19: Flood event characteristics and stress and overall severity 114Table 6.20: Social dwelling and flood event characteristics and GHQ12
likert scores 116Table 6.21: Social dwelling and flood event characteristics and stress
and overall severity 117Table 6.22: Post event factors social, dwelling and flood event
characteristics and GHQ12 likert scores 120Table 6.23: Post event factors social, dwelling and flood event
characteristics and the stress and overall severity 121Table 7.1: Social vulnerability to flooding and preparedness actions 125Table 7.2: Social vulnerability to flooding and coping actions during and after flooding 127
FiguresFigure 3.1: Living alone: Intangibles Survey and Warnings Survey 20Figure 3.2: Income by social grade: Intangibles Survey – flooded 24Figure 3.3: Income by social grade: Intangibles Survey - at risk 24Figure 3.4: Income by social grade: Warnings Survey 25Figure 3.5: Home ownership by social grade: Intangibles Survey
and Warnings Survey 27Figure 3.6: Respondents’ long term illness and disability by age 29Figure 4.1: Receipt of a flood warning by number of main rooms
document.doc 29/06/07VI

FLOODsite Project Report Contract No:GOCE-CT-2004-505420
flooded: Intangibles Survey 43Figure 4.2: Receipt of a flood warning by depth of main room flooding:
Intangibles Survey 43Figure 4.3: Receipt of a flood warning by social grade 44
Figure 5.1: Household insurance: Intangible and Warnings Surveys change caption to ‘New for old’ not ‘new and old’ 50
Figure 5.2: Buildings and structure insurance by social grade: Intangibles Survey and Warnings Survey 50
Figure 5.3: “New for old” contents insurance by social grade: Intangibles Survey and Warnings Survey 51
Figure 5.4: Other types of contents insurance by social grade: Intangibles Survey and Warnings Survey 51
Figure 5.5: Structural preparedness actions taken: Warnings Survey Phase 2 53
Figure 5.6: Damage reducing preparedness actions taken: Warnings Survey Phase 2 54
Figure 5.7: The number of preparedness actions taken before and after flooding: Warnings Survey Phase 2 55
Figure 5.8: Flood prevention measures undertaken: Lower Thames Survey 58
Figure 5.9: Behavioural preparations for flooding: Lower Thames Survey 59
Figure 5.10: Duration of evacuation: Intangibles Survey 68Figure 5.11: Worry about future flooding: Intangibles Survey 72Figure 5.12: Concerns about flooding: Intangibles Survey 73Figure 6.1: Model of factors affecting vulnerability and resilience
to flooding 82Figure 6.2: Percentage reporting stage at which the health impacts
were most severe: Intangibles Survey 86Figure 6.3: Percentage with high current GHQ12 scores among men
in the Intangibles Survey compared with the national average 88Figure 6.4: Percentage with high current GHQ12 scores among women
in the Intangibles Survey compared with the national average 89Figure 6.5: Percentage with high Current GHQ12 scores among
the flooded and at risk in the Intangibles Survey 89Figure 6.6: Mean scores for stress of the flood event and overall
severity of the flood by gender: Intangibles Survey 90Figure 6.7: Mean scores for the stress of the flood event by age:
Intangibles Survey 91Figure 6.8: Mean scores for overall severity of the flood by age:
Intangibles Survey 92Figure 6.9: Mean scores for the stress of the flood event by gender and age:
Intangibles Survey 92Figure 6.10: Mean scores for overall severity of the flood event by gender
and age: Intangibles Survey 93Figure 6.11: Mean scores for the stress of the flood event and overall
severity of the flood by social grade: Intangibles Survey 93Figure 6.12: Mean current and worst GHQ12 Likert scores by prior
health: Intangibles Survey 94Figure 6.13: Mean worst and current GHQ12 Likert scores by long
term illness or disability of respondents: Intangibles Survey 96Figure 6.14: Mean scores on the stress of the flood event and overall
severity of the flood by long term illness or disability of respondents 96Figure 6.15: Percentage with high current and worst time GHQ12
document.doc 29/06/07VII

FLOODsite Project Report Contract No:GOCE-CT-2004-505420
scores by maximum depth of main room flooding: Intangibles Survey 98Figure 6.16: Mean scores on the stress of the flood event and overall
severity of the flood by pollution of the floodwaters: Intangibles Survey 98Figure 6.17: Mean current and worst GHQ12 Likert scores
by pollution of the floodwaters: Intangibles Survey 99
Figure 6.18: Mean current and worst GHQ12 Likert scores by tenure: Intangibles Survey 100
Figure 6.19: Mean scores on the stress of the flood event and overall severity of the flood by tenure: Intangibles Survey 100
Figure 6.20: Mean current and worst GHQ12 Likert scores by whether or not respondents were living in vulnerable property: Intangibles Survey 101
Figure 6.21: Mean scores on the stress of the flood event and overall severity of the flood by whether or not respondents were living in vulnerable property: Intangibles Survey 101
Figure 6.22: Means scores on stress of the flood event and overall severity of the flood by help received from family outside the household: Intangibles Survey 107
Figure 6.23: Mean worst and current GHQ12Likert by help received from family outside the household: Intangibles Survey 107
Figure 6.24: Mean worst and current GHQ12Likert by evacuation: Intangibles Survey 108
Figure 6.25: Means scores on stress of the flood event and overall severity of the flood by evacuation: Intangibles Survey 108
document.doc 29/06/07VIII

FLOODsite Project Report Contract No:GOCE-CT-2004-505420
1. Introduction1.1 Objectives of Task 11
The purpose of the sociological research within the Integrated Project FLOODsite is to better understand the impact of floods on communities and the latter’s capability to respond during, and to recover from, such events. The concept “community” comprises two distinct meanings: it refers, firstly, to a locally based group of people (e.g. a village) and, secondly, to social networks of individuals belonging together because of specific interests and objectives as well as of ties based on kinship or positive emotions. Community-based approaches to flood mitigation aim to build the capacity of local people to respond quickly and effectively. Understanding how communities cope in flood events, how they respond, how they behave, etc. is valuable information to share with those yet to be impacted and with time to prepare, as well as with those agencies responding to flood events. Thus, the major objectives of FLOODsite Task 11 are (i) to characterise types of communities with regard to their preparedness, vulnerability and resilience related to flood events; (ii) to understand the driving forces of human behaviour before, during, and after floods, and (iii) to learn lessons from case studies in Germany, Italy and the U.K.
The outcome of these efforts will provide a better understanding of the role of subjective and intersubjective perceptions and situational interpretations, pre- and post-disaster preparedness as well as the capability and capacity of communities to recover from a hazardous event. Since FLOODsite is a project developed and dominated by natural scientists and engineers, it should be pointed out that our approach differs from mainstream flood research: We strongly focus on a bottom-up perspective, i.e. the residents of flood-prone and, in most cases, recently flood-affected areas. Their points of view in many respects differ from experts’ evaluations with regard to the way flood risk management should work on several scales.
The main Deliverable represents a major outcome of FLOODsite Task 11. It summarises the main findings of three Milestone reports and in-depth analyses at the regional level in the river catchments Vereinigte Mulde (Germany), Adige (Italy) and in England and Wales (U.K.):
• Part A: Country Report Germany (case study Mulde)• Part B: Country Report Italy (case study Adige)• Part C: Country Report U.K. (case study England and Wales)
This report represents the results of Part C, the UK case study. The structure of the Country Reports is as far as possible similar, although some research questions are focused on in more detail in certain sections, because they arose out of the specific context of the respective case study. All Country Reports have a common introduction setting out the theoretical background of the basic concepts (Chapter 1.2). After a description of the research locations and the methodological approach, main empirical findings are presented. It has to be taken into account that Parts A and B are based on primary empirical investigations within the framework of the FLOODsite project, while Part C mainly builds upon secondary analyses of data stemming from other research projects.
The Country Reports represent the first milestone of our analyses. The next step will focus on cross-national comparisons and lessons to be learned from the different experiences.
document.doc 29/06/071

FLOODsite Project Report Contract No:GOCE-CT-2004-505420
1.2 Theoretical approaches and main concepts In the following chapter, the most important concepts of our analyses will be explained and defined. These are (social) vulnerability, social capital (including social networks) and risk construction. All of them stem from rather distinct strands of the social sciences and are only exceptionally brought together in disaster research, especially in the classical sociological tradition (e.g. Quarantelli and Dynes 1977; Drabek 1986; Quarantelli 1987; Kreps 1989; Dynes and Tierney 1994; Quarantelli 1998; Tierney et al. 2001). However, we will lay down some good reasons for their interrelatedness. Further context-specific concepts will be introduced in the course of the single Country Reports (Parts A, B and C).
1.2.1 Social vulnerabilityVulnerability has been defined as the major topic of FLOODsite Subtheme 1.3. However, this is not the only reason why it deserves some conceptual consideration. More important is that within just a few years, “vulnerability” has become a buzzword applied in distinct contexts in order to describe and explain almost everything. Some years ago, Weichselgartner (2001, 88) presented 24 more or less different definitions of vulnerability. He categorised them into three approaches: vulnerability as exposure to risks or hazards, vulnerability as social response and vulnerability of places (ibid., 87; with reference to Cutter 1996).
“Official” FLOODsite terminology refers to the first conceptualisation. Vulnerability is defined as the “characteristic of a system that describes its potential to be harmed. This can be considered as a combination of susceptibility and value” (Language of Risk 2005, 27). With its focus on potential or actual damage due to a hazardous event, this describes a very common and widespread understanding of vulnerability from the point of view of natural scientists, engineers, disaster managers and economists (for the latter: Messner and Meyer 2006). From a social science perspective, namely, sociology, geography and political science, however, this framing of vulnerability has some severe shortcomings: First of all, it does not explicitly take into account people’s behaviour, their assumptions, their knowledge and non-knowledge or processes of sense-making. Secondly, the definition does not pay attention to the temporal dimensions of a disaster, its emergence out of and rootedness in daily routines, which in their own are related to the political context and conditioned by policy choices (Sarewitz et al. 2003).
In order to avoid (further) conceptual confusion in this multi-faceted debate, in the following we restrict our efforts to a concept of social vulnerability building mainly upon approaches from sociology and geography. This goes back to a central notion of the term—its emergence “as a concept for understanding what it is about the condition of people that enables a hazard to become a disaster” (Tapsell et al. 2005, 3). Also in the reports, our focus will be on the social dimension of vulnerability. However, we are fully aware that the impact of a flood depends not only on social aspects but also on event characteristics (such as flood depth, duration, contamination, speed of onset etc.), context-specific conditions (functioning of warning system and evacuation measures, dike-breaches, daytime, location) as well as certain parameters which might gain importance in the course of a flood (e.g. type of housing, having handicapped or permanently ill persons in the household etc.). Therefore, if necessary we will also pay attention to these “non-social” aspects of vulnerability.
Social vulnerability can be defined, in a first step, as the specific social inequality in the context of a disaster (be it technological or “natural”).1 This conceptualisation is surely in line with the origin of the discourse in empirical studies on disastrous famines (O’Keefe et al. 1976; Susman et al. 1983) and is fostered by today’s prevalent approach in research practice—which entails an operationalisation by means of indicators and indices in order to “measure” vulnerability (examples are given in: Blaikie et al. 1994, 9, 13, 132–4; King and Mac Gregor 2000; Buckle et al. 2000; Tapsell et al. 2002; Cutter et
1 This understanding is, of course, not obligatory. In the literature one also finds conceptualisations of “social vulnerability” recalling the idea of potential for loss (e.g. Weichselgartner 2001, 87; Cutter et al. 2003).
document.doc 29/06/072

FLOODsite Project Report Contract No:GOCE-CT-2004-505420
al. 2003, 246–9, 252; for an overview: Tapsell et al. 2005, 11–7). However, so-called “demographic” or “taxonomic” approaches ignore the situativeness of vulnerability (Wisner 2004, 184–8). The underlying hypothesis of such studies is the existence of a strong positive correlation between socio-economic status and vulnerability or, to put it with Blaikie et al. (1994, 9): “as a rule the poor suffer more from hazards than the rich”. It needs to be stressed that most “classical” vulnerability indicators (age, income, formal qualification, gender, race etc.) are basically indicators of social inequality in general and therefore of social vulnerability with respect to hazardous events in the life-course other than only those caused by “nature” 2.
Such an approach of strictly “measuring” vulnerability has both strengths and weaknesses (e.g. Adger et al. 2004; Kasperson and Kasperson 2001). Surely a central advantage relates to the implications for policy: It puts the issue of natural hazards and vulnerability on the public agenda or into the “heart of government thinking” (Benson 2004, 159). Additionally, indicators and indices are transferable to other contexts and allow for cross-regional or cross-national comparison. Moreover, they can be fed into complex, even interdisciplinary models in order to explain flood impact. Not surprisingly, the weaknesses are strongly related to the aforementioned points. When applying indicators and indices which were developed in one cultural context into another one, it is not only the question of whether the respective data are available but, much more important, whether seemingly identical variables measure “the same”.3 A good example in this context refers to tenure: While in some cultures renting a flat is considered as a sign of lower social status, in others (e.g. in Switzerland or in Germany) this causal relationship is not as strong as might be predicted—rental housing is widespread also among middle- and partly even upper classes. Hence, home-ownership does not mean the same in different cultural backgrounds. It is therefore necessary to develop a context-sensitive concept and respective indicators of social vulnerability—this is what we mean by the “situativeness” of vulnerability. Otherwise, researchers run the risk of stereotyped approaches (Handmer 2003, 57), in the end of which they rather approve their own prejudices instead of critically assessing the concepts applied and data analysed.
In our point of view, a worthwhile working definition was developed by Blaikie and his colleagues. By vulnerability they mean “the characteristics of a person or group in terms of their capacity to anticipate, cope with, resist, and recover from the impact of a natural hazard” (Blaikie et al. 1994, 9). This definition highlights both the social and temporal dimensions of a disaster. Instead of emphasising characteristics of the natural or technological hazard itself or the exposure (structures, buildings etc.) to the hazard, it focuses on the question of how communities and social groups are able to deal with the impact of a natural hazard. Hence, it is not so much the susceptibility of entire communities or certain groups to a specific hazard that is of interest but the coping capacity, hence active behaviour, in a very general sense (Green 2003).4 Moreover, this definition takes into account the long-term character of a disaster and the significance of human behaviour in the different phases of such an event.
Although this definition also has some shortcomings (as discussed in Part A, Chapter 5.1), we will apply it because of its genuine sociological character. But in order to make clear that we will not be interested in atomised individuals but rather in people who in mutual social relationships create intersubjective sense, trust, knowledge and interpretations, there is a further concept that deserves our attention: social capital.
2 Hence, this problem is by no means restricted to developing countries—a point that is stressed by Dixit (2003, 167).3 They will never do. Methodologists discuss this problem under the keyword of “interpretative equivalence” which is regarded as a key methodological criterion of cross-national comparison (Steinführer 2005, 97).4 In parts of the literature, this emphasis on capacity instead of susceptibility is rather linked to the concept of resilience (Adger 2000; Handmer 2003, 56, with reference to the UN International Strategy for Disaster Reduction; Tapsell et al. 2005, 4). Therefore, resilience and vulnerability are often discussed in a mutual (conceptual) relationship (Buckle et al. 2001; Gallopín 2006).
document.doc 29/06/073

FLOODsite Project Report Contract No:GOCE-CT-2004-505420
1.2.2 Social capital and social networksJust like vulnerability, social capital is a term currently widely used and discussed (but only recently also in hazard research: Dynes 2002; Nakagawa and Shaw 2004; Kirschenbaum 2004; Bohle 2005; Pelling and High 2006). What is more, the concept “has become one of the most popular exports from sociological theory into everyday language”, despite the fact that it “does not embody any idea really new to sociologists” (Portes 1998, 2).
Although only rarely reflected upon, the concept of social capital stems from at least two distinct strands of thought: sociology of social inequality and political sociology. The first conceptualisation goes back to Bourdieu (1986; similarly Coleman 1990, 302) who conceived social capital as “resource of individuals”. The second and much more influential perspective, which emphasises the role of social capital as collective asset, is mainly connected to Putnam’s idea of (not) “bowling alone” (Putnam 1993 and 2000).5 Bourdieu (1986, 248) defines social capital as the “aggregate of the actual or potential resources which are linked to possession of a durable network of more or less institutionalised relationships of mutual acquaintance and recognition”. These resources are based on the affiliation to one or several social groups. It is both the quality and quantity of these social relationships and the resources (further social, but also economic and cultural capital) which can be mobilised via this network which makes up the social capital of an individual. This is an important difference to Putnam who conceptualises social capital as a collective good of a community indicating its respective level of “civicness” (for a critical appraisal: Portes 1998, 18–20).
Despite all the differences, in both conceptualisations social networks play a crucial part. Social networks form an important nexus between the individual and social structures. Therefore, network analysis is interested in the “in-between”, i.e. in the structure, quantity and quality of social relations as units of analysis (Burt and Minor 1983; Schenk 1983; Pfenning 1996). In the context of floods and other hazardous events, one might assume that social networks function as resources for information, material compensation, emotional support and physical help and are something exclusively “positive”. However, network theorists provide ambiguous hypotheses concerning the actual role of social networks in different situations. There is, first of all, the “strength-of-weak-ties” hypothesis (Granovetter 1973, 1983) which holds that heterogeneous social networks—resting in various social and local contexts—have more and in particular more diverse information about a certain topic (in its original application referring to labour markets and getting a job) than a dense network consisting of persons who are similar in various socio-economic and socio-demographic dimensions. With respect to coping with floods and their consequences, a variety of information channels (hence: networks of weak ties) might help an endangered person to assess a hazardous situation more appropriately than a network built upon strong ties. Then, also the coping behaviour might be more adequate.
But, secondly, there is also evidence for the “strength of strong ties” meaning that dense networks of people in a similar situation are exploited as a resource. Frequently interacting (i.e. densely connected) persons are more likely to share similar information, attitudes and beliefs (with a similar approach: contagion theory; Scherer and Cho 2003). The most prominent examples in this respect are networks of innovation (Burt 1987) or—from the realm of urban sociology—the emergence of ethnically segregated neighbourhoods in big cities and of ethnic entrepreneurship which built upon the strong ties of kinship and cultural-linguistic similarity, respectively (Portes 1998, 12–3). When transferred to floods, on the one hand such networks might be obstructive in the immediate pre-phase of an extreme event since they could hinder the reception of diverse and possibly even ambiguous information.6 But, on the other hand, they are able to create an immediate flow of resources in the entire period of a disaster (information, physical and emotional support, economic capital etc.).
5 Since there are different asset-holders (individual or collective actors) involved, Bohle (2005, 66–8) distinguishes an individualist (works in the tradition of Bourdieu and Coleman) from a collectivist perspective (studies following Putnam; similarly Portes 1998).6 With respect to the anticipation phase, there is also some empirical evidence for shared risk perceptions among densely knit persons (Scherer and Cho 2003, 265–6).
document.doc 29/06/074

FLOODsite Project Report Contract No:GOCE-CT-2004-505420
Without denying older traditions in disaster research which strongly focused on communities (Barton 1969; Erikson 1976; Couch and Kroll-Smith 1991; Mitchell 1996), there are some good reasons for dealing with social networks (and social capital) instead of focussing on communities in their ambiguous meaning of being both locally based and socially constructed. Kirschenbaum (2004, 96) points out that traditional community-based approaches usually defined their object of research by taking physical and geographical borders as a matter of fact instead of referring to subjectively defined borders and cross-local networks.7 But regardless of whether communities, social capital or social networks are in the focus, it is apparent that most disaster research is interested in the recovery phase and the effects the disastrous event has on social cohesion and community relations (Beggs et al. 1996; Sweet 1998; Nakagawa and Shaw 2004). Only a few authors deal with the role of social networks and social capital in earlier stages (Barton 1969; Hurlbert et al. 2000; Kirschenbaum 2004).In this report, social capital will be used in a non-romantic manner (which is one of the criticisms related to Putnam). Thereby, we will follow principal conceptual ideas of both Bourdieu and Putnam, hence taking into account social capital as an individual resource (i.e. related to the various social networks a person creates and belongs to and the economic, social and cultural resources they provide) as well as a collective asset (i.e. a community resource for which trust and shared norms are basic requirements).
At this point we also want to introduce our notion of local knowledge. Usually, in the discourse on natural disasters it is agreed upon that this form of knowledge is a valuable resource for mitigating the impact of a hazard, since the local population developed specific strategies over time for coping with crises (Blaikie et al. 1994, 64–9). We will incorporate this dimension into our analysis, by focusing on the constitution of this form of knowledge in the interaction with the physical as well as the social environment. In this respect, local knowledge is a form of knowledge, which was developed and tested in the local environment and which is therefore held as highly reliable and accepted. However, the operationalisation of “local knowledge” by means of a standardised questionnaire is hardly possible in a meaningful manner. Therefore we approach this dimension via social networks and their spatial arrangements suggesting that exclusively or predominantly locally based networks continuously create and recreate local knowledge.
Social networks as defined above predominantly refer to informal ties people have to friends, neighbours and kin. However, in the context of a disaster threatened residents usually have to deal also with representatives of organisations, such as fire brigades, municipal authorities, the Red Cross, the police, the army etc. Therefore, when analysing trust (e.g. as regards information announcing a disastrous flood about to come) and the like, also the distinction between formal and informal networks according to Matthiesen (2005; with a slightly different terminology) makes sense. Formal (Matthiesen: “hard”) networks are “strategic cooperation structures within formal-institutional structures and systemic functions, with clearly defined strategic goals, explicit benchmarking processes (milestones) and […] with a defined end (death of network)” (ibid., 10). In the following, all those governmental and non-governmental organisations are subsumed that are part of official disaster protection efforts. The network has a clearly defined beginning (in Germany for example Warning stage 1), a clearly defined end (termination of the disaster declaration) and encompasses such different institutions as the regional government, the municipality, the police, the army, in Germany the THW (Technisches Hilfswerk; Federal Agency for Technical Relief), as well as non-governmental organisations such as the local fire brigades and various aid agencies (Streitz and Dombrowsky 2003). Informal (Matthiesen: “soft”) networks consist of family-members, friends, neighbours and colleagues. They are defined, above all, by “intensified communication processes and shared tacit/explicit components of knowledge” (Matthiesen 2005, 9). Hence these networks are more or less identical with the social capital as defined above.
7 This is, by the way, one of the key criticisms with regard to community studies as a whole (for a general evaluation: Stacey 1969).
document.doc 29/06/075

FLOODsite Project Report Contract No:GOCE-CT-2004-505420
1.2.3 Risk constructionAlthough in Task 11 the concept of “risk perception” is prominently positioned (namely in its title), in the course of the work we became more and more convinced that it has some conceptual shortcomings. Although the term is quite well established in the scientific community, we decided to replace it with risk constructions. There are many reasons for doing so, four of which we want to point out in the following discussion.
Firstly, risk perception implies a simple cause-and-effect model in the sense that an individual perceives physical stimuli and reacts upon them. However, as the “traditional” literature on risk perception was able to show in the course of its intellectual development, the issue under investigation is far more complex: “To speak of ‘perceived risk’ in the same manner we speak of ‘perceived length’ makes no sense“ (Brehmer 1994, 83), since a mental construct (e.g. “probability * consequence”) cannot be perceived.
The second argument relates to the historical development of the discourses on risk perception and vulnerability. The discourse on risk perception was mostly advanced in psychology by the so-called Oregon Group around Fischhoff, Lichtenstein and Slovic (Psychometric Paradigm). Its intention from the very beginning was, firstly, to show that risk is above all a “subjective” construct (and not an “objective” one), secondly, to point out that so-called lay-people have a different risk perception than experts, and, thirdly, to analyse the cognitive structure of risk judgements by employing multivariate statistical analyses such as factor analysis, multiple regression etc. (Slovic et al. 1974; Fischhoff et al. 1979; Slovic 1987 and 1992). Another “school”, which may be called rather sociological and/or cultural in its orientation to risks, emphasized the intersubjective modi of constructing risk. Risk perception in this perspective is defined by norms, value systems and cultural idiosyncrasies of groups and societies. A simple juxtaposition of individual/subjective and scientific/objective risk perceptions is no longer possible thereby, since every group, thus also scientists, are biased by certain assumptions, norms, values and beliefs (Douglas and Wildawsky 1982; Johnson and Covello 1987; Hoekstra 1998).
In 1992, the volume “Social Theories of Risk” (Krimsky and Golding 1992) appeared as a collection of essays by sociologists and other social scientists who, in the following years, contributed, together with a growing cluster of colleagues, to enlarge the debate with natural scientists, also increasing the visibility and “legitimacy” of social studies of science and technology (among many others, Nowotny et al. 2001; Jasanoff 2006; Renn 2007). Also, attention grew on issues of complexity and indeterminacy (e.g., Lash et al. 1996; Wynne 1992), with relevant contributions from ecology and ecological economics (Kay 2001; Gunderson et al. 1995; Gregory 2002; Gregory and Wellman 2001). A key point of attention became the distinction between risk and uncertainty (Funtowicz and Ravetz 1993), the former being quantifiable through the application of standard assessment techniques, the latter being characteristics of contemporary scientific problems and requiring new instruments of analysis as well as novel management approaches (De Marchi 1995; De Marchi and Ravetz 1999). When Ulrich Beck’s book was published in English (Beck 1992; first in German in 1986) the time was ripe for a debate with many voices, contrary to a decade earlier, when Short’s appeal in his presidential address to the American Sociological Association (Short 1984), remained largely unheard.
Particularly the Psychometric Paradigm was also prominent in research on natural hazards (Slovic et al. 1974; White 1974) and uncovered some valuable empirical findings, such as the central paradox of technical flood protection measures: while expenditure on flood control was rapidly increasing after the 1927 Mississippi flood, the monetary flood damages were also rising (White 1973; Barry 1997). However, the underlying assumption is quite simplistic as Watts states: The research paradigm is based on an “assumption of individual purposeful rationality expressed through a tripartite cybernetic structure: (a) hazard perception, (b) recognition of alternative-adjustments, (c) choice of response” (Watts 1983, 240). As a result, individuals are understood as rationalistic atoms, defined by imperfect knowledge and acting in a societal space that is without structure and institutions. Watts concludes that maladaptation in this context is simply a function of insufficient knowledge, distorted perception and inflexible decision-making (ibid., 241).
document.doc 29/06/076

FLOODsite Project Report Contract No:GOCE-CT-2004-505420
Therefore we think it is of importance to keep in mind both the development of the field on risk perception as well as the “radical constructivist” moment of the conceptualization of risk perception inherent in Cultural Theory when one relates it to the concept of vulnerability, since most vulnerability researchers are not interested in this debate. There is even a strong opposition to questions of interpretation and perception, since particularly vulnerable people of a society are simply not in a position to take the necessary steps to mitigate or prevent the occurrence of a disaster (Oliver-Smith 2002). The concept of vulnerability is based on a realist assumption to the effect that the causes eventually resulting in a disaster are socially produced; the event itself, however, is not constructed; it is rather understood as “real”. The debate about vulnerability is predominantly interested in social, economic and political structures and processes, since these “hard” factors are seen as the driving forces defining the vulnerability of certain groups; questions of perception and interpretation, particularly when conceptualized in a narrow sense as mostly done in hazard research, are seen as subordinate.
However, in recent years there has also developed a counter-discourse to the rigid understanding of vulnerability. Critics point to the problematic assumption of the “vulnerability view”, since it assumes people who are held as vulnerable are weak, passive and, in a certain sense, deviant (Hewitt 1997; Boyce 2000; Bankoff 2001). Therefore some scholars underline the importance of incorporating the perception of people, their capacities and interpretation of their own situation in empirical studies. The reasons these scholars do so are, however, not analytical; they are above all normative, since they try to empower people (Delica-Willison and Willison 2004) in order to find a way of how to integrate both societal structures and individual actors within one theoretical framework. Nevertheless, it seems important to point towards the difficulty of overcoming the duality of a constructivist and realist view on risks and disasters. In the wider sociological debate Anthony Giddens’ theory of structuration is surely such an attempt to reconceptualise the dichotomy of agency/structure and objectivity/subjectivity (Giddens 1986); however, the empirical applicability of this theory is an exercise exceeding the intentions of the work in FLOODsite Task 11.
This relates to the third argument: The term “risk construction” chosen in the title of this section highlights our understanding of risk. Risk is neither objectively given nor predetermined by social structures such as income, age, class etc., nor is it simply a matter of individual cognitive operations. Risk is socially constructed in the sense that norms and values as well as belief systems influence and possibly define it. Thus in this context, we want to depart from most conceptualizations of vulnerability which agree that vulnerable conditions are produced by social structures but which, however, would reject that the concepts risks and disasters themselves are socially constructed. Nevertheless, in our opinion the modi of construction have to be taken into account. We therefore draw upon the work of Berger and Luckmann (1967). In their ground-breaking work on the “Social Construction of Reality” the authors lay down a theory, which allows for incorporation of, on the one hand, the inter-subjectively constituted life-world of people and, on the other hand, the objectified reality of everyday life (ibid.). The authors emphasize that the construction of reality proceeds by no means arbitrarily, since over time social actors develop typifications of each other as well as of each other’s actions, and these typifications eventually become habitualised into reciprocal roles. Reality is finally objectified when these roles and typifications are made available to other members of the society, which means they are institutionalised. These institutions appear as objectively given, since they transcend the individual and particular concept for action (Handlungsentwurf), although they are embedded and reproduced by individual actions, since the process of institutionalization is executed in interactions among human actors.
Institutions are evolving when different actors are confronted with a recurring problem, which is solved more or less routinely (e.g. floods). They are typical solutions for recurring (and accordingly typified) societal problems of action. Therefore institutions are relevant for a sociological analysis; they point towards what is considered as important in a society, they uncover in a more general sense the respective societal system of relevance. The development of insurances during the 13 th century and their stepwise spreading in the sphere of maritime trade during the 14 th and 15th centuries is such an
document.doc 29/06/077
FLOODsite Project Report Contract No:GOCE-CT-2004-505420
example (Ewald 1989; Bonß 1995), pointing to the coverage of certain requirements of safeness and security.
At this point, we want to introduce the final argument for talking about risk constructions: FLOODsite Task 11 ultimately aims at a cross-cultural analysis. Usually, such investigations are either pursued in the tradition of the Psychometric Paradigm or in line with Cultural Theory (Horlick-Jones et al. 1998; Caulkins 1999; Renn and Rohrmann 2000; Rohrmann 2000; Sjöberg et al. 2000; Marincioni 2001). However, understanding the construction of risk in the outlined manner allows us to take into account rather subjective definitions of risk but also to focus on the institutionalised construction or risk. This seems to us to be a fruitful design, allowing an approach towards cross-cultural comparison, which does not rest on the level of superficial results and which does not overemphasise rigid interpretations of social structures, but rather takes dissimilar institutionalisations of risk in different societal contexts into account.
document.doc 29/06/078

FLOODsite Project Report Contract No:GOCE-CT-2004-505420
2 Research Methods and Limitations
As mentioned in Section 1.1, the focus of FHRC has been on re-analysing, or further secondary analysis of, data from some of our earlier studies rather than collecting new survey data. The data offered in the data sets are very different from the case study data focused on particular localities and particular flood events available to our German and Italian partners. The FHRC data were originally collected and analysed for other purposes, based on particular theoretical frameworks, and have been reported elsewhere (RPA/FHRC, 2004; Tunstall et al., 2006; Tunstall et al., 2005; McCarthy et al., 2006). This therefore allows some limited comparison with data from the German and Italian case studies.
The data sets provide quantitative survey data derived from structured questionnaires and are thus different from the data collected by our German and Italian partners which includes substantial qualitative elements derived from qualitative interviewing, focus groups and observation. However, the FHRC survey studies did involve some initial qualitative focus group and in depth interview research and this report will also draw on the insights that this qualitative research provided where appropriate. The report will also make reference to our qualitative studies of the social and health impacts of flooding (Tapsell et al., 1999; Tapsell and Tunstall, 2001, Tapsell et al., 2003).
Three existing recent data sets collected between 2002 and 2005 have been reanalysed to address the aims and objectives of this task, they are the:
‘Intangibles’ data set ‘Warnings’ data set ‘Lower Thames‘ data set
The first two UK data sets listed cover a range of locations (up to 30) and many different flood events in England and Wales. However, the third data set was focused on a particular location along the River Thames and a single key flood event. These data sets have been further analysed to augment our understanding of flood event experiences, preparedness and response to elaborate our understanding of the social and health impacts of flooding in the UK. The report uses as a basis for analysis the suggested Set of Indicators produced for Task 11 in 2005. However the previous studies do not necessarily cover the full range of indicators outlined in the 2005 report.
Initially, the data set from an earlier series of surveys - the ‘Full Flood Impacts’ study - was to be included. However, on further examination of the data it was decided that little more analysis could be achieved on this data, therefore a decision was taken to include data from a different study which had focused on flood warnings. This offered much more recent data, some of which had not been fully analysed.
Familiarity with the data and the methods used to collect it, often a difficult issue in secondary analysis of survey data, is not a problem in this case as all the data were collected for, and originally analysed by, FHRC. The data, too, are relatively recent so that we would not expect change over time to be an issue for the reanalysis. However, the availability of variables to adequately measure the concepts of interest to the FLOODsite Task (such as vulnerability and resilience), is a problem. The focus of all the surveys, moreover, was upon the household and the individual rather than upon the community. These studies are very weak or lacking in variables that measure community characteristics that are of interest to FLOODsite researchers in Task 11. However, the data sets are relatively large and rich in variables and the FLOODsite work provides a valuable opportunity to consider issues and relationships that were not considered at the time of the original analysis. The three data sets are outlined below.
document.doc 29/06/079

FLOODsite Project Report Contract No:GOCE-CT-2004-505420
2.1 The ‘Intangibles’ data set
This was collected throughout England and Wales as part of a project funded by the UK Government Department for the Environment, Food and Rural Affairs (Defra) that aimed ‘to develop a robust yet simple-to-use, methodology so that the intangible impacts on human health and well being can be accounted for in assessing the benefits of flood alleviation measures’. The methodology was intended to be applicable to all levels of appraisal from policy and programme evaluation to individual flood defence schemes (RPA, FHRC, 2004:1). Specific requirements were to obtain greater understanding of the social issues that underlie the long-term health risks of flooding, and to develop an easy to use methodology that could be used in economic appraisal to generate robust and defensible valuations for human-related intangible impacts of flooding, based on the improved understanding of the relevant social issues (RPA, FHRC, 2004). The focus of the analysis and reporting of the data was on the long and short term health impacts of flooding, and the economic values that may be attached to avoiding health and stress effects (RPA/FHRC, 2004).
The Intangibles survey involved two questionnaires with many common questions. The main questions for the ‘flooded’ sample can be summarised as:
questions about the property, members of the household, nature of the flood event and associated damages;
perceptions of flooding, flood prevention measures and support received. questions about social and health impacts; self-completion health questionnaires; willingness to pay to avoid the stress of flooding questions; and standard socio-economic questions.
For the ‘at risk’ sample the questions focused on:
questions about the property, members of the household and awareness of flooding; perceptions of flood risk and flood prevention measures; questions about health; self-completion health questionnaires; willingness to pay to avoid the stress of flooding questions; and standard socio-economic questions.
2.2 The ‘Warnings’ data set
This survey in different locations in England and Wales was undertaken as part of research funded by the UK Environment Agency (EA) and Defra. The objective of the survey research was ‘to examine and further develop as necessary, the model of the economic benefits of flood warnings set out by Flood Hazard Research Centre researchers and to produce a new data set to be used to calibrate the model. The analysis of this data was concerned with the factors that may explain the level of property damage reduction that can be achieved through timely flood warnings (Tunstall et al., 2005:1).
The Warnings Survey employed a single questionnaire with the following main question topics:
questions about the property, members of the household, nature of the flood event and associated damages including detailed questions on items of property damaged or saved;
questions about flood warnings; questions about actions taken in response to flooding; and standard socio-economic questions.
document.doc 29/06/0710

FLOODsite Project Report Contract No:GOCE-CT-2004-505420
2.3 The ‘Lower Thames’ data set
This survey was mounted as part of the Lower Thames Strategy Study Phase 3 funded by the Environment Agency which is examining options for flood risk management in the Lower Thames Catchment area. The survey focused principally upon flood risk perception and the acceptability of community based flood risk reduction, in particular through the installation of local flood barriers and devices (McCarthy et al., 2006). The Lower Thames Survey questionnaire covered the following main topics:
awareness and perceptions of flooding and flood risk; preventative measures taken; response to community based risk reduction options; and standard socio-economic questions.
2.4 Qualitative research and pilot testing
Both the Intangibles and the Warnings Surveys were preceded by a qualitative research stage involving focus group discussions. This qualitative and developmental stage was extensive in the case of the Intangibles survey because measuring the health and stress impacts of flooding had not been attempted before. A total of five health focus groups to develop and test questions and health measures for the survey were held in five different areas with a total of 34 mainly flooded participants. Following on from this, six focus groups were conducted in three areas; in each area one group of flooded and one group of those at risk was involved. This second phase of focus groups aimed to develop and test questions to elicit willingness to pay (WTP) to avoid the stress and health effects of flooding; a total of 35 participants took part. Pilot testing of the questionnaires was undertaken in three stages:
1. Separate pilot surveys of a health questionnaire (72 respondents) and WTP questionnaires (48 flooded, 42 at risk respondents).
2. 11 face to face interviews by researchers using a questionnaire combining the health and WTP questions.
3. Pilot survey testing the combined questionnaire with 37 flooded and 16 at risk respondents. Following the first two stages of the pilot testing it was decided that it would be feasible to combine the health and WTP questionnaires into a single instrument without the interview becoming too lengthy and a combined version of the questionnaire was therefore tested in the third stage of the pilot testing.
The Warnings Survey questions were derived from instruments that had been tested and used in previous research on flood warnings and response by FHRC and the British Market Research Bureau (BMRB) in Post Event Surveys for the Environment Agency. Therefore, pre-testing of the survey instrument was more limited and was mainly confined to testing the ability of focus group participants to recall (using a checklist) the items of property moved and thus saved from flooding and items damaged. Five focus group discussions to refine and test the survey materials were held in five different areas with a total of 29 flooded residents.
In the Lower Thames Study, one focus group discussion was conducted with a special community of residents living on an island in the River Thames.
2.5 Main survey methods
The survey methods used to collect the data sets are summarised in Table 2.1. This shows that the studies on which this report is based had many features in common.
document.doc 29/06/0711

FLOODsite Project Report Contract No:GOCE-CT-2004-505420
Table 2.1: Main survey methods used to collect the data sets
Survey methods used to collect the data sets
Method Intangibles Warnings Lower ThamesFlooded At risk
Date of main survey fieldwork
September 2002-January 2003
September 2002-January 2003
Phase 1.October – December 2004Phase 2January – February 2005
October – November 2005
Areas for sampling
30 specific locations in England and Wales
The same 30 locations in England and Wales
11 Environment Agency areas and a large number of specific locations in England and Wales
13 locations in the Lower Thames – from Walton Bridge to Teddington
Population Residents - all of whom had experienced above floor flooding in flood events between April 1998 and December 2001
Residents aged 18 and over
Residents within the 1 in 100 flood risk area who had not experienced flooding above floor flooding since April 1998
Residents aged 18 and over
Phase 1 included some residents in flood risk areas that had not experienced property flooding in events in 2003 and 2004.Phase 2 included only residents who had experienced property flooding since September 2000
Residents aged 18 and over
Residents in the 1 in 50 flood risk area in Lower Thames locations where community based flood risk reduction was feasible.
Residents aged 18 and over
Sampling Non-probabilityArea quotas set
Non-probabilityArea quotas set
Phase 1: a censusPhase 2: Non-probabilityArea quotas set
Non-probabilityArea quotas set
Number of personal interviews
983 527 408 in total - 130 in Phase 1278 in Phase 2
206
Interview method
Personal interview Personal interview Phase 1 computer assisted personal interviewPhase 2 personal interview
Personal interview
Mean length of interview
48 minutes 23 minutes Phase 1 45 minutesPhase 2 35 minutes
Approx. 20 minutes
Questionnaire Structured with a few open questions
Structured with a few open questions
Structured with a few open questions
Structured with a few open questions
Interviews conducted by:
Professional market research interviewers
Professional market research interviewers
Professional market research interviewers
Professional market research interviewers
Focus groups conducted by:
FHRC FHRC FHRC FHRC
Data entry and checking by:
Market research company
Market research company
Market research company
Market research company
Data checking/ analysis by:
FHRC using SPSS FHRC using SPSS FHRC using SPSS FHRC using SPSS
document.doc 29/06/0712

FLOODsite Project Report Contract No:GOCE-CT-2004-505420
2.5.1 Selection of survey areas and samplesAll the studies were undertaken with populations in flood risk areas where flooding had occurred in recent years. The locations were spread across seven of the eight Environment Agency Regions and drew upon different populations in those areas. The 30 interview locations used in the Intangibles Survey and the target number of interviews set and achieved at each location are shown in Appendix 1. At the time the studies were undertaken, the Environment Agency did not hold accurate or up to date records of properties where flooding had taken place in the different areas. The Agency did have a list of ‘at risk’ properties, both residential and non-residential, used for flood warning purposes. However, this information provided only a very approximate guide to the addresses where flooding had taken place. Thus, none of the studies was based on a probability or random sample because of this lack of information on flooded properties to serve as sampling frames, and the process of fully screening populations to develop such sampling frames was too expensive and time consuming to be employed.
In the Intangibles Survey, reports on the Easter 1998 and autumn 2000 floods, were used to draw up an initial list of locations where a substantial number of properties were believed to have been affected by flooding. Much flooding in England and Wales occurs in small pockets and to scattered properties but in order to facilitate the organisation of fieldwork, areas where at least 20 properties were thought to have been flooded were selected. Since the Agency’s at risk data base offered only approximate information on where flooding had occurred, 24 of the 30 locations included in the Intangibles Survey were partially pre-screened through site visits to identify more accurately the scale and extent of flooding in the area. Detailed information had already been obtained for the remaining six sites. On the basis of the site visit data lists of potential addresses for the survey were drawn up.
The Intangibles Survey involved two separate samples. First, it required a large sample of residents who had experienced flood events inside their homes since April 1998. Then, for comparison, a second sample was required of people who lived in the same areas and were also at risk but had not been flooded inside their homes in the recent flood event, although their gardens and driveways might have been affected. These samples were needed in order to investigate whether actually being flooded inside the home led to long-term psychological effects, and if these were therefore not experienced by those who were not seriously affected by the flooding.
The Warnings study was carried out in two phases in order to take advantage of a Post Event Survey being undertaken for the Environment Agency involving the main areas where flooding had most recently occurred (in 2003-4). In the two phases of the Warnings Survey, interviews were conducted in all eight Environment Agency Regions in England and Wales and in a very large number of different locations (Appendix 1). For the first phase of the survey the Environment Agency provided a sample list of addresses and the survey aimed to interview all those listed as affected by the most recent event: as such it was a census rather than a sample survey. The addresses in the areas selected were pre-screened to establish their eligibility. Of 283 addresses provided, 215 were found to be eligible for inclusion in the survey and 168 interviews were achieved, a response rate of 78%. Phase One of the Warnings Survey covered households that had experienced flooding inside the home but also those who only had other parts of their property (including gardens and drives) flooded and even some properties that were not affected by the flooding in any way.
As both this Phase One of the Warnings Survey and the Intangibles Survey had covered the areas where substantial numbers of properties had been flooded recently, the Second Phase of the Warnings Survey had to draw on a large number of areas where only a small number of properties had been affected. All 26 Environment Agency areas were approached by the researchers and asked for property details and maps of locations affected by flooding since September 2000. Eleven areas provided information on recent property flooding in over 40 different locations. This information was used by interviewers to identify properties affected by flooding. In Phase Two of the Warnings Survey, because the focus of the survey was on damage reduction, interviewers were asked to obtain 80% of their interviews at residential properties that were flooded inside the dwelling. The remaining
document.doc 29/06/0713

FLOODsite Project Report Contract No:GOCE-CT-2004-505420
20% were to have experienced flooding to ‘built property’ i.e. flooding to their garage or outbuildings. Those with only gardens or driveways flooded were excluded.
In the Intangibles Survey and in Phase Two of the Warnings Survey, interviewers were given target quotas of the number of interviews to achieve within an area. The number of addresses given to the interviewers was restricted to ensure that the interviewers could exercise little choice over the respondents they interviewed. Given this sampling approach, it was not possible to calculate response rates for these studies.
The Lower Thames Survey focuses on a reach of the Thames extending from Datchet to Walton Bridge within the Lower Thames study area where there are a number of flood prone properties along the river banks and on islands in the Thames. For the survey, from an initial list of 39 possible localities, 13 specific areas were chosen to represent the reach in the survey. The choice of areas to include was informed by the residents’ level of flood risk (a 1 in 50 return period or less), the possible feasibility of providing community based flood risk reduction, the focus of the survey within each of the areas and a range of possible combinations of such approaches, a spread of localities along the river to represent the reach, and areas providing a sufficient numbers of households in order to maximise the chances of recruiting the target number of respondents within the limited time available for the fieldwork. Each locality was tightly defined by street and house address and the 13 areas provided nearly target 500 addresses from which the interviewers were to recruit respondents. Thus, as interviews were undertaken in approximately half the households available, it is likely that the respondents responses are a valid reflection of the residents across the localities chosen. Interviewers were instructed to recruit one adult member per household with no restrictions placed on gender, age or social grade.
In the Intangibles survey, the targets were to achieve 1,000 interviews with flooded households and nearly that number was achieved (983) The target for those at risk, 500 was exceeded with 527 interviews achieved. In the Warnings Survey, the target was to achieve at least 400 interviews, with a target of 300 in Phase Two. The number of interviews achieved in that Phase fell a little short of the target. In the Lower Thames Survey, the target number of 200 was achieved with 206 interviews completed. In all three surveys, only one interview was conducted with an adult aged 18 and over in each household to avoid clustering effects.
2.5.2 Questionnaires In the Intangibles Survey, different questionnaires with a core of common questions were used for the flooded sample and the at risk sample. The flooded sample were asked detailed questions about the health and social impacts of the flooding which were not relevant to those unaffected by flooding.
In the two Phases of the Warnings Survey, slightly different versions of the questionnaire were employed. The Phase One questionnaire contained more detailed questions about the flood warning service required by the Environment Agency for the evaluation of its service. These questions were not included in Phase 2. This allowed additional more detailed questions about flood prevention actions to be included. Thus, although there was a large core of common questions asked in the two phases, a few different questions were introduced in each phase.
2.5.3 FieldworkFieldwork was undertaken by two different market research companies, Market Opinion Research International (MORI) and BMRB. BMRB has had a contract with the Environment Agency to undertake regular annual public attitude surveys including post event surveys since 1997 and has therefore substantial experience of designing questionnaires and undertaking fieldwork with flood affected and at risk populations. MORI has undertaken surveys at coastal and river sites for FHRC over a number of years. The market research companies assisted in finalising the questionnaires and briefed and supervised their trained interviewers through their regional supervisors.
document.doc 29/06/0714

FLOODsite Project Report Contract No:GOCE-CT-2004-505420
FHRC has, for some surveys recruited, briefed and supervised its own team of fieldworkers. This has the advantage of keeping the researchers in close contact with the fieldwork areas and respondents. However, for the surveys included in this analysis, because of the large number of interviews involved, the wide distribution of the fieldwork sites, and the very short time available for the fieldwork in the Lower Thames area, this approach was not considered feasible. The researchers had gained insights into some of the areas included in the samples through screening activities in the Intangibles Survey and through prior qualitative research, focus group discussions and pilot interviews undertaken at many of the survey locations included in the studies.
2.5.4 Data processing and checkingThe market research companies were responsible for data checking and data entry. They provided FHRC with a disk with the data entered into an SPSS database. In the Intangibles Survey, the researchers were given limited access to the questionnaires but were able to read them and check the data entry directly with them. In Phase 2 of the Warnings Survey, FHRC were given the questionnaires to read and check. In all other cases, this was not possible because of the exact nature of the confidentiality agreement included in the survey.
2.5.5 AnalysisData from the three surveys were analysed by FHRC researchers using SPSS. This report mainly provides insights from new analyses of these data. However, there are points at which it is useful to include data that have already been presented elsewhere, either for comparison with new analyses or in support of the argument being made in this report. It was decided to analyse and present the findings by themes across the data from the three surveys where available. This results in some de-contextualising of the data, particularly that from the Lower Thames which is focused on one particular locality. For the other national surveys which were undertaken in many areas covering many different events, it has not been possible to take the detail of the local context into account.
The surveys, particularly the large Intangibles data sets, provide a rich source of data. However, it was not possible to analyse the data as fully as we would have liked across some themes because of time restrictions. Therefore, some themes have been analysed more thoroughly than others. In some cases, only bivariate analyses have been undertaken where it would otherwise have been advantageous to also have undertaken multi-variate analyses. The Lower Thames Survey offers more limited opportunities for analysis because of the size of the sample.
Generally, as a guide in the analysis, sub-group analysis has been restricted to those sub-groups containing 40 or more cases. Where exceptionally smaller groups have been included in the analysis, this is normally indicated in the text. Where reference is made to significant differences or associations in the text, this indicates that appropriate statistical tests have been applied and have been found to be statistically significant at at least the p<0.05 level and these are normally reported in the text. Where differences or associations are not statistically significant but are potentially interesting or important, this is pointed out.
Table 2.2 summarises the main independent variables available for analysis in some, but not in all cases, of the three surveys. Most of these variables are self-explanatory or are described in detail at the point where they are first used in the analysis. Background information and a more extensive explanation is provided in section 3 for a few of the variables.
2.6 Summary
The data offered in the three FHRC data sets are very different from the case study data available to our German and Italian partners. The FHRC data were originally collected and analysed for other purposes, based on particular theoretical frameworks. These data sets have been further analysed to augment our understanding of flood event experiences, preparedness and response to elaborate our understanding of the social and health impacts of flooding in the UK. The main independent variables
document.doc 29/06/0715
FLOODsite Project Report Contract No:GOCE-CT-2004-505420
used in the analysis for this report, are the most appropriate available from the earlier studies which address the aims of Task 11.
The first two UK data sets (from the ‘Intangibles’ and ‘Warnings’ surveys) cover a range of up to 30 locations and many different flood events in England and Wales between 1998 and 2003. The third data set (‘Lower Thames’ survey) focused on a particular location along the River Thames and a single key flood event in 2003. All surveys were preceded by a qualitative research stage involving focus group discussions. The Intangibles Survey involved two separate samples: flooded and ‘at risk’.
The Warnings study was carried out in two phases in areas where flooding had most recently occurred. The surveys mainly covered households that had experienced flooding inside the home but also some who only had other parts of their property (including gardens and drives) flooded and even a few properties that were not affected by the flooding in any way.
The Lower Thames study was almost exclusively of those at risk since very few of those in the survey had been flooded in the event of January 2003 that affected their area.
In the Intangibles Survey, different questionnaires with a core of common questions were used for the flooded sample and the at risk sample. In the Warnings Survey, slightly different versions of the questionnaire were employed in two Phases of the survey although there was a large core of common questions. The Phase One questionnaire contained more detailed questions about the flood warning service while Phase 2 contained detailed questions about flood prevention actions.
Fieldwork was undertaken by two different market research companies, Market Opinion Research International (MORI) and British Market Research Bureau (BMRB), who were also responsible for data checking and data entry. Data from the surveys were analysed by FHRC researchers using SPSS, sub-group analysis was generally restricted to those sub-groups containing 40 or more cases. For the Intangibles and Warnings data it has not been possible to take the detail of the local context into account due to the large number of survey locations.
document.doc 29/06/0716

FLOODsite Project Report Contract No:GOCE-CT-2004-505420
Table 2.2: Main independent variables used in the analysis
Variable Character Operationalisation Type
Research location Geographic 30 areas: Intangibles14 areas: Warnings
Nominal
Flood event characteristics
Type of flood Hydrological Perceived speed of onset: Intangibles only
Nominal
Flood depth Hydrological Maximum depth in cms in main roomsGrouped
ScaleOrdinal
Extent of flooding Hydrological Number of main rooms flooded: 0-4 Scale
Duration of flooding Hydrological Duration of flooding in hoursGrouped
Scale
OrdinalPollution of flood waters Hydrological Perceived as polluted/not/DNK
3categories2 categories
Nominal
Flood warning Institutional Received/notSourceWarning lead time
NominalNominalOrdinal
Social characteristics
Age Socio-demographic
YearsGrouped: various groupings
ScaleOrdinal
Gender Socio-demographic
Male/female Nominal
Dependent persons Socio-demographic
Long-term ill or disabled: respondent/household member
Nominal
Prior health Socio-demographic
4 categories Ordinal
Household type Young children in h/h Children in h/h Elderly in h/h
Socio-demographic
Various including:Aged <10 yearsAged <18Adults aged 75+ in h/h
NominalNominalNominal
Household size Socio-demographic
Number of adults/persons in h/hNumber living alone
Scale
NominalSocial grade Socio-economic 6 categories
4 categories2 categories white collar/not
Ordinal
Income Socio-economic Monthly household income from all sources: 8 categories
Ordinal
Previous flood experience inside home
Social Number of times flooded inside at current addressGrouped: various
Scale
OrdinalAwareness of flood risk Social Aware/not Nominal
Housing/ residence characteristics
Tenure Socio-economic 6 categoriesRenter/ notOwner/ not
NominalNominalNominal
Type of dwelling Socio-economic 9 categoriesVulnerable housing/not
NominalNominal
Length of residence at address Socio-demographic
YearsGrouped various
ScaleOrdinal
Area house price Socio-economic Grouped Ordinal
document.doc 29/06/0717
FLOODsite Project Report Contract No:GOCE-CT-2004-505420
3. Demographic and socio-economic structure of the population samples
As mentioned in Section 1.2.1, classical indicators of vulnerability include demographic and socio-economic characteristics of a particular population. In the following sections, the samples in the surveys are compared for gender, age and in terms of household composition, socio-economic stratification and vulnerability factors including health where the variables are available. The survey samples have been compared with the Census data for England and Wales (available from www.statistics.gov.uk/Stat.Base) on a few of the variables where comparison was possible (Table 3.1). Because the samples were drawn from at risk or flooded populations rather than from general populations within particular areas, it is not possible to determine in most cases whether deviations from the national picture reflect differences in these local areas, or in populations in flood risk areas as compared with the nation overall or some selection or other bias or in the survey samples. Table 3.1 summarises the socio-demographic characteristics of the respondents and households where interviews took place for all the three surveys.
Table 3.1: Social structure and housing/residence characteristics of the samples
Characteristics Intangibles Warnings Lower Thames
Census for England / Wales 2001
Flooded% (n=)
At risk% (n=)
% (n=)
% (n=)
%
Gender of respondent Male 39 (381) 43
(225)51 (206) 48 48**
Female 61 (602) 57 (302)
49 (202) 52 52
Age of respondent 18-34 11 (104) 36
(184)6 (25) 12* (24) ) 48
35-44 21 (211) 18 (91)
17 (68) 18 (36) )
45-54 29 (194) 15 (80)
21 (84) 23 (46) )31
55-64 20 (198) 13 (69)
24 (95) 21 (43) )
65-74 13 (129) 10 (53)
20 (82) 13 (27) 11
75+ 15 (148) 8 (40) 13 (53) 15 (30) 10N= 982 517 407 206 40,246,680***Households containing: Children under 10 16 (158) 25
(130)14 (56) 19 (39)
Young people 10-17 17 (168) 16 (83)
19 (79) 17 (35)
Adults aged 18-64 75 (736) 86 (453)
70 (387) 74 (153)
Adults aged 65-74 18 (173) 12 (62)
26 (107) 16 (33)
Adults aged 75+ 17 (163) 8 (44)
17 (68) 14 (29)
* Lower Thames contains two residents in the age group 16 -24**% of males and females aged 16 and over*** % of people aged 16 and over in households
document.doc 29/06/0718
FLOODsite Project Report Contract No:GOCE-CT-2004-505420
3.1 Gender and age
The Warnings Survey and Lower Thames Survey samples were reasonably well balanced in terms of the gender of the respondents (Table 3.1). However, this was not the case for the Intangibles Survey, both those at risk and the flooded. The 2001 Census shows that 52% of the population in England and Wales (over 16) are female. In the Intangibles Surveys, 61% of flooded sample respondents were female and for the at risk sample the proportion was 57%. The imbalance may be the result of interviewer selection bias and of interviews taking place on weekdays, rather than at weekends or evenings when women tend to be more available than men.
The flooded and at risk samples in the Intangibles Survey were drawn from the same locations. However, they differed significantly in various ways. Indeed the at risk sample stood out as different from all the other samples in terms of age. The at risk sample was younger than the flooded sample with more respondents in the 18-34 age group and fewer people aged 65 and over. The at risk sample was thus closer to the population of England and Wales than the other samples. The mean ages for the at risk and flooded sample respondents were 45.4 and 54.5 respectively which can be compared with the Census 2001 figure of 47.5 for adults aged 18 and over in England and Wales. All the survey respondents apart from the at risk were older than the population of England and Wales as indicated by the Census data, with fewer residents in the under 45 age groups and more in the 45-64 age group, the 65 and over and indeed the 75 and over age groups. It is only possible to speculate on why this is the case. It is possible that those living in flats above ground floor level who were likely to be younger people were under-represented because they would not have been flooded above floor level and would have been excluded on those grounds. Older people are more likely to be housed in ground floor flats and bungalows and may be over-represented among those flooded as a result. It is also possible that locations near rivers were seen as attractive places to live and therefore residents were less likely to move away from them as they grew older.
3.2 Household types
The at risk sample in the Intangibles Survey also differed from the other samples in terms of the households represented, reflecting the differences in respondents’ age. The at risk sample contained more households with young children under ten years of age and fewer households containing elderly members, both those aged 65-74 and more particularly those aged 75 and over than the other samples (Table 3.1). One might expect that households with young children would be particularly vulnerable during flood events. With older children and young people under 18, it might be different since teenagers might be able to help with the care of young children and with taking action to protect property. In the same way households that included older people, particularly the very elderly aged 75 and over, might also be expected to be handicapped as compared with other households.
The size of the households was compared for the Intangibles Survey and the Warnings Survey. Data on household size were not included in the Lower Thames Survey. All the survey samples contained significant minorities of one person households (Figure 3.1). However, the at risk sample included many more people under 65 living on their own, while in the other samples, older people aged 65 and over predominated among the single person households. It can be hypothesised that those living alone will be more vulnerable in the event of flooding because they will be without others in the household to consult on what to do and to help take action to prepare for flooding. Older people living alone might be expected to be particularly vulnerable.
The most common size of household across all the samples was a household consisting of just two people reflecting the age and stage in the household life cycle of the residents in the flood risk areas. There were very few larger households containing five or more residents of all ages including children as well as adults (Table 3. 2)
document.doc 29/06/0719

FLOODsite Project Report Contract No:GOCE-CT-2004-505420
Figure 3.1: Living alone: Intangibles Survey and Warnings Survey
Percentage living alone according to age: Intangibles Survey and Warnings Survey
28
16
12
23
7
16
18
11
6
0 5 10 15 20 25 30
All Alone
Alone 65+
Alone <65
Percentage
Warning survey (n=406)
Intangibles Survey at risk(n=523)Intangibles Survey (n=983)
Table 3.2 Household size: Intangibles Survey and Warnings Survey
Household size Intangibles WarningsFlooded% (N= 980)
At risk% (N=523)
% (N=406)
One person 28 24 18Two 37 38 44Three 16 16 14Four 14 14 15Five or more 5 8 8
3,3 Socio-economic stratification
3.3.1 Social grade classificationSocio-economic status was highlighted in Section 1.2.1 as a possible indicator of social equality, and therefore social vulnerability. The social grade classification of respondents used in the surveys is that used by market research companies (The Market Research Society, 2002). This social grading is based upon the occupation of the ‘Head of Household’ or ‘Chief Income Earner’ (CIE) in a household. In the surveys analysed for this report, the CIE provided the basis. The surveys excluded residents in communal institutions and were of residents in ‘private households’ i.e. people living alone or in a group together whose food and household expenses are managed as one unit. The CIE is the person in the household with the largest income, whether from employment, pensions, state benefits, investments or any other sources regardless of gender. Where two people in a household have equal incomes, the older person is taken as the CIE. The CIE is graded according to his or her current occupation. An indication of the occupations and their grading is given in Table 3.3. Where the CIE is retired, the grading is according to the previous occupation if the person has an occupational pension, a state earnings related pension or private means i.e. they are not dependent on the basic state pension and other state benefits for income. Widowed, divorced or separated persons are graded according to their own occupations unless they do not work or receive a pension or
document.doc 29/06/0720

FLOODsite Project Report Contract No:GOCE-CT-2004-505420
maintenance from their former spouse. Occupations are listed by rank and the appropriate grading attached to the rank is indicated.
Table 3.3: Social grade classification
Social grade Examples of occupation groups included
A Senior managers, administrators and professionalsVery senior managers in business or commerceTop civil servantsMedical Consultants, Senior Nursing Officer, Hospital ManagerUniversity Professor
B Intermediate managers, administrators and professionalsMiddle Managers, Principal Officers in local Government and Civil ServiceOther University TeachersSchool teacher with qualificationsOther Doctors
C1 Supervisors, clerical, junior managers/administrators and professionalsAdministrative officer/clerical officerMidwife, Qualified NurseLibrary Assistant
C2 Skilled manual workers and manual workers with responsibility for other peopleBus/train driverSkilled Electrician, Plasterer, Dairyman/Skilled farm workerShop assistant with responsibilities
D Semi-skilled and unskilled manual workersVan driverUnskilled building workerFarm worker, semi-skilled or unskilledShop assistant without responsibilitiesApprentices and trainees to skilled workers
E On state benefit, unemployed, lowest grade workersCasual workers and those without a regular incomeOnly households without a chief income earner are included
The Census classifications are similar as shown belowAB : Higher and intermediate managerial/administrative/professional C1 : Supervisory, clerical, junior managerial/administrative/professional C2 : Skilled manual workers D : Semi-skilled and unskilled manual workers E : On state benefit, unemployed, lowest grade workers
Interviewers are required to ask questions to establish, the position rank or grade of the CIE and additional questions on the industry or type of company they work for, qualifications they may have and the number of staff they are responsible for as necessary. Interviewers are given training in categorising social grade and note down the responses to these questions and complete the social grade coding after probing fully in the field. Interviewers are provided with a booklet listing occupations and grades and their appropriate social grade. Where there is uncertainty over the appropriate occupational grading, for example, for engineers, managers or directors of companies, the number of employees in the establishment and the qualifications and responsibilities of the CIE are taken into account. Students who live at home and form part of that household are graded according to the CIE of that household. The same is true of lodgers and domestic servants that are categorised by the household that employs them. Households where there are no current earners or only those whose earnings are intermittent and on or below the basic minimum state benefit, retired people living on the basic state retirement pension, widows with only widows benefit and people who have been sick or unemployed for six months or more are graded as in the lowest category (E). An indication of the respondents’ occupations and their grading is given in Table 3.4.
document.doc 29/06/0721

FLOODsite Project Report Contract No:GOCE-CT-2004-505420
Table 3.4: Socio-economic status and housing/residence characteristics of the samples
Characteristics Intangibles Warnings Lower Thames
Census for England / Wales 2001
Flooded% (n=983)
At risk% (n=527)
% (n=408)
% (n=206)
%
Socio-economic group of main income earner AB Professional/managerial
21 (204) 18 (96) 33 (134) 32 (66) 22
C1 Clerical/white collar 27 (263) 30 (157) 30 (121) 53 (110) 30 C2 Skilled manual 23 (226) 21 (113) 19 (77) 6 (13) 15 DE Semiskilled/unskilled etc
28 (273) 29 (155) 18 (75) 6 (13) 33
Not known 2 (17) 1 (6) * (1) 2 (4)N= 983 527 408 206 40,665,546**Households containing Ill or disabled person 24 NA 17 (69) NA 34***Property tenure Own outright 46 (448) 26 (138) ) 90 (369) 45 (93) 29 Buying on a mortgage 42 (416) 41 (216) ) 42 (87) 40 Renting from local authority
7 (66) 9 (45) 2 (7) 3 (6) 13
Renting from housing association or trust
1 (14) 3 (19) 3 (12) 0 6
Renting privately 3 (30) 19 (98) 3 (14) 8 (16) 9 Other/don’t know 1 (9) 2 (11) 2 (6) 2 (4) 3N= 983 527 408 206 21,660,475Length of residence Less than a year 1 (6) 27 (140) 1 (5) 7 (15) 1-4 years 14 (136) 33 (176) 47 (185) 15 (30) 5-9 years 22 (220) 11 (56) 22 (45) 10-19 years 28 (279) 15 (80) 27 (106) 26 (54) 20+ years 35 (342) 14 (75) 25 (98) 30 (62)N= 983 527 394 206Type of dwelling Detached house 14 (139) 11 (59) 40 (163) 33 (68) Semi-detached 24 (238) 25 (129) 25 (102) 24 (50) Terraced house 51 (503) 46 (245) 25 (101) 16 (32) Bungalow, g/f/basement flat, mobile home, other
10 (103) 18 (94) 9 (39) 27 (56)
N= 983 527 405 206* Less than 0.5%** % of people aged 16 and over in households*** % of household containing one or more persons with long-term limiting illness
In the Warnings and Lower Thames Surveys as compared to both Intangibles samples, a higher proportion of respondents were in the higher social grades (AB) and a lower proportion were in the lowest grades (DE) than is the case in England and Wales overall. This is probably due to the substantial proportion of interviews in the Warnings Survey and all in the Lower Thames study that were conducted in the Thames Valley or in affluent areas in the South East of England. The Warnings and Lower Thames samples were also different since they contained a larger proportion of people living in detached properties than both Intangibles samples. This may again reflect the greater affluence of the locations where the surveys took place.
3.3.2 Household income
document.doc 29/06/0722

FLOODsite Project Report Contract No:GOCE-CT-2004-505420
Household income can be a contributing factor to social vulnerability. Questions about income are some of, if not the most sensitive items, to include in surveys in Britain. They are usually asked, as in the surveys in this study, as one of the last questions in the survey in order not to alienate respondents early on in the interview. They are asked in a broadly grouped and coded form in order to make them more acceptable to respondents. Respondents are shown a card with income categories listed with a random letter against each category so that respondents can answer without stating the amount of their income. Respondents are asked: ‘Please can you indicate which of the following letters represents your gross household income (before tax) per week, month or year. Just read out the letter that applies’.
Despite this approach, there is normally a high level of non-response to this question item because some respondents do not know the gross household income which involves knowing and adding together the income of all household members, and others refuse to provide the information.
Respondents in the Intangibles Survey and the Warnings Survey were asked to give their gross household income before tax. This question was not asked in the Lower Thames Survey. The key feature of the response to this question is the high level of non-response in both surveys; there was a 36% non response in the Warnings Survey with refusals at 27%, a key component. For the flooded sample in the Intangibles Survey, 24% were unclassifiable on income. For the at risk sample non response on income was 19%. These high levels of non-response reduce the value of the income variable for the analysis since the sample size is significantly reduced when this variable is used and because the non response may mean that the data on income and respondents giving it are unrepresentative of the sample as a whole.
Bearing these reservations in mind, Table 3.5 presents gross household income data for single person and multiple person households for three of the survey samples excluding the non-response. These data confirm what was indicated by the data on social grade: the greater affluence of the Warnings Survey respondents overall and those in multiple person households among them as compared with those in the Intangibles Survey both the flooded and the at risk. In all three samples, markedly more in the single person households had incomes falling in the two lowest income categories (under £800 per month) than did multiple person households. Table 3.5: Percentage of respondents with a gross monthly household income level for one person and multiple person households
Gross Monthly Household income before tax
Intangibles Survey Flooded
Intangibles SurveyAt risk
Warnings Survey
One personhouse-hold(n=217)%
Multiple person house-hold(n=537)%
AllHouse-holds
(n=754)%
One personhouse-hold(n=99)%
Multiple person house-hold(n=319)%
AllHouse-holds
(n=418)%
One personhouse-hold(n=46)%
Multiple person house-hold(n=212)%
AllHouse-holds
(n=258)%
Less than £400
21 1 7 27 7 12 13 2 4
£400 < £800
33 15 20 19 10 12 37 11 15
£800 < £1,500
25 23 24 23 27 26 22 21 21
£1,500 < 2,400
14 25 22 19 23 22 20 16 17
£2,400 < £3,200
3 18 14 8 15 13 2 15 13
£3,200 < £4,00
2 7 6 1 7 6 0 14 11
document.doc 29/06/0723

FLOODsite Project Report Contract No:GOCE-CT-2004-505420
£4,000 or more
1 11 8 2 12 9 6 22 19
Non-response to the household income question is excluded from this Table.
As figures 3.2, 3.3 and 3.4 show, in all three survey samples, there was a strong association between income and social grade (Chi-square; p<0.001). Among the flooded in the Intangibles Survey, 62% of those in the DE social grades had gross monthly household incomes of under £800 per month; for the at risk, the proportion was 55% and in the Warnings Survey the proportion was also 62%. Thus, the DE social grade category, admittedly a small category in each of the surveys, encapsulates multiple vulnerabilities in economic and social terms.
Figure 3.2: Income by social grade: Intangibles Survey - flooded
Percentage of respondents with a gross monthly income level according to social grade: Intangibles Survey: flooded
(n=741)
62
20
17
3
37
78
70
53
1
2
13
44
0% 20% 40% 60% 80% 100%
DE (n=204)
C2 (n=168)
C1 (n=213)
AB (n=156)
Soci
al G
rade
Low <£800
Medium £800< £3200
High £3200 ormore
Figure 3.3: Income by social grade: Intangibles Survey - at risk
Percentage of respondents with a gross monthly income level according to social grade: Intangibles Survey: At Risk
(n=416)
55
14
10
10
43
80
73
43
1
6
17
31
0% 20% 40% 60% 80% 100%
DE (n=121)
C2 (n=86)
C1 (n=127)
AB (n=82)
Soci
al G
rade
Low <£800
Medium £800< £3200
High £3200 ormore
document.doc 29/06/0724
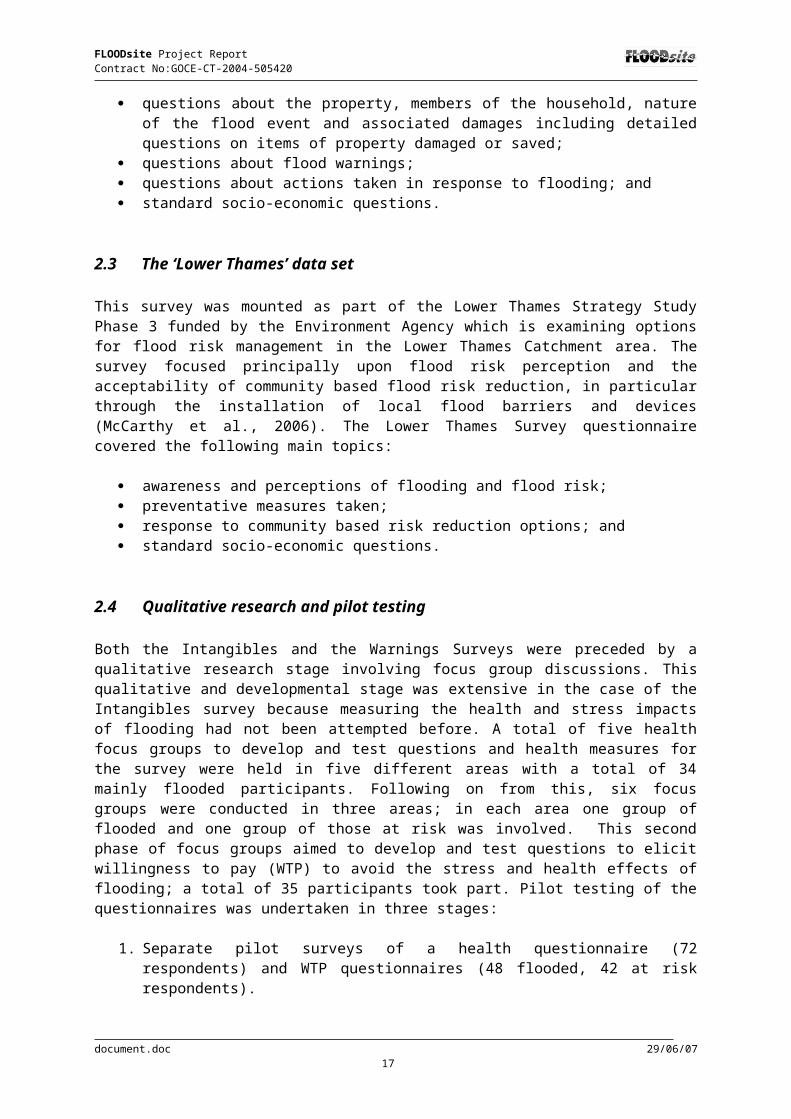
FLOODsite Project Report Contract No:GOCE-CT-2004-505420
Figure 3.4: Income by social grade: Warnings Survey
Percentage of respondents with a gross monthly income level according to social grade: Warning Survey (n=259)
62
16
18
0
38
71
48
49
0
13
34
51
0% 20% 40% 60% 80% 100%
DE (n=45)
C2 (n=45)
C1 (n=85)
AB (n=84)
Soci
al G
rade
Low <£800
Medium £800< £3200
High £3200 ormore
3.3.3 Tenure and length of residence
The tenure situation in England and Wales The tenure situation in England and Wales is complex and varies greatly depending upon a number of factors. One key difference compared to many European countries is that a higher proportion of people own or are buying their own homes. This will be highlighted in later Sections as an example of a context-specific indicator of social vulnerability. The national average for home ownership (including those buying on a mortgage) is 69% (Census, 2001). Around 9% of people nationally rent from a private owner or landlord. Around 13% of people nationally rent their property from their local authority or social housing provider. The term ‘social housing’ covers both local authority (‘council’) and housing association dwellings. In England, there are an estimated 3.93 million households in the social rented sector; of which 2.47 million are in local authority accommodation and 1.46 million in housing association accommodation (ODPM, 2005). By the early 1980s, problems associated with council housing were widely recognised and many estates had already acquired a negative reputation and had become the last resort for those on the lowest incomes (LGiU, 2004).
Over the last 20-30 years the proportion of Local Authority social housing has decreased due to a wide range of factors. ‘Right-to-Buy’ sales (sales to those who have been renting the property from the Authority for many years and who were offered the right to buy the properties for less than the market prices) were a significant factor. The right-to-buy legislation introduced in 1980 had an uneven effect, both across the UK and over the socioeconomic spectrum. Sales were higher in areas that already had the highest levels of home ownership, and were concentrated on the most desirable estates (LGiU, 2004). Other factors affecting the reduction in Local Authority social housing include ‘Large Scale Voluntary Transfers’ to registered non-profit Housing Associations (Registered Social Landlords) or trusts, and selling into shared ownership schemes. Local Authorities no longer build new social housing but they maintain responsibility for existing stock (i.e. that which has not been sold or transferred to housing associations etc.). According to government figures, the proportion of older households living in social rented accommodation increases with age (ODPM, 2005).
Tenure and length of residence in the SurveysIn all the samples apart from the ‘at risk’ sample in the Intangibles Survey, over 80% of residents owned outright or were buying their properties and higher proportions of those interviewed in those
document.doc 29/06/0725

FLOODsite Project Report Contract No:GOCE-CT-2004-505420
studies owned their homes outright (without a mortgage) than the national average of 29% (Table 3.4), in some cases this figure was significantly higher. The differences in the proportions owning their homes outright may reflect the high proportion of older people in the samples, who have had time to pay off their mortgages. High levels of home ownership may also reflect the affluence of the areas where flooding occurred.
In the study areas for this report apart from the at risk sample, fewer interviewees generally rented their property, except for the at risk sample in the Intangibles study. The proportion of local authority and housing association (social housing) tenants was lower than the national average. It may be that these differences reflect greater success in planning and locating local authority and housing association property outside flood risk areas and the fact that many older pre 1900 properties likely to be owner occupied are located in the flood plain. It is also possible that the difference is due to the fact that surveys that focus on those who have been flooded inside their homes or who are at risk from such flooding necessarily exclude those who live on the upper floors in blocks of flats or converted buildings. Local authority, privately renting and housing association tenants are more likely to live in such property and therefore to be excluded from the surveys as not at risk.
The at risk in the Intangibles Survey were strikingly different in terms of their tenure to the other samples, although the proportion owning or buying their property in this sample (67%) was closer to the national average than were the other samples. Many more of the at risk were renting their property privately than was the case in the other samples and than is the case nationally. There was an equally marked contrast in the length of residence in the flooded and at risk samples, with over 40% of the at risk resident for less than two years compared with 1% of the flooded. This may in part be accounted for by the requirements of the sampling, since those who had recently moved to the area would not have been affected by the main flood events of Easter 1998 and of autumn 2000, and would thence be eligible for inclusion in the at risk sample.
It is possible that these differences in age and length of residence reflect, in part, the age of housing in the flooded area, with younger people moving into more recently constructed properties that are built where the risk is lower. A further explanation is that younger people have since moved into rented accommodation that was flooded in the recent events when the owners no longer wished to live there. The data are consistent with such mobility following recent flooding. The other sample that is almost all of those at risk, the Lower Thames Survey, is more like those flooded in the Intangibles Survey and the Warnings Survey in tenure and length of residence. The majority of the residents in the samples other than the at risk sample had been resident ten or more years at their address. This apparent stability may again in part reflect the sampling selection procedures (since to be interviewed residents had to have been present at the time or a recent or worst flood which may have occurred some years earlier) rather than the mobility in the area as a whole.
Although home ownership was the dominant form of tenure for all social grade groups, there was a strong association between social grade and tenure among the flooded in the Intangibles Survey (Chi-square; p<0.001) and in the Warnings Survey (Chi-square; p<0.05) (Figure 3.5). In both surveys, the C2 and more particularly DE groups were more likely to rent from the local authority, a housing association or a private landlord than the AB and C1 groups. Because the ‘right to buy’ offers local authority tenants the opportunity to buy their homes at discounted prices, it has enabled local authority tenants who would not otherwise have been able to afford to buy, to become home owners and has thus widened home ownership. It has also introduced a mix of tenure types to estates and block of flats that formerly provided exclusively local authority rented accommodation.
3.3.4 Area House pricesIn the Intangibles Survey only, a variable that was intended to reflect the differences in the 30 locations where the interviews took place was developed. Local house prices were used to capture variations in the affluence of the locations.
document.doc 29/06/0726
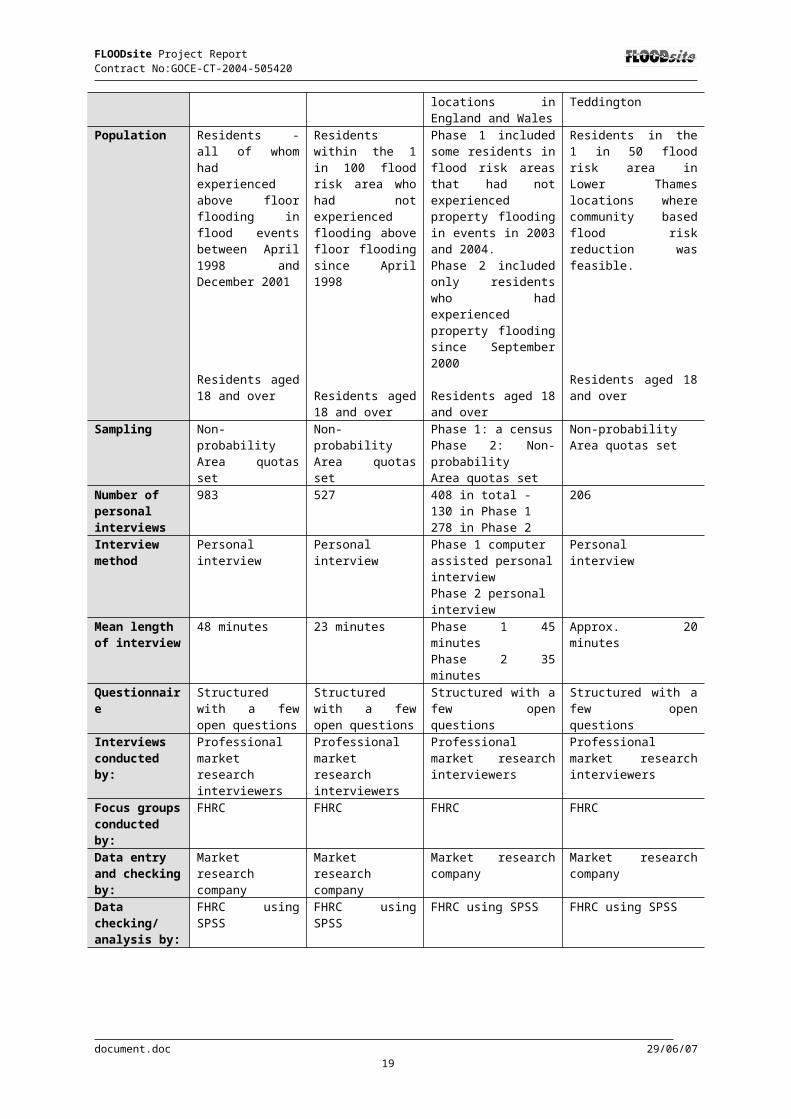
FLOODsite Project Report Contract No:GOCE-CT-2004-505420
Figure 3.5: Home ownership by social grade: Intangibles Survey and Warnings Survey
Percentage owning or buying their accomodation by social grade: Intangibles Survey (n=962) and Warnings Survey
(n=406)
96 9488
76
97 95
84 81
0
10
20
30
40
50
60
70
80
90
100
AB C1 C2 DE AB C1 C2 DE
Perc
enta
ge
Intangibles SurveyWarnings Survey
Typical house prices (for 2001) for individual wards (administrative divisions within parliamentary constituencies and local government areas) are readily available from National Statistics Online (www.neighbourhood.statistics.gov.uk) by entering a postcode. For each of the 30 locations, typical house prices for both terraced and semi-detached houses, the most common types of property in the survey, were obtained by entering a range of sample post-codes (from address lists supplied by MORI, the survey organisation that undertook the interviewing). For some locations, all the addresses were within a single ward, whilst in others the location covered several wards. The house prices for a terraced and semi-detached property in each location were then compared with the national averages for these types of property and relative house price value for each of the types of property was developed for each location. Locations were assigned a simple rating value on a scale of 1 to 5 based on the average of the relative values for the two types of property (RPA/FHRC 2004). The details are shown in Table 3.6.
The average price for a terraced house in England and Wales in 2001 was £89,500; the price for a semi-detached property was £101,700. The highest house price rating (1) was assigned to areas where house prices taking the two property types into account were more than 1.4 times the national average; the lowest house price rating was given to areas where the average house prices across the two types of property were 60% or less compared with the national average. Areas with the higher house price ratings (1 and 2) were predominantly in the south of England, while the lower house price ratings (4 and 5) were with one exception only assigned to areas in the north east and west regions and Wales. The area house price rating, in part reflects regional differences in house prices.
There was a strong correlation between area house price ratings and social class with 61% of those in the higher social grades (AB) mainly living in the high rated house price areas (1 and 2) and 55% of those in the lowest (DE) grade living in areas with the low ratings (4 and 5). However, area house price ratings are averages and the housing in most areas is mixed and neighbourhoods are not entirely homogenous. As Table 3.7 shows, people from different social grades are found in the locations in each of the house price rating categories.
document.doc 29/06/0727

FLOODsite Project Report Contract No:GOCE-CT-2004-505420
Table 3.6: Details of area house price rating: Intangibles Survey
Area house price rating:
Mean % of national average house price
Locations in each house price rating category
Number of locations
% and (number ofrespondent)flooded sample
1 High >1.40 Lewes, Sussex; London Colney, Herts; Ponteland, Northumberland; Weybridge, Surrey; Woking, Surrey.
5 20 (194)
2 Above average to fairly high
1.01-1.40 Alconbury, Cambs; Five Oak Green, Kent; Hemingford Grey, Cambs; Leamington Spa, Warks; Waltham Abbey, Essex.
5 18 (181)
3 At or below average
0.91-1.00 Banbury, Oxon; Bollington, Cheshire;Evesham, Worcs; Newport Pagnell, Bucks; Rhydymwyn, Flints; Worcester, Worcs; York, Yorkshire.
7 18 (180)
4 Fairly Low 0.61-0.90 Congleton, Cheshire; Kendal Cumbria; Macclesfield, Cheshire; Malton, Yorks; Melton Mowbray, Leics; Ryde, IOW;
6 10 (103)
5 Low <0.61 Barlby/Selby, N.Yorks; Hatton, Derbyshire; Gowdall, E.Yorks; Newport, Gwent; Ruthin, Denbighshire; South Church/West Aukland, Co. Durham; Todmorden, Lancs.
7 33 (325)
Table 3.7 Area house price rating and social grade: Intangibles Survey
Social grade
Area house price rating
1 high%
2%
3%
4%
5 Low%
AB 30 39 20 10 11C1 37 25 31 19 23C2 17 14 20 44 28DE 17 22 30 27 38N= 191 175 178 103 319
Chi square; p<0.001
3.4 Prior health and long-term illness and disability
It was hypothesised that health prior to a flood event would be a significant factor in vulnerability to flooding. It was also assumed that those whose health was poor before a flood event would be less able to cope and would recover from the event less well that those in good health. Thus in the Intangibles Survey, flooded respondents were asked to rate their prior health on the scale shown in Table 3.8. Only 4% of respondents rated their health as ‘poor’ before the flood event, and there were no significant differences between men and women in their rating. There were, however, significant differences by age group (Table 3.8) in how they rated their prior health.
In the Intangibles Survey, prior health was also significantly associated with social grade. The distinction was mainly between the lowest DE social grade and the other categories. Nearly a quarter (24%) of the DE category described their prior health as poor or fair compared with 10% of all other
document.doc 29/06/0728

FLOODsite Project Report Contract No:GOCE-CT-2004-505420
grades. Only 13% of the DEs described their prior health as excellent, compared with twice as many of the other grades, 26%.
Table 3.8: Prior health by age group – Intangibles Survey
Prior health by age group – Intangibles Survey
“How was your state of health in general before the worst flooding?”
Previous health
Percentages (Number of cases)
Age group
18-24%
25-34%
35-44%
45-54%
55-64%
65-74%
75+%
Poor 4 (42) 0 0 2 3 7 7 6Fair 10 (97) 0 2 5 9 7 15 24Good 34 (333) 13 34 28 31 35 39 43Very good 30 (294) 44 28 39 30 29 26 20Excellent 22 (217) 44 35 27 27 22 13 7Number of cases
983 16 88 211 194 198 128 147
Chi-square; p < 0.001
In the Intangibles Survey, flooded respondents only were asked:
‘Before the flooding, did you have any long-term illness, health problems or disability which limited your daily activities or the work you could do (including problems which are due to old age)?’
A total of 16% (161) of flooded respondents said they had a long-term illness, health problems or disability of this kind. There were no significant gender differences but there were age differences with the proportion of long term illnesses or disabilities increasing with age, as would be expected (Figure 3.6).
Figure 3.6: Respondents’ long term illness and disability by age
Percentage of respondents with long term illness or disability by age of respondent: Intangibles Survey
6 6
13
19
23
33
0
5
10
15
20
25
30
35
18-34 (n=104) 35-44 (n=211) 45-54 (n=194 55-64 (n=198) 65-74 (n=128) 75+ (n=128)
Perc
enta
ge
Chi-square; p < 0.001
Flooded respondents were also asked whether anyone else in their household had long-term illness, health problems or disability. In 13% (129) of households, someone other than the respondent had a long term illness or disability. When the responses to the two questions were combined, it emerged
document.doc 29/06/0729

FLOODsite Project Report Contract No:GOCE-CT-2004-505420
that in 24% (237) of households either the respondent or someone else came into this category. This can then be compared with the Warnings Survey data. In the Warnings Survey, the same question was asked but covering the respondent and anyone else in the household. A much lower proportion (17%) of households in that survey contained someone with a long-term illness, health problem or disability. It is possible that this difference is in part due to the lower proportion of residents in the DE social grade group in the Warnings Survey.
In the Intangibles Survey, the incidence of long term illness, and disability in the flooded households was significantly linked to social grade (Chi-square; p<0.001). Again the main distinction was between the lowest DE grade and all the other grades; 38% of the DEs reported having a long term ill or disabled member in their household compared with 19% of all the other groups. In the Warnings Survey, there was a trend for long term illness or disability to increase from the AB to the DE social grade groups (11% compared with 25% respectively reporting long term illness or disability in the household) but the differences were not statistically significant. In Britain, a social class gradient is commonly identified in health statistics. But it must also be noted that the E social grade includes those who are long term unemployed (often for health reasons) and those dependent on state benefits associated with disability or incapacity and without other means. This means that the DE social grade group encapsulates multiple potential vulnerabilities in terms of socio-economic and health status.
3.5 Summary
The samples in the three surveys were compared for gender, age, in terms of household composition, socio-economic stratification and vulnerability factors including health, where the variables were available. Samples from the Warnings and Lower Thames Surveys were reasonably well balanced in terms of gender, however, this was not the case for the Intangibles Survey, where both samples contained significantly higher proportions of women. All respondents apart from the at risk in the Intangibles Survey were older than the average population of England and Wales. The at risk sample also contained more households with young children under ten years of age. Significant minorities of one person households were found in the Intangibles and Warnings Surveys, both over and under age 65. The most common size of household across all the samples was just two people, reflecting the age and stage in the household life cycle of the residents in the flood risk areas.
A higher proportion of respondents were in the higher social grades (AB) in the Warnings and Lower Thames Surveys compared to both Intangibles samples, and a lower proportion were in the lowest grades (DE) than is the case in England and Wales overall. This is probably due to the substantial proportion of interviews in the former surveys that were conducted in affluent areas in the South East of England. These samples also differed in that they contained a larger proportion of people living in detached properties than both Intangibles samples, again possibly reflecting the greater affluence of the locations and the higher incomes reported by respondents in the Warnings Survey compared with the Intangibles Survey. In all samples, markedly more in the single person households (often the elderly) had incomes falling in the two lowest income categories than did multiple person households.
In all the samples apart from the ‘at risk’ in the Intangibles Survey, over three quarters of residents owned outright or were buying their properties and higher proportions owned their homes outright than the national average, in some cases this figure was significantly higher. Fewer interviewees generally rented their property, except for the at risk sample in the Intangibles study. These respondents were strikingly different in terms of their tenure to the other samples, although the proportion owning or buying their property was closer to the national average. There was a strong association between social grade and tenure among the flooded in the Intangibles Survey and in the Warnings Survey, with the C2 and more particularly DE groups in both surveys more likely to rent. In the Intangibles Survey, prior health was also significantly associated with social grade. The distinction was mainly between the lowest DE social grade and the other categories.
document.doc 29/06/0730

FLOODsite Project Report Contract No:GOCE-CT-2004-505420
There was also a marked contrast in the length of residence in the flooded and at risk samples, with over 40% of the at risk resident for less than two years compared with 1% of the flooded which may in part be accounted for by the requirements of the sampling. It is possible that the differences in age and length of residence reflect, in part, the age of housing in the flooded area, with younger people moving into more recently constructed properties that are built where the risk is lower. A further explanation is that younger people have since moved into rented accommodation that was flooded in the recent events when the owners no longer wished to live there.
Intangibles Survey respondents reported higher proportions with a long-term illness, health problems or disability and someone in the household other than the respondent with a long term illness or disability compared with the Warnings Survey. This may reflect in part the lower proportion of residents in the DE social grade group in the Warnings Survey: in the Intangibles Survey, the incidence of long term illness, and disability in the flooded households was significantly linked to social grade, the main distinction being between the lowest DE grade and all the other grades. In the Warnings Survey, there was a trend for long term illness or disability to increase from the AB to the DE social grade groups.
Overall, according to the literature on vulnerability, one might expect that many of the respondents and households in the surveys e.g. those with young children, older residents, long term ill or disabled, and those on lower incomes would be particularly vulnerable during flood events. These factors will be explored in later Sections of the report.
document.doc 29/06/0731

FLOODsite Project Report Contract No:GOCE-CT-2004-505420
4. Flood events, experiences and perceptions
4.1 The flood events
Although the focus in this report is on social vulnerability, other factors can also influence whether individuals or households are vulnerable to the impacts of flooding. People or communities are resilient or vulnerable in the context of particular situations, especially their risk environments. Every flood event is unique and the outcome of a combination of:
the flood event characteristics; the characteristics and resources of the population affected; dwelling characteristics; and the organisational and institutional responses to the particular event.
Moreover, each event may have different impacts on the households and communities affected, depending upon levels of preparedness and other factors. A similar flood event in terms of depth, duration, etc. can have very different effects on different people.:
As Appendix 1 shows the surveys on which the data sets are based covered a very large number of different floods in different locations. In the Intangibles Survey of the flooded, 224 respondents (23%) had been affected by the Easter 1998 floods; 502 respondents (51%) were involved in the very extensive autumn 2000 events and the remainder were flooded by other events occurring at some time between January 1998 and November 2000. In the Warnings Survey, only one flood event, the January 2003 Thames flooding, provided a substantial number of the respondents, 116 (28%); there were 37 respondents (9%) only affected by the autumn 2000 floods. The bulk of the Warnings respondents were involved in diverse events that occurred across the country since September 2000. Brief outlines of the main flood events covered in the studies in this report are given below.
4.1.1 Easter 1998The Easter 1998 flooding in England and Wales was the most widespread for many years. Sustained heavy rainfall across central England and Wales caused rivers to flood over the Easter holiday weekend. Rainfall varied from place to place but was exceptionally heavy and prolonged over three counties in central England resulting in severe flooding in these areas (return periods between 75 to 170 years) but lesser events elsewhere (20-75 years). Flooding was particularly severe in towns such as Northampton, Banbury, Kidlington, Leamington and Skenfrith, and many thousands of people were severely affected by the floodwaters.
In many catchments the flooding was the most severe ever recorded, many of the floodwaters containing pollutants. Flood warnings were issued in most locations but lack of public awareness, together with nationally inconsistent and inadequate procedures and systems resulted in poor overall performance. Many residents and local authorities were taken by surprise. Five people died directly or indirectly as a result of the floods. Many lost their homes and personal possessions and suffered massive disruption to their lives and livelihoods, some for up to six months (Bye and Horner, 1998). Initial estimates of insured and uninsured losses were in the order of £350 million. An independent commission set up to review the flooding and the Environment Agency’s response particularly highlighted the issue of the human and social impacts of the flood event (Bye and Horner, 1998).
4.1.2 Autumn 2000The autumn of 2000 was the wettest on record across England and Wales for over 270 years. Recurrent heavy rainfall in October and November caused prolonged, extensive and in some places repeated flooding. Flood levels in many locations were the highest on record and in many places no previous record of flooding existed. The flooding was therefore very dispersed, with around 10,000 properties (homes and businesses) being flooded at over 700 locations. Many of these locations involved less than 20 properties or between 20 to 100 properties. Around 20 locations reported over
document.doc 29/06/0732

FLOODsite Project Report Contract No:GOCE-CT-2004-505420
100 properties flooded. There was also widespread disruption to road and rail services. The total estimated costs were in the order of £1 billion. Since the Easter 1998 flooding, improvements had been made to flood warning systems and these appeared to have worked well. Around 11,000 people were requested to evacuate their homes, although not everyone complied (EA, 2001).
4.1.3 Thames 2003Severe flooding occurred along the River Thames in January 2003. This was caused by heavy rain falling on a saturated catchment with already swollen rivers. The flooding took place relatively soon after the June 2002 completion of the £110 m, Maidenhead, Windsor and Eton Flood Alleviation Scheme (a diversion channel named the Jubilee River), immediately upstream from the Lower Thames area. The flood alleviation scheme saved approximately 1,000 properties in Maidenhead, Eton and Windsor from being flooded but there was internal flooding affecting about 500 properties elsewhere including the downstream Lower Thames area. There was also widespread disruption to traffic and businesses. The extent of the River Thames flooding was the worst since 1947. Following the flooding, there was great public concern that the operation of the Jubilee River had exacerbated the downstream flooding. An independent Chairman was appointed to lead an investigation and report on the causes of the flooding along the River Thames (Onions, 2004) and a Strategy Study was initiated to explore the options for the Lower Thames area and in particular for the reach of Lower Thames with a narrow, confined and highly urbanised flood plain where the Lower Thames Survey was mounted (Halcrow Group Limited et al., 2005).
4.2 Flood events and experience in the surveys
The ‘Intangibles’ and ‘Warnings’ Surveys cover a wide range of flood events occurring at different times since April 1998, affecting different local communities, and evoking varied responses from the responsible organisations. The Intangibles Survey involved only river flood events. However, the kinds of rivers and event varied greatly covering slowly developing events on long rivers such as the Thames and Severn, to flash flooding in steep catchments, and very extreme rainfall events. The Intangibles Survey focused heavily upon areas affected by two major national flood events: the Easter flooding of 1998 and the floods of autumn 2000. The Warnings Survey also covered some localities affected by the autumn 2000 floods but not included in the Intangibles Survey. In addition, it included a large variety of later small fluvial events and also covered some coastal flooding and flooding that was affecting very small ‘ordinary watercourses’ for which the Environment Agency was not, at the time, responsible. The Lower Thames Study is different since it focused on a particular locality affected mainly by one specific recent event: the flooding from the Thames in January 2003. The different populations and sampling approaches used in the surveys reported here mean that those included differed in the extent to which they had experienced recent and past flooding at their current address (Table 4.1).
Table 4.1: Experience of flooding
Flood experience Intangibles Warnings Lower ThamesFlooded% (n=)
At risk% (n=) % (n=) % (n=)
Flooded above floor level in last/worst event
100 (980) 0 70 (287) 12 (24)
Number of times flooded above floor level (inc, basement or cellars) at current address since living there Never 0 (1) NA 13 (51) 88 (180)1 80 (786) NA 58 (222) 7 (15)2 13 (128) NA 11 (42) 3 (6)3 2 (21) NA 3 (130 1 (1)4 or more 5 (47) NA 13 (51) 1 (2)Number of cases 983 NA 379 204
document.doc 29/06/0733

FLOODsite Project Report Contract No:GOCE-CT-2004-505420
Flood experience has been found to be a salient variable in many studies of flood perception and response from the early 1960s (e.g. Lowenthal, 1961; Kates, 1962; White, 1973, 1974; Burton, Kates and White, 1978; Azjen, 1988; Tunstall and Fordham, 1994). There is support for an “innoculation hypothesis” and other conceptualisations that emphasise the advantage of being familiar or experienced with a stressor that is at hand (Norris and Murrell, 1988). However, Tunstall and Bossman-Aggrey (1988) reported that previous experience of flooding did not leave residents with knowledge about how to cope with a future flood, but with a feeling that there is little they can do.
Of those interviewed in the Lower Thames survey, very few respondents (24) reported being flooded above floor level in that event, and only 44 respondents reported that they had been flooded at all.
4.3 Depth and duration of the survey flood events
Flood event characteristics that may have an influence on flood impacts, and hence on people’s capacity to cope with these impacts, are depth and duration. Both the Intangibles Survey of the flooded and the Warnings Survey contained some information on the nature of the recent or worst flood event, where more than one recent event had been experienced by those surveyed. Flooding in England and Wales is generally mild by international standards and the survey data on flood depths confirm this. However Table 4.2 shows that those interviewed in the Intangibles Survey were more seriously affected in terms of flood depths than those in the Warnings Survey, with substantial minorities experiencing deep flood waters (60cms or more) in their homes.
Flooding in England and Wales is usually of relatively short duration. However, in both surveys, a majority had flood waters in their homes for at least a day. In the Warnings Survey, there were more cases in which the flood waters receded quickly, within less than 12 hours.
Table 4.2: Maximum depth of flooding and duration of flooding inside the home: Intangibles Survey and Warnings Survey
Maximum depth in the house
Intangibles survey
FloodedMaximum depth main room flooding
% (n=)
Warnings survey
Those with above floor level flooding
% (n=)
Duration of flooding
Intangibles survey
FloodedDuration of flooding in home
% (n=)
Warnings survey
Duration of above floor level flooding
% (n=)0<10 cm 12 (105) 20 (59) Less than 12 hrs 29 (274) 40 (115)10<20 cm 14 (125) 26 (75) 12< 24 hrs 18 (164) 9 (26)20<30 cm 8 (68) 12 (36) 24 hrs < 7 days 45 (417) ) 51% (146)30<60 cm 23 (205) 21 (61) 7 days or more 8 (79) )60<100 cm 26 (235) 16 (45)1 metre or more 17 (156) 5 (15)N= 894 291 N= 934 287
The Intangibles Survey of the flooded included further detailed questions because it was hypothesised that specific flood characteristics and the extent of flooding might have an influence on the health effects of flooding. These factors may be important for the analysis of vulnerability and resilience in Section 6. Thus, this survey included questions on the particular rooms affected.
document.doc 29/06/0734

FLOODsite Project Report Contract No:GOCE-CT-2004-505420
Respondents were asked ‘How quickly did the flood waters rise?’ because it was thought that the speed of onset of flooding might have had more impact on health and well being. Most respondents (64%) reported that the waters rose so quickly that you could see them rising, 16% reported waters rising slowly over many hours, 10% thought the speed was somewhere in between, and 10% did not know. Flooded respondents were also asked whether the flood waters contained sewage or other pollution, because it was hypothesised that these might add to the adverse impact of flooding on health. Most (77%) thought that the flood waters were contaminated, 15% thought they were not, and the remainder 8% did not know.
4.4 Flood risk constructions and awareness
4.4.1 Flood risk constructionsHow people construct the risk of flooding (how they perceive it) is both subjective to the individuals and groups concerned as well as influenced by the objective realities with which they live and function (see Section 1.2.3). One main hypothesis in this report is that people in low or infrequent flood risk areas will be willing to live with the risk in exchange for other benefits associated with living in an area, such as amenities, environment, social networks and so on. There is very little data on flood risk constructions across the three surveys reported here. Some perceptions of risk were a focus of the Lower Thames Survey and there is more scope for analysis there. In an earlier 1989 study of Thames residents (Tunstall and Fordham, 1994) respondents were asked what they thought was an acceptable (tolerable) level of flood risk that they were prepared to live with each and every year. A majority of the 488 sample stated that they would be prepared to live with a 1 in 200 or 100 risk of flooding and half were prepared to live with a 1 in 50 risk; the proportion prepared to accept the risk declined as the level of risk increased. However, over a fifth stated that they would be willing to accept a 1 in 5 risk each and every year; much of this was attributed to a trade-off being made between living in a highly valued environment and the flood risk. It would be interesting to know if these perceptions have since changed.
4.4.2 Flood awarenessAwareness of flood risk may be a factor affecting response to flooding. Lack of awareness of the risk may be seen as making residents more vulnerable to the impacts of flooding. All three surveys contained a question on awareness of flood risk, although the form of the questions varied significantly across the studies (Table 4.3).
Table 4.3: Awareness of flood risk: Intangibles, Warnings and Lower Thames Surveys
Flood experience Intangibles Warnings Lower Thames
Flooded% (n=)
At risk% (n=) % (n=) % (n=)
Prior awareness of the flood risk (a) (b (c) (d)
Yes 24 (238) 86 (454) 55 (225) 30 (61)
No 76 (745) 10 (50) 44 (178) 69 (142)
No answer/Don’t know - 4 (23) 1 (5) 1 (3)
N= 983 527 408 206
a) Question asked was ‘Were you aware of the flood risk in this area before you were first flooded?’b) Question asked was ‘Are you aware that this area is defined as a flood risk area?’c) Question asked was ‘Before the recent flooding, were you aware that your address is in an area at risk from flooding?’d) Question asked ‘Were you aware of the possibility of flooding when you moved to this home?’ Question was only asked of those who believed their house to be at some risk. Others are included with those not aware.
document.doc 29/06/0735
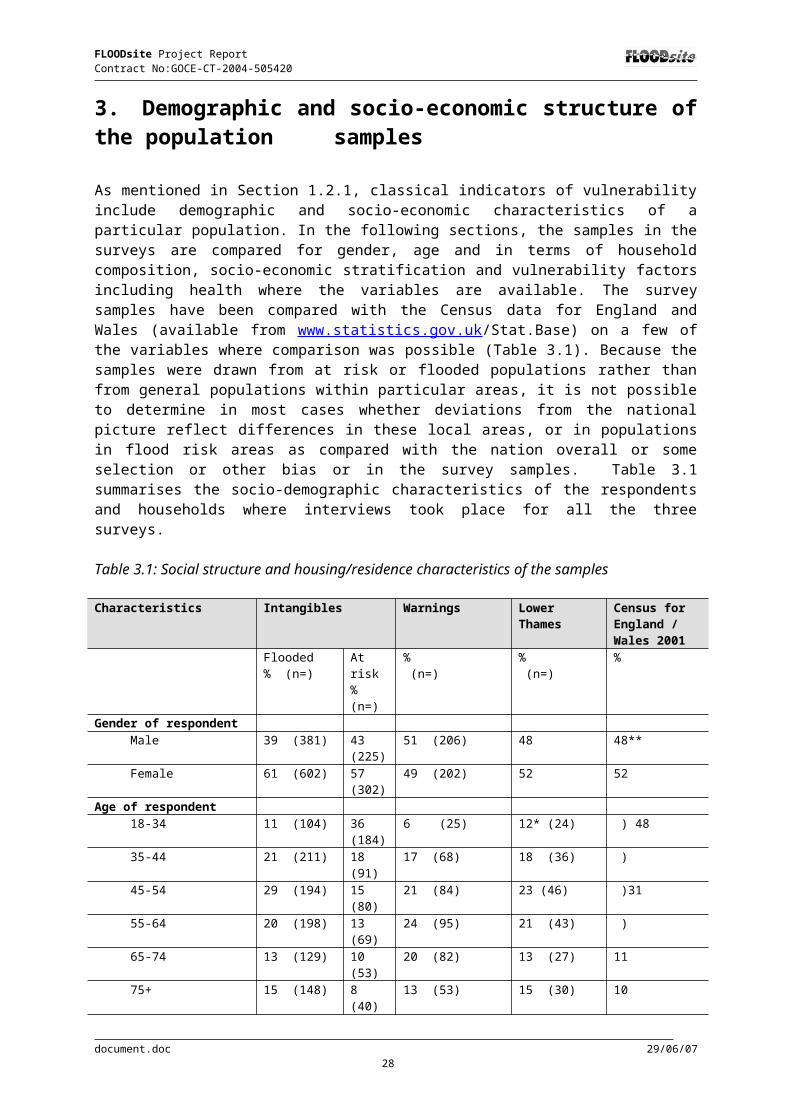
FLOODsite Project Report Contract No:GOCE-CT-2004-505420
Awareness is a difficult concept to define and measure and needs to be time bounded. The responses on awareness are very different in the different surveys, mainly because the questions asked were different. A large proportion of the respondents in the flooded sample in the Intangibles Survey were unaware of the flood risk in the area before they were first flooded. Most of them had been flooded for the first time in the recent flood.
Unlike the flooded respondents, the at risk respondents were asked about their current rather than their prior awareness of flood risk. Some of these respondents had witnessed the recent flooding in their area although they had not been flooded inside their homes. Others had moved to their current address after the recent event, but may have been informed about the flooding on moving or since living in the area. Recent Environment Agency awareness raising campaigns may have influenced current awareness of those at risk. There was variation by area among those at risk in the Intangibles Survey with 100% awareness in some areas (RPA/FHRC, 2004: 56).
Those questioned in the Warnings Survey, most of whom (70%) had experienced flooding inside their home in the most recent event, were asked about their awareness prior to that recent flooding. More of those questioned in the Warnings Survey than those flooded in the Intangibles study had been flooded more than once and that may partially account for greater awareness of flooding prior to the recent event. Certainly those who experienced one or more floods inside their homes prior to the most recent event were more likely to be aware of the risk (76% compared with 48% for those lacking flood experience).
Among flooded respondents in the Intangibles Survey, those who owned their property outright (usually older and more long-term residents) were significantly more likely to be aware than those still buying their property, and they, in turn, were more likely to have prior awareness of the flood risk than those renting or in other forms of tenure. However, in the Warnings Survey difference in awareness according to tenure was not significant. Awareness also varied according to length of residence in the Intangibles Survey, with very long term residents (30 years or more) and short term residents (less than five years) most likely to have prior knowledge. In the Warnings Survey, those resident 20 years or more were more likely than more recent residents to be aware of the risks, but the differences were not statistically significant.
Prior awareness among the flooded in the Intangibles Survey and in the Warnings Survey did not differ according to gender, age or social class. Thus, the key social variables which might be expected to have some influence on awareness do not appear to be important. The type of property occupied was also not a factor meaning that those in vulnerable housing including basement, ground floor flats and mobile homes were not more aware of the risk than those with upper floor accommodation.
In both surveys, there were significant and marked variations in prior awareness according to the specific location where the interviews took place. This suggests that the nature of the events and flood history and possibly institutional factors such as awareness raising campaigns, social networks and community preparedness are more significant factors in flood risk awareness than individual characteristics.
In the Lower Thames Survey, the question about prior awareness was only asked of those who thought that there was some likelihood of their property flooding in the next five or 50 years at the time of the interview. Those who did not think so have been included with those with no awareness of the possibility of flooding when they moved to their home. The responses did not vary according to gender. There were significant differences according to age but they did not show a consistent trend or pattern. There were significant differences in prior awareness by social grade when those in the highest social grade groups were compared with the rest. Among the AB groups 40% claimed that they knew of the flood risk when they moved; for the other groups the proportion was only 26%. The AB social groups were no more likely to be river bank residents than other social grades and, perhaps surprisingly, also those who lived on the river bank were no more likely to have prior awareness of the flood risk than those living at a greater distance from the river in the Lower Thames Survey. Length
document.doc 29/06/0736

FLOODsite Project Report Contract No:GOCE-CT-2004-505420
of residence did not emerge as a significant factor in prior awareness among Lower Thames residents. There were no significant differences in awareness according to tenure. There were too few tenants for meaningful analysis and those buying their property were more aware than those owning it outright.
4.4.3 Flood risk constructions: the Lower Thames SurveyIn the Lower Thames Survey, issues of flood risk perception were examined for a population living in an area with an approximately 1 in 50 risk of flooding, but in which the experience of flooding was limited. Respondents were asked a very general question about risk: ‘From what you know or have heard, how much if at all is your home at risk of flooding?’ Only 6% rated their property as ‘a great deal at risk’, 34% rated the risk as ‘a fair amount’, and the majority (53%) thought the risk ‘not very much’. Questioned in these very general terms, there were no significant differences in responses by gender, age, social class, length of residence and tenure. Respondents did differ significantly according to whether or not they had been flooded in some way at some time at the address (chi-square; p=0.001) with twice as many of the small group (44) who had some experience reporting their home to be ‘a great deal’ or a ‘fair amount’ at risk from flooding (68% compared with 33%). There were some significant differences according to whether or not respondents lived on the river bank and these tended to show river bank residents judging their property to be less at risk in general terms than non-residents (chi-square;p<0.01).
Likelihood of floodingWhen a time period was associated with the flood risk, nearly a quarter of respondents who had experienced flooding thought that it was likely or certain that they would be flooded in the next five years. When asked about the flood risk to their home over the next fifty years, nearly half thought flooding to be likely or certain. Again, there were significant differences between those with some flood experience not necessarily of flooding inside the home and the non-flooded in this survey. The small group of residents (44) whose property had been flooded in some way at some time thought future flooding more likely than those lacking that experience. More than half of the flooded Lower Thames respondents (24) said that they were very or fairly likely to be flooded in the next five years. When asked about the possibility of flooding in the next 50 years, 57% (25) of flooded respondents thought that it was either fairly or very likely that they would be flooded, and the remaining 43% (19) thought it was certain that they would be flooded. Significant proportions of those without flood experience did not know what to answer particularly in the longer term. (Tables 4.4 and 4.5).
There were no significant differences in the flood risk perceptions of men and women in the Lower Thames nor were there significant differences according to social grade and length of residence. The significant differences that were found for age and tenure seemed mainly to lie in the proportions unable to give an answer, which were higher for the 65 age groups and the very small number of tenants. It appears, therefore, that while residents surveyed acknowledge a level of risk, for most of those without flood experience, the level was not associated with an immediate risk to their homes.
Table 4.4: Perception of likelihood of future flooding in next 5 years
“How likely or unlikely do you think it is that your home will be flooded in the next 5 years?”
Lower Thames Sample% (n=)
Lower Thames flooded*% (n=)
Lower Thames not flooded*% (n=)
Certain to be flooded (+1) 2 (5) 9 (4) 1 (1)Very likely to be flooded (+2) 9 (18) 25 (11) 4 (7)Fairly likely to be flooded (+3) 14 (28) 29 (13) 9 (15)Fairly unlikely to be flooded (+4) 38 (78) 23 (10) 42 (68)Very unlikely to be flooded (+5) 26 (53) 7 (3) 31 (50)Certain not to be flooded (+6) 4 (8) 0 5 (8)Don't know 8 (16) 7 (3) 8 (13)
N= 206 44 162*Chi-square; p< 0.001
document.doc 29/06/0737
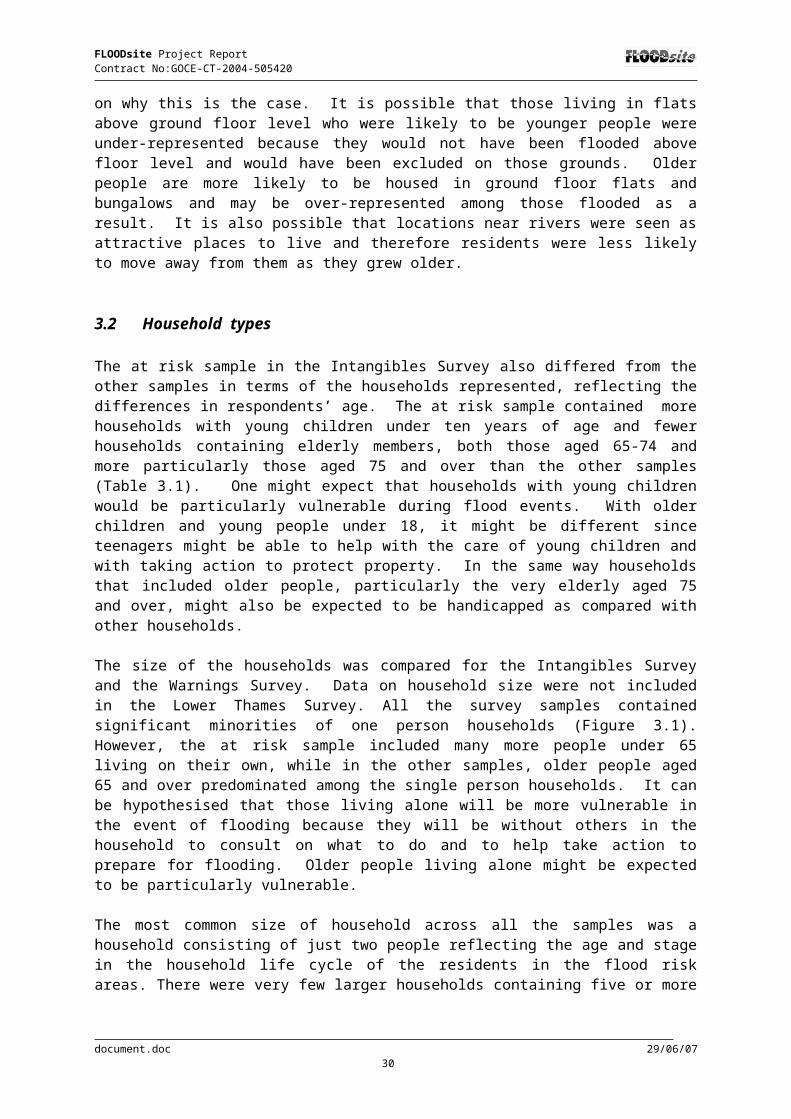
FLOODsite Project Report Contract No:GOCE-CT-2004-505420
Table 4.5: Perception of likelihood of future flooding in next 50 years
“How likely or unlikely do you think it is that your home will be flooded in the next 50 years?”
Lower Thames Sample% (n=)
Lower Thames flooded*% (n=)
Lower Thames not flooded*% (n=)
Certain to be flooded (+1) 15 (32) 43 (19) 8 (13)Very likely to be flooded (+2) 13 (27) 34 (15) 7 (12)Fairly likely to be flooded (+3) 23 (48) 23 (10) 23 (38)Fairly unlikely to be flooded (+4) 19 (39) - 24 (39)Very unlikely to be flooded (+5) 7 (14) - 9 (14)Certain not to be flooded (+6) 2 (4) - 2 (4)Don't know 20 (42) - 26 (42)N= 206 44 162
*Chi-square p< 0.001
River bank location was a significant factor in risk construction. There were significant (chi-square; p<0.01) if not very marked differences in the way the small category (70) of those whose property was immediately on the river bank (i.e where there were no properties between them and the river) and those who lived further away constructed the risk. The river bank residents were more likely to view the risk of their property being flooded in the next five years as certain or very likely compared with non-river bank residents (15% compared with 9%) and less likely to think that flooding in that time period was very unlikely or certain not to happen (24% compared with 32%). The way riverbank residents viewed the likelihood of flooding at their property in the longer term, over the next 50 years, also varied significantly (chi-square; p<0.001). Riverbank residents were more likely than non-river bank residents to consider flooding of their property within the next 50 years as very likely or certain (34% compared with 26%). However there were more riverbank residents who did not know (27% compared with 17%) and little difference in the proportions thinking that there was certain to be no flooding of their property over the next 50 years or that flooding in that time period was very unlikely.
Sources of information about flood riskIn the Lower Thames Survey, respondents who believed that their property was at some risk (those who thought their property was certain, very or fairly likely to be flooded in the next five or 50 years), were asked ‘How did you first find out about the risk of flooding to your home?’ The responses are shown in Table 4.6.
Table 4.6: Sources of information about flood risk: Lower Thames Survey
Source of information %
I have been flooded 39Its just obvious 14Told by local residents 11Environment Agency letter 8Neighbours have been flooded 6Media 6Solicitors search 6Environment Agency website 4Local paper 3Local Council 2Water Company 2Other Live near a river/area Garden/road flooded Insurance application Flood warning
3613932
document.doc 29/06/0738
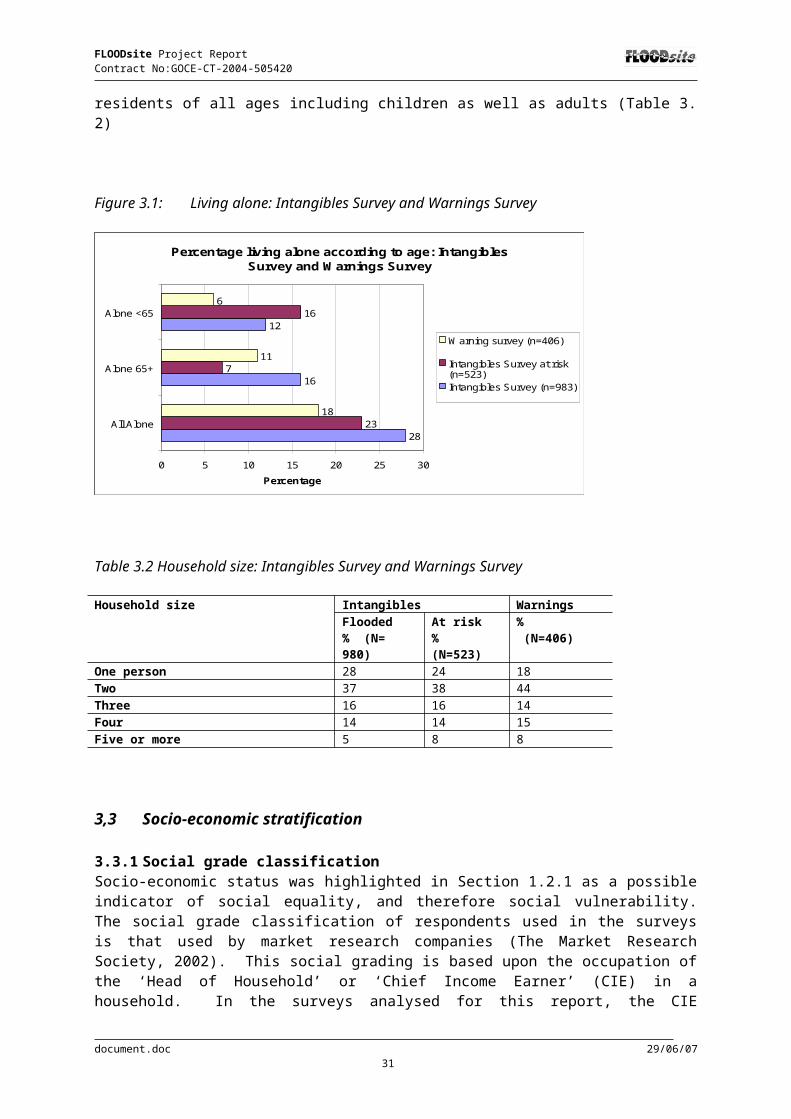
FLOODsite Project Report Contract No:GOCE-CT-2004-505420
N= 112
What is striking in these responses is the extent to which respondents drew on their own experience and judgement or on other informal sources such as neighbours rather than on formal sources such as the Environment Agency’s letters, website or flood warnings, the local council, water companies and solicitors’ searches. When properties are bought and sold in England and Wales, part of the normal legal process is a solicitors’ search on behalf of a potential buyer of legal documents relating to the property and this should include enquiries to check with the Environment Agency and local authority as to whether there is any history of flooding or evidence of flood risk at the property. In the Lower Thames Survey this legal mechanism did not appear to be an important source of flood risk information. Currently, a seller is under no obligation to reveal a known flood risk although under proposed new legislation (to require sellers of property to provide a Home Information Pack - a set of standard information about the property) this might change.
In the Lower Thames, those who believed their home to be at some risk of flooding either in the five year period or in the 50 year period, were asked ‘Do you think you would have moved to the area if you had known about the possibility of flooding?’ All those with awareness of the flood risk prior to moving, responded positively. Of the small group (48) who were not aware when they moved to their home, the majority 58% said they would have moved had they known of the risk, 21% would not have moved and the same proportion did not know. Overall, 81% of those with some current awareness of the risk stated that they would have moved even if they had known of the risk and only 10% would not have moved. For respondents having at some time had some experience of flooding (not necessarily inside the home), living on the river bank and social class did not have any influence on the decision to move despite the flood risk. These findings can be taken as illustrating the strong pull of the amenity of living in the Lower Thames area balanced against their limited knowledge of the risk of flooding and also their limited experience and thence, possibly, their poor understanding of the impacts that flooding would have on their lives and property (McCarthy et al 2006).
4.4.4 Flood warnings Another factor which may affect the level of flood impacts and hence respondents’ coping capacity are flood warnings.
Flood warnings authoritiesIn England and Wales the Environment Agency has (since 1996) had responsibility for issuing flood warnings, a responsibility previously exercised mainly by the police. The Agency is also (along with the emergency services and local authorities) a Category 1 responder under the Civil Contingencies Act (2004) providing civil protection during an emergency situation, such as a flood event. The flood warnings issued by the EA only apply to river, tidal, and coastal flooding, and not to flooding from other causes such as surface water, sewers and drains (although this is currently being considered). The main warning dissemination methods currently in use in England and Wales are: automatic voice messaging systems (AVM, now Floodline Warnings Direct or FWD) using land-line and mobile telephones, faxes, sirens, loudspeakers, face-to-face door knocking, written communication, flood wardens, TV weather reports, teletex and radio. Other methods soon to be available include SMS texts to mobile telephones and digital broadcasting.
As part of their role as Category 1 Responders under the Civil Contingencies Act, Local Authorities also have responsibility for providing an immediate response to care for flood-affected populations, including the provision of emergency care, feeding, accommodation and welfare of evacuees. They also have the most responsibility following flooding in assisting local communities during the recovery phase.
Receipt of flood warningsIn September 1996, prior to all the surveys and flood events analysed for this report, the EA took over lead responsibility for disseminating flood warnings to the public. When the flooding occurred in Easter 1998, the Agency had only just begun to make improvements to the warning system and its
document.doc 29/06/0739
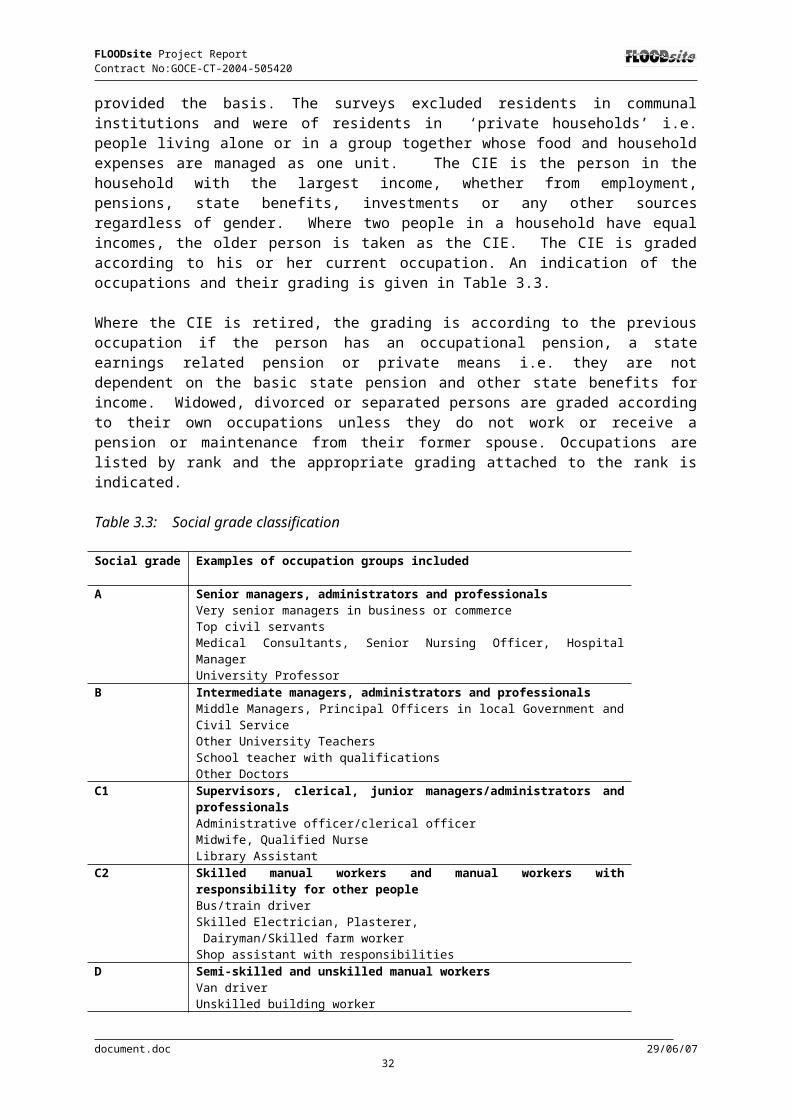
FLOODsite Project Report Contract No:GOCE-CT-2004-505420
failure to provide warnings to many of those affected by that event was severely criticised (Bye and Horner, 1998). Since that time, the EA has focused attention on enhancing its flood forecasting, and especially its warning systems. It has expanded its ability to deliver warning messages directly to the public: first through its AVM system, and since early 2006 through Floodline Warnings Direct, a national automatic telephone warning system with greatly increased capacity to deliver warning messages (Andryszewski et al., 2005). The Agency offers different levels of service to different areas according to the level of risk, from a maximum of direct warning to properties, to a minimum in which only the media and professional partners such as the local authority and emergency services are used to broadcast warnings, with an intermediate category in which sirens or loudhailers are used in the community. Flood warnings are provided by the EA to known areas of flood risk but flooding can occur in areas where no flood warning dissemination service is provided. For some events such as those affecting very small watercourses and very extreme events, no warning service is provided.
The surveys included in this report cover flood events occurring over the period in which the Agency has been active in improving its forecasting and warnings service. All the surveys provide some evidence on the receipt of warnings. In the surveys, respondents were left to define what constituted a warning and their responses cover warnings deriving directly from official sources, informal warnings and indeed their own experience and judgement. The data show that informal sources of warning such as family, friends and neighbours were an important source of warning. These warnings may serve to amplify, supplement or indeed compete with formal systems (Parker and Handmer, 1998) (Table 4.7).
Table 4.7: Flood warnings received
Flood Warning Intangibles: flooded (a)
Warnings(b)
Lower Thames (c)
% (n=) % (n=) % (n=)
Warning received 23 (229) 37 (149) 53 (110)No warning received/received too late 73 (717) 62 (251 47 (96)Don’t know/no answer 4 (37) 2 (8)
N= 983 408
Warning lead time: those receiving a warning and aware of lead time
Under 2 hours 21 (41) 18 (22) NA2 < 4 hours 18 (35) 7 (9) NA4 < 8 hours 23 (45) 16 (19) NA8 hours or more 39 (78) 59 (72) NA
N= 187 122 NA
Sources of warning (d) (d) (d)EA automatic voice message (AVM)/ recorded telephone message from EA
22 (51) 42 (63) 14
Environment Agency Floodline 11 (26) 3 (5) 15Personnel/telephone call from/to EA 18 (42) 11 (16) 17Emergency services (Fire/Police/Ambulance) 16 (37) Police 3 (5) 4 Fire brigade 1 (1) 1Local authority 6 (13) 3 (5) 21Neighbour 18 (40) ) 24 (35) )18Family/friend 5 (12) ) )Media (TV/Radio) 8 (19) Radio broadcast - 5 (8) 6 TV announcement - 2 (3) 13Flood warden NA 14 (21) 4Personal observation NA 17 (25) 13Other 8 (19) 11 (16) 33N= 229 149 110
document.doc 29/06/0740

FLOODsite Project Report Contract No:GOCE-CT-2004-505420
(a) Respondents were asked ‘Did you receive a warning from any source before the flood (most recent/worst flood)?(b) Respondents were asked about a warning received in the most recent/worst flood.(c) Respondents were asked: ‘Have you ever received a warning from any source, even if you haven’t been flooded?’ (d) Respondents were able to name more than one source of warning received in the worst/recent flood.
The data suggest that there may have been some improvement in flood warning dissemination over time. In the Intangibles Survey, only 10% of residents flooded in 1998 reported receiving a warning; for 1999 and 2000, the proportions were 29% and 28% respectively. The Warnings Survey, however, does not provide evidence to confirm an improving trend since those interviewed in the first Phase of this survey who had been affected by flooding in 2003/4 were no more likely to have received a warning than those affected by earlier events covered in Phase 2 (32% warned in Phase 1 compared with 41% in Phase 2). A key finding from the surveys analysed here and from the research undertaken for the Environment Agency (Tunstall et al., 2005) is that despite investment in improvements to warning systems, it is still only a minority of residents (rarely more than 40%) who receive a flood warning of any kind.
The data from both the Intangibles and the Warnings Surveys also indicate that the receipt of a warning is very area and event specific. For example, in the Intangibles Survey there were ten locations in which no one reported receiving a warning. These included Banbury, flooded in the Easter 1998 event, and Waltham Abbey, flooded in autumn 2000. In five locations, a majority of residents were warned (RPA/FHRC, 2004). A similar pattern of wide variations in the receipt of warnings according to location was observed in the Warnings Survey (Tunstall et al., 2005).
4.4.5 Who receives a warning?The Environment Agency’s AVM system (now Floodline Warnings Direct) has become the main method by which residents in England and Wales are warned. The growth in importance of the AVM (now FWD) system may be reflected in the sources of warning found in the Intangibles and the Warnings data sets, since the Warnings Survey was focused on more recent flood events than the Intangibles study (Table 4.6). In the current ‘opt-in’ system residents have to take action to register their household on the system in order to receive warnings in this way, although an ‘opt-out’ system is currently being considered whereby residents will automatically be registered on the system unless they request otherwise.
In the Warnings Survey, being registered on the AVM system was found to be the main factor associated with receiving a warning. Overall, 51% of respondents who answered the question in the survey were registered on the system at the time of the survey. This proportion includes some who signed on to the system after the most recent flood. All registered residents were twice as likely to have received a warning as those not registered (48% compared with 24%). In Phase 2 of the Warnings Survey, a distinction was made between those registered at the time of the flood event (only 28% of Phase 2 respondents) and those who registered afterwards (24%). In this Phase, three-quarters (76%) of those registered, compared with only one-third (27%) of those not on the system at the time of the flood, received a warning. The interesting question then is who registers to receive the AVM/FWD and why do they do so? These questions are examined in Section 5.2.1 on preparedness.
Other factors were found to be associated with receiving a warning in the analysis of the Warning Survey data (Tunstall et al., 2005). Although the association between length of residence and the receipt of a warning was not strong, more long term (those resident 20 years or more) than recent residents had received some kind of warning. This did not appear to be due to the long term residents being more likely to be signed up to the AVM system. It may be because long term residents have greater experience and awareness of the flood risk. Certainly, those residents who reported that they were aware of the flood risk prior to the recent flooding were significantly more likely to have received a warning than those unaware (47% compared with 23%). Again this did not appear to be simply due to a higher proportion of those with prior awareness being registered on the AVM. Not
document.doc 29/06/0741
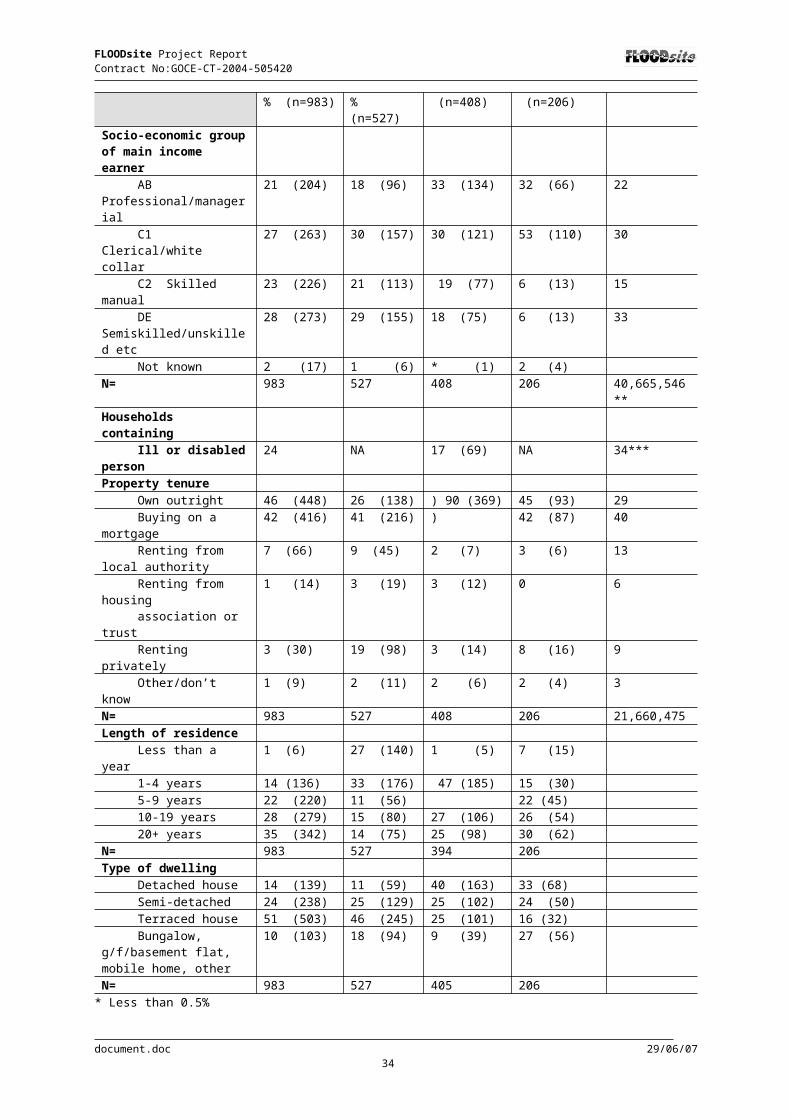
FLOODsite Project Report Contract No:GOCE-CT-2004-505420
surprisingly, those with prior experience of flooding inside their homes above floor level were not only more likely to have been registered on the AVM at the time of the recent flood, but also to have received a warning. The proportion receiving a warning was 54% for those with some past experience of in-house flooding, compared with 29% for those flooded in their house for the first time.
In the Warnings data set, there was no evidence of warnings being targeted at those most at risk and thence most affected. Those who had flood waters inside their homes were no more likely to have received a warning than those less seriously affected.
New analyses of the Intangibles data set have been undertaken to see whether this data set, which contains a larger number (albeit a smaller proportion) of respondents who actually received a flood warning, can throw further light on the factors affecting receipt of a warning. The nature of the flood event can make a difference to the possibility of forecasting and issuing timely warnings. Indeed, some events such as the flooding in Boscastle in 2004 (Environment Agency, 2005), are regarded as extremely difficult to predict with current science and technology. In the Intangibles Survey, respondents were asked a question that was not included in the Warnings Survey: ‘How quickly did the floodwaters rise’? Their perceptions of the speed of onset of the flooding were associated with the receipt of a flood warning and with the length of warning lead time. Those who reported the waters rising quickly were less likely to have received a warning and have a shorter warning time than those who judged their flood to be slower in its onset (Table 4.8).
Table 4.8: Receipt of a warning and warning lead time according to the perceived speed of onset of flooding. Intangibles Survey (RPA et al., 2004)
Receipt of warning Waters rose quickly
Speed of onset in between
Waters rose slowly
All respondents
% warned 17 37 51 23*Warning lead time: those in receipt of a warning and aware of the warning lead time % Under 2 hours 34 16 5 212 hours< 4 hours 25 19 8 184 hours < 8 hours 19 29 22 228 hours or more 21 36 66 39Number of cases 91 31 65 187**
* Chi square; p< 0.001**Chi square : p< 0.001
All the respondents in the Intangibles Survey had flood waters inside their homes. However, there was some variation in the extent to which their properties were affected. There were four types of main parts or rooms affected by flood waters: living rooms, bedrooms, kitchens and bathrooms - all taken as a measure of the extent of flooding. A majority in this survey had had two parts affected, usually the kitchen and the living room, since most of the properties were houses on two floors. However, there were some respondents who did not have any main rooms affected because the flood waters only entered other parts such as hall ways, cellars or basements. It was found that those more seriously affected were more likely to have received a flood warning than those with fewer main parts of their home affected. In addition, there was an association between depth of flooding and receipt of a warning (Figures 4.1 and 4.2).
This is surprising since the Environment Agency is not able in most areas to target its warnings specifically at the properties most at risk. It may be that:
those properties that have flooded before, and are most at risk, are known to the warning authorities; or
people resident in such properties have taken steps to ensure that they are registered to receive warnings; or
people resident in such properties have taken steps to contact the warning authorities themselves as flooding threatened.
document.doc 29/06/0742
FLOODsite Project Report Contract No:GOCE-CT-2004-505420
Figure 4.1: Receipt of a flood warning by number of main rooms flooded: Intangibles Survey
Percentage in receipt of a flood warning in the recent/worst flood by number of main rooms flooded
13
25
3128
17
02468
10121416182022242628303234
None (n=78) One (n=80) Two (n=531) Three (n=157) Four (n=100)
Number of main rooms flooded
Perc
enta
ge
Chi square; p< 0.05
Figure 4.2: Receipt of a flood warning by depth of main room flooding: Intangibles Survey
Percentage in receipt of a flood warning in the recent/worst flood event by maximum depth of main room flooding:
Intangibles Survey
2326
21
37
23
0
5
10
15
20
25
30
35
40
1 < 10cms (n=98)
10 < 30cms(n=184)
30 < 60cms(n=196)
60 < 100cms(n=230)
1 metre or more(n=153)
Maximum depth of main room flooding
Perc
enta
ge
Chi square; p<0.01
Certainly, in the Intangibles Survey (as in the Warnings Survey), those who were aware i.e. who reported that they were aware of the flood risk in the area before they were first flooded, were more likely to have received a flood warning than those unaware (39% compared with 20%). Most of those interviewed in the Intangibles Survey (80%) had never before been flooded inside their home at their current address. Those that had previous experience of such flooding (mainly of one earlier flood inside their home) were significantly more likely to have received a flood warning than those experiencing flooding for the first time in the recent or last event (31% compared with 23%).
The social characteristics of those receiving a flood warning in the two surveys were examined to see whether any common factors could be identified. In both surveys some differences were found according to social grade. These differences depended in part on the social grade groupings used. However, significant differences were noted, in both data sets, with the categorisation used in Figure 4.3. In the Warnings Survey both the skilled, semi-skilled and unskilled worker categories were less
document.doc 29/06/0743

FLOODsite Project Report Contract No:GOCE-CT-2004-505420
likely to have received a warning. In the Intangibles Survey, the lowest social grade was the only one to be markedly different.
There was some evidence of differences in the receipt of a warning according to tenure. In the Warnings Survey, more owner-occupiers than those renting property were warned (39% compared with 23%). However, differences were not statistically significant and the number of respondents renting property (39) was very small. In the Intangibles Survey, both those owning and buying their properties were more likely to have received a warning than those in other tenure groups, a substantial number (115) in this survey. The proportions were 23% and 26% respectively for those owning and buying and 13% for those in the other tenure groups. It is not possible to establish whether these differences were due to variations in service provision to different neighbourhoods and groups or to differences in the extent to which residents are proactive in accessing services.
No other differences were found in the two data sets in the receipt of warnings according to other social characteristics. Households that are vulnerable in terms of age, disability or ill health of their members, and those living alone and households with children under the age of ten, were no more likely to have received a warning than less vulnerable households. As yet, the Environment Agency’s formal warning systems generally are not able to differentiate and prioritise particularly vulnerable households, although this may be done in certain locations and circumstances, for example, where flood wardens or informal warnings systems and active neighbourhood networks operate.
Figure 4.3: Receipt of a flood warning by social grade
Percentage in receipt of a flood warning in the recent/worst flood event by social grade
23
3025
16
40
46
26 28
05
101520253035404550
Perc
enta
ge
Intangibles SurveyWarnings Survey
Warnings Survey: Chi square; p<0.05Intangibles Survey: Chi square; p< 0.01
4.4.6 Reliance on authorities for warnings: Lower Thames SurveyFHRC research on flood warning systems over the years has examined the issue of the extent to which those at risk from flooding rely upon official warning systems in making decisions at the time of flooding. For example, a 1986-7 study in the Upper Severn, Upper Trent and Avon Catchments (Neal and Parker, 1989) showed that farmers in all the catchments were more used to coping with flooding and were less reliant upon warnings systems than those in commercial property and that residents were most reliant on official warnings.
In a survey of residents affected by flooding along the River Thames in 1990, respondents were asked about their ‘need’ for an official warning (Tunstall, 1992). More than half (60%) felt that they needed an official warning, while a third (34%) were prepared to rely upon their own judgement, for the rest it depended upon the circumstances. Responses varied according to area, with residents in rural settlements reporting less need for an official warning than those in urban areas such as Guildford,
document.doc 29/06/0744

FLOODsite Project Report Contract No:GOCE-CT-2004-505420
Woking and Purley. Lack of experience of, and connection with, urban rivers, population mobility and thence lack of community memory of flooding may contribute to the greater reliance on official warning systems in urban areas. The perceived need for an official warning did not differ markedly according to the extent to which the residents in the survey were affected by the recent flood event nor according to whether or not residents had received an official warning although those who had been warned saw more need for an official warning than those not warned. These data are old and public expectations of warning services as well as their provision may have changed markedly in the intervening period.
In the Lower Thames Survey, respondents were asked “How much if at all, do you currently rely on the authorities or your own judgement of when the River Thames is going to flood?”. Only 10% reported that they ‘completely rely on the authorities’, 20% said that they ‘mainly rely on the authorities’, for the largest group (35%) the response was ‘about half and half’, a quarter (26%) ‘mainly rely on their own judgement’ and for very few (7%) the response was ‘completely rely on their own judgement (McCarthy et al., 2006). The Lower Thames area surveyed is an urban area but one with a fairly stable population in which a substantial minority live close by the river and may have knowledge of its behaviour. Furthermore, residents in focus groups pointed out that flood warnings for the area are issued in general terms for large reaches of the river and provide only a very general indication of what may happen on a particular section of the river, obliging residents to exercise some further judgement of their own.
4.5 Summary
The data sets covered a very large number of floods with different characteristics (slow onset river floods, flash flooding in steep catchments, and extreme rainfall events), in different locations, and invoking different responses from the responsible organisations. It was hypothesised that specific flood characteristics and the extent of flooding might have an influence on the health effects of flooding and that these factors may be important for the analysis of vulnerability and resilience in Section 6. Those interviewed in the Intangibles Survey were more seriously affected in terms of flood depths than those in the Warnings Survey, with substantial minorities experiencing deep flood waters in their homes. In both surveys, a majority had flood waters in their homes for at least a day. It was also hypothesised that contaminants might add to the adverse impact of flooding on health, and three quarters of Intangibles flooded sample reported the flood waters being contaminated.
Awareness of flood risk may be a factor affecting response to flooding. Prior awareness was reported as highest among the Intangibles at risk sample (86%), followed by the Warnings sample (55%), the Lower Thames sample (30%) and finally the Intangibles flooded sample (24%). However, the questions asked about awareness were different in the different surveys and this may account for the variations. Prior flood experience, tenure and length of residence were significant factors affecting awareness in some of the data sets. Those who had experienced floods inside their homes prior to the most recent event were more likely to be aware of the risk. Those who owned their property outright (usually older and more long-term residents) were significantly more likely to be aware than those still buying their property, and they, in turn, were more likely to have prior awareness of the flood risk than those renting or in other forms of tenure. Awareness differed with length of residence with longer term residents most likely to have prior knowledge of flood risk. The key social variables (gender, age and social grade) which might be expected to have some influence on awareness do not appear to be important. However, there were significant and marked variations in prior awareness according to the specific location and context of where the interviews took place. There is very little data on flood risk constructions across the three surveys. However, some perceptions of risk were a focus of the Lower Thames Survey and were analysed. Results showed that prior awareness of risk appeared higher among those in higher social grade groups. The risk of future flooding was perceived as higher among the flooded rather than non-flooded. It appears, therefore, that while residents in the area surveyed acknowledge a level of risk, for most of those without flood
document.doc 29/06/0745

FLOODsite Project Report Contract No:GOCE-CT-2004-505420
experience, the level was not associated with an immediate risk to their homes. It was striking that respondents drew on their own experience and judgement or on other informal sources such as neighbours to a large extent rather than on formal sources of information.
River bank location was also a significant factor in risk construction in the Lower Thames, with significant differences in the way those whose property was immediately on the river bank and those who lived further away constructed the risk. The river bank residents were more likely to view the risk of their property being flooded in the future as certain or very likely compared with non-river bank residents. Overall, 81% of those with some current awareness of the risk stated that they would have moved to the area even if they had known of the risk, illustrating the strong attraction of living in the Lower Thames area balanced against the limited knowledge of the risk of flooding and also limited experience and thence possibly poor understanding of the impacts of flooding.
A flood warning had been received at some time in the past by 53% of Lower Thames respondents Only 37% of Warnings respondents and 23% of flooded Intangibles respondents had received a warning in a recent flood event. Those more seriously affected were more likely to have received a flood warning than those with fewer main parts of their home affected, with an association between depth of flooding and receipt of a warning. Moreover, those owning their properties were more likely to have received a warning than those in other tenure groups. For Lower Thames respondents, reliance on warnings was more equally divided between formal and informal sources. In the Lower Thames area as in other parts of the country flood warnings are issued in general terms for large reaches of the river and provide only a very general indication of what may happen on a particular section of the river, thus obliging residents to exercise some further judgement. A key finding is that despite investment in improvements to warning systems, still only a minority of residents receive an official flood warning of any kind. Data from both the Intangibles and the Warnings Surveys also indicate that the receipt of a warning is very area and event specific.
The Environment Agency’s automatic voice messaging (AVM and now FWD) systems are becoming the main source of warnings, whilst unofficial warnings from neighbours, friends and relatives still feature significantly. The location and thence the nature of the flood event and the level and type of warning service available, are the key factors in variations in warning dissemination. Whether or not residents have registered on the automatic voice messaging system is very important and their prior awareness of the flood risk and their past experience of flooding are other factors. Lower social grades and those renting properties appear to be less likely to receive warnings, and vulnerable households appear at present to be no more likely than others to be warned.
Therefore, the data help to illustrate people’s experience of flooding and how their perceptions or constructions of flood risk may be influenced by a number of factors, such as flood event or dwelling type characteristics, organisation or institutional responses to the event and the characteristics and resources of the population affected. These factors may result in individuals and households being more or less vulnerable to the threat and extent of flooding and may affect their ability to recover.
document.doc 29/06/0746
FLOODsite Project Report Contract No:GOCE-CT-2004-505420
5. Human behaviour before, during and after a flood
People’s behaviour before, during and after a flood will be driven by a number of factors such as the flood event itself and individual or household characteristics. These factors will influence the levels of social vulnerability relating to capacity to cope with and recover from a flood event. Evidence of people’s behaviour examined in this section includes:
before the flood event: undertaking preventative measures including insurance; during the event: actions undertaken to minimise the effects of the flood event on the
household (e.g. move furniture upstairs); and after the event: evacuation, undertaking preventative measures for future events.
In many cases, what happens after a flood can have a worse effect than the event itself. Other factors can also help reduce or increase the effects of a flood. These include:
resources: income, car ownership, insurance, education; social support: help, social capital; and intervening factors: problems with builders and insurers, evacuation.
In addition to the above factors, drivers or explanatory factors for people’s behaviour may include:
length of residence, prior flood experience, awareness of flood risk, the event characteristics including the receipt of a warning, people’s characteristics, community support
5.1 Drivers of human behaviour before, during and after a flood
The actions that people take during a flood, such as moving furniture or valuable items, will depend to an extent on receiving a flood warning and also on the length of the warning. But with or without warnings, other variables such as having previous experience of flooding and how people construct flood risk (discussed in Section 4) may influence people’s behaviour. People who have prior experience or awareness of flooding will be more likely to know which actions to take or how to obtain help. Personal and household characteristics such as age, presence of children, number of people in the household, and disability are also likely to affect these actions.
Whether respondents or a member of their household left the home after the flood, the length of the evacuation, the time to get back to normal are examples of variables that will show aspects of people’s behaviour after the event. We can hypothesise that these actions will be determined by the characteristics and extent of the flood, i.e. large depths will cause more damages to the property and be the main cause of an evacuation. The type of property will also be key, as people living in ‘vulnerable’ housing will find living in their homes more difficult. The characteristics of the household members, i.e. age, health problems, presence of children, etc., are also likely to influence the decision to evacuate the home.
Preventative measures such as taking out insurance against flooding, keeping sandbags in the property, not buying expensive furniture for ground level rooms or avoiding keeping valuable or irreplaceable objects on the ground floor, can be undertaken before a flood occurs in which case they will be determined by the awareness of the risk or prior flooding experience. These measures can also be undertaken after an event in preparation for future flooding. Again, having experienced a flood will be the main driver for undertaking these sorts of measures as well as being worried about the possibility and consequences of a future event. These drivers of behaviour are discussed in the following sections.
document.doc 29/06/0747

FLOODsite Project Report Contract No:GOCE-CT-2004-505420
5.2 Flood preparedness and preventative actions
This section addresses the issue of the actions taken by residents in flood risk areas in advance of flood events such as registering on the AVM and obtaining insurance cover, and examines the drivers for taking preventative action. It draws mainly on the Warnings data set which included a number of questions on preparedness, some of which were only included in Phase 2 of the survey. The Intangibles data set only provides responses on insurance.
5.2.1 Automatic Voice Messaging system (AVM)A key preparatory action that those in flood risk areas in England and Wales can take is to register with the Environment Agency to receive flood warning messages via the Agency’s national automatic voice messaging (AVM) system Floodline Warnings Direct. Prior to the national system, which has only recently become active, property owners in flood risk areas were recruited to the warning system by staff in the Agency’s various area offices and there were variations in the methods and success of local recruitment.
Questions about registering on the AVM were only asked in the Warnings Survey. In Phase 1 of the Warnings Survey, information was collected on those people on the AVM system at the time of the interview. In Phase 2 on the other hand, the questions differentiated between those on the system at the time of the last/worst flood and those who had registered since then. Only 28% (70) of the 278 residents interviewed in Phase 2 had taken the precaution of signing up to register on the AVM system before the recent/worst flood. Among this group, those who had experienced more than the one flood inside at their current address were more likely to have registered than those only affected once (39% compared with 21%). Those who reported that they were aware of the flood risk before the recent flooding were also significantly more likely be on the AVM system than those unaware (37% compared with 18%).
There were no differences in the AVM take up in relation to length of residence, age, tenure, social grade or income. Thus, flood risk awareness and experience were the only variables considered that accounted for registration before the last/worst flood in the Warnings Survey. Other reasons, which were not possible to examine in the research, have been suggested for the failure of those in flood risk areas to sign on to receive warnings:
a reluctance to mark property as ‘at risk’ for fear of an effect on the property’s value; a belief that the flood risk at the property is low; a reluctance to accept the disturbance of warning messages, some of which might be received
at night, and may not always result in flooding; and lack of knowledge that the system is available in an area.
Phase 2 of the Warnings Survey shows the importance of the experience of flooding in overcoming inertia or reluctance to sign onto the system. As many as 24% (60 households) signed up for the AVM after the flood and only three households that were on the system at the time of the last/worst flood left the system. Thus at the time of the interview, a majority (52%) of those interviewed were on the system. There were few other factors that appeared to explain why some residents decided to register whilst others did not. There were no differences in AVM uptake according to social grade, tenure, age, length of residence, and living in vulnerable housing. Although there were significant variations in uptake with household income, there was no pattern to the variation. There was no relationship between depth of flooding experienced inside the home and signing onto the AVM. The least affected, i.e. those who had not even had flood waters in their garden, were less likely to have signed onto the AVM than those who had had gardens flooded (9% compared with 26%). Whether or not residents had had other parts of their property flooded, however, did not make any difference to uptake.
document.doc 29/06/0748

FLOODsite Project Report Contract No:GOCE-CT-2004-505420
5.2.2 Insurance
Insurance and compensation (relief funds)Residents in flood risk areas can prepare in advance for flooding by taking out insurance to cover damage to the building structure and to the contents of their property. Such insurance, rather than government or other compensation or relief schemes, has since the early 1960s provided the main mechanism by which flood victims in England and Wales are compensated for damage to their property (Arnell, Clark and Gurnell, 1984). Flood insurance has been provided routinely through the competitive insurance market as part of ordinary household insurance. Flooding is a standard feature in policies for properties in flood risk areas with annual probabilities of 1 in 75 or greater. However, since the flood events of 1998 and autumn 2000, the Association of British Insurers (ABI - the organisation representing insurers) has revised the basis on which insurers offer insurance in areas of significant flood risk in order to limit the liability.
The latest Statement of Principles from the ABI (ABI, 2005) commits its members to continue to provide flood insurance cover to existing customers in areas of significant risk where there are government plans to improve flood defences within five years. Moreover, if flood insurance is to remain widely available the government must make further progress in reducing flood risk. Should the government reduce investment in flood risk management measures in the long-term insurers will reconsider their flooding cover. New customers in flood risk areas are considered on a case by case basis. Cover is not normally refused but will be influenced by the level of existing or proposed flood defence measures and may result in higher ‘excess’ payments in the event of claims (ABI, pers. comm., 14.9.2006).
However, flood relief funds are also frequently set up following large-scale flood events. These receive donations from local authorities (where available), local communities and businesses and are usually administered by the local authorities, the local Mayor’s office or by voluntary organisations. However, previous experience shows that not everyone appears to receive information about these funds, e.g. those who were evacuated, and there is often resentment that those who were uninsured are able to benefit more from the funds than those with insurance (Tapsell and Tunstall, 2001). Voluntary donations of household goods are also often made available for flood affected households, particularly for those without insurance cover. Goods can include: clothing, furniture, decorating materials, and general household goods.
Insurance in the three SurveysAll three surveys in this study contained some information on insurance take-up that had not been previously analysed. Taking out insurance was a common form of preparedness measure taken by residents in the flood affected areas surveyed in England and Wales, although for many flood insurance may have come automatically as part of their general household cover (Figure 5.1). Both the respondents in the Warnings Survey and the flooded in the Intangibles Survey were asked about having insurance cover at the time of the recent /worst flood. The data do not cover those who may have sought insurance after the flood event.
In the Lower Thames Study, only 67% (138) of residents, most of whom had not experienced recent flooding inside their homes, reported currently having contents insurance that covered flooding. Respondents in the Lower Thames Survey were also asked “Have you ever experienced problems renewing or obtaining contents insurance because of the risk of flooding to your home?” From the responses, it appears that such problems only affected a minority (16%) in this flood risk area. The very small category (44) who had experienced some level of flooding at some time, not necessarily flooding inside their homes, reported more problems (25% compared with 14% for those not reporting themselves to have been flooded) but the differences were not statistically significant.
document.doc 29/06/0749
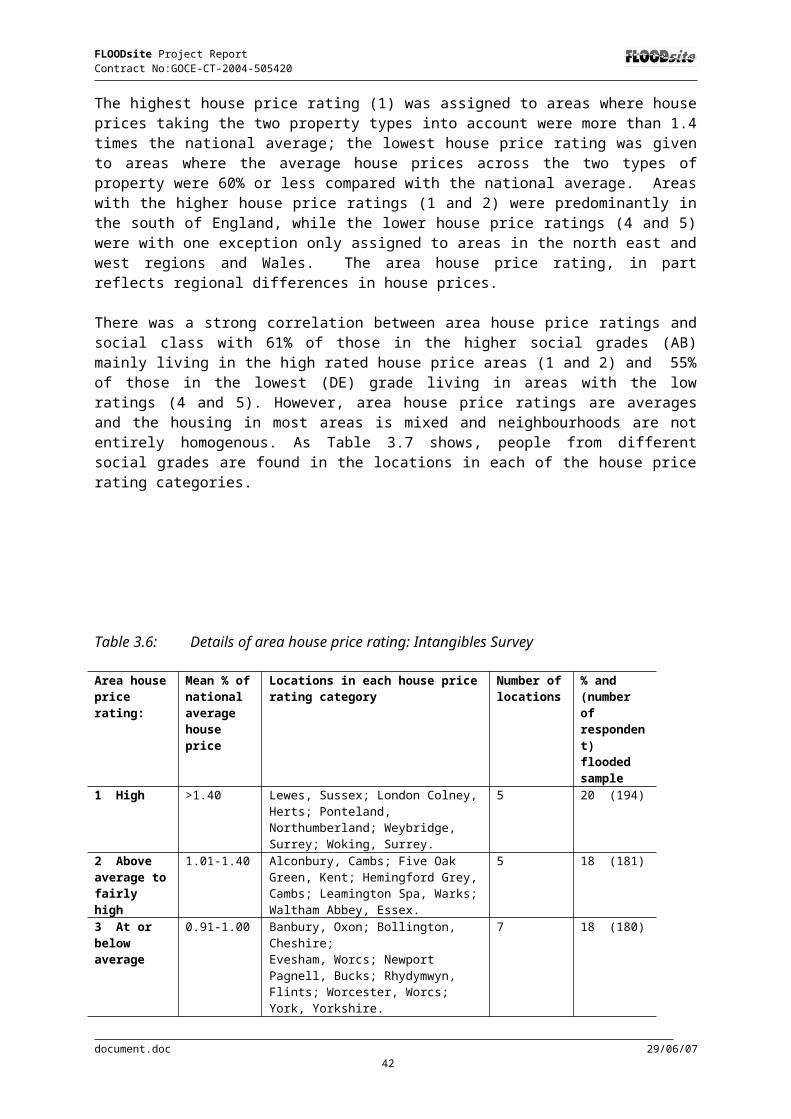
FLOODsite Project Report Contract No:GOCE-CT-2004-505420
Figure 5.1: Household insurance: Intangible and Warnings Surveys
Percentage of respondents having different types of insurance cover
88857880
1313
0%
10%
20%
30%
40%
50%
60%
70%
80%
90%
100%
Intangibles Survey (n=982) Warnings Survey (n=408)
Perc
enta
ge
Building and structure Contents - "New for old"Contents - others
In both the Warnings Survey and the flooded households in the Intangibles Survey, when the two main forms of insurance (buildings and structure, and new for old) were considered, it emerged that taking out insurance against flooding did not vary significantly with the number of floods experienced, or length of residence. Those with prior awareness of the flood risk were no more likely to have insurance of any type than those not aware. Similarly, age was not a significant factor in having insurance cover in most cases. However, in the Warnings Survey, the very elderly (75 and over) appeared to be somewhat different from those younger. Those aged 75 and over were less likely to have the more modern ‘new for old’ insurance (68% compared with 82% for those under 75) and more likely to have other forms of contents insurance than the under 75s (22% compared with 12%). In the Intangibles Survey, the older age groups (those aged 65 and over) were also found to be less likely to have ‘new for old’ contents insurance and more likely to have other contents insurance. The key factor important in insurance take-up in both surveys was social grade, with those in the lowest social groups significantly less likely to have all kinds of insurance (Figures 5.2, 5.3 and 5.4).
Figure 5.2: Buildings and structure insurance by social grade: Intangibles Survey and Warnings Survey
Percentage with building and structure insurance by social grade
90 87
72
9790 86
68
94
0
20
40
60
80
100
120
Perc
enta
ge
Intangibles SurveyWarnings Survey
Intangibles Survey: chi-square; p<0.001Warnings Survey: chi-square; p <0.001
document.doc 29/06/0750
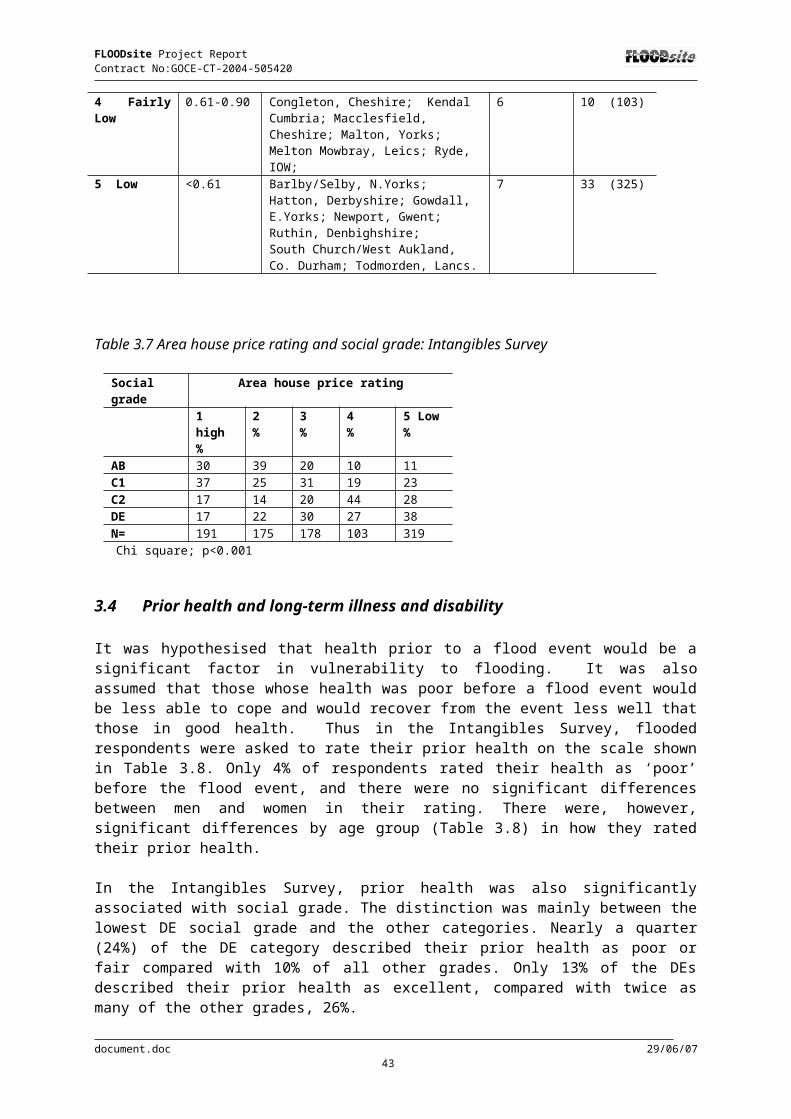
FLOODsite Project Report Contract No:GOCE-CT-2004-505420
Household income was considered in the Warnings Survey and was also found to be a significant related factor (Table 5.1). This may have significant implications as it is estimated that half a metre of floodwater in a modern semi-detached house will result in an average cost of £15,000-£30,000 (22,000-44,000 Euros) to repair the building and £9,000 (over 13,000 Euros) to replace damaged belongings (ABI, pers. comm., 23.9.2006).
Figure 5.3: “New for old” contents insurance by social grade: Intangibles Survey and Warnings Survey
Percentage with "new for old" contents insurance by social grade
8782 85
69
8779 83
56
0102030405060708090
100
Perc
enta
ge
Intangibles Survey Warnings Survey
Intangibles Survey: chi-square; p<0.001
Figure 5.4: Other types of contents insurance by social grade: Intangibles Survey and Warnings Survey
Percentage with "other" contents insurance by social grade
20
16
7
10
13 13
9
16
0
5
10
15
20
25
Perc
enta
ge
Intangibles SurveyWarnings Survey
Intangibles Survey: chi-square; p<0.001
document.doc 29/06/0751

FLOODsite Project Report Contract No:GOCE-CT-2004-505420
Table 5.1: Proportion of respondents with insurance cover according to gross monthly Household income: Warnings Survey
Buildings and structure insurance
Gross household income (before tax) per month*
Under £400-
£400<£800
£800<£1,500
£1,500<£2,400
£2,400<£3,200
£3,200<£4,000 £4,000
or moreNo 30% (3) 30% (12) 13% (7) 26% (11) 6% (2) 7% (2) 4% (2)
Yes 70% (7) 70% (28) 87% (47) 74% (32) 94% (32) 93% (27)
96% (47)
‘New for old’ contents insurance
Can you please indicate which one of the following represents your gross household income (before tax) per week, month, or year? **
Under £400-
£400<£800
£800<£1,500
£1,500<£2,400
£2,400<£3,200
£3,200<£4,000 £4,000
or moreNo 30% (30) 40% (16) 15% (8) 30% (13) 12% (4) 7% (2) 10% (5)
Yes 70% (7) 60% (24) 85% (46) 70% (30) 88% (30) 93% (27)
90% (44)
*Chi-square; p< 0.01**chi-square; p < 0.01
Tenure was also important in affecting insurance take-up. In both surveys those not owning or buying their property were less likely to have insurance of all kinds. Tenure affects insurance since mortgage lenders require their clients to have insurance cover for the buildings they lend on. Landlords should take responsibility for building and structure insurance on properties they rent out. Thus, in the Intangibles Survey, 94% of those owning or buying their property had building and structure insurance compared with 21% in other tenure groups. In the Warnings Survey, the proportions were 93% and 33% respectively. However, there were significant differences in ‘new for old’ contents insurance between owners and other types of tenure. For example, for the flooded in the Intangibles Survey, 85% of those owning or buying their homes compared with 50% in other tenure groups had such cover. For the Warnings Survey, the proportions were 80% and 60% respectively.
A small category in both surveys who were generally less likely to have insurance cover, were those people living in ‘vulnerable’ housing such as basement, ground floor flats or mobile homes (i.e. without an upper floor). In the Warnings Survey, a lower proportion of those living in vulnerable properties had building and structure insurance against flooding, however the difference was not significant. Households living in vulnerable properties were also less likely to have ‘new for old’ contents insurance, (63% versus 79%). In the Intangibles Survey, a similar picture emerged, 64% of those in vulnerable housing had buildings and structure insurance compared with 87% of those less vulnerable. For ‘new for old’ contents insurance, the contrast was as marked with 64% compared with 82% having such insurance. This may reflect high age, low income and the type of tenure of residents in such property. However, it does mean that those who are most vulnerable in terms of their housing, who had little scope to save their property and indeed household members by moving upstairs, were the least protected by insurance.
5.2.3 Preparedness measures taken before the event: Warnings SurveyIncreasingly in England and Wales, property owners are being encouraged to take some responsibility for protecting their property in the event of flooding so as to increase its resistance and resilience (Defra, 2004). The Environment Agency, government departments and the ABI have produced advice for residents on what to do to prepare for a flood (e.g. EA/CIRIA, 2001; DTLR, 2002; ABI, undated). These developments are fairly recent and their impact may not be fully reflected in the Warnings and Intangibles Surveys since the respondents in those surveys had been affected by flooding dating back to January 1998. The National Flood Forum, an organisation that represents all the local citizens’ Flood Action Groups set up in England and Wales, has promoted devices such as flood gates through
document.doc 29/06/0752

FLOODsite Project Report Contract No:GOCE-CT-2004-505420
Flood Fairs and the Environment Agency has backed a kite marking scheme produced by the British Standards Institute, to indicate reliable flood proofing devices. A list of Kitemark products is available on the Agency’s website.
The next section of this report examines a wide range of preventative measures that residents may take before a flood event happens. The questions on which this section is based were only asked of the 278 respondents in Phase 2 of the Warnings Survey. Respondents were asked two questions in which they were presented with a list of preparedness measures. First they were asked “While living at your current address, have you done any of the following?” and shown a list of preventative measures. The first list included mainly structural options to protect the property, such as installing water pumps or floodgates and also included taking out insurance (Figure 5.5 ). The second question asked respondents “Have you acted to reduce the damage that water would cause if it got into your home for example by” and they were then shown a second list of options designed to protect the furniture, valuable and sentimental objects and household fittings (Figure 5.6). Respondents were asked in relation to each item “Was this before or after your recent/most serious flood”. Figures 5.5 and 5.6 show the different actions and the percentages of respondents that undertook any of them before the last/worst flood event:
The data (Figure 5. 5) indicate that although most of those interviewed were within known flood risk areas and only a minority were affected by extreme events or floods from very small watercourses, that might be unanticipated, few residents had taken measures to protect the structure of their property prior to the recent or last flood event. The only preparatory action taken by more than half of the respondents was taking out insurance. Two other actions, keeping ditches and drains clean and obtaining sandbags and sand were taken by sizeable minorities. Very few residents in the warnings survey had made structural alterations to their property or had bought expensive items such as pumps or flood gates.
Figure 5.5: Structural preparedness actions taken: Warnings Survey Phase 2
Percentages taking structural preparedness actions before and after the recent worst flood: Warnings Survey Phase 2 (n=278) "While living in your current home have you done
any of the following ?"
3
9
11
11
27
18
14
3
4
5
9
24
26
62
0 10 20 30 40 50 60 70
Bought air-brick covers
Built new walls or drains to protect your home against flooding
Bought flood-gates
Installed water pump(s)
Obtained sand-bags and sand in case it floods in the future
Kept ditches and drains especially clean in readiness forflooding
Taken out insurance cover against flooding
Percentage
BeforeAfter
document.doc 29/06/0753

FLOODsite Project Report Contract No:GOCE-CT-2004-505420
Figure 5.6: Damage reducing preparedness actions taken: Warnings Survey Phase 2
Percentage taking preparedness actions to reduce damage before and after the recent/worst flood: Warnings Survey: Phase 2 (n=278) "Have you acted to reduce the
damage that flood water would cause if it got into your home by....?"
3
15
12
9
13
25
17
26
27
3
3
6
4
8
9
16
18
20
0 5 10 15 20 25 30
Making a written plan of what to do in case of a flood
Replacing old kitchen units with more flood resistant ones
Permanently raising furniture, washing machines etc off the floor
Buying cheaper or more flood resistant ground floor furniture
Using water-resistant plaster on the walls
Laying tiles on the floor or replacing fitted carpets with roll-up carpetsor rugs
Moving electricity sockets higher up the walls
Moving valuable items off the ground or upstairs
Moving sentimentally important items off the ground or upstairs
PercentageAfter Before
Figure 5.6 shows that only minorities had adapted their behaviour and the way they lived in their homes in preparation for flooding before the recent or worst flood. All 16 options presented in Figures 5.5 and 5.6 were combined into a ‘preparedness before or after the flood’ score (scored 0 to 16). This, of course, gives equal weight to each of the items. It does not take into account either the potential cost, degree of adaptation or potential impact on structural or property damages that might follow from the actions (which can be significant). However, this flood preparedness score provides a simple, if crude, measure of how proactive residents were in advance of a flood and afterwards. Figure 5.7 then, presents the overall scores on the preparedness actions before and after flooding.
A number of variables were examined in relation to the ‘flood preparedness score’ in order to throw light on the drivers for taking action before a flood. The number of floods experienced was significantly correlated with the number of flood preparedness actions undertaken before the flood ( r = 0.368, p < 0.001, number of cases = 251). Those who were aware of the risk of flooding in the area had undertaken a significantly higher mean number of preparedness actions prior to the flood than those unaware. Similarly, longer-term residents had undertaken on average a higher number of preparedness actions before the last/worst flood. This may simply reflect the fact that they had had more time to make preparations or more experience of flooding (Table 5.2).
Owner occupiers had on average taken more preparedness actions than those in other tenure groups. Owners have responsibility for their own property and also the power to make structural changes
document.doc 29/06/0754

FLOODsite Project Report Contract No:GOCE-CT-2004-505420
which those in other tenure groups may not have. Vulnerable households had on average undertaken fewer preparedness actions before the flood. However, neither of these differences was statistically significant.
Furthermore, there were no statistical differences in the average number of preparedness actions undertaken by social grade groups or according to income. Since those in higher income and socio-economic groups have access to more financial resources, these groups could be expected to be more active in preparing for flooding, but this was not found to be the case in this study.
Figure 5.7: The number of preparedness actions taken before and after flooding: Warnings Survey Phase 2
Percentage taking a number of preparedness actions before and after the recent/worst flood. Warnings Survey: Phase 2
1
0
4
2
4
7
9
11
21
20
22
1
1
1
1
4
5
5
11
21
30
19
0 5 10 15 20 25 30
12
9
8
7
6
5
4
3
2
1
0
Num
ber o
f pre
pare
dnes
s ac
tions
take
n
Percentage
Before theflood (n=276)After the flood(n=278)
Table 5.2: Awareness of flood risk and length of residence and number of preparedness actions undertaken: Warnings Survey Phase 2
Aware of flood risk Mean number of actions (standard deviation, n=)
T-test
Yes 2.8 (2.7, 134) t (221) = 4.4, p < 0.001No 1.6 (1.7, 139)
Length of residence Mean preparedness actions undertaken before the last/worst flood
ANOVA
Less than 1 year <10 1.8 (2.3, 148) F (2, 261) = 3.2, p = 0.04110<20 2.3 (2.3, 68)
20 and over 2.8 (2.4, 48)
document.doc 29/06/0755
FLOODsite Project Report Contract No:GOCE-CT-2004-505420
Age also did not emerge as a factor in the number of preparedness actions taken before a flood. Even when we took the extreme case of households in which a very elderly respondent (over 75) lived alone, there were no differences in the number of actions taken.
Like registering on the AVM system, most of the listed actions required the individual householder to take the initiative before a flood event and there were few institutional pressures on residents to make these preparations. Their readiness to do so appeared, like signing up for the AVM, to be influenced by flood awareness and experience rather than by socio-economic factors and resources.
5.2.4 Preparedness measures after the flood and for a future event: Warnings SurveyIn Phase 2 of the Warnings Survey, respondents were asked whether they had taken any of the same actions since the recent or worst flood, if they had not done so before, to protect their homes and belongings from future flood events. Here, it should be noted that 94% of the Phase 2 respondents had experienced flood waters inside their homes, basements or cellars. Despite this spur to action, the proportions taking structural actions to protect their property after the event were not high (Figure 5.5). The most common post-flood action taken by the respondents was the traditional and not necessarily very effective one of obtaining sandbags or sand to prevent flood waters getting into the property in the event of flooding. Respondents also reported keeping ditches and drains clean in readiness for flooding post flood. A few additionally took out flood insurance. Only a small proportion bought floodgates to protect their property, or took the more expensive measures of installing water pumps or building flood walls or drains to protect against flooding. The inexpensive purchase of air brick covers was also undertaken by very few residents.
Behavioural and other adaptations to the home to reduce the potential for flood damage were more common than structural changes post-flooding (Figure 5.6). Some had changed they way they lived in their homes after the flood. The most frequently reported adaptations post flooding were to move items of sentimental or monetary value off the ground or upstairs and laying floor tiles or replacing fitted carpets with rugs or unfixed carpets. More residents took these actions after the flood than before.
Most of those interviewed in Phase 2 of the Warnings Survey will have had to undertake some decoration and building works to restore their properties after flooding. However, only minorities appear to have taken the opportunity to make their properties more flood resistant and resilient by, for example, moving electricity sockets, using flood resistant plaster or replacing kitchen units with more flood resistant ones after the flood. Again, it was more common for residents to take some of these actions to make property more resistant and resilient after the flood than before. There have hitherto been no requirements on householders to refurbish their flooded properties in such a way as to make them more flood-resilient and resistant, although insurance companies do encourage this. However, it has also been noted that there is an institutional barrier to making such adaptations because insurance companies will only pay to put property back into its prior condition and therefore will not pay for adaptations that represent changes and additions to restoration costs. Furthermore, it has been suggested by some observers that some householders are reluctant to make changes such as raising electric sockets because they do not wish to have their property identified as in a flood risk area for fear of the effect this might have on future resale value.
Overall, as Figure 5.7 shows, even after the flood over a fifth of the respondents had taken none of the 16 actions to prepare for flooding. Residents were somewhat more active and took more actions after the flood as compared with before but the number of flood preparedness actions taken after the flood event remained small.
5.2.5 Preparedness measures taken at some stage: Intangibles SurveyIn the Intangibles Survey, respondents were asked whether they had undertaken any of a list of flood prevention measures (Table 5.3). The question did not require respondents to specify when they had undertaken the measures in relation to a flood event. Most of the respondents had undertaken at least one of the measures. Although the kinds of preventative measures taken by the flooded and those at
document.doc 29/06/0756

FLOODsite Project Report Contract No:GOCE-CT-2004-505420
risk were similar, not surprisingly the flooded had been more active either before or after the flood and over a quarter of those at risk had not taken any action. When the prior flood experience of those flooded in the recent or a worst flood was considered, there were some significant differences between those who had been flooded in just the one recent event and those who had greater experience. Those with prior experience of flooding inside their home were more active in keeping drains and ditches clear and they were more likely to avoid buying expensive downstairs furnishings. Significantly more of those with prior experience of flooding, particularly those flooded three or more times altogether, had built walls around their property and taken other preventative measures such as buying flood boards.
Table 5.3: “Have you undertaken any of these flood prevention measures?” according to experience of flooding: Intangibles Survey
Prevention measures Number of times flooded at the address above floor level including the recent event
At Risk
(n=527)%
Flooded once
(n=787)%
Flooded twice
(n=128)%
Flooded three or more times(n=68)%
All flooded
(n=983)%
Take out household insurance against flooding
44 61 49 65 60 *
Keep alert for flood warnings during high risk months
48 62 61 53 61
Avoid keeping irreplaceable items or goods of sentimental value on ground floor at all or certain times
18 34 41 46 36
Keep sand and bags in the property 15 25 25 28 25
Keep ditches and drains around the property clean
21 21 29 38 22 **
Avoid buying expensive downstairs furnishings
8 10 20 16 12 **
Purchased water pumps 2 4 5 5 5
Built walls around the property 2 3 8 15 4 ***
Other preventative measures including the purchase of flood boards or guards across doors
4 8 11 32 10 ***
Did not take any preventative action 27 9 12 3 9
Number of times flooded at the address:* Chi-square; p<0.05** Chi-square; p<0.01*** Chi-square; p<0.001
A small group (78 or 8%) of the flooded had incurred expenditure to build walls or install pumps at their property and of these 62 provided cost estimates. The average expenditure was around £1,750. A very few (19 or 4%) of the at risk sample had also undertaken these works and 13 provided cost estimates with the average expenditure at about £2,050.
5.2.6 Preparedness measures taken at some stage: Lower Thames SurveyA similar pattern emerged in the Lower Thames Study. In this, all but 24 of this sample had not been affected by a recent flood event. Only 44 had ever been flooded at their current address to some degree. So this study was mainly of people at risk and for almost all, actions were taken before any recent flooding inside their property but with recent evidence of the potential for flooding in the area shown by the January 2003 flood event. Respondents were shown the list of actions given in Figure 5.8 which also indicate the percentages taking these preparedness measures involving physical adaptations to their property or the way they used it. A small proportion (6 respondents, 3% of the
document.doc 29/06/0757

FLOODsite Project Report Contract No:GOCE-CT-2004-505420
sample) did not provide answers to this question and in this instance the proportions are calculated with those who did not respond included.
Only one preparedness action, checking on insurance cover, was taken by nearly half of residents and only two other actions were undertaken by significant minorities
Figure 5.8: Flood prevention measures undertaken: Lower Thames Survey
Percentage undertaking flood prevention measure: Lower Thames survey (n=206): "Have you undertaken any of these flood prevention measures at this address?"
35
0.5
1
1
1
1
3
9
12
48
0 10 20 30 40 50 60
None of these
Have flood proofed the exterior wall
Put up walls or changed the grounds around the property
Purchased water pumps
Permanently raised furnishings
Permanent changes to the house interior (water resistantplaster, furniture, moved electrical sockets)
Have flood boards/ flood gates/ airbrick covers
Keep sandbags at the property (e.g. in the garden)
Raised the property off the ground
Have made sure I am covered by insurance against flooding
Percentage
In this survey, it was possible to examine the way risk was constructed by the residents and the actions taken. However, when those who considered flooding to their home to be certain, very or fairly likely were compared with those who did not think flooding likely both for the likelihood in the next five years and 50 years, no relationship was found between how residents in the Lower Thames viewed the likelihood of flooding at their property, and the proportion taking the measures listed in Figure 5.8. Of course, the influence there might be in both directions: some of the measures taken, in particular raising the property, putting up walls around the property and purchasing flood boards might be seen as reducing the risk of flooding happening inside the property. Only one difference emerged: those who considered flooding in their home likely in the next 50 years (107) were significantly more likely to have
document.doc 29/06/0758

FLOODsite Project Report Contract No:GOCE-CT-2004-505420
undertaken at least one of the measures listed than those who thought flooding unlikely (70% compared with 52%, chi-square; p< 0.05). However, the smaller group (51) who considered flooding of their home likely in the next 5 years were no more likely to have taken action than others who thought flooding unlikely in that time period.
Residents in the Lower Thames survey were also asked about behavioural preparations and change. They were presented with a list of possible actions to respond on as shown in Figure 5.9.
Figure 5.9: Behavioural preparations for flooding: Lower Thames Survey
Percentage undertaking actions to prepare for flooding: "Have you undertaken any of these actions because of the risk of flooding at this address?": Lower Thames Survey
(n=206)
3
3
6
6
7
12
31
32
40
52
0 10 20 30 40 50 60
Avoid keeping irreplaceable items or goods of sentimental value on the groundfloor of my home at all or certain times
Have a supply of canned and bottled provisions
Have signed onto the flood warning voice messaging (AVM) service
I know where I would evacuate to
I/we have a plan of what to do when my home might flood
Keep ditches and drains around the property clean
I listen for reports of other areas flooding
Make sure I am aware of bad weather forecasts
I keep alert for flood warning during high risk months
I keep an eye on the level of the river
Percentage
The main behavioural adaptations reported were in terms of keeping alert to the possibility of flooding through a variety of means. Very few reported more elaborate planning for flooding. The Environment Agency suggests that households and families in flood risk areas should prepare their own ‘flood plans’ to ensure that they know whom to contact and what to do in the event of a flood. The evidence of the Lower Thames Survey suggests that very few do so. The low percentage signed on to the AVM system is also notable and contrasts with the results from the other surveys and areas. Recruitment to the AVM system has until the introduction of the new Floodline Warnings Direct System been the responsibility of the Environment Agency at area level and it is possible that staff in a densely
document.doc 29/06/0759

FLOODsite Project Report Contract No:GOCE-CT-2004-505420
populated area such as the Lower Thames have not had the resources to undertake the required recruitment.
There were some significant differences in behaviour according to the residents’ views on the likelihood of flooding with those considering flooding likely mainly reporting themselves to be more watchful for the possibility of flooding but not much else. They had not taken more active steps to prepare. For example, those who thought flooding likely in either the next five or 50 years had not signed onto the AVM system in greater proportions than other residents nor were they more likely to have prepared flood plans. Those who thought flooding of their home likely within 50 years were more likely to keep an eye on the river level than those who considered flooding in that time period unlikely (61% compared with 43%, chi-square; p< 0.05). They were also more likely to listen for reports of other areas flooding (41% compared with 20%, chi-square; p<0.01) and to keep alert for flood warnings during high-risk months (53% compared with 26%, chi-square; p <0.001).
There were some similar significant differences for those who thought flooding likely to their home within five years compared with those who thought such flooding unlikely. This group were also more likely to keep an eye on river levels (67% compared with 47%, chi-square; p <0.01). In addition, they were more likely to make sure that they were aware of bad weather reports (43% compared with 37%, chi square; p <0.05). Significantly more of both those considering flooding to their home likely in the next five and 50 years compared with those considering it unlikely reported undertaking at least one of the preparatory actions listed. For the likelihood of flooding in the five year period, the percentage taking some preparedness action was 88% for those who thought flooding likely in that time period compared with 65% of those who thought it unlikely (chi-square; p <0.01). For the 50 year period, the percentages taking preparedness actions were 83% for those who thought flooding likely in that period compared with 58% compared with those who thought it unlikely. Thus, viewing the flood risk to the home as more likely had a limited impact on preparatory action and mainly resulted in residents paying more attention to information about possible flooding.
5.2.7 Actions taken at the time of a flood event: Warnings SurveyThe Environment Agency provides advice to those in flood risk areas on what actions to take when flooding is possible or likely as part of its awareness campaigns. This advice is also included in its flood warning messages. This list of recommended actions was used as the basis for a series of questions that were only asked in the Warnings Survey. This section of the report therefore draws on the Warnings Survey only.
Respondents were asked: ‘Which if any of the following actions did you take to prepare for flooding and to protect your property?’ It is well recognised in the literature on the response to flooding that people, on becoming aware of the possibility of a threat such as flooding or on receiving a warning, seek confirmation from other sources (Drabek, 1986; 2000). This behavioural response is evident in the answers given in the Warnings Survey (Table 5.4). The most used source of further information was the official Environment Agency telephone call line service, Floodline. The responses also illustrate the importance of informal warnings systems and social networks as respondents sought to find out more from neighbours, friends and relatives as well as formal sources and passed on warnings to others.
Another important behavioural response to the threat of flooding was to attempt to keep the flood waters out of the property. Blocking doorways and airbricks with sandbags was the second most common action although few took the more effective action of putting up flood boards or gates, probably because they did not have them. However, the most common actions taken to prepare for flooding was to move valuables and personal property and cars to safety. Saving property from damage was a priority for the respondents in the Warnings Survey (Tunstall et al., 2005).
Flood warnings are intended to enable residents to protect their property and move household members and animals to safety. In the Warnings Survey, those who had received a warning were substantially and significantly more active in their preparations than those who reported that they did
document.doc 29/06/0760
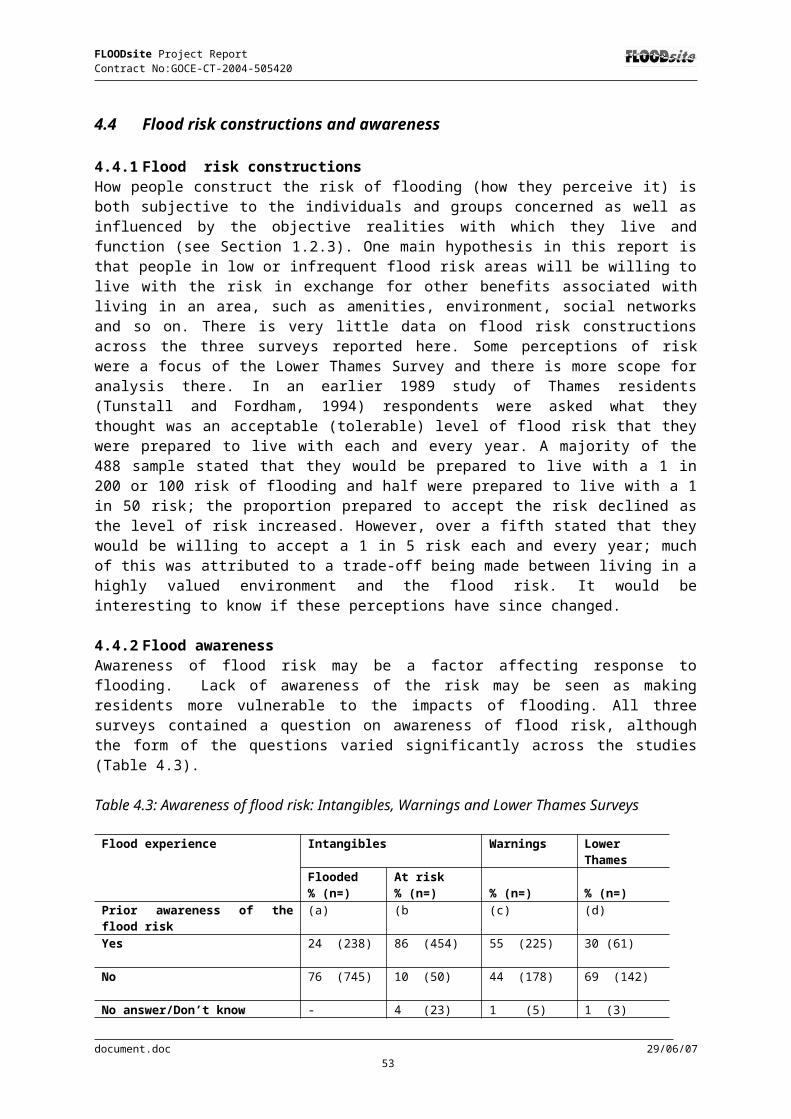
FLOODsite Project Report Contract No:GOCE-CT-2004-505420
not receive what they defined as a warning. Flood warnings in this instance were a significant driver of behaviour before and during a flood event. In other surveys, this has not always been found to be the case (Tunstall et al., 2005).
In the Warnings Survey, the length of warning lead time available to residents to take action did not appear to be a very significant factor. Here, however, the small number warned and able to report a warning lead time (134) has to be noted. In addition, since a majority of these residents had a warning of eight hours or more and few had very short warnings (55% or 71 with eight hour plus warning, 45% or 61 with less), the data available only give us an imperfect indication of the impact of warning lead time on preparatory actions.
Table 5.4: Actions taken by respondents to prepare for flooding and to protect property: Warnings Survey
Actions taken by householders Warned
%
Not warned
%
Flooded above floor level
%
Not flooded above floor level
%
All residents
%Seeking informationTelephoned Floodline 47 20 *** 32 26 30*Listened out for warnings 44 20*** 29 31 29Listened to local radio 37 17 *** 22 32 24Sought information from EA 38 17 *** 28 20 24*Sought information from friend/family or neighbour
36 22** 30 22 27**
Sought information from LA 20 16 18 18 18Sought information from emergency services
11 13 14 11 12
Passing on informationWarned neighbours 38 12 *** 24 17 22Phoned other household members to warn them
22 13 * 18 14 16
Preventing water getting inBlocked doorways /airbricks with sandbags 56 31 *** 45 35 40***Put up flood boards/gates 20 4 *** 11 12 10Saving property from damageMoved valuables/personal belongings upstairs or to a safe place
75 53*** 68 51 ** 60***
Moved cars to safety 56 36 *** 45 50 43Safety measuresMoved household members to safety 44 28 ** 43 13 *** 33***Switched off electricity/gas 36 23 ** 32 20 * 26**Checked gas/electricity before reuse 34 20 ** 32 12 *** 25***Moved stock for businesses/ animals/pets to safety
29 22 30 14 ** 24**
Took supplies to safe place 22 13 * 20 10 * 16*Boiled water until declared safe 12 8 10 11 10None of above 7 20 *** 12 19 16***Number of cases 149 251 287 95 408
* Chi square p =< 0.05** Chi square p= <0.01*** Chi square p=<0.001
There were very few significant differences between those who had an eight hour warning and those who had less, although those who had a longer warning tended to be more active. In part, the longer warning lead time appeared to be taken up with trying to find out more. Significantly more of those with an eight hour or more warning telephoned Floodline (57% compared with 38%, chi-square: p<0.05). More of them also reported listening out for warnings (56% compared with 26%, chi-square; p<0.001) and trying to find out more from family, friends and neighbours (47% compared with 23%,
document.doc 29/06/0761
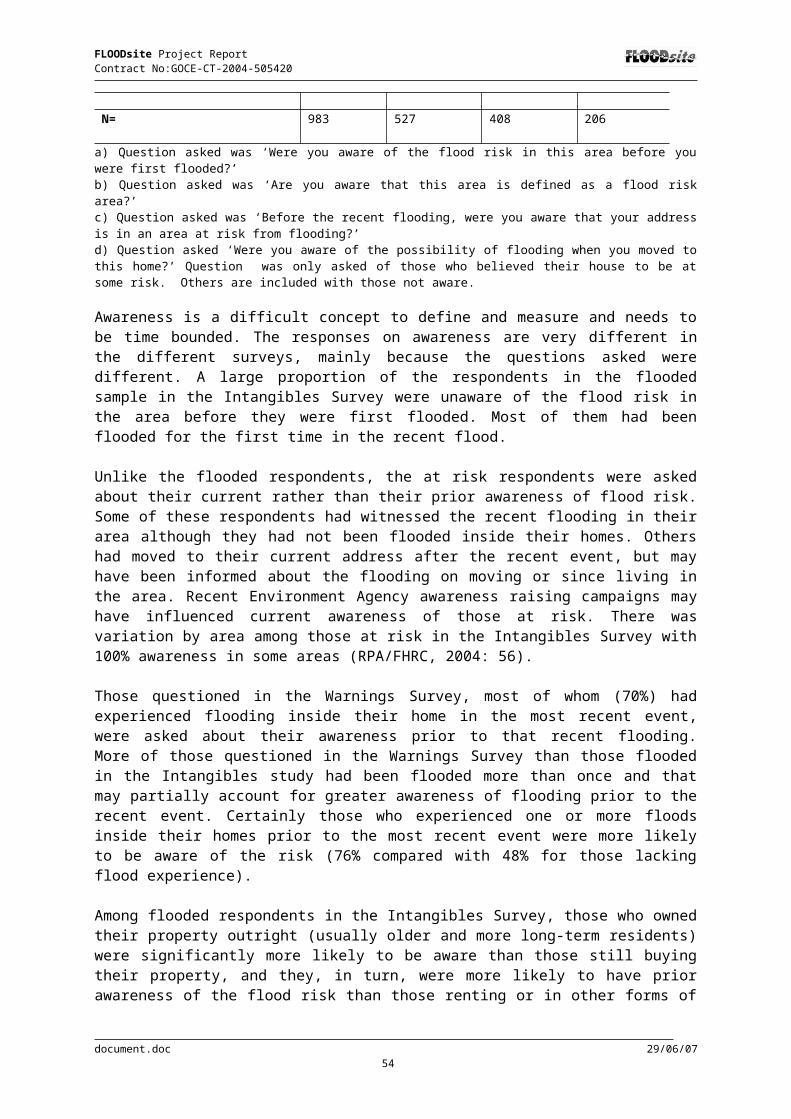
FLOODsite Project Report Contract No:GOCE-CT-2004-505420
chi-square; p<0.01). This suggests that a longer warning lead time allows informal warning processes to be activated and for formal warnings to be amplified via such processes. Those with a longer warning lead time were more active in moving valuables and personal property to a safe place (82% compared with 67% took this action, chi square; p<0.05).
Those who had flood waters inside their homes were also more active in some respects than those less affected. Those flooded did not differ in their information gathering and disseminating from other households. However, more of them were spurred into action to protect people and property. This suggests that residents waited to be almost certain that their property was going to flood before taking damage saving action. Prior awareness made hardly any significant difference to behaviour. However, prior experience of flooding did appear to be a significant driver of action in response to a flood threat perhaps because those with flood experience knew better whom to contact and what to expect and do. A higher proportion of those flooded more than once went to the official source, Floodline, for further information (46% compared with 24% of those without prior experience, chi-square: p<0.001), and more of those flooded before listened out for warnings (chi-square; p<0.05). They were also significantly more active in moving people (48% compared with 28%, chi-square; p<0.001), moving valuables (73% compared with 56%, chi square; p< 0.05), and in taking some of the safety measures. Being flooded at night, which might have been expected to hamper a response, did not make any difference.
Social grade did not emerge as a key factor in behaviour before and during flooding. Those in higher social grade groups were more active in seeking information from official sources, perhaps because they were better informed or more willing to contact the authorities. Significantly more of those in the higher social grades (AB, 33%, C1, 38%) than in the lower grades (C2, 23% and DE, 16%, chi-square; p<0.01) telephoned the official source, Floodline for information and in trying to find out more from the Environment Agency (the percentages were 35%, 26%, 13% and 15% respectively, chi square; p<0.001) and from local authorities. Those in higher social grades were no more likely to move valuables than others but they were significantly more likely to move cars, probably because more of them had cars to move.
The behaviour of the social groups that might be considered to be vulnerable and disadvantaged in taking action in the face of a flood threat was considered, i.e. those living alone, households containing ill or disabled members, or people aged 75 and over. Households containing someone aged 75 and over were found to be less able to take action to prepare for flooding in various ways. Significantly fewer of these households telephoned Floodline and sought information in other ways and, in particular, fewer moved property and personal possessions (41% compared with 64%, chi square; p<0.01). Having a disabled or ill person in the household, however, appeared to make almost no difference to the actions taken.
Single person households also were very similar to other households in what they did to prepare for flooding and to protect their property. Households containing children under 10, a very small category in the Warnings Survey, were different in that they gave priority to moving household members to a safe place, and a high proportion (54%) did so. In all other respects, the presence of young children in the home did not appear to handicap the household in taking action.
5.3 Social resources and help outside the home
Section 1.2.2 highlighted the role of social capital and social networks in affecting the ability of individuals and communities to respond to and recover from a hazardous event. This issue was not directly covered in any of the three surveys studied here. However, some questions on social resources and help received by respondents from outside the household were asked. At present, there is little evidence as to which forms of help or social support are most effective for victims of flooding. Moreover, earlier research results show that support may even have little effect upon the final outcome. Green (1995) found that the extent and type of social support received by victims of flooding
document.doc 29/06/0762

FLOODsite Project Report Contract No:GOCE-CT-2004-505420
seemed to have no effect on their reported stress or extent of disruption caused during a flood event. However, the Lewes Flood Aftercare Group, formed by various statutory and voluntary sector organisations following the autumn 2000 flooding in the town, was seen as a success in providing emotional, informational, practical and social support to over 250 people (LFAG, 2001).
When the social resources available to residents were examined in the Warnings Survey data, some factors, for example the number of members of the household available and taking action that might have been expected to make a difference, were not found to be important in the actions taken before and during a flood.
Both the Warnings Survey and the Intangibles Survey contained questions on help received from outside the household at the time of the flood (Table 5.5). However the questions asked were somewhat different and this may partially explain the marked difference in the level of help recorded in the two surveys. In the Intangibles Survey all the flooded respondents were simply asked whether they had received any help from any of a list of possible sources. In the Warnings Survey respondents were first asked whether they had received any other help (i.e. help from outside the household), and only those who responded positively were then asked from which sources they received help without being presented with a list of possible sources. Furthermore, in the Warnings Survey, respondents were asked about help in the specific context of ‘protecting property’ whereas Intangibles Survey respondents were asked about ‘help’ generally. Only 40% of respondents in the Warnings Survey, unprompted, recalled receiving such help whereas in the Intangibles Survey almost all the respondents prompted by a list (94%) mentioned receiving help from at least one of the sources presented to them. All the Intangibles Survey respondents had experienced flood waters inside their homes whereas this was not the case for all those interviewed in the Warnings Survey. However, while those who had flood waters inside their homes in the Warnings Survey understandably attracted more outside help than those not so badly affected (47% compared with 25%), this factor did not explain the difference in the help from outside the household reported in the two surveys.
Table 5.5: Help received from outside the households: Intangibles and Warnings Survey
Source of help Intangibles Survey Flooded Sample (a)
Warnings survey
All% helped(n=)
Mean help score (b)
All% helped(n=) (c)
Neighbours/friends 67 (655) 4.3 22 (90)Family outside h/h 60 (588) 4.6 10 (41)Local Authority 35 (345) 3.0 10 (40)Fire Brigade 33 (318) 3.8Police 20 (197) 3.7 5 (19)Church 12 (116) 3.1Environment Agency/flood wardens
11 (109) 2.7 1 (4)
Charities 10 (93) 3.4 Not availableCommunity Groups 8 (80) 3.6 Not availableLocal business/Employees, work colleagues
6 (62) 3.1 1 (5)
Other Not available Not available 7 (28)N= 983 405
a) Respondents were asked ’From which if any of these (listed institutions and people) did you receive help?’b) Respondents were asked to ‘Rank the level of help by stating a score from I to 5, where 1 means ‘received very little help’ and 5 equals ‘received all the help I needed’c) Respondents were asked ‘Did you receive any other help (i.e. than from the household) in protecting your property?
What is interesting is that, despite the different methods of elicitation, the pattern of sources of help reported is very similar in the two surveys. Neighbours and friends were the leading helpers, with
document.doc 29/06/0763
FLOODsite Project Report Contract No:GOCE-CT-2004-505420
family outside the home unusually slightly less significant as a source of help at least in the Warnings Survey. This is perhaps because family members are not as likely to be near by as neighbours and possibly friends. The survey findings bear out what our qualitative researches have shown i.e. that flood events do to some degree engender a community spirit and mutual help among those affected (Tapsell et al., 1999; Tapsell and Tunstall 2001). Several respondents in one of the focus groups following the 1998 floods felt that the experience had made their community more cohesive and that this was one of the good things to have come out of the flooding; one resident even described it as fun (Tapsell et al., 1999).
5.3.1 Who gets help from outside the household?In what circumstances and to whom is outside help from neighbours and friends and others forthcoming? In this section we draw on the results on help from both the Intangibles and Warnings Surveys, bearing in mind that the elicitation methods were very different in the two surveys. In the Intangibles Survey, help received from neighbours and friends alone was examined since almost all reported receiving some help. In the Warnings Survey, both all help and help from neighbours and friends only were considered.
All these forms of help varied significantly in the different areas included in the surveys. In some areas in the Intangibles Survey all those interviewed were helped by neighbours or friends, in others less than half were. Both the social composition and social cohesiveness of the areas and the characteristics of the flood events there may contribute to this variation in resilience. According to Ketteridge and Fordham (1995), the context of the community will influence the response to flooding. Residents in one community may contact emergency services or the police, while residents of another community may contact family, friends, and the Housing Association, none of whom form part of the official emergency response network.
In the Intangibles Survey, there were significant differences in help received according to the depth and extent of flooding experienced. For example, those with no main rooms affected (i.e. bedrooms, kitchen, bathroom or living room) or just one main room, were significantly less likely to attract friends’ and neighbours’ help (helped by 51% and 59% respectively) than others more extensively affected (70% helped). Other aspects of the flooding such as the speed of onset and the receipt of a flood warning of some kind did not make any difference in this survey. However, in the Warnings Survey, those who were warned were significantly more likely to report receiving help from outside the household (53% compared with 32%) but there was no difference in help from neighbours and friends according to warning receipt.
Getting help from neighbours and friends or overall in the surveys varied according to certain social characteristics of respondents such as social grade group. In the Intangibles Survey, those in the lowest social grade groups (DE) were significantly less likely to be helped by neighbours than other groups. Tenure, a linked factor, was also significant, with those renting their property also less likely to be helped in this way (52% helped) compared with those owing their property outright (77%) or on a mortgage (63%). In the Warnings Survey, however, tenure and social grade were not significant factors in help, although the lowest social grade groups (DE) were again less likely to report some outside help (29%) compared with other social groups. In the Intangibles Survey, the small minority (83) living in vulnerable housing such as bungalows, ground floor flats or mobile homes also attracted less help than those with an upstairs floor to serve as a refuge (49% compared with 69% helped by neighbours). This finding was confirmed in the Warnings Survey in which only 17% of the very small group (30) in vulnerable housing received any help compared with 42% of the others. It appears therefore that there was no more, and in some cases less, help forthcoming for those who could be regarded as socially disadvantaged in some way.
A similar finding emerged when those who could be regarded as vulnerable were considered. In the Intangibles Survey, help from neighbours and friends varied significantly according to the age of the respondent, with those in older age groups (65-74 and 75 and over) less likely to attract this help. However, in the Warnings Survey, the older age groups did not appear to be disadvantaged in this way
document.doc 29/06/0764

FLOODsite Project Report Contract No:GOCE-CT-2004-505420
as regards outside assistance. In the Intangibles Survey, respondents who described their health prior to flooding as fair or poor were less likely to have received help from neighbours or friends than those in better health. The same was also true for households containing an ill or disabled person, where 58% of such households receiving help compared with 70% for other households. However, in the Warnings Survey, these differences for households where ill health or disability was present were not found for help of any kind. Those living alone might be thought to be in greater need of help in a flood event than other households. However, no more help was forthcoming for these single person households in either survey. Indeed, in the Intangibles Survey, the small group of people aged 65 and over living alone (154) were less likely than other households to have been aided by neighbours and friends. It may be that older people, the disabled and those living alone are less linked into local support networks than others around them and therefore may get overlooked when it comes to neighbourly help.
Families with young children may be considered to be vulnerable and in particular need of help from outside the household in flood events and they were one vulnerable group that did attract more of such help. In both surveys, households with children under ten years of age were more likely to be helped by neighbours and friends than other households. In the Intangibles Survey, 78% of these households (158 in total) compared with 65% for other households were aided in this way. However, it is possible that these families received help from neighbours and friends not because of their need but because of their greater connections to local social networks as compared with other needy groups.
Length of residence which might be expected to be associated with stronger linkages with local social networks was only a significant factor for help from neighbours and friends in the Warnings Survey. In that survey, flood experience was also significantly associated with getting help of all kinds, with those who had been flooded before more likely to be helped in some way. However flood experience was not a factor in help from neighbours or friends in the Intangibles Survey.
5.3.2 Help and protective actionIn the Warnings Survey, it was possible to examine whether the availability of help from outside the home made any difference to the protective actions taken at the time of the flood (Table 5.6). In that survey, although the amount of help available within the household was not significant, being given help from outside the home in protecting property was a significant factor. In the Warnings survey, there were some significant differences in the actions taken to prepare for flooding of those who did and did not receive outside help. Such help did make some difference
More of those who received such help tried to find out more about the possibility of flooding in various ways. They were more active in moving themselves and others to a safe place, in moving valuables and in moving pets and stock. More of those who were helped tried to stop the flood waters entering their property with sand bags. Thus neighbourliness and community cohesion played a part in generating action to prepare for flooding and to protect property.
5.4 Evacuation and disruption
5.4.1 IntroductionEvacuation is one possible behavioural response to flooding. The function of evacuation is to save lives and reduce the danger to people and animals during a flood event. Evacuation measures are only normally taken during serious flood events when it would not be safe or practicable for people to remain in their properties, or for those living in ground floor flats, bungalows or mobile homes. Green and Parker (1993: 2) define evacuation as: “movement, normally using the individuals concerned own resources, towards a place of safety where that safety is created by separation by distance or topography from the hazard”.
document.doc 29/06/0765

FLOODsite Project Report Contract No:GOCE-CT-2004-505420
Table 5.6: Actions taken to prepare for flooding and to protect property according to help received: Warnings Survey
Actions taken by householders Helped
%
Not helped
%
Helped by neighbours/friends%
Not helped by neighbours / friends%
All residents
%
Seeking informationTelephoned Floodline 41 20 *** 49 24*** 30Listened out for warnings 39 22*** 46 24*** 29Listened to local radio 33 18*** 36 21** 24Sought information from EA 29 21 29 23 24*Sought information from friend/family or neighbour
34 22** 40 23** 27
Sought information from LA 20 15 23 15 18Sought information from emergency services
15 11 17 11 12
Passing on informationWarned neighbours 28 18* 26 21 22Phoned other household members to warn them
22 12** 24 14* 16
Preventing water getting inBlocked doorways /airbricks with sandbags
55 30*** 54 36** 40
Put up flood boards/gates 14 8* 16 9 10Saving property from damageMoved valuables/personal belongings upstairs or to a safe place
77 49*** 80 54*** 60
Moved cars to safety 49 39* 52 41 43Safety measuresMoved household members to safety 44 26*** 46 30** 33Switched off electricity/gas 32 25 34 26 28Checked gas/electricity before reuse 30 22 31 23 25Moved stock for businesses/ animals/pets to safety
35 17*** 39 20*** 24
Took supplies to safe place 21 13* 20 15 16Boiled water until declared safe 9 10 9 10 10None of above 10 19 11 17 16Number of cases 163 245 90 318 408
* Chi-square p < 0.05, ** Chi-square p<0.01*** Chi-square p<0.001
Evacuation is a process and not a short-term response and it is not complete until those who have had to leave their homes have returned (FHRC, 1996). Although many people will spontaneously evacuate to relatives and friends before being asked to do so officially, there is evidence that the evacuation process itself is extremely distressing and worrying for people, particularly where family or social structures are disrupted. Evacuation can largely increase the overall disruption resulting from flooding. Ketteridge and Fordham (1995) discuss the trauma of a badly co-ordinated and managed evacuation, the effects of which can be long-lasting and potentially devastating, particularly amongst the most vulnerable members of society. This highlights the importance of the temporal dimension of a disaster outlined in Section 1.2.1.
Post-event evacuation is necessary when flooding lasts for a long period of time or when there can be serious health and safety risks. The loss of services such as electricity or heating can also warrant leaving the home (Ketteridge and Fordham, 1995). Data from 1,712 FHRC interviews with flood victims from 11 different surveys comprising the Full Flood Impacts study were combined into one composite data file. The data did not distinguish between pre-event evacuation and the household leaving the house because it was inhabitable, but inspection of the data suggests that it was mainly the
document.doc 29/06/0766

FLOODsite Project Report Contract No:GOCE-CT-2004-505420
second type. 28 % of households reported that at least one member left. A discriminant analysis showed that the likelihood of evacuation depended on the number of infirm adults in the household, depth of water, duration of loss of telephone service and the time of year that water entered the property (e.g. households were more likely to evacuate in winter due to the cold and absence of heating). The duration of the evacuation was a function of the damage to the house. The severity of the evacuation was a function of the duration; however those that stayed with friends or relatives reported a greater severity than those who stayed elsewhere (Ketteridge and Green, 1994).
However, mass flood evacuations have been shown to be effective. Prolonged rainfall in 1995 led to extensive flooding in the Netherlands, with a total of 250,000 people being evacuated to safety. Overall, the evacuation operation was deemed successful. The slow onset of the flood and long warning lead time allowed time to prepare (van Duin and Bezuyen, 2000). The level of public cooperation surprised the authorities and operational services, the public's behaviour and discipline during evacuation were praised and said to be a contributing factor to its success. Almost all evacuees departed and returned to their homes without any support by the authorities. However, in Limburg where the flooding was not life threatening, people were more reluctant to leave their homes. This reluctance to evacuate is not uncommon and many flood victims from the autumn 2000 floods commented that although they evacuated on that occasion, they would not do so in the event of future flooding.
For this report, the Intangibles Survey is the only one of the three datasets to contain information on evacuation. It has been further analysed to throw new light on this form of behavioural response to flooding and to examine whether the drivers of this behaviour have changed since the earlier data was collected over ten years ago.
5.4.2 Evacuation behaviourFlooded respondents in the Intangibles Survey were asked four questions:
whether or not the respondent had to leave the home (60% did); whether or not another family member had to leave the home (these two are not mutually
exclusive) (56%); whether no-one left the house (35%), so in 65% of homes at least one person had to leave the
home due to the flood); and how long it was before the whole household could live in the property again.
The research shows that usually people evacuate as whole families (Fisher et al., 1995; Drabek, 2000, Heath et al., 2001). Our data shows that there were some instances where someone other than the respondent left home but the respondent did not, and vice versa. But our data do not enable us to calculate whether all household members left home.
The survey did not include questions to establish when people left their homes. In England and Wales the police take the final decision on whether to initiate any official structured evacuation, and firefighters and local authorities would also assist in the process. However, although the police may strongly suggest that people evacuate they have no powers to enforce evacuation for flooding. Should an extreme flood event occur, as in the 1953 coastal floods, such a large-scale evacuation would prove extremely difficult and would need substantial prior-preparedness planning and resources, including military assistance.
No mass evacuations were organised during the Easter 1998 or autumn 2000 floods in England and Wales (which are the main events covered by the Intangibles Survey). During the autumn 2000 floods around 11,000 people were requested to leave their homes by the police, however, not everyone complied with the request (EA, 2001). It is likely, therefore, that most of the evacuations that did take place were the result of family decisions and that most people left very shortly before, during or after the flood when living conditions in the home became intolerable. The last choice is the most common response in England and Wales (Ketteridge and Green, 1994).
document.doc 29/06/0767

FLOODsite Project Report Contract No:GOCE-CT-2004-505420
Green and Parker (1993: 2) differentiate between types of evacuation according to when during the hazard the evacuation takes place:
A precautionary or pre-event evacuation takes place before the hazard has occurred. In some cases, precautionary evacuations can exist as a form of land use control, e.g. property on a floodplain can be purchased by the government and its residents relocated somewhere else. However, most precautionary evacuations are undertaken because there is a forecast of a hazardous event, e.g. a dam break, toxic material release, etc. Pre-event evacuation is the main protective action against hurricanes (Sorensen, et al., 1987).
Aftermath or post-event evacuations take place in the aftermath of the event because of deterioration of living conditions in the area. This type of evacuation should be avoided or reduced to the shortest possible duration as it disrupts the social support network of the victims and makes it more difficult to put their lives back together. Consequently, disruption is particularly important if the relocation is permanent (see also Bland et al., 1997).
It is striking that so many households in the Intangibles Survey had at least one member leave home because of the flooding. This proportion (65%) is more than twice the proportion (28%) of people doing so in events that occurred at least ten years earlier, as reported in the full flood impacts study (Ketteridge and Green, 1994). It may be that the explanation is simply that the earlier events were less severe with fewer properties flooded and a lower depth of flooding. All the flooded in the Intangibles Survey had flood waters inside their homes. However, it is possible that current households have higher standards and expectations of comfort and convenience in their homes and are less prepared to live with the discomforts of a flooded home than households interviewed even a decade earlier.
The evacuations reported in the Intangibles Survey were long (Figure 5.10) and lasted from 12 weeks to up to 6 months for 30% (192) of households and between 6 months to 9 months for a further 30% (191). A few, 4% (23) of households could not live in the property again until over a year after the flood. The mean duration of evacuation of those households where someone left home was 23 weeks.
Figure 5.10: Duration of evacuation: Intangibles Survey
Duration of evacuation: Intangibles Survey (n=634) "How long was it before the whole household could live in the
property again?"
7
7
30
30
8
13
4
0 5 10 15 20 25 30 35
1 year or more
9 <12 months
6 <9months
12 weeks <6months
4 <12weeks
1 <4weeks
Less than a week
Percentage
% of those evacuated
5.4.3 Flood event characteristics as drivers of evacuation behaviourWe would expect the nature of the flood event, particularly the depth and extent of the flooding in the home to be a key determinant of evacuation and its duration. In the Full Flood Impacts Study (Ketteridge and Green, 1994), the depth of flooding, the £ value of damages incurred, the time flood waters entered the property, the duration of loss of telephone services and the number of infirm adults
document.doc 29/06/0768

FLOODsite Project Report Contract No:GOCE-CT-2004-505420
in the home were key determinants of the likelihood of evacuation. In the Intangibles Survey there was also a strong association between whether someone had to leave home and the length of time before all the household could live together in the home and the depth of flooding inside the home. However, a minority of those who only had flooding in other parts of their property evacuated possibly because of loss of utility services and of access to the home (Table 5.7).
Table 5.7: Evacuation and depth of flooding: Intangibles Survey
Maximum depth in the house
% who evacuated
% who did not evacuate
Mean duration of evacuation in weeks(n=)
N=
0 23 77 11 (20) 861<10 cm 41 59 12 (43) 10510<20 cm 55 45 18 (70) 12520<30 cm 59 41 18. (41) 14130<60 cm 69 31 21 (141) 20560<100 cm 76 24 23 (182) 2351 metre or more 87 13 33 (136) 156
N= 634 349 23 (633) 983
Which particular rooms or areas were flooded was a significant factor in evacuation. There were significant correlations between the depth of flooding in particular rooms and the propensity to evacuate, and flooding was significantly deeper in the rooms of those who evacuated compared with those who did not (Table 5.8).
The extent of flooding in the home as measured by the number of main parts of the home affected by flooding (main parts being living room, bedroom, bathroom and kitchen) was a significant factor in evacuation. Where none of these main parts of the dwelling or only one were affected only a quarter reported leaving home; where two parts were affected the proportion was 68%, for three parts, 74% and where all the main parts of the home were flooded very few households, only 11%, managed to stay together in the home during and after the flood.
Table 5.8: Type of rooms flooded and evacuation : Intangibles Survey
Room % with room flooded
% who evacuated:If room flooded
% who evacuated:If room not flooded
Correlation between depth of flooding in room and evacuation
Living room 87 71 26 *** Correlation = 0.183, p< 0.001
Bedroom 14 87 61.*** Correlation = 0.150, p< 0.001
Kitchen 86 71 30*** Correlation = 0.262, p< 0.001
Bathroom 26 81 60*** Correlation = 0.167 p< 0.001
Hallway 61 74 51*** Correlation = 0.218, p< 0.001
Basement 15 71 31*** *** Chi-square; p<0.001
5.4.4 Other flood characteristicsOther flood characteristics were also significant in the Intangibles study as drivers of evacuation behaviour. These include: speed of onset, the presence of contaminants, receipt of flood warnings, social characteristics and material resources
document.doc 29/06/0769

FLOODsite Project Report Contract No:GOCE-CT-2004-505420
Speed of onsetEvacuation was less likely where flood waters were reported to have risen quickly (63% evacuated) rather than slowly (78%), or in-between (71%). This may be because residents did not have time to organise an evacuation in advance but it is surprising since most evacuations take place after flooding anyway. It is possible that in areas where flood waters rose fast, they also retreated quickly and caused less damage.
ContaminationThere are health fears associated with living in property believed to have been flooded by contaminated waters. Respondents were asked whether the floodwater contained sewage or other pollution. Those 68% who said yes were more likely to evacuate (compared with the 57% who said no and those who did not know, 54%). One of the main concerns for flood victims raised in qualitative studies following the 1998 and June 2000 floods was the fact that the floodwaters contained sewage and other contaminants (Tapsell et al., 1999; Tapsell and Tunstall, 2001). The perceived threat of diseases and risk to human health from the contaminants had caused anxiety, particularly where young children were living in the properties. In addition there was fear of contaminated drinking water, rat infestations and possible bacteria left in the materials of properties following the flooding. Many people spoke of the unpleasantness of having to clean up after the floodwaters had receded, and the smell which had remained in the properties for months afterwards.
Flood warningsRespondents who received a flood warning of some kind before the flood were significantly more likely to evacuate than those who did not (76% compared with 62%). It may be that the warning gave residents a better chance to arrange to stay elsewhere and to get people out of the house.
Various factors appear to have some relevance as influences on evacuation in the Intangibles Survey, these include: institutional factors, the performance of the formal warning system, social factors, and the social networks operating informal warnings. However, literature on warning response across different kinds of hazards reviewed by Fisher et al (1995) indicates that the source of a warning is important to the warning being taken seriously and acted on. However, the issue of the potential influence of the source of warning, whether official or unofficial, has not been explored in this analysis. Other factors may include: clarity and consistency of the message, frequency of the warnings, the type of authority giving the message, accuracy of past warnings, and frequency of disaster.
5.4.5 Social characteristics and material resources The literature on evacuations in a range of hazard situations indicates that the presence of children in the home is a key factor (Heath et al., 2001; Fisher et al., 1995; Drabek, 2000; Van Duin and Bezuyen, 2000). The bi-variate analyses of the Intangibles Survey confirmed this. Households containing children under ten were more likely to evacuate than households without young children (75% with such children evacuated compared with 62% without).
The Intangibles data did not contain any information on the presence of pets in the home. Having pets has been found to act as a disincentive to evacuation because households are often not allowed to take pets to evacuation rest centres and will not abandon them (New Orleans anecdotal evidence). Heath et al. (2001) found that ownership of dogs or cats appeared to be the most important reason why households without children failed to evacuate and that people without children were prepared to put themselves in danger in order to stay with their pets. It was not possible to investigate this factor for this report.
Vulnerable households might be expected to have a higher incidence of household members leaving home. This was the case for those who lived alone (271). They had a significantly higher propensity to evacuate than those living with others (72% compared with 61% left home). This was also true of those aged 65 and over living alone (235) as compared with all other households. However, households that included an ill or disabled person and respondents who described their health prior to
document.doc 29/06/0770
FLOODsite Project Report Contract No:GOCE-CT-2004-505420
flooding as only fair or poor were no more likely to report household members leaving home than others without any such health problems in the home.
The kind of property lived in made a difference. Not surprisingly, people living in vulnerable property (bungalows, ground floor or basement flat and mobile homes i.e. property without an upstairs to retreat to, only 83 households) were significantly more likely to evacuate (89% compared to 63% of other in less vulnerable housing). Owner-occupiers were no more likely to evacuate than those with other forms of tenure.
One counter-intuitive finding emerged in the analysis. We would expect those with higher income and probably greater resources to be more likely to evacuate than those with less income since paying to stay in a hotel or to rent an alternative property to stay in while repairing their home would present them with fewer financial problems. However the reverse was the case (Table 5.9). Those in the lowest household income group are likely to be living alone, and to be elderly people living on pensions. These factors may explain the high evacuation rate in this income group.
When evacuation by social grade was considered, those in the highest social grade group (AB) like the highest income group were surprisingly the least likely to evacuate with only 54% doing so. It is possible that the higher income and social grade groups had large enough homes to make living on the premises while rehabilitation works were carried out more feasible and the resources to ensure that their homes were made habitable more speedily.
Table 5.9: Evacuation by gross monthly household income
Gross monthly income
Under £400-
£400<£800
£800<£1,500
£1,500<£2,400
£2,400<£3,200
£3,200<£4,000
£4,000 or more
Dkn.
% evacuated
81 69 64 71 65 60 56 58
N= 52 151 177 165 103 43 63 224 Chi-square; p < 0.05
Having some form of insurance cover was a significant factor in evacuation. Significantly more of those with building and structure insurance (85% of homes were insured in this way) evacuated (67% evacuated compared with 56% of the uninsured). The same was true of ‘new for old’ contents insurance (80% had this cover). Two thirds (67%) with this cover evacuated compared with 59% without it. However, those with other forms of contents insurance were less likely to evacuate. Only just over half (53%) those with this cover evacuated, compared with 67% without it. Findings from the qualitative research show that having insurance which covers buildings or contents does not guarantee that the insurers will pay for alternative temporary accommodation (Tapsell et al., 1999; Tapsell and Tunstall, 2001). Varying levels of service are offered by different insurers. Failure or reluctance to pay for temporary accommodation was cited by some respondents. Although included in people’s policies, insurance companies often did not point this out unless people asked for it. Other common complaints include: slowness in dealing with claims and no up-front payments to cover immediate financial needs (Tapsell and Tunstall, 2001).
There were significant correlations between length of evacuation and many of the variables that affected whether or not residents left their homes. Length of evacuation was measured as a continuous variable and it correlated significantly with the following variables:
Maximum depth of flooding, correlation = 0.206, p< 0.001 Receiving a flood warning, correlation = 0.144, p < 0.001 Insurance: building structure, correlation = 0.146, p < 0.001 Insurance: contents, new for old, correlation = 0.072, p <0.05 Vulnerable property, correlation = 0.117, p <0.001
document.doc 29/06/0771
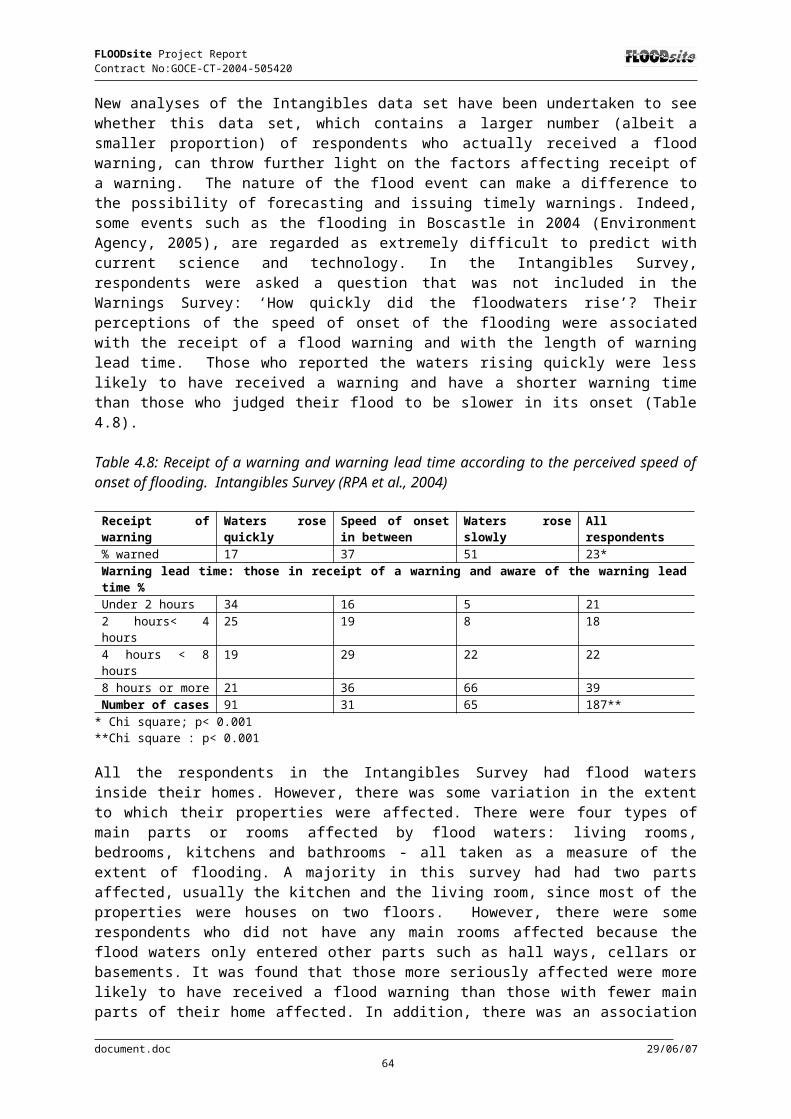
FLOODsite Project Report Contract No:GOCE-CT-2004-505420
There was no significant correlation with children aged under 10 in the household.
5.5 Worry about future flooding
The Intangibles Survey and the Lower Thames Surveys contained some form of questions on worry about future flooding. Worry is perhaps best considered as an affective response to a perceived risk. It may, along with flood risk perception, be a driver of behaviour after the flood where a flood event has occurred, or before an event when there has not been recent flooding. Not surprisingly, ‘flooded’ respondents in the Intangibles Survey were more worried about flooding, even over the relatively short time period of twelve months, than the ‘at risk’ (Figure 5.11).
Twenty seven percent (261) of flooded respondents said they were ‘very worried’ compared with only 9 % (49) of the ‘at risk’ sample. Half of the at risk respondents were either ‘not worried at all’ or ‘not very worried’ compared with 28% of flooded respondents despite a majority of them being aware of the flood risk in the area. Generally, however, the levels of worry were fairly low considering that all those surveyed lived in areas that had been affected by flooding in recent years.
Figure 5.11: Worry about future flooding: Intangibles Survey
"How worried are you about the possibility of your property being flooded during the next 12 months?"
9
33
7
30
20
27
39
6
18
10
0 5 10 15 20 25 30 35 40 45
Very worried
Somewhat worried
Indifferent
Not very worried
Not worried at all
Percentage
Flooded (n=978)At risk (n=527)
Respondents in the Intangibles survey were also asked: ‘When thinking about your own home, which one (of various listed characteristics of a house flooding) worries you most?’ Those who had experienced flooding above ground floor and those at risk were similar in their concerns (Figure 5.12).
There were also significant differences in the degree of worry about the possibility of flooding in the next 12 months between flooded and non-flooded Lower Thames respondents, although the number who had some experience of flooding in this study was very small (Table 5.10). In the Intangibles Survey, there were significant differences between flooded men and women, with 31% of female respondents ‘very worried’ versus 20% of male respondents. A similar significant difference was found between men and women in the at risk sample (Table 5.11).
document.doc 29/06/0772

FLOODsite Project Report Contract No:GOCE-CT-2004-505420
Figure 5.12: Concerns about flooding: Intangibles Survey
Flood characteristics of most concern to respondents: Intangibles Survey.
4
2
3
8
9
12
18
22
22
3
3
6
6
9
11
17
22
23
0 5 10 15 20 25
Not worried about specific characteristics
Other
Season of year when it occurs
Duration of flood
Time of day/night when it occurs
Warning time
Depth of water
Dirtiness of water
Speed of water rising
Percentage
Flooded (n=979)At risk (n=527)
Table 5.10: Worry about flooding by those flooded and not flooded: Lower Thames Survey
Worry about the possibility of being flooded in the next 12 months
Lower Thames Sample
% (n=)
Lower Thames flooded
% (n=)
Lower Thames not flooded*% (n=)
0 - Not worried at all 22 (45) 9 (4) 25 (41)1 23 (48) 14 (6) 26 (42)2 23 (48) 18 (8) 25 (40)3 13 (27) 14 (6) 13 (21)4 14 (28) 36 (16) 7 (12)5 2 (5) 2 (1) 2 (4)6 - Very worried 2 (4) 7 (3) 0.6% (1)Don't know 0.5% (1) - 0.6% (1)N= 206 44 162
*Chi-square, p< 0.001
document.doc 29/06/0773

FLOODsite Project Report Contract No:GOCE-CT-2004-505420
Table 5.11: Worry about flooding by gender: Intangibles Survey
How worried are you about the possibility of your property being flooded during the next 12 months?
Flooded * At risk **
Men Women Men Women
Not worried at all 15 7 23 18Not very worried 19 18 29 31Indifferent 7.3 5 10 5Somewhat worried 39 39 33 32Very worried 20 31 5 13
* Chi-square, p<0.001,** Chi-square, p<0.01
Many researchers have argued that gender has been ignored in the study of the impacts of disasters in general and flooding in particular (Enarson and Morrow, 1968; Fordham, 1998). Natural disasters such as floods have often been shown to have more adverse impacts on women than men (Morrow, 1999; Fordham, 1998; Ketteridge and Fordham, 1997, Enarson and Fordham, 2001; Tapsell and Tunstall, 2001; Tapsell et al., 2003). It is well recognised that men and women experience and respond to flooding differently. Fordham (1998) suggests that women are often invisible in disasters as they are often confined to the ‘feminine space’ and private domain of the home, and therefore may suffer more inconvenience when their routine in the home is disrupted. Women tend to be the chief homemakers and carers, looking after children and other dependants who may be upset by flooding, and often may have a greater emotional investment in the home; they also usually have to bear the greater part of the burden of getting the home back to normal after flooding. Women therefore may be more prepared to admit to worrying or they may feel more concerned about the prospect of flooding. For men, disasters may lead to changes in self-perception away from the traditional identity as provider and protector of their families to one of helplessness.
In contrast to the Intangibles Survey findings, there were no significant differences identified in worry by gender in the Lower Thames Survey. Furthermore, those whose property was immediately on the river bank (70 respondents, 34% of the sample) were no more worried than those at a greater distance from the river.
The degree of worry varied by area in the Intangibles Survey (RPA/FHRC, 2004). Local circumstances, in particular whether or not there is a flood alleviation scheme or any developments perceived to have potential to exacerbate the flood risk (such as run off from a new building) may affect the degree of worry experienced in a particular area (Tapsell et al., 1999, 2003).
There are also other factors such as the extent and depth of flooding experienced and other social and demographic characteristics, that may affect worry among the flooded and at risk that have not been examined in the analysis.
5.6 Summary
People’s behaviour before, during and after a flood was analysed along with a number of driving factors such as individual or household characteristics. These factors help to highlight the levels of social vulnerability relating to capacity to cope with and recover from a flood event.
Registering on the AVM system can be one preparedness measure for flooding. Only 28% of Warnings Survey residents in Phase 2 had taken this precaution before the recent/worst flood (this question was not asked in the other surveys), while 24% signed up for the service after the event. Those with prior experience of more than one flood event and prior awareness of flood risk were more likely to take this preparedness measure. Taking out insurance was a common form of preparedness measure by residents in the flood affected areas, although for many flood insurance may have come
document.doc 29/06/0774

FLOODsite Project Report Contract No:GOCE-CT-2004-505420
automatically as part of their general household cover. Age was a significant factor relating to insurance take up in the Intangibles and Warnings Surveys, with older age groups less likely to have ‘new for old’ insurance and more likely to have other forms of contents insurance. The key factor important in insurance take-up was social grade, with those in the lowest social groups significantly less likely to have all kinds of insurance. Tenure was also important in affecting insurance take-up, with those not owning or buying their property less likely to have insurance of all kinds. Those people living in ‘vulnerable’ housing were generally also less likely to have insurance cover. Therefore, we can see very different drivers of human behaviour before a flood at work across forms of preparedness action such as registering onto the flood warning system and taking out insurance. Flood awareness and experience were important for the former and of no significance for the latter. Instead, taking out insurance appears to be related to socio-economic factors and institutional arrangements affecting tenure.
Few Warnings Survey residents had taken pre-flood measures to protect the structure of their property; the only preparatory action taken by more than half of the respondents was taking out insurance. Only minorities had adapted their behaviour and the way they lived in their homes in preparation for flooding before the recent or worst flood. The number of floods experienced was significantly correlated with the number of flood preparedness actions undertaken before the flood across all three surveys. Those who were aware of the risk of flooding in an area had undertaken a significantly higher mean number of preparedness actions prior to the flood than those unaware. Similarly, longer-term residents and owner occupiers had undertaken on average a higher number of preparedness actions before the last/worst flood. Vulnerable households had on average undertaken fewer preparedness actions before the flood. Readiness to take actions like signing up for the AVM appeared to be influenced by flood awareness and experience rather than by socio-economic factors and resources.
The most common post-flood measure taken by respondents in the Warnings Survey was obtaining sandbags or sand to prevent flood waters entering the property. Behavioural and other adaptations to the home to reduce the potential for flood damage were more common than structural changes post-flooding. In the Warnings Survey, even after the flood over a fifth of the respondents had taken none of the 16 actions to prepare for flooding. Respondents were somewhat more active and took more actions after the flood as compared with before but the number of flood preparedness actions taken after the flood event remained small. In the Lower Thames Study there were some significant differences in behaviour before or after flooding according to views on the likelihood of flooding, with those considering flooding likely mainly reporting themselves to be more watchful for the possibility of flooding but not much else.
Therefore, the only and most common action to protect property prior to flooding taken by more than a minority of residents was taking out flood insurance. Flood awareness and experience were clearly important in preparedness. Those who had taken preparedness actions tended to be those with the highest levels of flood risk awareness and previous experience of flooding, such as longer-term residents. Home owners/buyers had also taken more preparedness actions than renters. Following the last flood event, unsurprisingly flooded respondents were more likely to take actions than non-flooded to make their homes more flood-resilient, although levels of actions were fairly low overall.
During a flood event, the most common actions taken to prepare for flooding by Warnings Survey respondents were to move valuables, personal property and cars to safety. Households containing children under 10, a very small category in the Warnings Survey, gave specific priority to moving household members to a safe place. A further important behavioural response was to attempt to keep the flood waters out of the property, while another was to seek further information about the threat of flooding; the most used source of this information was the official Environment Agency telephone call line service, Floodline. Those in higher social grade groups were more active in seeking information from official sources, perhaps because they were better informed or more willing to contact the authorities. Flood warnings were a significant driver of behaviour, before and during the flood. Those with floodwaters inside their properties took more actions than those less affected, however these
document.doc 29/06/0775

FLOODsite Project Report Contract No:GOCE-CT-2004-505420
actions were often not taken until flooding was certain. Although prior experience of flooding was a significant driver for those taking actions, flood risk awareness was not. Only households with residents aged 75+ were less able to take action, while disability and prior ill health were not significant.
There were marked differences in the level of help received from outside the household at the time of the flood in both the Warnings and the Intangibles Surveys, however the questions asked were somewhat different and may partially explain these differences. In the Warnings Survey, respondents were asked about help in the specific context of ‘protecting property’ whereas Intangibles Survey respondents were asked about ‘help’ generally. Only 40% of respondents in the Warnings Survey, unprompted, recalled receiving such help whereas in the Intangibles Survey almost all the respondents prompted by a list (94%) mentioned receiving help from at least one of the sources presented to them. Despite the different methods of elicitation, the pattern of sources of help reported is very similar in the two surveys; neighbours and friends were the leading helpers, with family outside the home slightly less significant, at least in the Warnings Survey.
All forms of help varied significantly in the different locations targeted in the surveys. In some areas neighbours or friends were the main sources of help, in others less than half were. Both the social composition and social cohesiveness of the areas and the characteristics of the flood events may contribute to this variation. In the Intangibles Survey, there were significant differences in help received according to the depth and extent of flooding experienced, while in the Warnings Survey those who were warned were significantly more likely to report receiving help from outside the household, but there was no difference in help from neighbours and friends according to warning receipt.
Receiving help varied according to certain social characteristics of respondents such as social grade group. In the Intangibles Survey, those in the lowest social grade groups (DE) were significantly less likely to be helped by neighbours than other groups. Tenure, a linked factor, was also significant, with those renting their property also less likely to be helped in this way. In the Warnings Survey, however, tenure and social grade were not significant factors in help, although the lowest social grade groups (DE) was again less likely to report some outside help compared with other social groups. Living in vulnerable housing also attracted less help in both surveys. A similar finding emerged in the Intangibles Survey where those who could be regarded as more vulnerable were considered e.g. the elderly and those with poor prior health or households will ill or disabled persons, however this was not the case in the Warnings Survey. Single person households did not attract any more help in either survey.
It appears therefore that there was no more, and in some cases less, help forthcoming for those who could be regarded as socially disadvantaged. It may be that older people, the disabled and those living alone are less linked into local support networks than others around them and therefore may get overlooked when it comes to neighbourly help. In both surveys, households with children under ten years of age were more likely to be helped by neighbours and friends than other households. It is possible that these families received help from neighbours and friends not because of their need but because of their greater connections to local social networks as compared with other needy groups. Length of residence which might be expected to be associated with stronger linkages with local social networks was only a significant factor for help from neighbours and friends in the Warnings Survey. In that survey, flood experience was also significantly associated with getting help of all kinds, with those who had been flooded before more likely to be helped in some way. The results were also consistent with the findings from the literature in that people seek confirmation of a threat once they become aware of it.
Being given help from outside the home was a significant factor in taking actions to protect property and prepare for flooding. There appear to be a number of drivers to action taken to prepare for flooding and to protect property when there is a threat of flooding or indeed during a flood. Institutional factors such as the receipt of a warning from a formal source and help from the authorities
document.doc 29/06/0776

FLOODsite Project Report Contract No:GOCE-CT-2004-505420
appear to be one driver. Social cohesion reflected in the high proportion helped by neighbours and friends and the operation of an unofficial warning system appear to be another. The vulnerability of households in terms of age, ill health and disability and living alone does not emerge as a major handicap.
Evacuation is one possible behavioural response to flooding. This response was only measured in the Intangibles Survey. No mass evacuations were organised during the main flood events covered by the Survey, however, it is striking that 65% of households had at least one member leave home because of the flooding. This proportion is more than twice the proportion of people reporting doing so in events that occurred at least ten years earlier. Explanatory factors could simply be that the earlier events were less severe with fewer properties flooded and a lower depth of flooding. It is also possible that current households have higher standards and expectations of comfort and convenience in their homes and are less prepared to live with the discomforts of a flooded home than those interviewed a decade earlier.
Length of evacuation was reported as between three and nine months, with mean duration of 23 weeks. For 4% of households it was more than a year after the flood before they could live in the property again. Which particular rooms or areas in the property were flooded was a significant factor in evacuation; the more rooms flooded the longer the likelihood and duration of evacuation. There were also significant correlations between the depth of flooding in particular rooms and the propensity to evacuate; flooding was significantly deeper in the rooms of those who evacuated compared with those who did not.
Other flood characteristics were also significant as drivers of evacuation behaviour. These included: speed of onset, the presence of contaminants, receipt of flood warnings, social characteristics and material resources. Evacuation was less likely where flood waters were reported to have risen quickly and where contaminants were present in the flood waters. Respondents who received a flood warning of some kind before the flood were significantly more likely to evacuate than those who did not. Institutional factors, the performance of the formal warning system, social factors, and the social networks operating informal warnings appear to have affected propensity to evacuate. The literature on warning response indicates that the source of a warning (and level of trust in those issuing the warning) is important to the warning being taken seriously and acted on, however, this issue was not explored in the analysis.
Households containing children under ten were more likely to evacuate than households without young children. Vulnerable households such as those living alone and with residents aged over 65 had a significantly higher propensity to evacuate as did people living in vulnerable property. Those in the lowest household income group are likely to be living alone, and to be elderly people living on pensions. These factors may explain the high evacuation rate in this income group. Those with higher income and probably greater resources were less likely to evacuate than those with less income, the reverse to what might be expected. Having some form of insurance cover was also a significant factor in evacuation, with those with insurance more likely to evacuate.
Worry can also be considered as an affective response to a perceived risk. It may, along with flood risk perception, be a driver of behaviour after the flood where an event has occurred, or before an event where no recent flooding has taken place. Not surprisingly, ‘flooded’ respondents in the Intangibles Survey were more worried about flooding than the ‘at risk’. There were also significant differences between flooded men and women with higher proportions of female respondents reporting being ‘very worried’ compared with male respondents. A similar significant difference was found between men and women in the at risk sample, however, these findings were not present in the Lower Thames Survey. The degree of worry appeared to be location specific and varied by area in the Intangibles Survey, possibly a reflection of the presence of flood alleviation schemes or warnings systems or any developments perceived to have potential to exacerbate the flood risk, as well as social and demographic characteristics.
document.doc 29/06/0777

FLOODsite Project Report Contract No:GOCE-CT-2004-505420
6. The impacts of flooding
6.1 Subjective severity of impacts
The manner in which people may respond to flooding and their capacity to recover may be affected by their subjective severity of the flood impacts. Only the Intangibles Survey sought to measure the subjective impacts of flooding and magnitudes of impacts in detail on its flooded sample. Therefore, this and subsequent sections of this report present further analyses from that survey.
In the Intangibles survey, the flooded respondents were asked to rate a list of ‘subjective effects’ of the flood on their household’s life on a scale from 0 (no effect) to 10 (extremely serious effect). Only those who considered that they had experienced the effect rated it and those who did not experience the effects were excluded from the calculation of the means, medians and percentages. The list of effects has been developed on the basis of FHRC qualitative and quantitative research over many years and has been used in many FHRC post flood event surveys. In the Intangibles Survey, three new items were introduced on the basis of our qualitative focus group research. This showed that problems with builders and insurers were significant factors that exacerbated the stress experienced by households during the recovery period. Loss of pets and the distress and adverse effects on pets also emerged as significant concerns to flooded households in the qualitative research for the survey.
The respondents were also then asked to rate the ‘overall severity’ of the above effects on the household using the same 0 to 10 scale in the following question: ‘Overall, how serious were the effects of the flood upon your household?’ The results are presented in Table 6.1 in order of the seriousness of the effects.
In the Intangibles survey, getting the house back to normal, i.e. the disruption to life and all the problems and discomfort whilst trying to get the house back in order, were rated as most serious of the effects, followed by the stress of the flood event itself, having to leave home and worry about flooding in the future. The first three intangible effects were rated as markedly more serious than the tangible damages to the contents and structure of the property.
There were striking and significant differences in the rating of the effects between men and women, with women giving a higher rating than men to almost all the effects. Women also rated the flood overall as having a more serious effect on their household than did the men. As stated in Section 5.5, women traditionally have more responsibility for the management of the household than men and may suffer more inconvenience when it is disrupted. Women too are likely to be more aware of the impacts because of their key role in the household. Women’s often greater emotional investment in the home may result in them feeling a greater sense of loss when possessions are damaged or lost. In addition, in carrying out the main responsibility for caring within the household women may be put under greater strain following flooding. Finally, women may be more able to admit to and to express their feelings. The Intangibles Survey results confirm that women felt that their households were more affected by most impacts than men (RPA/FHRC, 2004), but it is interesting to note that these striking differences according to gender were not identified in earlier FHRC surveys.
The correlation matrix in Table 6.2 summarises the relationships between the subjective severity scores. All the correlations are significant at the 0.01 level (two tailed).
Some strong associations between the severity rating can be identified in the matrix. The most highly rated impact, disruption, and all the problems of getting the home back to normal, was most closely associated with the stress of the flood event itself, also a highly rated impact. This suggests that the stress associated with the flooding extended beyond the event itself into the recovery period. The rating of damage to the contents of the home was also associated with disruption.
document.doc 29/06/0778

FLOODsite Project Report Contract No:GOCE-CT-2004-505420
Table 6.1: Subjective rating of the severity of the effects of flooding on the household: Intangibles Survey
Effect% with a rating score of Mean scores Median
%1
%2-3
%4-7
%8-9
%10 Men Women
All
All
N=
Getting house back to normal
4 7 22 27 40 7.4 8.0*** 7.8 9 967
Stress of the flood event itself
6 11 27 21 35 6.7 7.4*** 7.1 8 972
Having to leave home
12 10 20 23 35 6.4 7.3*** 7.0 8 714
Worry about future flooding
8 13 32 21 26 6.1 6.8*** 6.6 7 968
Damage to replaceable items
8 14 30 18 29 6.2 6.7* 6.5 7 943
Damage to house itself
9 16 27 20 18 6.1 6.9** 6.4 7 951
Irreplaceable items loss
24 14 21 15 25 5.0 6.0** 5.6 6 656
Builder problems
27 18 24 14 16 4.5 5.1* 4.9 4 839
Insurance problems
27 21 23 13 16 4.7 4.7 4.7 4 895
Loss of or distress to pets
39 12 17 16 16 3.9 5.0*** 4.6 3 537
Loss of house value
32 15 26 13 14 4.3 4.7 4.6 4 779
Health effects 24 19 38 11 8 4.0 4.9*** 4.5 4 966
Overall effect 2 11 32 26 19 6.7 7.6*** 7.3 8 973
Men and women* t test; p<0.05** t test; p<0.01*** t test; p<0.001Source: RPA/FHRC 2004
The stress rating was associated not only with disruption but also with having to leave home, worry about future flooding and with health effects. This rating therefore appeared to capture many of the most severe impacts of flooding on the lives of households. Having to leave home was most strongly linked to the rating of getting the home back to normal and to damage to the property structure, with the stress of the flood event itself also a strongly associated effect.
The overall rating of the seriousness of the effects of flooding was highly correlated with the stress rating. Other effects that were closely associated with the overall rating were disruption, having to leave home, health effects and damage to the house. Two of the subjective severity measures, the stress of the flood event rating and the overall rating of the effects have been selected for further examination in the following section because they appear to be associated with a number of the most serious specific effects of flooding.
document.doc 29/06/0779
FLOODsite Project Report Contract No:GOCE-CT-2004-505420
Table 6.2: Correlations between the subjective severity scores: Intangibles Survey
Effect A B C D E F G H I J K LA Getting house back to normalB Stress of the flood event itself
.72
C Having to leave home
.58 .57
D Worry about future flooding
.52 .60 .43
E Damage to replaceable items
.57 .51 .50 .42.
F Damage to house itself
.55 .53 .58 .41 .48
G Irreplaceable items loss
.42 .42 .45 .38 .44 .44
H Builder problems
.34 .26 .28 .24 .17 .31 .22
I Insurance problems
.36 .32 .31 .30 .26 .34 .26 .45
J Loss of or distress to pets
.38 .35 .33 .25 .27 .37 .39 .34 .32
K Loss of house value
.29 .30 .30 .38 .27 .33 .26 .25 .30 .30
L Health effects .53 .59 ..51 .47 ..40 ..42 .38 .24 .29 .38 .27
M Overall effect .69 .72 .61 .57 .54 .60 .49 .30 .35 .44 .35 .61
6.2 Resilience and vulnerability
This section of the report sets out to examine in detail the concepts of vulnerability and resilience through further detailed analysis of the Intangibles data for the flooded population. We currently know least about the social aspects of vulnerability, partly due to the fact that it is not always easy to quantify socially created vulnerabilities (see Task 11 Social Indicator Set report, Tapsell et al., 2005). There has also been much discussion in recent years on whether certain individuals or groups within communities such as the elderly, the very young, women, the disabled, ethnic minorities etc. are likely to be more vulnerable or resilient to the effects of hazards and disasters than the population in general (Morrow, 1999; Fordham, 1998; Buckle et al., 2000). Moreover, the vulnerability of human beings in the community has emerged as the least known element in the disaster literature as hazard-proof building structures and prediction of hazard impact and warning systems have been improved (King and MacGregor, 2000).
There is still a limited understanding of what the terms vulnerability and resilience include (Buckle et al., 2000, and see Section 1.2.1). We hypothesise that resilience will be a function of vulnerability plus other factors, which include:
material resources: e.g. insurance, income, car ownership; personal/household resources: e.g. skills, knowledge, experience, time; community resources: e.g. help or support; and evacuation, disruption, problems with builders or insurers.
These (other) factors affect: a) the ‘coping capacity’ or the ‘means by which people or organisations use available resources and abilities to face adverse consequences that could lead to a disaster’’
document.doc 29/06/0780

FLOODsite Project Report Contract No:GOCE-CT-2004-505420
(FLOODsite, 2005), and b) the ‘available resources’. However, not all the above information can be obtained from the existing FHRC datasets as these data were collected for a different purpose.
According to their vulnerability, people or households will experience different degrees of tangible and intangible damages due to flooding. Moreover, depending on their resilience, some people or households will recover better than others. The question is, can a very vulnerable household, person or community also be very resilient?
There is some overlap in the definitions. Characteristics that determine vulnerability can also affect resilience or the capacity to recover. This is one of the reasons that make separating the two concepts difficult. Resilience is affected by vulnerability, but can increase or decrease independently. For instance, having insurance against flooding will increase the resilience of a household; it will help them recover better from (at least the financial) effects of the flood. Insurance will not reduce the damages to the house or its contents but will help the recovery, so it does not affect the vulnerability. Flood proofing measures or flood warnings, on the other hand, reduce vulnerability by potentially reducing damages to the household.
Some people are affected more severely by a flood than others. In order to see what factors affect the vulnerability and resilience three variables have been chosen as dependent variables and are outlined below.
The GHQ (General Health Questionnaire). This is a self-completion questionnaire that was designed as a screening test for detecting psychiatric disorders (Goldberg and Williams, 1988). The GHQ12 (12 questions) is regularly used in annual health surveys in England8. However, the GHQ only takes into account symptoms experienced in the past few weeks and does not focus on the health impacts from a specific event. To overcome this, the questionnaires were administered twice: once to measure ‘current’ health and secondly to focus on the ‘worst period’ after the flood event (RPA/FHRC, 2004). Current GHQ12 scores can be used as a measure of resilience but also can be studied as a function of the GHQ12 in the worst period and why some people recover better than others.
Overall subjective severity. Respondents were asked to rate the overall effects of the flood on the household using a 1 (no effects) to 10 (extremely serious) scale. Unlike the GHQ12, this is not an ‘individual’ measure as respondents were asked to consider the effects on the household.
Subjective stress on the household. Respondents were asked to rate the effects of the stress of the event on the household using the same 1 to 10 scale. This is another household measure.
The dependent variables (overall severity, subjective stress and GHQ12 current and worst) will be explained by several factors. The variables that are most likely to account for the vulnerability of the respondents are:
People/ household characteristics: e.g. age, gender, prior health, social class, household composition (e.g. presence of children and people over 75 in the household).
The flood event characteristics: i.e. depth, number of rooms affected, duration, speed of onset, contamination, damages, warnings.
Type of dwelling: people living in ‘vulnerable housing’ (e.g. single storey dwellings or basement flats) will be more vulnerable to the consequences of the flood event, that is, there are no upper floors to store furniture or to seek refuge.
Thus the reanalysis is based on a model that considers that vulnerability and resilience to flooding depend on a series of factors: flood event characteristics, social characteristics including prior health, dwelling characteristics and post-flood factors or intervening factors, see Figure 6.1.
8 See for instance: Health Survey for England 2003. Available: http://www.dh.gov.uk/PublicationsAndStatistics/Publications/PublicationsStatistics/PublicationsStatisticsArticle/fs/en?CONTENT_ID=4098712&chk=F4kphd
document.doc 29/06/0781

FLOODsite Project Report Contract No:GOCE-CT-2004-505420
Figure 6.1: Model of factors affecting vulnerability and resilience to flooding
The following variables will be investigated in order to explain resilience.
1. Money, income and savings used to repair the effects of the flood event. Having savings can help reduce the effects of the flood event and increases resilience. The amount spent by respondents (uninsured losses) can be normalised by level of income and/or social class. Having insurance is another key variable that will increase people’s resilience. The type of contents insurance (e.g. new for old) can be another key variable.
2. Demographics such as age, gender, social grade, number/presence of children, and single parents can affect resilience. Moreover, older people living alone may be less resilient, whilst people with higher education, as reflected in social grade, may be more articulate and more able to get help, and therefore more resilient.
3. There are no specific questions regarding community cohesion or social capital in the data sets. Length of residence and help received may give some indication of levels of support received from within the community. For instance, people that have been living at the same address for a number of years will be, in theory, more integrated in the community. The sources of help, such as neighbours or friends, can also indicate level of support within the community. People that have been living at the same address for a long time will be expected to have received more help from their neighbours and perhaps be more active in flooding groups. People with more social capital may rate the overall severity, health effects or stress as lower than people who do not receive support from their neighbours or have been living in the area for a shorter period. Another aspect that can be investigated is whether people that have been more active and participated in flood related groups/events/letters report better health.
4. General disruption to the life of the household, having to take days off work, having to leave the home and the length of evacuation, are all variables that are likely to increase the stress and severity of the event. Time to get back to normal is another measure of disruption.
document.doc 29/06/0782

FLOODsite Project Report Contract No:GOCE-CT-2004-505420
As well as the above, there are also other intervening factors that may occur after the flood event and that may also affect resilience:
problems with insurance companies and building contractors; worry about future flooding; and awareness of the risk of flooding and preventative measures (including insurance).
Thus the main hypotheses are:
1. Resilience (as measured by the GHQ, subjective severity and subjective stress) is a function of vulnerability (determined by flood event characteristics, dwelling characteristics and people/household characteristics) and the coping capacity (resources and how they are utilised).
2. Within vulnerable groups, if some people are shown to recover better from flooding than others, resilience can then be increased on its own.
3. Mediating factors such as problems with insurers and builders, evacuation, worry, awareness and preventative measures affect the coping capacity and thus resilience.
6.2.1 Measures of vulnerability and resilienceThe four variables used in the analysis as measures of vulnerability and resilience are:
1. The General Health Questionnaire 12 (GHQ12) current score.2. The General Health Questionnaire 12 (GHQ12) worst time score.3. Overall severity of the effects of the flood on the household.4. The effect of the stress of the flood event itself on the life of your household.
For conciseness, on occasions these variables are referred to jointly as ‘vulnerability variables’:
Unlike the GHQ12 questionnaire, which is a measure of the individual’s health, the subjective measures refer to the effects of the flood on the household. Therefore they are not measuring the same thing. While the GHQ12 scores and the factors that influence them have been examined in detail (Tunstall et al., 2006), no detailed analysis has previously been undertaken for the subjective severities. It is useful to present a comparative analysis of the two variables here.
As well as ‘objective’ measures of the impacts of flooding such as depth, number of rooms flooded, days spent away from the home, insured and uninsured costs, visits to doctors, etc. respondents were asked to rate the effects of several of those effects on the household. These ‘subjective’ variables were scored on a scale of 1 (indicates "no effect") to 10 (indicates "extremely serious effect").
6.2.2 Background to the General Health QuestionnaireAs mentioned above, the General Health Questionnaire (GHQ) is a self-administered screening test aimed at detecting psychiatric disorders in community and non-psychiatric clinical settings. The GHQ was designed to be easy to administer, acceptable to respondents, fairly short and objective. It focuses on the psychological components of ill-health (Goldberg and Williams, 1988). The GHQ12 is a shorter version of the original GHQ60 questionnaire, and has been widely used with disaster victims (e.g. Reacher et al., 2004), and is regularly used in annual health surveys in England. The GHQ12 consists of twelve questions concerning general level of happiness, depression, anxiety and sleep disturbance over the past few weeks (Sproston and Primatesta, 2004).
The GHQ was designed for London and was intended to be culture-specific. However, the test has been translated into 38 languages and seems to work just as well in India, China or south London and also in very different settings: from rural communities to university students and general practice clinics. This seems to indicate that psychological distress has certain common features in widely different settings. Symptoms such as not being able to sleep due to worry or the inability to face up to
document.doc 29/06/0783

FLOODsite Project Report Contract No:GOCE-CT-2004-505420
one’s problems appear to be common to the human condition rather than being country-specific (Goldberg and Williams, 1988).
The GHQ focuses on changes in normal functions rather than upon long term disorders. The questionnaire focuses on two main classes of phenomena:
1. The inability to continue to carry out one’s normal ‘healthy functions’.2. The appearance of new phenomena of a distressing nature (Goldberg and Williams
Scoring the GHQ12Each item in the questionnaire consists of a question on whether the respondent has been experiencing a particular symptom on a 0-3 scale ranging from ‘less than usual’ to ‘much more than usual’. Each of the 12 questions thus has four possible responses. The GHQ12 is very simple to score and also has the advantage of eliminating any errors due to ‘end users’ or ‘middle users’ (Goldberg and Williams, 1988). Scoring can be by one of two methods: the GHQ method (score 0-12) and the Likert method (score 0-36). To use the GHQ method, the first two response categories for each question are both given a zero score (no symptoms) and the third and fourth response categories are given a score of one (some symptoms). This method simply differentiates between those respondents within a sample who display symptoms of impaired mental health (cases) compared with those that do not (non cases). It does not take into account the degree of impaired health effects. The standard threshold for diagnosis of impaired mental health is a score of four or more out of the possible score of 12; this is referred to as a ‘high GHQ score’ (Sproston and Primatesta, 2004).
Using the second scoring method - the Likert scale - responses to questions are scored either 0, 1, 2 or 3, depending upon whether the respondent had experienced the symptom (e.g. 'Have you recently felt constantly under strain?') either not at all, no more than usual, rather more than usual or much more than usual. This system is preferred when the GHQ score is to be analysed as a continuous outcome. Total scores will be ranged between 0 and 36. Research suggests that 11-12 is the most effective threshold for identifying cases in Likert scored GHQ-12s. This means that respondents who score between 0 to 10 are not classified as cases, but those who score 11 and above are. However, thresholds may be varied to being higher or lower than 11/12, depending upon the particular population sample in question (Goldberg and Williams, 1988).
Current and Worst GHQ12The GHQ12 was administered twice in the survey. First, respondents were told ‘We would like to know how your health has been in general over the past few weeks.’ They were then asked to complete the 12 item General Health Questionnaire. The respondents were not asked how long they had been experiencing the symptoms but to focus on how they had been feeling over the last few weeks, and this may thus result in the short and medium-term affects of an event not being captured. The GHQ is thus sensitive to very transient disorders which may remit without treatment (Goldberg and Williams, 1988). Thus these responses cover the health of respondents at around the time of the interview referred to as the ‘Current GHQ12’. Very few of those interviewed had been flooded within the last year; most (58%) had experienced flooding between two and two and a half years earlier including the autumn 2000 floods; a substantial minority (26%) had experienced flooding four or five years earlier including the Easter 1998 floods. Thus, for most respondents years had elapsed since the flooding giving their health time to recover or, as in a few cases, to deteriorate.
Second, after flooded respondents had completed the GHQ12 with reference to their current health, they were asked ‘to think back to how your health was when the health effects from the flooding were at their most severe’ i.e. the worst time and to complete the GHQ12 again with reference to that time (RPA, FHRC, 2004). Earlier in the interview after questions on health effects, respondents had been asked, ‘At what stage during or after the flooding were the health impacts most severe or worst for you personally? Please think about health in the broadest sense to include physical, mental and social
document.doc 29/06/0784

FLOODsite Project Report Contract No:GOCE-CT-2004-505420
well-being’. Respondents were asked to refer to this ‘worst time’ in completing the GHQ12 for a second time referred to as the ‘Worst GHQ12’. This required respondents to think back and recall how they felt in most cases several years earlier.
The ‘worst ever episode’ approach has been validated by Power (1988 and undated) using the longer GHQ28 questionnaire. It was not possible to validate the approach in the Intangibles study, but it was concluded that the GHQ12, if applied retrospectively to the ‘worst time’ following the flood, provided a reasonable measure of the short-term psychological effects (RPA, FHRC, 2004). A version of the GHQ12 questionnaires used in the Intangibles Survey is included in Appendix 2.
6.2.3 Response to the vulnerability variablesNot all those interviewed in the Intangibles Survey were able or willing to complete the GHQ12 questionnaires. In the flooded interview, the request to provide these responses came more than half way through the interview after the respondents had answered questions on flooding and its impacts but before the willingness to pay questions. Among those flooded, a total of 814 answered the current GHQ12, giving a non-response rate of 17.4%. Most of those flooded respondents who provided answers to the current GHQ12 went on to give information about their worst time. Worst time GHQ12, responses were obtained from 810, giving a non-response rate of 17.8%. In the at risk sample, the respondents were faced with a shorter questionnaire and response on the current GHQ12 was higher in this sample, with responses obtained from 485 at risk respondents, giving a non-response rate of 8%.
Response was much higher on the questions rating the stress of the flood event and the overall severity of the effects of the flood. The number of flooded respondents providing answers to these questions was 972 with only 11 non respondents for stress and 973 with 10 non-respondents for overall severity.Thus, it should be noted that the responses to the variables are drawn from different groups of respondents.
6.2.4 Correlations between vulnerability variables The following table (Table 6.3) shows the correlations between current and worst GHQ12 scores (both GHQ and Likert scoring) and the other measures of vulnerability to give an indication of the extent to which the different measures are measuring the same thing. Not surprisingly, the two methods of scoring the GHQ12 produce scores that were very closely correlated.
When the current and worst GHQ12 scores were correlated with the subjective severity measures of stress and overall severity, the worst time scores were more closely related to stress and the overall severity than the current GHQ12 scores. This is true whatever method of scoring the GHQ12 is adopted. The worst time, stress and overall severity vulnerability measures were all placed closely in the context of the recent or worst flood event, whereas the current GHQ12 questions administered without reference to the flood event, were not. However, the current GHQ12 scores were moderately strongly correlated with the worst time scores under both methods indicating a link between current and worst time health.
Table 6.3: Correlations between current and worst GHQ12 scores and other vulnerability variables: Intangibles Survey
document.doc 29/06/0785

FLOODsite Project Report Contract No:GOCE-CT-2004-505420
Vulnerability measure
Current GHQ12
Current GHQ12 Likert
GHQ12 worst
GHQ12 worst Likert
Stress of the flood event
Current GHQ12
Current GHQ12 Likert
.92
GHQ12 worst .47 .47
GHQ12 worst Likert
.50 .54 .94
Stress of the flood event
.31 .29 .51 .50
Overall severity
.31 .30 .51 .50 .74
6.2.5 Stage at which the health and other impacts of flooding were worstThe responses to the question “At what stage during or after the flooding were the health impacts the most severe or worst for you personally? Please think about health in the broadest sense to include physical, mental and social well-being” provide a guide as to when flooded respondents considered themselves to be at their most vulnerable. Figure 6.2 shows the stage when the health effects were most severe. A significant proportion (76 or 8%) did not name a stage. There was a wide range of responses on the time when the impacts were worst. For half the respondents who did respond, the worst stage occurred early on, during or within a month of the event in the immediate aftermath as they came to terms with what had happened. However, there were others for whom the worst effects were not felt until months after the flood itself during the recovery period. Respondents were also asked about the duration of the worst stage. A third of respondents did not provide information on this. Of those that did, a majority reported the worst stage lasted no more than two or three weeks. However, there were others who reported suffering severe effects for months.
Figure 6.2: Percentage reporting stage at which the health impacts were most severe: Intangibles Survey
"At what stage during or after the flooding were the health impacts most severe or worst for you personally?" (n=907)
12
10
11
17
14
15
21
0% 5% 10% 15% 20% 25%
Other
More than six months after flood
Between one to three months after flood
Between one to six months after flood
In the first month after the flood
In the first week or two after the flood
During flood event itself
Percentage
Men and women showed the same pattern of response on the stage at which the impacts were worst for them. There were also no significant differences in the responses according to the social grade of the respondent. However, there were significant differences in the responses with age (Chi-square; p<0.01). In particular, there was a trend for the proportion citing ‘during the flood event itself’ to
document.doc 29/06/0786
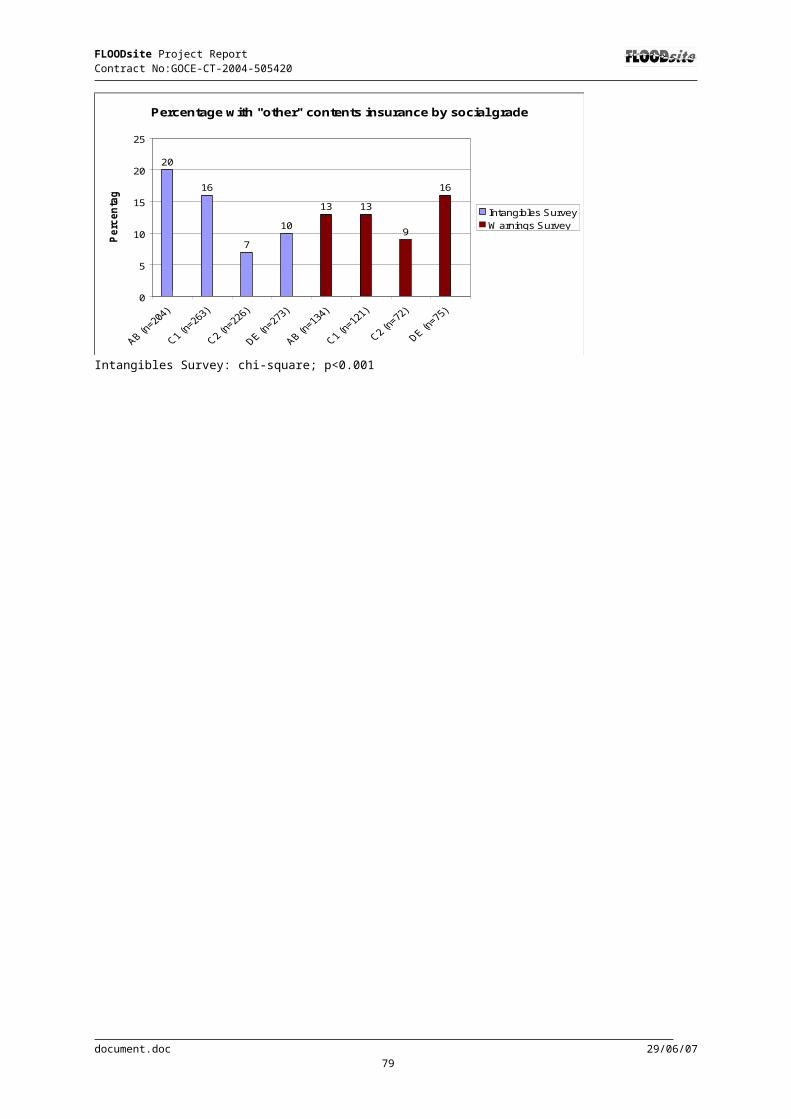
FLOODsite Project Report Contract No:GOCE-CT-2004-505420
increase with age and this was the most common response of the 75 and over age group, given by 25% of them. People aged under 55 most commonly reported the first week or two as having most impact.
The stage at which the impacts were worst for flooded respondents also varied according to the extent (Chi-square; p<0.01) and depth (Chi-square; p<0.05) of main room flooding. For those minimally affected i.e. with no main room flooding, or only one main room affected and those flooded to a low level (<10cms), the worst period occurred early for most people. Their most common response was ‘during the flood event itself followed by the first week or two after the flood. There were few of the minimally affected for whom impacts peaked later. Those worst affected i.e. with four main rooms flooded or a metre or more of flood waters in the home commonly cited one to three months after the flood as well as the first week or two as their worst time and their range of responses was quite varied. For those whose extent and depth of flooding fell in between, the first week or two was a common response but again the peak time occurred at varying times after the event. Table 6.4 shows the mean scores on the vulnerability variables according to the reported worst stage.
Table 6.4: Mean scores on vulnerability variables according to the reported worst stage: Intangibles Survey
Stage Stress of the flood eventMean score(scale 1-10)
Overall severity
Mean score (scale 1-10)
Worst GHQ12 LikertMean score (Scale 0-36)
Current GHQ12 LikertMean score (scale 0-36)
During the flood event itself
7.2 6.7 16.5 11.8
In the first week or two after the flood
7.8 7.8 18.9 12.8
In the first month after the flood
8.1 8.2 20.8 13.3
Between one month and three months after the flood
7.8 7.8 20.8 13.6
Between three to six months after the flood
7.7 7.9 21.6 13.1
More than six months after the flood
7.6 7.6 19.6 14.4
Other 5.3 5.8 13.3 10.7
N= 896 898 751 755
For the stress of the flood event itself and the overall severity of the effects, the highest scores were found among those whose worst stage occurred in the first month although a range of worst stages attracted high average scores. GHQ12 Likert worst time peak scores were found for those whose worst stage was later, between three and six months after the event, well into the recovery period but there were high scores for all stages apart from the flood event itself and those who gave other answers. The current GHQ12 Likert scores were highest where the worst stage of the flood was reported as occurring between very late or six months or more after the event, perhaps because these respondents had had less time to recover when the worst impacts were experienced late on in the process. These responses indicate that the impact of flooding extend over time and are experienced very differently over time by different individuals, reflecting in part the nature of the flood event that affected them and their own characteristics.
6.2.6 Comparison between Intangibles Survey data and 1998 Health Survey for England: current GHQ12 results
document.doc 29/06/0787
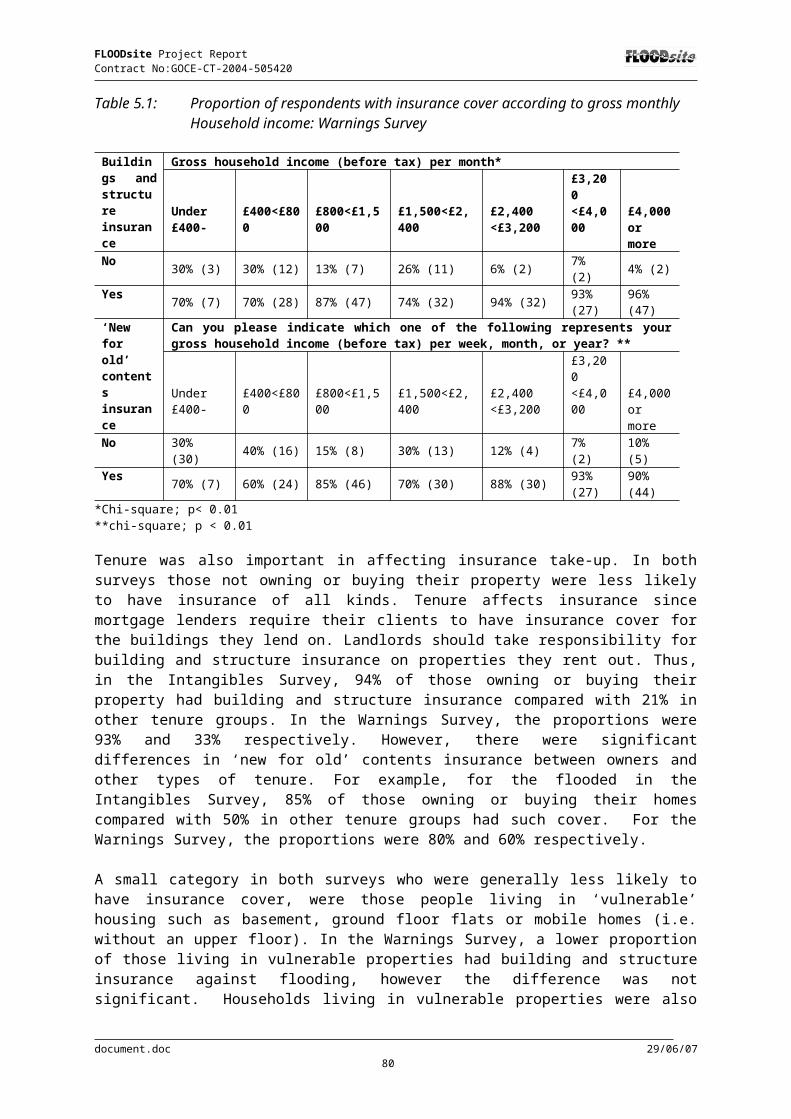
FLOODsite Project Report Contract No:GOCE-CT-2004-505420
According to the 1998 Health Survey for England data (Sproston and Primatesta, 2004), 13% of men and 18% of women had a high GHQ score (four or more). In the flooded sample, 22% of men and 26% of women had scores of four or more in the current GHQ12. Thus, more flood victims scored four or more at the time of the interview than was found to be the case in the population of England as a whole. The Intangibles survey was conducted in autumn 2002 and most respondents had been flooded in autumn 2000 and 1998, so this result also indicates that flooding has long-lasting health effects on the victims.
Figures 6.3 and 6.4 show the distribution of 4+ scores in flooded men and women, compared with the national averages from the Health Survey for England 1998 by age group. Female flood victims were more likely to score 4 or more in all age groups compared with national averages. In the case of males, the same is true for all age groups except 16-24 (although this group only had eight respondents in total in the Intangibles Survey) and over 75s. The most striking differences in high scores between the flooded in the Intangibles Survey and the national average were found in the 55-64 age group both for men and women, suggesting that the mental health of this age group is particularly susceptible to the impact of flooding. There are of course problems in making direct comparisons with the national data because the Intangibles Survey locations are unlikely to be representative of the country as a whole and they include some data from Wales which the Health Survey data does not.
Figure 6.3: Percentage with high current GHQ12 scores among men in the Intangibles Survey compared with the national average
Men : Percentage with high GHQ12 scores (4+ scores) in the Intangible Survey and Health Survey for England 1998
(national average)
16
11
13
13
14
12
15
16
30
22
23
17
010
0 10 20 30 40
75+
65-74
55-64
45-54
35-44
25-34
16-24
Age
Percentage with 4+ scores
Intangibles Survey (n=496)National average (n=8254)
6.2.7 Comparison between the ‘flooded’ and the ‘at risk’ samples in the Intangibles Survey on Current GHQ12
In the Intangibles Survey, the at risk respondents were only asked to complete the GHQ12 for their current health. Other measures of vulnerability are not available for the at risk sample. Those who had had their homes flooded were significantly more likely to have high current GHQ12 scores than those at risk living in the same areas (Figure 6.5). The ‘at risk’ sample was not matched with the flooded sample and differed in some significant ways from those who had experienced flooding in the recent event, in particular, the two samples differed in terms of age (see Table 3.1 and 3.4). It was not possible to make the comparison by gender and age because the at risk sample was not large enough. However, when controlling for age, with the exception of the 60+ age group, the flooded, were age for age, more likely to have high GHQ scores than the at risk (Figure 6.5). This again indicates that the experience of being flooded has long term effects on health and well being and that those whose homes are flooded are more vulnerable than those who merely live with the risk. There were significant differences in the current GHQ12 scores of the flooded and at risk when gender, social grade and length of residence (<5 years or not) and tenure were taken into account.
document.doc 29/06/0788

FLOODsite Project Report Contract No:GOCE-CT-2004-505420
Figure 6.4: Percentage with high current GHQ12 scores among women in the Intangibles Survey compared with the national average
Women: Percentage with high GHQ12 scores (4+ scores) in the Intangible Survey and in the Health Survey for England
1998 (national average)
18
15
14
19
20
18
22
25
25
31
25
24
26
25
0 10 20 30 40
75+
65-74
55-64
45-54
35-44
25-34
16-24
Age
Percentage with 4+ scores
Intangible Survey (n=496)National average (n=8254)
Figure 6.5: Percentage with high Current GHQ12 scores among the flooded and at risk in the Intangibles Survey
Percentage of flooded and at risk with high current GHQ12 Scores (4+scores) by age.
9 8
11
15
10
20
27 27
24 25
0
5
10
15
20
25
30
18-39* 40-49** 50-59* 60+ All***
Age
Perc
enta
ge
At riskFlooded
6.3 Factors that may influence vulnerability and resilience
The variables that have been explored in bi-variate analyses in order to explain vulnerability and resilience are:
social characteristics and health; dwelling characteristics; flood event characteristics; and other factors.
6.3.1 Social characteristics and health
document.doc 29/06/0789

FLOODsite Project Report Contract No:GOCE-CT-2004-505420
This section looks at characteristics of individuals or households that may increase their vulnerability to the effects of a flood event. These characteristics include gender and age of respondents, social grade and household composition (i.e. presence of children, single parents, and elderly people alone). Prior health and long-term illness or disability are other factors that may determine the vulnerability of an individual. Finally, this section looks at respondents that had to see a doctor as a consequence of the flood
Gender A significantly higher number of women scored 4 or more in the worst GHQ12 (57% versus 45%). However, the percentage of women that scored 4 or more in the current GHQ12 was not significantly different from the percentage of men. The average worst GHQ12 (Likert) score for women was 19.4 versus 16.6 for men (t test; p< 0.001). However, when looking at Current mean GHQ12 (Likert) scores, there was no significant difference in the ‘current’ scores between men and women. This seems to indicate that the women were more affected by flooding at the time than men but that the women in the sample recovered better than men: they were more resilient.
Women also rated the effects of stress and overall severity of the flood on the household significantly higher than men (Figure 6.6).
Figure 6.6: Mean scores for stress of the flood event and overall severity of the flood by gender: Intangibles Survey
Stress of the flood event and overall severity of the flood by gender (n=973)
6.7 6.77.4 7.6
0
1
2
3
4
5
6
7
8
9
10
Stress (scale 1-10) Overall Severity (scale 1-10)
Mea
n Sc
ore
MenWomen
Stress: t test; p<0.001Overall severity: t test; p<0.001
AgeConsidering the age of all respondents, there were significant differences in the proportions with high worst GHQ12 scores according to age, with the middle age groups (35-44, 45-54 and 55-64) having a higher proportion of high scores than the youngest age group (18-34) and the older groups. Markedly fewer of the over 75s had high worst GHQ12 scores (4+) (51% compared with the overall percentage, 63%) (chi-square, p<0.05). The mean worst GHQ12 Likert scores showed the same significant pattern with age (Anova, p<0.05).
There were no significant differences with age in the proportions having high current GHQ12 scores (4+) and in the mean current GHQ12 Likert scores. In this, the flooded residents were different from the national average in England where differences with age are normally found. This finding suggests that those in their middle years recover more fully from the effects of flooding than older and younger people so that the worst time differences disappear.
document.doc 29/06/0790

FLOODsite Project Report Contract No:GOCE-CT-2004-505420
Elderly respondents were not more likely to have rated the subjective effects of stress and overall severity higher than the rest of the sample. In fact, the over 75s showed lower average scores in both variables (Figures 6.7 and 6.8), although only the differences in stress were significant by age (Anova; p =<0.05).
Gender and ageWhen the worst GHQ12 scores by age were considered separately for men and women, there were no significant differences for men with age in the proportions with high GHQ12 scores (4+) or in men’s mean worst GHQ12 Likert scores with age. For women, however, age remained a factor. Among the women, the highest proportions of high worst GHQ12 scores (4+) were again found among those in the middle age groups, with lower proportions amongst younger and older age groups (Chi-square, p<0.01). There was a similar significant finding for mean worst GHQ12 Likert scores (Anova; p<0.05). When age is controlled, significant differences according to gender in the proportions with high worst GHQ12 scores (4+) were only found for the 35-44 and 45-54 age groups (chi-square, p<0.05 and 0.001 respectively), see Figures 6.9 and 6.10.
For current GHQ12 scores, however, age was not a factor for men or women considered separately, either in terms of high current GHQ12 scores or mean current GHQ12 Likert scores. Similarly when controlling for age, no significant gender differences were found for any age group on current GHQ12.
Figure 6.7: Mean scores for the stress of the flood event by age: Intangibles Survey
Stress of the flood event by age (n=971)
7.5 7.3 7.3 7.3 7.16.3
0
1
2
3
4
5
6
7
8
9
10
18-34(n=103)
35-44(n=209)
45-54(n=191)
55-64(n=196)
65-74(n=127)
75+(n=145)
Age
Mea
n Sc
ore
Stress of theflood event(scale 1-10)
document.doc 29/06/0791

FLOODsite Project Report Contract No:GOCE-CT-2004-505420
Figure 6.8: Mean scores for overall severity of the flood by age: Intangibles Survey
Overall severity of the flood by age(n=971)
7.2 7.57.1 7.3 7.3
6.8
0
1
2
3
4
5
6
7
8
9
10
18-34(n=103)
35-44(n=209)
45-54(n=191)
55-64(n=196)
65-74(n=127)
75+(n=145)
Age
Mea
n Sc
ore
Overall severityof the flood(scale 1-10)
Figure 6.9: Mean scores for the stress of the flood event by gender and age: Intangibles Survey
Stress of the flood event by gender and age
6.8 6.7 6.8 7.16.5
5.9
7.8 7.7 7.7 7.4 7.4
6.5
0
1
2
3
4
5
6
7
8
9
18-34 35-44 45-54 55-64 65-74 74+
Age
Mea
n Men (scale 1-10)Women (Scale 1-10)
document.doc 29/06/0792
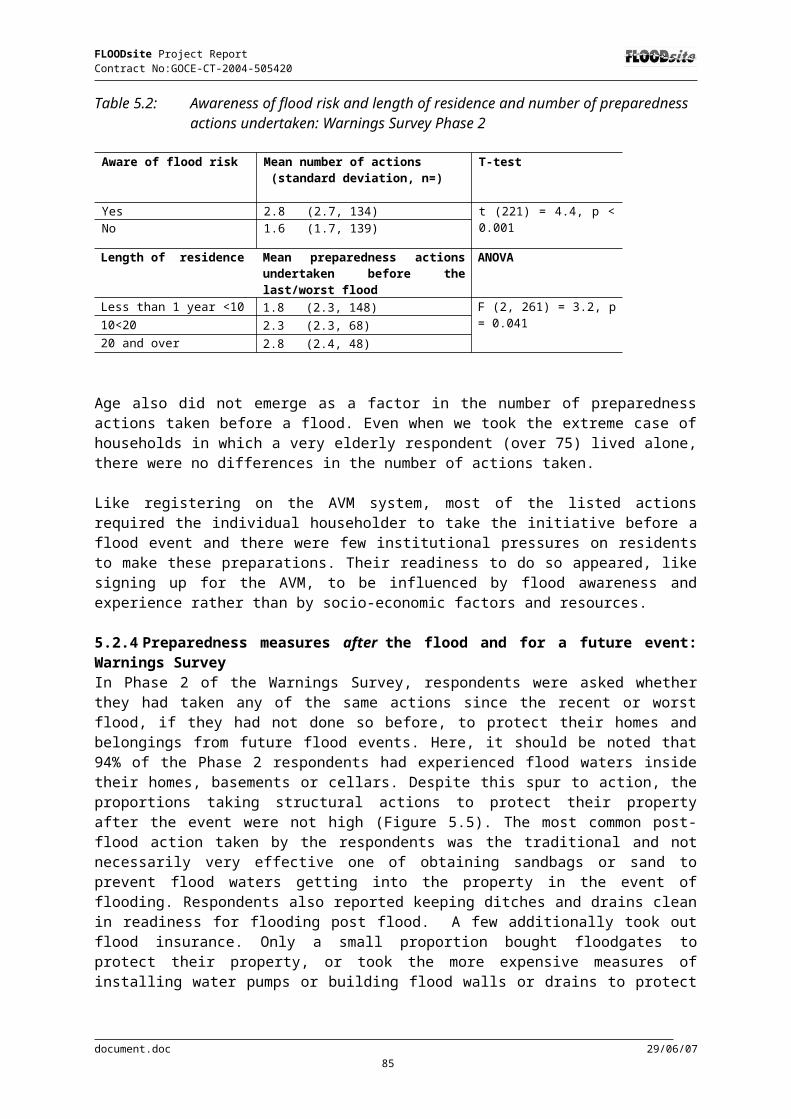
FLOODsite Project Report Contract No:GOCE-CT-2004-505420
Figure 6.10: Mean scores for overall severity of the flood event by gender and age: Intangibles Survey
Overall severity of the flood event by gender and age
6.6 6.96.4
7 6.7 6.4
7.6 7.9 7.6 7.6 7.77
0
1
2
3
4
5
6
7
8
9
18-34 35-44 45-54 55-64 65-74 74+
Age
Mea
n sc
ore
Men (Scale 1-10)Women (Scale 1-10)
Age was a significant factor when men and women were considered separately on other vulnerability vcariables. There were significant differences for men by age group in overall severity (Anova F test; p<0.05). Women had significantly different stress scores by age group (Anova F test; p <0.05).
In summary, women were more vulnerable to the effects of the flood having significantly higher ‘worst time’ GHQ12 scores. Women also rated both the effects of the stress and overall severity significantly higher. There were no significant differences in GHQ12 ‘current’ scores. The age group 55-64 had the highest percentage of high current GHQ12 scores (4+) in both men and women. The over 75s were not found to be more vulnerable. This age group was not more likely to have high GHQ12 scores or rate the stress and overall severity of the event higher than the other age groups.
Social gradeThere were no significant differences in GHQ12 scores, current or worst time, by social grade. There were, however, significant differences in subjective stress and overall subjective severity, with AB or C1 respondents rating these effects lower than C2 or DE respondents (Figure 6.11).
Figure 6.11: Mean scores for the stress of the flood event and overall severity of the flood by social grade: Intangibles Survey
Stress and overall severity by social grade(Stress n=951, Overall severity n=952)
7.5
7.7
7
6.1
7.4
7.4
7.2
6.6
0 2 4 6 8 10
DE
C2
C1
AB
Soci
al G
rade
Mean score
Overall severity(Scale 1-10)**Stress of flood event(Scale 1-10)*
document.doc 29/06/0793

FLOODsite Project Report Contract No:GOCE-CT-2004-505420
Stress* Anova F test; p< 0.001Overall severity ** Anova F test; p<0.01
DE respondents were not more vulnerable to the health effects measured by the GHQ12 than the rest of the sample. However, AB particularly and also C1 respondents were less vulnerable to the effects of stress and overall severity on their household.
Household compositionHouseholds with children had an average stress score of 7.5 versus 7.0 of those households without children (t test: p<0.01). There were no significant differences in any other vulnerability variables. Households with young children (under 10) were not significantly more vulnerable.
A total of 271 respondents lived alone. They were no more vulnerable than other households. Indeed, those living alone has significantly lower mean stress scores than other households, (6.8 for those living alone compared with 7.3 for other households t test; p<0.05), Taking another extreme example of potentially vulnerable people, there were 161 respondents from households containing only people aged 75 and over. In 134 of those, there was one person of over 75 living alone. Neither type of household was more vulnerable than the rest of the sample. The only significant differences occurred in the average stress scores. Households containing over 75s only had lower average stress scores than the rest of the sample (6.4 compared with 7.3, t test; p<0.01) as did those households containing only one person over 75 (6.5 compared with 7.3, t test: p<0.01). These findings in the bi-variate analysis are counter to our expectations. Whether the elderly people who remained in their homes are survivors, with others more severely affected having died, moved away or into residential care cannot be determined. Similarly, hard to determine are whether generational effects may be at work which make the older age groups more resilient, for example with many older people having gone through the trauma of the second world war.
In summary, the presence of children was related to a higher rating of the effects of stress but had no influence on the other vulnerability variables. Households containing only very elderly people, either alone or not, showed no higher vulnerability than the rest of the sample, and even had lower average stress scores.
Prior health and long term illness or disabilityThe state of people’s health prior to the flood had a significant effect on the GHQ12 current scores. There were also significant differences in the mean scores of GHQ12 worst time (Figure 6.12).
Figure 6.12: Mean current and worst GHQ12 Likert scores by prior health: Intangibles Survey
Current and worst time GHQ12 by prior health(Current GHQ12 n=814 and worst GHQ12 n=810)
14.8 14.512.9 12.4 11.4
22.720.3
17.9 18.5 17.1
0
5
10
15
20
25
30
35
Poor Fair good Very Good Excellent
State of health in general before the worst flooding
Mea
n sc
ore
Current GHQ12 Likert (0-36)*
Worst GHQ12 Likert (0-36)Scale***
document.doc 29/06/0794
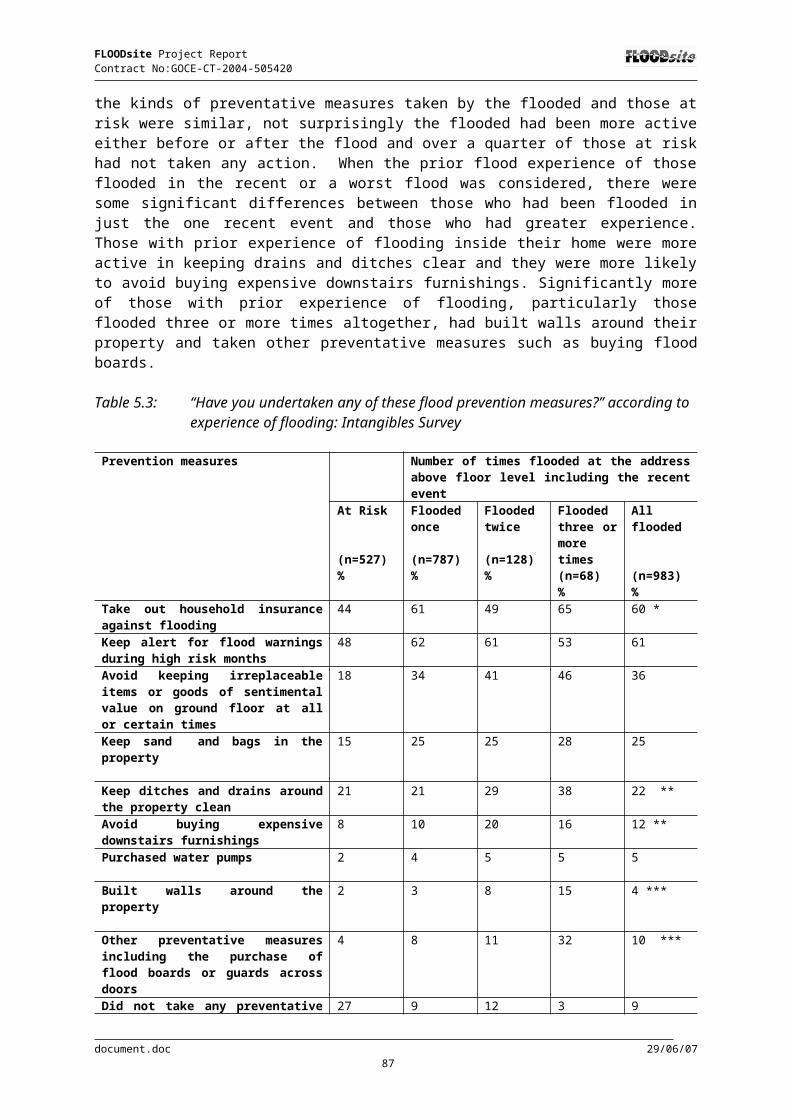
FLOODsite Project Report Contract No:GOCE-CT-2004-505420
* Current GHQ12: Anova F test; p < 0.001*** Worst GHQ12 : Anova F test ; p< 0.001
Additionally, the proportion with high scores (4+) in the current GHQ12 and the mean scores for overall severity of the flooding varied significantly according to their prior health (Table 6.5).
Table 6.5: Percentage with high scores on current GHQ12 and mean scores on overall severity of the flood by prior health: Intangibles Survey
How was your state of health in general before the worst flooding?
Current GHQ12
% scoring 4+
Current GHQ12
% scoring less than 4 *
Overall severity of the flood event**Mean score(Scale 1-10)
Poor 53 (17) 47 (15) 8.4Fair 41 (30) 59 (44) 7.4Good 25 (68) 75 (205) 7.1Very good 22 (56) 78 (199) 7.3Excellent 15 (27) 85 (153) 7.1
* Chi-square; p< 0.001** Anova F test; p < 0.05
Prior health had an effect on all vulnerability variables except stress. Respondents with poor or fair prior health were more vulnerable than those with good, very good or excellent health before the flood.
Respondents in the Intangibles Survey were asked about long term illness and disability before flooding, not only in terms of their own health but also in relation to other members of the household. It is useful to consider the responses to these two questions separately because the GHQ12 vulnerability measures refer to the individual respondent whereas the stress and overall severity measures are concerned with household effects.
Respondents with a long term illness or disability before the flood were significantly more likely to have high current scores in the GHQ12 (40% scored 4 or higher compared with 21% of those with no disability or long term health problems). The GHQ12 worst time scores of the ill and disabled respondents tended to be higher with significantly, but not markedly, more having 4+ scores (71% compared with 62% of other respondents). The mean current and worst time GHQ12 scores of ill or disabled respondents were also higher than those of other respondents (Figure 6.13). Thus, the data suggest that ill and disabled respondents were more affected by flooding at the time than others but more particularly they were less resilient and recovered less well than others and thus their current GHQ12 scores were significantly higher than those of other respondents.
The respondent being disabled or having a long term illness also had an effect on all the average scores on the other vulnerability variables, although these measured effects on households. (Figure 6.14).
The presence of a person with a long term illness or disability in the home, might be expected to put an extra strain on other household members at the time of a flood and thereafter. However, respondents who reported that their household contained someone with a long term illness or disability were no more likely than others to have high (4+) current or worst time GHQ12 scores. However, there were significant differences in the mean stress of the flood event scores for households containing someone with an illness or disability (Mean score 7.7 compared with 7.0 for other households, t test; p<0.05). There were similar significant differences for the mean overall severity scores for households with an ill or disabled member as compared with other households (Mean score 7.8 compared with 7.1, t test; p<0.01) Thus, the measures of vulnerability, which were in terms of effects on the household, were significantly different where there was an ill or disabled person other than the respondent in the household.
document.doc 29/06/0795

FLOODsite Project Report Contract No:GOCE-CT-2004-505420
Figure 6.13: Mean worst and current GHQ12 Likert scores by long term illness or disability of respondents: Intangibles Survey
Worst and current GHQ12 by long term illness or disability of respondents
14.2
20.6
12.4
17.9
0 5 10 15 20 25
Current GHQ12Likert (scale 0-
36)**(n=814
Worst GHQ12likert (scale 0-36)** (n=810)
Mean score
Non long term ill/disabledrespondentLong-term ill/disabledrespondent
Worst GHQ12: t test: p< 0.001Current GHQ12: t test; p<0.01
Figure 6.14: Mean scores on the stress of the flood event and overall severity of the flood by long term illness or disability of respondents: Intangibles Survey
Stress and overall severity by long term illness or disability of respondents
7.7
7.7
7.1
7
0 2 4 6 8 10
Overall Severity(scale 1-10)**
(n=873)
Stress of theflood (scale 1-10)* (n=872)
Mean score
Non long term ill/disabledrespondentLong-term ill/disabledrespondent
* Stress: t test; p<0.05** Overall severity: t test; p<0.001
Doctor consultationsRespondents were asked whether they had consulted a doctor after the flood regarding physical and psychological health problems experienced during and after the event: 185 people (30%) said they had consulted a doctor, and of those, 150 (81%) said they received treatment. Those who saw a doctor had significantly higher scores on the vulnerability variables than those who did not (Table 6.6). Significantly more of those respondents who scored four or more in both GHQ12 questionnaires consulted a doctor after the flood event than did all other respondents (including here those who did not respond to the GHQ12 questions). Half those with a current GHQ12 score of 4 or more had consulted a doctor compared with only 24% for the rest of the sample. For those with high GHQ12 worst time scores, the proportions were 36% compared with 22%.
document.doc 29/06/0796
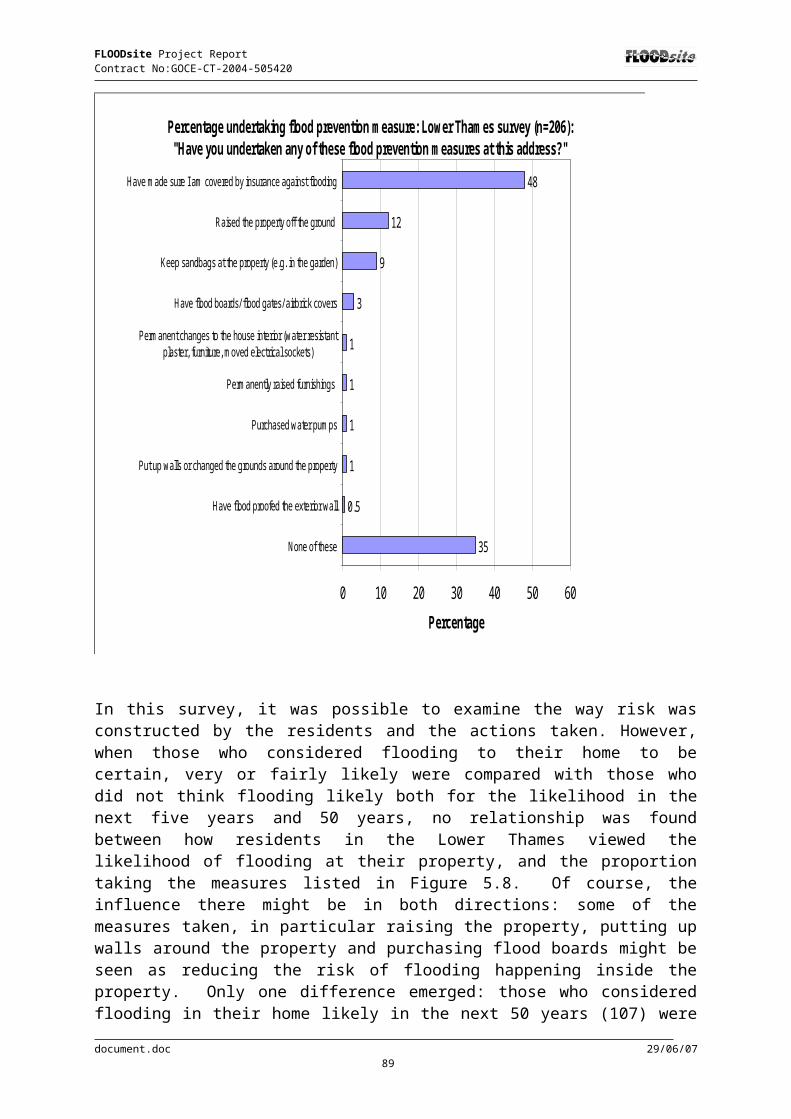
FLOODsite Project Report Contract No:GOCE-CT-2004-505420
Table 6.6: Mean scores on vulnerability variables by doctor consultations: Intangibles Survey
Variable Saw a doctor after the flood (Standard deviation, n=)
Doctor not consulted (Standard deviation, n =)
t test
Stress of the flood event
8.8 (2, 182) 7.8 (2.4, 327) t (441) = 5.1, p < 0.001
Overall Severity 8.7 (1.6, 183) 7.9 (2.1, 327) t (472) = 5.1, p < 0.001
Current GHQ12 Likert (scale 0-36)
15.7 (6.4, 125) 12.3 (4.7, 689) t (251) = 5.9, p < 0.001
Worst Likert GHQ 12 (scale 0-36)
25 (7.6, 158) 18.7 (7.4, 275) t (431) = 8.2, p < 0.001
Thus there is an association between the vulnerability variables and consulting a doctor. However, this behaviour can be seen as a confirmation or reflection of the vulnerability measures rather than as a contributory factor. We would not expect doctor visits to exacerbate the patients’ health and stress problems, although unsatisfactory consultations could do so.
6.3.2 Flood event characteristics
Depth, number of rooms flooded and contamination of floodwatersThere were weak but significant correlations between maximum depth of flooding in main rooms (bathroom, bedroom, kitchen, and living room), the number of main rooms flooded, and the four vulnerability variables. However, what is perhaps surprising is that the relationship between depth and extent of flooding is not stronger. It is clear from the data that individuals flooded to the same depth and extent respond very differently to the experience (Table 6.7).
There were differences in the proportions with high scores on the current and worst time GHQ12 according to the maximum depth of main room flooding (Figure 6.15). However the main distinctions were between those with no or low (less than 10 centimetres) flooding and those flooded to greater depths. It is also surprising that a proportion of those with no main rooms flooded who of course will have had flood waters in other parts of their dwelling such as a hall or basement also recorded high GHQ12 scores.
Table 6.7: Correlations between depth and number of rooms and vulnerability variables: Intangibles Survey
Variables Max depth main rooms, Pearson ρ
Number of main rooms, Pearson ρ
Stress of the flood event 0.118, p < 0.001, n = 969 0.239, p < 0.001, n = 972
Overall Severity 0.212 , p < 0.001, n = 970 0.293, p < 0.001, n = 973
Current GHQ12 (scale 0-36)
0.125, p < 0.001, n = 811 0.090, p = 0.010, n = 814
Worst GHQ12 (scale 0-36) 0.152, p < 0.001, n = 807 0.177, p < 0.001, n = 810
Figure 6.15: Percentage with high current and worst time GHQ12 scores by maximum depth of main room flooding: Intangibles Survey
document.doc 29/06/0797

FLOODsite Project Report Contract No:GOCE-CT-2004-505420
Current and worst time percentage with high GHQ12 score (4+ scores) by maximum depth of main room flooding
31
56
66
62
67
71
66
13
16
25
15
31
25
29
0% 20% 40% 60% 80% 100%
None
<10
10<20
20<30
30<60
60<100
1 metre or more
Floo
d de
pth
in c
entr
emet
res
Percentage
% with high current GHQ12scores (4+ score)% with high worst time GHQ12scores (4+ score)
Regarding pollution in floodwaters, 77% of respondents said that the floodwaters contained sewage or other pollution. Respondents who believed the flood waters to be polluted were significantly more likely to have high (4+) GHQ12 scores, particularly GHQ12 worst scores (68% compared with 41% for those who did not consider the flood waters to be polluted). The proportions scoring four or more on the current GHQ12 were also significantly different for those who thought the flood waters contaminated and those who did not (27% compared with 12%). This would seem to indicate that the presence of sewage or other pollution was one of the characteristics of the flood that had a significant effect on the mental health of respondents not only at the time of the flood but also in the long term. Respondents who reported pollution in the flood waters were also more likely to score higher on all four vulnerability variables (Figures 6.16 and 6.17).
Thus, as predicted in the model, certain flood characteristics, chiefly the depth, number of rooms flooded and the presence of sewage and other pollution in the flood waters have an impact on the vulnerability of respondents and their households but the relationship between flood characteristics and vulnerability is perhaps not a strong as might be expected.
Figure 6.16: Mean scores on the stress of the flood event and overall severity of the flood by pollution of the floodwaters: Intangibles Survey
Stress and overall severity by pollution of the flood water polluted
7.6
7.6
6.1
5.6
0 2 4 6 8 10
Overall Severity(scale 1-10)
(n=899)
Stress of floodevent (scale 1-10)
(n=899)
Mean Score
Not pollutedPolluted
Stress: t test: p<0.001Overall severity: t test ; p<0.001
document.doc 29/06/0798

FLOODsite Project Report Contract No:GOCE-CT-2004-505420
Figure 6.17: Mean current and worst GHQ12 Likert scores by pollution of the floodwaters: Intangibles Survey
Worst and current GHQ12 by pollution of the flood water
13
19.2
11
15
0 6 12 18 24 30 36
Current GHQ12Likert (scale 0-36)
(n=753)
Worst GHQ12Likert (scale 0-36)
(n=749)
Mean Score
Not pollutedPolluted
Worst GHQ12: t test; p<0.001Current GHQ: t test : p<0.001
6.3.3 Flood warnings, rate of onset and duration of floodOnly 23% (229) of respondents received a warning before the flood event. There were no significant differences between people that had received a warning and those who had not in terms of GHQ12 (worst and current), overall severity, and subjective stress scores. People that had not received a warning were not more likely to score 4+ in the GHQ12 (current or worst). No correlations were found between any of the variables and the length of warning. The warnings are intended to provide property owners with the opportunity to protect their property and to reduce the risk to life, but they are also intended to reduce the stress of a flood by allowing people time to prepare mentally for the flood. However, this did not appear to be the case on the evidence of the bi-variate analysis.
Other flood event characteristics that were examined in bi-variate analyses did not appear to have an effect upon the vulnerability measures. The rate of rise of floodwaters had no effect on the subjective scores, the GHQ12 scores or the likelihood of scoring 4 or more. There were also no correlations between the effects of stress, GHQ12 scores and duration of the flood. The duration of the flood was not significantly longer for respondents with high GHQ12 scores. There was only a weak significant correlation between the duration of the flood and the overall severity of the flood (r=0.11; p<0.01).
6.3.4 Tenure and housing characteristics
TenureRespondents that lived in rented accommodation showed greater vulnerability than those who owned or were buying their property on mortgage (Figures 6.18 and 6.19). Fewer respondents who owned their property or were buying on mortgage scored 4 or more in the GHQ12, (19% versus 27% of those who lived in rented homes, chi-square; p < 0.05).
Vulnerable propertyVulnerable properties are those situated on the ground floor or basement and where there are no upper floors to seek refuge from the floodwaters or to move furniture to. These include bungalows, ground floor and basement apartments and mobile homes. Those who lived in vulnerable properties had significantly higher vulnerability scores, except on the GHQ12 current (Figures 6.20 and 6.21).
Figure 6.18: Mean current and worst GHQ12 Likert scores by tenure: Intangibles Survey
document.doc 29/06/0799

FLOODsite Project Report Contract No:GOCE-CT-2004-505420
Worst and current GHQ12 by tenure
12.5
18
14
21.1
0 3 6 9 12 15 18 21 24 27 30 33 36
Current GHQ12Likert (scale 0-36)*
(n=722)
Worst GHQ12Likert (scale 0-36)** (n=718)
Mean Score
Rented
Owned/beingbrought onmortgage
*Current GHQ12: t test; p<0.05** Worst GHQ2: t test; p < 0.01
Figure 6.19: Mean scores on the stress of the flood event and overall severity of the flood by tenure: Intangibles Survey
Stress of the flood event and overall severity of the flood by tenure
7.2
7
7.8
8
0 2 4 6 8 10
Overall Severity(Scale 1-10)*
(n=964)
Stress of floodeven (Scale 1-10)*** (n=963)
Mean Score
Rented
Owned/being brought onmortgage
*** Stress: t test; p < 0.001* Overall severity: t test; p < 0.05
Figure 6.20: Mean current and worst GHQ12 Likert scores by whether or not respondents were living in vulnerable property: Intangibles Survey
document.doc 29/06/07100
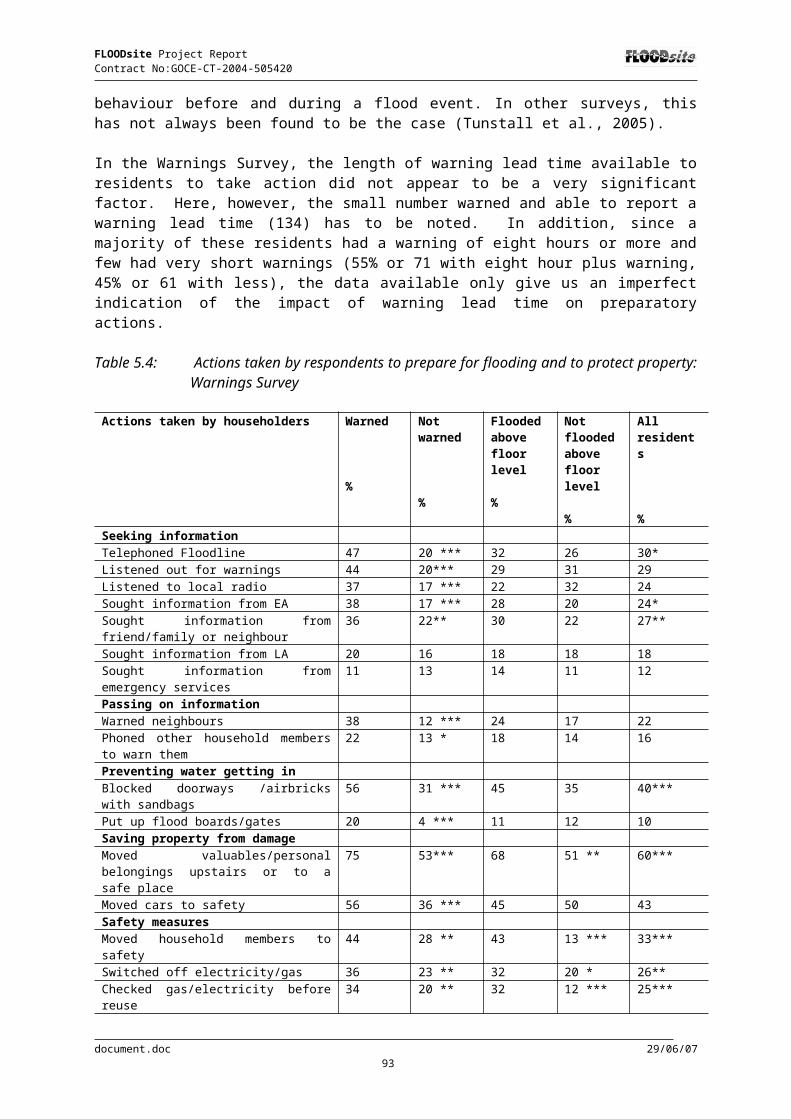
FLOODsite Project Report Contract No:GOCE-CT-2004-505420
Worst and current GHQ12 by whether or not residents were living in vulnerable property.
21.2
12.5
18.1
13.9
0 3 6 9 12 15 18 21 24 27 30 33 36
GHQ Current Likert(Scale 0-36) (n=794)
GHQ Worst Likert*(Scale 0-36) (n=794)
Mean score
Vulnerable property Not Vulnerable property
* GHQ Worst: t test: p < 0.05GHQ Current: Not significant
Figure 6.21: Mean scores on the stress of the flood event and overall severity of the flood by whether or not respondents were living in vulnerable property: Intangibles Survey
Stress and overall severity by whether or not residents were living in vulnerable property.
8.2
8.1
7.1
7
0 2 4 6 8 10
OverallSeverity***
(Scale 1-10)(n=953)
Stress of theflood event**(Scale 1-10)
(n=953)
Mean Score
Not Vulnerable propertyVulnerable property
** Stress: t test; p < 0.01*** Overall severity: t test; p < 0.001
Area house prices and length of residenceThe respondents were drawn from 30 locations across England and Wales. A house price rating (scale 1 to 5, 1 = high and 5 = low) was included as a surrogate variable to reflect locational characteristics (see Section 3.3.4). House prices were then compared to the national averages and assigned a simple rating value on a scale 1 to 5 (1 equates to areas where house prices are more than 1.4 times the national average, whilst a 5 equates to areas where house prices are up to 60% of the national average) (RPA, FHRC, 2004).
Area house price rating was weakly correlated with stress (Correlation 0.20, p <0.001, n = 972) and overall severity (Correlation 0.12, p<0.001, n = 973), i.e. the lower the area house price the higher the vulnerability of the household on these variables.
document.doc 29/06/07101

FLOODsite Project Report Contract No:GOCE-CT-2004-505420
There was no correlation between the length of residence and any of the vulnerability variables. However, those who had high GHQ12 worst scores had on average lived in the area almost three years less than those who scored lower than 4 (or who did not respond to the GHQ12 questionnaire): 16 years versus 19, ( t test; p <0.01).
6.3.5 Other factors in the aftermath of floodingOther factors are associated with the aftermath of the flood event and may also increase the severity of the effects of the flood or help the recovery. These factors include: having to leave the home, length of evacuation, length of disruption, problems with builders and insurers, worry about future flooding, and level of resources. Resources can be material or personal such as income, education, having insurance or social capital.
Problems with builders and insurersRespondents were asked to rate the impact that problems with builders and insurers had on their household on a scale 1 = no effect to 1- very serious effect. There were some among the flooded who did not have to call upon builders or insurers after the flood. Thus, there was significant non response to these questions mainly because they did not apply to these respondents. A total of 88 respondents 9% did not reply on insurers and loss adjustors; for builders, the figures were 144 or 15%. These are excluded from the correlations shown in Table 6.8. Having problems with insurers and builders is not directly related to the flood event characteristics, it is something that happens after the event during the recovery period. There were significant correlations with the four vulnerability variables which indicate that these were factors that exacerbated the impact of the flood event itself and affected the resilience and vulnerability of the respondents.
Table 6.8 shows the Pearson correlations between the four dependent variables and the effect of problems with builders and insurers on the household:
Table 6.8: Correlations between vulnerability variables and problems with builders and insurers: Intangibles Survey
Variable Effects of problems with insurers (scale 1-10) Pearson ρ
Effect of problems with builders (scale 1-10) Pearson ρ
Stress of the flood event (scale 1-10)
0.323, p < 0.001, n = 891 0.226, p < 0.001, n = 835
Overall Severity(scale 1-10
0.355, p < 0.001, n= 889 0.306, p < 0.001, n = 832
Current GHQ12 (scale 0-36) 0.238, p < 0.001, n = 733 0.175, p < 0.001, n = 696
Worst GHQ12 (scale 0-36) 0.337, p < 0.001, n = 731 0.309, p < 0.001, n = 693
Worry about future floodingThere were positive correlations between ‘worry’ about flooding in the next year and effects of stress, overall severity and GHQ12 scores. ‘Worry about future flooding’ generally was one of the ‘subjective effects’ that respondents were asked to rate on a scale from 1 (no effect) to 10 (extremely serious effect). There were significant correlations between this variable and the four vulnerability variables (Table 6.9). Worry about future flooding over the short and longer terms was quite strongly associated with vulnerability. However, worry is probably best seen as a component factor in the health and stress effects of flooding or indeed as a consequence of the health and stress effects experienced in a recent or worst flood event rather than as an explanatory factor for vulnerability.
Table 6.9: Correlations between vulnerability variables and worry: Intangibles Survey
Variable “How worried are you about Worry about future flooding
document.doc 29/06/07102

FLOODsite Project Report Contract No:GOCE-CT-2004-505420
the possibility of your property being flooded during the next 12 months?”(scale 1 to 5) Pearson ρ
(scale 1-10)
Pearson ρ Stress of the flood event (scale 1-10)
0.433, p < 0.001, n = 972 0.602, p < 0.001, n = 961
Overall Severity (scale 1-10) 0.453, p < 0.001, n = 973 0.588, p < 0.001, n = 961
Current GHQ12 (scale 0-36) 0.328, p < 0.001, n = 814 0.329, p < 0.001, n = 805
Worst GHQ12 (scale 0-36) 0.288, p < 0.001, n = 820 0.309, p < 0.001, n = 811
Material/ personal resourcesMaterial and personal or household resources include having insurance against flooding, income levels, car ownership and education. The time need for recovery and time taken off work can also be considered as a resource. The use of these resources to recover from the flood prevents people from using them somewhere else.
Insurance Most households were insured against flooding. 85% of homes had building/structure insurance, 80% had ‘new for old’ contents insurance and a further 13% had other types of contents insurance. Respondents who had insurance were not less likely to obtain higher scores in the GHQ12 both current and worst time. There were also no significant differences in subjective stress, overall severity and mean GHQ12 scores between insured and uninsured households. Although it would be expected that having insurance against flooding would increase the resilience of the household, most respondents were insured so this may hide the effect on vulnerability. However, as shown above, the way in which insurers and loss adjustors handle insurance claims was a significant factor for the insured.
DamagesRespondents were asked whether their home or contents had been damaged in the flood. Not surprisingly since all the respondents had had flood waters in their homes, 96% of respondents said that their homes and/or contents suffered from flood damage. Respondents with insurance cover were asked to estimate the damages that were paid out by insurance, whether building and structure, contents or both. A significant proportion of those with damages and insurance were unable to give an estimate either because they did not know, could not remember or were unwilling to divulge the information. Respondents were able to answer in terms of costs to buildings and structure and contents damage separately, together or both. Thus the answers to these questions have been given by slightly different groups of respondents depending on whether they were able to give separate information on buildings and structure and content or not. The results shown in Table 6.10 are very rough estimates and must be treated with considerable caution because it is not possible to establish whether those who gave information on insured costs differed from those who did not in terms of the damages incurred.
Respondents were also asked to estimate the damages incurred that were not covered by insurance. Not all those who suffered damages of this kind were able to give an estimate and those who did so were only able to provide very approximate figures in many cases. Over a third (38%) suffered costs that were not covered by insurance. These respondents may have been uninsured, under-insured or may have been unable to convince their insurers of the value of their damaged property or costs, or may have lost patience with negotiating with them and decided to cover costs themselves. Most of those who incurred uninsured costs had insurance. As many as 80% of those with uninsured costs, compared with 88% for those not incurring such costs, had some buildings and structure insurance. For ‘new for old’ contents insurance the percentages were 67% as compared with 89%. However, those incurring uninsured costs were significantly less likely to have both types of insurance cover (chi-square; p<0.01 and p<0.001 respectively).
document.doc 29/06/07103

FLOODsite Project Report Contract No:GOCE-CT-2004-505420
It should be noted that in addition, 88% of respondents also lost irreplaceable items such as photographs or personal papers to which it was impossible to attach a value as a consequence of the flood.
Table 6.10: Insured and uninsured damages incurred: Intangibles Survey
Insured damages incurred
£ Mean £ Median £ Minimum £ Maximum N= Non-response on damages of total the sample including those uninsured and those without damages% (n=)
Buildings and structure
£21,079 £15,000 £99 £200,000 321 67% (662)
Contents £8, 538 £6,000 £99 £50,000 463 53% (520)
Both £26,555 £20,000 £2 £202,000 367 63% (616)
Uninsured damages £ Mean £ Median £ Minimum £ Maximum N=
Non-response on uninsured damages of those who reported uninsured damages (375)% (n=)
Buildings and structure
£2,967 £675 £12 £32,000 64 83% (311)
Contents £2,608 £1,325 £10 £50,000 216 42% (159)
Both £2,840 £1,200 £50 £36,000 104 72% (271)
Tables 6.11 and 6.12 show the expected significant relationships between the extent of main room flooding and the maximum depth of main room flooding and the level of insured damages incurred. However, the small number of cases on which some of the means are based, and the large standard deviations (not shown), should be noted.
Table 6.11: Insured damaged incurred by the number of main rooms flooded: Intangibles Survey
Insured damages incurred
Number of main rooms floodedNone
£ mean(n=)
One
£ mean(n=)
Two
£ mean(n=)
Three £ mean(n=)
Four£ mean(n=)
Buildings and structure
£13,165(12)
£12, 564(21)
£19,744(207)
£24,584(51)
£33,456(30)
Contents £5,326(21)
£4,832(30)
£8,151(291)
£9,729(73)
£12,796(48)
Both * £15,121(19)
£13,600(26)
£25,403(219)
£29,123(71)
£46,058(32)
* Anova F test; p<0.001
Table 6.12: Insured damaged incurred by maximum depth of main rooms flooding: Intangibles Survey
document.doc 29/06/07104

FLOODsite Project Report Contract No:GOCE-CT-2004-505420
Insured damages incurred
1<10cms£ mean(n=)
10<20cms£ mean(n=)
20<30cms£ mean(n=)
30<60cms£ mean(n=)
60<1 metre£ mean(n=)
1 metre or more£ mean(n=)
Buildings and structure
£8,166(27)
£11,805(37)
£13,825(29)
£20,118(71)
£25,305(73)
£32,888(69)
Contents £4,248(51)
6,685(63)
£4,785(32)
£7,716(102)
£9,630(101)
£14,763(87)
Both* £14,546(46)
£18,952(47)
£19,389(32)
£25,756(76)
£32, 213(83)
£45,274(58)
* Anova F test; p<0.001
When normalised by household income, those in Social Grades DE had higher uninsured costs for both contents (t test: p =<0.01) and contents + building structure (t test; p <0.05) than those in social grades ABC1 and 2. There were significant but only very weak correlations between some of the subjective severity and stress and GHQ12 scores and the amount spent on uninsured costs both normalised by income and not (Table 6.13).
Table 6.13: Correlations between uninsured costs (normalised and not) and vulnerability variables
Variable Uninsured amount spent on contents,Pearson ρ
Uninsured amount spent on building structure/ contents,Pearson ρ
Stress of the flood event NS 0.094, p = 0.004, n = 972
Overall Severity 0.084, p = 0.009, n = 973 0.088, p = 0.006, n = 973
Current GHQ12 (scale 0-36) 0.110, p = 0.002, n = 814 NS
Worst GHQ12 (scale 0-36) 0.087, p = 0.013, n = 810 NS
Variable Uninsured amount spent on contents, normalised by income,Pearson ρ
Uninsured amount spent on building structure/ contents, normalised by income,
Pearson ρStress of the flood event NS 0.249, p = 0.026, n = 80
Overall Severity 0.206, p = 0.007, n = 170 NS
Current GHQ12 (scale 0-36) 0.213, p = 0.009, n = 151 NS
Worst GHQ12 (scale 0-36) 0.199, p = 0.015, n = 148 NSNS = Not significant
Those who had incurred costs not covered by insurance were more likely to have high GHQ12 (4+ ) scores than those had not incurred such costs (30% compared with 21% for the current GHQ 12, chi-square; p< 0.05 and 70% compared with 59% for the worst time GHQ12, chi-square; p<0.01). In the bi-variate analyses, it appears that uninsured damages contributed to vulnerability but did not appear to be a main factor.
Days taken off workTwo fifths of the respondents (42%) needed to take days off work after the flooding (including days taken as annual leave). Another 28% did not need to do so and the remainder (30%) were not in employment. Some of those who took time off did so because of physical or psychological health problems that they attributed to the flood event. Thus, taking time off may in part be a consequence of the health, stress and overall effects of flooding rather than an explanatory factor in them. Others took the time to start the work of getting their home back to normal and to deal with builders and insurers.
document.doc 29/06/07105

FLOODsite Project Report Contract No:GOCE-CT-2004-505420
For those who took any time off work due to the flood, the average number of days was 12.6. The number of days taken off work was most strongly correlated with the GHQ12 worst scores. There were also weak but significant correlations between days taken off work and subjective stress and overall severity and GHQ12 current (Table 6.14).
Table 6.14: Correlations between number of days taken off work and vulnerability variables: Intangibles Survey
Variable Number of days taken off as a result of flooding
Overall severity (scale 1-10) 0.165, p = 0.001, n = 405
Stress of the flood event (scale 1-10) 0.149, p = 0.003, n = 404
Current GHQ12 (scale 0-36) 0.131, p = 0.015, n = 343
Worst GHQ12 (scale 0-36) 0.342, p < 0.0001, n = 344
People with high scores in the GHQ12 worst (four or more) had to take more time off, an average of 14.4 days of work after the flood, compared to 9.8 days for the rest of the sample (t (406) = 2.3, p = 0.024). Respondents with high scores in the GHQ12 current also took more days off work on average: 16.7 compared with 11.6 taken by respondents with low scores or who did not respond to the GHQ12 questionnaires (t (406) = 2.1, p = 0.034). The number of days taken off work appears to be associated with vulnerability perhaps because those who had more serious effects took more days off work to recover but also because they were vulnerable and suffered health and stress effects as a result of the flooding that required them to take time off.
Income and education There were no significant differences in GHQ12 mean scores, subjective stress and subjective severity by income group. However, the level of education of the respondent did appear to have some influence on subjective stress levels in bivariate analyses. Those educated to at least degree level or equivalent had an average stress score of 6.5 versus 7.2 of those who had not been educated to that level (t test; p < 0.01). Respondents who had a postgraduate degree also had even lower subjective stress scores: 5.2 versus 7.2 (t test; p < 0.001). The level of education seems to reduce vulnerability.
Social resources and helpRespondents were asked whether they had received help from their friends or neighbours, members of the family outside the household and several institutions. They were also asked to rate the help they received from 1 (very little help) to 5 (all the help they needed) for each source of help. A combined ‘help scale’ (0 to 50) was calculated using the 10 sources of help and their individual rating. There were only very weak positive correlations between help received (0 to 50) and subjective stress (r = 0.111, p = 0.001, n= 972) and overall severity (r = 0.134, p < 0.0001, 972).
There were only weak significant correlations between subjective effects, overall severity and GHQ12 and the amount of help received from different sources. Respondents who said they had received help from friends or neighbours, rated the subjective stress and overall severity higher on average than people who had not. For stress, the mean score of those helped in this way was 7.5 compared with 6.5 for those not helped (t test; p< 0.001). For overall severity of the flood, the mean score for those helped by neighbours and friends was 7.5 compared with 6.7 for those not helped (t test; p< 0.001) There were no significant differences in GHQ12 scores.
People who said they had received help from family members outside the household, scored higher in all four variables (Figures 6.22 and 6.23). These differences may reflect the fact that those flooded to a greater depth and extent tended to attract more help than those less affected. Certainly there was no evidence here that help from outside the household mitigated the effects of flooding
document.doc 29/06/07106

FLOODsite Project Report Contract No:GOCE-CT-2004-505420
Figure 6.22: Means scores on stress of the flood event and overall severity of the flood by help received from family outside the household: Intangibles Survey
Stress and overall severity by help received from family members outside the household
7.7
7.6
6.5
6.5
1 2 3 4 5 6 7 8 9 10
Overall severity(Scale 1-10)***
(n=973)
Stress of the floodevent (Scale 1-10)***
(n=972)
Mean Score
Did notreceive helpfrom familymembersoutside thehoushold
Receivedhelp fromfamilymembersouside thehousehold
Stress: t test ; p< 0.001Overall severity: t test; p< 0.001
Figure 6.23: Mean worst and current GHQ12Likert by help received from family outside the household: Intangibles Survey
Worst and current GHQ12 by help received from family members outside the household
13
19
12.1
17
0 10 20 30
Current GHQ12(scale 0-36)*
(n=814)
Worst GHQ12(scale 0-36)***
(n=810)
Mean score
Did not receive help fromfamily members outside thehousholdReceived help from familymembers ouside thehousehold
*Current t test ; p= 0.05*** Worst t test;, p< 0.001
Evacuation and length of evacuationRespondents that had left the home or had another member of their household leave, recorded higher scores in both subjective stress and overall severity and GHQ12 scores (Figure 6.24 and Figure 6.25).
Figure 6.24: Mean worst and current GHQ12Likert by evacuation: Intangibles Survey
document.doc 29/06/07107

FLOODsite Project Report Contract No:GOCE-CT-2004-505420
Worst and cureent GHQ12 by evacuation "Did you or anyone in your household have to leave home during or
after the flood"
11.9
15.8
13
19.6
0 5 10 15 20 25
GHQ currentlikert** (Scale 0-
36) (n=814)
GHQ worselikert*** (scale 0-
36) (n=810)
Mean score
Someone left homeNo one left home
*** Worst GHQ12: t test; p <0.001** Current GHQ12: t test: p <0.01
Figure 6.25: Means scores on stress of the flood event and overall severity of the flood by evacuation: Intangibles Survey
Stress and overall severity by evacuation "Did you or anyone in your household have to leave home during or
after the flood"
6
6
7.7
7.9
0 2 4 6 8 10
Overall,severity*** (Scale
0-10) (n=810)
Stress of the floodevent*** (Scale 1-
10) (n=972)
Mean score
Someone left homeNo one left home
Stress: t test; p< 0.001 Overall severity: t test; p< 0.001
Where someone in the household had to leave home, respondents were significantly more likely to report their worst time GHQ12 scores to be high (4 +) than where no one had to leave (70% compared with 50%). The same was true for the current GHQ12 scores (28% compared with 18%). Where it was the respondent who had evacuated (possibly with other or all family members) the contrast between those evacuating and those not was significant and almost as marked (69% compared with 53% for GHQ12 worst time and 27% compared with 20% for the current GHQ12).
The findings were very similar where other household members were reported as having evacuated (either separately or together with the respondent). In these cases, high GHQ12 worst time scores were reported by 72% of respondents compared with 55% where others did not leave home. For the current GHQ12, the proportions were 29% compared with 20%. Thus, having to leave home was a highly significant factor in vulnerability as measured by the GHQ12.
document.doc 29/06/07108

FLOODsite Project Report Contract No:GOCE-CT-2004-505420
Our data do not allow us to consider whether the effects were greater where only some members of the household evacuated and some stayed at the property, where the family had to split up and evacuate to different places or whether the nature of the place the people stayed made a difference (e.g. a rest centre, family or friends’ homes, rented accommodation or a mobile home in the front garden). Thus, leaving the home, usually after the flood event (although no information is available on when household members left), had a significant effect on the vulnerability variables, whether it was the respondent who left or another member of the household.
Length of disruption and length of evacuationRespondents were asked three different questions regarding the length of disruption:
1. How long was it before the whole household could live in the property again (in weeks), or how long was the length of the evacuation. The average was nearly 15 weeks for all respondents, however when removing the zeros (i.e. the households in which no-one left), the average is almost 24 weeks.
2. How long did the worst period last (in weeks). The ‘worst period’ was defined as the stage during or after the flooding when health impacts most severe or worst for the respondent personally. The average duration of this period was 7 weeks.
3. How long did it take to get the home back to normal (in weeks). The average was almost 27 weeks.
There were significant positive correlations between subjective stress, overall severity and average GHQ12 scores and the above variables with those not evacuating included as zeros in the length of evacuation (Table 6.15).
Table 6.15: Correlations between length of disruption and vulnerability variables: Intangibles Survey
Variable How long was it before the whole household could live in the property again?
How long did the 'worst' period last in total?
How long did it take to get your home back to normal, or is it still not back to normal?
Overall severity 0.321, p < 0.001, n = 973 0. 248, p < 0.001, n = 973 0.221, p < 0.001, n = 968
Stress of the flood event
0.233, p < 0.001, n = 972 0.194, p < 0.001, n = 972 0.119, p < 0.001, n = 967
Current GHQ12 (scale 0-36)
0.114, p = 0.001, n = 814 0.185, p < 0.001, n = 814 0.080, p < 0.05, n = 810
Worst GHQ12 (scale 0-36)
0.215, p < 0.001, n = 810 0.283, p < 0.001, n = 810 0.159, p < 0.001, n = 806
The average length of disruption was longer for those scoring 4+or more in both current and worst GHQ12 as compared with the rest of the sample (Table 6.16). The length of disruption, worst period and the time to get the household back to normal had an effect across all four vulnerability variables.
Table 6.16 High GHQ12 scores and length of disruption
document.doc 29/06/07109

FLOODsite Project Report Contract No:GOCE-CT-2004-505420
GHQ12 current Mean time in weeks (SD, number)Less than 4
Mean time in weeks (number)4+ scores
t test
How long did it take to get your home back to normal?
27.9 ( 616) 39.5 (198) p < 0.05
GHQ12 worst Less than 4 4+ scores t test
How long did it take to get your home back to normal?
26.1 ( 299) 33.2 ( 511) p < 0.01
6.4 Multivariate analysis
Table 6.24 summarises the variables found in the bi-variate analyses to be significantly associated in some way with the vulnerability measures. In order to identify the key variables that may explain vulnerability to the effects of flooding, among the many that were associated with the vulnerability measures, backwards regression analyses were carried out for two of the vulnerability measures: the overall severity measure and the subjective stress measure included in the Intangibles Survey for this report. Such analyses had been undertaken for the two GHQ12 measures, both current and worst (Tunstall et al., 2006) and the results are reproduced here. Table 6.17 was used to guide the selection of variables for inclusion in the multiple regressions. In all cases the dependent variables were transformed to normality using a log normal transformation to ensure that their distribution more closely conformed to the normal distribution required for regression analyses. The .010 probability level was used as the cut-off for the inclusion of variables in the models although most of the variables included were significant at the .05 level.
6.4.1 Multi-variate analyses: flood characteristics and vulnerabilityAlthough the focus of Task 11 is upon the social dimensions of vulnerability, it is recognised that the characteristics of a flood event will have an effect on the impacts of flooding (Section 1.2.1). The bi-variate analyses in Table 6.24 show this to be the case across all the vulnerability variables for three flood characteristics, maximum depth of main room flooding, number of main rooms flooded and contamination of the floodwaters. Therefore, it is important to take account of how the flood characteristics affects vulnerability. In initial multi-variate analyses, we examined the impact that the flood event characteristics taken on their own had on the vulnerability variable as indicated in the model shown in Figure 6.1
The following flood event characteristics were included in the analyses shown in Table 6.25: Maximum depth of main room flooding, (centimetres) Number of main rooms flooded (scale 0-4), Contamination of flood waters (1= contaminated, 0 = not contaminated) Length of warning (log normal transformation of length of flood warning time including
zeros) Speed of rise of flood waters (1 = fast ,0 = not fast) Duration of flooding (hours)
Table 6.17 Variables from bi-variate analyses significantly associated with vulnerability variables
Factors GHQ 12 Worst
GHQ12 Current
Stress of the flood event
Overall severity
document.doc 29/06/07110

FLOODsite Project Report Contract No:GOCE-CT-2004-505420
itself
Flood event characteristicsMax.depth main room flooding
* * * *
Number of main rooms flooded
* * * *
Contamination of flood waters
* * * *
Warning receipt NS NS NS NSLength of warning NS NS NS NSRate of rise NS NS NS NSDuration of flooding NS NS NS NSSocial characteristics and prior healthGender * NS * *Age * * * *Social grade NS NS * *Household with children NS NS * NSHouseholds with children under 10
NS NS NS NS
Households with only 75+ NS NS NS NSLiving alone NS NS * NS75+ living alone NS NS * NSPrior health * * NS NSLong term illness or disability: respondent
* * * *
Long term illness or disability: other
NS NS * *
Doctor consultation * * * *
Dwelling characteristicsOwning/renting * * * *Vulnerable property * NS * *Area House prices * NS * *Length of residence * NS NS NS
Other post flood factorsProblems with builders and insurers
* * * *
Worry * * * *Having insurance cover NS NS NS NSUninsured contents damages:Normalised by income or not
* * NS *
Uninsured buildings damages:Normalised by income
NS NS * NS
Uninsured buildings damages:Not normalised by income
NS NS * *
Income NS NS NS NSEducation NS NS * NSHelp extent (0-50) NS NS * *Help from neighbours/friends NS NS * *Help from family * * * *Evacuation: Respondent * * * * Other * * * * No one * * * *
document.doc 29/06/07111
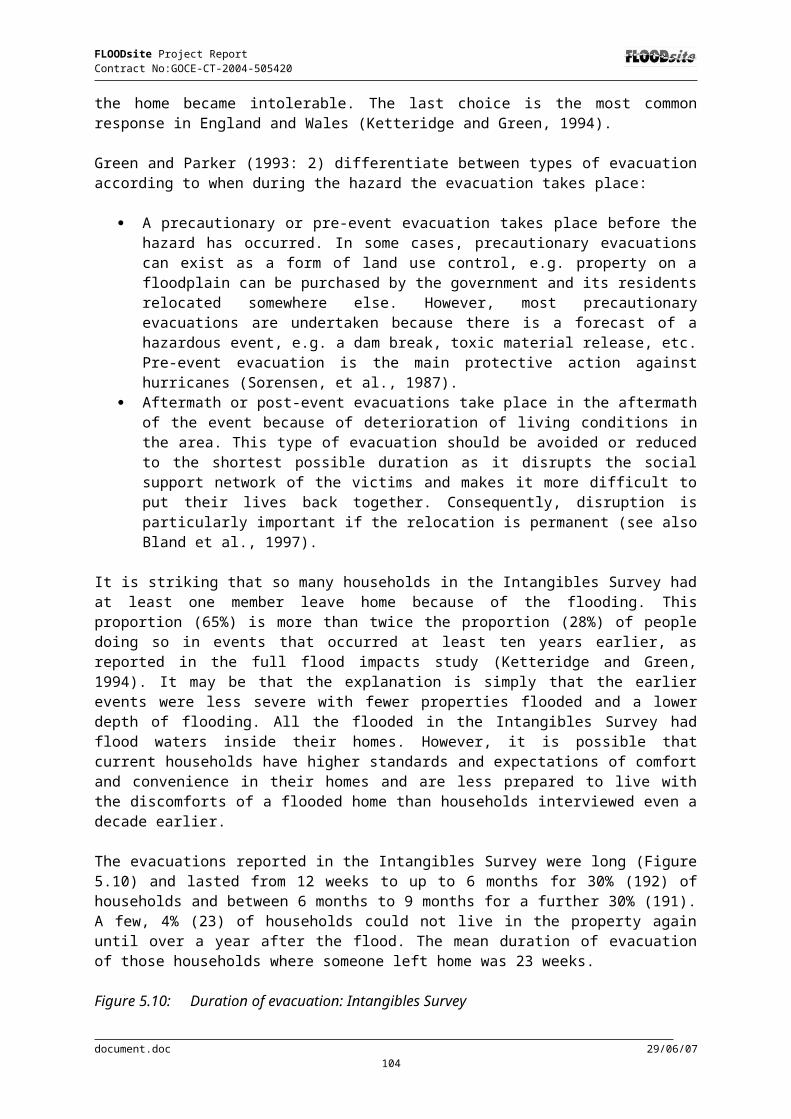
FLOODsite Project Report Contract No:GOCE-CT-2004-505420
Time to get back to normal * * * *Length of evacuation * * * *Length of worst health period * * * *NS = Not statistically significant on any measure. * indicates some statistical significance
When the worst time GHQ12 was considered as a measure of short term health impacts of flooding, four of the six factors emerged as explanatory factors (Table 6.18). Contamination of the floodwaters made the most significant contribution followed by the maximum depth of main room flooding. The extent of flooding as measured by the number of main rooms flooded and the length of flood warning lead time also emerging as significant factors. As predicted in the model, the greater the depth of main room flooding, the higher were the worst time GHQ12 scores. Where pollution of the flood waters was detected, the scores were also higher. A longer warning lead time was associated with lower scores and thus did lead to reduced mental health and stress effects at the time when those impacts were at their worst. Flood characteristics such as duration of flooding and the speed of onset were not significant factors. However the key finding is that these flood characteristics alone explained very little of the variance in the effect of flooding on the mental health and well being of flood victims at the time they judged the effects to be at their worst.
In considering models for the current GHQ12 Likert scores (Table 6.18), it must be emphasised again that these scores reflect the mental health and well being of respondents at the time of the interview and this occurred in most cases some years after the flood event. During this time many circumstances and events may have intervened to change the respondents’ state of health. Therefore, it is not surprising that the current state of health and well being as measured by the GHQ12 Likert scores is more difficult to predict with flood characteristics variables. Taking the current GHQ12 scores as an indication of the long term effects and vulnerability to flooding, it appears that, when flood characteristics were taken on their own, the same two characteristics of the flood event experienced that were key factors in the immediate worst time effects, depth and contamination, had a significant and lasting impact (Table 6.18). However in the long term, the length of a flood warning received was no longer a factor. It is notable that the characteristics of the event experienced taken on their own explained even less of the long term variability in the vulnerability measure, the current GHQ12 scores.
It can be argued that the current GHQ12 score is likely to be influenced by the worst time experience as indicated by the worst time GHQ12 score. These two variable GHQ12 Likert variables were quite strongly correlated (Correlation: 0.54). Therefore, a further regression analysis was undertaken including the worst time GHQ12 Likert as an explanatory variable for current GHQ12 Likert scores along with the flood characteristics variables. When this was done, the worst time GHQ12 Likert emerged as the only significant factor indicating that the effects of the flood event are reflected in the GHQ12 worst time scores and do not add any explanatory power when that score is included. Indeed the worst time GHQ12 score explains a significant proportion of the variance in the current GHQ12 scores (R2 = 0.319, R2 (adjusted) = 0.318).
The factors that emerged when the stress of the flood event and the overall subjective severity were considered in relation to the nature of the event experienced were similar to those that were predictors of the GHQ12 measures (Table 6.19). Again flood event characteristics alone explained little of the variance in the subjective responses to flooding. Contamination of the flood waters emerged as a very significant predictor of both stress and overall severity. Then either the extent or depth of main room flooding and in the case of overall severity, both, were factors. The length of flood warning lead time, however, featured as an explanatory variable only for the stress of the flood event albeit not a very significant predictor ( not significant at the p<0.05 level) suggesting that a longer warning lead time may make a small contribution to reducing the stress experienced during and after a flood event.
Table 6.18: Flood event characteristics and GHQ12 Likert scores
document.doc 29/06/07112

FLOODsite Project Report Contract No:GOCE-CT-2004-505420
Worst time GHQ12 LikertNumber of cases = 611, R2 = 0.075, R2 (adjusted) = 0.069
Unstandardized Coefficients
Standardized Coefficients t Sig.
B Std. Error Beta(Constant) 13.105 1.063 12.328 .000
Contamination of floodwaters 4.382 .885 .198 54.950 .000
Maximum depth of main room flooding
.013 .006 .098 2.366 .018
Number of main rooms flooded .703 .345 .084 2.037 .042
Warning lead time included those not warned as zeros (log normal transformation)
-.247 .124 -.080 -1.999 .046
Current GHQ12 LikertNumber of cases = 613, R2 = 0.043, R2 (adjusted) = 0.040
Unstandardized Coefficients
Standardized Coefficients t Sig.
B Std. Error Beta(Constant) 10.108 .558 18.115 .000
Contamination of floodwaters 2.478 .587 .168 4.224 .000
Maximum depth of main room flooding
.010 .004 .107 2.679 .008
Table 6.19: Flood event characteristics and stress and overall severity
Stress of the flood eventNumber of cases = 727, R2 = 0.089, R2 (adjusted) = 0.085
document.doc 29/06/07113

FLOODsite Project Report Contract No:GOCE-CT-2004-505420
Unstandardized Coefficients
Standardized Coefficients t Sig.
B Std. Error Beta(Constant) 4.812 0.348 13.816 .000
Contamination of floodwaters 1.760 .287 .221 6.142 .000
Number of main rooms flooded .532 .109 .175 4.890 .000
Warning lead time included those not warned as zeros (log normal transformation)
-.070 .041 -.062 -1.725 .085
Overall severity of the floodNumber of cases = 727, R2 = 0.100, R2 (adjusted) = 0.096
Unstandardized Coefficients
Standardized Coefficients t Sig.
B Std. Error Beta(Constant) 4.86 .303 16.105 .000
Contamination of floodwaters 1.351 .251 .183 5.386 .000
Number of main rooms flooded .509 .100 .188 5.092 .000
Maximum depth of main room flooding
.004 .002 .101 2.734 .006
6.4.2 Multi-variate analyses: Social characteristics and vulnerabilityHere we consider, in addition to the key flood event characteristics that were predictors in the models in Tables 6.25 and 6.26, the social aspects that may gain importance during a flood and make individuals and households more vulnerable during and after flooding: the social dimensions of vulnerability. These factors may include both the social characteristics of the respondents and their households and the characteristics of the dwelling and area where respondents lived presented in Figure 6.1. In this section we confine the analysis to factors present at the time of the flood and exclude the developments and interventions that may occur after the event shown as post-flood intervening factors in Figure 6.1. The following factors which may be expected to make individuals and their households more vulnerable are included in these analyses:
Social characteristics and prior health: Gender, (Male = 1, female = 0) Age: under 45, 45 - 64, age 65+, (1= yes, 0 = no) Social grade: AB or not, DE or not (1 = yes, 0 = no) Households with children, households with children under 10, (1 = yes, 0 = no) Living alone, (1 = yes, 0 = no) Aged 65 living alone, (1=yes, 0=no) Prior health,(1 = poor to 5 = excellent) Long term illness or disability in respondent/other household members/ and overall (1 = yes ,0
= no)
Dwelling characteristics: Housing status (renting or not , 1= yes 0= no), Vulnerable property or not (1 = yes,0 = no) Length of residence in years (years) Area house prices as an indicator of the affluence of the area (1 = high – 5 = low)
document.doc 29/06/07114

FLOODsite Project Report Contract No:GOCE-CT-2004-505420
Because the relationship between age and the vulnerability variables does not appear to be linear. Age has been included in grouped form as three dummy variables.
Including social and dwelling characteristic variables in the regression analysis enhanced the explanatory power only a little with 11 % of the variance explained in the model for the worst time GHQ12 Likert scores, which represent the short term health effects of flooding (Table 6.20). While flood characteristics remained important explanatory variables for the worst time scores, five social variables emerged as highly significant predictors. These included gender, with women predicting higher scores than men, and prior health with poorer health a predictor of raised GHQ12 worst time scores were the most significant. As might be expected, living in vulnerable housing such as ground floor flats, bungalows and mobile homes was another significant predictor of higher scores. In line with the findings in the bivariate analyses those in the middle age groups (45-64) were associated with higher scores. Those in the somewhat younger age groups (under 45) were also included in the model as predicting higher scores, indicating that it is the older age groups that stand out as less affected.
When the social dimension was included in the model for the current GHQ12 scores, indicating the longer term health effects of flooding, there was much less effect on the explanatory power of the best fit model (Table 6.20). A very simple model with only five variables emerged. Perceived contamination of the flood waters remained as a flood characteristic that was a predictor and a highly significant one for the current GHQ12 Likert scores. The maximum depth of main room flooding also remained in the model.
Of the social characteristics, poorer prior health and being in the middle aged group (aged 45 to 64) were again key predictors of higher current GHQ12 scores. Gender, however, an important predictor in the worst time model, was no longer a factor for the current GHQ12. This reflects the findings of the bi-variate analysis that women were worse affected than men at the worst time of the flooding but that the gender difference disappeared with time and was no longer evident in the current GHQ12 scores suggesting that women were more resilient and recover better than men. Many other variables that were predictors of the worst time GHQ12 scores do not feature in this model. More surprising was the fact that area house prices were a factor, with higher house price areas leading to higher current GHQ12 scores.
Here again the passage of time from the flood event to the time of the interview to which the current GHQ12 scores relate must be noted. However, it is therefore particularly significant that key flood characteristics remain important predictors despite the passage of time. If the worst time scores were to be included again as an explanatory variable for the current scores it is likely that the explanatory power of the model would be enhanced.
Table 6.20: Social, dwelling and flood event characteristics and GHQ12 Likert scores
Worst time GHQ12 LikertNumber of cases = 595, R2 = 0.123, R2 (adjusted) = 0.114
document.doc 29/06/07115

FLOODsite Project Report Contract No:GOCE-CT-2004-505420
Unstandardized Coefficients
Standardized Coefficients t Sig.
B Std. Error Beta(Constant) 16.775 1.347 12.451 .000
Contamination of floodwaters 3.832 .807 .176 4.747 .000
Maximum depth of main room flooding
.015 .005 .113 3.092 .002
Gender -2.433 .606 -.146 -4.0016 .000
Prior health -.0985 .286 -.128 -3.443 .001
Vulnerable housing 3.432 1.070 .120 3.207 .001
Aged 45 to 64 2.697 ,775 .164 3.478 .001
Aged under 45 2.479 .832 .145 2.980 .003
Current GHQ12 LikertNumber of cases = 682, R2 = 0.089, R2 (adjusted) = 0.082
Unstandardized Coefficients
Standardized Coefficients t Sig.
B Std. Error Beta(Constant) 14.727 1.028 14.329 .000
Contamination of floodwaters .2.248 .583 .154 4.177 .000
Maximum depth of main room flooding
.009 .004 .096 .2.498 .013
Prior health -1.056 .191 -.203 -5.520 .000
Area house price rating -.250 .136 -.070 -1.844 .066
Age 45 to 64 .710 .409 .064 1.736 .083
When the subjective stress of the flood event was considered as a measure of vulnerability, introducing the social dimension revealed the importance of social inequalities in vulnerability to flooding. In the model shown in Table 6.21, three flood characteristics, contamination of flood waters, the extent, and to a lesser degree, the depth of flooding were important predictors. Warning lead time emerged as a weak predictor of reduced stress. However, the inclusion of social and dwelling variables greatly enhanced the albeit still limited explanatory power of the model with 18% of the variance in subjective stress explained by the predictors. In this model living in lower house price and thus less affluence areas was a predictor of higher stress levels and being in social grades AB was a predictor of lower stress levels. Renting the dwelling was another factor reflecting social disadvantage that was a predictor of higher stress levels, although not a very significant one (not significant at <0.05 level). Gender was a factor for stress, as it was for worst time GHQ12 scores, with men as predictors of lower scores. There were some factors in the model that were counter to expectations although generally consistent with the bi-variate analyses. Thus living alone was a predictor of lower stress scores. The same was true of being in the 65 and over age group.
document.doc 29/06/07116

FLOODsite Project Report Contract No:GOCE-CT-2004-505420
Table 6.21: Social, dwelling and flood event characteristics and stress and overall severity
Stress of the flood eventNumber of cases = 816, R2 = 0.189, R2 (adjusted) = 0. 180
Unstandardized Coefficients
Standardized Coefficients t Sig.
B Std. Error Beta(Constant) 3.887 .387 10.042 .000
Contamination of floodwaters 1.648 .255 .210 6.464 .000
Number of main rooms flooded .546 .103 .182 5.291 .000
Maximum depth of main room flooding
.004 .002 .084 2.401 .017
Warning lead time included those not warned as zeros (log normal transformation)
-.067 .038 -.057 -1.746 .081
Area house price rating .342 .065 .180 5.249 .000
Gender -.620 .194 -.103 -3.192 ,001
AB Social grade -.722 .242 -.098 -2.977 .003
Living alone -.548 .219 -.082 -2.498 .013
Renting .586 .302 .064 1.941 .053
Overall severity of the floodNumber of cases = 815, R2 = 0.174, R2 (adjusted) = 0.167
Unstandardized Coefficients
Standardized Coefficients t Sig.
B Std. Error Beta(Constant) 4.820 .454 10.609 .000
Contamination of floodwaters 1.267 .222 .181 .5.572 .000
Number of main rooms flooded .547 .092 .215 6.231 .000
Maximum depth of main room flooding
.006 .002 .144 4.070 .000
Gender -.759 .176 -.141 -4.323 .000
Area house price rating .229 .057 .135 4.020 .000
Aged 65 and over living alone -.521 .254 -.070 -2.051 .041
Prior health -.152 .081 -.062 -1.889 .059
The model for the overall severity of the effects of the flood on the household’s life contained only seven predictor variables. Three flood characteristics were significant predictors. Only four additional factors emerged when the social and dwelling characteristics variables were included in this model. However, together, these variables explained substantially more of the variance in the overall subjective severity ratings, 17%, than the characteristics of the flood event taken on their own. Gender
document.doc 29/06/07117

FLOODsite Project Report Contract No:GOCE-CT-2004-505420
was a significant factor in this model. Prior health was a factor in the overall severity of the flood event. Area house prices again featured as a predictor with low house prices leading to raised overall severity ratings. Age and household composition combined were factors with those aged 65 and over living alone, counter-intuitively having lower overall severity scores
To summarise, on our analysis of flood characteristics and the social dimensions of vulnerability presented in Tables 6.18 to 6.21:
A first point to re-iterate is that the vulnerability variables are rather different and also because of the non-response, particularly to the GHQ12 question items, the regression models are based on samples of different size and composition. The models clearly show that the characteristics of a flood event are important. As we would expect, the depth of flooding was a predictor of vulnerability in all eight of the models; the extent of flooding to the home as measured by the number of main rooms (living room, bedroom, kitchen, bathroom) featured in four of the models. Flood warnings and a longer flood warning lead time which are intended to reduce the health and stress effects of flooding were significant factors in three models: that for the worst time GHQ12 score and both stress models including when the social dimension was taken into account. What was not anticipated was that the perception of the floodwaters as containing sewage or other pollution would be such an important predictor appearing as a highly significant explanatory variable in all models. However, it is clear that, for all the vulnerability variables, but particularly for the current GHQ12 scores, the flood event characteristics available in the Intangibles Survey taken on their own explained only a very limited amount of the variance in vulnerability, under 10% for all the variables considered and only 4% for the current GHQ12 score.
When the social dimension was introduced, the amount of variance explained across the models was enhanced, ranging from 8% for the current GHQ12 to 18% for the stress rating. Overall, the introduction of a wide range of social variables into the analysis still leaves a large amount of the variability in the vulnerability variables unexplained. Lack of success in predicting the current GHQ12 scores with flood characteristics and social variables may be partially explained by the passage of time from the flood event to the time of interview and the changes in circumstances and events that may have intervened affecting health and well being.
A wide range of explanatory social variables appear in the models but there were some common factors. Gender was a factor in all the models apart from that for the current GHQ12. The variable relating to health status prior to the flood was a predictor in three models. Various variables that were indicators of socio-economic status also featured in the models. The rating of the area house prices, an indicator of the relative affluence of the interview locations was a factor in three models. In line with expectations that vulnerability would be associated with social deprivation, lower area house price ratings were predictors of higher ratings for stress and overall severity but for current GHQ12 scores the reverse was the case. Renting property, which can be taken as indicative of social disadvantage in the UK context was also a predictor of higher scores in the current GHQ12 and stress models. However, being in the highest social grades (AB) was a predictor of higher stress. Vulnerable housing was an explanatory factor in only one model, for the worst time GHQ12. In line with the findings in the bi-variate analyses, the middle aged group (45-64) was an explanatory factor in the GHQ12 current and worst time models and indicating higher scores. Certain explanatory variables appeared in a way that was contrary to expectations on vulnerability. We would expect those living alone and older people and particularly those aged 65 and over living alone to be more vulnerable than others. However, in certain models these variables appeared as significant predictors of lower vulnerability. The bi-variate analyses also provide some evidence of this counter intuitive finding. The variables that cover prior health and illness and disability may cover much of the vulnerability associated with old age and this may provide some explanation for this finding.
6.4.3 Post flood intervening factorsIn this section we consider the factors that may intervene in the aftermath of flooding and their effect on the vulnerability variables. Our analysis of the time at which the health effects were at their worst
document.doc 29/06/07118

FLOODsite Project Report Contract No:GOCE-CT-2004-505420
showed that people varied in the stage at which they experienced the worst time with their responses ranging from the time of the flood event itself to well into the recovery period. Thus the kinds of factors that may come into play to influence the vulnerability variables will also vary depending in part on when they experienced the worst time. The way in which institutions, organisations and individuals within the community respond and deal with the event are among the factors to be taken into account. The post event intervening factors considered are listed here:
Post-flood intervening factorsRating of problems with builders (scale 1-10)Rating of problems with insurers and loss adjustors (scale 1-10)Help received from outside household (0-50) Evacuation (yes, evacuated = 1, no, did not evacuate = 0)Disruption: time taken to get home back to normal (weeks)£value of uninsured losses
When these post-flood intervening factors were introduced into the regression analyses, the models changed substantially although some of the flood and social dimensions remained. Table 6.29 shows the model that accounts for vulnerability as measured by the worst time GHQ12 scores. The inclusion of the post –event factors greatly enhanced the explanatory power of the model for this vulnerability variable. Certain socio-demographic factors were important as explanatory variables for this vulnerability measure. Gender and prior health emerged again as significant factors in the short term-health effects of flooding. Counter-intuitively but in line with the bi-variate analyses, being aged 65 and over was a factor reducing vulnerability in this model, (albeit not significant at the 0.05 level). This may be because prior health, which is strongly related to age, accounts for the vulnerability due to ill health among those in the older age groups. Living in rented accommodation as compared with owner occupation was a contributory factor.
Perhaps surprisingly, the extent and depth of flooding do not feature as explanatory variables possibly because their influence is reflected in other variables such as the time taken to get back to normal and evacuation. One flood characteristic that does feature in this model is the belief that the flood waters are contaminated, a factor leading to higher GHQ12 worst time scores. Flood warning lead time also had some contributory influence in reducing vulnerability in the short term.
Factors associated with the aftermath of flooding and the recovery period such as having to evacuate and the time taken to get back to normal were significant explanatory factors. The data confirm what emerged in our qualitative studies (Tapsell et al., 1999; Tapsell and Tunstall, 2001) that the role of the insurance industry and the way that its personnel deal with flood victims are crucial in mitigating or exacerbating the trauma of a flood. Insurance was both a positive and negative influence. The level of uninsured losses incurred due to lack of insurance cover or under insurance was a negative factor but conversely having adequate insurance was a positive factor. Flooded households reported very varied experiences of the attitudes of loss adjustors and insurers towards their clients and in the speed, efficiency and sympathy shown in handling claims. These problems were a very significant factor in vulnerability.
Table 6.22: Post-event factors social, dwelling and flood event characteristics and GHQ12 Likert scores
Worst time GHQ12 LikertNumber of cases = 511, R2 = 0.267, R2 (adjusted) = 0.253
Unstandardized Standardize t Sig.
document.doc 29/06/07119

FLOODsite Project Report Contract No:GOCE-CT-2004-505420
Coefficients d Coefficients
B Std. Error Beta(Constant) 14.179 1.480 9.583 .000Problems with insurers/loss adjustors
Gender -2.424 .634 -1.48 -3.824 .000
Prior health -.885 .300 -.117 -2.953 .003
Uninsured £ losses (as in ln. U + 1) .343 .104 .129 3.287 .001
Evacuation 1.999 695 .118 2.874 .004Time to get back to normal .038 .013 .121 3.034 .003
Contaminated flood waters 2.345 1.480 .113 .2.850 .005
Rented accommodation 2.266 1.074 .085 2.109 .035
Warning time (log. WT = 1) -.258 .116 -.088 -2.229 .026
Aged 45-64 1.59 .641 0.97 2.477 .014
GHQ12 currentNumber of cases = 508, R2 = 0.163, R2 (adjusted) = 0.152
Unstandardized Coefficients
Standardized Coefficients t Sig.
B Std. Error Beta(Constant) 13.920 1.112 12.516 .000Problems with insurers or loss adjustors
.361 .067 .229 5.396 .000
Prior health -1.121 .212 -.218 -5.289 .000
Contaminated flood waters 1.379 .589 .099 2.34443
.019
Area house price rating -.299 .145 -.085 -2.061 .040
Warning lead time included those not warned as zeros (log normal transformation)
-.165 .085 -.081 -1.941 .053
Evacuation 1.002 .491 .087 2.040 .042
Time to get back to normal .018 .009 .086 1.999 .046
It should be noted that the experience at the worst time and the worst time scores would account for much of the vulnerability that remained in the long term. However, here the analysis was undertaken excluding the worst time scores as a predictor in order to examine what other explanatory factors might emerge. Other factors were of some significance. Prior health was one continuing influence. Post event factors, problems with insurers, evacuation and the time taken to get back to normal remained in the analysis affecting recovery. Gender and age do not feature in this model although
document.doc 29/06/07120

FLOODsite Project Report Contract No:GOCE-CT-2004-505420
gender and age differences were of some significance in vulnerability in the short term as measured by the worst time GHQ12 of flooding suggesting differential resilience and recovery with age and gender. One new and to some extent surprising factor was area house prices. These exerted a significant if small adverse effect on long term vulnerability with higher area prices areas associated with higher GHQ12 current scores
In the model of factors explaining the stress of the flood event itself, flood characteristics featured as explanatory factors with the number of main rooms flooded as well as contamination of flood waters. However as in the other models, problems with insurers and loss adjustors were major contributory factors in stress experienced and the level of uninsured losses had some influence. Two variables related to the dwelling and area characteristics of households were included in this model. Renting and living in low house price areas both had an adverse effect on levels of stress experienced in the flood (Table 6.23). Unexpectedly, being in the highest social grade groups (AB) was a predictor of higher stress levels and living alone was a predictor of lower stress levels. The £ value of uninsured losses and problems with insurers and loss adjustors were post –event predictors of higher stress levels.
When the overall severity of the flood event was modelled (Table 6.23), broadly similar predictors emerged. Three flood characteristics were significant factors: the contamination of flood waters, and the depth and extent of flooding to the home.
Table 6.23: Post-event factors social, dwelling and flood event characteristics and the stress and overall severity
Stress of the event on the householdNumber of cases 611, R2 = .303, R2 = .291 (adj)
Unstandardized Coefficients
Standardized Coefficients t Sig.
BStd. Error Beta
(Constant) 2.774 .405 6.842 .000
Problems with insurers/loss adjustors (1= no effect to 10= extremely serious effect)
.209 .031 .242 6.730 .000
Number of main rooms flooded .433 .115 .142 3.782 .000
Contaminated flood waters 1.449 .264 .191 5.478 .000
Area house prices .265 .067 .140 3.960 .000
Rented accommodation 1.126 .331 .120 3.398 .001
Gender -.510 .208 -.085 -2.448 .015Living alone -.497 .236 -.074 -2.107 .035Social grade AB -.540 .266 -.072 -2.034 .042Uninsured £ losses (as ln. U = 1) .069 .035 .069 1.977 .049
Overall severityNumber of cases 611, R2 = 0.304, R2 = 0.293 (adj)
Unstandardized Standardized t Sig
document.doc 29/06/07121

FLOODsite Project Report Contract No:GOCE-CT-2004-505420
Coefficients Coefficients
BStd. Error
Beta
(Constant) 3.668 .477 7.685 .000Number of main rooms flooded .414 .103 .151 4.007 .000
Contaminated flood waters 1.053 .238 .154 4.426 .000
Problems with insurers/loss adjustors
.194 .028 .249 7.024 .000
Evacuation .973 .213 .175 4.571 .000
Gender -.617 .187 -.113 -3.299 .001Time to get back to normal .010 .003 .106 2.959 .003
Area house price rating .186 .062 .108 3.012 ,003
Maximum depth main room flooding .004 .002 .081 2.089 .037
Prior health -.162 .085 -.066 -1.909 .057
6.5 Summary and conclusion on vulnerability and resilience
The manner in which people may respond to flooding and their capacity to recover may be affected by their subjective severity of the flood impacts. Of the three surveys included in this reanalysis, only the Intangibles Survey sought to measure the subjective impacts of flooding and magnitudes of impacts in detail on its flooded sample by looking at the subjective severity of flooding upon households. Getting the house back to normal (the disruption to life and all the problems and discomfort during recovery) was rated as the most serious of the effects, followed by the stress of the flood event itself, having to leave home and worry about flooding in the future. These first three intangible effects were rated as markedly more serious than the tangible damages to the contents and structure of the property. There were striking and significant differences in the rating of the effects between men and women, with women giving a higher rating than men to almost all the effects and also rating the flood overall as having a more serious effect on their household than did the men.
The most highly rated impact, disruption, and all the problems of getting the home back to normal, was most closely associated with the stress of the flood event itself, also a highly rated impact. The stress rating was associated not only with disruption but also with having to leave home, worry about future flooding and with health effects. This rating therefore appeared to capture many of the most severe impacts of flooding on the lives of households. The overall rating of the seriousness of the effects of flooding was highly correlated with the stress rating. Other effects that were closely associated with the overall rating were disruption, having to leave home, health effects and damage to the house.
The reanalysis in this study is based on a model (Figure 6.1) that considers that vulnerability and resilience to flooding depend on a series of factors: flood event characteristics, social characteristics including prior health, dwelling characteristics and post-flood factors or intervening factors. In order to see what factors may affect vulnerability and resilience three variables were chosen as dependent variables: the GHQ12, overall subjective severity, and subjective stress on the household.
A number of key points emerged from the analyses on vulnerability and resilience. The four vulnerability measures examined appear to be measuring somewhat different aspects of vulnerability.
document.doc 29/06/07122

FLOODsite Project Report Contract No:GOCE-CT-2004-505420
The correlations between the variables are only moderately strong and there are only four predictor variables that are shared across more than two of the measures in the regression models.
The research on the GHQ12 measures shows that flooding has impact on the mental health of flood victims not only in the short term (at the worst time) but also in the long term as reflected in the current scores registered at the time of the interview, in most cases at least a year after the flooding. The current scores were higher for the flooded sample than for both the ‘at risk’ sample and the average for England in the Health Survey for England 2003. While there is recovery and resilience, as evidenced by the differences in the worst time and current scores, the flooding has long lasting impacts on the mental health of flood victims.
Vulnerability as measured here remains difficult to explain. Although the levels of explanation offered in the regressions analyses are not high, such levels of explanation are common in social science. Nevertheless, for two of the measures more than three quarters of the variance in the vulnerability remains unexplained when all the potential explanatory variables available within the study were included in the analysis. Community and social variables and psychological measures that were not included in the Intangibles Survey might offer further explanation.
The basic flood characteristics of depth and extent of flooding were not as prominent as explanatory factors as might be expected although they did play a part for some measures. All the respondents in the Intangibles Survey had flood waters inside their home and the results of the regression indicated that the actual depth of flooding is not such a salient factor. The contamination of the floodwaters was surprisingly important featuring as a predictor for all the measures and models, not only for the GHQ12 scores which focuses on mental health but also for the stress of the event and the overall severity.
Social variables that we might expect to be associated with vulnerability, such as old age, ill health and disability in the household, living alone, living alone in old age, having children or young children in the home did not feature as prominently as predictors as we might have expected. Indeed old age and or living alone were included in some models with an effect in the opposite direction to the expected one. The models were consistent with the bivariate analyses which showed that the middle aged tended to be more vulnerable than older people. Prior health was a predictor of the GHQ12 scores and featured in six of the eight models that included social variables indicating that health status contributed to many forms of vulnerability and both in the short term and long term. Gender was also a common factor in the models apart from those for the current GHQ12 The area house price ratings which reflect the wealth of the areas where people lived were significant factor in six of the models although the effect was not consistently in one direction. So too was tenure for some measures.
When post-flood events and responses were introduced, having to leave home and the time spent in getting the home back to normal were important explanatory variables. Institutional responses in the aftermath of flooding by insurers and loss adjustors were a very important explanatory factor common to all the vulnerability measures. This shows that how these institutions and the individuals within them deal with insurance claims can have a very significant role in mitigating or exacerbating the impacts of flooding on households. This emerged very strongly in FHRC’s earlier qualitative work (Tapsell et al., 1999; Tapsell and Tunstall 2001). Having uninsured losses was a predictor in two models indicating that where insurance cover was adequate, people were less vulnerable. Social and other institutional responses in terms of help from outside the household were factors that did not emerge as significant predictors of vulnerability. Indeed, the bivariate analyses showed that those helped tended to have higher scores on the vulnerability variables, probably because those who attracted help from outside the home were more seriously affected by the flooding. Thus such help did not emerge as a mitigating factor in vulnerability.
7 Summary and Conclusions
document.doc 29/06/07123

FLOODsite Project Report Contract No:GOCE-CT-2004-505420
The major objectives of FLOODsite Task 11 that this research aimed to address were:
to characterise types of communities with regard to their preparedness, vulnerability and resilience related to flood events;
to understand the driving forces of human behaviour before, during, and after floods; to learn lessons from case studies in Germany, Italy and the U.K.
In this report we addressed these questions through the reanalysis of three existing sets of data originally collected for other purposes between 2002 and 2005:
‘Intangibles’ data set ‘Warnings’ data set ‘Lower Thames’ data set
The first two surveys covered mainly those affected by flooding in a wide range of flood events and local communities in England and Wales and the third focused mainly on those at risk in a particular allocation in the Thames Valley, in the South of England.
Our key hypotheses were that individuals or households are vulnerable or resilient to flooding in the context of particular situations, especially their risk environments. Every flood therefore presents a combination of factors and the outcome in terms of vulnerability or resilience will be a combination of:
the flood event characteristics and the flood risk perceptions and experiences of the population affected;
the characteristics and resources of the population affected; their dwelling characteristics; and the organisational and institutional responses to a particular event.
Therefore, the social and dwelling characteristics of the respondents in the three data sets were described in Chapter 3 and the flood events covered in the survey and the evidence on risk perceptions and constructions were presented in Chapter 4.
7.1 Social vulnerability and the drivers of human behaviour, before, during and after floods
In chapter 5 we explored human behaviour before, during and after flooding in relation to the key factors outlined above, which may influence the levels of social vulnerability and the ability to cope with and recover from a flood. Table 7.1 summarises some key findings on preparedness prior to flooding.
Almost all the preparedness actions were found to vary according to the specific location surveyed, thus highlighting the importance of the combination of factors unique to each flood event.
According to the literature on social vulnerability, one might expect that many of the respondents and households in the surveys e.g. those with young children, older residents, long term ill or disabled, and those on lower incomes or in lower social grade groups would be particularly vulnerable during flood events. This was evidenced in the data analyses, however, the situation is complex and different groups were not necessarily vulnerable across all situations.
Flood awareness is a difficult concept to define and measure and it needs to be time-bounded. However, prior awareness of flood risk or the lack of it is important: it can be taken as indicative of vulnerability and may be a factor affecting response to flooding. The surveys show that awareness prior to actually experiencing flooding or on moving to the address was low (at between 24% to 30%). In some of the surveys, prior flood experience, being a property owner rather than renting property and a longer term residence were associated with prior awareness.
document.doc 29/06/07124

FLOODsite Project Report Contract No:GOCE-CT-2004-505420
Table 7.1 Social vulnerability to flooding and preparedness actions: Intangibles and Warnings Surveys
Pre flooding
Prior awareness of flood risk
Holding insurance:BuildingsContents: old for new
Registered onAVM system
Prior prepared-ness actions taken
Warning received including unofficial warnings
Survey Intang-ibles
Warn-ings
Intang-ibles
Warn-ings
Warn-ings
Warnings Intang-ibles
Warn-ings
People aged 65+ -AB Social grade
++
++
DE Social grade
--
--
- -
Owners + ++
++
+
Young children in h/h (<10)
-
Living alone
--
Disability/ illness in h/h
--
Long term resident: 20+/30+ yrs
+ + +
Vulnerable housing
-- -
Prior flood experience
NA + + + + +
Location +-
+-
+-+- +-
+-
+-
+-
+-
+ = a positive effect: significant at the p<0.05 level- = a negative effect: significant at the p<0.05 level
In terms of preparedness actions that might be expected to make individuals and households less vulnerable to flooding, taking out some form of insurance was the most common measure taken although for many residents flood insurance may have come automatically as part of their general household insurance. Social and economic factors: social grade, income and owning rather than renting property were important in insurance take up. Groups that might be considered to be vulnerable i.e. the lower social grade groups, those living alone, households with long term ill or disabled members and those in vulnerable housing were less likely to have insurance cover. Another key preparatory action that those at risk of flooding in England and Wales can take is to register with the Environment Agency to receive an Automatic Voice Message (AVM) via Floodline Warnings Direct of possible flooding. However, the Warnings Survey data confirm that registration prior to flooding is low (28%) and they also show that the drivers here were different from those affecting take up of insurance: those with prior experience of flooding and prior awareness of the risk were more likely to register and other social and economic factors were not significant in registration.
As in other European countries, property owners in flood risk areas in England and Wales are increasingly being encouraged to take some responsibility for protecting their property. However, few Warnings Survey residents had taken pre-flood measures to protect the structure of their property. The only action that was taken by more than half of respondents was to take out insurance. Only small minorities had adapted their behaviour and the way they lived in their homes prior to the recent or worst flooding. Drivers for the number of pre-flood precautions taken were awareness of flood risk,
document.doc 29/06/07125

FLOODsite Project Report Contract No:GOCE-CT-2004-505420
the number of floods experienced and length of residence. Households that might be considered to be particularly vulnerable were less active but the differences were not significant apart from the case of households with young children.
Flood warnings from official or unofficial sources may affect the level of flood impacts such as property damage and the health and stress effects of flooding by allowing time to move people and property to safety and to prepare mentally for the flood event. Findings on flood warnings are discussed in detail in Chapter 4, Sections 4.4.4.and 4.4.5 of this report. A key finding from the surveys is that only minorities received a warning of any kind (% receiving a warning in the recent or worst flood ranged from 23% to 37%). In the Lower Thames Survey only just over half those interviewed (53%) had ever received a warning of flooding at their current address. From the Warnings Survey, it is clear that a telephone message from the AVM system is becoming the main warning source, with warnings from unofficial sources: neighbours, friends and relatives also significant. In that Survey, the key factor in who received a warning was found to be registration on the AVM system.
In addition receipt of a warning was more common among long term residents in that survey. In both the Intangibles and Warnings Surveys, receipt of a warning was associated with prior awareness and experience of flooding and there were significant variations in warning receipt according to social grade, with the lowest social grade groups less likely to be recipients. There was some evidence of variation in warning receipt according to tenure but the difference was significant only in the Intangibles Survey in which more owners were warned. In the Intangibles survey, the receipt of a warning also varied according to the flood characteristics perceived and experienced. Those who perceived the speed of onset of flooding to be slow and those more seriously affected in terms of flood depth and the number of parts of the property flooded were more likely to have received a warning. However, there was no evidence in the Surveys of warnings being targeted at socially vulnerable groups.
Thus, those that we might expect to be disadvantaged in preparing for floods, such as the elderly, those living alone, households with young children, those in low social grade and income groups did not differ in all cases in their preparedness actions as compared with others. The drivers of human behaviour in taking precautionary measures were complex and vary according to the particular actions. Other factors, such as how flood risk was constructed and flooding experienced, were influential.
Table 7.2 focuses on coping actions taken during and after flooding and social vulnerability drawing mainly on the evidence from the Warnings Survey. There was some evidence summarised in Table 7.2 to indicate that groups that might be considered to be vulnerable were disadvantaged in coping with a flood event. For example, people aged 65 and over were less active in seeking further information, in taking action to protect their property and in taking some other safety measures. They were more likely to have taken no coping actions than others. In contrast, households with young children were more active than other households in some respects: more of them moved property and household members to safety. However, other factors were important. Flood warnings were a significant driver of coping behaviour as were current or past experience of flooding inside the home.
The Intangibles Survey examined help and social support received during and after the flood event from a variety of sources, and in particular help from neighbours and friends. In this Survey, help from neighbours and friends was less forthcoming for many of those who might be considered to be particularly vulnerable and in need of help in a flood event: older people, those in low social grades, living alone, the long term ill or disabled. Those living in vulnerable housing such as bungalows, ground floor flats often occupied by elderly people were less likely to be helped than others in both the Warnings and the Intangibles Surveys. It is possible that these groups were less linked into their local support networks than others around them and therefore may get overlooked. In the Warnings Survey, in which spontaneously mentioned help from all sources as well as just help from neighbours were examined, there were fewer associations between social vulnerability and help received. However, families with young children, also potentially vulnerable in a flood event, did attract more help from neighbours and friends to cope with the flood in both the Intangibles and the Warnings Surveys. It is
document.doc 29/06/07126

FLOODsite Project Report Contract No:GOCE-CT-2004-505420
possible that social networks make the difference here and that families with young children are more strongly linked into the local community through schools and children’s friendships and activities than other residents.
Table 7.2 Social vulnerability to flooding and coping actions during and after flooding: Intangibles and Warnings Surveys
During and after flooding
Sought information
Damage reduction:Sandbags used/ property moved
Moved household members
Other safety measures
No action taken
Help received
Survey Warnings Warnings Warnings Warnings Warnings Intangibles:From neighbour/friends
Warnings:From all kinds of sources
People aged 65+
_ _ _ + _
AB Social grade
+
DE Social grade
_ _ _
Owners + +
Young children in h/h (<10)
+ + + +
Living alone
_ _
Disability/ illness in h/h
_
Vulnerable housing
_ _ + _ _
Prior flood experience
+ + + + _ +
+ = a positive effect: significant at the p<0.05 level- = a negative effect: significant at the p<0.05 level
Other factors apart from the social vulnerability of the residents were significant in the help received. In the Intangibles survey there were significant differences according to the depth and extent of flooding, with more help from neighbours and friends forthcoming for the more seriously affected. In the Warnings Survey, those who received a flood warning were significantly more likely to report help of all kinds but not specifically neighbourly help, and getting help of all kinds was significantly associated with flood experience.
All forms of help varied significantly in the different locations targeted in the survey. Both the social composition and social cohesiveness of the neighbourhoods and the characteristics of the flood events may contribute to this variation.
Overall, the analysis helps us to further understand the diverse factors influencing human behaviour before, during and after the flood events. The analysis also makes clear that no single social variable or set of indicator social variables can be identified to explain all aspects of vulnerability, coping and resilience in flooding. Different social factors come into play in the different phases of a flood event and, more particularly affect specific behavioural responses and coping activities. Thus, the revealed situations and responses are much more complex and diverse than the concept of social vulnerability appears to imply.
document.doc 29/06/07127

FLOODsite Project Report Contract No:GOCE-CT-2004-505420
7.2 The impacts of flooding and social vulnerability
Chapter 6 of this report examined in detail the impacts of flooding drawing on the data from the Intangibles Survey alone. In this survey, subjective ratings were obtained for 12 possible effects of flooding and for the overall subjective severity of the effects of flooding on the household. Of these subjective severity measures, the disruption to life and all the problems and discomfort during the recovery was the most highly rated impact, followed by the stress of the flood event, having to leave home and worry about future flooding. The first three of these intangible impacts were rated more highly than the tangible impacts (property damages).
Four measures of the impacts including two of these subjective severity ratings were taken as measures of vulnerability of individuals and households to the effects of flooding. These vulnerability variables were employed to further explore the concepts of vulnerability, coping and resilience to flooding. The variables used were:
The General Health Questionnaire (GHQ)12: a 12-item self completion questionnaire for screening mental health applied to the individual’s current situation.
The GHQ12 applied to the individual’s situation at the worst time of the flooding The overall subjective severity rating of the effects of the flood on the household (scale 1-10) The subjective stress of the flood on the household (scale 1-10)
These variables are clearly very different: the first two employ well established scales for measuring mental health and apply to individuals at different stages in time. The second two measures are subjective single item scales that apply to the household. These variables appeared to be capturing somewhat different dimensions of vulnerability and the correlations between them were only moderately strong.
The reanalysis in this chapter was based on a model that considered vulnerability and resilience in flooding to depend on four sets of factors. These ‘vulnerability’ variables were examined in bi-variate (summarised in Table 6.17) and multi-variate analyses (summarised in Tables 6.22 and 6.23) in relation to four sets of variables:
The flood event characteristics The social characteristics of the individuals and households affected. The dwelling and residence characteristics Post event and intervening factors such as help received
The bi-variate analyses showed that the certain characteristics of the flood experienced: the depth and extent of flooding in terms of the number of main parts of the dwelling flooded, and the perception of the floodwaters as contaminated, were significant explanatory factors across all the ‘vulnerability’ variables. Certain variables that might be taken as indicators of social vulnerability, ill health and disability, and age were also significantly associated with all these variables. However, counter-intuitively, the very old, those aged 75 and over, were less affected than the middle aged and the relationship between age and the vulnerability variables was not a linear one. Social characteristics that might be expected to make individuals or households more vulnerable such as having young children in the home, social grade and living alone were not associated with all the ‘vulnerability ‘ variables but were factors for only one or two of them. Gender was significant for three of the variables including the overall subjective severity and stress and the worst time GHQ12 score but not for the current GHQ12 score suggesting that flooding had a worse effect on women around the time of the event but that women recovered over time so that the difference between men and women was no longer significant in the current GHQ12 scores. Dwelling and residence characteristics also had some influence. Tenure emerged as a significant factor across all the variables with the small minority renting their property more affected than the home owners. Those living in vulnerable property such as bungalows and ground floor flats had higher scores on all the variables apart from the current GHQ12. Finally, it is clear that intervening factors such as dealings with builders and insurers and the way they
document.doc 29/06/07128
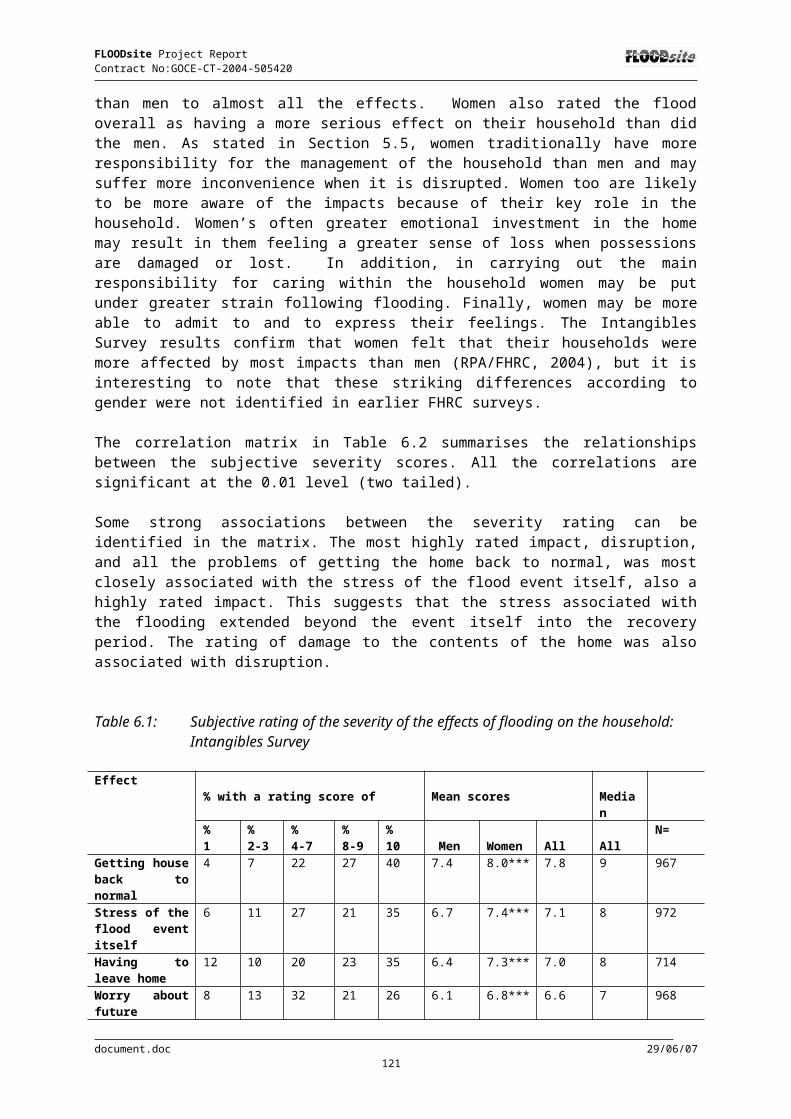
FLOODsite Project Report Contract No:GOCE-CT-2004-505420
handle flood affected clients during the recovery period can have a significant impact on the vulnerability measures. Help received from outside the household in the flood event and in the aftermath were significant factors in relation to the subjective measures.
A key conclusion from the multi-variate regression analyses is that vulnerability as measured by the four variables remains difficult to explain. Although the levels of explanation offered by these analyses were not high, such levels of explanation are common in social science. When only the social, dwelling and flood characteristics were entered into the model as predictors, adjusted R 2 ranged from 0.08 for current GHQ12 scores to 0.18 for subjective stress ratings. When post flood and intervening factors were introduced into the model as predictors, levels of explanation were enhanced with adjusted R2 of 0.15 for current GHQ12 and 0.29 for stress and overall severity. There is much that remains to be explained here.
Furthermore, the four measures were clearly measuring somewhat different aspects of vulnerability. There were only five predictor variables that were shared across three or more of the four regression models that excluded post event and intervening factors. A complex set of social and other factors appears to be involved in the susceptibility of people to the health and other effects of flooding. There is some evidence in the study too that the way the aftermath of flooding is handled by institutions and individuals, for example builders and insurance agents, warning agencies and those responsible for guidance on water contamination, can have a very significant mitigating or exacerbating effect on the impacts of flooding.
The data also allow lessons to be learned (albeit in the context of specific populations and locations in England and Wales) in identifying which groups might be vulnerable to the probability and impacts of flooding and on how individuals and households may be able to increase their resilience to these impacts and their capacity to recover. The results will be of use to people living in flood risk areas and to those agencies with a responsibility to respond to flooding in order to improve pre-flood preparedness and post-flood recovery. Agencies with responsibility for flood risk management, including the insurance industry in the UK, need to take on board the results from this research, for example, by providing more targeted flood warnings to those at risk, keeping a register of vulnerable groups and housing within local areas, increasing awareness-raising activities, improving the ways that insurance claims are dealt with, by organising local flood action groups and providing grants for householders to purchase flood protection products.
7.3 Key lessons and further research
The key lessons learned from the UK case study relate to understanding the driving forces of human behaviour before, during and after flooding, and with regard to the preparedness, vulnerability and resilience of households and individuals in relation to flood events. Certain groups within communities can be identified as more or less vulnerable in certain situations and as more or less resilient in others, although the research revealed the complexity of these issues. However, the study was not able to address the first aim of Task 11 in characterising types of communities with regard to their preparedness, vulnerability and resilience related to flood events. Further UK research is necessary on the community impacts of and response to flooding, as this report has, by necessity, focused only on individuals and households. More research is also needed on how people construct flood risk and how this affects behaviour in response to flooding.
Further exploration in the UK context is also needed on social cohesiveness and social networks, within communities, which were a focus of research in the Mulde study, and on institutional arrangements in supporting flood risk communities in their response to flooding. Although some assumptions can be made from the research findings here regarding these factors, they should be viewed with some caution and more detailed studies are needed.
document.doc 29/06/07129

FLOODsite Project Report Contract No:GOCE-CT-2004-505420
References
1. ABI (undated) Flood Resilient Homes: What homeowners can do to reduce flood damage. Available at: http://www.abi.org.uk/Display/File/78/Flood_Resistance_report.pdf
2. ABI (2005) Statement of Principles on the provision of flood insurance. http://www.abi.org.uk/Display/File/Child/553/statementofprinciples2005.pdf
3. ADGER W N (2000), Social and ecological resilience: are they related? Progress in Human Geography 24, 347–364.
4. ADGER W N, BROOKS N, BENTHAM G, AGNEW M, ERIKSEN S (2004), New indicators of vulnerability and adaptive capacity, Technical Report 7, Norwich: Tyndall Centre for Climate Change Research (http://www.tyndall.ac.uk/research/theme3/final_reports/it1_11.pdf; last access November 13, 2006).
5. ANDRYSZEWSKI A, EVANS K, HAGGETT C, MITCHELL B & WHITFIELD D (2005) Flood Warning – the Next Step-Change, 40th Defra Conference of River and Coastal Engineers, Keele, July 2005.
6. ARNELL N W, CLARK M J, & GURNELL A M (1984) Flood insurance and extreme events: the role of crisis in prompting changes in British institutional response to flood hazard. Applied Geography 4, pp. 167-181
7. AZJEN I (1988) Attitudes, Personality, and Behaviour. Milton Keynes: Open University Press
8. BANKOFF G (2001), Rendering the World Unsafe: Vulnerability as Western Discourse. Disasters 25, 19–35.
9. BARRY J M (1997), Rising Tide. The Great Mississipi Flood of 1927 and How it Changed America, New York: Simon and Schuster.
10. BARTON A H (1969), Communities in Disaster. A Sociological Analysis of Collective Stress Situations, Garden City, NY: Doubleday.
11. BECK U (1992), Risk Society. Towards a New Modernity, London: Sage (first in German in 1986).
12. BEGGS J, HAINES V, HULBERT J S (1996), The effects of personal network and local community contexts on the receipt of formal help during disaster recovery, International Journal of Mass Emergencies and Disasters 14, 57–78.
13. BENSON C (2004), Macro-Economic Concepts of Vulnerability: Dynamics, Complexity and Public Policy. Mapping Vulnerability: Disasters, Development and People. In: BANKOFF G., FRERKS G., HILHORST D. (eds.), Mapping Vulnerability: Disasters, Development and People, London: Earthscan, 159–173.
14. BERGER P, LUCKMANN T (1967), The Social Construction of Reality: A Treatise in the Sociology of Knowledge, New York: Anchor Books.
15. BLAIKIE P, CANNON T, DAVIS I, WISNER B (1994), At Risk: Natural Hazards, People’s Vulnerability, and Disasters, London: Routledge.
document.doc 29/06/07130

FLOODsite Project Report Contract No:GOCE-CT-2004-505420
16. BLAND A H, O’LEARY E S, FARINARO E, JOSSA F, KROGH V, VIOLANTI J M & TREVISAN M D (1997) Social network disturbance and psychological distress following earthquake evacuation, The Journal of Networks and Mental Disease, 185 (3) 188-194.
17. BOHLE H-G (2005), Soziales oder unsoziales Kapital? Das Sozialkapital-Konzept in der Geographischen Verwundbarkeitsforschung, Geographische Zeitschrift 93, 65–81.
18. BONẞ W (1995), Vom Risiko: Unsicherheit und Ungewißheit in der Moderne, Hamburg: Hamburger Edition HIS Verlagsgesellschaft.
19. BOURDIEU P (1986), The forms of capital, In: RICHARDSON J. G. (ed.), Handbook of Theory and Research for the Sociology of Education, New York: Greenwood, 241–258.
20. BOYCE J K (2000), Let Them Eat Risk? Wealth, Rights and Disaster Vulnerability, Disaster 24, 254–261.
21. BREHMER B (1994), Some notes on psychological research related to risk. In: BREHMER B, SAHLIN NE (eds.), Future risks and risk management, Amsterdam: Kluwer, 79–91.
22. BUCKLE P, MARSH G, SMALE S (2000), New approaches to assess vulnerability and resilience, Australian Journal of Emergency Management Winter, 8–14.
23. BUCKLE P, MARSH G, SMALE S (2001), Assessing Resilience and Vulnerability: Principles, Strategies and Actions. Guidelines (paper for Emergency Management Australia).
24. BURT RS (1987), Social contagion and innovation: Cohesion versus structural equivalence, American Journal of Sociology 92, 1287–1335.
25. BURT R S, MINOR M J (eds.) (1983), Applied Network Analysis. A Methodological Introduction, Beverly Hills: Sage.
26. BURTON I, KATES R W & WHITE G F (1978) The Environment as Hazard. New York: Oxford University Press
27. BYE P & HORNER M (1998) Easter 1998 floods. Volume I. Report by the Independent Review Team to the Board of the Environment Agency.
28. CAULKINS D D (1999), Is Mary Douglas's Grid/Group Analysis Useful for Cross-Cultural Research? Cross-Cultural Research 33, 108–128.
29. CENSUS FOR ENGLAND AND WALES (2001), available from: www.statistics.gov.uk/Stat.Base
30. COLEMAN J S (1990), Foundations of Social Theory, Cambridge, Mass.: Harvard University Press.
31. COUCH S. R., KROLL-SMITH J. S. (eds., 1991), Communities At Risk: Collective Responses to Technological Hazards, New York et al.: Peter Lang.
32. CUTTER S L (1996), Vulnerability to environmental hazards. Progress in Human Geography 20, 529–539.
33. CUTTER S L, BORUFF B J, SHIRLEY W L . (2003), Social Vulnerability to Environmental Hazards, Social Science Quarterly 84, 242–261.
document.doc 29/06/07131

FLOODsite Project Report Contract No:GOCE-CT-2004-505420
34. DEFRA (2004) Making space for water: Taking Forward a new Government strategy for flood and coastal erosion risk management. Response to first consultation document. London: Defra
35. DE MARCHI B. (1995), Uncertainty in Environmental Emergencies: A Diagnostic Tool, Journal of Contingencies and Crisis Management 3, 103–112.
36. DE MARCHI B, RAVETZ J R (1999), Risk management and governance: A post-normal science approach, Futures 31, 743–757.
37. DELICA-WILLISON Z, WILLISON R (2004), Vulnerability Reduction: A Task of the Vulnerable People Themselves, In: BANKOFF G., FRERKS G., HILHORST, D. (eds.), Mapping Vulnerability: Disasters, Development and People, London: Earthscan, 145–158.
38. DIXIT A (2003), Floods and Vulnerability: Need to Rethink Flood Management, Natural Hazards 28, 155–179.
39. DOUGLAS M., WILDAVSKY A. (1982), Risk and Culture: An Essay on the Selection of Technical and Environmental Dangers, Berkeley, CA: University of California Press.
40. DRABEK T. (1986), Human System Responses to Disaster. An Inventory of Sociological Findings, New York, Berlin, Heidelberg: Springer.
41. DRABEK T E (2000) ‘The social factors that constrain human responses to flood warnings’. In Parker, D.J. (ed) ‘Floods’ vol 1, Routledge, London.
42. DTLR (2002) Preparing for Floods. DTLR: London
43. DYNES R. (2002), The importance of social capital in disaster response, Preliminary paper 327, Disaster Research Center, Newark: University of Delaware Press.
44. DYNES R. R., TIERNEY K. J. (1994), Disasters, collective behaviour, and social organization, Newark: University of Delaware Press.
45. ENARSON E & FORDHAM M (2001) Lines that divide, Ties that bind: Race, class and Gender in Wome4n’s Flood Recovery in the US and UK, Australian Journal of Emergency Management,Vol.15 (4), 43- 52.
46. ENARSON E & MORROW B (Eds.) (1998) Through Women’s Eyes: The Gendered Terrain of Natural Disasters, Westport: Praeger.
47. ENVIRONMENT AGENCY (2001) Lessons learned: Autumn 2000 floods. Bristol: Environment Agency
48. ENVIRONMENT AGENCY/CONSTRUCTION INDUSTRY RESEARCH AND INFORMATION ASSOCIATION (2001), Damage Limitation: How to Make Your Home Flood Resistant. Bristol, Environment Agency
49. ENVIRONMENT AGENCY (2005) Living with the risk: The floods in Boscastle and North Cornwall 16 August 2004, Exeter, Environment Agency.
50. ERIKSON K (1976), Everything in Its Path, New York: Simon and Schuster.
51. EWALD, F (1989), Die Versicherungsgesellschaft, Kritische Justiz 22, 385–393.
document.doc 29/06/07132

FLOODsite Project Report Contract No:GOCE-CT-2004-505420
52. FHRC (1996) Technical Annex 14: Evacuation. EUROflood project.
53. FISHER H W, STIE G F, STOKER B L, TROWBRIDGE M L & DRAIN E M (1995) ‘Evacuation behaviour: why do some evacuate while others do not? A case study of the Ephrata, Pennsylvania (USA) evacuation’. Disaster Prevention and Management, 4 (4), p.30-36.
54. FISCHHOFF B, SLOVIC P, LICHTENSTEIN S (1979), Which Risks Are Acceptable? Environment 21, 17–38.
55. FLOODsite (2005) Language of Risk: Project Definitions. FLOODsite
56. FORDHAM M H (1998) 'Making women visible in disasters: Problematising the private domain'. Disasters 22, No. 2, 126-143.
57. FUNTOWICZ S O, RAVETZ J. R. (1993), Science for the Post-Normal Age, Futures 25, 735–755.
58. GALLOPÍN G C (2006), Linkages between vulnerability, resilience and, and adaptive capacity, Global Environmental Change 16, 293–303.
59. GIDDENS A (1986), The Constitution of Society: Outline of the Theory of Structuration, Santa Barbara: University of California Press.
60. GOLDBERG D (1978) Manual of the General Health Questionnaire. Windsor: NFER-Nelson
61. GOLDBERG D & WILLIAMS P (1988) A User’s Guide to the General Health Questionnaire, Windsor: NFER-Nelson
62. GRANOVETTER M (1973), The Strength of Weak Ties, American Journal of Sociology 78, 1360–1380.
63. GRANOVETTER M (1983), The Strength of Weak Ties: A Network Theory Revisited, Sociological Theory 1, 201–233.
64. GREEN C (2003), Evaluating vulnerability and resilience in flood management. In: VAN DER VEEN A., ARELLANO V., NORDVIK J. P. (eds.), Search for a common methodology on damage estimation, Ispra: European Commission (EUR 20997 EN), 19–52.
65. GREEN C H (1995) Assessing vulnerability to flooding: nodes and networks. Enfield: Flood Hazard Research Centre, Middlesex University
66. GREEN G H & PARKER D J (1993) Evacuation: a research perspective. Invited paper given at Emergency Planning College Workshop on Evacuation Planning. Easingwold.
67. GREGORY R (2002), Incorporating value trade-offs into community-based environmental risk decisions, Environmental Values 11, 461–488.
68. GREGORY R WELLMAN K (2001), Bringing stakeholder values into environmental policy choices: a community-based estuary case study, Ecological Economics 39, 37–52.
69. GUNDERSON L, HOLLING C, LIGHT S (1995), Barriers and bridges to the renewal of ecosystems, New York: Columbia University Press.
document.doc 29/06/07133
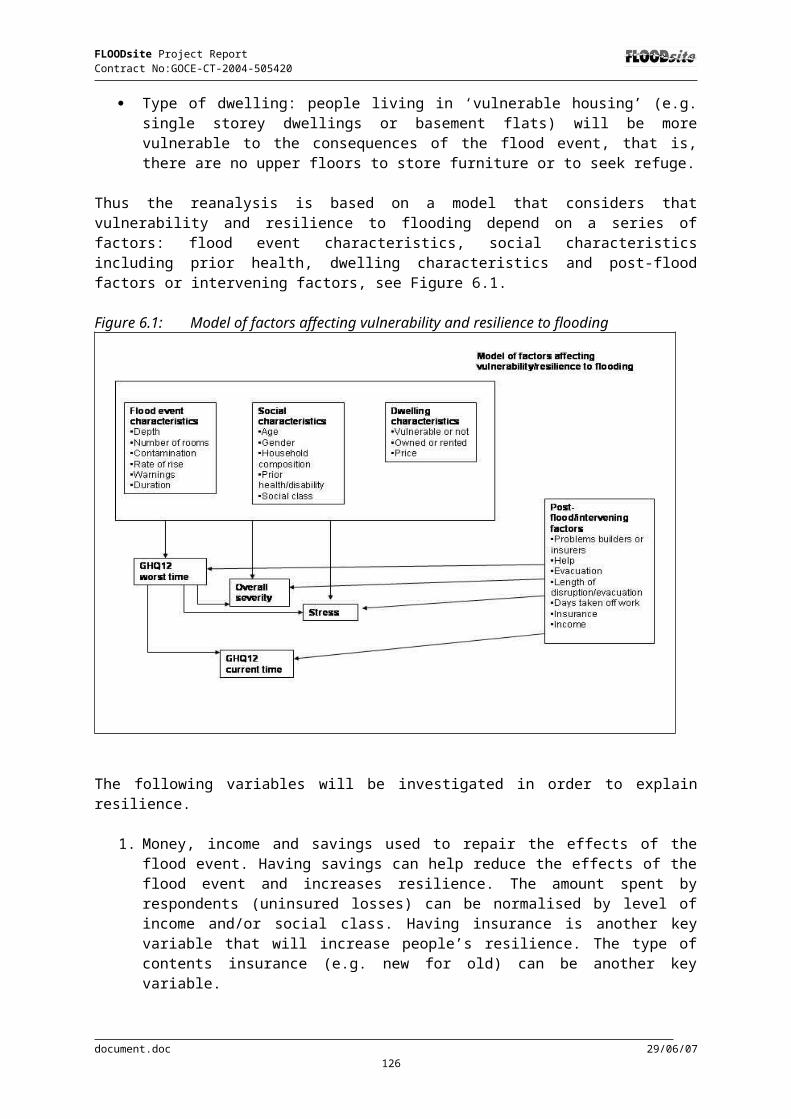
FLOODsite Project Report Contract No:GOCE-CT-2004-505420
70. HALCROW GROUP LIMITED, BABTIE BROWN AND ROOT, FLOOD HAZARD RESEARCH CENTRE (2005), Environment Agency Lower Thames Strategy Study – Phase 2. Final Draft Report February 2005, Swindon, Halcrow Group Limited.
71. HANDMER J (2003), We are all vulnerable. Australian Journal of Emergency Management 18 (3), 55-60
72. HANDMER J (2000), Are Flood Warnings Futile? Risk Communication in Emergencies, The Australian Journal of Disaster and Trauma Studies No. 1 (e-journal), 14 pp.
73. HEATH E; KADD PH, BECK AM & GLICKMAN LT (2001) ‘Human and pet-related risk factors for household evacuation failure during a natural disaster’. American Journal of Epidemology, 153 (7), p.659-665.
74. HEWITT K. (1997), Regions of Risk: A Geographical Introduction to Disasters. Essex: Longman.
75. HOEKSTRA A. J (1998), Appreciation of water: four perspectives, Water Policy 1, 605–622.
76. HORLICK-JONES T., DE MARCHI B., PRADES LOPEZ A., PIDGEON N., DEL ZOTTO M., DIAZ HIDALGO M., PELLIZZONI L., SIME J., UNGARO D. (1998), The social dynamics of Environmental Risk Perception: A Cross-Cultural Study. Final Report of the PRISP project funded by the European Commission, 4th Framework Programme.
77. HURLBERT J S, HAINES V A, BEGGS J J (2000), Core Networks and Tie Activation: What Kinds of Routine Networks Allocate Resources in Nonroutine Situations?, American Sociological Review 65, 598–618.
78. JASANOFF S (2006, forthcoming), Risk in Hindsight: Constructing a Politics of Resilience, In: RICHTER I. K., BERKING S., MÜLLER-SCHMID R. (eds.), Risk Society and the Culture of Precaution, Basingstoke: Palgrave Macmillan.
79. JOHNSON B B, COVELLO V. T. (1987), The social and cultural construction of risk, Dordrecht: Reidel.
80. KASPERSON J. X., KASPERSON R. E. (2001), International Workshop on Vulnerability and Global Environmental Change: A Workshop Summary, 17–19 May 2001, Stockholm, Sweden. Stockholm Environment Institute Risk and Vulnerability Programme Report. www.vulnerabilitynet.org (last access July 30, 2006).
81. KATES R W (1962) Hazard and Choice Perception in Flood Plain Management. University of Chicago, Dept. of Geography, Research Paper No. 78
82. KAY J (2001), Ecosystems, Science and Sustainability, In: ULGIATI S., BROWN M. T., GIAMPIETRO M., HERENDEEN R., MAYUMI K. (eds.), Proceedings of the international workshop: Advances in Energy Studies: exploring supplies, constraints and strategies, Porto Venere, Italy, 23–27 May, 2000, 319–328.
83. KETTERIDGE A M & FORDHAM M (1997) ‘Flood Warning and the Local Community Context’. In J. Handmer, ed. (1997) Flood Warning: Issues and practice in total system design. Enfield: Flood Hazard Research Centre, Middlesex University , 189-199
84. KETTERIDGE AM & FORDHAM M (1995) ‘EUROflood UK Evacuation Study: Interim Results’ Paper presented at TIEMEC’95 Conference, Nice, France. 9-12 May 1995.
document.doc 29/06/07134

FLOODsite Project Report Contract No:GOCE-CT-2004-505420
85. KETTERIDGE A M & GREEN C (eds) (1994) ‘Technical annex for the Full Flood Impacts module’. Flood Hazard Research Centre, Middlesex University, Enfield, Middlesex.
86. KING D, MAC GREGOR C (2000), Using social indicators to measure community vulnerability to natural hazards, Australian Journal of Emergency Management 15, 52–57.
87. KIRSCHENBAUM A. (2004), Generic Sources of Disaster Communities: A Social Network Approach, International Journal of Sociology and Social Policy 24, no. 10/11, 94–129.
88. KREPS G (ed., 1989), Social Structure and Disaster, Newark: University of Delaware Press.
89. KRIMSKY S, GOLDING D (eds., 1992), Social Theories of Risk, Westport, CT: Praeger.
90. LASH S, SZERSZYNSKI B, WYNNE B (eds.) (1996), Risk, environment and modernity: towards a new ecology, London: Sage.
91. LEWES FLOOD AFTERCARE GROUP (LFAG) (2001) Final Report. Lewes, Lewes Flood Aftercare Group
92. LGiU (2004), ‘Housing: The Right to Choose’ (by J Sillett). London, Local Government Information Unit
93. LOWENTHAL D (1961) ‘Geography, experience and imagination: towards a geographical epistemology’. Annals, Association of American Geographers, 51, pp. 241-260
94. THE MARKET RESEARCH SOCIETY (2002) Occupation Grouping: A job Dictionary, 5th
Edition, London: The Market Research Society.
95. MARINCIONI, F (2001), A Cross-Cultural Analysis of Natural Disaster Response: The Northwest Italy Flood of 1994 Compared to the U.S. Midwest Flood of 1993, International Journal of Mass Emergencies and Disasters 19, 209–236.
96. MATTHIESEN U. (2005), KnowledgeScapes: Pleading for a knowledge turn in socio-spatial research, Working Paper, Erkner: IRS (http://www.irs-net.de/download/KnowledgeScapes.pdf, last access 01.02.2006).
97. MCCARTHY S, PARKER D & PENNING-ROWSELL E (2006) Preconsultation Social Survey; Community Based Flood Risk Reduction Options Reach 4: Walton Bridge to Teddington. Enfield: Flood Hazard Research Centre, Middlesex University.
98. MESSNER F, MEYER V (2006), Flood damage, vulnerability and risk perception – challenges for flood damage research, In: SCHANZE J., ZEMAN E., MARSALEK, J. (eds.), Flood Risk Management – Hazards, Vulnerability and Mitigation Measures, Berlin et al.: Springer (NATO Science Series IV, Earth and Environmental Sciences; 67), 149–167.
99. MITCHELL J K (ed., 1996), The long road to recovery: Community responses to industrial disaster, Tokyo: United Nations University Press.
100. MORROW B H (1999) 'Identifying and mapping community vulnerability'. Disasters, 23, No. 1, 1-18.
101. NAKAGAWA Y., SHAW R. (2004), Social Capital: A Missing Link to Disaster Recovery, International Journal of Mass Emergencies and Disasters 22, 5–34.
document.doc 29/06/07135
FLOODsite Project Report Contract No:GOCE-CT-2004-505420
102. NEAL J AND PARKER D J (1989), Flood warnings in the Severn-Trent Water Authority area: an investigation of standards of service, effectiveness and customer satisfaction. Geography and Planning Paper No. 23. Enfield, Middlesex Polytechnic
103. NORRIS F H & MURRELL S A. (1988) 'Prior experience as a moderator of disaster impact on anxiety symptoms in older adults'. American Journal of Community Psychology, 16, 665-683
104. NOWOTNY H, SCOTT P, GIBBONS M (2001), Re-Thinking Science. Knowledge and the Public in an Age of Uncertainty, Oxford: Polity.
105. ODPM (2005), Housing in England 2003/04: Part 3: Social Renters and Private Renters. December 2005, Office of the Deputy Prime Minister, London.
106. O’KEEFE P, WESTGATE K, WISNER B (1976), Taking the Naturalness Out of Natural Disasters, Nature 260, 566–567.
107. OLIVER-SMITH, A. (2002), Theorizing Disasters: Nature, Power and Culture. In: HOFFMAN S. M. (ed.), Catastrophe and Culture: The Anthropology of Disaster. Santa Fe: School of American Research Press, 23–47.
108. ONIONS C (2004) Mechanisms of Flooding Report Vol. 1. An Independent Report on the Cause of Flooding Along the River Thames Between Hurley and Teddington in January 2003. By the Mechanisms of Flooding Subgroup on behalf of the FRAGS: Independent Chairman: Clive Onions. Flood Risk Action Groups: www.frags.org.uk
109. PARKER D J HANDMER J H (1998) The Role of Unofficial Flood Warning Systems, Journal of Contingencies and Crisis Management, Vol. 6, No. 1, 45-61
110. PELLING M, HIGH C (2006), Understanding adaptation: What can social capital offer assessments of adaptive capacity [sic!]? Global Environmental Change 16, 308–319.
111. PFENNING U (1996), Soziale Netzwerke in der Forschungspraxis. Zur theoretischen Perspektive, Vergleichbarkeit und Standardisierung sozialer Netzwerke. Zur Validität und Reliabilität von egozentrierten Netz- und Namensgeneratoren, Darmstadt: DDD (Sozialwissenschaftliche Reihe; Vol. 1).
112. PORTES A (1998), Social Capital: Its Origins and Applications in Modern Sociology, Annual Review of Sociology 24, 1–24.
113. POWER M J (undated) The “worst ever” version of the General Health Questionnaire, Extended version, MRC Social Psychiatry Unit, Institute of Psychiatry, London
114. POWER M J (1988) ‘The “Worst Ever” Version of the General Health Questionnaire’. Journal of Clinical Psychology, 44 (2), 215-216
115. PUTNAM R D (1993), Making democracy work. Civic traditions in modern Italy, Princeton, N.J.: Princeton University Press.
116. PUTNAM R D (2000), Bowling alone. The collapse and revival of American community, New York et al.: Simon & Schuster.
117. QUARANTELLI E. L. (1987), Disaster studies: An analysis of the social historical factors affecting the development of research in the area, International Journal of Mass Emergencies and Disasters 5, 285–310.
document.doc 29/06/07136

FLOODsite Project Report Contract No:GOCE-CT-2004-505420
118. QUARANTELLI E L (ed., 1998), What is a disaster? Perspectives on the question, London: Routledge.
119. QUARANTELLI E L, DYNES R R (1977), Response to social crisis and disaster. Annual Review of Sociology 3, 23–49.
120. REACHER M, MCKENZIE K, LANE C, NICHOLS T, IVERSON A, HEPPLE P, WALTER T, LAXTON C& SIMPSON J (2004) Health impacts of flooding in Lewes: a comparison of reported gastrointestinal and other illness and mental health in flooded and non-flooded households. Communicable Disease and Public Health. Vol. 7 (1), 1-8
121. RENN O (2007, forthcoming), Risk Governance. Coping with Uncertainty in a Complex World, London: Earthscan.
122. RENN O, ROHRMANN B (2000), Cross-Cultural Risk Perception: State and Challenges. In: RENN O, ROHRMANN B (eds.), Cross-Cultural Risk Perception: A Survey of Empirical Studies, Dordrecht et al.: Kluwer, 211–233.
123. ROHRMANN B (2000), Cross-cultural Studies on the Perception and Evaluation of Hazards. In: RENN O, ROHRMANN B (eds.), Cross-Cultural Risk Perception: A Survey of Empirical Studies, Dordrecht et al.: Kluwer, 103–144.
124. RPA/FHRC (2004) The Appraisal of the Human related Intangible Impacts of Flooding, R&D Technical Report FD2005/TR, London: Defra
125. SAREWITZ D. R., PIELKE JR. A., KEYKYAH M. (2003), Vulnerability and Risk: Some Thoughts from a Political and Policy Perspective, Risk Analysis 23, 805–810.
126. SCHENK M. (1983), Das Konzept des sozialen Netzwerkes, In: NEIDHARDT F. (ed.), Gruppensoziologie. Perspektiven und Materialien. Westdeutscher Verlag (Kölner Zeitschrift für Soziologie und Sozialpsychologie; Special Vol. 25), 88–104.
127. SCHERER C W, CHO H. (2003), A Social Network Contagion Theory of Risk Perception, Risk Analysis 23, 261–267.
128. SHORT J F Jr. (1984), The Social Fabric at Risk: Toward the Social Transformation of Risk Analysis, American Sociological Review 49, 711–725.
129. SJÖBERG L, KOKAROVA D, RUCAI A ., BERNSTRÖM KL (2000), Risk Perception in Bulgaria and Romania. In: RENN O ., ROHRMANN B . (eds.), Cross-Cultural Risk Perception: A Survey of Empirical Studies, Dordrecht et al.: Kluwer, 145–184.
130. SLOVIC P (1987), Perception of Risk, Science 236, 280–285.
131. SLOVIC P (1992), Perception of Risk: Reflections on the Psychometric Paradigm. In: KRIMSKY S. GOLDING D (eds.), Social Theories of Risk. Westport, London: Praeger, 117–152.
132. SLOVIC P, KUNREUTHER H, WHITE GF (1974), Decision processes, rationality, and adjustment to natural hazards, In: WHITE G. F. (ed.), Natural Hazards: Local, National, Global, New York: Oxford University Press, 187–205.
133. SORENSEN J H, VOGT B M, AND MILETI D S (1987) Evacuation: an assessment of planning and research, Prepared for the Federal Emergency Management Agency (FEMA) Washington, US
document.doc 29/06/07137

FLOODsite Project Report Contract No:GOCE-CT-2004-505420
134. SPROSTON K AND PRIMATESTA P (2004) Health Survey for England 2003 Vol.2: Risk Factors for Cardiovascular Disease, London: Stationery Office.
135. STACEY M (1969), The Myth of Community Studies, British Journal of Sociology 20, 134–147.
136. STEINFÜHRER A (2005), Comparative Case Studies in Cross-National Housing Research, In: VESTBRO D. U., HÜROL Y., WILKINSON N. (eds.), Methodologies in Housing Research, Gateshead: Urban International Press, 91–107.
137. STREITZ W., DOMBROWSKY W. R. (2003), Die Analyse der Katastrophenabwehr als Netzwerk und als Kommunikation, In: DKKV [DEUTSCHES KOMITEE FÜR KATASTROPHENVORSORGE] (ed.), Hochwasservorsorge in Deutschland: Lernen aus der Katastrophe 2002 im Elbegebiet, Bonn: DKKV, 100–119.
138. SUSMAN P, O’KEEFE P, WISNER B (1983), Global Disasters, a Radical Interpretation, In: HEWITT K. (ed.), Interpretation of Calamity: From the Viewpoint of Human Ecology, Boston: Allen & Unwinn, 263–283.
139. SWEET S (1998), The Effect of a Natural Disaster on Social Cohesion: A Longitudinal Study, International Journal of Mass Emergencies and Disasters 16, 321–331.
140. TAPSELL S M, TUNSTALL S M AND WILSON T (2003) Banbury and Kidlington Four Years After the Flood: An Examination of the Long-Term Health Effects of Flooding, Report to the Environment Agency, Flood Hazard Research Centre, Middlesex University, Enfield
141. TAPSELL S M AND TUNSTALL S M (2001) The Health and Social Effects of the June 2000 Flooding in the North East Region. Report to the Environment Agency. Enfield: Flood Hazard Research Centre, Middlesex University
142. TAPSELL S M, TUNSTALL S M, PENNING-ROWSELL E, HANDMER J W (1999) The Health Effects of the 1998 Easter Flooding in Banbury and Kidlington. Report to the Environment Agency, Thames Region. Enfield: Flood Hazard Research Centre, Middlesex University
143. TAPSELL S M, PENNING-ROWSELL E, TUNSTALL S M, WILSON T L (2002), Vulnerability to flooding: health and social dimensions, Philosophical Transactions of the Royal Society London A 360, 1511–1525.
144. TAPSELL S M, TUNSTALL S M, GREEN C, FERNANDEZ-BILBAO A (2005), Indicator set. Internal FLOODsite report (Task 11), Enfield: Flood Hazard Research Centre.
145. TIERNEY K. J., LINDELL M., PERRY R. (2001), Facing the unexpected. Disaster preparedness and response in the United States, Washington: Joseph Henry Press.
146. TUNSTALL S (1992), The flood warning system and flood events of January and February 1990 in Maidenhead and other locations within the Western areas of the NRA Thames Region. Report to the NRA, Thames Region. Enfield, Flood Hazard Research Centre
147. TUNSTALL S, TAPSELL S, GREEN C, FLOYD P & GEORGE C (2006) The Health Effects of flooding: social research results from England and Wales, Journal of Water and Health, 04.3, 365-380
148. TUNSTALL S, TAPSELL S. & FERNANDEZ-BILBAO A (2005) Defra/EA Project 2014: Development of economic appraisal methods for flood management and coastal erosion
document.doc 29/06/07138

FLOODsite Project Report Contract No:GOCE-CT-2004-505420
protection. The “Roadtesting” Project. Objective 13. The damage reducing effects of flood warnings: Results from new data collection. Enfield: Flood Hazard Research Centre, Middlesex University
149. TUNSTALL S M, BOSSMAN-AGGREY P (1988) Waltham Abbey and Thornwood, Essex: An Assessment of the Effects of the Flood of 29th July, 1987 and the Benefits of Flood Alleviation, Flood Hazard Research Centre, Middlesex Polytechnic, Enfield
150. TUNSTALL S M & FORDHAM M (1994) Thames Perception and Attitude Survey: Datchet to Walton Bridge. Final Report to the National Rivers Authority. Enfield: Middlesex University
151. VAN DUIN M J AND BEZUYEN M J (2000) 'Flood evacuation during the floods of 1995 in the Netherlands'. In Parker, D J (Ed) 2000 Floods. London: Routledge
152. WATTS M (1983), On the Poverty of Theory: Natural Hazards Research in Context. In: HEWITT K. (ed.), Interpretation of Calamity: From the Viewpoint of Human Ecology, Boston: Allen & Unwinn, 231–262.
153. WEICHSELGARTNER J (2001), Disaster mitigation: the concept of vulnerability revisited, Disaster Prevention and Management 10, 85–94.
154. WHITE G F (1973), Natural Hazards Research, Reprinted in: CUTTER S. L. (ed., 1994), Environmental Risks and Hazards. Englewood Cliffs, NJ: Prentice Hall, 4–17.
155. WHITE G F (ed., 1974), Natural Hazards: Local, National, Global. New York: Oxford University Press.
156. WISNER B (2004), Assessment of Capability and Vulnerability. In: BANKOFF G., FRERKS G., HILHORST D. (eds.), Mapping Vulnerability: Disasters, Development and People, London: Earthscan, 183–193.
157. WYNNE B (1992), Uncertainty and environmental learning: reconceiving science and policy in the preventive paradigm, Global Environmental Change 2, 111–127.
document.doc 29/06/07139
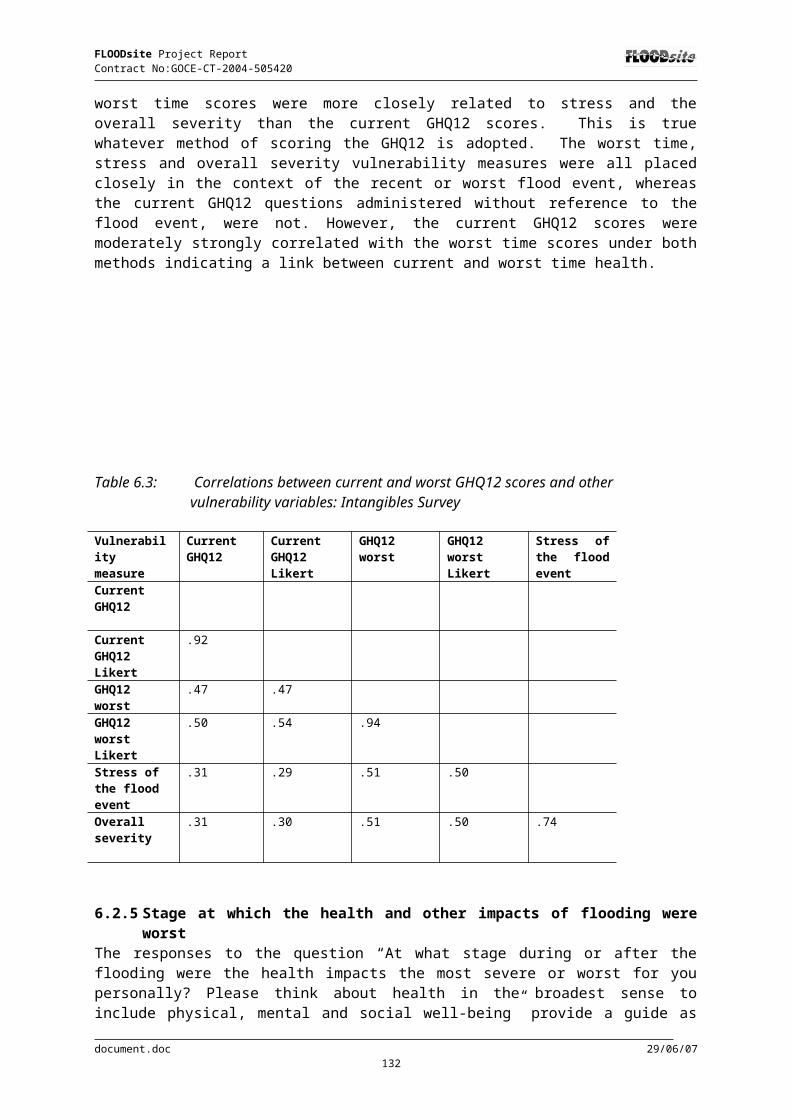
FLOODsite Project Report Contract No:GOCE-CT-2004-505420
Appendix 1
WARNINGS SURVEY PHASE 1EA Region
EA Area
County/AreaMain Locations
River/tidal/Seaflooding
Date of flooding
Target number: residential and non-residential
Interviews Achieved
Residential only
Thames West 98Marlow, Buckinghamshire
R.Thames January 2003
NA NA
Bourne End, R.Thames January 2003
NA NA
Wraysbury, Berkshire R.Thames January 2003
NA NA
Egham, Surrey R.Thames/Meadlake Ditch
January 2003
Staines, Middlesex R.Thames /R.Ash January 2003
NA NA
Chertsey, Surrey R. Thames / Chertsey Bourne
January 2003
North West
20
Kendal, Burnside, Cumbria
R.Kent February 2004
NA
Wales 12Trefriw, Conwy, N.Wales
Afon Conwy February 2004
NA NA
Llanrwst, Denbighshire
Afon Conwy February 2004
NA NA
TOTAL 220 130NA = Data not available
document.doc 29/06/07140

FLOODsite Project Report Contract No:GOCE-CT-2004-505420
WARNINGS SURVEY PHASE 2EA Area County/Area
LocationsM\in river/tidal/Seaflooding
Date of flooding Target number
Interviews Achieved
Anglian Eastern Essex 50 56Bocking, R. Blackwater October 2001 2Witham R.Brain October 2001 15White Colne R.Colne October 2001 4Halstead R.Colne October 2001 5Chappel R.Colne October 2001 4Keldevon R.Blackwater October 2001 26
Central Cambridgeshire 25 25Girton Non-main river October 2001 4Oakington Non-main river October 2001 7Linton Non-main river October 2001 10HuntingdonshireHemingford/St Ives R.Great Ouse January 2003 4
Midlands Upper Severn
50 43
Shrewsbury, Shropshire R.Severn February 2004/02October 2000
17
Ironbridge, Shropshire R.Severn As above 5Bridgnorth, Shropshire R.Severn As above 2Bewdley/Stourport, Worcs
R Severn As above 14
Grimley/Worcester, Worcs.
R.Severn As above 5
North East
Dales 20 18
Tadcaster, N.Yorks R.Wharfe Autumn 2000 5Naburn, Yorks R.Ouse Autumn 2000 4Ripon, N.Yorks R. Ure Autumn 2000 5Knaresborough, N.Yorks R.Nidd Autumn 2000 4
Ridings 25 25Glusburn, N.Yorks Eastburn Brook August 2004 25
North West
North Cumbria 15 15
Grange-over-Sands, Arnside, Haverthwaite, Milnethorpe, Ulverston
Tidal/estuary/sea January/February 2002
11
Kirkby-in-Furness, Sandside, Foxfield,
Tidal/estuary/sea January/February 2002
4
South-west
Cornwall Cornwall 20 14
Flushing Tidal October 2004 5Fowey Tidal October 2004 3Boscastle R. August 2004? 4Helston R. Cober December 2002/
January 20032
Wessex 25 21Iford, Dorset R.Stour November 2002 3Longham, Dorset R.Stour November 2002 1Fordingbridge, Hampshire
R.Avon January 2003 5
Downton, Wiltshire R.Avon January 2003 4Shipton Bellinger, Hampshire
R.Bourne January 2003 8
Southern
Kent Kent 25 24
South Darenth Non- mainriver 2002/3 3Yalding R.Beult 2002/3 3Wateringbury/Nettlestead
R.Medway 2002/3 3
Little Mill/East Peckham R.Bourne/ 2002/3, 2000/1 6
document.doc 29/06/07141

FLOODsite Project Report Contract No:GOCE-CT-2004-505420
R.MedwayBrasted R.Darent 2002/3 3Headcorn R.Beult/R.Sherway 2000/1 6
WARNINGS SURVEY PHASE 2 - CONTINUEDThames North
EastEssex 20 19
Woodford/Ilford R.Roding October 2000 19West 25 18
Oxford, Oxon R.Thames January 2003 6Purley, Nr. Reading, Berks.
R.Thames January 2003 3
Wargrave, Shiplake, Berks
R.Thames January 2003 9
document.doc 29/06/07142

FLOODsite Project Report Contract No:GOCE-CT-2004-505420
INTANGIBLES SURVEY
EA RegionCounty/AreaLocations
River/tidal/sea flooding
Date of flooding
At riskTarget
At riskAchieved
Flooded Target
FloodedAchieved
Anglian Alconbury, Cambridgeshire
Alconbury Brook
26 28 13 15
Hemingford Grey, Cambs.
R.Ouse April 1998 11 10 5 4
Newport Pagnell, Buckinghamshire
R.Ouse April 1998 17 19 9 10
Midlands Evesham, Worcestershire
R.Avon April 1998 21 21 11 11
Hatton, Derbyshire
R.Dove November 2000
40 39 20 19
Leamington Spa, Warwickshire
R.Leam April 1998 104 101 51 55
Melton Mowbray, Leicestershire
R.Eye/Wreake / Soar
April 1998 27 18 14 23
WorcesterWorcestershire
R.Severn November 2000
15 15 7 7
North East Barlby/Selby,N.Yorks
R.Ouse November 2000
48 48 24 24
Gowdall, E.Yorkshire
R.Aire November 2000
32 36 16 13
Malton, N.Yorkshire
R.Derwent March 1999 45 45 23 25
Ponteland , Nortthumberland
R.Pont November 20009
9 9 5 5
South Church, West Auckland, Co. Durham
R. Gaunless June 2000 50 53 25 24
Todmorden,Lancashire
Upper Calder River
June 2000 32 35 16 13
York, RawcliffeN.Yorkshire
R.Ouse November 2000
25 29 14 10
North West
Bollington, Cheshire
R.Dean October 1998
17 16 9 9
Congleton, Cheshire
R.Dane October 1998
7 7 3 2
Kendall, Cumbria Drainage January 1999
15 16 8 7
Macclesfield, Cheshire
Drainage June 1998 23 24 11 11
Southern Five Oak Green, Kent
Non main river
May 2000 18 12 9 15
Lewes, E. Sussex R.Ouse November 2000
161 159 78 80
Ryde, Isle of Wight
Monkton Mead Brook/drainage
December 2001/October 2000
24 17 12 6
Thames Banbury, Oxon R.Cherwell April 1998 37 27 19 30London Colney, Herts
R.Colne November 2000
12 10 6 6
Waltham Abbey, Essex
Cobbins Brook
November 2000
35 30 17 18
Weybridge, Surrey
R.Wey November 2000
18 6 9 19
Woking, Surrey R.Wey November 2000
10 10 5 6
document.doc 29/06/07143

FLOODsite Project Report Contract No:GOCE-CT-2004-505420
INTANGIBLES SURVEY - CONTINUEDWales Newport, Gwent Malpas
BrookOctober 2000
42 52 21 15
Rhydymwyn,Flintshire
Un-classified
November 2000
21 29 11 5
Ruthin, Denbighshire,
Non main river
November 2000
58 62 29 30
document.doc 29/06/07144

FLOODsite Project Report Contract No:GOCE-CT-2004-505420
Appendix 2
GHQ12 Questionnaire - Current
GENERAL HEALTH OVER THE LAST FEW WEEKS
Please read this carefully:
We would like to know how your health has been in general over the past few weeks.Please answer ALL the questions by ticking the box below the answer which you think most applies to you.
Have you recently…
QC1. …been able to concentrate on whatever you’re doing?
Better than usual Same as usual Less than usual Much less than usual
QC2. …lost much sleep over worry?
Not at all No more than usual Rather more than usual Much more than usual
QC3. …felt you were playing a useful part in things?
More so than usual Same as usual Less useful than usual Much less useful
QC4. …felt capable of making decisions about things?
More so than usual Same as usual Less so than usual Much less capable
QC5. …felt constantly under strain?
Not at all No more than usual Rather more than usual Much more than usual
QC6. …felt you couldn’t overcome your difficulties?
Not at all No more than usual Rather more than usual Much more than usual
document.doc 29/06/07145

FLOODsite Project Report Contract No:GOCE-CT-2004-505420
QC7. …been able to enjoy your normal day-to-day activities?
More so than usual Same as usual Less so than usual Much less than usual
QC8. …been able to face up to your problems?
More so than usual Same as usual Less able than usual Much less able
QC9. …been feeling unhappy and depressed?
Not at all No more than usual Rather more than usual Much more than usual
QC10. …been losing confidence in yourself?
Not at all No more than usual Rather more than usual Much more than usual
QC11. …been thinking of your self as a worthless person?
Not at all No more than usual Rather more than usual Much more than usual
QC12. …been feeling reasonably happy, all things considered?
More so than usual Same as usual Less so than usual Much less than usual
THANK YOU. PLEASE INFORM THE INTERVIEWER THAT YOU HAVE FINISHED.
General Health Questionnaire (GHQ-12) © David Goldberg, 1978
document.doc 29/06/07146

FLOODsite Project Report Contract No:GOCE-CT-2004-505420
GHQ12 Questionnaire - Worst
GENERAL HEALTH WHEN THE HEALTH EFFECTS FROM THE FLOODING WERE AT THEIR MOST SEVERE
Please read this carefully:
We would like you to think back to how your health was when the health effects from the flooding were at their most severe. Please answer ALL the questions by ticking the box below the answer which you think most applies to you.
Did you find you…
QC1. …were able to concentrate on whatever you’re doing?
Better than usual Same as usual Less than usual Much less than usual
QC2. …lost much sleep over worry?
Not at all No more than usual Rather more than usual Much more than usual
QC3. …felt you were playing a useful part in things?
More so than usual Same as usual Less useful than usual Much less useful
QC4. …felt capable of making decisions about things?
More so than usual Same as usual Less so than usual Much less capable
QC5. …felt constantly under strain?
Not at all No more than usual Rather more than usual Much more than usual
QC6. …felt you couldn’t overcome your difficulties?
Not at all No more than usual Rather more than usual Much more than usual
document.doc 29/06/07147

FLOODsite Project Report Contract No:GOCE-CT-2004-505420
QC7. …were able to enjoy your normal day-to-day activities?
More so than usual Same as usual Less so than usual Much less than usual
QC8. …were able to face up to your problems?
More so than usual Same as usual Less able than usual Much less able
QC9. …were feeling unhappy and depressed?
Not at all No more than usual Rather more than usual Much more than usual
QC10. …were losing confidence in yourself?
Not at all No more than usual Rather more than usual Much more than usual
QC11. …were thinking of your self as a worthless person?
Not at all No more than usual Rather more than usual Much more than usual
QC12. …been feeling reasonably happy, all things considered?
More so than usual Same as usual Less so than usual Much less than usual
THANK YOU. PLEASE INFORM THE INTERVIEWER THAT YOU HAVE FINISHED.
General Health Questionnaire (GHQ-12) © David Goldberg, 1978
document.doc 29/06/07148