Flooding in the Southern Midwestern United States, … · streamgages had AEPs in the range from...
46
Flooding in the Southern Midwestern United States, April–May 2017 Open-File Report 2018–1004 U.S. Department of the Interior U.S. Geological Survey
Transcript of Flooding in the Southern Midwestern United States, … · streamgages had AEPs in the range from...
Flooding in the Southern Midwestern United States, April–May 2017
Open-File Report 2018–1004
U.S. Department of the InteriorU.S. Geological Survey
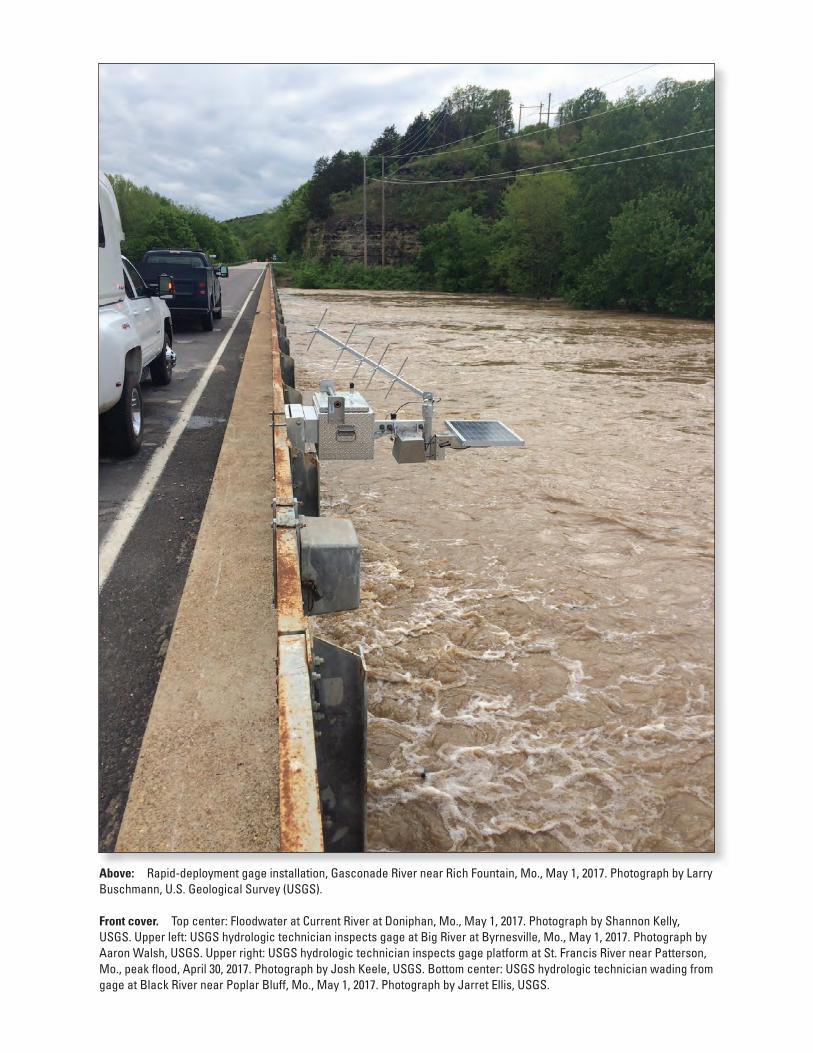
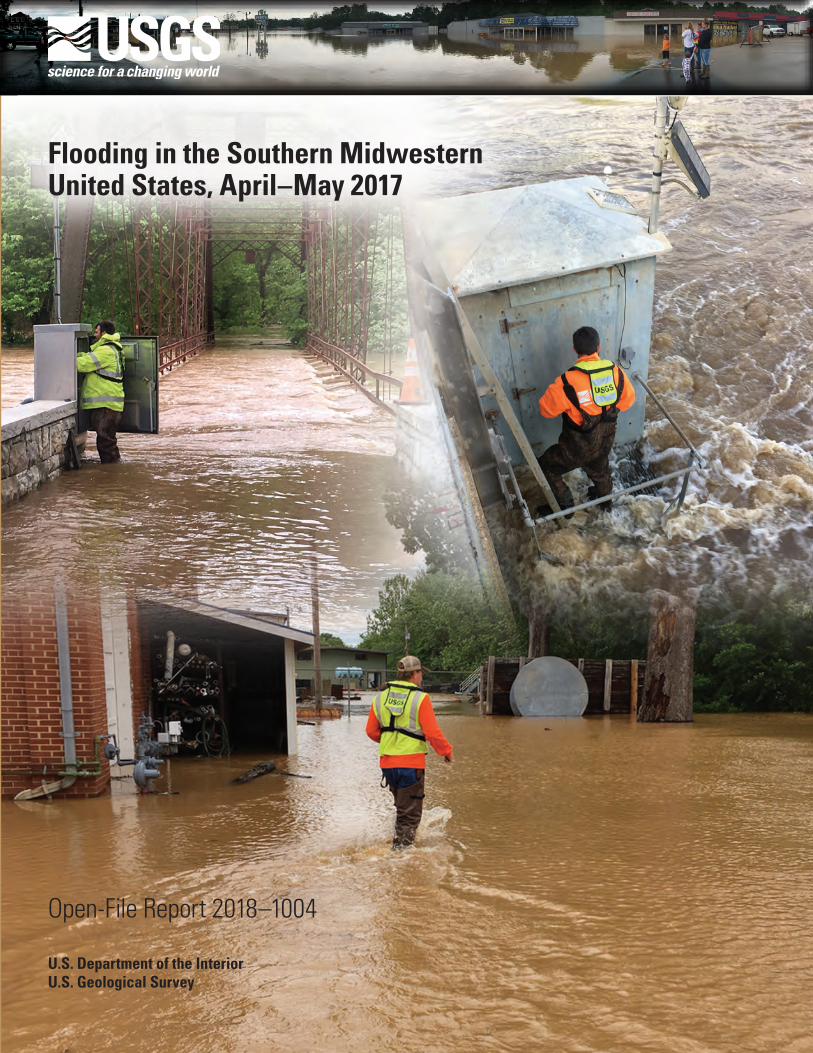
Above: Rapid-deployment gage installation, Gasconade River near Rich Fountain, Mo., May 1, 2017. Photograph by Larry Buschmann, U.S. Geological Survey (USGS).
Front cover. Top center: Floodwater at Current River at Doniphan, Mo., May 1, 2017. Photograph by Shannon Kelly, USGS. Upper left: USGS hydrologic technician inspects gage at Big River at Byrnesville, Mo., May 1, 2017. Photograph by Aaron Walsh, USGS. Upper right: USGS hydrologic technician inspects gage platform at St. Francis River near Patterson, Mo., peak flood, April 30, 2017. Photograph by Josh Keele, USGS. Bottom center: USGS hydrologic technician wading from gage at Black River near Poplar Bluff, Mo., May 1, 2017. Photograph by Jarret Ellis, USGS.
Flooding in the Southern Midwestern United States, April–May 2017
By David C. Heimann, Robert R. Holmes, Jr., and Thomas E. Harris
Open-File Report 2018–1004
U.S. Department of the InteriorU.S. Geological Survey

U.S. Department of the InteriorRYAN K. ZINKE, Secretary
U.S. Geological SurveyWilliam H. Werkheiser, Deputy Director exercising the authority of the Director
U.S. Geological Survey, Reston, Virginia: 2018
For more information on the USGS—the Federal source for science about the Earth, its natural and living resources, natural hazards, and the environment—visit https://www.usgs.gov or call 1–888–ASK–USGS.
For an overview of USGS information products, including maps, imagery, and publications, visit https://store.usgs.gov.
Any use of trade, firm, or product names is for descriptive purposes only and does not imply endorsement by the U.S. Government.
Although this information product, for the most part, is in the public domain, it also may contain copyrighted materials as noted in the text. Permission to reproduce copyrighted items must be secured from the copyright owner.
Suggested citation:Heimann, D.C., Holmes, R.R., Jr., and Harris, T.E., 2018, Flooding in the southern Midwestern United States, April–May 2017: U.S. Geological Survey Open-File Report 2018–1004, 36 p., https://doi.org/10.3133/ofr20181004.
ISSN 2331-1258 (online)
iii
ContentsAbstract ...........................................................................................................................................................1Introduction.....................................................................................................................................................1April–May 2017 Flooding—Antecedent Conditions, Chronology, and Magnitude .............................1
Antecedent Streamflow and Weather Conditions for the 2017 Southern Midwest Flooding ....................................................................................................................3
Flood Chronology ..................................................................................................................................3Magnitude of April–May 2017 Flooding ..........................................................................................16
April–May 2017 Flooding—Comparison with Historic Floods ..............................................................17April–May 2017 Flooding—Annual Exceedance Probability ................................................................17Temporal Changes in Annual Peak Streamflows ...................................................................................18Summary........................................................................................................................................................31References Cited..........................................................................................................................................31Glossary .........................................................................................................................................................35
Figures
1. Map showing the Midwestern United States and flood study area associated with the April–May 2017 flood ....................................................................................................2
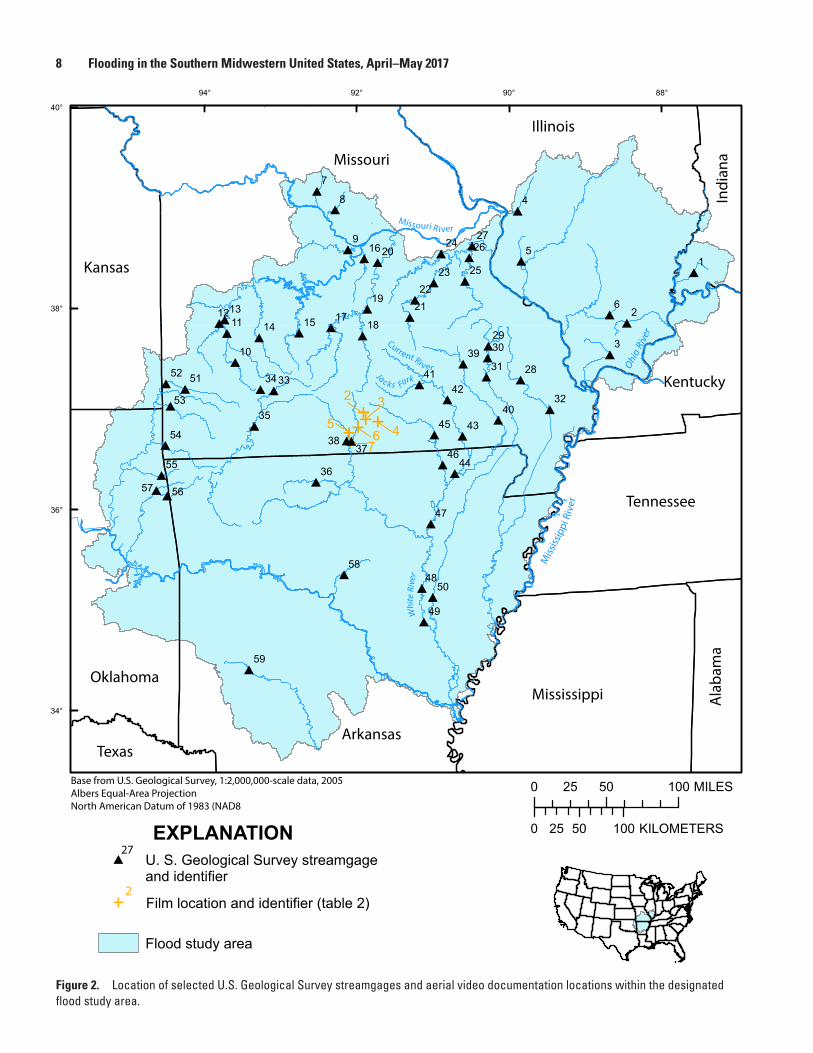
2. Map showing location of selected U.S. Geological Survey streamgages and aerial video documentation locations within the designated flood study area .................8
3. Maps showing streamflow conditions at selected U.S. Geological Survey streamgages in the study area before the April–May 2017 flooding including January, February, March, and April of 2017 ..........................................................................9
4. Maps showing monthly precipitation conditions in the United States for January–April 2017, as a percent of normal ..........................................................................11
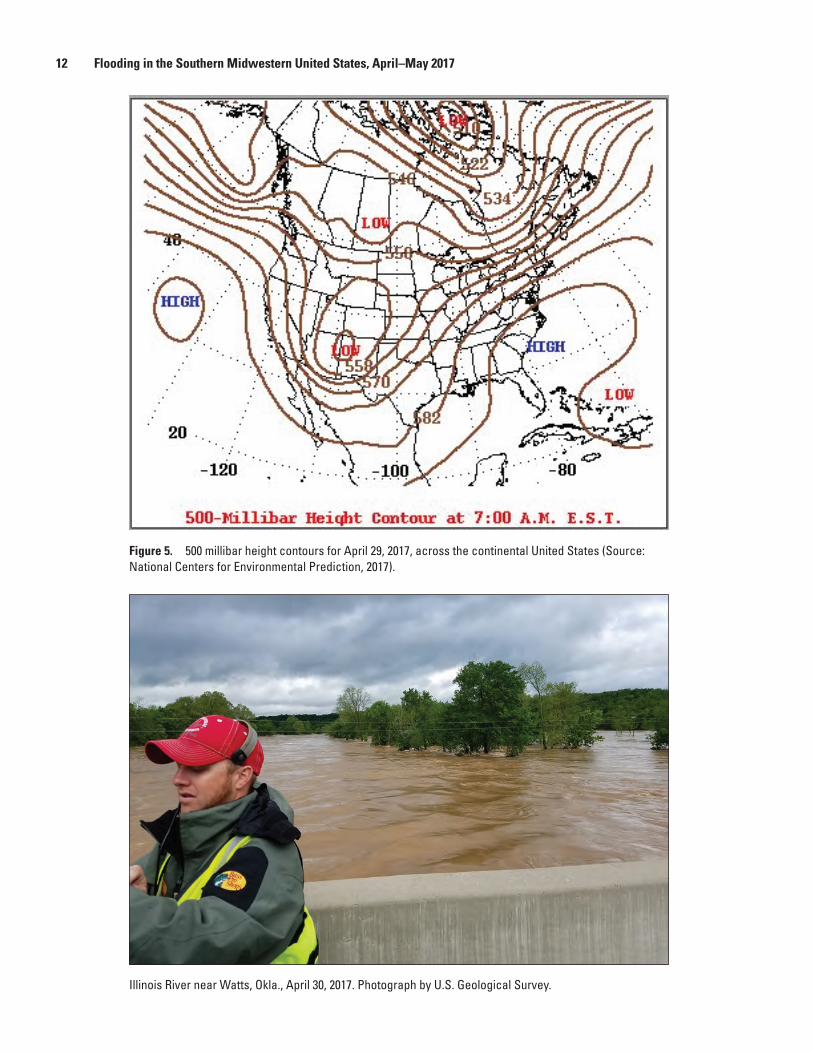
5. Map showing the 500 millibar height contours for April 29, 2017, across the continental United States ..........................................................................................................12
6. Maps showing daily surface weather maps at 7:00 AM Eastern Standard Time from April 29 to 30, 2017 .............................................................................................................13
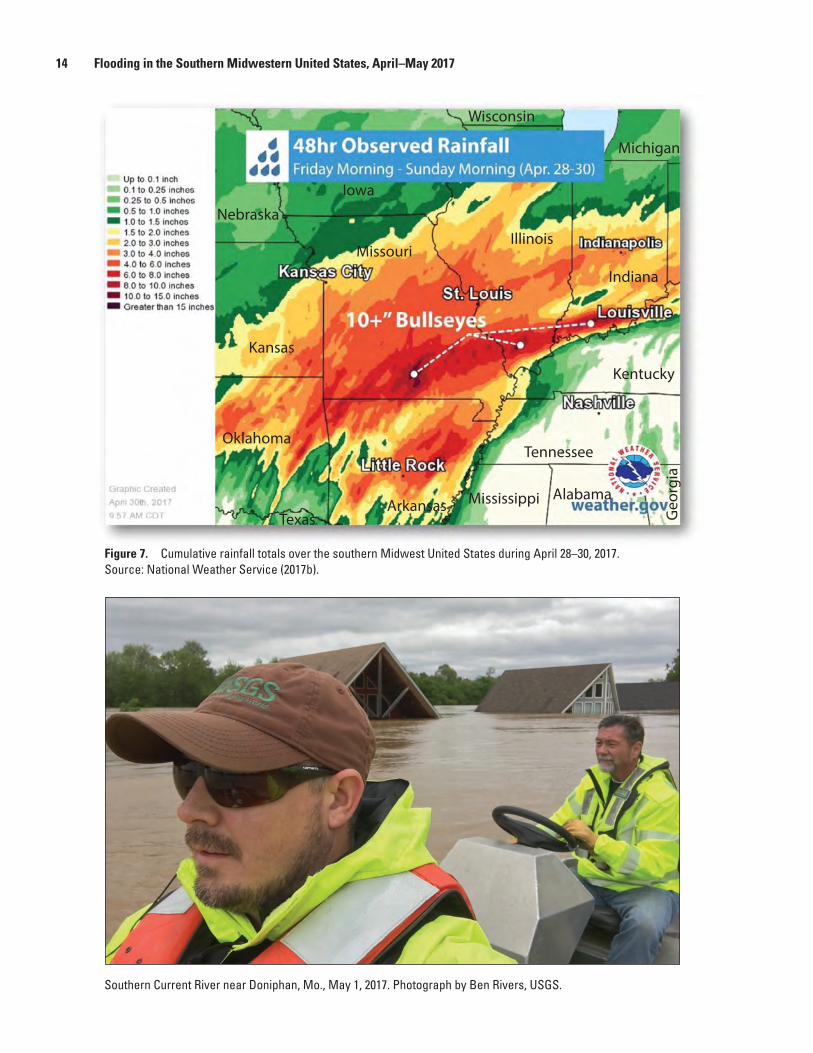
7. Map showing cumulative rainfall totals over the southern Midwest United States during April 28–30, 2017 .............................................................................................................14
8. Streamflow hydrographs and precipitation totals and distributions for selected U.S. Geological Survey streamgages and precipitation stations within the study area ....................................................................................................................................15
9. Graph showing annual number of peak-of-record streamflows and number of U.S. Geological Survey streamgages in the study area with peak streamflow record ......................................................................................................................17
10. Map showing the spatial distribution of the magnitude of annual exceedance probabilities of peak streamflows at 59 U.S. Geological Survey streamgages for the April–May 2017 flood .....................................................................................................26
11. Maps showing percentage changes in median annual peak streamflow values for selected U.S. Geological Survey streamgages for 1930–2017, 1956–2017, 1975–2017, and 1989–2017 .........................................................................................................27
12. Maps showing the percentage change in the median annual precipitation by climate division within the study area for 1930–2016, 1956–2016, 1975–2016, and 1989–2016 .............................................................................................................................29
iv
13. Graphs showing change in frequency of daily high intensity (greater than 2–3 in.) precipitation from the long-term (1900–2014) average, by state ........................................30
Tables
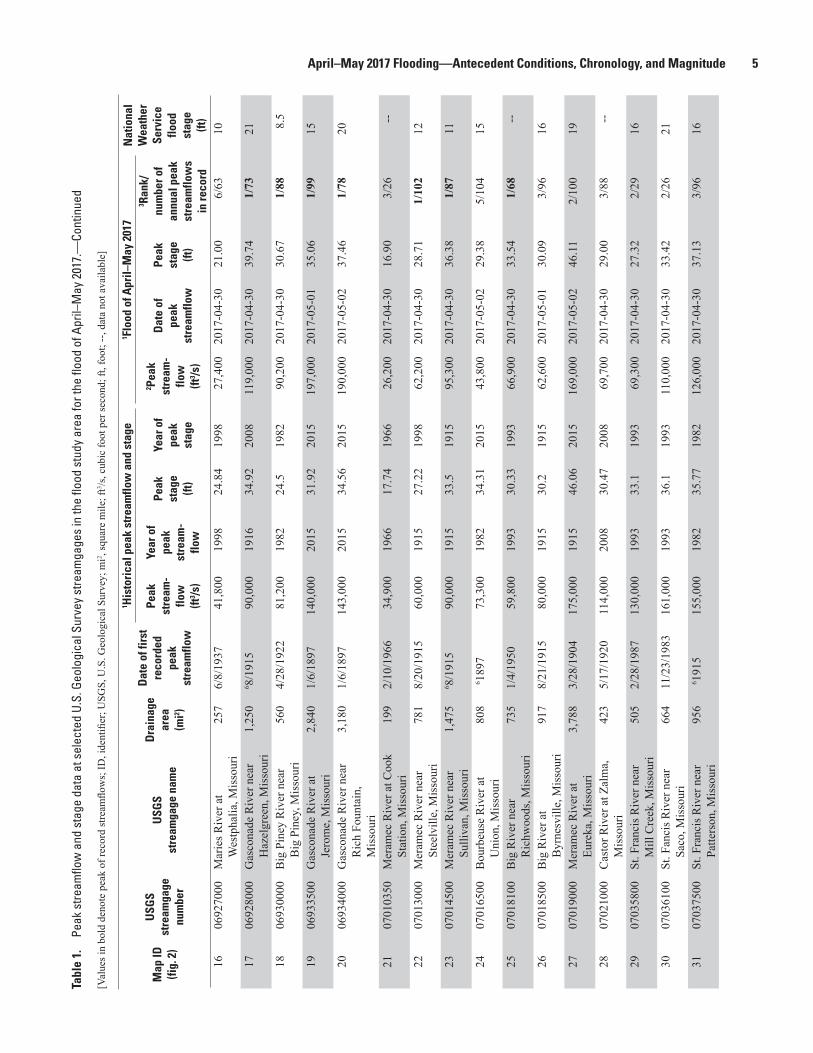
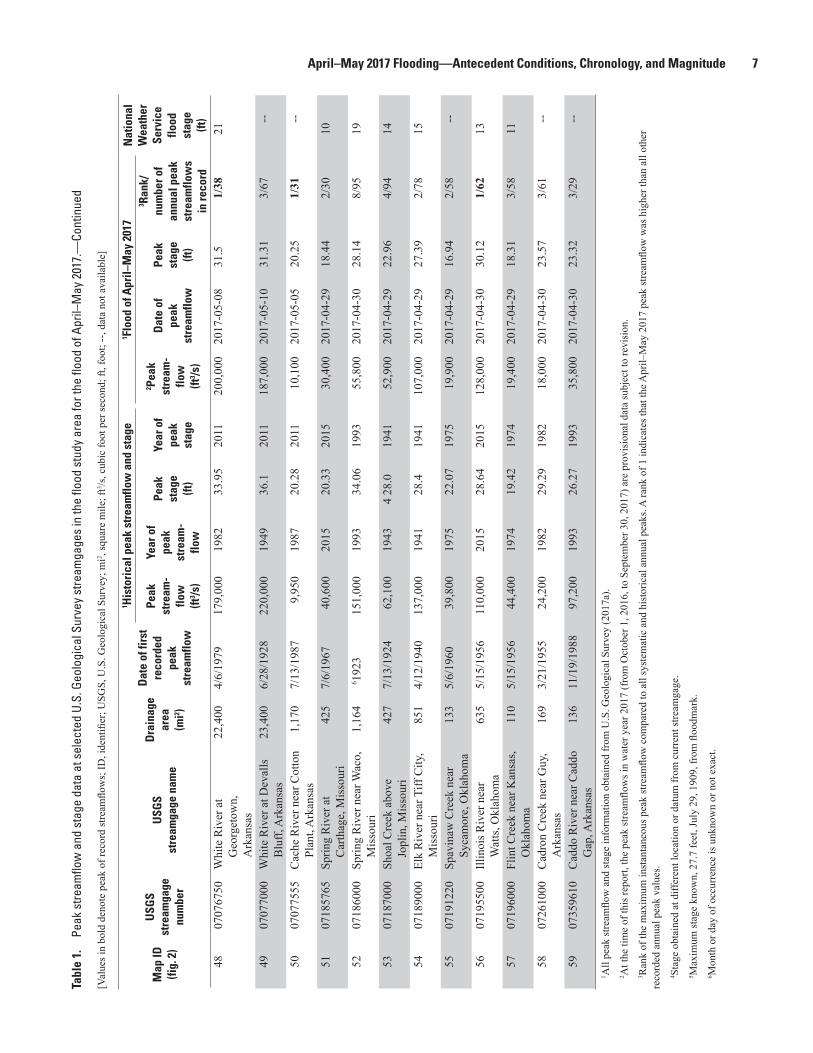
1. Peak streamflow and stage data at selected U.S. Geological Survey streamgages in the flood study area for the flood of April–May 2017 .........................................................4
2. Date, times, and locations of aerial video footage documenting the effects of the April–May 2017 flood at selected locations in south-central Missouri .............................16
3. Estimated annual exceedance probability of the 2017 flood peaks and weighted peak streamflow estimates for selected flood quantiles at 59 U.S. Geological Survey streamgages included in this study ...........................................................................21
Films
1. Daily distribution of streamflow conditions in the study area, April 27–May 10, 2017 ...................................................................................................................3
2. Spring Creek at Highway AP bridge near Willow Springs, Missouri, April 30, 2017, at 10:30 a.m .........................................................................................................16
3. North Fork River and Spring Creek at Highway 14, Douglas County, Missouri, April 30, 2017, at 12:09 p.m .......................................................................................16
4. North Fork River at Highway CC, Ozark County, Missouri, April 30, 2017, at 12:37 p.m ..................................................................................................................................16
5. Bryant Creek at Highway 181, Ozark County, Missouri, April 30, 2017, at 13:06 ..........................................................................................................................................16
6. North Fork River at Highway PP near Tecumseh, Missouri, Ozark County, April 30, 2017, at 13:40 ................................................................................................................16
7. Dry Creek at Highway AP near Willow Springs, Missouri, April 30, 2017, at 15:29 ..........................................................................................................................................16
v
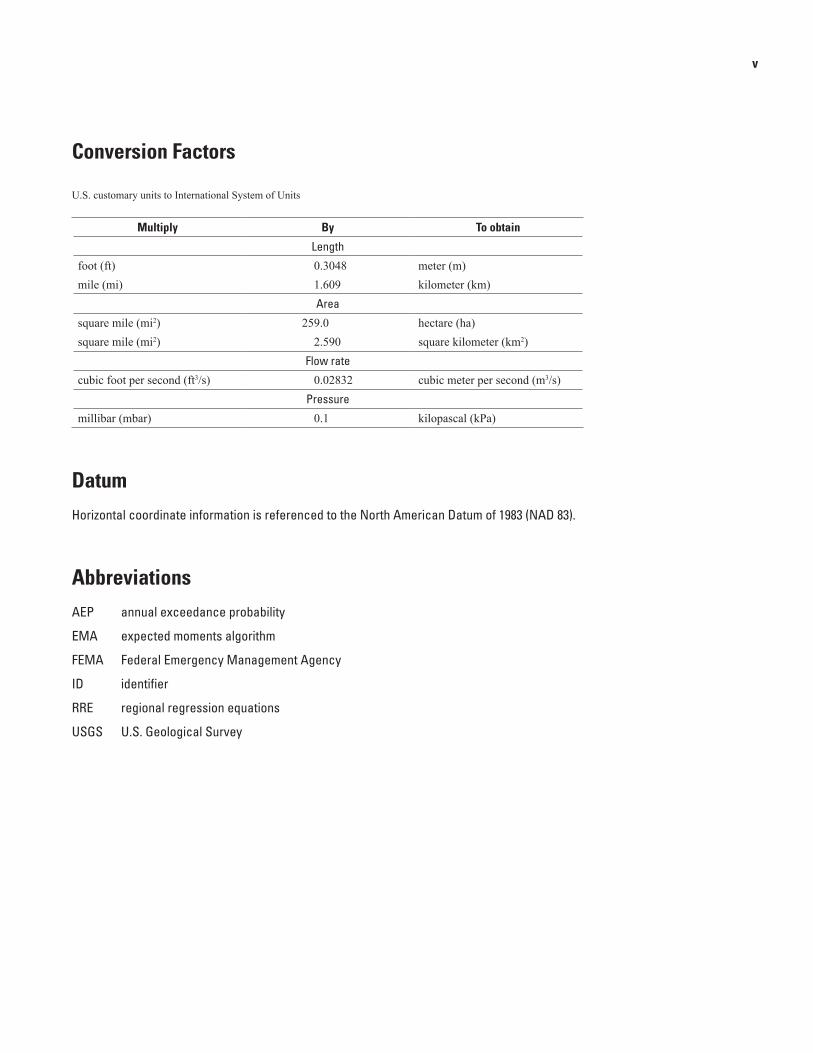
Conversion Factors
U.S. customary units to International System of Units
Multiply By To obtain
Length
foot (ft) 0.3048 meter (m)mile (mi) 1.609 kilometer (km)
Area
square mile (mi2) 259.0 hectare (ha)square mile (mi2) 2.590 square kilometer (km2)
Flow rate
cubic foot per second (ft3/s) 0.02832 cubic meter per second (m3/s)Pressure
millibar (mbar) 0.1 kilopascal (kPa)
DatumHorizontal coordinate information is referenced to the North American Datum of 1983 (NAD 83).
AbbreviationsAEP annual exceedance probability
EMA expected moments algorithm
FEMA Federal Emergency Management Agency
ID identifier
RRE regional regression equations
USGS U.S. Geological Survey
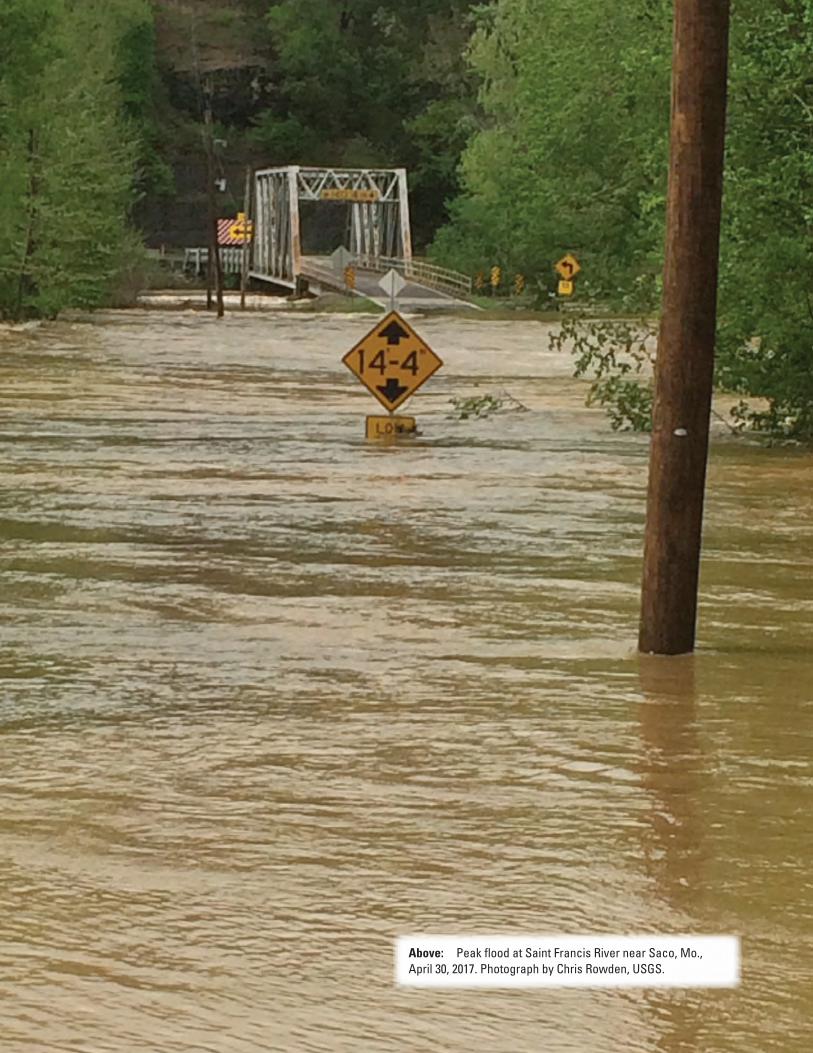
Above: Peak flood at Saint Francis River near Saco, Mo., April 30, 2017. Photograph by Chris Rowden, USGS.

Flooding in the Southern Midwestern United States, April–May 2017
By David C. Heimann, Robert R. Holmes, Jr., and Thomas E. Harris
AbstractExcessive rainfall resulted in flooding on numerous rivers
throughout the southern Midwestern United States (southern Midwest) in late April and early May of 2017. The heaviest rainfall, between April 28 and 30, resulted in extensive flood-ing from eastern Oklahoma to southern Indiana including parts of Missouri, Arkansas, and Illinois.
Peak-of-record streamflows were set at 21 U.S. Geologi-cal Survey (USGS) streamgages in the southern Midwest during the resulting April–May 2017 flooding and each of the five States included in the study area had at least one streamgage with a peak of record during the flood. The annual exceedance probability (AEP) estimates for the April–May 2017 peak streamflows indicate that peaks at 5 USGS streamgages had AEPs of 0.2 percent or less (500-year recur-rence interval or greater), and peak streamflows at 15 USGS streamgages had AEPs in the range from greater than 0.2 to 1 percent (500- to 100-year recurrence intervals).
Examination of the magnitude of the temporal changes in median annual peak streamflows indicated positive increases, in general, throughout the study area for each of the 1930–2017, 1956–2017, 1975–2017, and 1989–2017 analysis periods. The median increase in peak streamflows was great-est in 1975–2017 and 1989–2017 with maximum increases of 8 to 10 percent per year. No stations in the 1975–2017 or 1989–2017 analysis period had median negative changes in peak streamflows.
IntroductionExcessive rainfall resulted in flooding on numerous
rivers throughout the southern Midwestern United States (hereafter referred to as the southern Midwest) in late April and early May of 2017 (fig. 1). Tropical moisture lifted over a stalled frontal system and caused heavy rains from Texas to Ohio between April 28 and May 10 resulting in extensive flooding from eastern Oklahoma to southern Indiana includ-ing parts of Missouri, Arkansas, and Illinois. The flooding resulted in 12 deaths, 7 in Arkansas and 5 in Missouri (Cable News Network, 2017). A total of 84 counties (53 in Missouri
[Missouri Department of Public Safety, State Emergency Management Agency, 2017], 18 in Oklahoma [Federal Emergency Management Agency (FEMA), 2017b], and 13 in Arkansas [FEMA, 2017a]) were declared Federal disaster areas. In Missouri alone, the flooding resulted in destruc-tion or damage to more than 1,200 homes and caused at least $58 million in damage to roads, bridges, and other public infrastructure (Office of Missouri Governor, 2017).
The purpose of this report is to document the flood peaks (stage and streamflow) of selected U.S. Geological Survey (USGS) streamgages within the southern Midwest that were affected by the April–May 2017 floods, placing them in hydrologic context at these selected locations in relation to timing, rank, flood frequency, temporal trends, and histori-cal flooding. The flood peak data are reported for 59 USGS selected streamgages in the southern Midwest including parts of Arkansas, Illinois, Indiana, Missouri, and Oklahoma having more than 25 years of peak streamflow record and, generally having 2017 peak streamflows that were ranked in the top 3 of the annual peaks of record. Flood frequency characteristics for selected stations are provided through the determination of the annual exceedance probabilities (AEPs) of the 2017 flood peaks for the selected stations. The AEP is the probability, or chance, of a flood of a given streamflow magnitude being equaled or exceeded in any given year. Documenting the flood peaks and AEPs will help put the 2017 floods in historical context aiding public and private entities in flood prepared-ness, protection, and control. The determination of trends in annual streamflow peaks will provide insight into potential changes in the nature of flooding with time and help further inform agencies involved with flood mitigation efforts.
April–May 2017 Flooding—Antecedent Conditions, Chronology, and Magnitude
The 2017 flooding in the southern Midwest was wide-spread in that it included parts of Arkansas, Illinois, Indiana, Missouri, and Oklahoma (fig. 1). The April–May 2017 flooding primarily occurred in small basins of less than about 1,000 square miles (mi2) but included stations with drain-age areas as large as 23,400 mi2 (table 1). Streamflow peaks

2 Flooding in the Southern Midwestern United States, April–May 2017
Figure 1. The Midwestern United States and flood study area associated with the April–May 2017 flood.
Mississippi Riv e r
Arkansas River
North Dakota
South Dakota
Minnesota
Wisconsin
Michigan
Nebraska
Kansas
Oklahoma
Arkansas
Tennessee
Kentucky
OhioIndianaIllinois
Iowa
Joplin
St. Louis
Georgetown
Willow Springs
Springfield
Wadesville
Missouri
Tecumseh
DeValls Bluff
Cotton Plant
Doniphan
Pleasant View
EminenceVan Buren
Caddo Gap
95° 80°85°90°100°105°
45°
40°
35°
EXPLANATION
Flood study area
Midwestern United States
0 150 30075 MILES
0 150 30075 KILOMETERS
Base from U.S. Geological Survey, 1:2,000,000-scale data, 2005Albers Equal-Area ProjectionNorth American Datum of 1983 (NAD83)
Missouri River
April–May 2017 Flooding—Antecedent Conditions, Chronology, and Magnitude 3
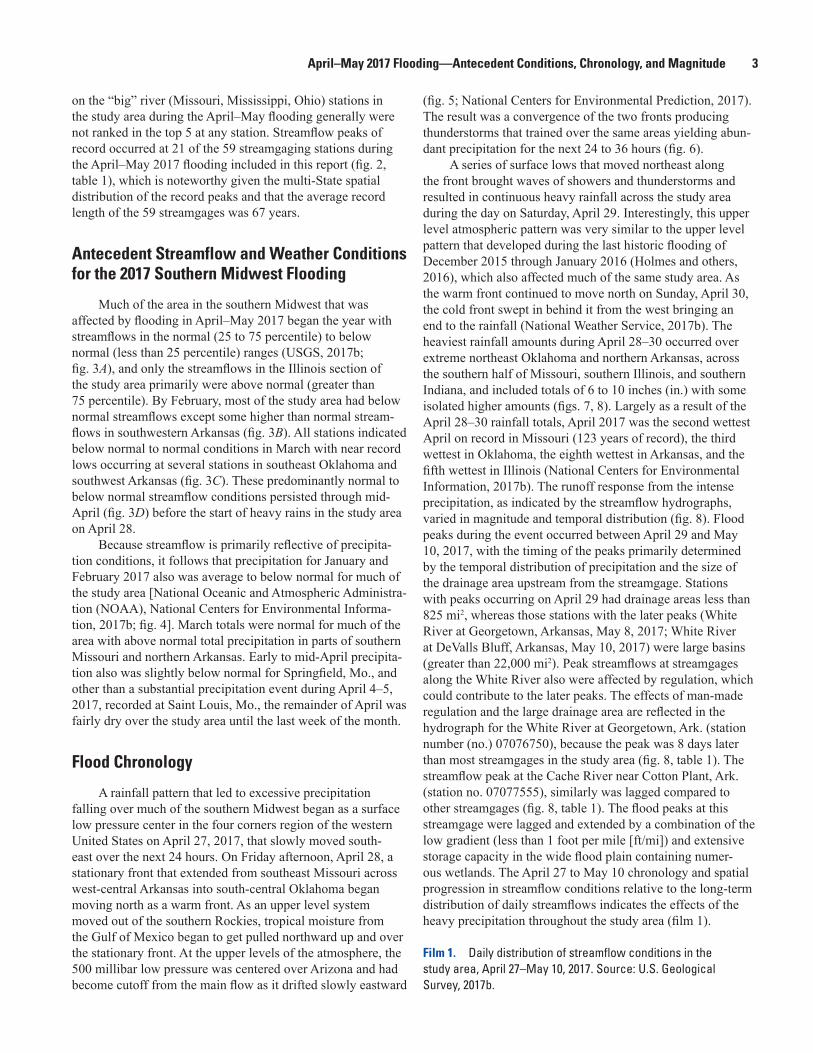
on the “big” river (Missouri, Mississippi, Ohio) stations in the study area during the April–May flooding generally were not ranked in the top 5 at any station. Streamflow peaks of record occurred at 21 of the 59 streamgaging stations during the April–May 2017 flooding included in this report (fig. 2, table 1), which is noteworthy given the multi-State spatial distribution of the record peaks and that the average record length of the 59 streamgages was 67 years.
Antecedent Streamflow and Weather Conditions for the 2017 Southern Midwest Flooding
Much of the area in the southern Midwest that was affected by flooding in April–May 2017 began the year with streamflows in the normal (25 to 75 percentile) to below normal (less than 25 percentile) ranges (USGS, 2017b; fig. 3A), and only the streamflows in the Illinois section of the study area primarily were above normal (greater than 75 percentile). By February, most of the study area had below normal streamflows except some higher than normal stream-flows in southwestern Arkansas (fig. 3B). All stations indicated below normal to normal conditions in March with near record lows occurring at several stations in southeast Oklahoma and southwest Arkansas (fig. 3C). These predominantly normal to below normal streamflow conditions persisted through mid-April (fig. 3D) before the start of heavy rains in the study area on April 28.
Because streamflow is primarily reflective of precipita-tion conditions, it follows that precipitation for January and February 2017 also was average to below normal for much of the study area [National Oceanic and Atmospheric Administra-tion (NOAA), National Centers for Environmental Informa-tion, 2017b; fig. 4]. March totals were normal for much of the area with above normal total precipitation in parts of southern Missouri and northern Arkansas. Early to mid-April precipita-tion also was slightly below normal for Springfield, Mo., and other than a substantial precipitation event during April 4–5, 2017, recorded at Saint Louis, Mo., the remainder of April was fairly dry over the study area until the last week of the month.
Flood Chronology
A rainfall pattern that led to excessive precipitation falling over much of the southern Midwest began as a surface low pressure center in the four corners region of the western United States on April 27, 2017, that slowly moved south-east over the next 24 hours. On Friday afternoon, April 28, a stationary front that extended from southeast Missouri across west-central Arkansas into south-central Oklahoma began moving north as a warm front. As an upper level system moved out of the southern Rockies, tropical moisture from the Gulf of Mexico began to get pulled northward up and over the stationary front. At the upper levels of the atmosphere, the 500 millibar low pressure was centered over Arizona and had become cutoff from the main flow as it drifted slowly eastward
(fig. 5; National Centers for Environmental Prediction, 2017). The result was a convergence of the two fronts producing thunderstorms that trained over the same areas yielding abun-dant precipitation for the next 24 to 36 hours (fig. 6).
A series of surface lows that moved northeast along the front brought waves of showers and thunderstorms and resulted in continuous heavy rainfall across the study area during the day on Saturday, April 29. Interestingly, this upper level atmospheric pattern was very similar to the upper level pattern that developed during the last historic flooding of December 2015 through January 2016 (Holmes and others, 2016), which also affected much of the same study area. As the warm front continued to move north on Sunday, April 30, the cold front swept in behind it from the west bringing an end to the rainfall (National Weather Service, 2017b). The heaviest rainfall amounts during April 28–30 occurred over extreme northeast Oklahoma and northern Arkansas, across the southern half of Missouri, southern Illinois, and southern Indiana, and included totals of 6 to 10 inches (in.) with some isolated higher amounts (figs. 7, 8). Largely as a result of the April 28–30 rainfall totals, April 2017 was the second wettest April on record in Missouri (123 years of record), the third wettest in Oklahoma, the eighth wettest in Arkansas, and the fifth wettest in Illinois (National Centers for Environmental Information, 2017b). The runoff response from the intense precipitation, as indicated by the streamflow hydrographs, varied in magnitude and temporal distribution (fig. 8). Flood peaks during the event occurred between April 29 and May 10, 2017, with the timing of the peaks primarily determined by the temporal distribution of precipitation and the size of the drainage area upstream from the streamgage. Stations with peaks occurring on April 29 had drainage areas less than 825 mi2, whereas those stations with the later peaks (White River at Georgetown, Arkansas, May 8, 2017; White River at DeValls Bluff, Arkansas, May 10, 2017) were large basins (greater than 22,000 mi2). Peak streamflows at streamgages along the White River also were affected by regulation, which could contribute to the later peaks. The effects of man-made regulation and the large drainage area are reflected in the hydrograph for the White River at Georgetown, Ark. (station number (no.) 07076750), because the peak was 8 days later than most streamgages in the study area (fig. 8, table 1). The streamflow peak at the Cache River near Cotton Plant, Ark. (station no. 07077555), similarly was lagged compared to other streamgages (fig. 8, table 1). The flood peaks at this streamgage were lagged and extended by a combination of the low gradient (less than 1 foot per mile [ft/mi]) and extensive storage capacity in the wide flood plain containing numer-ous wetlands. The April 27 to May 10 chronology and spatial progression in streamflow conditions relative to the long-term distribution of daily streamflows indicates the effects of the heavy precipitation throughout the study area (film 1).
Film 1. Daily distribution of streamflow conditions in the study area, April 27–May 10, 2017. Source: U.S. Geological Survey, 2017b.

4 Flooding in the Southern Midwestern United States, April–May 2017Ta
ble
1.
Peak
stre
amflo
w a
nd s
tage
dat
a at
sel
ecte
d U.
S. G
eolo
gica
l Sur
vey
stre
amga
ges
in th
e flo
od s
tudy
are
a fo
r the
floo
d of
Apr
il–M
ay 2
017.
[Val
ues i
n bo
ld d
enot
e pe
ak o
f rec
ord
stre
amflo
ws;
ID, i
dent
ifier
; USG
S, U
.S. G
eolo
gica
l Sur
vey;
mi2 ,
squa
re m
ile; f
t3 /s, c
ubic
foot
per
seco
nd; f
t, fo
ot; -
-, da
ta n
ot a
vaila
ble]
Map
ID
(fig.
2)
USG
S st
ream
gage
nu
mbe
r
USG
S
stre
amga
ge n
ame
Dra
inag
e ar
ea
(mi2 )
Dat
e of
firs
t re
cord
ed
peak
st
ream
flow
1 His
tori
cal p
eak
stre
amflo
w a
nd s
tage
1 Floo
d of
Apr
il–M
ay 2
017
Nat
iona
l W
eath
er
Serv
ice
flood
st
age
(ft
)
Peak
st
ream
-flo
w(ft
3 /s)
Year
of
peak
st
ream
-flo
w
Peak
st
age
(ft
)
Year
of
peak
st
age
2 Peak
st
ream
-flo
w(ft
3 /s)
Dat
e of
pe
ak
stre
amflo
w
Peak
st
age
(ft
)
3 Rank
/nu
mbe
r of
annu
al p
eak
stre
amflo
ws
in re
cord
103
3785
50B
ig C
reek
nea
r W
ades
ville
, Ind
iana
104
5/18
/196
617
,700
2013
21.0
620
1319
,000
2017
-04-
2921
.23
1/52
--
203
3821
00So
uth
Fork
Sal
ine
Riv
er
near
Car
rier M
ills,
Illin
ois
147
4/28
/196
629
,500
2008
18.4
120
0812
,200
2017
-04-
3017
.14
2/52
--
303
6120
00C
ache
Riv
er a
t For
man
, Ill
inoi
s24
42/
3/19
2320
,400
2008
4 42.
2919
3511
,200
2017
-05-
0236
.55
3/95
--
405
5879
00C
ahok
ia C
reek
at
Edw
ards
ville
, Illi
nois
212
9/17
/196
916
,100
2015
27.1
720
159,
090
2017
-05-
0123
.08
3/49
--
505
5952
00R
ichl
and
Cre
ek n
ear
Hec
kler
, Illi
nois
129
5/1/
1970
23,4
0019
9644
.419
9616
,000
2017
-04-
3043
.06
3/48
--
605
5975
00C
rab
Orc
hard
Cre
ek
near
Mar
ion,
Illin
ois
31.7
4/13
/195
210
,000
2008
13.7
420
0810
,300
2017
-04-
2913
.84
1/66
--
706
9095
00M
onite
au C
reek
nea
r Fa
yette
, Mis
sour
i75
.13/
6/19
4813
,700
1973
22.2
319
734,
010
2017
-04-
3019
.71
15/6
016
806
9102
30H
inks
on C
reek
at
Col
umbi
a, M
isso
uri
69.8
5/30
/196
714
,200
2009
21.8
820
099,
300
2017
-04-
2919
.21
6/31
15
906
9107
50M
orea
u R
iver
nea
r Je
ffers
on C
ity,
Mis
sour
i
561
6/7/
1949
33,0
0019
8533
.52
2015
32,9
0020
17-0
5-01
33.5
72/
5817
1006
9184
40Sa
c R
iver
nea
r D
adev
ille,
Mis
sour
i25
74/
4/19
6536
,100
1993
27.5
619
9318
,400
2017
-04-
3021
.85
4/53
--
1106
9190
20Sa
c R
iver
at H
ighw
ay
J bel
ow S
tock
ton,
M
isso
uri
1,29
23/
10/1
974
13,7
0020
1523
.86
2015
11,4
0020
17-0
4-30
22.3
64/
44--
1206
9195
00C
edar
Cre
ek n
ear
Plea
sant
Vie
w,
Mis
sour
i
420
6/10
/192
337
,000
1958
5 27.
719
0921
,000
2017
-04-
3024
.81
10/7
420
1306
9199
00Sa
c R
iver
nea
r C
aplin
ger M
ills,
Mis
sour
i
1,81
011
/4/1
974
61,5
0019
9430
.95
1994
33,3
0020
17-0
4-30
28.3
96/
4316
1406
9210
70Po
mm
e de
Ter
re R
iver
ne
ar P
olk,
Mis
sour
i27
61/
30/1
969
38,2
0020
1527
.81
2015
27,6
0020
17-0
4-30
24.6
83/
49--
1506
9235
00B
enne
tt Sp
ring
at
Ben
nett
Sprin
gs,
Mis
sour
i
100
5/6/
1929
12,6
0019
9010
.55
2015
4,01
020
17-0
4-30
7.46
7/54
--
April–May 2017 Flooding—Antecedent Conditions, Chronology, and Magnitude 5Ta
ble
1.
Peak
stre
amflo
w a
nd s
tage
dat
a at
sel
ecte
d U.
S. G
eolo
gica
l Sur
vey
stre
amga
ges
in th
e flo
od s
tudy
are
a fo
r the
floo
d of
Apr
il–M
ay 2
017.
—Co
ntin
ued
[Val
ues i
n bo
ld d
enot
e pe
ak o
f rec
ord
stre
amflo
ws;
ID, i
dent
ifier
; USG
S, U
.S. G
eolo
gica
l Sur
vey;
mi2 ,
squa
re m
ile; f
t3 /s, c
ubic
foot
per
seco
nd; f
t, fo
ot; -
-, da
ta n
ot a
vaila
ble]
Map
ID
(fig.
2)
USG
S st
ream
gage
nu
mbe
r
USG
S
stre
amga
ge n
ame
Dra
inag
e ar
ea
(mi2 )
Dat
e of
firs
t re
cord
ed
peak
st
ream
flow
1 His
tori
cal p
eak
stre
amflo
w a
nd s
tage
1 Floo
d of
Apr
il–M
ay 2
017
Nat
iona
l W
eath
er
Serv
ice
flood
st
age
(ft
)
Peak
st
ream
-flo
w(ft
3 /s)
Year
of
peak
st
ream
-flo
w
Peak
st
age
(ft
)
Year
of
peak
st
age
2 Peak
st
ream
-flo
w(ft
3 /s)
Dat
e of
pe
ak
stre
amflo
w
Peak
st
age
(ft
)
3 Rank
/nu
mbe
r of
annu
al p
eak
stre
amflo
ws
in re
cord
1606
9270
00M
arie
s Riv
er a
t W
estp
halia
, Mis
sour
i25
76/
8/19
3741
,800
1998
24.8
419
9827
,400
2017
-04-
3021
.00
6/63
10
1706
9280
00G
asco
nade
Riv
er n
ear
Haz
elgr
een,
Mis
sour
i1,
250
6 8/1
915
90,0
0019
1634
.92
2008
119,
000
2017
-04-
3039
.74
1/73
21
1806
9300
00B
ig P
iney
Riv
er n
ear
Big
Pin
ey, M
isso
uri
560
4/28
/192
281
,200
1982
24.5
1982
90,2
0020
17-0
4-30
30.6
71/
888.
5
1906
9335
00G
asco
nade
Riv
er a
t Je
rom
e, M
isso
uri
2,84
01/
6/18
9714
0,00
020
1531
.92
2015
197,
000
2017
-05-
0135
.06
1/99
15
2006
9340
00G
asco
nade
Riv
er n
ear
Ric
h Fo
unta
in,
Mis
sour
i
3,18
01/
6/18
9714
3,00
020
1534
.56
2015
190,
000
2017
-05-
0237
.46
1/78
20
2107
0103
50M
eram
ec R
iver
at C
ook
Stat
ion,
Mis
sour
i19
92/
10/1
966
34,9
0019
6617
.74
1966
26,2
0020
17-0
4-30
16.9
03/
26--
2207
0130
00M
eram
ec R
iver
nea
r St
eelv
ille,
Mis
sour
i78
18/
20/1
915
60,0
0019
1527
.22
1998
62,2
0020
17-0
4-30
28.7
11/
102
12
2307
0145
00M
eram
ec R
iver
nea
r Su
lliva
n, M
isso
uri
1,47
56 8
/191
590
,000
1915
33.5
1915
95,3
0020
17-0
4-30
36.3
81/
8711
2407
0165
00B
ourb
euse
Riv
er a
t U
nion
, Mis
sour
i80
86 1
897
73,3
0019
8234
.31
2015
43,8
0020
17-0
5-02
29.3
85/
104
15
2507
0181
00B
ig R
iver
nea
r R
ichw
oods
, Mis
sour
i73
51/
4/19
5059
,800
1993
30.3
319
9366
,900
2017
-04-
3033
.54
1/68
--
2607
0185
00B
ig R
iver
at
Byr
nesv
ille,
Mis
sour
i91
78/
21/1
915
80,0
0019
1530
.219
1562
,600
2017
-05-
0130
.09
3/96
16
2707
0190
00M
eram
ec R
iver
at
Eure
ka, M
isso
uri
3,78
83/
28/1
904
175,
000
1915
46.0
620
1516
9,00
020
17-0
5-02
46.1
12/
100
19
2807
0210
00C
asto
r Riv
er a
t Zal
ma,
M
isso
uri
423
5/17
/192
011
4,00
020
0830
.47
2008
69,7
0020
17-0
4-30
29.0
03/
88--
2907
0358
00St
. Fra
ncis
Riv
er n
ear
Mill
Cre
ek, M
isso
uri
505
2/28
/198
713
0,00
019
9333
.119
9369
,300
2017
-04-
3027
.32
2/29
16
3007
0361
00St
. Fan
cis R
iver
nea
r Sa
co, M
isso
uri
664
11/2
3/19
8316
1,00
019
9336
.119
9311
0,00
020
17-0
4-30
33.4
22/
2621
3107
0375
00St
. Fra
ncis
Riv
er n
ear
Patte
rson
, Mis
sour
i95
66 1
915
155,
000
1982
35.7
719
8212
6,00
020
17-0
4-30
37.1
33/
9616

6 Flooding in the Southern Midwestern United States, April–May 2017Ta
ble
1.
Peak
stre
amflo
w a
nd s
tage
dat
a at
sel
ecte
d U.
S. G
eolo
gica
l Sur
vey
stre
amga
ges
in th
e flo
od s
tudy
are
a fo
r the
floo
d of
Apr
il–M
ay 2
017.
—Co
ntin
ued
[Val
ues i
n bo
ld d
enot
e pe
ak o
f rec
ord
stre
amflo
ws;
ID, i
dent
ifier
; USG
S, U
.S. G
eolo
gica
l Sur
vey;
mi2 ,
squa
re m
ile; f
t3 /s, c
ubic
foot
per
seco
nd; f
t, fo
ot; -
-, da
ta n
ot a
vaila
ble]
Map
ID
(fig.
2)
USG
S st
ream
gage
nu
mbe
r
USG
S
stre
amga
ge n
ame
Dra
inag
e ar
ea
(mi2 )
Dat
e of
firs
t re
cord
ed
peak
st
ream
flow
1 His
tori
cal p
eak
stre
amflo
w a
nd s
tage
1 Floo
d of
Apr
il–M
ay 2
017
Nat
iona
l W
eath
er
Serv
ice
flood
st
age
(ft
)
Peak
st
ream
-flo
w(ft
3 /s)
Year
of
peak
st
ream
-flo
w
Peak
st
age
(ft
)
Year
of
peak
st
age
2 Peak
st
ream
-flo
w(ft
3 /s)
Dat
e of
pe
ak
stre
amflo
w
Peak
st
age
(ft
)
3 Rank
/nu
mbe
r of
annu
al p
eak
stre
amflo
ws
in re
cord
3207
0435
00Li
ttle
Riv
er D
itch
No.
1
near
Mor
ehou
se,
Mis
sour
i
450
6 6/1
945
12,2
0019
8919
.85
1945
9,50
020
17-0
5-01
18.9
910
/69
--
3307
0507
00Ja
mes
Riv
er n
ear
Sprin
gfiel
d, M
isso
uri
246
6 7/1
909
62,0
0019
0922
.220
1538
,100
2017
-04-
3020
.90
4/63
12
3407
0521
00W
ilson
Cre
ek n
ear
Sprin
gfiel
d, M
isso
uri
31.4
11/1
/197
26,
710
2015
10.1
620
154,
220
2017
-04-
299.
156/
297
3507
0525
00Ja
mes
Riv
er a
t Gal
ena,
M
isso
uri
987
4/1/
1922
85,1
0020
0835
.96
2008
82,8
0020
17-0
4-30
35.9
72/
9615
3607
0556
07C
rook
ed C
reek
at K
elly
C
ross
ing
at Y
ellv
ille,
A
rkan
sas
398
2/23
/198
538
,500
1990
31.5
120
1195
,200
2017
-04-
3031
.87
1/33
--
3707
0575
00N
orth
For
k R
iver
nea
r Te
cum
seh,
Mis
sour
i56
14/
15/1
945
75,0
0019
8528
.119
8518
9,00
020
17-0
4-29
41.8
21/
7320
3807
0580
00B
ryan
t Cre
ek n
ear
Tecu
mse
h, M
isso
uri
570
4/14
/194
571
,100
1982
26.7
419
8211
1,00
020
17-0
4-29
33.0
71/
6316
3907
0615
00B
lack
Riv
er n
ear
Ann
apol
is, M
isso
uri
484
4/17
/193
910
9,00
019
9327
.38
1993
71,2
0020
17-0
4-30
23.3
3/79
8
4007
0630
00B
lack
Riv
er a
t Pop
lar
Blu
ff, M
isso
uri
1,24
56 3
/190
410
0,00
019
0422
.15
2008
29,7
0020
17-0
5-01
21.9
612
/96
16
4107
0660
00Ja
cks F
ork
at E
min
ence
, M
isso
uri
398
11/1
9/19
2158
,500
1993
4 25
.019
0410
6,00
020
17-0
4-30
27.7
21/
9612
4207
0670
00C
urre
nt R
iver
at V
an
Bur
en, M
isso
uri
1,66
73/
26/1
904
153,
100
1904
29.0
1904
179,
000
2017
-04-
3037
.42
1/10
620
4307
0680
00C
urre
nt R
iver
at
Don
ipha
n, M
isso
uri
2,03
86 3
/190
413
0,00
019
0425
.49
1982
183,
000
2017
-05-
0133
.13
1/10
113
4407
0690
00B
lack
Riv
er a
t Po
caho
ntas
, Ark
ansa
s4,
840
4/17
/192
786
,600
2011
28.4
420
1110
5,00
020
17-0
5-02
28.9
51/
7717
4507
0715
00El
even
Poi
nt R
iver
nea
r B
ardl
ey, M
isso
uri
793
8/20
/191
549
,800
1982
21.6
419
8212
4,00
020
17-0
4-30
28.6
61/
97--
4607
0720
00El
even
Poi
nt R
iver
nea
r R
aven
den
Sprin
gs,
Ark
ansa
s
1,13
01/
14/1
930
162,
000
1982
29.0
619
8213
7,00
020
17-0
5-01
27.9
1/86
15
4707
0744
20B
lack
Riv
er a
t Elg
in
Ferr
y, A
rkan
sas
8,42
012
/4/1
982
212,
000
2011
34.7
720
1117
3,00
020
17-0
5-04
33.9
92/
27--
April–May 2017 Flooding—Antecedent Conditions, Chronology, and Magnitude 7
Map
ID
(fig.
2)
USG
S st
ream
gage
nu
mbe
r
USG
S
stre
amga
ge n
ame
Dra
inag
e ar
ea
(mi2 )
Dat
e of
firs
t re
cord
ed
peak
st
ream
flow
1 His
tori
cal p
eak
stre
amflo
w a
nd s
tage
1 Floo
d of
Apr
il–M
ay 2
017
Nat
iona
l W
eath
er
Serv
ice
flood
st
age
(ft
)
Peak
st
ream
-flo
w(ft
3 /s)
Year
of
peak
st
ream
-flo
w
Peak
st
age
(ft
)
Year
of
peak
st
age
2 Peak
st
ream
-flo
w(ft
3 /s)
Dat
e of
pe
ak
stre
amflo
w
Peak
st
age
(ft
)
3 Rank
/nu
mbe
r of
annu
al p
eak
stre
amflo
ws
in re
cord
4807
0767
50W
hite
Riv
er a
t G
eorg
etow
n,
Ark
ansa
s
22,4
004/
6/19
7917
9,00
019
8233
.95
2011
200,
000
2017
-05-
0831
.51/
3821
4907
0770
00W
hite
Riv
er a
t Dev
alls
B
luff,
Ark
ansa
s23
,400
6/28
/192
822
0,00
019
4936
.120
1118
7,00
020
17-0
5-10
31.3
13/
67--
5007
0775
55C
ache
Riv
er n
ear C
otto
n Pl
ant,
Ark
ansa
s1,
170
7/13
/198
79,
950
1987
20.2
820
1110
,100
2017
-05-
0520
.25
1/31
--
5107
1857
65Sp
ring
Riv
er a
t C
arth
age,
Mis
sour
i42
57/
6/19
6740
,600
2015
20.3
320
1530
,400
2017
-04-
2918
.44
2/30
10
5207
1860
00Sp
ring
Riv
er n
ear W
aco,
M
isso
uri
1,16
46 1
923
151,
000
1993
34.0
619
9355
,800
2017
-04-
3028
.14
8/95
19
5307
1870
00Sh
oal C
reek
abo
ve
Jopl
in, M
isso
uri
427
7/13
/192
462
,100
1943
4 28
.019
4152
,900
2017
-04-
2922
.96
4/94
14
5407
1890
00El
k R
iver
nea
r Tiff
City
, M
isso
uri
851
4/12
/194
013
7,00
019
4128
.419
4110
7,00
020
17-0
4-29
27.3
92/
7815
5507
1912
20Sp
avin
aw C
reek
nea
r Sy
cam
ore,
Okl
ahom
a13
35/
6/19
6039
,800
1975
22.0
719
7519
,900
2017
-04-
2916
.94
2/58
--
5607
1955
00Ill
inoi
s Riv
er n
ear
Wat
ts, O
klah
oma
635
5/15
/195
611
0,00
020
1528
.64
2015
128,
000
2017
-04-
3030
.12
1/62
13
5707
1960
00Fl
int C
reek
nea
r Kan
sas,
Okl
ahom
a11
05/
15/1
956
44,4
0019
7419
.42
1974
19,4
0020
17-0
4-29
18.3
13/
5811
5807
2610
00C
adro
n C
reek
nea
r Guy
, A
rkan
sas
169
3/21
/195
524
,200
1982
29.2
919
8218
,000
2017
-04-
3023
.57
3/61
--
5907
3596
10C
addo
Riv
er n
ear C
addo
G
ap, A
rkan
sas
136
11/1
9/19
8897
,200
1993
26.2
719
9335
,800
2017
-04-
3023
.32
3/29
--
1 All
peak
stre
amflo
w a
nd st
age
info
rmat
ion
obta
ined
from
U.S
. Geo
logi
cal S
urve
y (2
017a
).2 A
t the
tim
e of
this
repo
rt, th
e pe
ak st
ream
flow
s in
wat
er y
ear 2
017
(fro
m O
ctob
er 1
, 201
6, to
Sep
tem
ber 3
0, 2
017)
are
pro
visi
onal
dat
a su
bjec
t to
revi
sion
.3 R
ank
of th
e m
axim
um in
stan
tane
ous p
eak
stre
amflo
w c
ompa
red
to a
ll sy
stem
atic
and
his
toric
al a
nnua
l pea
ks. A
rank
of 1
indi
cate
s tha
t the
Apr
il–M
ay 2
017
peak
stre
amflo
w w
as h
ighe
r tha
n al
l oth
er
reco
rded
ann
ual p
eak
valu
es.
4 Sta
ge o
btai
ned
at d
iffer
ent l
ocat
ion
or d
atum
from
cur
rent
stre
amga
ge.
5 Max
imum
stag
e kn
own,
27.
7 fe
et, J
uly
29, 1
909,
from
floo
dmar
k.6 M
onth
or d
ay o
f occ
urre
nce
is u
nkno
wn
or n
ot e
xact
.
Tabl
e 1.
Pe
ak s
tream
flow
and
sta
ge d
ata
at s
elec
ted
U.S.
Geo
logi
cal S
urve
y st
ream
gage
s in
the
flood
stu
dy a
rea
for t
he fl
ood
of A
pril–
May
201
7.—
Cont
inue
d
[Val
ues i
n bo
ld d
enot
e pe
ak o
f rec
ord
stre
amflo
ws;
ID, i
dent
ifier
; USG
S, U
.S. G
eolo
gica
l Sur
vey;
mi2 ,
squa
re m
ile; f
t3 /s, c
ubic
foot
per
seco
nd; f
t, fo
ot; -
-, da
ta n
ot a
vaila
ble]
8 Flooding in the Southern Midwestern United States, April–May 2017
EEEE
E
E
#
#
#
#
#
#
#
#
#
#
###
# #
#
##
#
#
#
#
#
#
#
##
#
##
#
#
##
#
#
##
#
#
##
#
#
#
#
#
#
#
#
##
#
#
#
##
#
#
9
8
7
6
5
4
3
2
1
59
58
57 56
55
54
53
52 51
50
49
48
47
46
45
44
43
4241
40
39
3837
36
35
3433
32
31
3029
28
2726
25
24
2322
21
20
19
1817
16
1514
131211
10
Whi
te R
iver
2 3
456
7
88°90°92°94°
40°
38°
36°
34°
Miss
issip
pi R
iver
Jacks Fork
Current River
Missouri R iver
Ohio
Rive
r
EXPLANATION# U. S. Geological Survey streamgage
and identifier
E Film location and identifier (table 2)
Flood study area
0 50 10025 MILES
0 50 10025 KILOMETERS
Kansas
Missouri
Illinois
Indi
ana
Kentucky
Tennessee
Oklahoma
Arkansas
Mississippi Ala
bam
a
Texas
Base from U.S. Geological Survey, 1:2,000,000-scale data, 2005Albers Equal-Area ProjectionNorth American Datum of 1983 (NAD8
27
2
Figure 2. Location of selected U.S. Geological Survey streamgages and aerial video documentation locations within the designated flood study area.

April–May 2017 Flooding—Antecedent Conditions, Chronology, and Magnitude 9
Figure 3. Streamflow conditions at selected U.S. Geological Survey streamgages in the study area before the April–May 2017 flooding including A, January ; B, February; C, March; and D, April of 2017.
86°88°90°92°94°96°
38°
36°
34°
January 15, 2017
February 15, 2017
86°88°90°92°94°96°
38°
36°
34°
0 50 100 MILES
0 50 100 KILOMETERS
Base from U.S. Geological Survey, 1:2,000,000-scale data, 2005Albers Equal-Area ProjectionNorth American Datum of 1983 (NAD83)
A.
B.
New low Less than 5 to 9 percentile
10 to 24 percentile25 to 75 percentile
76 to 90 percentileGreater than 90 percentile
Stream�ow condition
Flood study area
Kansas
Missouri IllinoisIndiana
Kentucky
Tennessee
Oklahoma
Arkansas
Kansas
Missouri IllinoisIndiana
Kentucky
Tennessee
Oklahoma
Arkansas
Texas
Texas
MississippiAlabama

10 Flooding in the Southern Midwestern United States, April–May 2017
86°88°90°92°94°96°
38°
36°
34°
86°88°90°92°94°96°
38°
36°
34°
0 50 100 MILES
0 50 100 KILOMETERS
Base from U.S. Geological Survey, 1:2,000,000-scale data, 2005Albers Equal-Area ProjectionNorth American Datum of 1983 (NAD83)
March 15, 2017
April 15, 2017
New lowLess than 5 to 9 percentile
10 to 24 percentile25 to 75 percentile
76 to 90 percentileGreater than 90 percentile
Stream�ow condition
Flood study area
C.
D.
Kansas
Missouri IllinoisIndiana
Kentucky
Tennessee
Oklahoma
ArkansasTexas
Kansas
Missouri IllinoisIndiana
Kentucky
Tennessee
Oklahoma
ArkansasTexas
MississippiAlabama
Figure 3. Streamflow conditions at selected U.S. Geological Survey streamgages in the study area before the April–May 2017 flooding including A, January; B, February; C, March; and D, April of 2017.—Continued

April–May 2017 Flooding—Antecedent Conditions, Chronology, and Magnitude 11
January 2017 February 2017
March 2017 April 2017
Study area boundary
EXPLANATIONMonthly precipitation condition
Figure 4. Monthly precipitation conditions in the United States for January–April 2017, as a percent of normal. (Modified from NOAA, National Centers for Environmental Information, 2017b).
USGS hydrologic technician tethering acoustic Doppler current profiler (ADCP), St. Francis River near Patterson, Mo., April 30, 2017. Photograph by Aaron Walsh, USGS.
12 Flooding in the Southern Midwestern United States, April–May 2017
Figure 5. 500 millibar height contours for April 29, 2017, across the continental United States (Source: National Centers for Environmental Prediction, 2017).
Illinois River near Watts, Okla., April 30, 2017. Photograph by U.S. Geological Survey.

April–May 2017 Flooding—Antecedent Conditions, Chronology, and Magnitude 13
Figure 6. Daily surface weather maps at 7:00 AM Eastern Standard Time from April 29 to 30, 2017 (Source: National Centers for Environmental Prediction, 2017).
April 29, 2017
April 30, 2017
Precipitation area HL1020 Isobar and value
High-pressure area
Low-pressure area
Frontal line between high- and low-pressure systems
EXPLANATION
14 Flooding in the Southern Midwestern United States, April–May 2017
Figure 7. Cumulative rainfall totals over the southern Midwest United States duringApril 28 - 30, 2017. Source: National Weather Service (2017b).
Missouri
Kansas
Iowa
Nebraska
Oklahoma
Arkansas
Tennessee
Alabama
Geo
rgia
Mississippi
Kentucky
Illinois
Indiana
Wisconsin
Michigan
Texas
Figure 7. Cumulative rainfall totals over the southern Midwest United States during April 28–30, 2017. Source: National Weather Service (2017b).
Southern Current River near Doniphan, Mo., May 1, 2017. Photograph by Ben Rivers, USGS.

April–May 2017 Flooding—Antecedent Conditions, Chronology, and Magnitude 15
#
#
#
#
#
0.35
0.95
3.87
0 00.3
0.5
0 0 0 0 0 0 0
0.5
1
1.5
2
2.5
3
3.5
4
4.50
10,000
20,000
30,000
40,000
50,000
60,000
4/28 4/29 4/30 5/1 5/2 5/3 5/4 5/5 5/6 5/7 5/8 5/9
0
6.05
1.361.78
0.02 0
0.95
1.81
0.06 0 0 0 0 0
1
2
3
4
5
6
702,0004,0006,0008,000
10,00012,00014,00016,00018,00020,000
4/28 4/29 4/30 5/1 5/2 5/3 5/4 5/5 5/6 5/7 5/8 5/9 5/10
0
1.8
6.57
0.66
0 0.09
1.83
0.97
0 0 0 0 0 0
1
2
3
4
5
6
7020,00040,00060,00080,000
100,000120,000140,000160,000180,000200,000
4/28 4/30 5/2 5/4 5/6 5/8 5/10
Stre
am�o
w, i
n cu
bic
feet
per
sec
ond
Prec
ipita
tion,
in in
ches
Daily precipitation and value (National Centers for Environmental Information, 2017a)
0.26Precipitation from Georgetown station
Preciptitation from Winona ForestRanger Station
Precipitation from Poseyville 2.8 NW station
Flood study area
0 0
7.82
0.330 0
1.69
0.260 0 0 0 0 0
0.38
0
1
2
3
4
5
6
7
8
90
2,000
4,000
6,000
8,000
10,000
12,000
4/28 4/30 5/2 5/4 5/6 5/8 5/10 5/12
Precipitation from Georgetownstation
Stre
am�o
w, i
n cu
bic
feet
per
sec
ond
Prec
ipita
tion,
in in
ches
Prec
ipita
tion,
in in
ches Prec
ipita
tion,
in in
ches
Prec
ipita
tion,
in in
ches
Stre
am�o
w, i
n cu
bic
feet
per
sec
ond
Stre
am�o
w, i
n cu
bic
feet
per
sec
ond
Stre
am�o
w, i
n cu
bic
feet
per
sec
ond
Georgetown(7.82,10.10)
Clinton 6 SE(2.95,4.59)
Pocahontas 1(4.05, 6.77)
Red Bud 5 SE(5.03,8.36)
Herrin 3.4 S(8.56,11.49)
Union 0.8 NE(5.23,9.53)
Mount Ida 4 S(5.9, 8.35)
Joplin 5.2 SSW(5.68,8.33)
Westville 0.2 ENE(5.56,5.61)
Steelville 5.6 SW(7.70,11.79)
West Plains 1.5 NW(9.29,13.55)
Upper Spavinaw Port(5.17, 5.97)
Springfield 0.7 ENE(5.61,7.91)
Poplar Bluff 4.2 NW (7.40,8.92)
Jefferson City 5.9 W(5.81,9.18)
Winona Forest Ranger Station(9.29,11.92)
Poseyville 2.8 NW(7.41, 12.03)
Shoal Creek above Joplin, MOStation 07187000
White River at Georgetown, ARStation 07076750
Cache River near Cotton Plant, ARStation 07077555
Current River at Van Buren, MOStation 07068000
Big Creek near Wadesville, INStation 03378550
Oklahoma
Arkansas
MissouriIllinois
Indiana
Kansas
Red Bud 5 SE(5.03,8.36)
Precipitation station(April 28-30 total precipitation,April 28-May 10 total precipitation, in inches)
0 0
7.82
0.330 0
1.69
0.260 0 0 0 0 0
0.380
1
2
3
4
5
6
7
8
90
50,000
100,000
150,000
200,000
250,000
4/28 4/30 5/2 5/4 5/6 5/8 5/10 5/12
EXPLANATION
Stream�ow hydrograph
Precipitation from Joplin 5.2 SSW
Date
Date
Date
Date
Date
Figure 8. Streamflow hydrographs and precipitation totals and distributions for selected U.S. Geological Survey streamgages and precipitation stations within the study area.

16 Flooding in the Southern Midwestern United States, April–May 2017
Magnitude of April–May 2017 Flooding
Peak-of-record streamflows were set at 21 USGS streamgages in the southern Midwest during the resulting April–May 2017 flooding (table 1). Each of the five States included in the study area had at least one streamgage with a peak of record during the flood. In Missouri, the previous peaks of record (for stage) at two rivers (Jacks Fork, Current River) had stood since 1904 and included 96 to 106 annual peaks. The peak stage of the April–May 2017 flood at the Current River at Van Buren, Mo. (station no. 07067000), exceeded the previous maximum stage by 8.4 ft (table 1). Most remaining streamgages included in the study had peak streamflows during the event that ranked in the top three peaks of record. Additional USGS streamgages within the study area, but on the perimeter of the storm track, had peaks that ranked as low as the top 10–15 (table 1) including the Moniteau River near Fayette, Mo. (map identifier [ID] 7), and Cedar Creek near Pleasant View, Mo. (map ID 12), along the northern boundary of the study area (fig. 2).
Flooding is easily summarized numerically as a peak stage or streamflow value, but these numbers alone fail to convey the physical consequences of such high flows on struc-tures and the lives of those affected. Aerial videos that were collected within 24 hours of the flood peaks at several loca-tions (table 2, fig. 2) document the consequences of the floods (films 2–7). These videos were collected at locations within the greater than 10 in. precipitation areas shown in figure 7,
and that also were near USGS streamgage locations with peaks of record during the flood including North Fork River near Tecumseh, Mo. (fig. 2 map ID 37; table 1) and Bryant Creek near Tecumseh, Mo. (fig. 2 map ID 38; table 1).
Film 2. Spring Creek at Highway AP bridge near Willow Springs, Missouri, April 30, 2017, at 10:30 a.m. (see fig. 2 aerial video location 1). (Video footage provided by Aerial Ozarks).
Film 3. North Fork River and Spring Creek at Highway 14, Douglas County, Missouri, April 30, 2017, at 12:09 p.m. (see fig. 2 aerial video location 2). (Video footage provided by Aerial Ozarks).
Film 4. North Fork River at Highway CC, Ozark County, Missouri, April 30, 2017, at 12:37 p.m. (see fig. 2 aerial video location 3). (Video footage provided by Aerial Ozarks).
Film 5. Bryant Creek at Highway 181, Ozark County, Missouri, April 30, 2017, at 13:06. (see fig. 2 aerial video location 4). (Video footage provided by Aerial Ozarks).
Film 6. North Fork River at Highway PP near Tecumseh, Missouri, Ozark County, April 30, 2017, at 13:40. (see fig. 2 aerial video location 5). (Video footage provided by Aerial Ozarks).
Film 7. Dry Creek at Highway AP near Willow Springs, Missouri, April 30, 2017, at 15:29. (see fig. 2 aerial video location 6). (Video footage provided by Aerial Ozarks).
Table 2. Date, times, and locations of aerial video footage documenting the effects of the April–May 2017 flood at selected locations in south-central Missouri.
[ID, identifier; Lat, lattitude; Long, longitude; hwy, highway; nr, near; MO, Missouri]
Map ID (fig. 2) Film Lat Long Date Time Description
2 2 36.9074051 -92.0808668 4/30/2017 10:30 Spring Creek at Hwy AP bridge, nr Willow Springs, MO.
3 3 36.810436 -92.1498827 4/30/2017 112:09 North Fork River and Spring Creek at Hwy 14, Douglas County, MO.
4 4 36.7598273 -92.1556513 4/30/2017 112:37 North Fork River at Hwy CC, Ozark County, MO.5 5 36.7095049 -92.2690143 4/30/2017 213:06 Bryant Creek at Highway 181, Ozark County, MO.6 6 36.615802 -92.262483 4/30/2017 113:40 North Fork River at Hwy PP nr Tecumseh, Ozark
County, MO.7 7 36.8378767 -92.0559632 4/30/2017 15:29 Dry Creek at Highway AP, near Willow Springs,
Howell County, MO.1The peak at the nearby North Fork River near Tecumseh, Missouri, streamgage was at 4/29/17 at 21:45.2The peak at the nearby Bryant Creek near Tecumseh, Missouri, streamgage was at 4/29/17 at 20:00.
April–May 2017 Flooding—Annual Exceedance Probability 17
April–May 2017 Flooding—Comparison with Historic Floods
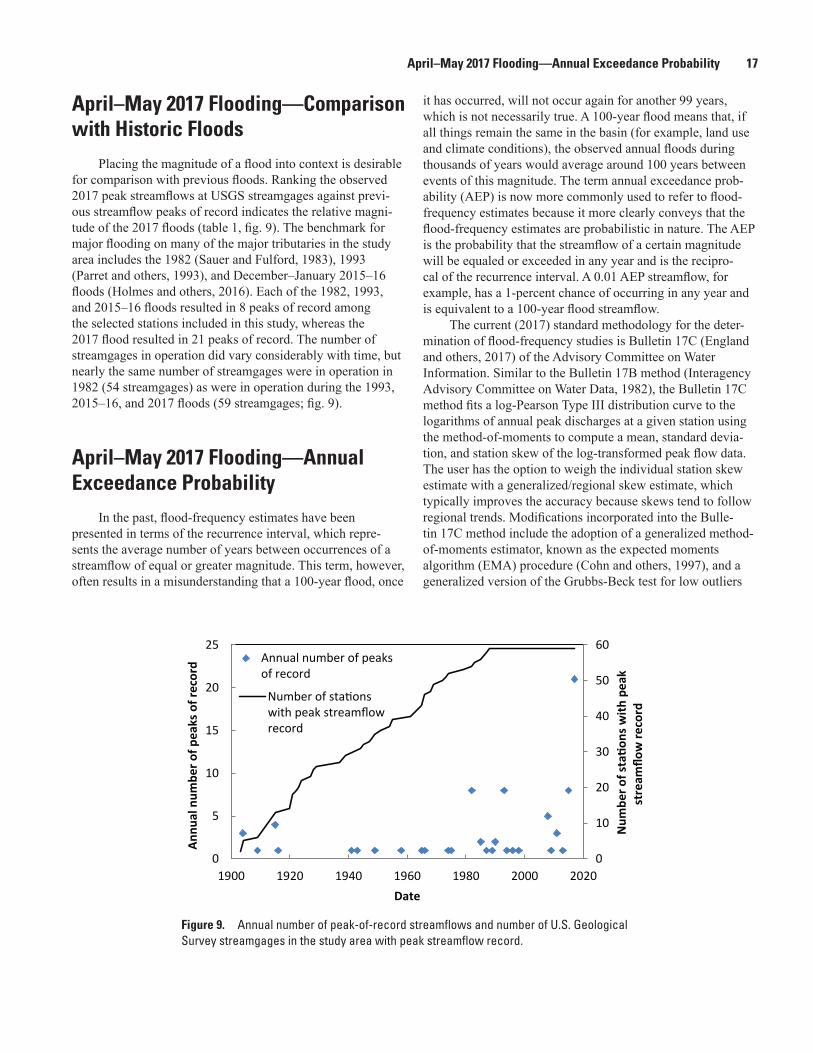
Placing the magnitude of a flood into context is desirable for comparison with previous floods. Ranking the observed 2017 peak streamflows at USGS streamgages against previ-ous streamflow peaks of record indicates the relative magni-tude of the 2017 floods (table 1, fig. 9). The benchmark for major flooding on many of the major tributaries in the study area includes the 1982 (Sauer and Fulford, 1983), 1993 (Parret and others, 1993), and December–January 2015–16 floods (Holmes and others, 2016). Each of the 1982, 1993, and 2015–16 floods resulted in 8 peaks of record among the selected stations included in this study, whereas the 2017 flood resulted in 21 peaks of record. The number of streamgages in operation did vary considerably with time, but nearly the same number of streamgages were in operation in 1982 (54 streamgages) as were in operation during the 1993, 2015–16, and 2017 floods (59 streamgages; fig. 9).
April–May 2017 Flooding—Annual Exceedance Probability
In the past, flood-frequency estimates have been presented in terms of the recurrence interval, which repre-sents the average number of years between occurrences of a streamflow of equal or greater magnitude. This term, however, often results in a misunderstanding that a 100-year flood, once
it has occurred, will not occur again for another 99 years, which is not necessarily true. A 100-year flood means that, if all things remain the same in the basin (for example, land use and climate conditions), the observed annual floods during thousands of years would average around 100 years between events of this magnitude. The term annual exceedance prob-ability (AEP) is now more commonly used to refer to flood-frequency estimates because it more clearly conveys that the flood-frequency estimates are probabilistic in nature. The AEP is the probability that the streamflow of a certain magnitude will be equaled or exceeded in any year and is the recipro-cal of the recurrence interval. A 0.01 AEP streamflow, for example, has a 1-percent chance of occurring in any year and is equivalent to a 100-year flood streamflow.
The current (2017) standard methodology for the deter-mination of flood-frequency studies is Bulletin 17C (England and others, 2017) of the Advisory Committee on Water Information. Similar to the Bulletin 17B method (Interagency Advisory Committee on Water Data, 1982), the Bulletin 17C method fits a log-Pearson Type III distribution curve to the logarithms of annual peak discharges at a given station using the method-of-moments to compute a mean, standard devia-tion, and station skew of the log-transformed peak flow data. The user has the option to weigh the individual station skew estimate with a generalized/regional skew estimate, which typically improves the accuracy because skews tend to follow regional trends. Modifications incorporated into the Bulle-tin 17C method include the adoption of a generalized method-of-moments estimator, known as the expected moments algorithm (EMA) procedure (Cohn and others, 1997), and a generalized version of the Grubbs-Beck test for low outliers
Figure 9. Annual number of peak-of-record streamflows and number of U.S. Geological Survey streamgages in the study area with peak streamflow record.
0
10
20
30
40
50
60
0
5
10
15
20
25
1900 1920 1940 1960 1980 2000 2020
Num
ber o
f statio
ns w
ith p
eak
stre
amflo
w re
cord
Annu
al n
umbe
r of p
eaks
of r
ecor
d
Date
Annual number of peaksof record
Number of stationswith peak streamflowrecord

18 Flooding in the Southern Midwestern United States, April–May 2017
(Cohn and others, 2013). The EMA is an updated method for fitting the log-Pearson Type III frequency distribution that is a more effective means of incorporating historical peak stream-flow information into a flood-frequency analysis.
The USGS computer program PEAKFQ (version 7.1; Flynn and others, 2006) was used to compute the flood-frequency estimates for the 59 stations in this study. The annual peak streamflow data used in the analyses were obtained from U.S. Geological Survey (2017a). The program automates many of the flood-frequency analyses procedures, including identifying and adjusting for high and low outli-ers and historical periods and fitting the log-Pearson Type III distribution to the streamflow data. The program includes the EMA procedure for flood-frequency analysis and multiple Grubbs-Beck outlier screening (Veilleux and others, 2013). The PEAKFQ program and associated documentation are available at https://water.usgs.gov/software/peakfq.html.
In addition to estimating the at-site AEP flood quantiles by Bulletin 17C methods, another way to obtain an AEP flood quantile estimate is by using regional regression equations (RREs). The RREs are developed using regression techniques that relate the peak flood-probability data at many streamgages in a particular region to the basin characteristics upstream from the streamgages (Jennings and others, 1994). The RREs allow a user to estimate the various AEP flood quantiles for any location along a stream (gaged or ungaged) by entering the specified basin characteristics (for example, drainage area or average precipitation) used as independent variables in the equation. Rural regression estimates for the 59 streamgages in this study were obtained from the corresponding RRE estimates developed for each state in the study area includ-ing Arkansas (Wagner and others, 2016), Illinois (Soong and others, 2004), Missouri (Southard, 2010; Southard and Veilleux, 2014), and Oklahoma (Lewis, 2010). The single streamgage in Indiana (Big Creek near Wadesville, Indiana) is within 10 mi of the Illinois border, so the Illinois RRE equa-tions were used to obtain the RRE estimates for this station. The optimal estimate of the AEP flood quantile for a gaged site is determined by weighting the at-site AEP flood quantile esti-mate determined from the Bulletin 17C methods with the AEP flood quantile estimate determined from the RRE as described in (Soong and others, 2004; Southard, 2010; Southard and Veilleux, 2014; and Wagner and others, 2016).
The AEP estimates for the April–May 2017 flood peak streamflows indicate that peaks at 5 USGS streamgages had an AEP of 0.2 percent or less, and peak streamflows at 15 USGS streamgages had an AEP in the range from greater than 0.2 to 1 percent (table 3, fig. 10). The weighted estimates of the AEP flood quantiles corresponding to the 50-, 20-, 10-, 4-, 2-, 1-, 0.5-, and 0.2-percent AEPs, along with their respective 95-percent confidence limits, for the selected 59 streams in the southern Midwest included in this study, also were computed (table 3).
Temporal Changes in Annual Peak Streamflows
Temporal changes in annual peak streamflows are impor-tant to investigate because they may indicate to emergency and infrastructure managers there are corresponding changes in the levels of risk to public safety. Temporal changes in streamflow can be the result of changes to such factors as land use and land cover, climate, or regulation. The annual peak streamflow time series data were analyzed for selected streamgages in the southern Midwest to determine the presence and subsequent magnitude of changes through time at each site.
The temporal changes in streamflow magnitudes were computed based on the Sen’s slope estimator (Sen, 1968) using the MAKESENS application from the Finnish Meteo-rological Institute (Salmi and others, 2002). The Sen’s slope, also known as the Kendall-Theil robust line, is a nonparamet-ric estimate of trend magnitude slope for a univariate time series when the time interval is constant (equally spaced).
f(t) = Mq×t + B (1)
where f(t) is the increasing or decreasing function
of time for the trend magnitudes of the streamflows used in the investigation,
Mq is the Sen’s slope estimate, t is time, and B is a constant.
The Sen’s slope is the median slope of all pairwise comparisons with each pairwise difference divided by the number of years separating the records. To determine the Sen’s slope estimate in equation 2, the slopes of all data pairs are calculated:
MX Xtj k
k j
j k
,( )
,
=−
∆ for j=1,..., n−1; j < k ≤ n (2)
where Mj,k is the slope between data points Xj and Xk; Xj is the data measurement at time j; Xk is the data measurement at time k; Δtj,k is the change in time between observations;
and n is the number of years of record.
The Sen’s slope estimate, Mq, is equal to the median value of all the Mj,k values.
Temporal Changes in Annual Peak Streamflows 19
Streamgages with missing record periods exceeding 5 percent of the total record were not used in the analyses of temporal changes in annual streamflow peaks nor were streamgages on regulated rivers. Of the 59 streamgages included in the study, 49 were used in the analyses of tempo-ral changes in annual peak streamflows. The start dates of documented peak streamflows and record periods for the 49 stations differed; therefore, four temporal analysis periods (1930–2017, 1956–2017, 1975–2017, and 1989–2017) were selected to maintain consistency in streamflow record start dates, have overlap of record analysis periods, and maximize the number of stations and the period of record that could be included in the analyses. For comparison of streamgages with differing basin sizes, the Sen’s slope for each streamgage was divided by the median annual peak streamflow value to determine the percentage of change with respect to the median annual peak streamflow at each streamgage.
Examination of the magnitude of the temporal changes (scaled by median annual peak flood streamflow) in median annual peak streamflows from 1930–2017 indicates all but 1 of the 20 stations included had a systematic positive increase in peak streamflows of less than 2 percent per year (fig. 11A). The remaining station, Shoal Creek above Joplin, Mo. (station no. 07187000, map ID 53), had a negative change of -0.12 percent per year during the analysis period. Simi-larly, the temporal change in peak streamflows at most of the 34 stations included in the 1956–2017 analysis period had median positive increases in annual peak flows of less than 2 percent (fig. 11B). Two stations (Jacks Fork at Eminence, Mo., station no. 07066000, map ID 41; Current River at Van Buren, Mo., station no. 07067000, map ID 42), had no change and one station had a median decrease in annual peak streamflows of -0.12 percent per year over the 61-year period (Cadron Creek near Guy, Ark., station no. 07261000, map ID 58). Analyses of the 1975–2017 and 1989–2017 periods indicated nearly all stations had median positive changes in
annual peak streamflows of increasing magnitude (fig. 11C). Six of the 44 stations in the 1975–2017 analysis period had positive changes of greater than 2 percent, whereas 23 of 49 stations in the 1989–2017 analysis period had median positive increases of greater than 2 percent with maximum increases of 8–10 percent per year (fig. 11D). No stations in either of the 1975–2017 or 1989–2017 analysis periods had median negative changes in peak streamflows, but five stations in the 1989–2017 analysis period had no change in streamflow peaks.
A primary driver of change in peak streamflows is precipitation. Similar to streamflow peaks, the annual precipi-tation within the flood study area was analyzed by climate division (NOAA, National Centers for Environmental Infor-mation, 2017c) using the Sen’s slope methodology. Changes in annual precipitation were analyzed for the same periods as peak streamflow except the analysis periods for precipitation ended in 2016. Similar to changes in annual peak streamflows, median changes in annual precipitation for the 1930–2016 and 1956–2016 periods generally were small (less than 2 percent) and positive (fig. 12). Changes in annual precipita-tion, however, provided little explanation for the substantial increase in magnitude of streamflow peaks because, for example, nearly one-half of the climate divisions in the 1989–2016 analysis period indicated no change or a negative change in precipitation per year, whereas this was the period of the greatest magnitude in positive changes in streamflow peaks in the study area. The increase in the frequency of larger magni-tude rain events with time may be a better explanatory variable for the greater positive changes in annual peak streamflows. The frequency of daily precipitation events of greater than 2 or 3 in. generally increased from 1985 to 2014 in each state in the study area (fig. 13). The degree to which land use changes may have contributed to the positive changes in peak stream-flows was undetermined.

20 Flooding in the Southern Midwestern United States, April–May 2017
Table 3. Estimated annual exceedance probability of the 2017 flood peaks and weighted peak streamflow estimates for selected flood quantiles at 59 U.S. Geological Survey streamgages included in this study.
[ID, identifier; USGS, U.S. Geological Survey; AEP, annual exceedance probability; ft, foot; ft3/s, cubic foot per second; %, percent; --, not calculated; stations with peak of record during April–May 2017 flood are shown with rank value of “1” in bold]
Map
ID (f
ig. 2
)
USGS
stre
amga
ge n
umbe
r
USGS
stre
amga
ge n
ame 2017 flood peak AEP for observed 2017 flood
Expected peak streamflows for selected AEP with 95-percent confidence limits (ft3/s)
Expected peak streamflows for selected AEP with 95-percent confidence limits (ft3/s)
50-percent AEP (2-year recurrence)
20-percent AEP (5-year recurrence)
10-percent AEP (10-year recurrence)
4-percent AEP (25-year recurrence)
2-percent AEP (50-year recurrence)
1-percent AEP (100-year recurrence)
0.5-percent AEP (200-year recurrence)
0.2-percent AEP (500-year recurrence)
Rank
Num
ber o
f ann
ual
peak
s in
ana
lysi
s
Date
of p
eak
stre
amflo
w
Peak
sta
ge (f
t)
Peak
stre
amflo
w
(ft3 /s
)
AEP
estim
ate
Recu
rren
ce
inte
rval
(yea
rs) 67% confidence
interval1
Estim
ate
95% confidence limits2
Estim
ate
95% confidence limits2
Estim
ate
95% confidence limits2
Estim
ate
95% confidence limits2
Estim
ate
95% confidence limits2
Estim
ate
95% confidence limits2
Estimate
95% confidence limits2
Estim
ate
95% confidence limits2
Low
er
Uppe
r
Low
er
Uppe
r
Low
er
Uppe
r
Low
er
Uppe
r
Low
er
Uppe
r
Low
er
Uppe
r
Low
er
Uppe
r
Low
er
Uppe
r
Low
er
Uppe
r
1 03378550 Big Creek near Wadesville, Indiana
1 52 4/29/2017 21.23 19,000 0.83% 123 0.4% 3.4% 5,270 4,710 5,890 7,920 6,930 9,050 9,870 8,440 11,500 12,500 10,200 15,200 14,500 11,500 18,300 16,700 12,800 21,800 -- -- -- 22,000 15,500 31,200
2 03382100 South Fork Saline River near Carrier Mills, Illinois
2 52 4/30/2017 17.14 12,200 1.4% 72 1.4% 6.1% 3,100 2,720 3,520 5,030 4,310 5,880 6,610 5,480 7,980 8,940 7,050 11,300 10,900 8,260 14,400 13,100 9,500 18,000 -- -- -- 18,900 12,500 28,600
3 03612000 Cache River at Forman, Illinois3
3 95 5/2/2017 36.55 11,200 3.8% 27 1.5% 4.7% 3,810 3,430 4,230 6,320 5,620 7,100 8,250 7,180 9,470 11,000 9,200 13,100 13,200 10,700 16,200 15,500 12,200 19,700 -- -- -- 21,400 15,600 29,500
4 05587900 Cahokia Creek at Edwardsville, Illinois
3 49 5/1/2017 23.08 9,090 7.3% 14 2.9% 9.1% 5,470 5,030 5,950 7,350 6,700 8,050 8,500 7,650 9,450 9,870 8,730 11,200 10,900 9,410 12,500 11,800 10,100 13,900 -- -- -- 14,000 11,300 17,200
5 05595200 Richland Creek near Heckler, Illinois
3 48 4/30/2017 43.06 16,000 4.9% 20 2.9% 9.2% 5,900 5,070 6,870 9,920 8,460 11,600 12,800 10,700 15,300 16,600 13,400 20,700 19,600 15,300 25,200 22,600 17,000 30,000 -- -- -- 29,800 20,600 43,100
6 05597500 Crab Orchard Creek near Marion, Illinois
1 66 4/29/2017 13.84 10,300 0.91% 110 0.3% 2.7% 1,950 1,670 2,260 3,600 3,030 4,270 4,920 4,020 6,010 6,800 5,310 8,700 8,320 6,250 11,100 9,910 7,140 13,800 -- -- -- 13,900 9,110 21,300
7 06909500 Moniteau Creek near Fayette, Missouri
15 60 4/30/2017 19.71 4,010 27.9% 4 19.3% 29.9% 2,830 2,500 3,200 4,600 4,010 5,270 5,900 5,070 6,870 7,700 6,420 9,220 9,120 7,430 11,200 10,600 8,420 13,300 12,200 9,400 15,700 14,200 10,600 19,100
8 06910230 Hinkson Creek at Columbia, Missouri4
6 31 4/29/2017 19.21 9,300 10.1% 10 12.1% 25.3% 4,560 3,880 5,360 7,400 6,360 8,610 9,330 7,930 11,000 11,900 9,870 14,300 13,900 11,300 17,100 16,900 12,800 22,200 -- -- -- 21,700 15,900 29,600
9 06910750 Moreau River near Jefferson City, Missouri
2 58 5/1/2017 33.57 32,900 3.1% 32 1.3% 5.5% 13,600 12,100 15,300 20,600 18,300 23,300 25,300 22,200 28,900 31,200 26,600 36,500 35,400 29,600 42,300 39,600 32,300 48,500 43,700 34,800 54,900 49,200 37,900 64,000
10 06918440 Sac River near Dadeville, Missouri
4 53 4/30/2017 21.85 18,400 7.3% 14 4.1% 10.7% 5,270 4,420 6,290 10,500 8,650 12,800 15,300 12,300 18,900 22,900 18,000 29,200 29,200 22,400 38,100 35,900 27,000 48,000 43,000 31,700 58,400 52,100 37,000 73,500
11 06919020 Sac River at Highway J below Stockton, Missouri5
4 44 4/30/2017 22.36 11,400 6.6% 15 4.9% 12.8% 6,860 6,120 7,650 9,120 8,180 10,400 10,500 9,360 12,200 12,100 10,600 14,800 13,300 11,500 16,900 14,400 12,200 19,100 15,400 12,800 21,400 16,700 13,600 24,800
12 06919500 Cedar Creek near Pleasant View, Missouri
10 74 4/30/2017 24.81 21,000 13.5% 7 9.6% 17.1% 9,880 8,640 11,300 17,500 15,200 20,000 23,200 20,100 26,800 31,400 26,700 36,900 37,900 31,600 45,500 44,900 36,600 55,000 52,400 41,900 65,500 61,900 48,000 79,900
13 06919900 Sac River near Caplinger Mills, Missouri5
6 43 4/30/2017 28.39 33,300 14.1% 7 8.7% 18.5% 15,300 11,900 19,300 27,900 22,200 36,500 37,500 29,400 52,000 50,700 38,600 77,600 61,000 44,900 101,000 71,700 50,600 130,000 82,800 55,900 163,000 97,900 62,200 217,000
14 06921070 Pomme de Terre River near Polk, Missouri
3 49 4/30/2017 24.68 27,600 5.4% 18 2.9% 9.1% 13,400 11,900 15,100 19,800 17,600 22,200 23,900 20,900 27,200 28,900 24,900 33,500 32,600 27,600 38,600 36,400 30,100 43,900 40,300 32,700 49,500 45,300 35,800 57,300
15 06923500 Bennett Spring at Bennett Springs, Missouri6
7 54 4/30/2017 7.46 4,010 9.4% 11 8.4% 17.0% 1,310 1,040 1,620 2,700 2,160 3,420 3,920 3,090 5,230 5,800 4,410 8,560 7,470 5,460 12,000 9,360 6,540 16,500 11,500 7,660 22,400 14,700 9,160 32,800
16 06927000 Maries River at Westphalia, Missouri
6 63 4/30/2017 21.00 27,400 7.5% 13 5.9% 12.8% 12,800 11,400 14,300 19,800 17,600 22,400 24,900 21,600 28,600 31,500 26,700 37,100 36,700 30,400 44,300 41,900 34,000 51,800 47,400 37,600 59,700 54,900 42,000 71,700
17 06928000 Gasconade River near Hazelgreen, Missouri
1 73 4/30/2017 39.74 119,000 1.4% 73 0.2% 2.4% 25,000 21,300 29,400 48,000 41,200 56,000 65,600 56,000 76,900 89,500 74,800 107,000 108,000 87,900 132,000 126,000 100,000 158,000 145,000 113,000 186,000 170,000 128,000 226,000
18 06930000 Big Piney River near Big Piney, Missouri
1 88 4/30/2017 30.67 90,200 0.22% 453 0.2% 2.0% 13,300 11,500 15,400 25,100 21,700 29,000 34,300 29,300 40,200 47,000 39,200 56,400 57,000 46,400 70,000 67,100 53,300 84,400 77,300 60,100 99,300 91,300 68,500 122,000
19 06933500 Gasconade River at Jerome, Missouri
1 99 5/1/2017 35.06 197,000 0.47% 215 0.2% 1.8% 30,400 26,800 34,400 57,100 50,500 64,500 78,700 68,700 90,100 110,000 94,000 130,000 137,000 113,000 165,000 164,000 132,000 203,000 193,000 153,000 244,000 232,000 177,000 304,000
20 06934000 Gasconade River near Rich Fountain, Missouri
1 78 5/2/2017 37.46 190,000 0.54% 186 0.2% 2.3% 34,000 29,800 38,900 61,400 53,800 70,000 82,900 71,800 95,700 114,000 96,400 134,000 139,000 115,000 167,000 165,000 133,000 203,000 192,000 152,000 242,000 229,000 175,000 299,000
21 07010350 Meramec River at Cook Station, Missouri
3 26 4/30/2017 16.90 26,200 5.7% 17 5.5% 16.7% 6,750 4,980 9,150 14,500 11,100 19,000 20,700 15,700 27,300 28,800 21,700 38,300 35,100 26,000 47,300 41,200 30,200 56,300 47,300 34,300 65,400 55,900 39,100 79,800
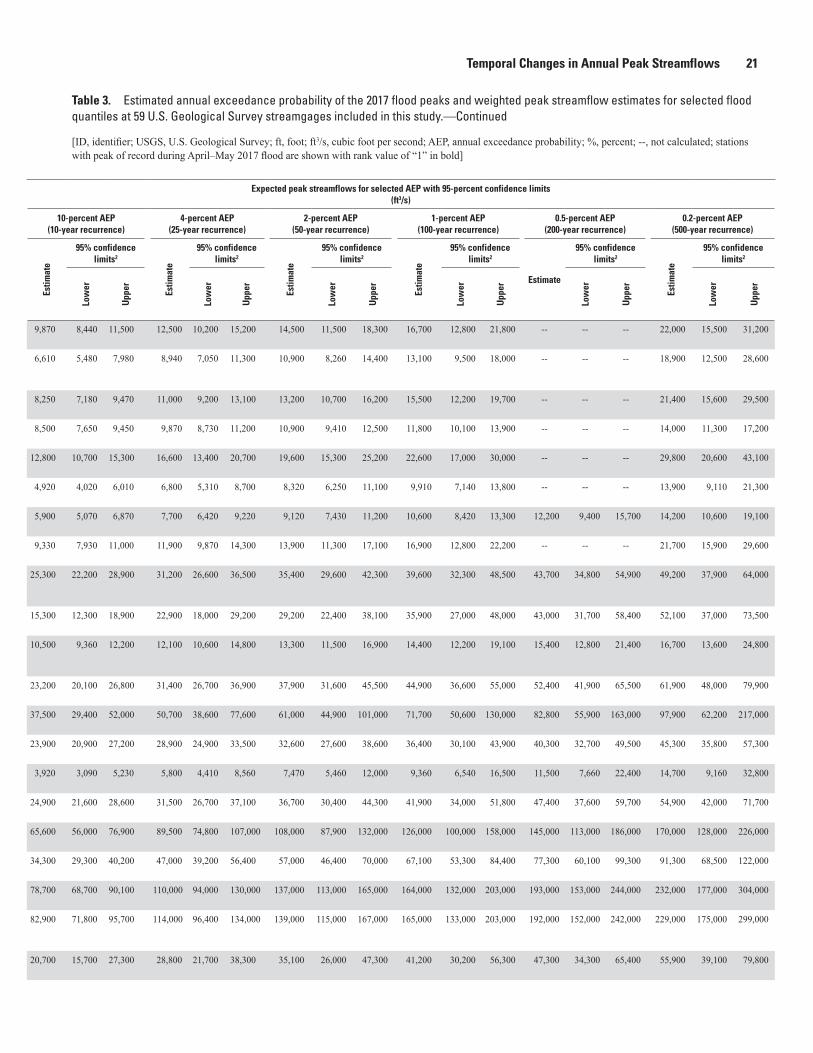
Temporal Changes in Annual Peak Streamflows 21
Table 3. Estimated annual exceedance probability of the 2017 flood peaks and weighted peak streamflow estimates for selected flood quantiles at 59 U.S. Geological Survey streamgages included in this study.
[ID, identifier; USGS, U.S. Geological Survey; AEP, annual exceedance probability; ft, foot; ft3/s, cubic foot per second; %, percent; --, not calculated; stations with peak of record during April–May 2017 flood are shown with rank value of “1” in bold]
Map
ID (f
ig. 2
)
USGS
stre
amga
ge n
umbe
r
USGS
stre
amga
ge n
ame 2017 flood peak AEP for observed 2017 flood
Expected peak streamflows for selected AEP with 95-percent confidence limits (ft3/s)
Expected peak streamflows for selected AEP with 95-percent confidence limits (ft3/s)
50-percent AEP (2-year recurrence)
20-percent AEP (5-year recurrence)
10-percent AEP (10-year recurrence)
4-percent AEP (25-year recurrence)
2-percent AEP (50-year recurrence)
1-percent AEP (100-year recurrence)
0.5-percent AEP (200-year recurrence)
0.2-percent AEP (500-year recurrence)
Rank
Num
ber o
f ann
ual
peak
s in
ana
lysi
s
Date
of p
eak
stre
amflo
w
Peak
sta
ge (f
t)
Peak
stre
amflo
w
(ft3 /s
)
AEP
estim
ate
Recu
rren
ce
inte
rval
(yea
rs) 67% confidence
interval1
Estim
ate
95% confidence limits2
Estim
ate
95% confidence limits2
Estim
ate
95% confidence limits2
Estim
ate
95% confidence limits2
Estim
ate
95% confidence limits2
Estim
ate
95% confidence limits2
Estimate
95% confidence limits2
Estim
ate
95% confidence limits2
Low
er
Uppe
r
Low
er
Uppe
r
Low
er
Uppe
r
Low
er
Uppe
r
Low
er
Uppe
r
Low
er
Uppe
r
Low
er
Uppe
r
Low
er
Uppe
r
Low
er
Uppe
r
1 03378550 Big Creek near Wadesville, Indiana
1 52 4/29/2017 21.23 19,000 0.83% 123 0.4% 3.4% 5,270 4,710 5,890 7,920 6,930 9,050 9,870 8,440 11,500 12,500 10,200 15,200 14,500 11,500 18,300 16,700 12,800 21,800 -- -- -- 22,000 15,500 31,200
2 03382100 South Fork Saline River near Carrier Mills, Illinois
2 52 4/30/2017 17.14 12,200 1.4% 72 1.4% 6.1% 3,100 2,720 3,520 5,030 4,310 5,880 6,610 5,480 7,980 8,940 7,050 11,300 10,900 8,260 14,400 13,100 9,500 18,000 -- -- -- 18,900 12,500 28,600
3 03612000 Cache River at Forman, Illinois3
3 95 5/2/2017 36.55 11,200 3.8% 27 1.5% 4.7% 3,810 3,430 4,230 6,320 5,620 7,100 8,250 7,180 9,470 11,000 9,200 13,100 13,200 10,700 16,200 15,500 12,200 19,700 -- -- -- 21,400 15,600 29,500
4 05587900 Cahokia Creek at Edwardsville, Illinois
3 49 5/1/2017 23.08 9,090 7.3% 14 2.9% 9.1% 5,470 5,030 5,950 7,350 6,700 8,050 8,500 7,650 9,450 9,870 8,730 11,200 10,900 9,410 12,500 11,800 10,100 13,900 -- -- -- 14,000 11,300 17,200
5 05595200 Richland Creek near Heckler, Illinois
3 48 4/30/2017 43.06 16,000 4.9% 20 2.9% 9.2% 5,900 5,070 6,870 9,920 8,460 11,600 12,800 10,700 15,300 16,600 13,400 20,700 19,600 15,300 25,200 22,600 17,000 30,000 -- -- -- 29,800 20,600 43,100
6 05597500 Crab Orchard Creek near Marion, Illinois
1 66 4/29/2017 13.84 10,300 0.91% 110 0.3% 2.7% 1,950 1,670 2,260 3,600 3,030 4,270 4,920 4,020 6,010 6,800 5,310 8,700 8,320 6,250 11,100 9,910 7,140 13,800 -- -- -- 13,900 9,110 21,300
7 06909500 Moniteau Creek near Fayette, Missouri
15 60 4/30/2017 19.71 4,010 27.9% 4 19.3% 29.9% 2,830 2,500 3,200 4,600 4,010 5,270 5,900 5,070 6,870 7,700 6,420 9,220 9,120 7,430 11,200 10,600 8,420 13,300 12,200 9,400 15,700 14,200 10,600 19,100
8 06910230 Hinkson Creek at Columbia, Missouri4
6 31 4/29/2017 19.21 9,300 10.1% 10 12.1% 25.3% 4,560 3,880 5,360 7,400 6,360 8,610 9,330 7,930 11,000 11,900 9,870 14,300 13,900 11,300 17,100 16,900 12,800 22,200 -- -- -- 21,700 15,900 29,600
9 06910750 Moreau River near Jefferson City, Missouri
2 58 5/1/2017 33.57 32,900 3.1% 32 1.3% 5.5% 13,600 12,100 15,300 20,600 18,300 23,300 25,300 22,200 28,900 31,200 26,600 36,500 35,400 29,600 42,300 39,600 32,300 48,500 43,700 34,800 54,900 49,200 37,900 64,000
10 06918440 Sac River near Dadeville, Missouri
4 53 4/30/2017 21.85 18,400 7.3% 14 4.1% 10.7% 5,270 4,420 6,290 10,500 8,650 12,800 15,300 12,300 18,900 22,900 18,000 29,200 29,200 22,400 38,100 35,900 27,000 48,000 43,000 31,700 58,400 52,100 37,000 73,500
11 06919020 Sac River at Highway J below Stockton, Missouri5
4 44 4/30/2017 22.36 11,400 6.6% 15 4.9% 12.8% 6,860 6,120 7,650 9,120 8,180 10,400 10,500 9,360 12,200 12,100 10,600 14,800 13,300 11,500 16,900 14,400 12,200 19,100 15,400 12,800 21,400 16,700 13,600 24,800
12 06919500 Cedar Creek near Pleasant View, Missouri
10 74 4/30/2017 24.81 21,000 13.5% 7 9.6% 17.1% 9,880 8,640 11,300 17,500 15,200 20,000 23,200 20,100 26,800 31,400 26,700 36,900 37,900 31,600 45,500 44,900 36,600 55,000 52,400 41,900 65,500 61,900 48,000 79,900
13 06919900 Sac River near Caplinger Mills, Missouri5
6 43 4/30/2017 28.39 33,300 14.1% 7 8.7% 18.5% 15,300 11,900 19,300 27,900 22,200 36,500 37,500 29,400 52,000 50,700 38,600 77,600 61,000 44,900 101,000 71,700 50,600 130,000 82,800 55,900 163,000 97,900 62,200 217,000
14 06921070 Pomme de Terre River near Polk, Missouri
3 49 4/30/2017 24.68 27,600 5.4% 18 2.9% 9.1% 13,400 11,900 15,100 19,800 17,600 22,200 23,900 20,900 27,200 28,900 24,900 33,500 32,600 27,600 38,600 36,400 30,100 43,900 40,300 32,700 49,500 45,300 35,800 57,300
15 06923500 Bennett Spring at Bennett Springs, Missouri6
7 54 4/30/2017 7.46 4,010 9.4% 11 8.4% 17.0% 1,310 1,040 1,620 2,700 2,160 3,420 3,920 3,090 5,230 5,800 4,410 8,560 7,470 5,460 12,000 9,360 6,540 16,500 11,500 7,660 22,400 14,700 9,160 32,800
16 06927000 Maries River at Westphalia, Missouri
6 63 4/30/2017 21.00 27,400 7.5% 13 5.9% 12.8% 12,800 11,400 14,300 19,800 17,600 22,400 24,900 21,600 28,600 31,500 26,700 37,100 36,700 30,400 44,300 41,900 34,000 51,800 47,400 37,600 59,700 54,900 42,000 71,700
17 06928000 Gasconade River near Hazelgreen, Missouri
1 73 4/30/2017 39.74 119,000 1.4% 73 0.2% 2.4% 25,000 21,300 29,400 48,000 41,200 56,000 65,600 56,000 76,900 89,500 74,800 107,000 108,000 87,900 132,000 126,000 100,000 158,000 145,000 113,000 186,000 170,000 128,000 226,000
18 06930000 Big Piney River near Big Piney, Missouri
1 88 4/30/2017 30.67 90,200 0.22% 453 0.2% 2.0% 13,300 11,500 15,400 25,100 21,700 29,000 34,300 29,300 40,200 47,000 39,200 56,400 57,000 46,400 70,000 67,100 53,300 84,400 77,300 60,100 99,300 91,300 68,500 122,000
19 06933500 Gasconade River at Jerome, Missouri
1 99 5/1/2017 35.06 197,000 0.47% 215 0.2% 1.8% 30,400 26,800 34,400 57,100 50,500 64,500 78,700 68,700 90,100 110,000 94,000 130,000 137,000 113,000 165,000 164,000 132,000 203,000 193,000 153,000 244,000 232,000 177,000 304,000
20 06934000 Gasconade River near Rich Fountain, Missouri
1 78 5/2/2017 37.46 190,000 0.54% 186 0.2% 2.3% 34,000 29,800 38,900 61,400 53,800 70,000 82,900 71,800 95,700 114,000 96,400 134,000 139,000 115,000 167,000 165,000 133,000 203,000 192,000 152,000 242,000 229,000 175,000 299,000
21 07010350 Meramec River at Cook Station, Missouri
3 26 4/30/2017 16.90 26,200 5.7% 17 5.5% 16.7% 6,750 4,980 9,150 14,500 11,100 19,000 20,700 15,700 27,300 28,800 21,700 38,300 35,100 26,000 47,300 41,200 30,200 56,300 47,300 34,300 65,400 55,900 39,100 79,800
Table 3. Estimated annual exceedance probability of the 2017 flood peaks and weighted peak streamflow estimates for selected flood quantiles at 59 U.S. Geological Survey streamgages included in this study.—Continued
[ID, identifier; USGS, U.S. Geological Survey; ft, foot; ft3/s, cubic foot per second; AEP, annual exceedance probability; %, percent; --, not calculated; stations with peak of record during April–May 2017 flood are shown with rank value of “1” in bold]

22 Flooding in the Southern Midwestern United States, April–May 2017M
ap ID
(fig
. 2)
USGS
stre
amga
ge n
umbe
r
USGS
stre
amga
ge n
ame 2017 flood peak AEP for observed 2017 flood
Expected peak streamflows for selected AEP with 95-percent confidence limits (ft3/s)
Expected peak streamflows for selected AEP with 95-percent confidence limits (ft3/s)
50-percent AEP (2-year recurrence)
20-percent AEP (5-year recurrence)
10-percent AEP (10-year recurrence)
4-percent AEP (25-year recurrence)
2-percent AEP (50-year recurrence)
1-percent AEP (100-year recurrence)
0.5-percent AEP (200-year recurrence)
0.2-percent AEP (500-year recurrence)
Rank
Num
ber o
f ann
ual
peak
s in
ana
lysi
s
Date
of p
eak
stre
amflo
w
Peak
sta
ge (f
t)
Peak
stre
amflo
w
(ft3 /s
)
AEP
estim
ate
Recu
rren
ce
inte
rval
(yea
rs) 67% confidence
interval1
Estim
ate
95% confidence limits2
Estim
ate
95% confidence limits2
Estim
ate
95% confidence limits2
Estim
ate
95% confidence limits2
Estim
ate
95% confidence limits2
Estim
ate
95% confidence limits2
Estimate
95% confidence limits2
Estim
ate
95% confidence limits2
Low
er
Uppe
r
Low
er
Uppe
r
Low
er
Uppe
r
Low
er
Uppe
r
Low
er
Uppe
r
Low
er
Uppe
r
Low
er
Uppe
r
Low
er
Uppe
r
Low
er
Uppe
r
22 07013000 Meramec River near Steelville, Missouri
1 102 4/30/2017 28.71 62,200 2.0% 49 0.2% 1.7% 15,400 13,600 17,400 28,100 24,700 32,100 38,000 32,900 43,800 51,600 43,800 60,900 62,400 51,700 75,400 73,600 59,500 91,000 85,200 67,300 108,000 101,000 76,800 132,000
23 07014500 Meramec River near Sullivan, Missouri
1 87 4/30/2017 36.38 95,300 1.2% 84 0.2% 2.0% 21,600 19,000 24,500 38,100 33,600 43,300 50,800 44,200 58,400 68,700 58,600 80,600 83,000 69,400 99,300 98,400 80,400 120,000 115,000 92,000 144,000 136,000 105,000 176,000
24 07016500 Bourbeuse River at Union, Missouri
5 104 5/2/2017 29.38 43,800 3.2% 31 2.8% 6.7% 15,200 13,900 16,700 24,200 22,000 26,700 31,100 27,700 34,900 40,800 35,400 46,900 48,600 41,300 57,100 56,900 47,300 68,400 65,800 53,500 80,900 77,900 61,300 99,000
25 07018100 Big River near Richwoods, Missouri
1 68 4/30/2017 33.54 66,900 1.8% 55 0.3% 2.6% 18,800 16,400 21,500 32,200 28,200 36,700 41,900 36,400 48,200 54,900 46,700 64,600 65,000 54,200 77,900 75,200 61,400 92,200 85,800 68,600 107,000 99,800 77,100 129,000
26 07018500 Big River at Byrnesville, Missouri
3 96 5/1/2017 30.09 62,600 1.6% 62 1.5% 4.7% 17,200 15,400 19,300 29,200 26,000 32,900 38,000 33,500 43,100 49,800 42,900 57,900 59,100 49,700 70,300 68,600 56,400 83,400 78,600 63,200 97,700 91,700 71,400 118,000
27 07019000 Meramec River at Eureka, Missouri
2 100 5/2/2017 46.11 169,000 1.1% 87 0.7% 3.2% 40,800 36,700 45,400 69,100 61,800 77,200 90,500 80,200 102,000 121,000 105,000 140,000 146,000 124,000 173,000 173,000 143,000 210,000 202,000 163,000 251,000 240,000 188,000 308,000
28 07021000 Castor River at Zalma, Missouri3
3 88 4/30/2017 29.00 69,700 0.93% 107 1.6% 5.1% 11,900 10,300 13,800 23,700 20,300 27,600 33,400 28,200 39,500 47,000 38,600 57,300 57,700 46,200 72,200 68,400 53,400 87,600 78,900 60,300 103,000 94,100 69,300 128,000
29 07035800 St. Francis River near Mill Creek, Missouri
2 29 4/30/2017 27.32 69,300 2.7% 37 2.5% 10.7% 23,900 19,800 28,900 39,300 32,600 47,400 49,700 40,600 60,900 62,900 50,300 78,600 73,100 57,200 93,300 83,100 63,800 108,000 93,300 70,400 124,000 108,000 78,500 148,000
30 07036100 St. Fancis River near Saco, Missouri
2 26 4/30/2017 33.42 110,000 0.50% 202 2.8% 11.9% 34,500 28,900 41,300 52,900 44,300 63,100 64,500 53,300 78,100 78,200 63,300 96,700 88,800 70,300 112,000 99,200 77,100 128,000 110,000 83,900 144,000 125,000 92,400 169,000
31 07037500 St. Francis River near Patterson, Missouri
3 96 4/30/2017 37.13 126,000 0.50% 191 1.5% 4.7% 33,800 30,700 37,400 53,300 48,000 59,200 67,100 59,700 75,300 84,900 73,700 97,800 98,700 83,900 116,000 113,000 93,600 135,000 127,000 103,000 156,000 146,000 115,000 186,000
32 07043500 Little River Ditch No. 1 near Morehouse, Missouri
10 69 5/1/2017 18.99 9,500 11.5% 9 10.3% 18.3% 6,430 5,970 6,940 8,500 7,890 9,160 9,690 8,910 10,500 11,000 9,970 12,100 11,900 10,600 13,200 12,600 11,200 14,300 13,300 11,600 15,400 14,300 12,100 16,800
33 07050700 James River near Springfield, Missouri3
4 63 4/30/2017 20.90 38,100 3.1% 32 3.4% 9.0% 12,500 10,800 14,400 21,300 18,400 24,600 27,500 23,500 32,100 35,500 29,900 42,100 41,600 34,400 50,200 47,600 38,700 58,600 53,700 42,900 67,300 62,000 48,000 80,100
34 07052100 Wilson Creek near Springfield, Missouri4
6 29 4/29/2017 9.15 4,220 20.1% 5 13.0% 26.9% 2,920 2,550 3,340 4,220 3,700 4,820 5,180 4,490 5,980 6,480 5,510 7,620 7,640 6,370 9,160 8,800 7,200 10,800 -- -- -- 11,800 9,210 15,100
35 07052500 James River at Galena, Missouri
2 96 4/30/2017 35.97 82,800 1.5% 67 0.8% 3.3% 20,700 18,300 23,500 36,400 32,200 41,100 48,100 42,000 55,000 64,100 54,700 75,200 76,600 63,900 91,900 89,600 73,100 110,000 103,000 82,300 129,000 121,000 93,200 157,000
36 07055607 Crooked Creek at Kelly Crossing at Yellville, Arkansas
1 33 4/30/2017 31.87 95,200 0.70% 143 0.6% 5.3% 10,100 7,760 13,200 22,900 17,400 30,200 34,200 25,600 45,800 51,500 38,000 69,800 66,000 47,900 91,100 81,600 58,400 114,000 -- -- -- 123,000 83,900 180,000
37 07057500 North Fork River near Tecumseh, Missouri
1 73 4/29/2017 41.82 189,000 <0.20% >500 0.2% 2.4% 13,200 11,200 15,600 26,800 22,400 32,000 38,500 31,500 47,100 55,700 44,200 70,100 69,300 53,600 89,600 83,000 62,800 110,000 96,900 71,900 131,000 116,000 83,200 163,000
38 07058000 Bryant Creek near Tecumseh, Missouri
1 63 4/29/2017 33.07 111,000 <0.20% >500 0.3% 2.8% 12,600 10,500 15,200 25,400 21,300 30,300 35,700 29,600 43,200 50,400 40,700 62,300 61,700 48,800 78,100 73,300 56,600 94,900 85,000 64,400 112,000 101,000 73,600 138,000
39 07061500 Black River near Annapolis, Missouri5
3 55 4/30/2017 23.30 71,200 4.9% 20 2.6% 8.1% 23,100 11,800 27,200 41,300 33,100 53,200 55,200 44,900 79,000 74,500 57,000 136,000 89,900 65,900 212,000 106,000 74,700 311,000 123,000 83,200 422,000 147,000 94,400 613,000
40 07063000 Black River at Poplar Bluff, Missouri5
3 70 5/1/2017 21.96 29,700 37.1% 3 2.0% 6.4% 8,040 6,940 9,340 13,500 11,500 16,400 17,800 14,900 23,100 24,300 19,600 34,900 29,900 23,200 46,800 36,100 27,000 62,100 43,000 31,000 81,600 53,400 36,400 116,000
41 07066000 Jacks Fork at Eminence, Missouri
1 96 4/30/2017 27.72 106,000 0.20% 500 0.2% 1.8% 12,600 10,700 14,800 25,700 22,000 30,100 35,900 30,300 42,500 49,400 40,900 59,600 59,700 48,400 73,500 69,700 55,400 87,700 79,400 61,800 102,000 93,000 69,900 124,000
42 07067000 Current River at Van Buren, Missouri
1 106 4/30/2017 37.42 179,000 0.47% 213 0.2% 1.7% 27,800 24,300 31,700 53,400 46,600 61,200 73,900 63,700 85,600 103,000 86,800 123,000 127,000 104,000 154,000 151,000 121,000 189,000 176,000 138,000 225,000 209,000 158,000 277,000
43 07068000 Current River at Doniphan, Missouri
1 101 5/1/2017 33.13 183,000 0.37% 274 0.2% 1.8% 28,300 24,500 32,700 55,300 48,100 63,700 76,000 65,300 88,400 104,000 87,900 124,000 126,000 104,000 153,000 148,000 119,000 183,000 170,000 134,000 216,000 200,000 152,000 262,000
Table 3. Estimated annual exceedance probability of the 2017 flood peaks and weighted peak streamflow estimates for selected flood quantiles at 59 U.S. Geological Survey streamgages included in this study.—Continued
[ID, identifier; USGS, U.S. Geological Survey; ft, foot; ft3/s, cubic foot per second; AEP, annual exceedance probability; %, percent; --, not calculated; stations with peak of record during April–May 2017 flood are shown with rank value of “1” in bold]

Temporal Changes in Annual Peak Streamflows 23
Map
ID (f
ig. 2
)
USGS
stre
amga
ge n
umbe
r
USGS
stre
amga
ge n
ame 2017 flood peak AEP for observed 2017 flood
Expected peak streamflows for selected AEP with 95-percent confidence limits (ft3/s)
Expected peak streamflows for selected AEP with 95-percent confidence limits (ft3/s)
50-percent AEP (2-year recurrence)
20-percent AEP (5-year recurrence)
10-percent AEP (10-year recurrence)
4-percent AEP (25-year recurrence)
2-percent AEP (50-year recurrence)
1-percent AEP (100-year recurrence)
0.5-percent AEP (200-year recurrence)
0.2-percent AEP (500-year recurrence)
Rank
Num
ber o
f ann
ual
peak
s in
ana
lysi
s
Date
of p
eak
stre
amflo
w
Peak
sta
ge (f
t)
Peak
stre
amflo
w
(ft3 /s
)
AEP
estim
ate
Recu
rren
ce
inte
rval
(yea
rs) 67% confidence
interval1
Estim
ate
95% confidence limits2
Estim
ate
95% confidence limits2
Estim
ate
95% confidence limits2
Estim
ate
95% confidence limits2
Estim
ate
95% confidence limits2
Estim
ate
95% confidence limits2
Estimate
95% confidence limits2
Estim
ate
95% confidence limits2
Low
er
Uppe
r
Low
er
Uppe
r
Low
er
Uppe
r
Low
er
Uppe
r
Low
er
Uppe
r
Low
er
Uppe
r
Low
er
Uppe
r
Low
er
Uppe
r
Low
er
Uppe
r
22 07013000 Meramec River near Steelville, Missouri
1 102 4/30/2017 28.71 62,200 2.0% 49 0.2% 1.7% 15,400 13,600 17,400 28,100 24,700 32,100 38,000 32,900 43,800 51,600 43,800 60,900 62,400 51,700 75,400 73,600 59,500 91,000 85,200 67,300 108,000 101,000 76,800 132,000
23 07014500 Meramec River near Sullivan, Missouri
1 87 4/30/2017 36.38 95,300 1.2% 84 0.2% 2.0% 21,600 19,000 24,500 38,100 33,600 43,300 50,800 44,200 58,400 68,700 58,600 80,600 83,000 69,400 99,300 98,400 80,400 120,000 115,000 92,000 144,000 136,000 105,000 176,000
24 07016500 Bourbeuse River at Union, Missouri
5 104 5/2/2017 29.38 43,800 3.2% 31 2.8% 6.7% 15,200 13,900 16,700 24,200 22,000 26,700 31,100 27,700 34,900 40,800 35,400 46,900 48,600 41,300 57,100 56,900 47,300 68,400 65,800 53,500 80,900 77,900 61,300 99,000
25 07018100 Big River near Richwoods, Missouri
1 68 4/30/2017 33.54 66,900 1.8% 55 0.3% 2.6% 18,800 16,400 21,500 32,200 28,200 36,700 41,900 36,400 48,200 54,900 46,700 64,600 65,000 54,200 77,900 75,200 61,400 92,200 85,800 68,600 107,000 99,800 77,100 129,000
26 07018500 Big River at Byrnesville, Missouri
3 96 5/1/2017 30.09 62,600 1.6% 62 1.5% 4.7% 17,200 15,400 19,300 29,200 26,000 32,900 38,000 33,500 43,100 49,800 42,900 57,900 59,100 49,700 70,300 68,600 56,400 83,400 78,600 63,200 97,700 91,700 71,400 118,000
27 07019000 Meramec River at Eureka, Missouri
2 100 5/2/2017 46.11 169,000 1.1% 87 0.7% 3.2% 40,800 36,700 45,400 69,100 61,800 77,200 90,500 80,200 102,000 121,000 105,000 140,000 146,000 124,000 173,000 173,000 143,000 210,000 202,000 163,000 251,000 240,000 188,000 308,000
28 07021000 Castor River at Zalma, Missouri3
3 88 4/30/2017 29.00 69,700 0.93% 107 1.6% 5.1% 11,900 10,300 13,800 23,700 20,300 27,600 33,400 28,200 39,500 47,000 38,600 57,300 57,700 46,200 72,200 68,400 53,400 87,600 78,900 60,300 103,000 94,100 69,300 128,000
29 07035800 St. Francis River near Mill Creek, Missouri
2 29 4/30/2017 27.32 69,300 2.7% 37 2.5% 10.7% 23,900 19,800 28,900 39,300 32,600 47,400 49,700 40,600 60,900 62,900 50,300 78,600 73,100 57,200 93,300 83,100 63,800 108,000 93,300 70,400 124,000 108,000 78,500 148,000
30 07036100 St. Fancis River near Saco, Missouri
2 26 4/30/2017 33.42 110,000 0.50% 202 2.8% 11.9% 34,500 28,900 41,300 52,900 44,300 63,100 64,500 53,300 78,100 78,200 63,300 96,700 88,800 70,300 112,000 99,200 77,100 128,000 110,000 83,900 144,000 125,000 92,400 169,000
31 07037500 St. Francis River near Patterson, Missouri
3 96 4/30/2017 37.13 126,000 0.50% 191 1.5% 4.7% 33,800 30,700 37,400 53,300 48,000 59,200 67,100 59,700 75,300 84,900 73,700 97,800 98,700 83,900 116,000 113,000 93,600 135,000 127,000 103,000 156,000 146,000 115,000 186,000
32 07043500 Little River Ditch No. 1 near Morehouse, Missouri
10 69 5/1/2017 18.99 9,500 11.5% 9 10.3% 18.3% 6,430 5,970 6,940 8,500 7,890 9,160 9,690 8,910 10,500 11,000 9,970 12,100 11,900 10,600 13,200 12,600 11,200 14,300 13,300 11,600 15,400 14,300 12,100 16,800
33 07050700 James River near Springfield, Missouri3
4 63 4/30/2017 20.90 38,100 3.1% 32 3.4% 9.0% 12,500 10,800 14,400 21,300 18,400 24,600 27,500 23,500 32,100 35,500 29,900 42,100 41,600 34,400 50,200 47,600 38,700 58,600 53,700 42,900 67,300 62,000 48,000 80,100
34 07052100 Wilson Creek near Springfield, Missouri4
6 29 4/29/2017 9.15 4,220 20.1% 5 13.0% 26.9% 2,920 2,550 3,340 4,220 3,700 4,820 5,180 4,490 5,980 6,480 5,510 7,620 7,640 6,370 9,160 8,800 7,200 10,800 -- -- -- 11,800 9,210 15,100
35 07052500 James River at Galena, Missouri
2 96 4/30/2017 35.97 82,800 1.5% 67 0.8% 3.3% 20,700 18,300 23,500 36,400 32,200 41,100 48,100 42,000 55,000 64,100 54,700 75,200 76,600 63,900 91,900 89,600 73,100 110,000 103,000 82,300 129,000 121,000 93,200 157,000
36 07055607 Crooked Creek at Kelly Crossing at Yellville, Arkansas
1 33 4/30/2017 31.87 95,200 0.70% 143 0.6% 5.3% 10,100 7,760 13,200 22,900 17,400 30,200 34,200 25,600 45,800 51,500 38,000 69,800 66,000 47,900 91,100 81,600 58,400 114,000 -- -- -- 123,000 83,900 180,000
37 07057500 North Fork River near Tecumseh, Missouri
1 73 4/29/2017 41.82 189,000 <0.20% >500 0.2% 2.4% 13,200 11,200 15,600 26,800 22,400 32,000 38,500 31,500 47,100 55,700 44,200 70,100 69,300 53,600 89,600 83,000 62,800 110,000 96,900 71,900 131,000 116,000 83,200 163,000
38 07058000 Bryant Creek near Tecumseh, Missouri
1 63 4/29/2017 33.07 111,000 <0.20% >500 0.3% 2.8% 12,600 10,500 15,200 25,400 21,300 30,300 35,700 29,600 43,200 50,400 40,700 62,300 61,700 48,800 78,100 73,300 56,600 94,900 85,000 64,400 112,000 101,000 73,600 138,000
39 07061500 Black River near Annapolis, Missouri5
3 55 4/30/2017 23.30 71,200 4.9% 20 2.6% 8.1% 23,100 11,800 27,200 41,300 33,100 53,200 55,200 44,900 79,000 74,500 57,000 136,000 89,900 65,900 212,000 106,000 74,700 311,000 123,000 83,200 422,000 147,000 94,400 613,000
40 07063000 Black River at Poplar Bluff, Missouri5
3 70 5/1/2017 21.96 29,700 37.1% 3 2.0% 6.4% 8,040 6,940 9,340 13,500 11,500 16,400 17,800 14,900 23,100 24,300 19,600 34,900 29,900 23,200 46,800 36,100 27,000 62,100 43,000 31,000 81,600 53,400 36,400 116,000
41 07066000 Jacks Fork at Eminence, Missouri
1 96 4/30/2017 27.72 106,000 0.20% 500 0.2% 1.8% 12,600 10,700 14,800 25,700 22,000 30,100 35,900 30,300 42,500 49,400 40,900 59,600 59,700 48,400 73,500 69,700 55,400 87,700 79,400 61,800 102,000 93,000 69,900 124,000
42 07067000 Current River at Van Buren, Missouri
1 106 4/30/2017 37.42 179,000 0.47% 213 0.2% 1.7% 27,800 24,300 31,700 53,400 46,600 61,200 73,900 63,700 85,600 103,000 86,800 123,000 127,000 104,000 154,000 151,000 121,000 189,000 176,000 138,000 225,000 209,000 158,000 277,000
43 07068000 Current River at Doniphan, Missouri
1 101 5/1/2017 33.13 183,000 0.37% 274 0.2% 1.8% 28,300 24,500 32,700 55,300 48,100 63,700 76,000 65,300 88,400 104,000 87,900 124,000 126,000 104,000 153,000 148,000 119,000 183,000 170,000 134,000 216,000 200,000 152,000 262,000
Table 3. Estimated annual exceedance probability of the 2017 flood peaks and weighted peak streamflow estimates for selected flood quantiles at 59 U.S. Geological Survey streamgages included in this study.—Continued
[ID, identifier; USGS, U.S. Geological Survey; ft, foot; ft3/s, cubic foot per second; AEP, annual exceedance probability; %, percent; --, not calculated; stations with peak of record during April–May 2017 flood are shown with rank value of “1” in bold]
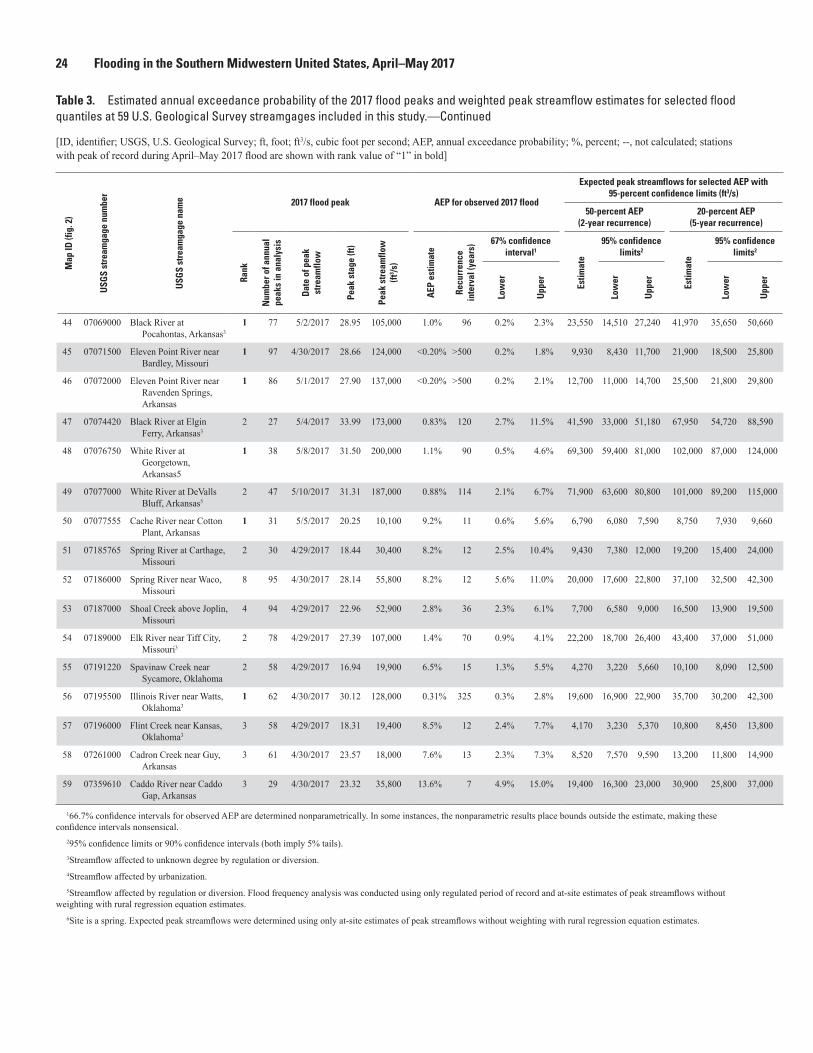
24 Flooding in the Southern Midwestern United States, April–May 2017M
ap ID
(fig
. 2)
USGS
stre
amga
ge n
umbe
r
USGS
stre
amga
ge n
ame 2017 flood peak AEP for observed 2017 flood
Expected peak streamflows for selected AEP with 95-percent confidence limits (ft3/s)
Expected peak streamflows for selected AEP with 95-percent confidence limits (ft3/s)
50-percent AEP (2-year recurrence)
20-percent AEP (5-year recurrence)
10-percent AEP (10-year recurrence)
4-percent AEP (25-year recurrence)
2-percent AEP (50-year recurrence)
1-percent AEP (100-year recurrence)
0.5-percent AEP (200-year recurrence)
0.2-percent AEP (500-year recurrence)
Rank
Num
ber o
f ann
ual
peak
s in
ana
lysi
s
Date
of p
eak
stre
amflo
w
Peak
sta
ge (f
t)
Peak
stre
amflo
w
(ft3 /s
)
AEP
estim
ate
Recu
rren
ce
inte
rval
(yea
rs) 67% confidence
interval1
Estim
ate
95% confidence limits2
Estim
ate
95% confidence limits2
Estim
ate
95% confidence limits2
Estim
ate
95% confidence limits2
Estim
ate
95% confidence limits2
Estim
ate
95% confidence limits2
Estimate
95% confidence limits2
Estim
ate
95% confidence limits2
Low
er
Uppe
r
Low
er
Uppe
r
Low
er
Uppe
r
Low
er
Uppe
r
Low
er
Uppe
r
Low
er
Uppe
r
Low
er
Uppe
r
Low
er
Uppe
r
Low
er
Uppe
r
44 07069000 Black River at Pocahontas, Arkansas3
1 77 5/2/2017 28.95 105,000 1.0% 96 0.2% 2.3% 23,550 14,510 27,240 41,970 35,650 50,660 55,890 46,590 71,790 74,960 60,050 108,800 90,050 70,120 144,100 105,700 80,070 185,800 122,100 89,880 233,700 144,700 102,600 306,000
45 07071500 Eleven Point River near Bardley, Missouri
1 97 4/30/2017 28.66 124,000 <0.20% >500 0.2% 1.8% 9,930 8,430 11,700 21,900 18,500 25,800 32,300 27,000 38,700 48,200 39,400 59,100 61,100 48,800 76,500 74,700 58,300 95,700 89,000 68,000 116,000 107,000 79,200 146,000
46 07072000 Eleven Point River near Ravenden Springs, Arkansas
1 86 5/1/2017 27.90 137,000 <0.20% >500 0.2% 2.1% 12,700 11,000 14,700 25,500 21,800 29,800 37,300 31,100 44,700 56,600 45,700 70,200 72,800 57,300 92,600 90,300 69,300 118,000 108,000 81,500 144,000 134,000 96,800 184,000
47 07074420 Black River at Elgin Ferry, Arkansas3
2 27 5/4/2017 33.99 173,000 0.83% 120 2.7% 11.5% 41,590 33,000 51,180 67,950 54,720 88,590 88,090 69,730 123,700 116,400 89,000 184,100 139,600 103,300 243,500 164,400 117,400 317,700 191,200 131,400 410,300 229,700 149,700 568,300
48 07076750 White River at Georgetown, Arkansas5
1 38 5/8/2017 31.50 200,000 1.1% 90 0.5% 4.6% 69,300 59,400 81,000 102,000 87,000 124,000 125,000 105,000 160,000 155,000 127,000 216,000 179,000 142,000 266,000 203,000 158,000 325,000 228,000 172,000 394,000 262,500 190,000 502,000
49 07077000 White River at DeValls Bluff, Arkansas5
2 47 5/10/2017 31.31 187,000 0.88% 114 2.1% 6.7% 71,900 63,600 80,800 101,000 89,200 115,000 120,000 106,000 141,000 145,000 125,000 179,000 164,000 138,000 212,000 183,000 151,000 248,000 202,000 163,000 289,000 227,000 178,000 350,000
50 07077555 Cache River near Cotton Plant, Arkansas
1 31 5/5/2017 20.25 10,100 9.2% 11 0.6% 5.6% 6,790 6,080 7,590 8,750 7,930 9,660 9,920 8,820 11,200 11,300 9,730 13,100 12,200 10,300 14,500 13,100 10,800 16,000 -- -- -- 15,100 11,800 19,400
51 07185765 Spring River at Carthage, Missouri
2 30 4/29/2017 18.44 30,400 8.2% 12 2.5% 10.4% 9,430 7,380 12,000 19,200 15,400 24,000 27,300 21,800 34,300 39,200 30,700 50,200 48,500 37,200 63,300 58,100 43,700 77,300 68,100 50,300 92,200 80,800 57,600 113,000
52 07186000 Spring River near Waco, Missouri
8 95 4/30/2017 28.14 55,800 8.2% 12 5.6% 11.0% 20,000 17,600 22,800 37,100 32,500 42,300 50,500 43,600 58,500 69,900 58,900 83,000 85,600 70,400 104,000 102,000 82,100 127,000 120,000 94,300 152,000 143,000 108,000 188,000
53 07187000 Shoal Creek above Joplin, Missouri
4 94 4/29/2017 22.96 52,900 2.8% 36 2.3% 6.1% 7,700 6,580 9,000 16,500 13,900 19,500 24,400 20,200 29,600 36,800 29,400 46,100 46,900 36,500 60,200 57,300 43,600 75,300 67,900 50,600 91,000 82,300 59,100 115,000
54 07189000 Elk River near Tiff City, Missouri3
2 78 4/29/2017 27.39 107,000 1.4% 70 0.9% 4.1% 22,200 18,700 26,400 43,400 37,000 51,000 59,600 49,600 71,500 81,200 65,900 100,000 98,000 77,900 123,000 114,000 89,200 147,000 132,000 101,000 172,000 154,000 114,000 208,000
55 07191220 Spavinaw Creek near Sycamore, Oklahoma
2 58 4/29/2017 16.94 19,900 6.5% 15 1.3% 5.5% 4,270 3,220 5,660 10,100 8,090 12,500 15,400 12,000 19,800 24,000 17,600 32,800 32,100 22,800 45,200 41,300 28,300 60,300 -- -- -- 67,100 42,000 107,000
56 07195500 Illinois River near Watts, Oklahoma3
1 62 4/30/2017 30.12 128,000 0.31% 325 0.3% 2.8% 19,600 16,900 22,900 35,700 30,200 42,300 48,600 40,100 58,900 67,000 52,800 85,100 81,300 61,700 107,000 96,200 70,200 132,000 -- -- -- 134,000 88,100 203,000
57 07196000 Flint Creek near Kansas, Oklahoma3
3 58 4/29/2017 18.31 19,400 8.5% 12 2.4% 7.7% 4,170 3,230 5,370 10,800 8,450 13,800 17,200 13,300 22,300 27,700 20,300 37,800 37,100 26,300 52,300 48,000 32,700 70,400 -- -- -- 79,200 48,400 130,000
58 07261000 Cadron Creek near Guy, Arkansas
3 61 4/30/2017 23.57 18,000 7.6% 13 2.3% 7.3% 8,520 7,570 9,590 13,200 11,800 14,900 16,400 14,500 18,700 20,600 17,600 24,000 23,700 19,800 28,400 26,900 21,900 33,000 -- -- -- 34,300 26,300 44,900
59 07359610 Caddo River near Caddo Gap, Arkansas
3 29 4/30/2017 23.32 35,800 13.6% 7 4.9% 15.0% 19,400 16,300 23,000 30,900 25,800 37,000 38,900 31,700 47,800 49,400 38,800 63,000 57,300 43,600 75,200 65,400 48,200 88,800 -- -- -- 85,000 58,100 125,000
166.7% confidence intervals for observed AEP are determined nonparametrically. In some instances, the nonparametric results place bounds outside the estimate, making these confidence intervals nonsensical.
295% confidence limits or 90% confidence intervals (both imply 5% tails).3Streamflow affected to unknown degree by regulation or diversion.4Streamflow affected by urbanization.5Streamflow affected by regulation or diversion. Flood frequency analysis was conducted using only regulated period of record and at-site estimates of peak streamflows without
weighting with rural regression equation estimates. 6Site is a spring. Expected peak streamflows were determined using only at-site estimates of peak streamflows without weighting with rural regression equation estimates.
Table 3. Estimated annual exceedance probability of the 2017 flood peaks and weighted peak streamflow estimates for selected flood quantiles at 59 U.S. Geological Survey streamgages included in this study.—Continued
[ID, identifier; USGS, U.S. Geological Survey; ft, foot; ft3/s, cubic foot per second; AEP, annual exceedance probability; %, percent; --, not calculated; stations with peak of record during April–May 2017 flood are shown with rank value of “1” in bold]

Temporal Changes in Annual Peak Streamflows 25
Map
ID (f
ig. 2
)
USGS
stre
amga
ge n
umbe
r
USGS
stre
amga
ge n
ame 2017 flood peak AEP for observed 2017 flood
Expected peak streamflows for selected AEP with 95-percent confidence limits (ft3/s)
Expected peak streamflows for selected AEP with 95-percent confidence limits (ft3/s)
50-percent AEP (2-year recurrence)
20-percent AEP (5-year recurrence)
10-percent AEP (10-year recurrence)
4-percent AEP (25-year recurrence)
2-percent AEP (50-year recurrence)
1-percent AEP (100-year recurrence)
0.5-percent AEP (200-year recurrence)
0.2-percent AEP (500-year recurrence)
Rank
Num
ber o
f ann
ual
peak
s in
ana
lysi
s
Date
of p
eak
stre
amflo
w
Peak
sta
ge (f
t)
Peak
stre
amflo
w
(ft3 /s
)
AEP
estim
ate
Recu
rren
ce
inte
rval
(yea
rs) 67% confidence
interval1
Estim
ate
95% confidence limits2
Estim
ate
95% confidence limits2
Estim
ate
95% confidence limits2
Estim
ate
95% confidence limits2
Estim
ate
95% confidence limits2
Estim
ate
95% confidence limits2
Estimate
95% confidence limits2
Estim
ate
95% confidence limits2
Low
er
Uppe
r
Low
er
Uppe
r
Low
er
Uppe
r
Low
er
Uppe
r
Low
er
Uppe
r
Low
er
Uppe
r
Low
er
Uppe
r
Low
er
Uppe
r
Low
er
Uppe
r
44 07069000 Black River at Pocahontas, Arkansas3
1 77 5/2/2017 28.95 105,000 1.0% 96 0.2% 2.3% 23,550 14,510 27,240 41,970 35,650 50,660 55,890 46,590 71,790 74,960 60,050 108,800 90,050 70,120 144,100 105,700 80,070 185,800 122,100 89,880 233,700 144,700 102,600 306,000
45 07071500 Eleven Point River near Bardley, Missouri
1 97 4/30/2017 28.66 124,000 <0.20% >500 0.2% 1.8% 9,930 8,430 11,700 21,900 18,500 25,800 32,300 27,000 38,700 48,200 39,400 59,100 61,100 48,800 76,500 74,700 58,300 95,700 89,000 68,000 116,000 107,000 79,200 146,000
46 07072000 Eleven Point River near Ravenden Springs, Arkansas
1 86 5/1/2017 27.90 137,000 <0.20% >500 0.2% 2.1% 12,700 11,000 14,700 25,500 21,800 29,800 37,300 31,100 44,700 56,600 45,700 70,200 72,800 57,300 92,600 90,300 69,300 118,000 108,000 81,500 144,000 134,000 96,800 184,000
47 07074420 Black River at Elgin Ferry, Arkansas3
2 27 5/4/2017 33.99 173,000 0.83% 120 2.7% 11.5% 41,590 33,000 51,180 67,950 54,720 88,590 88,090 69,730 123,700 116,400 89,000 184,100 139,600 103,300 243,500 164,400 117,400 317,700 191,200 131,400 410,300 229,700 149,700 568,300
48 07076750 White River at Georgetown, Arkansas5
1 38 5/8/2017 31.50 200,000 1.1% 90 0.5% 4.6% 69,300 59,400 81,000 102,000 87,000 124,000 125,000 105,000 160,000 155,000 127,000 216,000 179,000 142,000 266,000 203,000 158,000 325,000 228,000 172,000 394,000 262,500 190,000 502,000
49 07077000 White River at DeValls Bluff, Arkansas5
2 47 5/10/2017 31.31 187,000 0.88% 114 2.1% 6.7% 71,900 63,600 80,800 101,000 89,200 115,000 120,000 106,000 141,000 145,000 125,000 179,000 164,000 138,000 212,000 183,000 151,000 248,000 202,000 163,000 289,000 227,000 178,000 350,000
50 07077555 Cache River near Cotton Plant, Arkansas
1 31 5/5/2017 20.25 10,100 9.2% 11 0.6% 5.6% 6,790 6,080 7,590 8,750 7,930 9,660 9,920 8,820 11,200 11,300 9,730 13,100 12,200 10,300 14,500 13,100 10,800 16,000 -- -- -- 15,100 11,800 19,400
51 07185765 Spring River at Carthage, Missouri
2 30 4/29/2017 18.44 30,400 8.2% 12 2.5% 10.4% 9,430 7,380 12,000 19,200 15,400 24,000 27,300 21,800 34,300 39,200 30,700 50,200 48,500 37,200 63,300 58,100 43,700 77,300 68,100 50,300 92,200 80,800 57,600 113,000
52 07186000 Spring River near Waco, Missouri
8 95 4/30/2017 28.14 55,800 8.2% 12 5.6% 11.0% 20,000 17,600 22,800 37,100 32,500 42,300 50,500 43,600 58,500 69,900 58,900 83,000 85,600 70,400 104,000 102,000 82,100 127,000 120,000 94,300 152,000 143,000 108,000 188,000
53 07187000 Shoal Creek above Joplin, Missouri
4 94 4/29/2017 22.96 52,900 2.8% 36 2.3% 6.1% 7,700 6,580 9,000 16,500 13,900 19,500 24,400 20,200 29,600 36,800 29,400 46,100 46,900 36,500 60,200 57,300 43,600 75,300 67,900 50,600 91,000 82,300 59,100 115,000
54 07189000 Elk River near Tiff City, Missouri3
2 78 4/29/2017 27.39 107,000 1.4% 70 0.9% 4.1% 22,200 18,700 26,400 43,400 37,000 51,000 59,600 49,600 71,500 81,200 65,900 100,000 98,000 77,900 123,000 114,000 89,200 147,000 132,000 101,000 172,000 154,000 114,000 208,000
55 07191220 Spavinaw Creek near Sycamore, Oklahoma
2 58 4/29/2017 16.94 19,900 6.5% 15 1.3% 5.5% 4,270 3,220 5,660 10,100 8,090 12,500 15,400 12,000 19,800 24,000 17,600 32,800 32,100 22,800 45,200 41,300 28,300 60,300 -- -- -- 67,100 42,000 107,000
56 07195500 Illinois River near Watts, Oklahoma3
1 62 4/30/2017 30.12 128,000 0.31% 325 0.3% 2.8% 19,600 16,900 22,900 35,700 30,200 42,300 48,600 40,100 58,900 67,000 52,800 85,100 81,300 61,700 107,000 96,200 70,200 132,000 -- -- -- 134,000 88,100 203,000
57 07196000 Flint Creek near Kansas, Oklahoma3
3 58 4/29/2017 18.31 19,400 8.5% 12 2.4% 7.7% 4,170 3,230 5,370 10,800 8,450 13,800 17,200 13,300 22,300 27,700 20,300 37,800 37,100 26,300 52,300 48,000 32,700 70,400 -- -- -- 79,200 48,400 130,000
58 07261000 Cadron Creek near Guy, Arkansas
3 61 4/30/2017 23.57 18,000 7.6% 13 2.3% 7.3% 8,520 7,570 9,590 13,200 11,800 14,900 16,400 14,500 18,700 20,600 17,600 24,000 23,700 19,800 28,400 26,900 21,900 33,000 -- -- -- 34,300 26,300 44,900
59 07359610 Caddo River near Caddo Gap, Arkansas
3 29 4/30/2017 23.32 35,800 13.6% 7 4.9% 15.0% 19,400 16,300 23,000 30,900 25,800 37,000 38,900 31,700 47,800 49,400 38,800 63,000 57,300 43,600 75,200 65,400 48,200 88,800 -- -- -- 85,000 58,100 125,000
Table 3. Estimated annual exceedance probability of the 2017 flood peaks and weighted peak streamflow estimates for selected flood quantiles at 59 U.S. Geological Survey streamgages included in this study.—Continued
[ID, identifier; USGS, U.S. Geological Survey; ft, foot; ft3/s, cubic foot per second; AEP, annual exceedance probability; %, percent; --, not calculated; stations with peak of record during April–May 2017 flood are shown with rank value of “1” in bold]
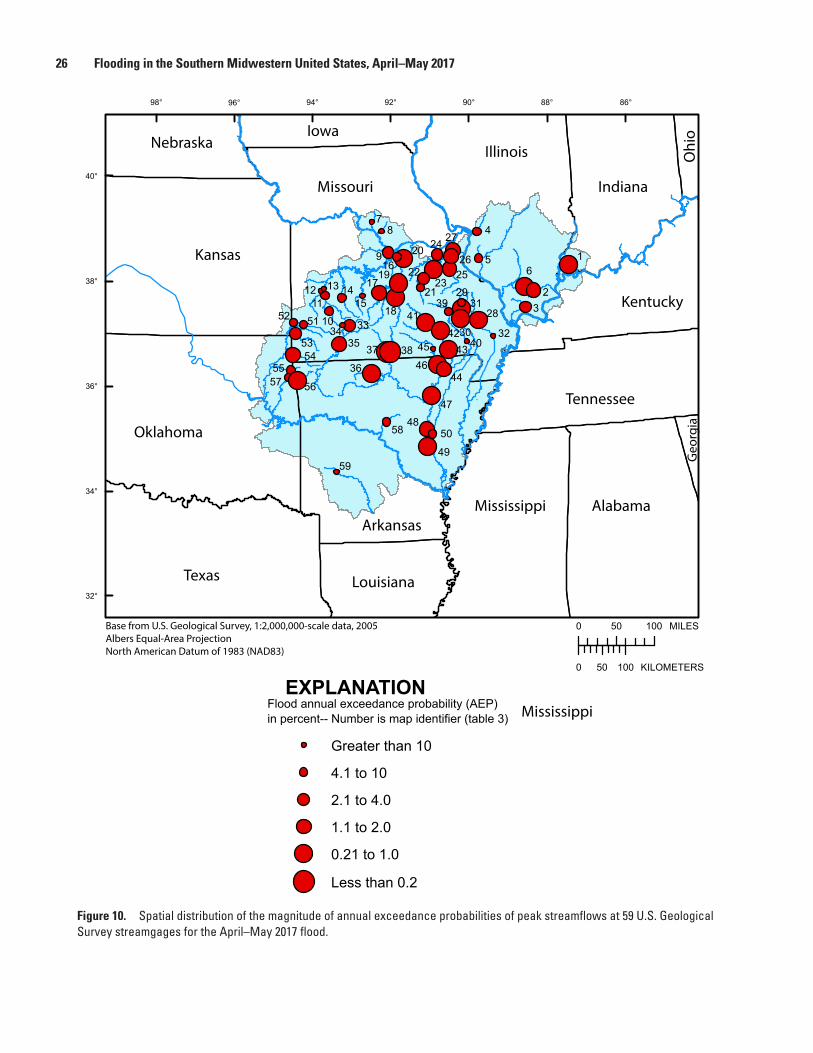
26 Flooding in the Southern Midwestern United States, April–May 2017
Figure 10. Spatial distribution of the magnitude of annual exceedance probabilities of peak streamflows at 59 U.S. Geological Survey streamgages for the April–May 2017 flood.
86°88°90°92°94°98° 96°
40°
38°
36°
34°
32°
EXPLANATION
Greater than 10
4.1 to 10
2.1 to 4.0
1.1 to 2.0
0.21 to 1.0
Less than 0.2
0 50 100 MILES
0 50 100 KILOMETERS
Flood annual exceedance probability (AEP)in percent-- Number is map identifier (table 3)
1
23
4
56
78
916
2026
2724
2523
22
21
3240
28
2931
30
3941
4245 4346
44
4748
49
5058
59
55
5657
5152
5354
1112 13
10
1415
34 33
35
36
37 38
17
18
19
Base from U.S. Geological Survey, 1:2,000,000-scale data, 2005Albers Equal-Area ProjectionNorth American Datum of 1983 (NAD83)
Kansas
Missouri
Illinois
Indiana
Kentucky
Tennessee
Oklahoma
Arkansas
Mississippi
Texas
NebraskaIowa
Ohi
o
Mississippi Alabama
Geo
rgia
Louisiana
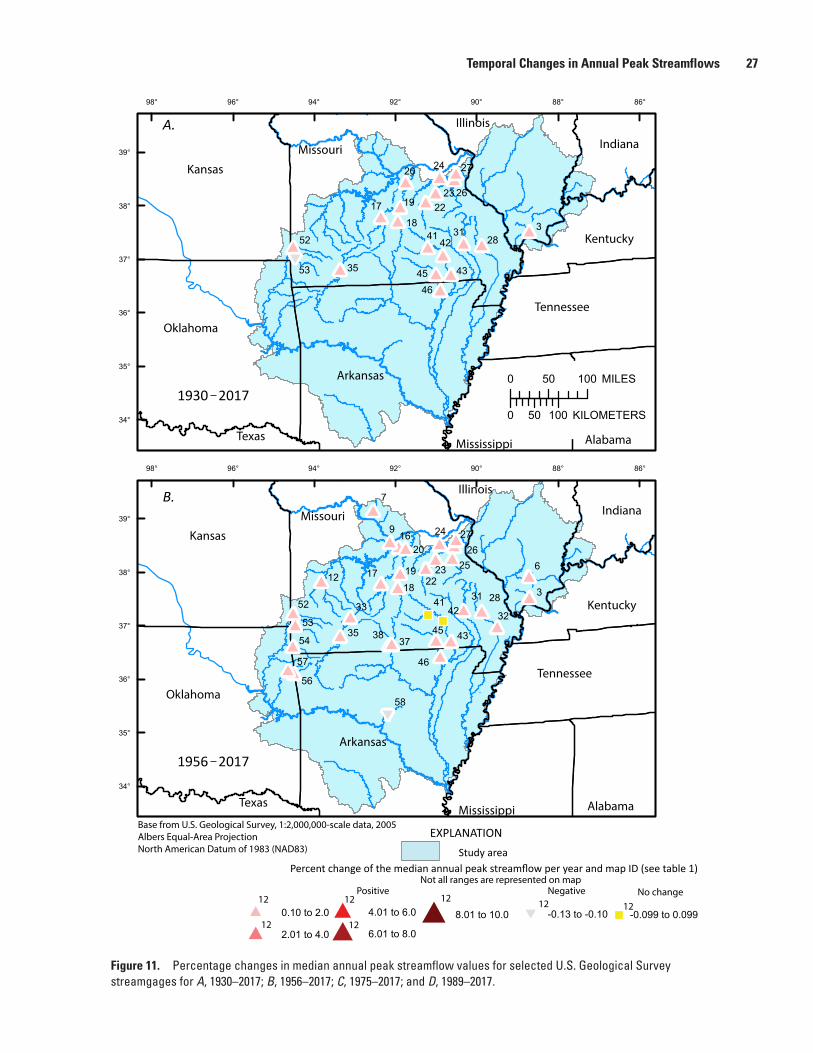
Temporal Changes in Annual Peak Streamflows 27
Figure 11. Percentage changes in median annual peak streamflow values for selected U.S. Geological Survey streamgages for A, 1930–2017; B, 1956–2017; C, 1975–2017; and D, 1989–2017.
Ó
##
#
###
##
#
#
##
##
#
#
#
##
#
#
#
##
##
#
#
###
9
7
6
3
57
56
54
53
52
46
45 43
41
3837
35
3332
31 28
2726
25
24
2322
20
19
1817
16
12
58
42
86°88°90°92°94°96°98°
39°
38°
37°
36°
35°
34°
Ó -0.13 to -0.10# 0.10 to 2.0
# 2.01 to 4.0
# 4.01 to 6.0
# 6.01 to 8.0# 8.01 to 10.0
EXPLANATION
Percent change of the median annual peak streamflow per year and map ID (see table 1)
Positive Negative No change
Study area
-0.099 to 0.099
Not all ranges are represented on map
12
12
12
12
12 12 12
Kansas
Oklahoma
Arkansas
TexasMississippi
A.
B.
##
#
#
# #
#
#
#
#
#
#
##
#
#
#
#
#
Ó
53
352
4645 43
4241
35
3128
27
26
24
2322
20
19
18
17
86°88°90°92°94°96°98°
39°
38°
37°
36°
35°
34°
0 50 100 MILES
0 50 100 KILOMETERS
Alabama
Tennessee
Kentucky
Indiana
Illinois
Missouri
Kansas
Oklahoma
Arkansas
TexasMississippi Alabama
Tennessee
Kentucky
Indiana
Illinois
Missouri
1930 2017
1956 2017
Base from U.S. Geological Survey, 1:2,000,000-scale data, 2005Albers Equal-Area ProjectionNorth American Datum of 1983 (NAD83)
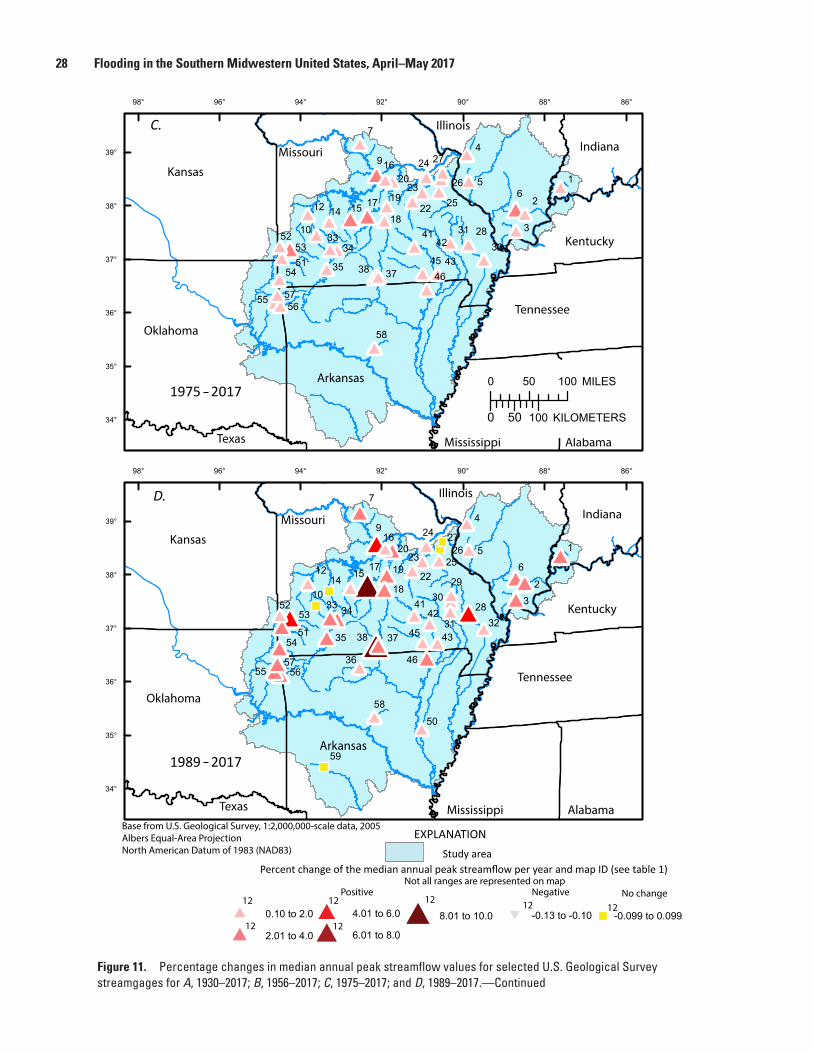
28 Flooding in the Southern Midwestern United States, April–May 2017
#
#
#
##
# #
#
#
#
##
#
#
###
#
#
#
#
##
#
#
#
#
##
#
#
#
#
# ##
#
##
#
#
#
#
9
7
65
4
3
2
1
58
5756
55
54
5352
5146
45 43
41
38 3735
3433
32
31 28
27
26
25
24
23
22
20
19
1817
16
151412
1042
86°88°90°92°94°96°98°
39°
38°
37°
36°
35°
34°
#
#
#
# #
##
#
#
##
#
#
#
#
##
#
#
#
##
#
#
#
#
##
#
#
# ##
##
#
#
#
# #
#
#
#
#
9
7
65
4
32
1
58
575655
54
5352
51
50
46
45 43
4241
38 37
36
35
3433
3231
3029
28
2726
25
24
23
22
20
19
18
17
16
1514
12
10
59
86°88°90°92°94°96°98°
39°
38°
37°
36°
35°
34°
Kansas
Oklahoma
Arkansas
Texas Mississippi Alabama
Tennessee
Kentucky
Indiana
Illinois
Missouri
Kansas
Oklahoma
Arkansas
Texas Mississippi Alabama
Tennessee
Kentucky
Indiana
Illinois
Missouri
1975 2017
1989 2017
Ó -0.13 to -0.10# 0.10 to 2.0
# 2.01 to 4.0
# 4.01 to 6.0
# 6.01 to 8.0# 8.01 to 10.0
EXPLANATION
Percent change of the median annual peak streamflow per year and map ID (see table 1)
Positive Negative No change
Study area
-0.099 to 0.099
Not all ranges are represented on map
12
12
12
12
12 12 12
Base from U.S. Geological Survey, 1:2,000,000-scale data, 2005Albers Equal-Area ProjectionNorth American Datum of 1983 (NAD83)
C.
D.
0 50 100 MILES
0 50 100 KILOMETERS
Figure 11. Percentage changes in median annual peak streamflow values for selected U.S. Geological Survey streamgages for A, 1930–2017; B, 1956–2017; C, 1975–2017; and D, 1989–2017.—Continued
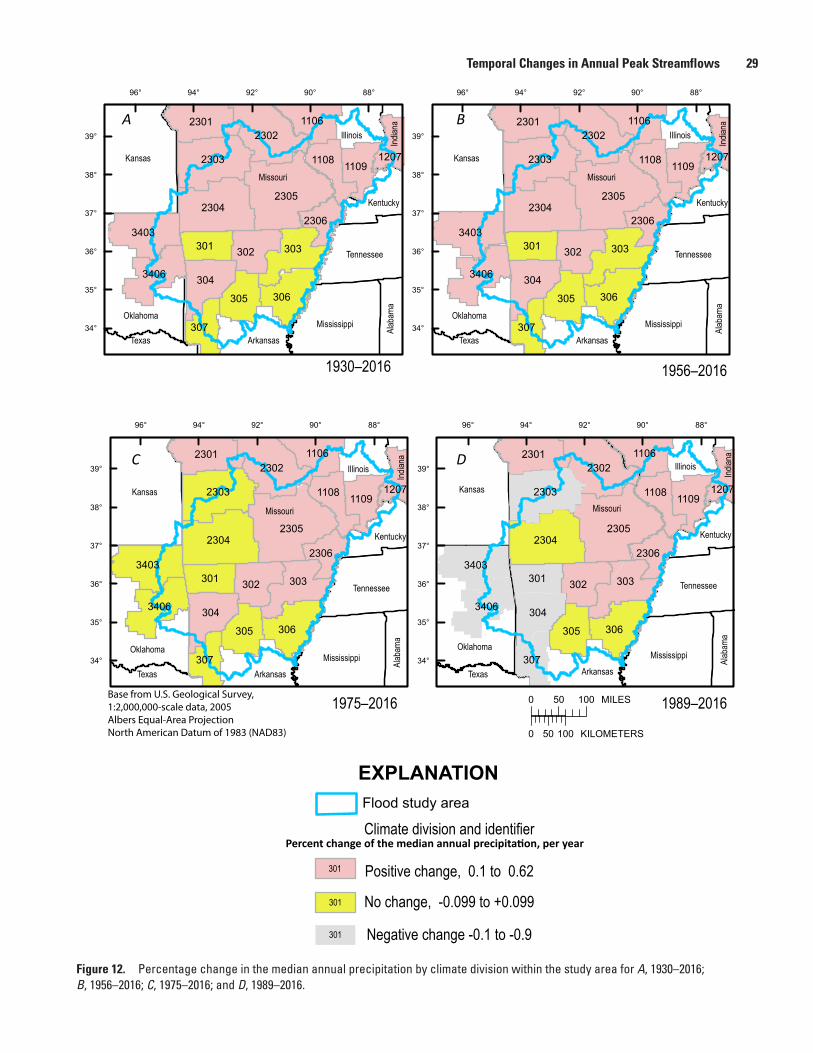
Temporal Changes in Annual Peak Streamflows 29
Figure 12. Percentage change in the median annual precipitation by climate division within the study area for A, 1930–2016; B, 1956–2016; C, 1975–2016; and D, 1989–2016.
Illinois
Indian
a
23052304
2303
2302
303
306304
3403
302
2301
3406
305
301
307
1106
11091108
2306
1207
88°90°92°94°96°
39°
38°
37°
36°
35°
34°
23052304
2303
2302
303
306304
3403
302
2301
3406
305
301
307
1106
11091108
2306
1207
88°90°92°94°96°
39°
38°
37°
36°
35°
34°
23052304
2303
2302
303
306304
3403
302
2301
3406
305
301
307
1106
11091108
2306
1207
88°90°92°94°96°
39°
38°
37°
36°
35°
34°
23052304
2303
2302
303
306304
3403
302
2301
3406
305
301
307
1106
11091108
2306
1207
88°90°92°94°96°
39°
38°
37°
36°
35°
34°
1930–2016 1956–2016
1975–2016 1989–2016Base from U.S. Geological Survey, 1:2,000,000-scale data, 2005Albers Equal-Area ProjectionNorth American Datum of 1983 (NAD83)
Kansas
Oklahoma
Texas Arkansas
Mississippi
Missouri
Alab
ama
Tennessee
Kentucky
Illinois
Indian
a
Kansas
Oklahoma
Texas Arkansas
Mississippi
Missouri
Alab
ama
Tennessee
Kentucky
Illinois
Indian
a
Kansas
Oklahoma
Texas Arkansas
Mississippi
Missouri
Alab
ama
Tennessee
Kentucky
Illinois
Indian
a
Kansas
Oklahoma
Texas Arkansas
Mississippi
Missouri
Alab
ama
Tennessee
Kentucky
0 50 100 MILES
0 50 100 KILOMETERS
EXPLANATIONFlood study area
Climate division and identifierPercent change of the median annual precipitation, per year
Positive change, 0.1 to 0.62
No change, -0.099 to +0.099
Negative change -0.1 to -0.9
301
301
301
A B
C D
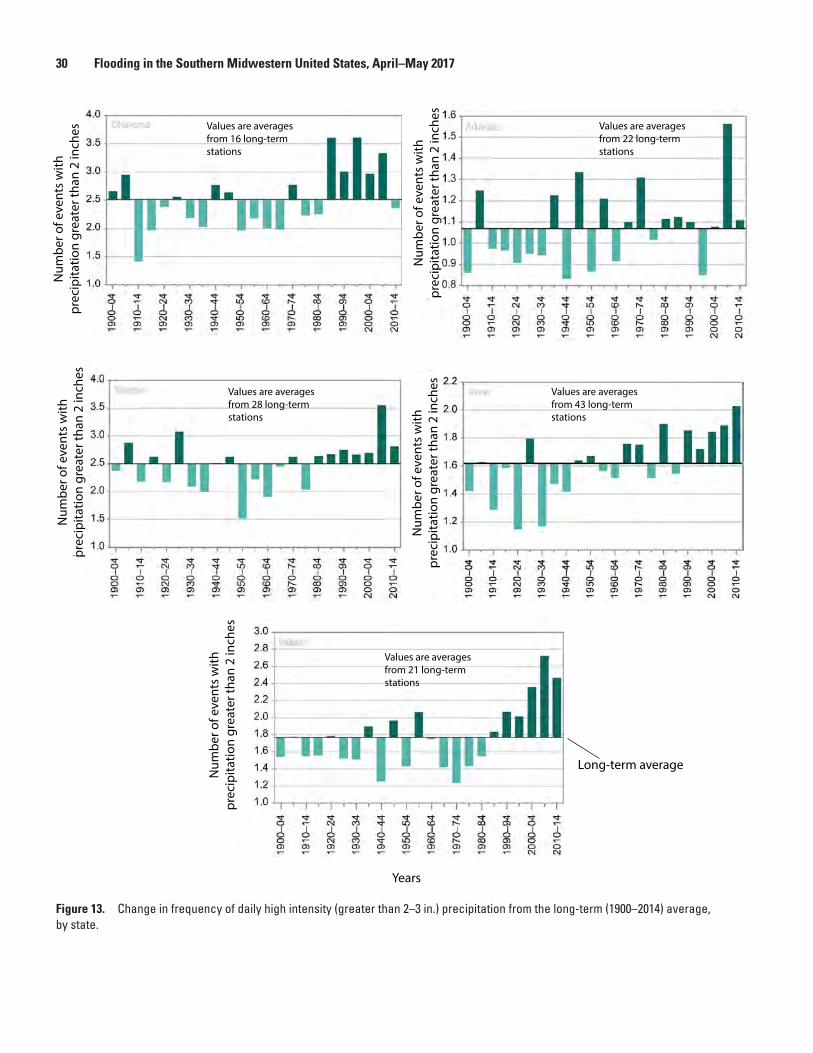
30 Flooding in the Southern Midwestern United States, April–May 2017
Figure 13. Change in frequency of daily high intensity (greater than 2–3 in.) precipitation from the long-term (1900–2014) average, by state.
Years
Values are averagesfrom 21 long-term stations
Values are averagesfrom 43 long-term stations
Values are averagesfrom 16 long-term stations
Values are averagesfrom 22 long-term stations
Values are averagesfrom 28 long-term stations
Num
ber o
f eve
nts
with
prec
ipita
tion
grea
ter t
han
2 in
ches
Num
ber o
f eve
nts
with
prec
ipita
tion
grea
ter t
han
2 in
ches
Num
ber o
f eve
nts
with
prec
ipita
tion
grea
ter t
han
2 in
ches
Num
ber o
f eve
nts
with
prec
ipita
tion
grea
ter t
han
2 in
ches
Num
ber o
f eve
nts
with
prec
ipita
tion
grea
ter t
han
2 in
ches
Long-term average

References Cited 31
SummaryExcessive rainfall resulted in flooding on numerous rivers
throughout the southern Midwestern United States in late April and early May of 2017. Tropical moisture lifted over a stalled frontal system caused heavy rains from Texas to Ohio between April 28 and May 10, resulting in extensive flood-ing from eastern Oklahoma to southern Indiana including parts of Missouri, Arkansas, and Illinois. The heaviest rainfall amounts during April 28–30 occurred over extreme northeast Oklahoma and northern Arkansas, across the southern half of Missouri, southern Illinois, and southern Indiana, and included totals of 6 to 10 inches with some isolated higher amounts.
Peak-of-record streamflows were set at 21 U.S. Geologi-cal Survey streamgages in the southern Midwest during the resulting April May 2017 flooding. Each of the five states included in the study area had at least one streamgage with a peak of record during the flood. The annual exceedance prob-ability (AEP) estimates for the April May 2017 flood peak streamflows indicate that peaks at 5 USGS streamgages had an AEP of 0.2 percent or less, and peak streamflows at 15 USGS streamgages had an AEP in the range from greater than 0.2 to 1 percent.
Examination of the magnitude of the temporal changes in median annual peak streamflows indicated positive increases, in general, throughout the study area for each of the 1930–2017, 1956–2017, 1975–2017, and 1989–2017 analysis periods. The median increase in peak streamflows was great-est in the 1975–2017 and 1989–2017 periods with maximum increases of 8–10 percent per year. No stations in either the 1975–2017 or 1989–2017 analysis period had median negative changes in peak streamflows.
A primary driver of change in peak streamflows is precipitation, but the changes in annual precipitation provided little explanation for the substantial increase in the magnitude of streamflow peaks in the 1989–2017 analysis period. The increase in the magnitude of the positive changes in annual peak streamflows during this period likely is better explained by a change in the frequency of larger magnitude rain events (greater than 2 or 3 inches) with time.
References Cited
Cable News Network, 2017, Aerial images show devastat-ing flooding in central US: Cable News Network web page accessed July 5, 2017, at http://www.cnn.com/2017/05/04/weather/missouri-flooding-images/.
Cohn, T.A., England, J.F., Berenbrock, C.E., Mason, R.R., Stedinger, J.R., and Lamontagne, J.R., 2013, A generalized Grubbs-Beck test statistic for detecting multiple potentially influential low outliers in flood series: Water Resources Research, v. 49, no. 8, p. 5047–5058.
Cohn, T.A., Lane, W.L., and Baier, W.G., 1997, An algorithm for computing moments-based flood quantile estimates when historical flood information is available: Water Resources Research, v. 33, no. 9, p. 2089–2096.
England, J.F. Jr., Cohn, T.A., Faber, B.A., Stedinger, J.R., Thomas, W.O., Veilleux, A.G., Kiang, J.E., and Mason, R.R., 2017, Guidelines for determining flood flow fre-quency, Bulletin 17C: U.S. Geological Survey Techniques and Methods book 4, chap. 5, 228 p.
Federal Emergency Management Agency [FEMA], 2017a, President Donald J. Trump approves Arkan-sas disaster declaration, accessed July 7, 2017, at https://www.fema.gov/news-release/2017/06/15/president-donald-j-trump-approves-arkansas-disaster-declaration.
Federal Emergency Management Agency [FEMA], 2017b, President Trump approves major disaster declara-tion for State of Oklahoma: accessed July 7, 2017, at https://www.fema.gov/news-release/2017/05/26/president-trump-approves-major-disaster-declaration-state-oklahoma.
Flynn, K.M., Kirby, W.H., and Hummel, P.R., 2006, User’s manual for program PeakFQ, Annual flood frequency analy-sis using Bulletin 17B guidelines: U.S. Geological Survey Techniques and Methods, book 4, chap. B4, 42 p.
Frankson, R., Kunkel, K., Champion, S., and Stewart, B., 2017a, Missouri State Summary: NOAA Technical Report NESDIS 149-MO, 4 p. accessed October 24, 2017, at https://statesummaries.ncics.org/mo.
Frankson, R., Kunkel, K., Champion, S., Stewart, B., Easterling, D., Hall, B., and Angel, J.R., 2017b, Illi-nois State Summary: NOAA Technical Report NES-DIS 149-IL, 4 p., accessed October 24, 2017, at https://statesummaries.ncics.org/il.
Frankson, R., Kunkel, K., Champion, S., Stewart, B., and Runkle, J., 2017c, Indiana State Summary: NOAA Tech-nical Report NESDIS 149-IN, 4 p. accessed October 24, 2017, at https://statesummaries.ncics.org/in.
Frankson, R., Kunkel, K., Stevens, L., Champion, S., and Stewart, B., 2017d, Oklahoma State Summary: NOAA Technical Report NESDIS 149-OK, 4 p. accessed Octo-ber 24, 2017, at https://statesummaries.ncics.org/ok.
Holmes, R.R., Jr., Koenig, T.A., and Karstensen, K.A., 2010, Flooding in the United States Midwest, 2008: U.S. Geologi-cal Survey Professional Paper 1775, 64 p.
Holmes, R.R., Jr., Koenig, T.A., Rydlund, P.H., and Heimann, D.C., 2016, Examination of flood characteristics at selected streamgages in the Meramec River Basin, Eastern Missouri, December 2015–January 2016: U.S. Geological Survey Open-File Report 2016–1140, 7 p., https://doi.org/10.3133/ofr20161140.

32 Flooding in the Southern Midwestern United States, April–May 2017
Interagency Advisory Committee on Water Data, 1982, Guidelines for determining flood flow frequency (revised): U.S. Geological Survey, Office of Water Data Coordination, Bulletin 17B, 28 p., 14 app., and 1 pl.
Jennings, M.E., Thomas, T.O., Jr., and Riggs, H.C., 1994, Nationwide summary of U.S. Geological Survey regional regression equations estimating magnitude and frequency of floods for ungaged sites: U.S. Geological Survey Water-Resources Investigations Report 94–4002, 196 p.
Langbein, W.B., and Iseri, K.T., 1960, General introduction and hydrologic definitions: U.S. Geological Survey Water- Supply Paper 1541-A, 29 p.
Lewis, J.M., 2010, Methods for estimating the magnitude and frequency of peak streamflows for unregulated streams in Oklahoma: U.S. Geological Survey Scientific Investigations Report 2010–5137, 41 p.
Missouri Department of Public Safety, State Emergency Management Agency, 2017, More Missouri residents and local governments will receive federal disaster assistance after FEMA approves Gov. Greiten’s request to expand Missouri disaster declaration: Missouri Department of Public Safety web page, accessed July 23, 2017, at https://sema.dps.mo.gov/news/newsitem/uuid/5e3948b0-4416-4763-bb4b-0f4445565a20.
National Centers for Environmental Prediction, 2017, Sur-face Weather Maps, April 27–30, 2017: National Centers for Environmental Prediction web page, accessed June 17, 2017, at http://www.ncep.noaa.gov/.
National Oceanic and Atmospheric Administration (NOAA), National Centers for Environmental Information, 2017a, Data access: National Centers for Environmen-tal Information web page, accessed August 2, 2017, at https://www.ncdc.noaa.gov/data-access.
National Oceanic and Atmospheric Administration (NOAA), National Centers for Environmental Information, 2017b, National Climate Report: National Centers for Environ-mental Information web page, accessed August 2, 2017, at https://www.ncdc.noaa.gov/sotc/national/.
National Oceanic and Atmospheric Administration (NOAA), National Centers for Environmental Information, 2017c, U.S. Climate Divisions: National Centers for Environ-mental Information web page, accessed June 27, 2017, at https://www.ncdc.noaa.gov/monitoring-references/maps/us-climate-divisions.php.
National Weather Service, 2017a, National Weather Service glossary: National Weather Service web page, accessed October 23, 2017, at http://w1.weather.gov/glossary/.
National Weather Service, 2017b, 28-30 April His-toric Flooding Event, Springfield, Missouri, Fore-cast Office: National Weather Service web page, accessed June 17, 2017, at https://www.weather.gov/sgf/28-30AprilHistoricFloodingEvent.
Office of Missouri Governor, 2017, At Governor Greiten’s request, President Trump declares major disaster in Mis-souri: Office of Missouri Governor web page, accessed July 7, 2017, at https://governor.mo.gov/news/archive/ governor-greitens%E2%80%99-request-president-trump-declares-major-disaster-missouri.
Parrett, Charles, Melcher, N.B., and James, R.W., Jr., 1993, Flood streamflows in the upper Mississippi River basin, 1993: U.S. Geological Survey Circular 1120–A, 14 p.
Runkle, J., Kunkel, K., Champion, S., Stewart, B., and Easter-ling, D., 2017, Arkansas State Summary: NOAA Technical Report NESDIS 149–AR, 4 p. accessed October 24, 2017, at https://statesummaries.ncics.org/ar.
Salmi, T., Määttä, A., Anttila, P., Ruoho-Airola, T., and Amnell, T., 2002, Detecting trends of annual values of atmospheric pollutants by the Mann-Kendall test and Sen’s slope estimates—The excel template application MAKESENS: Helsinki, Finland, Finnish Meteorological Institute Report 31, 35 p. accessed September 12, 2017, at http://en.ilmatieteenlaitos.fi/makesens.
Sauer, V.B., and Fulford, J.M., 1983, Floods of December 1982 and January 1983 in central and southern Mississippi River Basin: U.S. Geological Survey Open-File Report 83–213, 41 p.
Sen, P.K., 1968, Estimates of the regression coefficient based on Kendall’s tau: Journal of American Statistical Associa-tion, v. 63, p. 1379–1389.
Soong, D.T., Ishii, A.L., Sharpe, J.B., and Avery, C.F., 2004, Estimating flood-peak streamflow magnitudes and frequen-cies for rural streams in Illinois: U.S. Geological Survey Scientific Investigations Report 2004–5103, 147 p.
Southard, R.E., 2010, Estimating the magnitude and frequency of floods in urban basins in Missouri: U.S. Geological Sur-vey Scientific Investigations Report 2010–5073, 27 p.
Southard, R.E., and Veilleux, A.G., 2014, Methods for estimat-ing annual exceedance-probability discharges and largest recorded floods for unregulated streams in rural Missouri: U.S. Geological Survey Scientific Investigations Report 2014–5165, 39 p., https://doi.org/10.3133/sir20145165.
U.S. Geological Survey, 2017a, National Water Informa-tion System—Web interface: accessed June 30, 2017, at https://doi.org/10.5066/F7P55KJN.
U.S. Geological Survey, 2017b, WaterWatch, Flood—Flood Table Builder: U.S. Geological Survey, accessed on July 5, 2017, at https://waterwatch.usgs.gov/.
Veilleux, A.G., Cohn, T.A., Flynn, K.M., Mason, R.R., and Hummel, P.R., 2013, Estimating magnitude and frequency of floods using the PeakFQ 7.0 program: U.S. Geological Survey Fact Sheet 2013–3108, 2 p.
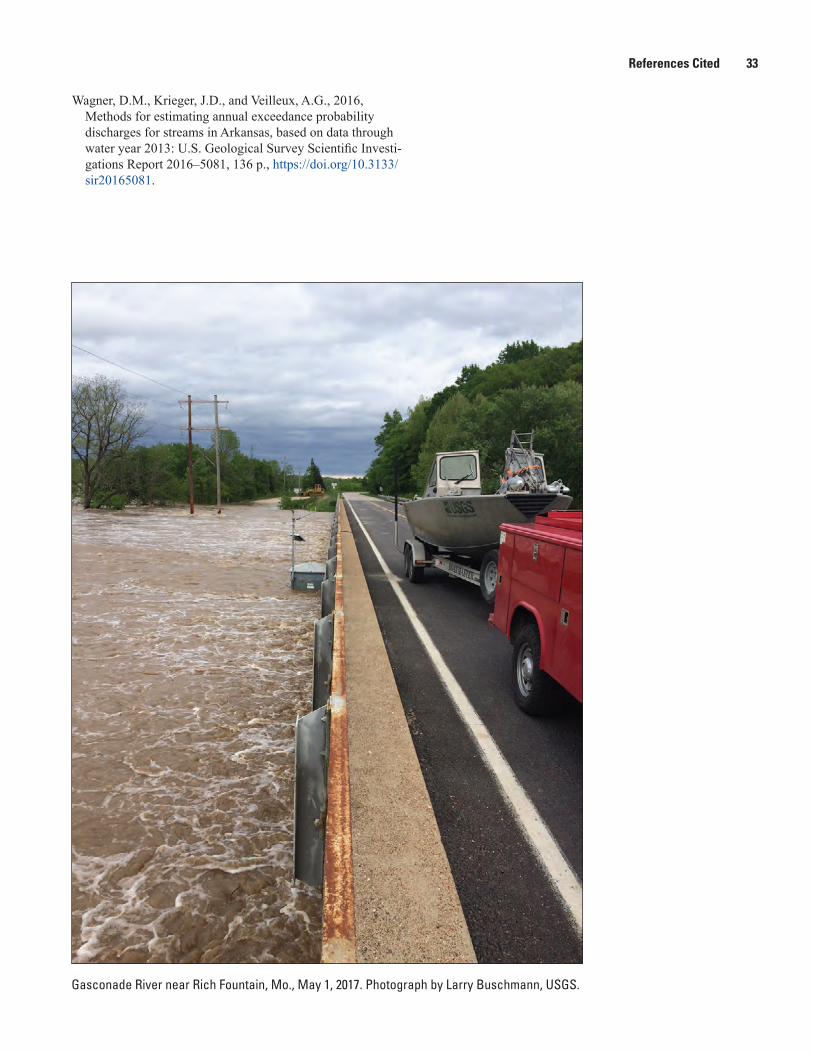
References Cited 33
Wagner, D.M., Krieger, J.D., and Veilleux, A.G., 2016, Methods for estimating annual exceedance probability discharges for streams in Arkansas, based on data through water year 2013: U.S. Geological Survey Scientific Investi-gations Report 2016–5081, 136 p., https://doi.org/10.3133/sir20165081.
Gasconade River near Rich Fountain, Mo., May 1, 2017. Photograph by Larry Buschmann, USGS.
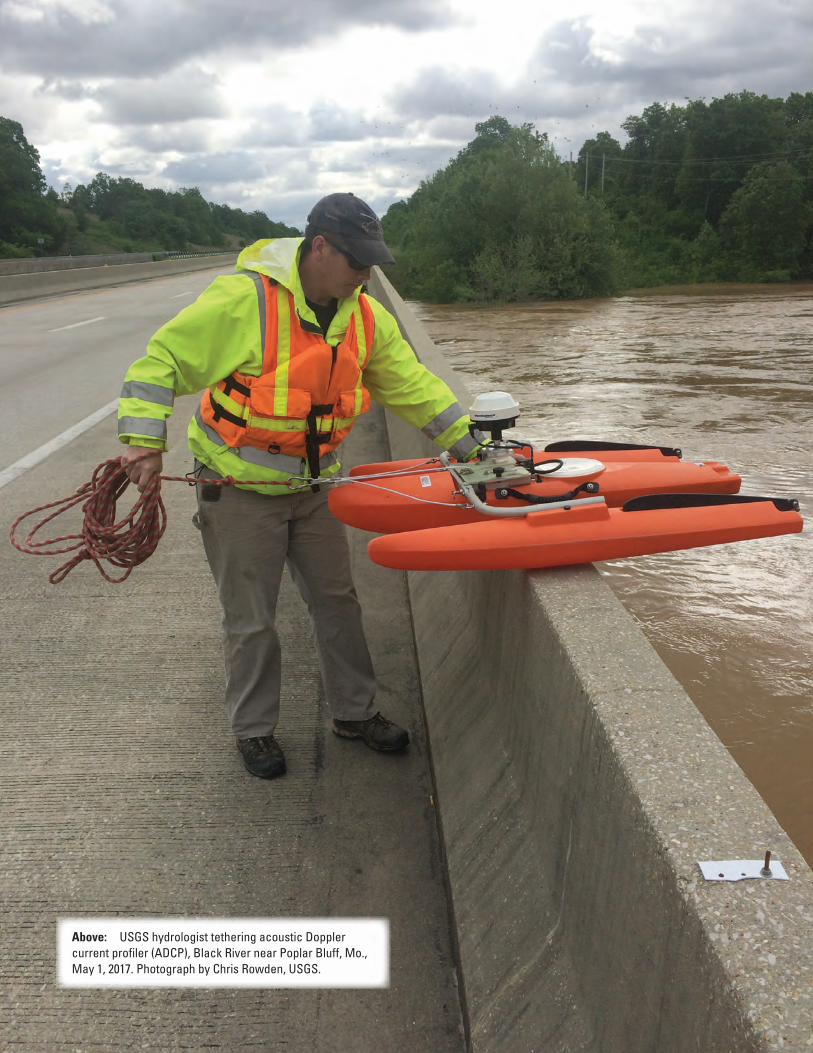
Above: USGS hydrologist tethering acoustic Doppler current profiler (ADCP), Black River near Poplar Bluff, Mo., May 1, 2017. Photograph by Chris Rowden, USGS.
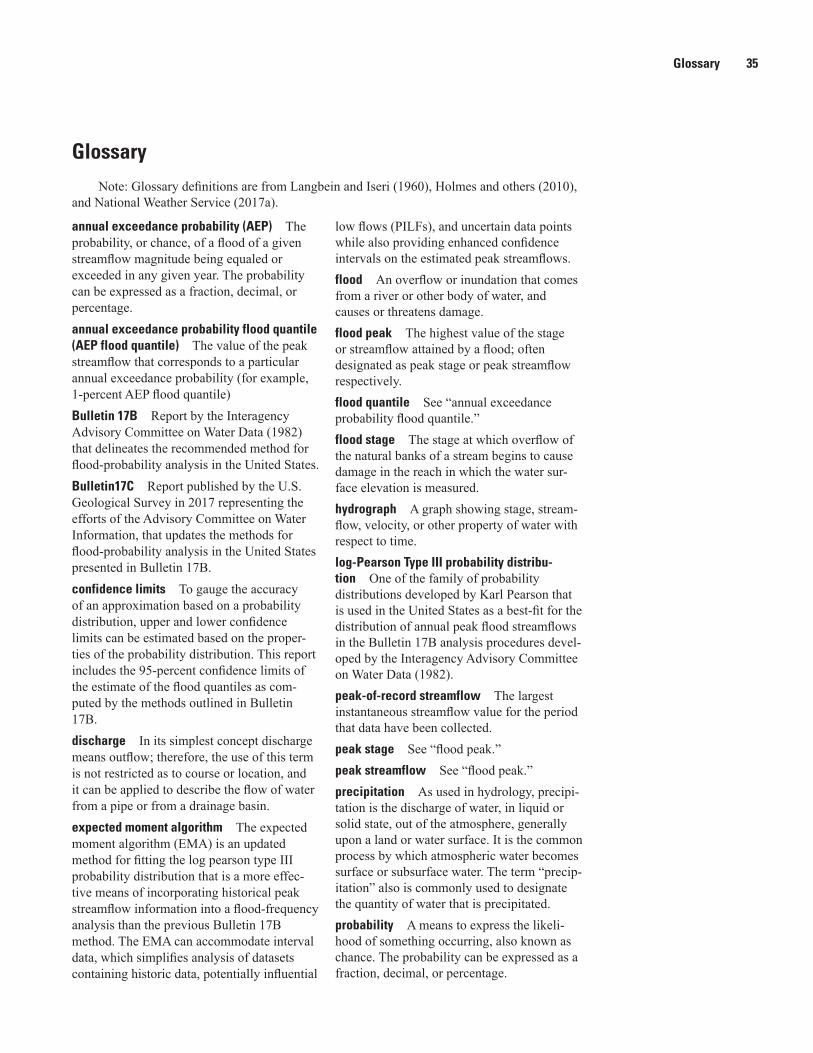
Glossary 35
GlossaryNote: Glossary definitions are from Langbein and Iseri (1960), Holmes and others (2010),
and National Weather Service (2017a).
annual exceedance probability (AEP) The probability, or chance, of a flood of a given streamflow magnitude being equaled or exceeded in any given year. The probability can be expressed as a fraction, decimal, or percentage. annual exceedance probability flood quantile (AEP flood quantile) The value of the peak streamflow that corresponds to a particular annual exceedance probability (for example, 1-percent AEP flood quantile) Bulletin 17B Report by the Interagency Advisory Committee on Water Data (1982) that delineates the recommended method for flood-probability analysis in the United States. Bulletin17C Report published by the U.S. Geological Survey in 2017 representing the efforts of the Advisory Committee on Water Information, that updates the methods for flood-probability analysis in the United States presented in Bulletin 17B.confidence limits To gauge the accuracy of an approximation based on a probability distribution, upper and lower confidence limits can be estimated based on the proper-ties of the probability distribution. This report includes the 95-percent confidence limits of the estimate of the flood quantiles as com-puted by the methods outlined in Bulletin 17B.discharge In its simplest concept discharge means outflow; therefore, the use of this term is not restricted as to course or location, and it can be applied to describe the flow of water from a pipe or from a drainage basin.expected moment algorithm The expected moment algorithm (EMA) is an updated method for fitting the log pearson type III probability distribution that is a more effec-tive means of incorporating historical peak streamflow information into a flood-frequency analysis than the previous Bulletin 17B method. The EMA can accommodate interval data, which simplifies analysis of datasets containing historic data, potentially influential
low flows (PILFs), and uncertain data points while also providing enhanced confidence intervals on the estimated peak streamflows.flood An overflow or inundation that comes from a river or other body of water, and causes or threatens damage.flood peak The highest value of the stage or streamflow attained by a flood; often designated as peak stage or peak streamflow respectively.flood quantile See “annual exceedance probability flood quantile.”flood stage The stage at which overflow of the natural banks of a stream begins to cause damage in the reach in which the water sur-face elevation is measured.hydrograph A graph showing stage, stream-flow, velocity, or other property of water with respect to time.log-Pearson Type III probability distribu-tion One of the family of probability distributions developed by Karl Pearson that is used in the United States as a best-fit for the distribution of annual peak flood streamflows in the Bulletin 17B analysis procedures devel-oped by the Interagency Advisory Committee on Water Data (1982).peak-of-record streamflow The largest instantaneous streamflow value for the period that data have been collected.peak stage See “flood peak.”peak streamflow See “flood peak.”precipitation As used in hydrology, precipi-tation is the discharge of water, in liquid or solid state, out of the atmosphere, generally upon a land or water surface. It is the common process by which atmospheric water becomes surface or subsurface water. The term “precip-itation” also is commonly used to designate the quantity of water that is precipitated.probability A means to express the likeli-hood of something occurring, also known as chance. The probability can be expressed as a fraction, decimal, or percentage.
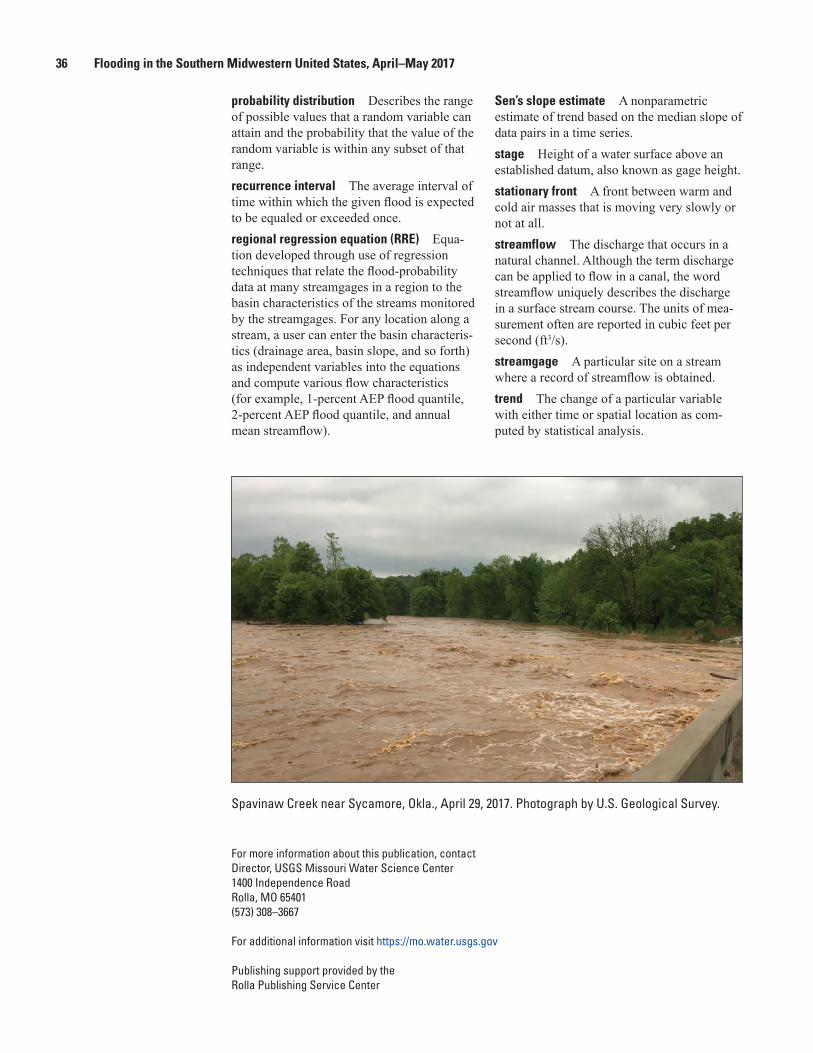
36 Flooding in the Southern Midwestern United States, April–May 2017
probability distribution Describes the range of possible values that a random variable can attain and the probability that the value of the random variable is within any subset of that range.recurrence interval The average interval of time within which the given flood is expected to be equaled or exceeded once.regional regression equation (RRE) Equa-tion developed through use of regression techniques that relate the flood-probability data at many streamgages in a region to the basin characteristics of the streams monitored by the streamgages. For any location along a stream, a user can enter the basin characteris-tics (drainage area, basin slope, and so forth) as independent variables into the equations and compute various flow characteristics (for example, 1-percent AEP flood quantile, 2-percent AEP flood quantile, and annual mean streamflow).
Sen’s slope estimate A nonparametric estimate of trend based on the median slope of data pairs in a time series.stage Height of a water surface above an established datum, also known as gage height.stationary front A front between warm and cold air masses that is moving very slowly or not at all.streamflow The discharge that occurs in a natural channel. Although the term discharge can be applied to flow in a canal, the word streamflow uniquely describes the discharge in a surface stream course. The units of mea-surement often are reported in cubic feet per second (ft3/s).streamgage A particular site on a stream where a record of streamflow is obtained.trend The change of a particular variable with either time or spatial location as com-puted by statistical analysis.
Spavinaw Creek near Sycamore, Okla., April 29, 2017. Photograph by U.S. Geological Survey.
For more information about this publication, contactDirector, USGS Missouri Water Science Center 1400 Independence RoadRolla, MO 65401(573) 308–3667
For additional information visit https://mo.water.usgs.gov
Publishing support provided by the Rolla Publishing Service Center

Back cover. USGS hydrologic technician wading St. Francis River near Patterson, Mo., April 30, 2017. Photograph by Josh Keele, USGS.

Heimann and others—
Flooding in the Southern Midw
estern United States, A
pril–May 2017—
Open-File Report 2018–1004
ISSN 2331-1258 (online)https://doi.org/10.3133/ofr20181004