Flood Resiliency: Data Collection and Data Analytic in ...
19
Funding Organization: North Carolina Collaboratory Project Title: 1. Accuracy Assessment for IoT Stream Gages Data, $15000, 04/01/2019 - 12/30/2020 2. Flood Resilience: Data Collection and Data Analytic in support of Flood Management, $50,000, 12/12/2019 – 12/20/2020 Principal Investigator: Leila Hashemi Beni, Ph.D., Assistant Professor, Department of Built Environment, College of Science and Technology, NC A&T State University, [email protected]/ Phone: 336-285-3133 Project Collaborator: Gary Thompson, Deputy Risk Management Chief for NC Emergency Management and Chief of the NC Geodetic Survey, [email protected] / Phone: 919- 948-7844 FINAL REPORT
Transcript of Flood Resiliency: Data Collection and Data Analytic in ...

Funding Organization: North Carolina Collaboratory
Project Title:
1. Accuracy Assessment for IoT Stream Gages Data, $15000, 04/01/2019 - 12/30/2020
2. Flood Resilience: Data Collection and Data Analytic in support of Flood
Management, $50,000, 12/12/2019 – 12/20/2020
Principal Investigator: Leila Hashemi Beni, Ph.D., Assistant Professor, Department of Built
Environment, College of Science and Technology, NC A&T State University,
[email protected]/ Phone: 336-285-3133
Project Collaborator: Gary Thompson, Deputy Risk Management Chief for NC Emergency
Management and Chief of the NC Geodetic Survey, [email protected] / Phone:
919- 948-7844
FINAL REPORT

Flood Resilience
Contents Objectives ..................................................................................................................................................... 2
Accuracy Assessment for IoT Stream Gages Data (Project 1 and 2.1) .......................................................... 3
1. Low Cost Gage Test Site Development ............................................................................................. 3
2. Autonomous Water Gauge Measurement for Flood Monitoring ................................................... 10
Effective Inundation Mapping and Water Depth Extraction In Support of Flood Management (Project
2.2) .............................................................................................................................................................. 13
Team ........................................................................................................................................................... 15
Products ...................................................................................................................................................... 15
1. Infrastructures: ............................................................................................................................... 15
2. Presentations: ................................................................................................................................. 15
3. Peer-Reviewed Publications: .......................................................................................................... 16
4. Proposal Development: .................................................................................................................. 16
Appendix 1: Reference Points ..................................................................................................................... 17

Flood Resilience
Objectives
Project 1: Accuracy Assessment for IoT Stream Gages Data, $15000, 04/01/2019 - 12/30/2020
The project aimed to evaluate the accuracy/precision of low cost stream gages in different environmental
conditions during a one-year period. This is to insure that the gages utilized for the expansion of FIMAN
coverage are providing accurate and precise information.
Project 2: Flood Resilience: Data Collection and Data Analytic in support of Flood Management,
$50,000, 12/12/2019 – 12/20/2020
This project is to expand two pervious projects supported by NC Collaboratory:
2.1. Expand gage testing to include low cost radar sensors and rain gages
The project aimed to expand gage testing (Project 1) by including low cost radar sensors and rain gages
and developing water gauge reading method.
2.2. Effective inundation mapping and water depth extraction in support of flood management
This project aimed to investigate an integrated method using Deep Learning and LiDAR analysis for near real time inundation mapping and extracting water depth from UAV data (RGB and infrared collected by the NC Division of Emergency Management over:
Princeville during flooding after hurricane Matthew in 2016. Lumberton and Fair Bluff during flooding after Hurricane Florence. NCAT & NCGS testbed in Tarboro for floodplain mapping in 2019; new datasets will be
collected as well using thermal sensor and LiDAR. The results will be compared and validate using USGS data.

Flood Resilience
Accuracy Assessment for IoT Stream Gages Data (Project 1 and 2.1)
Objective: The Flood Inundation Mapping Alert Network (FIMAN) provides flood warning information to
local community officials and the public. The goal of the FIMAN system is to reduce the loss of life and
flood related property damage by providing timely, detailed, and accurate flood inundation information.
FIMAN is a system of integrated datasets and tools that effectively communicates information to
community officials and the public. FIMAN uses data from a network of 500+ gages. In order to provide
flood warning information for additional locations in North Carolina, more stream gages are required.
This research funded by NC Collaboratory is to utilize Internet of Things (IoT) gages as well as other lower
cost gage and to insure that the gages utilized for the expansion of FIMAN coverage are providing accurate
and precise information. This is a joint effort between NCAT’s Geomatics program and North Carolina
Geodetic Survey to establish a testbed at NCAT farm by installing low cost gages and applying IoTs.
1. Low Cost Gage Test Site Development
The establishment of a stream gage accuracy assessment research test site is to provide North Carolina
Emergency Management (NCEM) and local government agencies a location to test stream gages and
provide test information that would assist in determining the type of gage that best fits the needs of the
community in which the gage would be installed.
In addition to testing and documenting the performance of stream gages, the test site can also be used to
perform research utilizing Artificial Intelligence to monitor water level conditions at gage locations.
1.1. Testbed Selection
The location of a testbed for installing and testing low cost stream gages was selected using the following
criteria:
Secure location to protect equipment from being stolen, vandalism (impact results) and tampering
with setup.
Close proximity to the NC A&T campus to be able quickly check on the status of equipment, replace
equipment efficiently, and repair damaged equipment quickly and reduce the time the equipment is
not operational.
Internet access (cell modem or WiFi) is critical as it is the primary source of data transfer. A key test
criteria because WiFi is not always available at sites where gauge will be installed.
Water source (stream, river, pond, lake) to test the equipment in different flow conditions. Pond
(same long term water level, but impacted by change in water level during heavy rain events). Stream
(velocity, rapid change in water level, equipment damage due to debris flow).
Using the criteria, the following two sites were initially selected to be used to test water level gage
performance and a third site in eastern North Carolina was added in October of 2020:
Flood Resilience
Test site #1
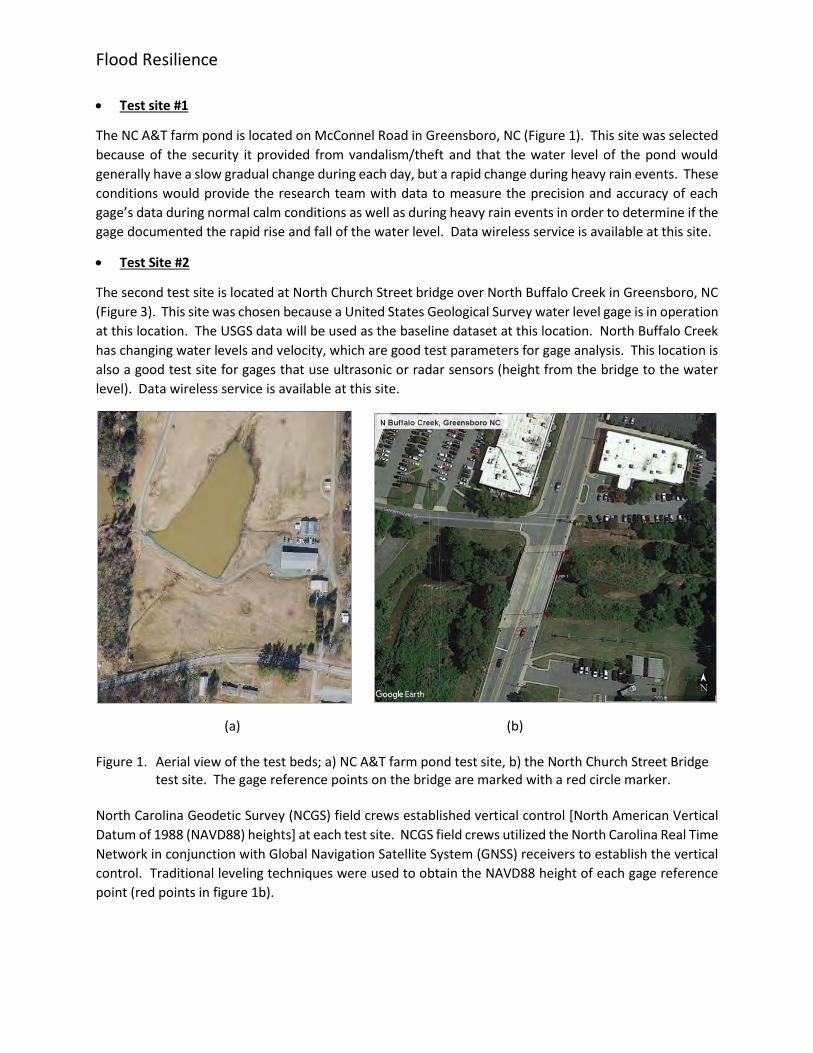
The NC A&T farm pond is located on McConnel Road in Greensboro, NC (Figure 1). This site was selected
because of the security it provided from vandalism/theft and that the water level of the pond would
generally have a slow gradual change during each day, but a rapid change during heavy rain events. These
conditions would provide the research team with data to measure the precision and accuracy of each
gage’s data during normal calm conditions as well as during heavy rain events in order to determine if the
gage documented the rapid rise and fall of the water level. Data wireless service is available at this site.
Test Site #2
The second test site is located at North Church Street bridge over North Buffalo Creek in Greensboro, NC
(Figure 3). This site was chosen because a United States Geological Survey water level gage is in operation
at this location. The USGS data will be used as the baseline dataset at this location. North Buffalo Creek
has changing water levels and velocity, which are good test parameters for gage analysis. This location is
also a good test site for gages that use ultrasonic or radar sensors (height from the bridge to the water
level). Data wireless service is available at this site.
(a) (b) Figure 1. Aerial view of the test beds; a) NC A&T farm pond test site, b) the North Church Street Bridge
test site. The gage reference points on the bridge are marked with a red circle marker. North Carolina Geodetic Survey (NCGS) field crews established vertical control [North American Vertical
Datum of 1988 (NAVD88) heights] at each test site. NCGS field crews utilized the North Carolina Real Time
Network in conjunction with Global Navigation Satellite System (GNSS) receivers to establish the vertical
control. Traditional leveling techniques were used to obtain the NAVD88 height of each gage reference
point (red points in figure 1b).

Flood Resilience
Test Site #3
The third test site is located on Winstead Avenue in Rocky Mount, NC on the bridge over Stony Creek
(Figure 2). This site was chosen because a North Carolina Emergency Management (water level gage is in
operation at this location). The NCEM data will be used as the baseline dataset at this location. Stoney
Creek has changing water levels and velocity, which are good test parameters for gage analysis. This
location is also a good test site for gages that use an ultrasonic sensor with an extended measuring range
(up to 30 feet). Data wireless service is available at this site. An additional parameter for adding this test
site was to test a low-cost sensor in real world conditions.
Figure 2. Aerial view of the test bed #3 on Winstead Avenue in Rocky Mount, NC
1.2. Gage Types: As a baseline, a staff gage was installed at the research NCAT farm test site (testbed #1), and the water level
has been documented using a web camera and field observations. Other gages were installed for testing
including Pressure Sensors, Ultrasonic and Radar. In addition to the water level data, some gage data
provide meteorological data (temperature, amount of rain, wind, pressure, etc.) have been collected to be
compared with meteorological data obtained from a source of higher quality that is located near the
research project site. The gages/sensors include:
Green Stream (ultrasonic)
Green Stream provides a low-cost, low footprint ultra-sonic water level sensor with on-board
temperature sensor. The sensor is non-contact, reducing the need for maintenance. It is perched 2-20
feet above the surface of the water and detects the level below to within 1cm accuracy. The sensor is
powered by and reports via a two-way transceiver. The transceiver reports every six minutes in real time.
It is ruggedized to IP67 standard, powered by a small internal battery charged by a small external solar
panel. It has on-board security, edge computing capability, and can receive over-the-air updates. It reports

Flood Resilience
wirelessly via cellular LTE communications. It can be attached to any pole or post or fitted to a small
bracket to attach to a bridge. The data passes through Green Stream’s cloud platform greenstream.io and
is pushed to Contrail for inclusion in FIMAN.
LB Foster (electro-capacitive design)
LB Foster’s Flood Monitoring was designed to utilize its Inline Flood Pole technology to measure water
depth levels along with its Masternode Communications Hub. In an industry first, the Inline Flood Poles
utilize an electro-capacitive design to detect the external presence of water and are connected to the
Masternode using a secure radio link. With an alarm at the zero point and a variable alarm anywhere
along the 3ft of sensing length, these sensors are designed to notify the user of water levels as they reach
critical depths. Multiple Inline Flood Poles can communicate with a single Masternode Communications
Hub, allowing flexible deployment of the system. When a critical flood level is detected, systems equipped
with a PTZ camera will take a picture of the flood event to send to the user for a real time visual of the
event. LB Foster’s innovative flood monitoring brings the ability to detect flood events and protect at risk
areas, with the flexibility to be deployed nearly anywhere.
Evigia SensiFlood (pressure sensor)
Evigia SensiFlood™ is a complete Internet of Things (IoT) hardware and software platform that includes real-time flood gauges, a range of environmental sensing capabilities, powerful cloud-based data storage and analytics, rule-based alerts, and easy-to-use web/mobile dashboard. The sensor nodes include stage (water-level) immersible and non-contact gauges in addition to plug-in ports for external SDI-12 and analog-output sensor instruments. The system supports ALERT2 protocol and can integrate with 3rd party software including ContarilTM. The sensor nodes operate on a cost-effective cellular network with automatic backup Iridium satellite link when cellular network is not available. The nodes also have optional local wireless mesh and LoRa wireless capability. The SensiFlood IoT network is self-configured while can be also remotely configured through a cloud software interface. The sensor nodes support two-way communications and provide optional control and activation ports for external equipment. The stage and elevation levels are recorded with a typical 0.05 ft of accuracy in the cloud database. The nodes include GPS, ambient pressure, and temperature sensors. The sensors nodes integrate optional camera and rain-gauge sensors as well in addition to SDI-12 sensor instruments. The sensor electronic node is powered by a solar panel and has internal rechargeable battery supporting the operation over 7 days without any charge. The sensor nodes are rugged with corrosion free outdoors operation in -40C to 80C temperature range, with IP68 water-immersible and dust-tight package rating. The sensor system cloud software provides sensor data analytics and user programmable alerts for flash-flooding, storm-surge and dam-breach, as well as stream-gauge data logging. The cloud sensor database and alerts for the external sensors are supported as well.
Hohonu
The Hohonu is a low-cost, solar-powered, internet-connected hardware that captures data at comparable accuracy to industry-standard gauges. Hohonu gauges are mounted on a fixed structure above water. They measure the distance from the sensor to the water surface by measuring the time-of-flight of ultrasound (ping, then listen for echo). This variable is named d2w ("distance to water"). Since the mount height is fixed relative to the bottom of the water body, e.g. the side of a bridge or a pier, water depth can be inferred by subtracting d2w from the height of the sensor. The operating range of the ultrasonic

Flood Resilience
distance sensors is typically 0.3 to 5 meters, though a few recent ones are now equipped with 0.5~10 meter sensors. Resolution is 1 mm while accuracy is TBD with internal temperature compensation. The temperature sensor measures the housing temperature. It does not directly measure the temperature of the air column. There are two types of tide gauges in terms of the data link used: an XBee version (900 MHz ISM-band), and a cellular (2G/3G/LTE) version. The XBee version requires on-site internet gateway for internet access, while the cellular ones connect to the internet directly. There is no non-volatile data memory in the tide gauges.
The Hohonu gauges are solar powered with battery backup (lithium rechargeable from 11 Wh to 26 Wh depending on configuration). The cellular version can operate without solar input for 7~22 days (depends on battery configuration, firmware+hardware revision, and cellular signal strength), while the 900MHz version would last about 30 days. The cellular version would shut down for 24 hours when battery charge is low. It then checks battery level every 24 hr. It only resumes operation if battery charge level is above threshold (~3.6V for recent deployments).
Onset HOBO MicroRX
The HOBO MicroRX Water Level Station is a cellular, web-enabled water level monitoring solution for stormwater, floodwater, irrigation, hydrologic, and environmental applications. Pre-programmed water flow formulas for select weirs, flumes, and a stage discharge table result in an easy and intuitive configuration. Water flow and accumulated rainfall calculations, which are performed directly on the station at time of measurement, trigger immediate notifications of critical water level conditions.
The compact and durable station, together with the non-vented water level sensor, enables harsh condition deployments and reliable monitoring. The optional integrated solar panel or battery power, with a wide range of plug-and-play smart sensors, supports flexible environmental monitoring.
Logged data from the station is transferred at regular connection intervals to HOBOlink® webbased software where you can check the latest conditions, view graphs, configure sensors and alarms, set up a dashboard, download your data, or schedule data delivery via email or FTP. Inside its weatherproof enclosure, this compact station has a built-in LCD screen to check the current system configuration and status, start and stop logging, add and remove smart sensors, and connect to HOBOlink on demand.
Intellisense
Intellisense’s AWARE Flood system consists of a rugged, low-cost, IoT connected flood sensor to remotely
monitor waterways and provide emergency notice in real-time to public and first responders to address
the number one leading natural disaster in deaths and costs. AWARE stands for Advance Warning
Equipment, which embodies the design’s core capability as an early warning system for natural disasters
and environmental monitoring.
Scenic Consulting Group-Triangle UAS Joint Venture
Our ultrasonic stream gage aims to lower the cost and size of traditional USGS style gages by incorporating
ultrasonic and IoT technology. We hope that the reduced size will allow single person installation and
maintenance as well as provide more versatility in mounting locations. The gage measures 6” x 9’ x 2.5”.
It has a solar charging system and can last about 31 days without any sunlight. Connectivity options include
cellular (for urban areas), satellite (for extremely rural areas), and WiFi for clients with existing
infrastructure. The data can be custom mapped to any protocol, with the test units feeding Contrail

Flood Resilience
directly. With quick plug-in parts, maintenance effort can be reduced so that no specialized knowledge is
needed to replace malfunctioning components. Our gage have also incorporated a watchdog circuit that
will automatically reset the device if it detects any issues. The sensor has a bug resistant design that helps
it avoid interference from organisms that traditionally affect ultrasonic horns. The lower cost of our
system is meant to encourage widespread deployment, helping to add a majority of the waterways into a
client’s sensor network. Future development pathways include manufacturing a radar version for
increased range, precision, and environmental flexibility.
1.3. Gage Installation:
Due to the small size the majority of the sensors were installed on metal fence post (figure 3b and 3c).
One of the sensors was installed on a wooden post per a request from the equipment vendor (figure 3a).
.
(a)
(b) (c) (d)
Figure 3. The Sensors: a) LB Foster, b) Green Stream, c) Evigia with rain gauge (left) and Intellisense
(right), and d) a staff gauge and a camera.

Flood Resilience
The pressure sensor to measure the water level was installed on a fence post near the pond/stream and
the sensor cable was installed from the sensor into the pond/creek. A metal fence post was installed in
the pond/stream and the sensor was attached the metal post.
The ultrasonic sensor to measure the water surface was installed in the pond on a metal pole so that the
ultrasonic sensor has direct line of sight to the water surface. The ultrasonic sensors that were installed
at test site #2 and #3 was attached to the bridge railing.
The project team is in the process of installing a Valarm radar sensor and Campbell Scientific rain gauge.
With the addition of a radar sensor, the test site will be composed of a variety of sensor types that will be
utilized by federal, state, county, and city agencies in North Carolina.
Issues and concerns during gage installation:
The team noticed many issues during the testbeds development.
Communication issues that cause loss of data from sensor, which could be critical during a flood
event as well as data service expiring during the test period.
Solar panel was not properly charging the unit and sensors go offline.
Pressure sensor damaged by velocity of water or hit by debris and no water level information can be
provided once sensor or sensor cable is damaged.
Cable connection at the sensor in the water damaged by water velocity/debris. Cable and sensor
were replaced in order to obtain water level observations from the impacted sensor.
Available of different unit values (one gage could only be setup initially to measure water height in
inches). This causes issues comparing data with the baseline data and the potential to introduce
errors when perform data conversion to a common unit. Sensor software should offer a variety of
units available, including feet and meters.
Moisture inside a gage control unit can lead to equipment damage and loss of data from the sensor.
Unit would not turn on. Company is investigating reason for water getting inside of the sensor
equipment enclosure.
Ultrasonic units impacted by spider webs growing into the sensor cone that causes incorrect sensor
measurements (figure 4). Spider webs cause noisy water level readings until spider webs were
removed from sensor cones.
Figure 4. Example of spider webs in the cone of an ultrasonic sensor.

Flood Resilience
1.4. Data Access- IOT:
Real time and accurate measurement of the water level is a crucial step for monitoring and management
of water resources. Thanks to the widespread implementation of the Internet of Things (IoT) sensors and
relays, the information on the water level in the monitored areas can be transmitted to the corresponding
management offices in orders to detect whether a gauge measurement is exceeding a certain threshold
which in turn, may trigger a set of protocol operations for disaster prevention/management.
One of the goals of developing of test sites is to enable upload of the gauge data in the Flood Inundation
Mapping Alert Network (FIMAN) from a variety of sources (federal, state, local, and private sector). For
each of the gauges installed at the test sites we worked with the company that provided the gauge to
develop protocols for incorporating their gauge data into FIMAN. At the time of the report four of the
gauges at the test sites are uploading data into Contrail (software used to collect gauge data). North
Carolina Emergency Management uses Contrail a software provided by OneRain to collect gauge data and
upload the data into FIMAN. OneRain has worked with the test site companies and NCEM to support
incorporating data into Contrail.
Figure 5. Example of Onset Hobo sensor data imported into the Contrail software.
2. Autonomous Water Gauge Measurement for Flood Monitoring
In recent years and with the advent of IoT and cloud computing, the surveillance technology for water
monitoring has been revolutionized due to the availability of high resolution and portable cameras, robust
image processing techniques, and cloud-enabled data fusion centers. Consequently, ubiquitous online
monitoring of the large water bodies such as lakes and rivers is becoming a standard configuration for the
gauging stations. However, despite the potential advantages of the online monitoring of the rivers’ and
lakes’ water level, there are some technical challenges that need to be addressed before it can be fully
utilized. In particular, automatic identification of exact water level reading is a challenging task due to
distortions in the received images, the ambient noise, camera tilt, and low imaging resolution. Using the
NC Collaboratory funds, we worked on a novel water level measurement method to extract the exact
water level from the gauge images in the presence of image distortions. In the proposed setup, we employ
a camera surveillance system for monitoring the water level of large water bodies that benefits from some
practical features such as easy and on demand installation, low-cost equipment, and reasonable
maintenance cost. The proposed method employs advanced image processing techniques to accurately
read the water level from the images obtained by on-site recording. This method offers automatic and

Flood Resilience
instantaneous water stage figure which can be incorporated in the disaster prevention engineering as well
as water resource management systems. Figure 1 shows the work flow used in the research.
Figure 4. The workflow for automatic reading the water level from the gauge images.
Noise Reduction: To develop a reliable image identification technique, it is of crucial importance to having
a clear and translucent set of images in hand. Thus, the primary step is to eliminate the background noise
in order to filter out the essential information from the image.
Grayscale Transformation: In order to reduce the amount of irrelevant information in our study, we
employ grayscale transformation. the color components R (Red), G (Green), and B (Blue) are transformed
into black and white with brightness level ranging from 0 to 255 in which 0 is associated absolute lack of
light intensity (i.e., black color), while 255 corresponds to the maximum brightness (i.e., white color).
Image Segmentation: A thresholding-based image segmentation was implemented to detect the staff
gauge and water line. The thresholding assumption stems from the fact that on-site images taken in the
daylight, show significant difference in the grayscale level between the staff gauge and the water surface.
This is due to the common high contrast materials of the staff gauge which are designed for better
visibility. Moreover, the random fluctuation on the water surface makes the water level to stand out in
the grayscale image.
Image Tilt Correction: The tilt viewing angle can impose undesirable impacts on the gauge reading due to
the change in perspective. Thus, it is of crucial importance to correct the tilting angle before proceeding
with the actual reading of the gauge numbers. The image tilt correction is an image processing technique
which edits the image perspective in such a way that it better conforms to the expected proportions.

Flood Resilience
Edge Detection: The Laplacian method, one of the most efficient and accurate mechanisms for edge
detection, was implemented to detect the water gage lines.
Gauge Line Detection: To read the water level from the gauge. Although it is possible to directly read the
gauge numbers by employing neural networks, it does not lead to the most accurate reading as the water
level may be anywhere between two numbers. Moreover, most commercial gauges do not enumerate
the sub sections between the integer numbers. Thus, to get the most accurate reading of the water level
gauge, it is necessary to detect the gauge lines and perform the readings based on the relative location of
the water level with respect to these lines.
Water Level Reading: Detecting the distance between two gauge marks is essential as it provides a
measure to detect the actual water level. Once this measure is acquired with a reasonable confidence
interval, we can find the actual water level by using a simple scaling procedure.
A real-time image obtained during a flood is efficacious and valuable source of information. In this
research, we investigated image processing methods for automatic water level measurement which is a
critical step for providing timely, detailed, and accurate flood inundation information to local community
officials and the public to reduce the loss of life and flood related property damage. This research proposes
a novel methodology for real-time water level measurement while taking into account the practical
scenarios where the on-site camera is displaced, or the ambient light is not enough for obtaining a high-
quality image. Therefore, the findings of this study suggest that applying image recording and
identification for measuring water level is an effective approach for extracting necessary information
during the flood. This information can be used to launch a timely and well-thought operation to prevent
or at least minimize the potential damages. In particular, the goal of this study was to provide the
observers and decision-makers with valuable information about the intensity and the depth of the flooded
areas which can be used for flood prevention engineering design for disaster management protocols. In
this research, the image identification process entailed image processing principles, such as noise filtering,
grayscale transformation, tilt correction, wavelet analysis, image segmentation, and edge detection. The
proposed algorithm is especially suitable for IoT-based online water level monitoring where the on-site
images captured by the camera can be efficiently processed using the cloud-based computation toolkits.
The simulation results prove that the proposed method provides reliable measurement even in low
ambient light environments or when the original image is distorted due to undesired movements of the
camera, which is a common scenario during intense wind and flood.
(a) Original image (b) Noise reduction and gray scale

Flood Resilience
(c) Tilt correction (d) Hough transform and edge detectio
Figure 5. Water level acquisition in late evening with dim ambient light.
Effective Inundation Mapping and Water Depth Extraction In Support of
Flood Management (Project 2.2)
Flood occurrence is increasing due to the expansion of urbanization and extreme weather like hurricanes;
hence, research on methods of inundation monitoring and mapping has increased to reduce the severe
impacts of flood disasters. This research studies and compares two methods for inundation depth
estimation using UAV images and topographic data. The methods consist of three main stages:
(1) Extracting flooded areas and create 2D inundation polygons using deep learning;
(2) Reconstructing 3D water surface using the polygons and topographic data; and
(3) Deriving a water depth map using the 3D reconstructed water surface and a pre-flood DEM.
The two methods are different at reconstructing the 3D water surface (stage 2). The first method uses
structure from motion (SfM) for creating a point cloud of the area, and the water polygons resulted from
stage 1 is applied for water point cloud classification. While the second method reconstructs the water
surface by intersecting the water polygons and a pre-flood DEM. We evaluate the proposed methods for
inundation depth mapping over the Town of Princeville during a flooding event during Hurricane
Matthew. The methods are compared and validated using the USGS gauge water level data acquired
during the flood event. The RMSEs for water depth using the SfM method and integrated method based
on deep learning and DEM were 0.34m and 0.26m, respectively.

Flood Resilience
Figure 6. The proposed methods for floodwater depth estimation
The town of Princeville, a flood-prone area in North Carolina in the USA was selected as our study area
for this research. Princeville is located along the Tar River in Edgecombe County and has been seriously
affected by several flood events including Hurricane Floyd and Hurricane Matthew. They both caused
widespread devastation when the Tar river flowed over the town of Princeville.
Figure 7. Study area - Princeville, North Carolina

Flood Resilience
The datasets used for the study include UAV imagery and Lidar data, which were acquired by North
Carolina Emergency Management. The flood imagery in Princeville was collected during Hurricane
Matthew in 2016 using a Trimble UX5 fixed-wing UAV. Each image consisted of three bands (RGB) at 2.6
cm spatial resolution. The LiDAR data was acquired in 2014 with two pulses per square meter (pls/m2)
with an accuracy of 9.25-cm RMSE and was used to generate pre-flood DEM over the town of Princeville.
We also collected the USGS Surface Water Gauge station information on the study area from the NOAA
website. USGS Gauge Stations collect time-series data that describe stream levels, streamflow or
discharge, reservoir and lake levels, surface-water quality, and rainfall.
Team Through these projects, we were able to provide post-doc, graduate and undergraduate students with rich and challenging research experiences in remote sensing and photogrammetry. One Postdoc in Machine Learning, One PhD student in Applied Science and Technology, and two Undergraduate Students in Geomatics were involved in the theoretical and practical aspects of this project. The PI worked closely with these students, conducting regular individual and group meetings on the project. In addition, NC Emergency Management, the project collaborator, contributed and supported the project by developing the testbed and implementing GCPs in the study areas and providing required information to process the flood data.
Products
1. Infrastructures:
Through the project 2 testbed were developed and many water sensors were purchased. The testbeds and sensors can be used for many different research on flood resilience study
2. Presentations:
Gebrehiwot, A., Hashemi-Beni, L., A Method to Generate Flood Maps in 3D Using UAV and Lidar Data, Accepted, ASPRS Annual Conference and International Lidar Mapping Forum, Washington, DC, March 23-25, 2020 (Published in the Proceeding).
Gebrehiwot, A., UAV Imagery Segmentation based on Convolutional Neural Network for Flood Management applications, Bahamas Department of Land and Surveys Campus Visit, April 11th, 2019.
Hashemi-Beni, L., (2020), Machine Learning in support of Flood Resilience, NSF PI Meeting. Gebrehiwot, A., (2020), Deep Learning Flood Mapping using UAV Optical Images. NC ASPRS
Student Research Symposium. Thompson, G., (2020), Presentation to Texas A&M University - Corpus Christi Director of the
Texas Spatial Reference Center, Geomatics / GIS Program, March 5, 2020 Koltyk,C,, Langan, T., Thompson, G., (2020), Modeling, Measuring and Scenario Planning for
Extreme Weather, Environmental Defense Fund workshop, March 19, 2020. Thompson, G., (2020), North Carolina Association of Floodplain Managers webinar, October 8,
2020.

Flood Resilience
Thompson, G., (2020), Geodetic Survey Advisory Committee meeting, June17 and November 2, 2020.
3. Peer-Reviewed Publications:
Hashemi Beni, L., Gebrehiwot, A. (2020) An Integrated Method using Deep Learning and Region Growing Method, Remote Sensing, IEEE Journal of Selected Topics in Applied Earth Observations and Remote Sensing, In Press.
Gebrehiwot, A., Hashemi Beni, L., (2020) Automated Inundation Mapping: Comparison of Methods, IEEE IGARSS 2020, In Press.
Hashemi-Beni L., Thompson, G. (2020) Autonomous Water Gauge Measurement for Flood Monitoring, Sensor, Under Revision.
Gebrehiwot, A., Hashemi Beni, L. (2020) Inundation Depth Mapping using Deep Learning and DEM, International Journal of Geo-information, Under review.
4. Proposal Development:
The NC Collaboratory projects help the PI to develop many proposals, including:
“Rapid floodwater extent and depth measurements using Optical UAV and SAR”, NOAA, 2021-2023, ($475,000), PI: L. Hashemi-Beni, Co-PI: G. Thompson (NCEM) and J. Dorton (SECOORA). pre-proposal accepted 10/2020, proposal submitted 11/2020.
“CAREER: An Integrated Research and Education Program to Advance Multisource and Multitemporal Geospatial and Remote Sensing Data Fusion and Classification”, NSF, 2021 – 2026, ($599,000), PI: L. Hashemi-Beni, Co-PI: - , submitted 08/2020.
“AI Institute: Customized Optimization for Real-world Problem Solving”, NSF. 2021 -2026, (MSU: $20,000,000, NCAT Subcontract: $1,750,000), NCAT PI: A. Homaifar, Co-PI: L. Hashemi-Beni (Lead for Flood Mapping of the center), A. Karimoddini. Submitted 12/20

Flood Resilience
Appendix 1: Reference Points North (N) Church Street Bridge over North Buffalo Creek reference mark data sheet (Test Site #2).
Elevation reference information for Test Site #1

Flood Resilience
Elevation reference information for Test Site #3
Acronyms
RM = Reference Mark
NAVD88 = North American Vertical Datum of 1988USFT = US Survey Foot
ft = US Survey Foot
NE = Northeast
SE = Southeast