Flood Maps for the Winooski River in Waterbury, Vermont, 2014 · Flood Maps for the Winooski River...
38
Prepared in cooperation with the Federal Emergency Management Agency Flood Maps for the Winooski River in Waterbury, Vermont, 2014 Scientific Investigations Report 2015–5077 U.S. Department of the Interior U.S. Geological Survey
Transcript of Flood Maps for the Winooski River in Waterbury, Vermont, 2014 · Flood Maps for the Winooski River...

Prepared in cooperation with the Federal Emergency Management Agency
Flood Maps for the Winooski River in Waterbury, Vermont, 2014
Scientific Investigations Report 2015–5077
U.S. Department of the InteriorU.S. Geological Survey

Cover. One-percent annual exceedance probability flood boundaries on the Winooski River in the Waterbury, Vermont, vicinity.

Flood Maps for the Winooski River in Waterbury, Vermont, 2014
By Scott A. Olson
Prepared in cooperation with the Federal Emergency Management Agency
Scientific Investigations Report 2015–5077
U.S. Department of the InteriorU.S. Geological Survey

U.S. Department of the InteriorSALLY JEWELL, Secretary
U.S. Geological SurveySuzette M. Kimball, Acting Director
U.S. Geological Survey, Reston, Virginia: 2015
For more information on the USGS—the Federal source for science about the Earth, its natural and living resources, natural hazards, and the environment—visit http://www.usgs.gov/ or call 1–888–ASK–USGS.
For an overview of USGS information products, including maps, imagery, and publications, visit http://www.usgs.gov/pubprod/.
Any use of trade, firm, or product names is for descriptive purposes only and does not imply endorsement by the U.S. Government.
Although this information product, for the most part, is in the public domain, it also may contain copyrighted materials as noted in the text. Permission to reproduce copyrighted items must be secured from the copyright owner.
Suggested citation:Olson, S.A., 2015, Flood maps for the Winooski River in Waterbury, Vermont, 2014: U.S. Geological Survey Scientific Investigations Report 2015–5077, 25 p., http://dx.doi.org/10.3133/sir20155077.
ISSN 2328-0328 (online)

iii
Acknowledgments
The author thanks the Department of Conservation of the Vermont Agency of Natural Resources for funding the streamgage operations at the Winooski River above Crossett Bk at Waterbury, Vermont. The author is also grateful to the consulting firm Milone and MacBroom, Inc., of Waterbury, Vermont, for providing the elevation data for cross sections in the Village of Waterbury. Special thanks are given to the National Weather Service for their continued support of the U.S. Geological Survey flood-inundation mapping program. The author wishes to thank the following U.S. Geological Survey personnel who assisted with the collection of data in this report: Adam Hudziec, Andrew Massey, Lance Ostiguy, Kelseyann Regan, Thor Smith, Jason Sorenson, and Marc Zimmerman.


v
Contents
Abstract ...........................................................................................................................................................1Introduction.....................................................................................................................................................1
Purpose and Scope ..............................................................................................................................3Study Area Description ........................................................................................................................3Previous Studies ...................................................................................................................................4
Creation of Flood Maps .................................................................................................................................4Estimation of Flood Discharges ..........................................................................................................4Topographic and Bathymetric Data and Geometry of Riverine Structures ................................6Development of the Hydraulic Model ................................................................................................6Annual Exceedance Probability of Flooding From Tropical Storm Irene .....................................7Development of Flood-Recovery and Flood-Inundation Maps .....................................................8
Availability of Flood-Recovery and Flood-Inundation Maps ...................................................................8Disclaimer for Flood-Inundation Maps .............................................................................................8Uncertainties and Limitations Regarding Use of Flood-Recovery and
Flood-Inundation Maps ..........................................................................................................8Summary..........................................................................................................................................................9Selected References ...................................................................................................................................10Appendix 1. Flood-Recovery Map for the Winooski River in Waterbury, Vermont .......................13Appendix 2. Water-Surface Elevations for Flooding at Selected Annual Exceedance
Probabilities and Estimated Tropical Storm Irene Flooding on the Winooski River in Waterbury, Vermont ...................................................................................................................15
Appendix 3. Floodway Data for the Winooski River in Waterbury, Vermont ..................................19Appendix 4. Water-Surface Elevations of the Winooski River in Waterbury, Vermont, for
Selected Stages at the Winooski River Above Crossett Bk at Waterbury, VT (04288040) Streamgage ..............................................................................................................23
Figures 1. Map showing the Winooski River study reach in Waterbury, Vermont, and the
locations of the Winooski River above Crossett Bk at Waterbury, VT (0428804) and Little River near Waterbury, VT (04289000) streamgages ......................................................2
2. Screenshot of the Flood Inundation Mapper Web application showing an example of a flood-inundation map for the Winooski River at Waterbury, Vermont, corresponding to a stage of 425 feet at the U.S. Geological Survey Winooski River above Crossett Bk at Waterbury, VT (04288040) streamgage ...............................................9

vi
Tables 1. U.S. Geological Survey streamgage information for Winooski River at
Waterbury, Vermont .....................................................................................................................3 2. Estimated flood discharges for the Winooski River streamgages and the
Winooski River study reach in Waterbury, Vermont ...............................................................5 3. Estimated flood discharges for the Winooski River flood-inundation mapping
model for Waterbury, Vermont ...................................................................................................6 4. Simulated water-surface elevations and surveyed high-water marks at selected
locations along the Winooski River, Vermont, study reach, and the difference between them, for the Tropical Storm Irene model ................................................................7
Conversion FactorsInch/Pound to International System of Units
Multiply By To obtain
Length
foot (ft) 0.3048 meter (m)mile (mi) 1.609 kilometer (km)
Area
square mile (mi2) 2.590 square kilometer (km2)Discharge
cubic foot per second (ft3/s) 0.02832 cubic meter per second (m3/s)
Temperature in degrees Fahrenheit (°F) may be converted to degrees Celsius (°C) as °C = (°F – 32) / 1.8.
Datum
Vertical coordinate information is referenced to (1) stage, the height above an arbitrary datum established at a streamgage, and (2) elevation, the height above the North American Vertical Datum of 1988 (NAVD 88).
Horizontal coordinate information is referenced to the North American Datum of 1983 (NAD 83).
Elevation, as used in this report, refers to distance above the vertical datum.

vii
Abbreviations
AHPS Advanced Hydrologic Prediction Service
AEP annual exceedance probability
DGPS differential global positioning system
FEMA Federal Emergency Management Agency
FIRM flood-insurance rate map
FIS flood insurance study
GIS geographic information system
NWS National Weather Service
RTK real-time kinetic technology
USGS U.S. Geological Survey


Flood Maps for the Winooski River in Waterbury, Vermont, 2014
By Scott A. Olson
AbstractFrom August 28 to 29, 2011, Tropical Storm Irene
delivered rainfall ranging from approximately 4 to more than 7 inches in the Winooski River Basin in Vermont. The rainfall resulted in severe flooding throughout the basin and significant damage along the Winooski River. In response to the flooding, the U.S. Geological Survey (USGS), in cooperation with the Federal Emergency Management Agency, conducted a new flood study to aid in flood recovery and restoration and to assist in flood forecasting. The study resulted in two sets of flood maps that depict the flooding for an 8.3-mile reach of the Winooski River from about 1,000 feet downstream of the Waterbury-Bolton, Vermont, town line upstream to about 2,000 feet upstream of the Waterbury-Middlesex, Vt., town line.
The first set of maps consists of flood-recovery maps depicting the boundaries of floodwaters at the 10-, 4-, 2-, 1-, and 0.2-percent annual exceedance probability (AEP) discharges, the boundaries of the floodway, and the boundaries of floodwaters from Tropical Storm Irene as estimated by a hydraulic model. The second set of maps consists of flood-inundation maps depicting the areal extent and depth of flooding corresponding to selected water levels (stages) at the USGS Winooski River above Crossett Bk at Waterbury, VT (04288040) streamgage. The maps correspond to streamgage water levels ranging from 417.0 to 431.0 feet in 2-foot increments. The availability of these flood-inundation maps along with current stage from the USGS streamgage obtained from a USGS Web site will provide emergency management personnel and residents with information that is critical for flood response activities such as evacuations and road closures, as well as for post-flood recovery efforts. These flood inundation maps can be accessed through the USGS Flood Inundation Mapping Science Web site (http://water.usgs.gov/osw/flood_inundation/).
To generate the maps, flood profiles for the Winooski River were developed. The U.S. Army Corps of Engineers one-dimensional step-backwater Hydrologic Engineering Center River Analysis System model (HEC–RAS), was used to compute the water-surface profiles along the study reach.
The simulated water-surface profiles were then combined with a geographic information system digital elevation model derived from light detection and ranging (lidar) data with a vertical accuracy that meets or exceeds vertical national map accuracy standards for 2-foot contour mapping to delineate the area flooded for each water-surface profile.
High-water marks from Tropical Storm Irene were available for seven locations along the study reach. The high-water marks were used to estimate water-surface profiles and discharges resulting from Tropical Storm Irene throughout the study reach. From a comparison of the estimated water-surface profile for Tropical Storm Irene with the water-surface profiles for the 1- and 0.2-percent annual exceedance probability (AEP) floods, it was determined that the high-water elevations resulting from Tropical Storm Irene exceeded the estimated 1-percent AEP flood throughout the Winooski River study reach but did not exceed the estimated 0.2-percent AEP flood at any location within the study reach.
Introduction
During August 28–29, 2011, record-breaking rainfall from Tropical Storm Irene resulted in extensive flooding across much of Vermont. In the Winooski River valley, the flooding resulted in extensive property damage and destruc-tion of transportation corridors. In response to the flooding, President Obama made a presidential declaration of a major disaster for the State of Vermont under the Stafford Act.1 The Winooski River reach was selected because of the significant flood damage that occurred during Tropical Storm Irene and the availability of light detection and ranging (lidar) based dig-ital elevation models. The study reach includes 8.3 miles (mi) of the Winooski River from approximately 1,000 feet (ft) downstream of the Waterbury-Bolton town line upstream to approximately 2,000 ft upstream of the Waterbury-Middlesex town line (fig. 1).
1Robert T. Stafford Disaster Relief and Emergency Assistance Act, Public Law 93–288 (codified as amended at 42 U.S.C. §§5121–5207).

2 Flood Maps for the Winooski River in Waterbury, Vermont, 2014
#
#
Moretown
Duxbury
Bolton
Waterbury Thatcher
Brook
Littl
e Ri
ver
VERMONT
Middlesex
Ridl
ey B
rook
Crossett Brook
Little River near Waterbury, Vermont
Winooski River above Crossett Brook at Waterbury, Vermont
U.S. ROUTE 2
INTERSTATE 89
STAT
E RO
UTE
100
STAT
E RO
UTE
100
Winooski River
72°42'72°44'72°46'72°48'72°50'
44°22'
44°20'
44°18'
Base map from U.S. Geological Survey National Boundary Dataset, 1:24,000, 2014U.S. Geological Survey National Transportation Dataset, 1:24,000, 2014
Map location
Bolton Falls Dam
EXPLANATION
Studied river reach
Highway
Town boundaries
Streamgage and identifier#
Village of Waterbury
River or stream
Waterbury Reservoir
0 10.5 1.5
0.5 1.5
2 MILES
0 1 2 KILOMETERS
Figure 1. The Winooski River study reach in Waterbury, Vermont, and the locations of the Winooski River above Crossett Bk at Waterbury, VT (0428804) and Little River near Waterbury, VT (04289000) streamgages.

Introduction 3
To address a component of the disaster declaration, the U.S. Geological Survey (USGS), in cooperation with the Federal Emergency Management Agency (FEMA), has produced a series of flood-recovery and flood-inundation maps. The flood-recovery maps show the extent of flooding from Tropical Storm Irene, as well as flood boundaries for discharge with a 10-, 4-, 2-, 1- and 0.2-percent annual exceedance probability (AEP) and the floodway. These flood-recovery maps are for advisory purposes and do not supersede the effective flood insurance rate maps (FIRMs; Federal Emergency Management Agency, 2013).
The flood-inundation maps depict the areal extent and depth of flooding corresponding to selected water levels (stages) at the USGS Winooski River above Crossett Bk at Waterbury, VT (04288040) streamgage. The streamgage water levels ranged from 417.0 to 431.0 ft in 2-ft increments (table 1). The 417.0-ft stage is approximately bankfull and is defined by the National Weather Service (NWS) as the flood action stage (National Weather Service, 2014) or that stage that, when reached by a rising stream, requires the NWS or a partner to take mitigation action in preparation for possible significant hydrologic activity. The 431.0-ft stage exceeds the stage that corresponds to the estimated 0.2-percent AEP flood. It should be noted that this streamgage is a stage-only streamgage, and discharge is not computed as part of its real-time record. The real-time stage reported for the Winooski River above Crossett Bk at Waterbury, VT streamgage can be translated into water-surface elevations, flood depths, and areal extent of flooding along the Winooski River in Waterbury, Vermont, by referring to the map that corresponds to the streamgage’s stage. By referring to the appropriate map, emergency responders can discern the severity of flooding and identify flooded roads and areas that require evacuation upstream and downstream from the streamgage.
Purpose and Scope
This report describes the development of a series of estimated flood-recovery and flood-inundation maps for the Winooski River in Waterbury and identifies the Web site where the maps are found. The flood-recovery maps show the extent of flooding from Tropical Storm Irene, as well as flood boundaries as a result of floods with a 10-, 4-, 2-, 1- or 0.2-percent AEP and the floodway in Waterbury. The purpose of the flood-recovery maps is to provide local government and citizens with accurate and up-to-date information on flood hazards to aid in the rebuilding process. The flood-inundation maps depict flooding corresponding to stages at the USGS Winooski River above Crossett Bk at Waterbury, VT (04288040) streamgage ranging from 417.0 to 431.0 ft in 2-ft increments (table 1). These flood-inundation maps along with current stage from the USGS streamgage obtained from a USGS Web site will provide emergency management person-nel and residents with information that is critical for flood response activities such as evacuations and road closures, as well as for postflood recovery efforts.
Study Area Description
Waterbury is a town in central Vermont with a popula-tion of 5,064 in 2010. Of those, 1,763 lived in Village of Waterbury, which is on the banks of the Winooski River on the southern side of the town (U.S. Census Bureau, 2014). The Winooski River flows east to west and forms the southern border of the Town of Waterbury. Duxbury, Vt., is across the river from Waterbury. Waterbury receives 42 inches of rain annually and has a mean annual high temperature of 55 degrees Fahrenheit (°F) and a mean annual low temperature of 32 °F (PRISM Group, 2012a–c).
Table 1. U.S. Geological Survey streamgage information for Winooski River at Waterbury, Vermont.
[Bk, Brook; VT, Vermont]
Characteristic Parameter
Station name Winooski River above Crossett Bk at Waterbury, VTStation number 04288040Drainage area, in square miles 672Latitude 44°19ʹ42.37″Longitude 72°44ʹ46.25″Date of establishment April 1991Maximum stage since establishment, in feet above the
North American Vertical Datum of 1988a429.3
aFrom a high-water mark 100 feet downstream of the streamgage.

4 Flood Maps for the Winooski River in Waterbury, Vermont, 2014
The Winooski River study reach consists of the entire portion of the river abutting Waterbury and extends 1,000 ft downstream of the Waterbury-Bolton, Vt., town line and 2,000 ft upstream of the Waterbury-Middlesex, Vt., town line. The drainage basin of the river at the study reach is primarily forested, whereas the valleys often have agricultural and residential uses. The drainage area at the downstream end of study reach is 836 square miles (mi2). The elevation of the river at the downstream end of the study reach is approximately 340 ft above the North American Vertical Datum of 1988 (NAVD 88). The basin has relatively steep upland slopes at relatively high elevations—97.6 percent of the basin is at elevations above 1,200 ft. There are a few peaks in the basin whose elevations exceed 4,000 ft. Much of the Winooski River study reach has broad floodplains that serve agricultural purposes. A portion of the Village of Waterbury occupies the floodplain.
The length of the Winooski River study reach is 8.3 mi. The channel changes approximately 100 ft in elevation along the reach. Near the downstream end of the study reach is Bolton Falls Dam. This dam was built on a natural falls area and is used to generate electricity. The fall at the dam is approximately 50 ft. In addition to the dam, the study reach is traversed by two automobile bridges, a railroad bridge, and a snowmobile-trail suspension bridge.
About halfway through the study reach is the confluence of the Winooski River and the Little River. The Little River is a relatively large tributary and has a drainage area of 112 mi2; it has a flood control reservoir with usable storage of 2.81 billion cubic feet at a drainage area of 108 mi2. Additional flood control reservoirs in the Winooski River Basin upstream from the study reach combine for an additional 1.87 billion cubic feet of usable storage (Keirstead and others, 2004).
Previous Studies
The flood insurance study (FIS) for Washington County, Vt. (Federal Emergency Management Agency, 2013), includes Waterbury and the Village of Waterbury, Vt. It is the effective FIS for Waterbury and was completed by ECJ–KCE Consul-tant Engineers in 1981, then updated by Green International Affiliates, Inc. in 1998.
New hydrologic estimates were made and new hydraulic models were developed for this investigation. The results of the study provided in this report and the recovery maps are for advisory purposes for the towns. The results and maps do not supersede the effective FISs or the FIRMs.
Creation of Flood MapsTasks specific to development of the flood-recovery and
flood-inundation maps for the Winooski River study reach in Waterbury were (1) estimation of flood discharges at the 10-, 4-, 2-, 1-, and 0.2-percent AEPs, (2) collection of topographic
and bathymetric data for cross sections and geometric data for structures and bridges along the study reach, (3) development of the hydraulic model for the study reach and computation of the water-surface profiles for the AEP flood discharges using the U.S. Army Corps of Engineers Hydrologic Engineering Center River Analysis System (HEC–RAS) computer program (U.S. Army Corps of Engineers, 2010), (4) development of hydraulic models with adjusted discharges corresponding to specific water-surface elevations at the Winooski River above Crossett Bk at Waterbury, VT, streamgage, and (5) production of estimated flood maps for the simulated water-surface pro-files using the U.S. Army Corps of Engineers HEC–GeoRAS computer program (U.S. Army Corps of Engineers, 2010) and a geographic information system (GIS). The flood maps con-sist of flood-recovery maps at selected AEPs (appendix 1) and flood-inundation maps for selected stages at the streamgage (http://wim.usgs.gov/FIMI/FloodInundationMapper.html).
Estimation of Flood Discharges
Flood discharges at the 10-, 4-, 2-, 1-, and 0.2-percent AEPs were estimated for the Winooski River study reach. There are two continuous recording Winooski River streamgages, the Winooski River near Essex Junction, VT2 (04290500) streamgage with a drainage area of 1,040 mi2 and the Winooski River at Montpelier, VT (04286000) streamgage with a drainage area of 395 mi2.
Reservoirs affect peak-discharge hydrology for the Winooski River. Useable storage for the reservoirs upstream from the Montpelier streamgage total 1.87 billion cubic feet, which is used for flood control. This results in 4.73 million cubic feet of storage per square mile of drainage area at the streamgage in Montpelier. At the Essex Junction streamgage the combined upstream storage is 4.48 billion cubic feet resulting in 4.31 million cubic feet of storage per square mile of drainage. According to Benson (1962), peak discharges are affected by less than 10 percent in New England when storage is 4.5 million cubic feet per square mile or less. Using this as criterion for defining peak discharges as regulated or unregulated, the peak discharges at the Montpelier and Essex Junction streamgages are best described as marginally regulated.
Because storage per square mile of drainage area above the Montpelier streamgage was greater than—but close to—Benson’s criterion and storage per square mile of drainage area above the Essex Junction streamgage was slightly less than the criterion, the peak discharges for both streamgages were treated as unregulated in the frequency analysis. This allowed the frequency curves at each of the gages to be determined using the generalized skew reported in Olson (2014); it also allowed for the results to be weighted with the regression equations in Olson (2014) and the results between
2The Winooski River near Essex Junction, VT and the Winooski River at Montpelier, VT streamgages are outside the study area and not shown in figure 1 or listed in appendix 1.

Creation of Flood Maps 5
the streamgages to be interpolated using techniques described in Olson (2014). The flood frequency analysis for the streamgages was conducted using the USGS PeakFQ software (U.S. Geological Survey, 2014a).
A few unique procedures were applied to the hydro-logic analyses. Analysis of the peak-discharge data revealed evidence of a change in the magnitude of peak discharges since the construction of the detention reservoirs. Hence, peak discharges prior to the construction of the reservoirs were removed from the analysis to keep the analysis representa-tive of current (2014) conditions. The exception was the 1927 peak. This peak, representing one of the greatest flooding events in Vermont’s history, was deemed too important to remove from the frequency analysis, although it could have been decreased by as much as 10 percent, according to the Benson criterion, had the reservoirs been constructed at that time. The estimated flood discharges are as shown in table 2.
The estimated flood discharges for Tropical Storm Irene on the Winooski River in Waterbury were based on high-water marks available for the Winooski River (Medalie and Olson, 2013). Initially, the discharge was estimated with the high-water marks at the Winooski Street Bridge3 using indirect measurement techniques (Hulsing, 1967; Matthai, 1967). The resulting discharge was 51,900 cubic feet per second (ft3/s). Applying this discharge to the HEC–RAS model resulted in water-surface elevations that were above the other high-water marks available for the reach. Model calibration to the high-water marks at the Winooski Street bridge and the South Main Street (U.S. Route 2) bridge resulted in a discharge decrease to 49,000 ft3/s. This discharge value was used for the study reach from the upstream end to the confluence with the Little River.
The discharge of Winooski River downstream of the confluence with the Little River was estimated using a
3The Winooski Street bridge and other features and locations not shown in figure 1 are listed in appendix 1.
drainage-area adjustment using the contributing drainage area from the Little River below the Waterbury flood reservoir (8 mi2) and adding 685 ft3/s, which is the discharge from the Waterbury flood reservoir at the time of the flood reported at the Little River near Waterbury, VT (04289000) streamgage. The resulting estimated peak discharge of the Winooski River downstream of the confluence of the Little River was 50,200 ft3/s. This discharge when input into the HEC–RAS model resulted in water-surface elevations that matched high-water marks at Bolton Falls Dam, within reason. The estimated discharges used to simulate the flooding from Tropical Storm Irene are shown in table 2.
In the flood-inundation mapping model, the discharges were implemented similar to the Tropical Storm Irene HEC–RAS model with the only change in discharge occurring at the confluence of the Little River. There are significant flood controls on the Little River; however, it is unknown what the contribution of discharge from the Little River would be in all flooding situations. This introduces some uncertainty in the flood-inundation maps of the Winooski River downstream of the Little River confluence. For the Winooski River flood-inundation model, an increase in discharge of 11.6 percent was applied at the confluence of the Little River. This percent increase was the average increase determined for the Winooski River at the Little River for the 10-, 4-, 2-, 1-, and 0.2-percent AEP discharge analysis.
Using the increase of 11.6 percent at the Little River confluence, the discharges input to the HEC–RAS model were adjusted to obtain the desired water levels at the Winooski River above Crossett Bk at Waterbury, VT streamgage location at the downstream side of the South Main Street (U.S. Route 2) bridge over the Winooski River. It should be noted that this streamgage is a stage-only streamgage and does not have a rating curve with corresponding discharges that could be used to calibrate the HEC–RAS model. The resulting estimated discharges are listed in table 3.
Table 2. Estimated flood discharges for the Winooski River streamgages and the Winooski River study reach in Waterbury, Vermont.
[mi2, square miles; ft3/s, cubic feet per second; VT, Vermont]
Location on Winooski RiverDrainage
area (mi2)
Flood discharges (ft3/s) for indicated annual exceedance probabilities
Tropical Storm Irene discharge
(ft3/s)10% 4% 2% 1% 0.2%
At streamgage 04286000, Winooski River at Montpelier, VT
395 12,000 15,900 19,400 23,200 34,300 14,600
Upstream of Crossett Brook 672 24,600 31,100 36,500 42,200 57,900 49,000Upstream of the Little River 704 25,400 32,000 37,500 43,400 59,500 49,000Bolton Falls 821 28,400 35,600 41,800 48,300 66,100 50,200At streamgage 04290500, Winooski River
at Essex Junction, VT1,040 32,000 39,800 46,400 53,500 73,000 35,000

6 Flood Maps for the Winooski River in Waterbury, Vermont, 2014
Table 3. Estimated flood discharges for the Winooski River flood-inundation mapping model for Waterbury, Vermont.
[ft, feet; NAVD 88, North American Vertical Datum of 1988; ft3/s, cubic feet per second; Bk, Brook; VT, Vermont]
Water level at streamgage 04288040, Waterbury River above Crossett Bk at Waterbury, VT
(ft, NAVD 88)
Flood discharges (ft3/s) for indicated reach of the Winooski River
Upstream of the Little River confluence Downstream of the Little River confluence
417 7,120 7,950419 10,440 11,650421 15,090 16,840423 22,160 24,730425 30,350 33,870427 39,550 44,140429 49,440 55,180431 59,960 66,920
Topographic and Bathymetric Data and Geometry of Riverine Structures
All elevation data used in this study are referenced verti-cally to NAVD 88; all horizontal data are referenced to the North American Datum of 1983. Cross-section elevation data were obtained from a digital elevation model (DEM) that was derived from lidar data that were collected during November 2006 and processed in 2007 by Sanborn Map Company, Inc. of Colorado Springs, Colorado, for FEMA in support of an initiative to update the digital flood insurance rate maps for the Winooski River (Federal Emergency Management Agency, 2007). The lidar data are for the Winooski River with a buffer of 1,200 ft on either side of the river centerline. The vertical accuracy of the data meets or exceeds vertical national map accuracy standards for 2-ft contour mapping.
In the Village of Waterbury, the floodplain is exceptionally broad, and the lidar data do not cover the entire floodplain. In this area not covered by lidar, elevations were surveyed by Milone and MacBroom, Inc. (R.S. Shiff and B. Cote, Milone and MacBroom, Inc., written commun., 2013) for work unassociated with this study. The elevation data were provided to the USGS by Milone and MacBroom, Inc., to allow development of the model through the Village of Waterbury beyond the coverage of the lidar.
Using HEC–GeoRAS—a set of procedures, tools, and utilities for processing geospatial data in a GIS—elevation data were extracted from the DEM for 69 cross sections. Because lidar data cannot provide ground elevations below a stream’s water surface, the channel segments of the cross sections were surveyed by USGS field crews from the USGS New England Water Science Center during spring and sum-mer 2013. The cross-sectional bathymetry was measured by wading or sounding at 65 sections. In these sections, within-channel data were directly merged with the DEM data. For the
other five cross sections at the Bolton Falls bypass channel, the DEM data represent the within-channel elevations.
A differential global positioning system (DGPS) with real-time kinematic (RTK) technology was used to derive horizontal locations and elevations at the surveyed cross sections. Two determinations of elevations by RTK DGPS at benchmark locations were within 0.03 ft of the known elevations, and one was within 0.2 ft.
Six riverine structures, consisting of five bridges and a dam, have the potential to affect water-surface elevations dur-ing floods along the stream. Bridge and other riverine structure geometry data were obtained from field surveys conducted by personnel from the USGS New England Water Science Center during spring and summer 2013.
The dam at Bolton Falls has a crest that can be adjusted for height. When fully inflated the dam’s crest structure adds 5 ft to the dam crest, raising it to 397 ft above NAVD 88. Under flooding conditions, the dam is deflated and is designed to lie flat on the downstream side of the dam. When fully deflated, the rubber material and hardware add about 2 inches to the crest of the dam putting it at approximately 392.15 ft above NAVD 88. This is the elevation of the dam crest used for all water-surface profiles modeled in this study. The exception was the crest in the model used for estimating the water-surface profile of the Tropical Storm Irene flooding. During this event, the crest structure was damaged and partially filled with sediment, adding approximately 1.3 ft to the crest. So for the Tropical Storm Irene model, the dam crest was set at 393.3 ft above NAVD 88.
Development of the Hydraulic Model
As previously stated, by using HEC–GeoRAS—a set of procedures, tools, and utilities for processing geospatial data in a GIS—elevation data were extracted from the DEM for

Creation of Flood Maps 7
69 cross sections. The cross-section data were merged with the surveyed channel data and subsequently were input to the HEC–RAS model. Objects blocking the flow of water, such as buildings, were digitized in a GIS and were converted to HEC–RAS input by the HEC–GeoRAS software. The data for the six riverine structures—five bridges and a dam—were manually input into the HEC–RAS model.
Hydraulic analyses require the estimation of energy losses that result from frictional resistance exerted by a channel on flow. These energy losses are quantified by the Manning’s roughness coefficient (n-value). Initial n-values were selected on the basis of field observations, field photographs, aerial photographs (U.S. Department of Agriculture, 2012), and aerial imagery from Google Maps (http://www.google.com/maps/). The initial n-values were adjusted to minimize the differences between simulated and observed water-surface elevations at the Tropical Storm Irene high-water marks. The n-values were also adjusted to avert defaults to critical depth by the HEC–RAS model. For the Winooski River study reach, the final channel n-values ranged from 0.040 in straight, lower gradient, sand and gravel channels to 0.075 in meandering, steep, cobble to boulder channels. The floodplains had n-values ranging from 0.035 on smooth lawns to 0.095 in heavily forested areas.
The HEC–RAS analysis for this study was done by using the steady-state flow computation option. Subcritical flow regime was assumed for the simulations. Normal depth was used as the starting water surface and was based on an estimated average water-surface slope of 0.0021 foot per foot of distance for the Winooski River using data contained in the effective flood insurance study (Federal Emergency Management Agency, 2013) and channel survey data. The peak discharges that were used in the model were discussed in the “Estimation of Flood Discharges” section.
The flood-recovery map water-surface profiles for the 10-, 4-, 2-, 1-, and 0.2-percent AEP and for Tropical Storm Irene, and the flood-inundation map water-surface profiles for selected streamgage water levels, were computed using HEC–RAS, version 4.1.0. HEC–RAS is a one-dimensional step-backwater model for simulation of water-surface profiles with steady-state (gradually varied) or unsteady-state flow computation options. Differences between surveyed high-water marks and simulated water-surface elevations for Tropical Storm Irene are shown in table 4. One of the differences exceeds 1 ft; however, the results demonstrate that the model is capable of simulating accurate water levels.
A floodway was also determined for the study reaches. A floodway is the channel plus adjacent floodplain areas that must be free of obstructions, such as fill or development, so that the 1-percent AEP flood can be carried without substantial increases in water-surface elevations. The allowable surcharge for Vermont, which was used in the analysis, is 1 ft. The flood-way was computed by using HEC–RAS, version 4.1.0.
The resulting water-surface elevations for the 10-, 4-, 2-, 1-, and 0.2-percent AEP and Tropical Storm Irene are listed in appendix 2. The results of the floodway analysis by cross section are in appendix 3. The resulting water-surface elevations for the selected streamgage water levels used for the flood-inundation mapping are listed in appendix 4.
Annual Exceedance Probability of Flooding From Tropical Storm Irene
Based on the hydraulic models, Tropical Storm Irene water-surface elevations exceeded the 1-percent AEP flood throughout the 8.3-mile study reach. Tropical Storm Irene water-surface elevations did not exceed the 0.2-percent AEP flood anywhere in the study reach.
Table 4. Simulated water-surface elevations and surveyed high-water marks at selected locations along the Winooski River, Vermont, study reach, and the difference between them, for the Tropical Storm Irene model.
[ft, feet; NAVD 88, North American Vertical Datum of 1988]
River station1 (ft)
Surveyed high-water marks (ft, NAVD 88)
Simulated water-surface elevation (ft, NAVD 88)
Difference in elevation (ft)
3,396 360.38 363.88 3.505,770 416.39 415.92 -0.476,337 416.52 416.65 0.13
24,208 425.00 426.00 1.0024,881 426.42 427.33 0.9131,184 429.30 429.01 -0.2931,587 431.16 431.12 -0.04
1River station is referenced to the longitudinal baseline used in the hydraulic model and is measured in feet from the downstream end of the model.

8 Flood Maps for the Winooski River in Waterbury, Vermont, 2014
Development of Flood-Recovery and Flood-Inundation Maps
Flood-recovery maps were created in a GIS by combin-ing the water-surface profiles and the DEM data. The DEM data were derived from the same lidar data described in the “Topographic and Bathymetric Data and Geometry of Riv-erine Structures” section. However, during the investigation, additional lidar data for the Village of Waterbury became available. The data from this lidar survey were collected during November 2013 and published in June 2014 by Photo Science of Lexington, Kentucky, for the USGS. The vertical accuracy of the data meets or exceeds the 18.13-centimeter vertical accuracy standard at the 95-percent confidence level with the result that all areas along the study reach with flood-ing potential are covered by a high-resolution DEM. The DEM generated from this new lidar data was combined with the DEM generated from the original lidar data for the delineation of the flood boundaries.
Estimated flood-inundation boundaries for each simulated profile were developed with the DEM and the HEC–GeoRAS software, which allows for the preparation of geometric data for import into HEC–RAS and processes simulation results exported from HEC–RAS. Shapefile polygons of the inun-dated areas for each profile were modified, as required, in the ArcMap application of ArcGIS (Esri Inc., 2012a) to ensure a hydraulically reasonable transition of the flood boundaries between modeled cross sections.
Any inundated areas that were detached from the main channel were examined to identify subsurface connections with the main river, such as through culverts under roadways. Where such connections existed, the mapped inundated areas were retained in their respective flood maps; otherwise, the erroneously delineated parts of the flood extent were deleted. The flood-inundation areas are overlaid on georeferenced aerial photographs of the study area (U.S. Department of Agriculture, 2012).
Availability of Flood-Recovery and Flood-Inundation Maps
The flood-recovery maps are provided in appendix 1, which contains an ArcGIS published map document (.pmf) that can be read using ArcGIS or the freeware ArcReader (Esri Inc., 2012b). ArcReader version 10.1 is available from Esri Inc. (http://www.esri.com/software/arcgis/arcreader/). The published map document provides the flood boundaries for the 10-, 4-, 2-, 1-, and 0.2-percent AEP floods, the floodway, and Tropical Storm Irene. Appendix 1 also contains cross sections with identifiers and the base-flood elevation markers. The base-flood elevations markers indicate the elevation of the 1-percent AEP at 1-ft elevation increments along the study reach.
The flood-inundation maps are available on the USGS flood inundation mapping science Web site (http://water.usgs.gov/osw/flood_inundation/). The Web portal has a link to the interactive Flood Inundation Mapper Web site (http://wim.usgs.gov/FIMI/FloodInundationMapper.html) that presents map libraries providing detailed information on flood extents and depths for selected sites and where customized flood-inundation maps can be generated from the map library for Winooski River at Waterbury. An example of a flood-inundation map is shown in figure 2. Also included on this Web site is a link to the USGS Winooski River above Crossett Bk at Waterbury, VT (04288040) streamgage on the National Water Information System (http://waterdata.usgs.gov/nwis/uv/?site_no=04288040), which presents graphs of the current stage at the streamgage (to which the inundation maps are referenced). In addition, a link is provided to the NWS Advanced Hydrologic Prediction Service (AHPS) site for the Winooski River at Waterbury hydrologic forecast (http://water.weather.gov/ahps2/hydrograph.php?wfo=btv&gage=watv1).
The estimated flood-inundation maps are displayed in sufficient detail to note the extent of flooding with respect to individual structures so that preparations for flooding and decisions for emergency response can be performed efficiently. Depending on the flood magnitude, roadways and bridges are shown as shaded (inundated and likely impassable) or not shaded (dry and passable) to facilitate emergency planning and use. One exception is at the railroad bridge over North Main Street; for the flooding scenarios in which North Main Street is flooded, the street is shown as inundated, which makes it appear as though the railroad bridge above it is inundated. The railroad bridge at this location is not inundated at any of the flood stages. Buildings that are shaded do not reflect inundation but denote that bare earth surfaces in the vicinity of the buildings are inundated. When the water depth (as indicated in the Web Mapping Application by holding the cursor over an inundated area) in the vicinity of the building of interest exceeds that building’s height, the structure can be considered fully submerged.
Disclaimer for Flood-Inundation Maps
The flood-inundation maps are not meant to be used for navigation, regulatory, permitting, or other legal purposes. The USGS provides these maps “as-is” for a quick reference, emergency planning tool but assumes no legal liability or responsibility resulting from the use of this information.
Uncertainties and Limitations Regarding Use of Flood-Recovery and Flood-Inundation Maps
Although the flood maps represent the boundaries of inundated areas with a distinct line, some uncertainty is associated with these maps. Water-surface elevations along the stream reach were estimated using steady-state hydraulic modeling, assuming unobstructed flow, and using discharges

Summary 9
Figure 2. The Flood Inundation Mapper Web application showing an example of a flood-inundation map for the Winooski River at Waterbury, Vermont, corresponding to a stage of 425 feet at the U.S. Geological Survey Winooski River above Crossett Bk at Waterbury, VT (04288040) streamgage. The small graphic window at lower right is the minimized version of the interactive user controls. The window can be shown full size by clicking on the map at the streamgage triangle, minimized by using the standard window minimize feature, or removed by using the standard window close feature.
and expected hydrologic conditions. The hydraulic model reflects the land-cover characteristics and any bridge, dam, or other hydraulic structures existing as of August 2013. Unique meteorological factors (timing and distribution of precipitation) may cause actual discharges along the modeled reach to vary from those assumed during a flood, which may lead to deviations in the water-surface elevations and inundation boundaries shown. Additional areas may be flooded as a result of unanticipated conditions, such as changes in the streambed elevation or roughness, backwater into major tributaries along a main stem river, backwater from localized debris or ice jams, dam operations at Bolton Falls Dam, or unexpected operations of flood reservoirs. Changes to any of these factors may change the water-surface elevations determined in this study. The accuracy of the floodwater extent portrayed on these maps will vary with the accuracy of the digital elevation model used to simulate the land surface. Additional uncertainties and limitations pertinent to this study may be described elsewhere in this report.
Summary
A series of digital flood-recovery maps and flood-inundation maps were developed by the U.S. Geological Survey (USGS) in cooperation with the Federal Emergency Management Agency for the Winooski River in Waterbury, Vermont. These flood maps cover an 8.3-mile reach of the Winooski River from the downstream end at about 1,000 feet (ft) downstream of the Waterbury-Bolton town line to the upstream end at about 2,000 ft upstream of the Waterbury-Middlesex town line. The maps are based on simulated water-surface profiles from hydraulic models developed using the U.S. Army Corps of Engineers’ HEC–RAS and HEC–GeoRAS computer programs.
The hydraulic models were used to compute the water-surface profiles for the 10-, 4-, 2-, 1-, and 0.2-percent annual exceedance probability (AEP) discharges, for Tropical Storm Irene, and for the floodway. The model was also used

10 Flood Maps for the Winooski River in Waterbury, Vermont, 2014
to compute eight water-surface profiles for flood stages at 2-ft intervals referenced to the streamgage water levels from 417.0 ft or near bankfull to 431.0 ft, which exceeds the 0.2-percent AEP flood at the Winooski River above Crossett Bk at Waterbury, VT (04288040) streamgage. The simulated water-surface profiles were then combined with data from a geographic information system digital elevation model (derived from light detection and ranging [lidar] data) to delineate estimated flood-submerged areas as shapefile polygons. These polygons were overlaid on georeferenced aerial photographs of the study area to generate the maps.
The flood-recovery maps which include the maps of the 10-, 4-, 2-, 1-, and 0.2-percent AEP floods, the floodway, and estimated Tropical Storm Irene flooding are available as a published map document and dataset available for download. The flood-inundation maps, which include the maps of the flooded areas corresponding to selected water levels at a streamgage in the modeled reach, are available from the Flood Inundation Mapper application (http://wimcloud.usgs.gov/apps/FIM/FloodInundationMapper.html).
Interactive use of the flood-inundation maps on this portal can give users a general indication of the depth of water at any point by using the mouse cursor to click within the shaded areas. These maps, in conjunction with the real-time stage data from the USGS streamgage in the study reach will help to guide the general public in taking individual safety precautions and will provide emergency management personnel with a tool to efficiently manage emergency flood operations and post-flood recovery efforts.
Selected References
Benson, M.A., 1962, Factors influencing the occurrence of floods in a humid region of diverse terrain: U.S. Geological Survey Water-Supply Paper 1580–B, 64 p. [Also available at http://pubs.er.usgs.gov/publication/wsp1580B.]
Esri Inc., 2012a, ArcGIS, version 10.1: Redlands, Calif., Esri Inc. Web page, accessed June 27, 2014, at http://www.esri.com/software/arcgis/.
Esri Inc., 2012b, ArcReader, version 10.1: Redlands, Calif., Esri Inc. Web page, accessed October 10, 2014, at http://www.esri.com/software/arcgis/arcreader/.
Federal Emergency Management Agency, 2007, LiDAR_Chittenden_Floodplain_2007: Federal Emergency Management Agency Web page, accessed January 13, 2015, at http://vcgi.vermont.gov/warehouse/products/ALL-LDR_MIX_LIDAR_STATE_ALL.
Federal Emergency Management Agency, 2013, Flood insurance study, Washington County, Vermont (all jurisdictions): Washington D.C., Federal Emergency Management Agency, 3 v.
Hulsing, Harry, 1967, Measurement of peak discharge at dams by indirect methods: U.S. Geological Survey Techniques of Water-Resources Investigations Report, book 3, chap. A5, 29 p. [Also available at http://pubs.usgs.gov/twri/twri3-a5/.]
Keirstead, C., Kiah, R.G., Ward, S.L., and Hilgendorf, G.S., 2004, Water resources data, New Hampshire and Vermont, water year 2004: U.S. Geological Survey Water-Data Report NH–VT–04–1, 335 p. [Also available at http://pubs.usgs.gov/wdr/2004/wdr-nh-04-1/.]
Matthai, H.F., 1967, Measurement of peak discharge at width contractions by indirect methods: U.S. Geological Survey Techniques of Water-Resources Investigations Report, book 3, chap. A4, 44 p. [Also available at http://pubs.usgs.gov/twri/twri3-a4/.]
Medalie, Laura, and Olson, S.A., 2013, High-water marks from flooding in Lake Champlain from April through June 2011 and tropical storm Irene in August 2011 in Vermont: U.S. Geological Survey Data Series 763, 11 p., http://pubs.usgs.gov/ds/763/.
National Weather Service, 2014, Advanced Hydrologic Prediction Service: Winooski River at Waterbury: National Weather Service data, accessed November 19, 2014, at http://water.weather.gov/ahps2/hydrograph.php?wfo=btv&gage=watv1&hydro_type=0.
Olson, S.A., 2014, Estimation of flood discharges at selected annual exceedance probabilities for unregulated, rural streams in Vermont, with a section on Vermont regional skew regression, by Veilleux, A.G.: U.S. Geological Survey Scientific Investigations Report 2014–5078, 27 p. plus appendixes. [Also available at http://pubs.usgs.gov/sir/2014/5078/.]
PRISM Group, 2012a, United States average monthly or annual precipitation, 1981–2010, 30 arc-second normal, created July 10, 2012: Corvallis, Oreg., Oregon State University, accessed September 16, 2013, at http://www.prism.oregonstate.edu/.
PRISM Group, 2012b, United States average monthly or annual maximum temperature, 1981–2010, 4 km grid cell resolution, created July 10, 2012: Corvallis, Oreg., Oregon State University, accessed September 16, 2013, at http://www.prism.oregonstate.edu/.
PRISM Group, 2012c, United States average monthly or annual minimum temperature, 1981–2010, 4 km grid cell resolution, created July 10, 2012: Corvallis, Oreg., Oregon State University, accessed September 16, 2013, at http://www.prism.oregonstate.edu/.
U.S. Army Corps of Engineers, Hydrologic Engineering Center, 2010, HEC–RAS river analysis system, user’s manual (version 4.1): U.S. Army Corps of Engineers, [variously paged].
Selected References 11
U.S. Army Corps of Engineers, Hydrologic Engineering Center, 2012, HEC–GeoRAS, GIS tools for support of HEC–RAS using ArcGIS 10, user’s manual (version 10): U.S. Army Corps of Engineers, [variously paged].
U.S. Census Bureau, 2014, Waterbury Town, Washington County, Vermont: U.S. Census Bureau American fact finder, accessed November 19, 2014, at http://factfinder2.census.gov/faces/tableservices/jsf/pages/productview.xhtml?src=bkmk.
U.S. Department of Agriculture, 2012, National Agriculture Imagery Program, 1:40,000 scale: U.S. Department of Agri-culture, accessed July 7, 2014, at http://vcgi.vermont.gov/.
U.S. Geological Survey, 2014a, PeakFQ—Flood frequency analysis based on bulletin 17B and recommendations of the Advisory Committee on Water Information (ACWI) Subcommittee on Hydrology (SOH) Hydrologic Frequency Analysis Work Group (HFAWG): U.S. Geological Survey Web page, accessed November 20, 2014, at http://water.usgs.gov/software/PeakFQ/.
U.S. Geological Survey, 2014b, USGS flood inundation mapping science: U.S. Geological Survey, accessed November 21, 2014, at http://water.usgs.gov/osw/flood_inundation/toolbox/.
U.S. Geological Survey, 2014c, USGS flood inundation map-per: U.S. Geological Survey, accessed November 21, 2014, at http://wim.usgs.gov/FIMI/FloodInundationMapper.html.


Appendix 1 13
Appendix 1. Flood-Recovery Map for the Winooski River in Waterbury, Vermont [Available separately for download at http://pubs.usgs.gov/sir/2015/5077/.]


Appendix 2 15
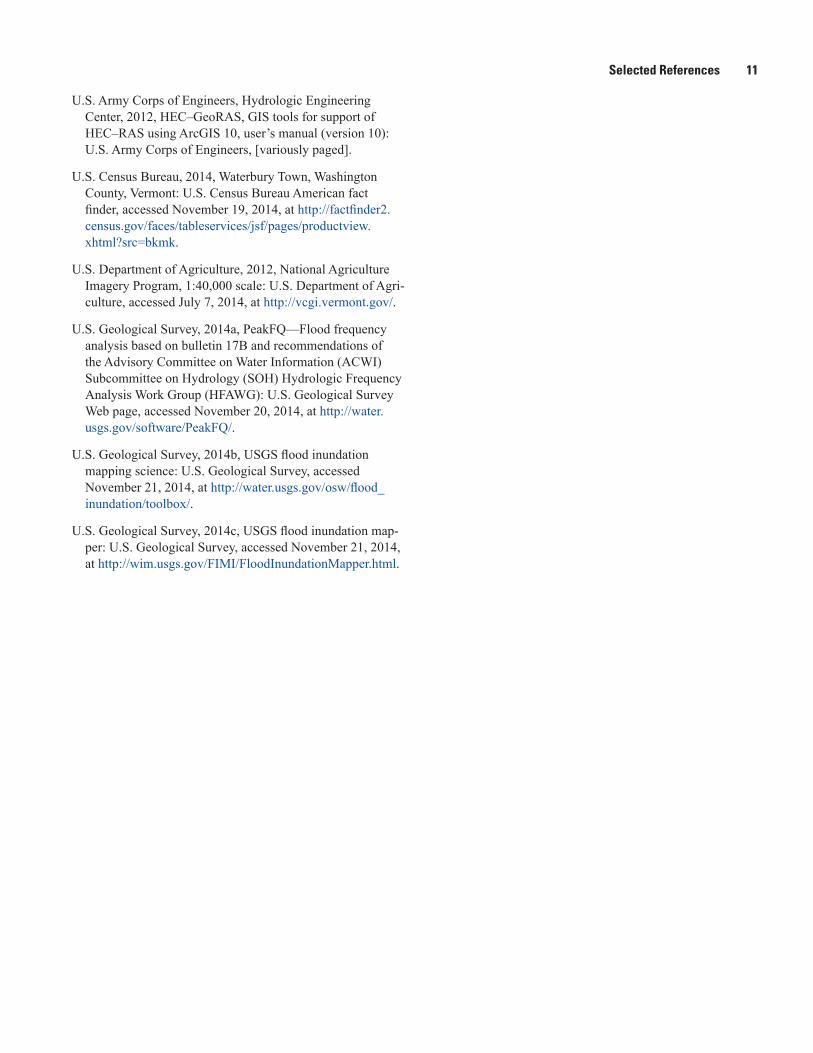
Appendix 2. Water-Surface Elevations for Flooding at Selected Annual Exceedance Probabilities and Estimated Tropical Storm Irene Flooding on the Winooski River in Waterbury, Vermont
16 Flood Maps for the Winooski River in Waterbury, Vermont, 2014
Table 2–1. Water-surface elevations for flooding at selected annual exceedence probabilities and estimated for Tropical Storm Irene flooding on the Winooski River in Waterbury, Vermont.—Continued
[Cross sections are shown in appendix 1. ft, feet; NAVD 88, North American Vertical Datum of 1988; %, percent; --, not applicable]
Cross-section
identification number
River station1 (ft)
Minimum channel
elevation (ft, NAVD 88)
Water-surface elevation for selected annual exceedance probabilities
(ft, NAVD 88)
Water-surface elevation estimated for
Tropical Storm Irene (ft, NAVD 88)10% 4% 2% 1% 0.2%
Winooski River
A 1.4 334.27 354.25 356.40 357.93 359.37 362.84 359.77B 671.4 337.80 355.51 357.66 359.19 360.65 364.15 361.06C 1,437.1 339.52 356.64 358.79 360.36 361.87 365.52 362.29D 2,519.1 337.90 357.86 359.97 361.53 363.04 366.71 363.46E 3,476.0 334.31 358.27 360.40 361.97 363.49 367.19 363.92
4,013.1 Bolton Falls Dam
F 4,150.3 383.00 405.76 407.75 409.28 410.76 413.90 412.22G 4,886.5 384.25 407.81 410.33 412.28 414.22 418.60 415.47H 5,769.8 382.09 408.40 410.89 412.82 414.74 419.06 415.92I 6,448.0 387.89 409.01 411.63 413.64 415.64 420.18 416.79J 7,335.0 389.61 409.41 411.95 413.93 415.90 420.40 417.03K 7,987.1 382.50 409.45 411.99 413.97 415.94 420.44 417.05
8,299.0 Snowmobile Trail Bridge
L 8,740.5 390.02 409.70 412.14 414.07 416.01 420.48 417.12M 9,831.3 388.52 409.91 412.29 414.18 416.11 420.54 417.19N 10,832.1 391.56 410.10 412.41 414.28 416.19 420.59 417.25O 11,681.9 391.72 410.27 412.50 414.34 416.23 420.61 417.29P 12,752.0 390.85 411.02 413.11 414.80 416.59 420.86 417.58Q 14,278.2 393.64 412.30 414.26 415.87 417.49 421.47 418.34R 15,413.7 393.76 413.15 415.15 416.76 418.39 422.08 419.19S 16,433.8 392.66 413.74 415.69 417.27 418.87 422.53 419.62T 17,227.7 394.91 414.28 416.15 417.68 419.23 422.81 420.00
17,598.2 Railroad Bridge
U 17,899.0 394.23 414.89 416.80 418.33 419.89 424.56 421.37V 18,864.8 395.28 416.17 418.30 419.99 421.70 426.51 423.29W 19,729.2 396.08 416.76 418.89 420.55 422.22 426.95 423.77X 20,317.3 396.87 417.03 419.12 420.76 422.41 427.10 423.95Y 20,904.7 397.00 417.27 419.35 420.99 422.64 427.33 424.17Z 21,754.0 398.82 417.59 419.62 421.20 422.80 427.40 424.31AA 22,176.4 397.67 417.85 419.78 421.28 422.86 427.41 424.34AB 22,612.3 396.18 418.19 420.12 421.61 423.11 427.65 424.59AC 23,218.3 399.12 419.27 421.34 422.94 424.52 428.71 425.90AD 23,996.8 400.00 419.39 421.44 423.02 424.58 428.71 425.95AE 24,467.3 401.46 419.73 421.71 423.24 424.76 428.82 426.1

Appendix 2 17
Table 2–1. Water-surface elevations for flooding at selected annual exceedence probabilities and estimated for Tropical Storm Irene flooding on the Winooski River in Waterbury, Vermont.—Continued
[Cross sections are shown in appendix 1. ft, feet; NAVD 88, North American Vertical Datum of 1988; %, percent; --, not applicable]
Cross-section
identification number
River station1 (ft)
Minimum channel
elevation (ft, NAVD 88)
Water-surface elevation for selected annual exceedance probabilities
(ft, NAVD 88)
Water-surface elevation estimated for
Tropical Storm Irene (ft, NAVD 88)10% 4% 2% 1% 0.2%
24,666.0 Winooski Street Bridge
AF 24,918.5 400.27 420.45 422.56 424.28 426.15 429.87 427.50AG 25,591.4 402.14 420.98 423.11 424.79 426.60 430.27 427.92AH 26,938.1 401.79 421.14 423.23 424.89 426.68 430.33 428.00AI 28,016.4 401.98 421.48 423.42 425.02 426.77 430.42 428.09AJ 29,091.4 402.10 422.49 424.26 425.68 427.26 430.69 428.49AK 30,377.2 404.44 423.01 424.66 425.98 427.48 430.79 428.68AL 31,183.9 403.71 423.63 425.28 426.48 427.88 431.05 429.01
31,382.3 South Main Street (U.S. Route 2) Bridge
AM 31,586.5 405.01 424.37 426.31 429.69 430.12 432.98 431.12AN 32,199.3 403.73 424.86 426.77 429.96 430.45 433.25 431.46AO 33,298.5 403.63 425.44 427.44 430.50 431.11 434.04 432.22AP 34,262.9 407.59 425.98 427.88 430.74 431.39 434.31 432.51AQ 35,080.7 409.42 426.50 428.30 430.96 431.62 434.49 432.73AR 36,058.2 410.03 427.49 429.37 431.79 432.61 435.51 433.78AS 37,168.3 409.41 428.50 430.42 432.56 433.44 436.33 434.63AT 38,347.5 408.04 429.29 431.28 433.37 434.38 437.49 435.69AU 39,358.3 400.54 429.93 431.98 434.02 435.11 438.35 436.49AV 39,886.3 412.17 430.36 432.49 434.60 435.81 439.32 437.35AW 40,479.2 417.27 430.78 432.90 434.94 436.17 439.69 437.70AX 41,248.6 407.75 431.90 433.92 435.80 437.04 440.46 438.57AY 42,026.4 394.99 432.65 434.66 436.46 437.72 441.09 439.23AZ 42,807.2 413.20 434.57 436.69 438.45 439.83 443.40 441.44BA 43,313.9 416.00 434.86 436.76 438.60 440.03 443.64 441.65BB 43,994.9 421.27 439.09 440.34 441.53 442.76 445.97 444.25
Bolton Falls Bypass
DIV-A 775.4 366.15 -- -- -- 366.39 368.39 367.06DIV-B 1,233.2 374.29 -- -- -- 374.92 378.55 376.29
1,709.8 Power Plant Road Bridge
DIV-C 2,246.6 415.13 -- -- -- 415.41 418.95 416.281River station datum for Winooski River is 1,049 ft downstream from Waterbury town boundary.


Appendix 3 19
Appendix 3. Floodway Data for the Winooski River in Waterbury, Vermont

20 Flood Maps for the Winooski River in Waterbury, Vermont, 2014
Table 3–1. Floodway data for the Winooski River in Waterbury, Vermont.—Continued
[Cross sections are shown in appendix 1. ft, feet; ft2, square feet; ft/s, feet per second; NAVD 88, North American Vertical Datum of 1988]
Cross-section identification
number
River station1 (ft)
Floodway Water-surface elevation
Width (ft)
Section area (ft2)
Mean velocity (ft/s)
Without floodway (ft, NAVD 88)
With floodway (ft, NAVD 88)
Increase (ft)
A 1.4 270 5,509 8.77 359.37 359.96 0.59B 671.4 332 6,748 7.16 360.65 361.43 0.78C 1,437.1 400 7,104 6.80 361.87 362.53 0.67D 2,519.1 490 10,119 4.77 363.04 363.87 0.83E 3,476.0 460 10,880 4.44 363.49 364.31 0.81
4,013.1 Bolton Falls Dam
F 4,150.3 146 3,506 13.78 410.76 410.76 0.00G 4,886.5 390 8,021 6.02 414.22 414.22 0.00H 5,769.8 294 6,869 7.03 414.74 414.75 0.01I 6,448.0 1,046 15,373 3.14 415.64 415.64 0.00J 7,335.0 1,155 19,888 2.43 415.90 415.92 0.02K 7,987.1 1,373 18,148 2.66 415.94 415.99 0.05
8,299.0 Snowmobile Trail Bridge
L 8,740.5 1,580 22,707 2.13 416.01 416.15 0.14M 9,831.3 1,225 17,394 2.78 416.11 416.27 0.16N 10,832.1 1,060 15,092 3.20 416.19 416.43 0.25O 11,681.9 752 10,607 4.55 416.23 416.54 0.31P 12,752.0 435 7,359 6.56 416.59 417.01 0.42Q 14,278.2 428 8,367 5.77 417.49 418.36 0.87R 15,413.7 600 9,893 4.88 418.39 419.29 0.90S 16,433.8 521 8,477 5.12 418.87 419.76 0.88T 17,227.7 428 8,146 5.33 419.23 420.21 0.98
17,598.2 Railroad Bridge
U 17,899.0 301 5,337 8.13 419.89 420.80 0.91V 18,864.8 299 6,602 6.57 421.70 422.30 0.60W 19,729.2 582 9,961 4.36 422.22 423.10 0.88X 20,317.3 580 10,256 4.23 422.41 423.29 0.88Y 20,904.7 630 10,503 4.13 422.64 423.53 0.89Z 21,754.0 562 8,285 5.24 422.80 423.79 0.99AA 22,176.4 480 6,442 6.74 422.86 423.85 0.99AB 22,612.3 314 5,498 7.89 423.11 424.09 0.98AC 23,218.3 835 13,732 3.16 424.52 425.29 0.77AD 23,996.8 640 8,814 4.92 424.58 425.46 0.88AE 24,467.3 500 7,393 5.87 424.76 425.60 0.84
24,666.0 Winooski Street Bridge
AF 24,918.5 678 9,306 4.66 426.15 426.70 0.55AG 25,591.4 1,205 17,979 2.41 426.60 427.25 0.65AH 26,938.1 1,300 16,562 2.62 426.68 427.46 0.78AI 28,016.4 1,060 12,854 3.38 426.77 427.66 0.89AJ 29,091.4 1,360 15,994 2.71 427.26 428.23 0.97AK 30,377.2 790 9,455 4.59 427.48 428.46 0.98AL 31,183.9 700 8,475 5.12 427.88 428.85 0.97

Appendix 3 21
Table 3–1. Floodway data for the Winooski River in Waterbury, Vermont.—Continued
[Cross sections are shown in appendix 1. ft, feet; ft2, square feet; ft/s, feet per second; NAVD 88, North American Vertical Datum of 1988]
Cross-section identification
number
River station1 (ft)
Floodway Water-surface elevation
Width (ft)
Section area (ft2)
Mean velocity (ft/s)
Without floodway (ft, NAVD 88)
With floodway (ft, NAVD 88)
Increase (ft)
31,382.3 South Main Street (U.S. Route 2) Bridge
AM 31,586.5 540 8,319 5.07 430.12 431.11 0.99AN 32,199.3 451 7,882 5.35 430.45 431.37 0.92AO 33,298.5 690 9,942 4.24 431.11 431.93 0.82AP 34,262.9 638 8,953 4.71 431.39 432.25 0.86AQ 35,080.7 425 6,352 6.64 431.62 432.42 0.80AR 36,058.2 425 6,857 6.15 432.61 433.34 0.73AS 37,168.3 332 6,635 6.36 433.44 434.20 0.76AT 38,347.5 341 6,605 6.39 434.38 435.04 0.66AU 39,358.3 304 6,264 6.74 435.11 435.78 0.67AV 39,886.3 400 7,184 5.87 435.81 436.35 0.54AW 40,479.2 430 6,452 6.54 436.17 436.78 0.61AX 41,248.6 560 8,452 4.99 437.04 437.69 0.65AY 42,026.4 296 4,969 8.49 437.72 438.36 0.64AZ 42,807.2 740 11,651 3.62 439.83 440.80 0.97BA 43,313.9 480 5,223 8.08 440.03 440.97 0.94BB 43,994.9 497 7,718 5.47 442.76 443.20 0.44
1River station datum for Winooski River is 1,049 ft downstream from Waterbury town boundary.


Appendix 4 23
Appendix 4. Water-Surface Elevations of the Winooski River in Waterbury, Vermont, for Selected Stages at the Winooski River Above Crossett Bk at Waterbury, VT (04288040) Streamgage

24 Flood Maps for the Winooski River in Waterbury, Vermont, 2014
Table 4–1. Water-surface elevations of the Winooski River in Waterbury, Vermont, for selected stages at the Winooski River above Crossett Bk at Waterbury, VT (04288040) streamgage.—Continued
[Cross sections are shown in appendix 1. Bk, Brook; VT, Vermont; ft, feet; NAVD 88, North American Vertical Datum of 1988; --, not applicable]
Cross-section
identifica-tion number
River station1
(ft)
Minimum channel
elevation (ft, NAVD 88)
Water-surface elevation on the Winooski River for selected stages at the Winooski River above Crossett Bk at Waterbury, VT streamgage
(ft, NAVD 88)
417.0 419.0 421.0 423.0 425.0 427.0 429.0 431.0
Winooski River
A 1.4 334.27 344.90 347.28 349.81 353.03 355.88 358.46 360.78 362.98B 671.4 337.80 346.34 348.60 351.09 354.28 357.13 359.73 362.08 364.30C 1,437.1 339.52 348.03 350.04 352.36 355.44 358.27 360.91 363.35 365.68D 2,519.1 337.90 349.44 351.44 353.74 356.69 359.46 362.09 364.52 366.86E 3,476.0 334.31 349.80 351.82 354.13 357.09 359.88 362.53 364.99 367.35
4,013.1 Bolton Falls Dam
F 4,150.3 383.00 398.40 400.08 402.09 404.68 407.27 409.84 412.09 414.03G 4,886.5 384.25 398.93 400.90 403.29 406.46 409.72 413.00 416.04 418.79H 5,769.8 382.09 399.37 401.43 403.88 407.05 410.29 413.53 416.53 419.25I 6,448.0 387.89 399.62 401.76 404.30 407.61 410.99 414.38 417.53 420.38J 7,335.0 389.61 400.03 402.19 404.76 408.03 411.33 414.66 417.77 420.60K 7,987.1 382.50 400.42 402.43 404.80 408.07 411.37 414.70 417.81 420.63
8,299.0 Snowmobile Trail Bridge
L 8,740.5 390.02 400.94 403.13 405.53 408.43 411.53 414.79 417.86 420.67M 9,831.3 388.52 401.72 403.78 406.00 408.70 411.70 414.89 417.93 420.73N 10,832.1 391.56 402.49 404.44 406.43 408.94 411.83 414.98 417.99 420.78O 11,681.9 391.72 402.89 404.86 406.85 409.18 411.94 415.04 418.02 420.80P 12,752.0 390.85 403.57 405.62 407.67 409.99 412.59 415.45 418.33 421.04Q 14,278.2 393.64 404.53 406.66 408.85 411.30 413.78 416.46 419.08 421.65R 15,413.7 393.76 405.16 407.31 409.57 412.11 414.66 417.36 419.99 422.25S 16,433.8 392.66 405.85 408.05 410.24 412.73 415.22 417.86 420.45 422.71T 17,227.7 394.91 406.34 408.60 410.85 413.30 415.69 418.24 420.77 422.98
17,598.2 Railroad Bridge
U 17,899.0 394.23 406.86 409.11 411.38 413.89 416.33 418.90 421.60 424.76V 18,864.8 395.28 407.45 409.81 412.26 415.05 417.78 420.60 423.49 426.70W 19,729.2 396.08 407.81 410.18 412.69 415.60 418.38 421.15 423.97 427.13X 20,317.3 396.87 408.23 410.62 413.06 415.90 418.62 421.35 424.14 427.28Y 20,904.7 397.00 408.54 410.92 413.34 416.15 418.85 421.58 424.36 427.51Z 21,754.0 398.82 409.08 411.45 413.80 416.48 419.13 421.77 424.49 427.58AA 22,176.4 397.67 409.38 411.75 414.14 416.80 419.31 421.85 424.52 427.58AB 22,612.3 396.18 409.60 411.97 414.41 417.13 419.65 422.14 424.77 427.82AC 23,218.3 399.12 410.17 412.65 415.22 418.12 420.85 423.51 426.05 428.86AD 23,996.8 400.00 410.61 413.01 415.43 418.26 420.95 423.58 426.10 428.87AE 24,467.3 401.46 411.06 413.46 415.93 418.65 421.24 423.79 426.24 428.97

Appendix 4 25
Table 4–1. Water-surface elevations of the Winooski River in Waterbury, Vermont, for selected stages at the Winooski River above Crossett Bk at Waterbury, VT (04288040) streamgage.—Continued
[Cross sections are shown in appendix 1. Bk, Brook; VT, Vermont; ft, feet; NAVD 88, North American Vertical Datum of 1988; --, not applicable]
Cross-section
identifica-tion number
River station1
(ft)
Minimum channel
elevation (ft, NAVD 88)
Water-surface elevation on the Winooski River for selected stages at the Winooski River above Crossett Bk at Waterbury, VT streamgage
(ft, NAVD 88)
417.0 419.0 421.0 423.0 425.0 427.0 429.0 431.0
24,666.0 Winooski Street Bridge
AF 24,918.5 400.27 411.49 413.95 416.53 419.30 422.06 424.90 427.59 430.00AG 25,591.4 402.14 411.93 414.41 416.99 419.80 422.62 425.39 428.05 430.39AH 26,938.1 401.79 413.91 415.34 417.32 420.00 422.75 425.48 428.13 430.46AI 28,016.4 401.98 415.14 416.67 418.32 420.49 422.96 425.60 428.21 430.55AJ 29,091.4 402.10 415.82 417.57 419.38 421.57 423.84 426.20 428.61 430.81AK 30,377.2 404.44 416.39 418.28 420.16 422.18 424.28 426.46 428.79 430.91AL 31,183.9 403.71 416.78 418.72 420.67 422.79 424.91 426.95 429.12 431.17
31,382.3 South Main Street (U.S. Route 2) Bridge
AM 31,586.5 405.01 417.15 419.19 421.26 423.46 425.89 429.92 431.21 433.14AN 32,199.3 403.73 417.40 419.52 421.68 423.97 426.38 430.22 431.55 433.41AO 33,298.5 403.63 417.72 419.88 422.12 424.54 427.05 430.83 432.31 434.25AP 34,262.9 407.59 418.20 420.39 422.65 425.09 427.53 431.09 432.60 434.52AQ 35,080.7 409.42 418.91 421.14 423.34 425.69 427.98 431.32 432.82 434.70AR 36,058.2 410.03 419.61 421.84 424.12 426.63 429.07 432.23 433.87 435.75AS 37,168.3 409.41 420.39 422.65 425.01 427.64 430.16 433.03 434.72 436.59AT 38,347.5 408.04 421.00 423.26 425.67 428.41 431.02 433.92 435.78 437.78AU 39,358.3 400.54 421.46 423.77 426.24 429.04 431.71 434.61 436.58 438.67AV 39,886.3 412.17 421.71 424.06 426.56 429.44 432.22 435.25 437.45 439.68AW 40,479.2 417.27 422.30 424.56 427.02 429.87 432.64 435.60 437.80 440.05AX 41,248.6 407.75 423.74 425.86 428.27 431.05 433.67 436.47 438.67 440.82AY 42,026.4 394.99 424.23 426.48 428.97 431.80 434.42 437.14 439.33 441.45AZ 42,807.2 413.20 425.04 427.61 430.51 433.67 436.45 439.20 441.54 443.80BA 43,313.9 416.00 425.22 427.36 430.39 434.42 436.49 439.38 441.75 444.04BB 43,994.9 421.27 430.31 433.66 436.35 438.50 440.19 442.19 444.34 446.34
Bolton Falls Bypass
DIV-A 775.4 366.15 -- -- -- -- -- -- 367.36 368.47DIV-B 1,233.2 374.29 -- -- -- -- -- -- 377.16 378.61
1,709.8 Power Plant Road Bridge
DIV-C 2,246.6 415.13 -- -- -- -- -- -- 416.79 419.201River station datum for Winooski River is 1,049 ft downstream from Waterbury town boundary.


For more information concerning this report, contact:Director, New England Water Science Center U.S. Geological Survey331 Commerce Way, Suite 2Pembroke, NH [email protected] visit our Web site at:http://nh.water.usgs.gov
Publishing support by: The Pembroke Publishing Service Center.

Olson—Flood M
aps for the Winooski River in W
aterbury, Vermont, 2014—
Scientific Investigations Report 2015–5077
ISSN 2328-0328 (online)http://dx.doi.org/10.3133/sir20155077

![Waterbury, Vermont 05671-1300 [email] DPS.MJRegistry ...medicalmarijuana.vermont.gov/sites/vmr/files/documents/PhytoCareVT... · PhytoScience Institute (PSI)D.B.A. PhytoCare Vermont](https://static.fdocuments.in/doc/165x107/5c7abb0509d3f2bb5e8c59a5/waterbury-vermont-05671-1300-email-dpsmjregistry-phytoscience-institute.jpg)