Flood Hazard and Risk in Lillooet River Valley, British...
205
Flood Hazard and Risk in Lillooet River Valley, British Columbia, Canada by Marit Heideman M.A. (Society, Science, Technology), Maastricht University, 2003, M.Sc. (Geology), Vrije Universiteit Amsterdam, 1999 Thesis Submitted in Partial Fulfillment of the Requirements for the Degree of Doctor of Philosophy in the Department of Earth Sciences Faculty of Science Marit Heideman 2013 SIMON FRASER UNIVERSITY Fall 2013 All rights reserved. However, in accordance with the Copyright Act of Canada, this work may be reproduced, without authorization, under the conditions for “Fair Dealing.” Therefore, limited reproduction of this work for the purposes of private study, research, criticism, review and news reporting is likely to be in accordance with the law, particularly if cited appropriately.
Transcript of Flood Hazard and Risk in Lillooet River Valley, British...
Flood Hazard and Risk in Lillooet River Valley,
British Columbia, Canada
by
Marit Heideman
M.A. (Society, Science, Technology), Maastricht University, 2003, M.Sc. (Geology), Vrije Universiteit Amsterdam, 1999
Thesis Submitted in Partial Fulfillment
of the Requirements for the Degree of
Doctor of Philosophy
in the
Department of Earth Sciences
Faculty of Science
Marit Heideman 2013
SIMON FRASER UNIVERSITY
Fall 2013
All rights reserved. However, in accordance with the Copyright Act of Canada, this work may
be reproduced, without authorization, under the conditions for “Fair Dealing.” Therefore, limited reproduction of this work for the
purposes of private study, research, criticism, review and news reporting is likely to be in accordance with the law, particularly if cited appropriately.

ii
Approval
Name: Marit Heideman
Degree: Doctor of Philosophy (Geology)
Title of Thesis: Flood Hazard and Risk in Lillooet River Valley, British Columbia, Canada
Examining Committee: Chair: Gwenn Flowers Associate Professor
John J. Clague Senior Supervisor Professor
Peter Anderson Supervisor Associate Professor School of Communication
Stephanie Chang Supervisor Professor School of Community and Regional Planning University of British Columbia
Brian Menounos Supervisor Associate Professor Department of Geography University of Northern British Columbia
Brent Ward Internal Examiner Associate Professor Department of Earth Sciences
Audrey Dallimore External Examiner Associate Professor School of Environment and Sustainability Royal Roads University
Date Defended/Approved: September 9, 2013

iii
Partial Copyright Licence

iv
Ethics Statement

v
Abstract
This thesis examines flood hazard in Lillooet River valley in the southern Coast
Mountains of British Columbia, Canada. My research is multi-disciplinary: I used earth
science methods to estimate pre-historical flood frequency and sediment yield, as well
social science theory to study the process of knowledge transfer between the scientific
community and local stakeholders. The results from this thesis contribute to and
complement previous earth science and natural hazard studies in Lillooet River valley,
while furthermore providing knowledge for river and floodplain management. The results
also shed a light on the communication of scientific knowledge to local emergency
managers and the use of such information at the local level.
My thesis comprises three studies. First, I compiled a varve chronology spanning
825 years (AD 1179-2004) from annually layered sediments (varves) recovered from
Lillooet Lake. I compared twentieth-century discharge records of Lillooet River to the
contemporary part of the varve chronology to determine the relation between river
discharge and varve thickness. Based on this relation, I examined the entire 825-year
varve chronology for the floods it might record. Second, I made annual sediment yield
estimates for the period AD 1629-1997 and compared them to estimates derived from
Lillooet Lake cores by previous researchers. I compared times of anomalously high
sediment yield to ages of large landslides and floods in the watershed, and to times of
marked glacier advance and retreat in order to understand controls on sediment
delivery. I assessed the persistence of high sediment input episodes using statistical
methods. Third, I assessed the history and current flood management policy landscape
at the federal, provincial, and local levels. In the context of the transfer of flood
management responsibility from the British Columbia Government to municipalities in
2003, I interviewed local floodplain and emergency managers on their use of scientific
knowledge in preparing for flooding in Lillooet River valley.
Keywords: varves; sediment yield; flooding; natural hazards; Lillooet River valley; British Columbia; knowledge transfer; society-science relationships; flood management

vi
Dedication
To Pieter, Noor and Yula

vii
Quotation
The point is not for flood scientists to dictate what people are supposed to do about flood hazards,
but for a science of floods that so compels peoples’ perceptions about floods that they actually take the actions necessary
to mitigate hazardous consequences. (Baker et al., 2002, p. 9)

viii
Acknowledgements
I first and foremost want to thank my senior supervisor, Dr. John J. Clague. His
continuing support, advice, and expertise throughout the many years have greatly
helped me (re-)shape my thoughts and research.
I also want to express deep gratitude to my co-supervisor, Dr. Brian Menounos, for his
guidance in the field and the laboratory, and for patiently answering countless questions
in person and through many e-mail and phone conversations. I also thank my other
supervisory committee members, Dr. Stephanie Chang and Dr. Peter Anderson, who
provided valuable input and advice for the non-geology section of this thesis.
There are many other people without whom I would not have been able to complete my
PhD research. Dr. Rolf Mathewes (SFU) generously allowed me to use his laboratory to
process sediment cores. Dr. Ian Hutchinson (SFU) lent me his bone saw to cut the
cores. Dr. James MacEachern (SFU) lent me his digital camera. Dr. Paul Whitfield
allowed me to access hydrological files on Lillooet River stored at Environment Canada.
Furthermore I thank Vanessa Egginton (Environment Canada) for providing data from
several climate stations in or near Lillooet River valley. Stefan Joyce and Mike Curry
(Kerr Wood Leidal Associates Ltd.) provided reports and data for Lillooet River valley.
Many fellow students have helped me during my tenure at SFU. Thanks to Tom
Lakeman and Melanie Grubb for assisting me recover sediment cores from Lillooet
Lake. I also thank Melanie for many hours of help in processing cores. Many thanks to
three of the best office mates one could ever have: Courtenay Brown (who also spent
many hours in the lab with me), Lesley Dampier, and Michelle Hanson. I shared many
highs and lows of my PhD research with them. My friend Elizabeth Colunga-Juarez
answered many of my statistics questions and patiently taught me how to use R
software. Nick Roberts helped me with GIS related issues.
ix
Further thanks go to the three respondents who participated in interviews for this thesis.
Each of them also provided valuable information, discussions, and contacts in the early
phases of this research.
I also thank the staff of the Earth Science department at SFU for assisting me with
countless issues throughout the years: Glenda Pauls, Tarja Vaisanen, Matt Plotnikoff,
Rodney Arnold, and Bonnie Karhukangas.
I especially want to thank my parents, Jan and Marleen, for their long-distance support
and belief in me; my husband, Pieter, for his assistance with GIS matters, but more
importantly for his patience and his continued words of support, encouragement, and
love during all these years; and last, but certainly not least, Noor and Yula, for their
unconditional love, and for providing the necessary and unnecessary distractions while I
pursued my PhD degree.

x
Table of Contents
Approval .......................................................................................................................... ii Partial Copyright Licence ............................................................................................... iii Ethics Statement ............................................................................................................ iv Abstract ........................................................................................................................... v Dedication ...................................................................................................................... vi Quotation ...................................................................................................................... vii Acknowledgements ....................................................................................................... viii Table of Contents ............................................................................................................ x List of Tables ................................................................................................................. xiii List of Figures................................................................................................................xiv
1. Introduction .......................................................................................................... 1 1.1. Flood hazard .......................................................................................................... 1 1.2. Scientific knowledge and natural hazards ............................................................... 4
1.2.1. Natural hazards research ............................................................................ 4 1.2.2. Scientific knowledge available for flood management ................................. 5
1.3. Knowledge transfers between science and society ................................................. 6 1.4. Study area .............................................................................................................. 8
1.4.1. Floods and flood management in Lillooet River valley ............................... 10 1.4.2. Current state of scientific knowledge in Lillooet River valley ...................... 11
1.5. Thesis objectives .................................................................................................. 12 1.6. Thesis outline ....................................................................................................... 12
2. A late Holocene varve record from Lillooet Lake, British Columbia, and its use as a flood proxy .............................................................................. 14
2.1. Abstract ................................................................................................................ 14 2.2. Introduction .......................................................................................................... 14 2.3. Study site ............................................................................................................. 17 2.4. Methods ............................................................................................................... 20
2.4.1. Statistical calculations between varve thickness and discharge ................ 22 2.5. Results ................................................................................................................. 23
2.5.1. Sedimentology .......................................................................................... 23 2.5.2. Varve chronology ...................................................................................... 26 2.5.3. Sedimentation rates .................................................................................. 28 2.5.4. Particle-size characteristics ....................................................................... 30 2.5.5. Varve thickness and twentieth-century Lillooet River discharge ................ 31 2.5.6. Long-term varve chronology ...................................................................... 34
2.6. Discussion ............................................................................................................ 38 2.6.1. Twentieth-century trends ........................................................................... 39 2.6.2. Regional varve records and climate proxies for the twentieth century ....... 44 2.6.3. Comparison to other streamflow proxies ................................................... 48 2.6.4. Anomalous varves in the period AD 1179-2004 ........................................ 48 2.6.5. Implications for flood frequency ................................................................. 49 2.6.6. Prehistoric climate proxies ........................................................................ 52 2.6.7. Implications for pre-historic flood reconstruction ........................................ 53
2.7. Conclusions and recommendations ...................................................................... 55

xi
3. A 369-year record of suspended sediment yield, Lillooet Lake, Coast Mountains, Canada .................................................................................. 58
3.1. Abstract ................................................................................................................ 58 3.2. Introduction .......................................................................................................... 59 3.3. Study area ............................................................................................................ 61 3.4. Methods ............................................................................................................... 64 3.5. Results ................................................................................................................. 66
3.5.1. Sedimentology .......................................................................................... 66 3.5.2. Error in sediment yield and estimation of total basin yield ......................... 67 3.5.3. Characteristics of the long-term sediment yield record .............................. 68 3.5.4. Long-term sediment-yield departures ........................................................ 71 3.5.5. Sediment yield trends following high-yield years ....................................... 73 3.5.6. Persistence of high-yield years ................................................................. 74
3.6. Discussion ............................................................................................................ 78 3.6.1. Comparison to other sediment yield studies .............................................. 78 3.6.2. Sediment sources and storage: persistence in the
sediment-yield record ................................................................................ 82 3.6.3. Interpretation of sediment-yield signal ....................................................... 85
Glacier changes and landslides during the period of the varve record (AD 1629-1997) .............................................................. 85
Twentieth century ...................................................................................... 90 3.7. Conclusions .......................................................................................................... 91
4. Role of science and technology in flood hazard management in Lillooet River valley ............................................................................................ 94
4.1. Abstract ................................................................................................................ 94 4.2. Introduction .......................................................................................................... 94
4.2.1. Science - society relationship .................................................................... 96 Knowledge transfer barriers in environmental and
natural hazard research ...................................................................... 98 Fostering the transfer and utilization of scientific knowledge ................... 100
4.2.2. Interviews ................................................................................................ 100 4.2.3. Research question and interview questions ............................................ 101
4.3. Study area .......................................................................................................... 102 4.3.1. Physical setting ....................................................................................... 102 4.3.2. Settlement history ................................................................................... 104
Mount Currie First Nations reserve .......................................................... 104 Village of Pemberton ............................................................................... 105
4.3.3. Flooding in Lillooet River valley ............................................................... 106 Causes of flooding .................................................................................. 106 River training ........................................................................................... 108 The 1940, 2003, and 2010 floods ............................................................ 109
Pre-engineering: The flood of October 17-20, 1940 ........................... 109 Post-engineering: The flood of October 16-22, 2003 ......................... 109 August 6, 2010, Mount Meager landslide and flood ........................... 110
4.4. Policy development and scientific publications ................................................... 110 4.4.1. Government flood management .............................................................. 110
Federal and provincial policies and responsibilities ................................. 112 Local and regional government bylaws ................................................... 112

xii
4.4.2. Basic and applied scientific research related to flooding ......................... 116 Scientific publications .............................................................................. 118 Consultancy reports ................................................................................ 120 Government publications ........................................................................ 120
4.4.3. Advances in data collection ..................................................................... 121 4.5. Community interviews ........................................................................................ 122
4.5.1. Respondent 1: Capacity of local government .......................................... 122 4.5.2. Respondent 2: Application and relevance of scientific knowledge ........... 123 4.5.3. Respondent 3: Communication of scientific knowledge ........................... 125 4.5.4. Other comments from the respondents ................................................... 126
4.6. Discussion .......................................................................................................... 127 4.7. Summary and conclusions .................................................................................. 131
5. The value of paleoflood research for flood hazard management .................. 133 5.1. Introduction ........................................................................................................ 133 5.2. Changes in floodplain management ................................................................... 133 5.3. Why do people still live on the floodplain in spite of the risk they face?............... 135 5.4. Flood frequency analysis as the underpinning for flood management ................. 136 5.5. Paleoflood research ............................................................................................ 137 5.6. The value of paleoflood research for Lillooet River valley flood management ..... 140
6. General conclusions ........................................................................................ 143 6.1. General summary ............................................................................................... 143 6.2. Recommendations for interdisciplinary research in the field of
natural hazards ................................................................................................... 145 6.3. Future work ........................................................................................................ 145
References ................................................................................................................. 147 Appendix A. Lake bathymetry, sedimentation, and varve formation in
Lillooet Lake. ........................................................................................ 162 Lake bathymetry ................................................................................................. 162 Sedimentation in Lillooet Lake ............................................................................ 162
Appendix B. Cores collected in Lillooet Lake in 2005 and 2006. ............................... 164 Appendix C. Core stratigraphy and bulk properties ................................................... 165 Appendix D. Historical floods in Lillooet River valley. ................................................ 177 Appendix E. Peak discharge of Lillooet River for the period 1914-2004
(source Environment Canada). ............................................................. 179 Appendix F. Identified landslides in the historic period (1900-2004). ........................ 182 Appendix G. Interview questions .............................................................................. 183
Participant background information .................................................................... 183 Research question.............................................................................................. 183 Closing questions ............................................................................................... 185
Appendix H. Flood policies and programs ................................................................ 186 Federal flood policies and programs ................................................................... 186 Provincial policies and programs ........................................................................ 188

xiii
List of Tables
Table 2.1. Minimum, maximum, and average thickness (in mm) of varves in Lillooet Lake cores. ................................................................................... 24
Table 2.2. Radiocarbon ages of two samples recovered in core A. ............................ 28
Table 2.3. Varve error based on radiocarbon ages. ................................................... 28
Table 2.4. Varve error based on varve counts and cross-correlation. ........................ 28
Table 2.5. Particle-size statistics for proximal core 5 and distal core A. ..................... 30
Table 2.6. D50 particle-size (in μm) for the four largest historic floods in all cores (listed from north to south). .............................................................. 32
Table 2.7. Correlation between varve thickness (log-transformed and z-score) and discharge for each core for the period 1914-2004. ............................. 35
Table 2.8. Correlation between varve thickness (log-transformed and z-score) and discharge for each core for the period 1914-1945. ............................. 36
Table 2.9. Correlation between varve thickness (log-transformed and z-score) and discharge for each core for the period 1946-2004. ............................. 36
Table 2.10. Number of varve years with a transformed varve thickness larger
than two times the standard deviation (2 ) and larger than the 9th decile (corresponding to peaks in Figure 2.7). ........................................... 38
Table 2.11. Systems and processes that contribute to the formation of varves in a proglacial environment (adapted from Hodder et al., 2007). ................... 39
Table 2.12. Ten highest maximum annual daily discharges during the period 1914-2004 (Environment Canada, 2010). ................................................. 41
Table 3.1. Sediment yield estimates for the entire period of record, AD 1179-1629, and 1629-1997. ............................................................................... 70
Table 3.2. Mean sediment yield per century............................................................... 70
Table 3.3. Number of years with sediment yields greater than specified estimated return periods. .......................................................................... 72
Table 3.4. Comparison of sediment yield estimates derived from this study (AD 1629-2004) and other published values. ................................................... 79
Table 4.1. Census statistics for Pemberton and Mount Currie (BCStats, 2012b). ........ 106
Table 4.2. Summary of important historical hydrological events in Lillooet River valley. ..................................................................................................... 108
Table 4.3. Peer-reviewed scientific publications and reports on natural hazards in Lillooet River valley and hazard management in British Columbia. ...... 119
xiv
List of Figures
Figure 1.1. Reported natural disasters, 1900-2011 (number of people reported killed, number of disasters reported, number of people reported affected). (Modified from EM-DAT: The OFDA/CRED International Disasters Database, 2009). ......................................................................... 2
Figure 1.2. Number of reported natural disasters, 1900-2011. (Modified from EM-DAT: The OFDA/CRED International Disasters Database, 2009). ......................................................................................................... 3
Figure 1.3. Location of the study area (square) in British Columbia. ............................. 9
Figure 1.4. Annual maximum daily discharge of Lillooet River, AD 1914-2004. ........... 11
Figure 2.1. Map of Lillooet Lake watershed. Inset left: bathymetry of Lillooet Lake and core locations. ........................................................................... 17
Figure 2.2. Annual maximum mean daily discharge (m3 s-1) of Lillooet River, 1914-2004. Insets show annual hydrographs for 1931 and 2003, years in which thick varves were deposited in Lillooet Lake. ..................... 19
Figure 2.3 Varve types in core 5. ............................................................................... 24
Figure 2.4. Examples of thick varves in Lillooet Lake. a. 1931 (landslide at Mount Meager and a minor autumn flood). b. 1940 (autumn flood). c. 1980 (winter flood). From left to right, proximal core (C), mid-lake core (2), and distal core (E). Vertical black bar at lower left of each photograph is 1 cm. Colours have been enhanced for contrast. ................ 25
Figure 2.5. a. Varve chronology for Lillooet Lake, AD 1170-2004. b. Varve thickness and maximum daily discharge, 1914-2004. Noted years are mentioned in the text. .......................................................................... 27
Figure 2.6. Overview of marker beds in Lillooet Lake cores; cores are ordered from north (left) to south (right). ................................................................. 29
Figure 2.7. Sedimentation rates in the proximal and distal basins of Lillooet Lake. Lettered data points are marker beds in the varve chronology......... 30
Figure 2.8. Particle-size distribution in (a) core 5 (proximal basin) and (b) core A (distal basin). Noted years are mentioned in the text. ................................ 32
Figure 2.9. Residual plot for the composite core, 1914-2004. a. Scatter plot and best-fit regression line between transformed varve thickness and discharge. b. Frequency distribution of residuals. c. Residuals vs. fitted values. d. Residual plot through time. ............................................... 37
Figure 2.10. Anomalously thick prehistoric varves. a. core A. b. core B. From left to right, varve years AD 1493, 1511, and 1611. Vertical black bar at bottom left of each varve is 1 cm. Dotted lines denote varve boundaries. Colours have been enhanced for contrast. ............................ 50

xv
Figure 2.11. The AD 1295 and 1300 varves in core A. Vertical black bar at lower left of photograph is 1 cm. ......................................................................... 51
Figure 2.12. Varve thickness in the Lillooet Lake and glacier fluctuations in western Canada (modified from Clague et al., 2009) and Garibaldi Provincial Park (modified from Koch et al., 2007). ..................................... 54
Figure 3.1. Holocene sedimentation in Lillooet River valley (figure not to scale). Red box indicates the period of this study. Adapted from Jordan & Slaymaker (1991). ..................................................................................... 61
Figure 3.2. Map of the Lillooet Lake watershed. Inset left: bathymetry of Lillooet Lake and core locations. ........................................................................... 63
Figure 3.3. Sediment yield record derived from Lillooet Lake sediments for the period AD 1179-2004. ............................................................................... 69
Figure 3.4. Sediment yield record derived from Lillooet Lake sediments for the period AD 1629-1997. ............................................................................... 71
Figure 3.5. Estimated return periods for sediment yield estimates, AD 1629-1997, based on a generalized extreme value (GEV) distribution (numbers in black are years with return periods greater than once every 25 years). ........................................................................................ 72
Figure 3.6. Cumulative departure of sediment yield for the period AD 1629-1997. ......................................................................................................... 74
Figure 3.7. Cumulative departure from AD 1629-1997 mean sediment yield for each group of recurrence interval group (lower left: Y25-50; upper right: Y50-100; upper left: >Y100). .................................................................. 75
Figure 3.8. Cumulative departure from AD 1629-1997 mean sediment yield for events with a recurrence interval between 10 and 25 years (Y10-25; orange: seventeenth century; green: eighteenth century; blue: nineteenth century; red: twentieth century; black: average cumulative departure of all Q10-25 events). .............................................. 76
Figure 3.9. Deviations from the mean over the period extending from 10 years before to 30 years after each high-yield year for groups with different recurrence intervals, AD 1629-1997. Red column is event year ‘0’. ..................................................................................................... 77
Figure 3.10 Deviations from the mean over the period extending from 10 years before to 30 years after each high-yield year for groups with different recurrence intervals; twentieth century. Red column is event year ‘0’. ........................................................................................... 78

xvi
Figure 3.11. Comparison of suspended sediment yield for the Lillooet River watershed (this study; red circle with error bars) and specific sediment yield (i.e. “the quantity of sediment passing a monitored river cross-section per unit area drained upstream of that section”; Church and Slaymaker, 1989, p. 452) in British Columbia. Closed symbols are data from natural landscapes; open symbols are data from landscapes influenced by natural or human disturbances. Measurements for Lillooet Lake from Church et al. (1989) are derived from a 57-year record of lake sedimentation reported by Gilbert (1973). Modified from Church & Slaymaker (1989). ....................... 80
Figure 3.12. Sediment yield and maximum daily discharge of Lillooet River during the twentieth century. Historic floods and landslides are listed in Appendices D and F. ............................................................................. 84
Figure 3.13. Conceptual model of sediment storage and transfer in Lillooet River valley, showing the most important sediment storage sites (adapted from Jordan & Slaymaker, 1991). Sediment transfers between each storage site operate continuously on all time scales. ................................. 87
Figure 3.14. Sediment yield in the Lillooet River watershed, dated landslides at Mount Meager (Friele et al., 2008), and glacier fluctuations in western Canada (modified from Clague et al., 2009) and Garibaldi Provincial Park (modified from Koch et al., 2007). Uncertainties in the ages of prehistoric landslides are shown with horizontal bars. ............ 88
Figure 3.15. Examples of the (a) AD 1931 and (b) 1776 varves in Lillooet Lake from cores C, 2 and E (left to right; proximal to distal core locations). The vertical black bar at lower left of each photograph is 1 cm. ................ 89
Figure 4.1. Models of knowledge transfer. a) Linear model. b) Pasteur’s quadrant (reproduced from Stokes, 1997). ................................................ 98
Figure 4.2. Map of the study area (adapted from Google Earth)................................ 103
Figure 4.3. Mean temperature and mean precipitation at Pemberton Airport, 1984-2011 (Environment Canada, 2011). ............................................... 107
Figure 4.4. Typical hydrographs of Lillooet River. a. Freshet flood (1968). b. Rain-on-snow flood (2003). c. Secondary flood in response to 2010 landslide (inset at right shows an initial drop in the hydrograph (1) when the landslide blocked Meager Creek and Lillooet River, followed by a recovery in flow (2) as Lillooet River incised the landslide deposit, and finally (3) arrival of the flood wave after Meager Creek breached the landslide dam (adapted from Guthrie et al., 2012). ................................................................................................ 111
Figure 4.5. Provincial and federal water policies. ...................................................... 113
Figure 5.1. Flood-society relationships (after Baker et al., 2002). .............................. 140

1
1. Introduction
1.1. Flood hazard
Natural hazards are omnipresent in our world and always have been. However,
the number of disasters reported and the number of people affected have rapidly
increased in recent decades (Figure 1.1), despite improved knowledge and awareness
of natural hazards (White et al., 2001).
Natural hazards are typically grouped in hydrometeorological, geological, and
biological categories (UN/ISDR, 2004, p. 39). Many geological hazards, including
earthquakes, volcanic eruptions, and most tsunamis, are related to internal Earth forces;
their occurrence probably does not change over long periods. In contrast, the frequency
and intensity of hydrometeorological hazards, for example floods and windstorms, may
change as Earth’s climate warms (UN/ISDR, 2004). The Intergovernmental Panel on
Climate Change (IPCC) has published four assessments of scientific knowledge about
global climate change and its effects on society (the fifth assessment will be released in
the spring of 2014). Changes in climate may, in turn, alter exposure to biological
hazards, such as epidemics. Any change in the frequency or intensity of
hydrometeorological hazards is of interest, especially considering a growing (global)
population (EM-DAT, 2009). Flooding is the most reported and injurious natural hazard
(EM-DAT, 2009; Figure 1.2).
The focus of this thesis is river flooding, which can be seasonal, as in the case of
spring floods caused by snow melt, or the result of sudden downpours (flash floods).
Another type of flooding results from storm surges accompanying cyclones (e.g.,
flooding of New Orleans during Hurricane Katrina in 2005). Each of these types of floods
can result in large economic losses, especially in densely populated areas. Secondary
hazards that either accompany or follow a flood can exacerbate damage. For example,
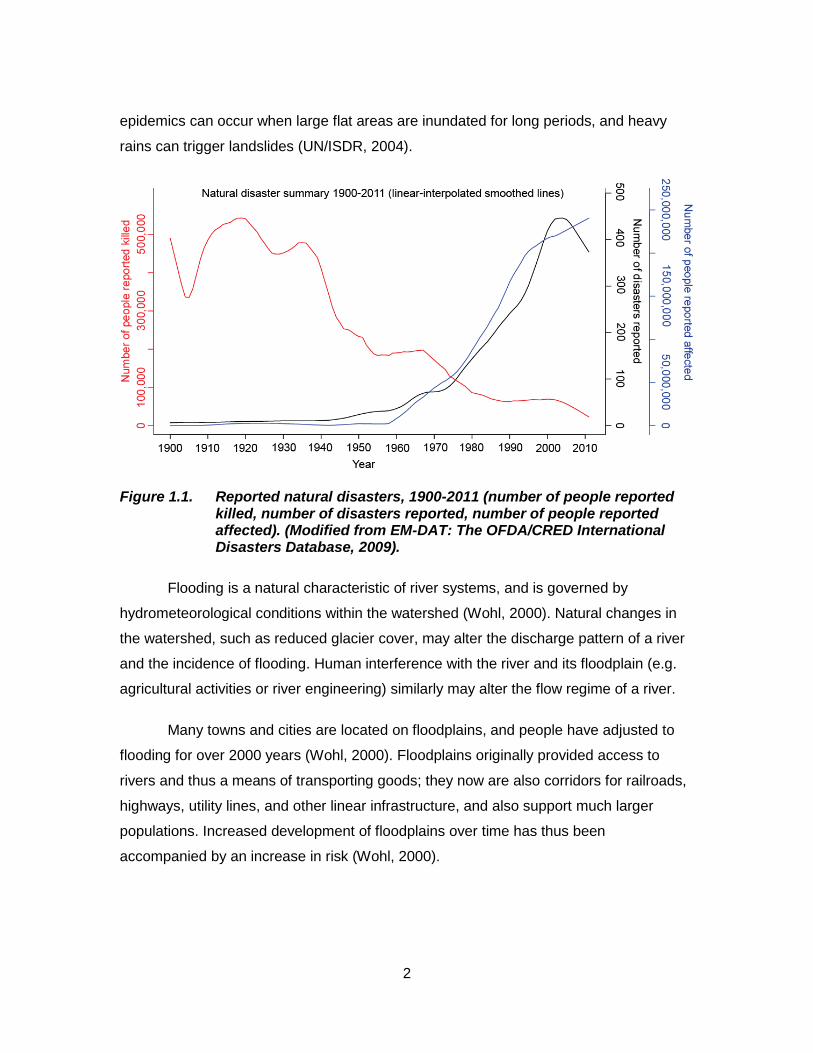
2
epidemics can occur when large flat areas are inundated for long periods, and heavy
rains can trigger landslides (UN/ISDR, 2004).
Figure 1.1. Reported natural disasters, 1900-2011 (number of people reported killed, number of disasters reported, number of people reported affected). (Modified from EM-DAT: The OFDA/CRED International Disasters Database, 2009).
Flooding is a natural characteristic of river systems, and is governed by
hydrometeorological conditions within the watershed (Wohl, 2000). Natural changes in
the watershed, such as reduced glacier cover, may alter the discharge pattern of a river
and the incidence of flooding. Human interference with the river and its floodplain (e.g.
agricultural activities or river engineering) similarly may alter the flow regime of a river.
Many towns and cities are located on floodplains, and people have adjusted to
flooding for over 2000 years (Wohl, 2000). Floodplains originally provided access to
rivers and thus a means of transporting goods; they now are also corridors for railroads,
highways, utility lines, and other linear infrastructure, and also support much larger
populations. Increased development of floodplains over time has thus been
accompanied by an increase in risk (Wohl, 2000).

3
Figure 1.2. Number of reported natural disasters, 1900-2011. (Modified from EM-DAT: The OFDA/CRED International Disasters Database, 2009).
The history of flooding in a region underpins an appropriate mitigation strategy.
Where the oral or written history of floods is brief or lacking, paleohydrological
observations can be used to reconstruct the flood history of a watershed (Baker et al.,
2002). Similar to flood marks on buildings, evidence of past floods can be found in trees,
for example scars and changes in ring width (Stoffel & Bollschweiller, 2008). Floods also
deposit sediments and erode channels, thus providing information on maximum water
levels of prehistorical floods (Baker et al., 2002). Paleoflood hydrology is a relatively new
discipline, having developed primarily in the past 40 years (Baker et al., 1979, 2002).
The discipline can provide floodplain managers insights into flood hazards that are not
available from historical accounts and river gauging. Nevertheless, paleoflood analysis
is, in most instances, not yet integrated into flood management.

4
1.2. Scientific knowledge and natural hazards
1.2.1. Natural hazards research
Natural hazards research is pursued in both the applied natural and social
sciences, and several schools of thought have emerged based on principles and
expertise in geology, other physical sciences, geography, anthropology, sociology,
development studies, disaster medicine, and epidemiology (Alexander, 1991). Two of
the most influential early researchers grounded in the geographical school of thought are
Harlan H. Barrows and Gilbert F. White. Barrows was a pioneer in interdisciplinary
research and “saw geography as human ecology or the study of adjustment of man to
his environment” (White et al., 1968, p. 5). White was a renowned geographer, whose
thoughts were shaped by John Dewey’s philosophy on human ecology (Mileti, 1999). He
is recognised and praised for his work in natural hazards, in particular flooding and flood
management (White, 1945, 1973). White has “maintained that natural hazards are the
result of interacting natural and social forces and that hazards and their impacts can be
reduced through individual and social adjustment” (Mileti, 1999, p. 19). His PhD
dissertation on human adjustments to floods (White, 1945) still influences hazards
research (Mileti, 1999). In this dissertation, White (1945) discussed adjustments to
floods, including, for example, land elevation, flood protection (i.e. structural solutions),
emergency measures, land-use changes, public relief, and insurance. White concludes
“that a comprehensive [flood] policy using a wide variety of adjustments is required”
(Macdonald et al., 2011, p. 128).
Since the early work of White, much research has been done on different
aspects of flooding and other natural hazards. In addition to natural science research on
the mechanisms of hazardous processes, many studies have assessed the social
impacts and consequences of natural hazards. Most current natural hazards research
performed within the social science school of thought assumes that human adjustment
to hazards is cyclical and comprises four stages: preparedness, response, recovery, and
mitigation (Mileti, 1999). Each of the four stages refers to processes that take place prior
to (preparedness), during (response and recovery), and after (mitigation) a natural
disaster.

5
In recent decades, natural hazards research has grown at an explosive pace,
accompanied by a parallel growth in the related literature (Alexander, 1997; White et al.,
2001). However, White et al. (2001, p. 1) postulate that, in spite of the much greater
knowledge of hazards, losses from natural disasters are increasing. The authors offer
four possible explanations for “why more is lost while more is known”:
1. “Knowledge continues to be flawed by areas of ignorance;
2. Knowledge is available but not used effectively;
3. Knowledge is used effectively but takes a long time to have effect, and;
4. Knowledge is used effectively in some respects but is overwhelmed by increases in vulnerability and in population, wealth, and poverty.”
The Intergovenmental Panel on Climate Change (2007, 2013) concluded that,
global climate change, coupled with population growth, will increase the number and
severity of natural disasters. Of relevance to this thesis, winter flooding is expected to
increase in North America. To reduce damage and injury from floods, relevant scientific
information must be current and, more importantly, must be effectively transferred and
used by responsible government agencies.
1.2.2. Scientific knowledge available for flood management
Two kinds of data provided by geography and physical sciences can contribute to
flood management: real-time data and data provided by ‘traditional’ scientific studies.
Both types of data can be used to estimate flood hazard and risk (e.g.,
Intergovernmental Panel on Climate Change, 2007, 2013; Lemmen et al., 2008).
Real-time data, such as discharge measurements and high water marks, have
been collected around the world for centuries (e.g. Naulet et al., 2005; Neppel et al.,
2011) and used in flood frequency analysis. Technological advances during the past
century have greatly increased the availability and quality of real-time data, even in
many remote localities. In addition, advances in meteorology and monitoring of weather
systems, for example with satellites, have increased our understanding of the relations
between climate and hydrology, and have improved our ability to forecast storms and
subsequent floods.

6
Scientific studies have also contributed knowledge required for flood
management. Paleoflood hydrological studies, for example, have supported
assessments of flood hazard and risk (Baker et al., 2002). The data that these studies
provide include ages of prehistoric floods, their peak discharges, and their frequency.
Benito et al. (2004) discuss the use of paleoflood data in combination with historical data
to improve flood risk analysis for several European watersheds. They comment that
improved flood estimates enable more informed decisions about floodplain use, the
design of hydraulic structures, management of critical water resources, and
environmental conservation.
Paleoflood studies also provide insights into the relations between past climate
and flooding. Several researchers have used varves (annually laminated sediments) in
paleoclimatic reconstructions. Lamoureux (2000), for example, describes a 487-year
sequence of varved sediment from Nicolay Lake in Nunavut. He interpreted anomalous
rainfall events from the thickness and lithology of the varves. Leonard (1997) retrieved a
4450-year varve record from Hector Lake in Alberta, from which he inferred changes in
glacier extent within the watershed. Sander et al. (2002) analysed a 2000-year varve
record from the river Ångermanälven in central Sweden to establish a history of
paleofloods. Brooks et al. (2002) identified and dated past floods in the Red River valley,
from scarring of old trees on the floodplain. Medioli & Brooks (2003) found that deposits
the 1997 and 1999 Red River floods have unique diatom and thecamoebian
assemblages and suggested that these assemblages could be used to reconstruct a
history of prehistoric floods.
1.3. Knowledge transfers between science and society
An influential report by Bush (1945) on the importance of science for society led
to a popular post-Second World War linear model of the relation between science and
society that still shapes science policies today. Bush (1945) argued that scientific
knowledge is the basis for technological progress and in many cases eventually leads to
important social contributions and practical applications. As an example, he stated that
new knowledge of diseases would enable us to find medicines to cure them.

7
Bush’s model, in which society is stipulated as the receiving member in the
process of knowledge transfer, is an inaccurate portrayal of the actual relationship
between science and society (Wise, 1985). Many scientists have criticized Bush’s
unidirectional model of knowledge transfer (e.g. Wise, 1985; Tatum, 1995; Stokes, 1997;
Pielke, 2010) and proposed different views. For example, Stokes (1997) classified
scientific knowledge based on its use and the quest for fundamental understanding.
Since Bush’s report on scientific knowledge and its use and applications, many
authors have assessed aspects of the science-society relationship. In Chapter 4 of this
dissertation, I explore the transfer of scientific knowledge from the science community to
local governments, and the use of that knowledge by the latter groups to reduce flood
hazard in Lillooet River valley.
Much knowledge about natural hazards is publically available (White et al.,
2001), but several studies have concluded that this knowledge is poorly communicated
to, and not effectively used by, decision-makers and practitioners (White et al., 2001;
Holmes & Clark, 2008). Lack of collaboration and communication, and differences in
perspectives and priorities have been cited as the main barriers to effective knowledge
transfer (Morss et al., 2005; Holmes & Clark, 2008).
The Intergovernmental Panel on Climate Change (2007, 2013) provides an
exhaustive review of scientific advances in our understanding of climate change and its
relation to hydro-meteorological hazards (Intergovernmental Panel on Climate Change,
2007, 2013). Yet it does not provide an assessment of the efficacy of the transfer and
use of this information by society. UN/ISDR (2004) concludes in its ‘Living with Risk’
report that, although scientific information is widely available, it does not necessarily
meet the needs of potential users. The wealth of available information makes it difficult
for users to extract or distill knowledge of value to them.
UN/ISDR (2004) suggests that national audits of risk-related information needs,
availability, and limitations would be beneficial to users. An example of such a national
audit in Canada is the report ‘From Impacts to Adaptation: Canada in a Changing
Climate 2007’ (Lemmen et al., 2008), the preface of which summarizes the scientific
advances made in “understanding Canada’s vulnerability to climate change during the

8
past decade.” The report provides a summary, by province, of the current state of
knowledge about climate change, as well as knowledge gaps. Decision-makers require a
better understanding of this information and the risks that climate change pose to
society. The report stresses the importance of “periodic science assessments and the
effective transfer of knowledge to decision-makers” (Lemmen et al., 2008, p. 440). The
value of national scientific assessments to local or regional decision-makers, however,
may be limited; local or regional assessments would be more useful.
A report published by the Columbia Basin Trust (2012) is an excellent example of
a regional scientific assessment, and is an attempt to translate and transfer scientific
knowledge to decision-makers and the public. The main objective of the report is to
provide Canadian communities in the Columbia River basin with a summary of current
scientific understanding of climate change and historical climate trends. The report also
presents possible impacts of climate change for communities in the basin and
suggestions for adapting to a changing climate. In his book on sustainable behavior,
McKenzie-Mohr (2011) argues that, even when information on climate change is
effectively conveyed to society, people will not necessarily act in a sustainable manner.
In Lillooet River valley much research on natural hazards has been done in
recent decades and has provided the scientific community with a better understanding of
the geological, geomorphological, and climatological forces that shaped the region.
Whether or how the availability of this scientific information has assisted local
communities in Lillooet River valley in adapting to flood hazard is the question I try to
answer in Chapter 4 of this thesis.
1.4. Study area
My study area is Lillooet River valley in the southern Coast Mountains of British
Columbia (Figure 1.3). I chose this area for my research for two reasons. First, the valley
has been flooded several times in recent history, and floods seem to have increased
with time. Second, the sedimentary record in Lillooet Lake has annual resolution and
may provide a proxy for Lillooet River floods (Desloges & Gilbert, 1994).

9
Figure 1.3. Location of the study area (square) in British Columbia.
The flat valley floor is bordered by steep slopes and glacier-clad mountains and
is prone to several hazardous natural processes. Floods, landslides, and wildfires pose
threats to residents in the valley, most of whom live in the villages of Pemberton and
Mount Currie. These processes are also hazardous to the highway, railroad, and other
infrastructure. In addition, a dormant volcano, which last erupted about 2400 years ago,
is situated in the upper part of the watershed (Clague et al., 1995).
Lillooet Lake, located just southeast of the community of Mount Currie, is 22 km
long and has a maximum width of about 2 km. The lake is fed by Lillooet River, which
has a source at Lillooet Glacier, approximately 95 km to the northwest. The main
tributaries of Lillooet River are Meager Creek, Ryan River, Green River, and Birkenhead
River (Desloges & Gilbert, 1994). Meager Creek drains the highly unstable Plio-
Pleistocene volcanic rocks of the Mount Meager massif and joins Lillooet River
approximately 65 km north of Lillooet Lake. Varved sediments in Lillooet Lake are
thought to record differences in discharge of Lillooet River (Desloges & Gilbert, 1994)

10
and to provide insight into changing climatologic conditions within the watershed (Gilbert
et al., 2006).
1.4.1. Floods and flood management in Lillooet River valley
This dissertation deals with several aspects of flooding in Lillooet River valley.
Although it has only two small population centers (Pemberton and Mount Currie), Lillooet
River valley is an important agricultural area and transportation route. The most recent
flood in 2003 was the largest flood of record; it claimed five lives and isolated residents
of the valley from the rest of the province for almost a week. Damage was estimated at
CDN $20-30 million (Blais-Stevens & Septer, 2008). More recently, in 2010, a landslide
blocked Meager Creek and Lillooet River, prompting an evacuation of residents of
Pemberton. The landslide dams were overtopped and breached slowly enough that the
communities were not flooded. These recent events have spurred scientific research in
the valley and increased public awareness of the flood hazard (Gilbert et al., 2006;
Simpson et al., 2006; Roche et al., 2011; Guthrie et al., 2012).
Lillooet River discharge has been recorded since 1914 by Environment Canada.
There have at least nine large floods (with a maximum daily discharge greater than 750
m3 s-1) in the valley over this 100-year period. The magnitudes of the floods appear to
have increased over time (Figure 1.4). Because the population in the valley is rapidly
growing (BCStats, 2012a, b, and c), vulnerability and losses from floods have increased.
In response to the flood hazard, both structural (dyking and straightening of Lillooet
River) and non-structural strategies (floodplain mapping, raising buildings above Flood
Construction Level) have been undertaken.
In 2003, the Province of British Columbia devolved responsibility for flood
management to local governments (Ministry of Environment, Water Stewardship
Division, 2011). The four local and regional authorities that presently have responsibility
for flood planning, preparedness, response, and recovery in Lillooet River valley are the
Village of Pemberton, Lil’wat First Nation, Pemberton Valley Dyking District, and
Squamish-Lillooet Regional District.

11
Figure 1.4. Annual maximum daily discharge of Lillooet River, AD 1914-2004.
1.4.2. Current state of scientific knowledge in Lillooet River valley
One of the early scientific publications on the Lillooet River watershed was that of
Carter (1932), who described a large landslide in the valley of Meager Creek. Scientific
interest in the geology and geological processes in the valley increased in the late
twentieth century. Sedimentary processes in Lillooet River valley and lacustrine
sedimentation in Lillooet Lake have been well studied (Gilbert, 1972, 1973, 1975; Jordan
& Slaymaker, 1991; Desloges & Gilbert, 1994, Friele et al., 2005; Gilbert et al., 2006).
During the past decade scientific research has shifted to hazard analysis and
descriptions of hazardous events, with emphasis on recurring landslides in the valley of
Meager Creek (Friele & Clague, 2004; Simpson et al., 2006; Blais-Stevens & Septer,
2008; Roche et al., 2011; Guthrie et al., 2012).
Aside from scientific publications several government reports were published
regarding flooding and flood protection in the Lillooet River watershed (e.g. Wester,
1967; Nesbitt-Porter, 1985; Province of British Columbia, 1990). A number of more
detailed reports on various aspects river management were published by a consultancy

12
agency since the start of the twenty-first century (Kerr Wood Leidal Associates Ltd.,
2002, 2007, 2009, 2010, 2011).
1.5. Thesis objectives
My thesis examines flood hazard and risk in Lillooet River valley using a multi-
disciplinary perspective. I use the record of sediments in Lillooet Lake to assess Lillooet
River flood frequency and sediment yield in the Lillooet River watershed. I also report the
experience of local and regional hazard managers in the use of available scientific
knowledge in the context of recent flood events. My research has three objectives, each
of which is addressed in a separate chapter:
1. Determine whether the historic flood record in Lillooet River valley can be extended using varved sediments recovered from Lillooet Lake.
2. Utilize the varve record from Lillooet Lake to gain a better understanding of long-term suspended sediment yield from the Lillooet River watershed and to identify times and causes of exceptionally high yield both for the entire record and, more specifically, the twentieth century portion of the record. Changes in sediment supply to the river may impact river aggradation, which in turn could affect the occurrence of floods.
3. Examine the process of knowledge utilization in relation to natural hazards, and identify concerns, obstacles, and opportunities for improving this process, by focussing on the experience of local government decision-makers in Lillooet River valley and their use of scientific information for public policy and planning purposes.
1.6. Thesis outline
My thesis comprises an introductory chapter and three research chapters written
in the style of journal manuscripts.
Chapter 2 describes an 825-year varve record retrieved from Lillooet Lake. I
examine the relation between twentieth-century discharge measurements and varve
thickness, and then discuss whether the prehistoric varve record can be used as a proxy
for Lillooet River flood discharge.

13
Chapter 3 reports suspended sediment yield estimates for the period AD 1629-
1997 based on the varve record from Lillooet Lake. I investigate the relation between
high sediment yield years and historical landslides and floods in the watershed, and the
persistence of high sediment yield events. I intend to submit both Chapters 2 and 3 for
publication in a peer-reviewed journal after completing the requirements for the PhD
degree.
Chapter 4 begins with a general introduction into the literature on knowledge
transfer between science and society, followed by a more detailed consideration of such
knowledge transfer in natural hazard science. The chapter includes overviews of the
history of settlement in Lillooet River valley, historical flooding in the valley, and federal,
regional, and local flood policy developments. I summarize interviews with local
government representatives to provide insights into the use of scientific information in
local flood management. The interview manuscript was approved by the Office of
Research Ethics of Simon Fraser University (File no. 2012s0677).
Chapter 5 includes a general discussion of developments in flood management
and the value of paleoflood research. Chapter 6 summarizes the main findings of my
research and provides recommendations for future research. This chapter is followed by
a bibliography and several appendices.

14
2. A late Holocene varve record from Lillooet Lake, British Columbia, and its use as a flood proxy
2.1. Abstract
Lillooet River in southwest British Columbia flooded many times during the past
century and caused considerable damage to the communities in the watershed. The
floods are recorded in Lillooet Lake, at the mouth of the river, as anomalously thick
varves. I compare river discharge records dating back to 1914 to the contemporaneous
record of varve thickness obtained from 12 percussion and vibracores to determine
whether an 825-year varve record can be used as a proxy for discharge. Correlations
between varve thickness and a variety of historical discharge measures are low to
moderate for the period 1914-2004 (r2 = 0.37) and 1914-1945 (r2 = 0.40), but higher for
the period 1946-2004 (r2 = 0.55). Landslides, glacier fluctuations, river dyking, an
artificial lowering of Lillooet Lake level, and lag effects of storms are responsible for the
considerable unexplained variance in the relation between peak annual discharge and
varve thickness in historic time. The cores contain many extremely thick varves, some of
which can possibly be attributed to previously dated prehistoric landslides in the
watershed or to local landslides into the lake. The varve record suggests that the
average recurrence of large floods (annual maximum daily discharge >900 m3 s-1),
ranges from 30-48 years between AD 1586 and 1825 to 20 years between AD 1906 and
2004.
2.2. Introduction
Paleoflood studies are valuable to assess flood hazard and risk (Baker et al.,
2002; Medioli & Brooks, 2003). These studies strive to provide ages and peak
discharges of prehistoric floods, which are useful in extending the historical instrumented

15
record of flooding. They also provide insights into the relation between past climate and
flooding over suitable long time scales.
Many researchers use varves for paleoclimatic reconstructions. Leonard (1997),
for example, obtained a 4450-year varve record from Hector Lake, Alberta, from which
he inferred variations in glacier extent within the watershed. Lamoureux (2000)
described a 487-year sequence of varved sediments from Nicolay Lake, Nunavut,
Canada, and postulated anomalous rainfall events based on the thickness and lithology
of the varves.
Fewer authors examine the relation between river discharge and varve thickness.
Kaufman et al. (2011) assessed the relations between varve thickness and multiple
climate variables at a site in southwest Alaska. They found that varve thickness strongly
correlates with total annual discharge (r2 = 0.75, n = 43, p < 0.0001), but not with other
annual climate variables and the Pacific Decadal Oscillation (PDO). Sander et al. (2002)
documented two exceptionally thick varves in their 2000-year record from an estuary in
central Sweden and concluded that varve thickness significantly correlates with
maximum annual daily discharge (r2 = 0.76).
Much research has been done on the Holocene history and sedimentary
environments of the Lillooet River watershed in the southern Coast Mountains of British
Columbia (Figure 2.1), with a particular focus on Lillooet Lake and Mount Meager
(Gilbert, 1972, 1973, 1975; Jordan & Slaymaker, 1991; Desloges & Gilbert, 1994; Friele
et al., 2005; Gilbert et al., 2006; Simpson et al., 2006). Gilbert (1973, 1975) documented
sedimentary processes operating at the Lillooet River delta and on the adjacent floor of
Lillooet Lake. He described sediment delivery to the lake and the processes that
distribute sediment from the delta to more distal lacustrine environments (Appendix A).
He was the first to show that the bottom sediments in the lake are varved. Varve
formation typically requires thermal stratification within a lake, heterogeneous sediment
influx and the presence of suspended matter in the water column (Sturm, 1979). Gilbert
(1975) also showed that varve thickness is related to Lillooet River discharge.
Three general types of varves are deposited in Lillooet Lake and include simple
two-layered varves and varves with multiple sub-annual laminae, which record runoff

16
dominated by spring (i.e. freshet) and summer (i.e. glacial melt) discharge. In contrast,
anomalously thick varves result from extreme flows (in excess of 600-800 m3 s-1), mostly
generated by autumn rain-on-snow storms (Desloges & Gilbert, 1994). Desloges &
Gilbert (1994) noted that extreme flood events are uncommon in the early part (1865-
1914) of their Lillooet Lake varve record, which they attributed to a lower frequency of
autumn storms and fewer large snowmelt events in spring. The frequency of floods
increases after 1965, coinciding with to a wetter and colder climate in southwest British
Columbia (Desloges & Gilbert, 1994). Menounos et al. (2005) found a positive
correlation between varve thickness and annual maximum mean daily discharge in
several watersheds in the southern Coast Mountains, including the Lillooet River
watershed. They attributed the increase in the frequency and magnitude of floods in the
past several decades to a reorganization of the North Pacific climate system (Mantua &
Hare, 2002), with a consequent increase in autumn flooding.
Gilbert et al. (2006) documented the characteristics of sediment delivered to
Lillooet Lake during the last large flood in October 2003. They found that 8-12 times
more sediment was deposited in the central part of the lake in 2003 than during years
without significant autumn flooding. They were able to trace the 2003 varve throughout
all but the most distal part of the lake based on its thickness, colour, stratigraphy,
magnetic properties, and organic content.
The villages of Pemberton and Mount Currie (Figure 2.1), the main population
centres in the Lillooet River valley, are rapidly growing, increasing the need for a flood
hazard assessment and a flood mitigation plan. In response, I initiated a project to
extend the historic flood record in the valley using the varved sediments in Lillooet Lake
as a flood proxy. To extend the flood record, I compared the nearly 100-year hydrometric
record for Lillooet River to varves deposited over the same period (1914-2004). I
summarize the varve record in this paper and discuss factors that confound
interpretation of the record. Furthermore, I compare the results of my study to those of
other related paleoenvironmental studies in northwest America.

17
Figure 2.1. Map of Lillooet Lake watershed. Inset left: bathymetry of Lillooet Lake and core locations.
2.3. Study site
Lillooet Lake is situated in the southern Coast Mountains of British Columbia,
approximately 160 km north of Vancouver (Figure 2.1). The Lillooet River watershed
upstream of the lake has an area of 3850 km2, of which 14% is permanent snow and
glacier ice. The lake and the inhabited parts of the broad, flat Lillooet River valley are
approximately 200 m above sea level (asl); the highest peaks in the watershed are about
2700 m asl.
Lillooet Lake is 22 km long and has an area of about 20.5 km2; its maximum
depth is 137 m (Desloges & Gilbert, 1994). The lake is dimictic and oligotrophic; it is

18
thermally stratified in summer and does not freeze over in winter (Menounos et al.,
2005). It has two basins separated by a sill (Desloges & Gilbert, 1994). The lake is an
efficient sediment trap, capturing up to 90% of the sediment delivered to it by Lillooet
River (Gilbert, 1973).
Lillooet River extends about 95 km from its headwaters at Lillooet Glacier to
Lillooet Lake, approximately 15 km southeast of Pemberton (Figure 2.1). Approximately
35% of the river’s discharge at the lake head comes from Green River and Birkenhead
River. Joffre, Ure, and Lizzie creeks flow directly into Lillooet Lake; the latter two have
built large sediment fans into the lake from its sides during the postglacial period
(Desloges & Gilbert, 1994).
The flat Lillooet River valley floor ranges from 1.5 to 2.5 km wide and is bordered
by steep valley walls that are locally unstable and subject to landslides and debris flows
(Desloges & Gilbert, 1994; Friele & Clague, 2004). Most of the watershed is underlain by
granitic and metamorphic rocks. A Plio-Pleistocene volcanic complex, centered at Mount
Meager where Meager Creek flows into Lillooet River, makes up only about 2% of
watershed, but is thought to dominate the sediment load of the river (Jordan &
Slaymaker, 1991; Friele et al., 2005). Large (> 1 million m3) landslides occurred on the
flanks of the volcanic massif in 1931, 1947, 1975, 1998, and 2010. The 2010 landslide
had a volume of about 48.5 million m3 and is one of the two largest historic landslides in
western Canada (Guthrie et al., 2012). Even larger landslides, best described as flank
collapses, occurred about 8700 and 4400 years ago (Friele et al., 2005, 2008), and
another large landslide occurred when the volcano last erupted about 2350 years ago
(Clague et al., 1995).
The Lillooet River watershed is located within the Pacific coastal climate region,
which is characterized by high annual precipitation and predominantly falls in autumn
and winter. Extreme floods triggered by heavy rainfall on snow in fall or early winter are
generally larger than those caused by snowmelt in late spring or summer (Melone,
1985).

19
The mean annual discharge of Lillooet River is 126 m3 s-1. The river typically
experiences a peak nival discharge of 400-600 m3 s-1 in June and a comparable peak
discharge related to snow and glacier ice melt in July (Gilbert et al., 2006).
Seven hydrometric stations have operated in Lillooet River valley; the oldest of
these dates back to 1911. The present station has the longest record (08MG005; Figure
2.1), and has been in operation since 1914 except for the period 1918-1923
(Environment Canada, 2010). Eight of the ten largest floods at this station – 1940, 1957,
1968, 1975, 1980, 1981, 1984, 1991, 1992, and 2003 – occurred in fall or early winter,
and seven of the ten floods have happened since 1975 (Figure 2.2).
Figure 2.2. Annual maximum mean daily discharge (m3 s-1) of Lillooet River, 1914-2004. Insets show annual hydrographs for 1931 and 2003, years in which thick varves were deposited in Lillooet Lake.
The reach of Lillooet River between Pemberton Meadows and Pemberton was
first dyked in 1946 to protect residential areas from recurrent floods. Dyking shortened
the river channel by 5.5 km (Kerr Wood Leidal Associates Ltd., 2002). Tenas Narrows
and Lillooet Narrows were dredged in 1946 to lower the level of Lillooet Lake by 2.5 m

20
and thus increased the gradient of Lillooet River and maintain channel depth between
Pemberton and the delta front (Kerr Wood Leidal Associates Ltd., 2002).
2.4. Methods
I collected three percussion cores and nine vibracores from Lillooet Lake during
the summers of 2005 and 2006 (Figure 2.1). The cores were collected in water depths
ranging from 78 to 128 m and have lengths ranging from 1.76 m to 11.06 m (Appendix
B). I cut the cores into sections for transport to the laboratory.
Some sediment was lost from the tops of cores and at the coupling point
between adjacent sections of core pipe. Loose, water-rich sediment at the tops of cores
was disturbed during coring, transport, and splitting. Cores closest to the Lillooet River
delta showed the most disturbances. The uppermost 60 varves in core C, which is
closest to the delta, are difficult to distinguish and thus were not included in the
chronology of that core.
I analyzed the cores in the Northern Sedimentary Archives and Environmental
Change Laboratory at the University of Northern British Columbia (UNBC) in Prince
George, and in Paleoecology Laboratory at Simon Fraser University (SFU) in Burnaby.
The same methods were used in both laboratories. I cleaned, photographed and logged
the cores after splitting them lengthwise. I sampled the cores for density and water
content every 10 cm, using a 2 mL plastic syringe and measured magnetic susceptibility
with a Bartington MS2 meter.
I determined the particle-size distributions of samples taken at 10-cm intervals
from core A from the distal basin and core 5 from the proximal basin in order to
characterize the full range in lithology of the varves. Additionally, I analyzed samples
from varves associated with known twentieth-century floods in all cores to assess
particle-size differences of specific flood events at different locations in the lake. All
samples were pre-treated with 30-35% hydrogen peroxide (H2O2) and dispersed in a
sodium hexametaphosphate (Na6P6O18), solution before analysis. I determined particle-
size distributions of the treated samples with a Malvern Mastersizer Hydro 2000G and
calculated particle-size statistics using GRADISTAT software (Blott & Pye, 2001). A twig

21
and unidentified terrestrial plant tissue recovered from core A, at depths of 930 cm and
1017.5 cm respectively, were radiocarbon-dated at the Keck Carbon Cycle AMS Facility
at the University of California at Irvine. Radiocarbon ages were calibrated using CALIB
6.0 (Stuiver & Reimer, 2011).
I identified varves and marker beds on digital images of the fresh wet core halves
and measured their thicknesses using Gimp2 (2012) software. After initial photographs
were taken and the core halves were sub-sampled, several core sections were partially
dried and re-photographed during the drying process to facilitate recognition and
measurement of varves (Gilbert, 1975; Lamoureux, 2001).
I established a varve chronology using marker beds and varve thickness
measurements using standard techniques (Lamoureux, 2001). Before compiling the
varve chronology, I log-transformed the varve thickness to normalize the data. I then
calculated a z-score to standardize systematic varve thickness differences among core
sites. Z-scores of log-transformed data in each core were computed as follows:
(eq. 2.1)
where is standardized varve thickness for year , is log-transformed varve
thickness, and and are the standard deviation and average log-transformed varve
thickness for a specific core.
I then compiled the chronology as the average z-score thickness for a given year across
all 12 cores (Menounos et al., 2005). I regressed transformed varve thicknesses against
a variety of river discharge measurements using the statistical software package R.
I estimated possible varve errors in two ways. First, I tabulated missing and extra
varves in each core. Second, I compared the difference in calibrated radiocarbon ages
on two samples from core A to the number of varves counted between the two dated
levels in the core.
I identified six types of varves and their associated river discharge and
disturbance regimes: (1) simple varves with no distinct sub-annual laminae, deposited in
years with typical freshet and glacial ice melt peaks (category S); (2) simple varves with
a late-season or upper graded lamina, deposited in years with a late summer or fall high-

22
discharge event (SB); (3) complex or micro-laminated varves with (CO) or without (C)
visible organic material, deposited during years with multiple high inflow events; (4)
anomalously thick varves containing one or more sub-annual laminae with or without
organic material, associated with major floods (AT); (5) anomalously thick varves
resulting from a local slump or other local disturbance in the lake (AL); and (6) other
varves (O) that have none of the above characteristics.
I calculated average sedimentation rates within the proximal and distal basins of
Lillooet Lake by determining the depth of several dated marker beds in each core.
Sediment density did not significantly change down core (Appendix C), therefore I did
not adjust varve thickness for compaction. I calculated sedimentation rates at each core
site by dividing the depth of a particular marker bed by the elapsed time since its
deposition (i.e. the number of varves).
2.4.1. Statistical calculations between varve thickness and discharge
I calculated Pearson’s correlation coefficients for relations between transformed
varve thickness and a variety of discharge measures. I also calculated correlation
coefficients between thicknesses of event beds (i.e. sub-annual laminae) and discharge
in two cores, one from the proximal basin (core 5) and one from the distal basin (core 3).
I performed five sets of calculations to assess correlations between varve
thickness and discharge. Two sets of calculations are relatively simple and assume that
one peak discharge event controls sediment input and thus varve thickness. The other
three sets of calculations are composites and assume that more than one peak
discharge event in a year controls varve thickness.
First, I determined correlations between annual maximum mean daily discharge
(m3 s-1) and varve thickness (Max_D) using data published by the Water Survey of
Environment Canada (2010). I then regressed varve thickness against maximum mean
daily discharge data between August 1 and December 31 (Max_F). Years with missing
data were excluded from this analysis. I also assessed the relation between varve
thickness and the nival melt peak, using peak discharge during the period April 1 – July
31 as a proxy, and during the period of glacier melt, represented by peak discharge

23
during the period July 15 – September 15. Correlation coefficients for these two
relationships, however, are not significant (p>0.05) and therefore are not reported. The
third (A) and fourth (F) sets of calculations are based, respectively, on annual and
fall/winter discharge thresholds. Thresholds were established by summing, respectively,
the ten days of greatest discharge for each year and for the period August 1 – December
31. Increased high flows usually occur only on a few days each year (usually less than
10) during the freshet and glacial melt periods, as well as due to rain or rain-on-snow
storms. The fifth set of calculations was done by regressing varve thickness against the
sum of the maximum fall peak discharge, and/ or the maximum nival melt peak, and/ or
the maximum glacial melt peak (FNG, FN, or FG). To avoid overlap between the
discharge periods and double-counting of peak flows, I assumed that the nival melt
period is April 1 to July 14, the glacial melt period is July 15 to September 14, and fall
extends from September 15 to December 31.
2.5. Results
2.5.1. Sedimentology
Lillooet Lake sediments primarily consist of rhythmically laminated silt and clay
couplets. Previous research confirmed that these couplets represent clastic varves
(Gilbert, 1975; Desloges & Gilbert, 1994). Each couplet comprises a silty lower layer that
grades into a thinner capping clay layer. The contact between the top of one couplet and
the base of the next higher couplet is sharp and, in most cases, clearly distinguishable
from contacts of inter-annual laminae within couplets.
Recovered varves range in thickness from 3.9 mm to 394.9 mm. Average varve
thickness decreases away from the Lillooet River delta front, from 32.6 mm in the most
proximal core to 13.8 mm in the most distal core (Table 2.1).
Almost 70% of the varves in my cores are simple varves (S or SB). There are
more S-type varves than SB-type varves in the distal part of Lillooet Lake. As might be
expected from the bathymetry of the lake and the reduction in suspended sediment with
distance from the delta front, the proximal cores have the largest variability in varve

24
types. All six varve types are recorded in core 5 (Figure 2.3), but complex (or micro-
laminated) varves are only found in this core between the mid-1920s and the late-1950s.
Table 2.1. Minimum, maximum, and average thickness (in mm) of varves in Lillooet Lake cores.
Note: Cores are listed, left to right, from north to south, i.e. most proximal to most distal in relation to the Lillooet River delta.
Figure 2.3 Varve types in core 5.
Deposits of known twentieth-century floods (Appendix D) are easily recognized
and can be tracked throughout the lake. Varves relating to these floods are thick,
commonly have distinctive colour and texture, and commonly contain organic matter.
Sub-annual laminae, which are mostly darker grey-brown, fine to coarse silt or very fine
sand, within a varve indicate the onset of these twentieth-century flood events; which
grade upward into an over-thickened clay cap. For example, the 1940 varve has a
characteristic sub-annual lamina and an over-thickened clay cap, which can be easily
tracked throughout the lake (Figure 2.4). Similarly, the 1931 varve deposited in response
to a landslide off Mount Meager and a minor autumn flood, is easily identified by two
Core C 7 D 5 4 1 2 A B 3 6 E
Min 8.5 10.7 8.7 9.4 10.1 5.2 5.3 3.9 4.3 5.6 4.3 4.4
Max 109.5 394.9 200 101.2 92.8 32.4 35.4 99.8 191.1 46.5 60.7 33.9
Average 32.6 32.1 30.4 27.7 25.1 14.1 13.8 11.9 13.7 15.4 13.4 13.8

25
darker grey sub-annual layers and the yellowish colour of the clay cap (Figure 2.4). The
deposit of the most recent flood (2003) was recovered in only one of the 12 cores.
Figure 2.4. Examples of thick varves in Lillooet Lake. a. 1931 (landslide at Mount Meager and a minor autumn flood). b. 1940 (autumn flood). c. 1980 (winter flood). From left to right, proximal core (C), mid-lake core (2), and distal core (E). Vertical black bar at lower left of each photograph is 1 cm. Colours have been enhanced for contrast.

26
Flood deposit thicknesses identified in this study are spatially similar to those
described by Gilbert et al. (2006) for the 2003 flood. In the most proximal cores, the flood
layers are difficult to distinguish from deposits emplaced by local slumps and turbidity
currents. The varves of all twentieth-century floods in the mid-lake cores (cores 1, 2, and
A) and core 3, which is farther south near the Lizzy Creek fan contain subannual
laminae. Sediment deposition at the latter site may be influenced by the discharge of
Lizzy Creek, for which there are no discharge data. Only the deposits of the largest
twentieth-century floods are recorded in the two most distal cores (6 and E).
2.5.2. Varve chronology
The number of cores that contributed to the chronology (Figure 2.5) between AD
1883 and 1940 is 11. Other intervals contain missing or disturbed varves, and comprise
fewer contributing cores. Only two cores (A and B) form the chronology prior to 1615,
and prior to AD 1432, the chronology is represented by a single core (core A). The
period AD 1179-1432 in core A contains an unknown number of missing varves between
the fourth and fifth core sections at 845 cm depth. The fourth section dates back to AD
1376. The cut between the core sections is clean and no sediment was lost in the field
during retrieval, therefore it is unlikely that many varves are missing. The maximum
number of missing years at the boundary between the fourth and fifth sections was
estimated by averaging the missing years in younger clean breaks in the same core.
Varve ages below the break in core A may be in error by up to five years.
I made an estimate of varve counting error in core A from the two AMS
radiocarbon ages at 930 cm and 1017.5 cm depth (Tables 2.2 and 2.3). Considering the
uncertainty in the upper radiocarbon age, the total estimated counting error for the
uppermost 930 cm of the core is 0.15-1.25% (1σ range) or 0.55-2.42% (2σ range). The
total error to 1017.5 cm depth is 1.34-2.68% (1σ range) or 2.18-3.36% (2σ range). The
2σ age range of the calibrated radiocarbon age for the sample at 930 cm depth is AD
1251-1289, corresponding to the varve age of AD 1295. The radiocarbon sample at
1017.5 cm depth has a 2σ calibrated age range of AD 1152-1218, which is consistent
with the varve age of AD 1192. The radiocarbon ages from core A confirm that, within
reported age ranges, counting errors have not accumulated downcore.

27
Figure 2.5. a. Varve chronology for Lillooet Lake, AD 1170-2004. b. Varve thickness and maximum daily discharge, 1914-2004. Noted years are mentioned in the text.
I made a second estimate of varve counting error by tracking missing and extra
varves in each core (Table 2.4). I found more missing varves than false varves. Based
on correlations across the 12 cores, varve error (the sum of missing and extra varves)

28
ranges from 0% to 1.61%. This error is slightly lower than the error estimate based on
the radiocarbon ages.
Table 2.2. Radiocarbon ages of two samples recovered in core A.
1 Reported CALIB ages are at 1 sigma.
Table 2.3. Varve error based on radiocarbon ages.
1 Calendar ages were calculated using CALIB 6.0.
Table 2.4. Varve error based on varve counts and cross-correlation.
Core C 7 D 5 4 1 2 A B 3 6 E
Total number of varves 248 158 331 165 52 239 379 753 493 109 231 322
Missing varves 4 - 4 1 - 2 2 1 - - 2 -
False varves - - - - - - 2 2 - - - -
Varve error (%) 1.61 - 1.21 0.61 - 0.84 1.06 0.40 - - 0.87 -
Missing years (section gaps) 12 3 25 3 - - - 651 29 - 2 4
1 Minimum estimate; section gap is not covered by other cores.
2.5.3. Sedimentation rates
Sedimentation rates for cores in the north basin range from 2.98 to 3.55 cm a-1.
Average sedimentation rates are much lower in the south basin, ranging from 1.40 to
1.64 cm a-1. Because sedimentation rates in the north and south basins differ, I
constructed separate age-depth curves for each basin. I determined the average depth
of each marker bed in the proximal and distal cores (Figure 2.6) and plotted those values
against varve year (Figure 2.7). Because varve errors are relatively small (Tables 2.3
and 2.4), I did not include error bars in Figure 2.7. Examination of these age-depth
Sample Material 14C age (BP) CALIB 6.0 age (AD)1 Varve year
06-LILL(A) 930 Twig 740 ± 20 1266-1280 1282
06-LILL(A) 1017.5 Plant tissue 875 ± 20 1160-1208 1192
Sample Varve age
14 C age (BP)
Calendar age (± 1σ range)1
Varve error (%) (± 1σ range)
Calendar age (± 2σ range)
Varve error (%) (± 2σ range)
A-930 1282 740 ± 20 AD1266-1280 0.15-1.25 AD1251-1289 0.55-2.42
A-1017.5 1192 875 ± 20 AD1160-1208 1.34-2.68 AD1152-1218 2.18-3.36

29
curves indicates that sedimentation rates in the north basin are more variable through
time than those in the south basin.
Figure 2.6. Overview of marker beds in Lillooet Lake cores; cores are ordered from north (left) to south (right).

30
Figure 2.7. Sedimentation rates in the proximal and distal basins of Lillooet Lake. Lettered data points are marker beds in the varve chronology.
2.5.4. Particle-size characteristics
Table 2.5 summarizes particle-size statistics (D10, D50, D90) for samples from cores
5 and A. The median (D50) particle size in both cores is medium silt, but sediment in the
proximal basin is coarser than that in the distal basin.
Table 2.5. Particle-size statistics for proximal core 5 and distal core A.
Particle size (μm) Core 5 Core A
D10 D50 D90 D10 D50 D90
Minimum 1.4 4.4 14.1 1.6 4.8 12.4
Maximum 7.2 31.7 195.9 6.7 43.3 104.1
Average 2.9 11.0 39.3 2.4 8.0 24.8

31
The median particle size of sediment in core 5 in the proximal basin is 11.0 μm,
whereas that in core A in the distal basin is 8.0 μm. The proximal core is more variable in
texture than the distal core (Figure 2.8), likely due to the greater range in energy near
the Lillooet delta front. The proximal core shows several particle-size peaks that are
labelled in Figure 2.8 with their respective varve years. All of the samples corresponding
to these peaks, except for that dating to 1900, are from fining-upward laminae, and 10 of
these 13 laminae can also be found in other cores. Except for the sample from 1936, all
twentieth-century particle-size peaks are associated with years during which the
maximum discharge was in the fall. The sample dating to 1900 is possibly related to a
slump or local landslide in the lake –the bed is deformed, shows no obvious grading, and
the event is not recorded in other cores. Core A shows one distinctive particle-size
anomaly, corresponding to varve year 1611 (Figure 2.8). The sample is from a massive,
bed that is also recorded in distal core B. Cores A and B are approximately 1.5 km apart,
but are both located near an unnamed sediment fan that has been built out into the lake.
Several smaller particle-size peaks date to AD 1300, 1493, 1511, 1645, 1655, 1661,
1731, 1776, 1917, 1980, and 1984 (Figure 2.8), and all come from varves with darker
grey to brown sub-laminae overlain by an over-thickened clay cap.
I also analysed samples of varves associated with the four largest floods on
record, excluding the 2003 flood. Table 2.6 presents the median particle-size (D50)
results of samples of these varves from all cores. The data show the same general fining
of sediment from north to south, away from the Lillooet River delta. Core A, however, is
an exception in that it has an average median particle size similar to that of the most
proximal core (C). Core A was collected close to the sediment fan of an unnamed creek,
which may have contributed coarser sediment to the core site.
2.5.5. Varve thickness and twentieth-century Lillooet River discharge
The lower panel in Figure 2.5 displays the relation between the varve thickness
and maximum daily discharge of Lillooet River over the period AD 1914-2004. Discharge
correlates well with varve thickness between about 1946 and 2004, but the relation is
poorer for the earlier part of the record. Average varve thickness for the period AD 1946-
2004 is also lower (19.31 mm) than for 1914-1945 (27.56 mm).

32
Figure 2.8. Particle-size distribution in (a) core 5 (proximal basin) and (b) core A (distal basin). Noted years are mentioned in the text.
Table 2.6. D50 particle-size (in μm) for the four largest historic floods in all cores (listed from north to south).
Notes: Samples were collected from the event bed. Data are not available for all floods in some cores because the varves were not recovered or identified, sediment was lost during coring, or the recovered sediments were too disturbed to positively identify the flood varve.
Tables 2.7-2.9 show the results of correlations between standardized varve
thickness and the five different sets of discharge calculations mentioned earlier. I initially
Core C 7 D 5 4 1 2 A B 3 6 E
1940 19.2 16.7 18.9 15.0 - 8.7 5.5 - 8.5 15.6 - -
1980 43.5 - 25.6 18.4 - 6.7 - 19.1 - 7.1 8.7 -
1984 30.1 24.5 26.1 22.0 - 8.3 - 41.8 - 6.5 6.5 -
1991 - 24.1 - 19.0 - 7.2 - - - 6.7 - -
Average 30.9 21.8 23.6 18.6 - 7.7 5.5 30.5 8.5 9.0 7.6 -

33
calculated correlations for 1914-2004, which is the entire period for which discharge data
are available, but then split the record in two sub-periods, 1914-1945 and 1946-2004,
because of the differences notes above.
Correlations between varve thickness and the five sets of discharge parameters
are generally low for the period 1914-2004 (Table 2.7). Correlations between varve
thickness and annual maximum mean daily discharge are highest (r2 = 0.59) for core 4
for this period, but I could only confidently identify and measure varves in this core for
the most recent part of the historic period (1953-2004). The r2 values for the other cores
range from 0.14 to 0.38. Cores in the proximal basin (D, 4, and 5), as well as core 3 in
the distal basin, have the highest correlations. The best results for seven out of twelve
cores and the composite core were obtained when varve thickness was regressed
against the sum of the fall peak and/or nival melt, and/or glacial melt (i.e. the fifth set of
calculations; FNG, FN, or FG; Table 2.7). For core 7, maximum fall discharge combined
with the two highest glacier melt days (FG2; Table 2.7) yielded the best correlation (r2
=0.14). Low correlations (r2 = 0.08) between discharge and varve thickness exist for core
B, whereas core C revealed no correlations with any of the discharge parameters.
Maximum daily discharge (Max_D) and maximum fall discharge (Max_F) are
more poorly correlated with varve thickness for the period 1914-1945 than for 1946-2004
(Tables 2.8 and 2.9). The correlations for the period before 1946 are also lower than
those for the full period, 1914-2004, except in the case of core D. Again, for many cores
the correlations improve significantly when discharge is taken as some function of nival
melt, glacial melt, and fall discharge (FNG, FN, or FG ; r2 = 0.23-0.48; Table 2.8).
For the period 1946-2004, maximum daily discharge and maximum annual
discharge yield the best correlations with varve thickness for most cores (Table 2.9).
Correlations are higher (r2 = 0.18-0.59) for this period than for the earlier historic period
and for the entire discharge record. Slightly better results for the period 1946-2004 are
reported for three cores when varve thickness is regressed against maximum (cores 6
and D) or two-day (core 7) fall discharge (F1 and F2, respectively; Table 2.9). Varve
thickness of the composite core is most highly correlated to maximum fall discharge for
the period 1946-2004 (r2 = 0.55); the correlation for fall discharge is poorer (r2 = 0.37) for
the other two time periods (1914-1945 and 1914-2004). The correlation in all of these

34
periods improves for a discharge variable that is the sum of the highest glacier melt and
the highest fall peak discharge.
I examined the residuals for the period AD 1914-2004 for the composite core with
the highest correlation between varve thickness and discharge (r2 = 0.37; a discharge
variable comprising maximum fall peak discharge and maximum glacial melt peak
discharge) to analyse which years have varve thicknesses that cannot be explained by
discharge. A scatter plot and regression line show that the relation between discharge
and thick varves of 1931 and 1936 is poor (Figure 2.9, panel a). The 1931 varve has two
clear subannual laminae, possibly related to a landslide and a flood in the basin, and a
distinct yellow clay cap. The 1936 varve has possibly some faint subannual laminae,
followed by one obvious subannual lamina at the base of the clay cap. Also, the 1974
varve is exceptionally thin for the discharge recorded that year and thus plots as an
outlier in the graphs. This varve, like the varves of 1972 and 1973, is characterised by a
very thin clay cap. The weak relation is also evident in the residual plot (Figure 2.9,
panel c), which shows that the residuals are not constant when plotted against fitted
values, and are somewhat scattered. I also plotted the residuals through time (Figure
2.9, panel d) to assess any temporal trends. Outliers in this plot date to 1915, 1931,
1936, 1941, 1948, 1953, 1973, and 1974. Most residuals are positive until 1951 (i.e.
observed varve thicknesses are greater than predicted thicknesses); since then, most
years have negative residuals (i.e. observed varve thicknesses are smaller than
predicted thicknesses; Figure 2.9, panel d).
2.5.6. Long-term varve chronology
The upper graph in Figure 2.5 shows the varve chronology for the entire period of
the record (AD 1179-2004). Table 2.10 summarizes the number of varve years in each
century that have transformed varve thicknesses more than two standard deviations
larger or than the mean, as well as the number of varves that are above the 9th decile.
The periods AD 1600-1699 and AD 1900-2004 have the largest number of varves that
are thicker than the specified values. The earliest centuries of the record have the lowest
numbers of unusually thick varves, although the composite core prior to AD 1615
comprises only one or two distal cores and some larger events may not be registered
well in the distal varve record during that period. It is also evident from Figure 2.5 that

35
average transformed varve thickness is lower prior to about AD 1600 than after that
date. I applied a linear filter (31-year moving average) to the varve chronology (red curve
in Figure 2.5) to illustrate long-term trends in the varve thickness signal. Periods with
thicker-than-average varves date to approximately AD 1425-1455, 1480-1512, 1566-
1626, 1677-1827, and 1858-1944. Periods of lower-than-average varve thickness are
before AD 1422, 1513-1566, and 1944-1967.
Table 2.7. Correlation between varve thickness (log-transformed and z-score) and discharge for each core for the period 1914-2004.
Core n Max_D Max_FW A1 A2 F1 F2 FNG FN FN2 FG FG2
C 28 - - - - - - - - - - -
7 71 0.08 0.13 0.08 0.10 0.12 0.14 0.07 - - 0.13 0.14
D 67 0.21 0.30 0.20 0.18 0.31 0.31 0.25 0.22 0.14 0.34 0.27
5 75 0.27 0.28 0.25 0.24 0.26 0.25 0.26 0.21 0.15 0.35 0.27
4 48 0.59 0.55 0.59 0.58 0.55 0.53 0.50 0.30 0.28 0.49 0.46
1 86 0.11 0.12 0.12 0.11 0.14 0.14 0.18 0.13 0.11 0.18 0.16
2 83 0.20 0.22 0.19 0.20 0.18 0.18 0.20 0.14 0.12 0.28 0.26
A 75 0.16 0.22 0.16 0.15 0.22 0.21 0.24 0.14 0.11 0.29 0.28
B 54 - - - - 0.08 - 0.08 - - - -
3 81 0.38 0.35 0.37 0.35 0.34 0.31 0.32 0.20 0.16 0.38 0.35
6 73 0.07 0.12 0.06 0.06 0.10 0.10 0.12 0.08 0.06 0.18 0.20
E 35 - - - - 0.17 0.18 0.20 0.14 - - -
Comp 91 0.27 0.32 0.26 0.27 0.31 0.32 0.31 0.20 0.16 0.37 0.36
ET3 59 0.35 0.31 0.31 0.30 0.29 0.29 0.27 0.23 0.18 0.27 0.21
ET5 57 0.22 0.34 0.21 0.18 0.34 0.35 0.21 0.10 - 0.35 0.31
Notes: Highest correlation for each core is in bold. Reported r2 values are significant at p < 0.05. n - Number of varves counted; Max_D - Maximum daily discharge (m3 s-1); Max_F - Maximum fall/winter discharge (Aug. 1 – Dec. 31), corrected for missing data; A1, A2, A3 - Annual threshold with 1, 2, or 3 days included; F1, F2, F3 - Fall threshold with 1, 2, or 3 days included; FNG- sum of maximum fall, nival, and glacial peak; FN or F-G - sum of fall and nival or fall and glacial peaks (number denotes number of peaks included).

36
Table 2.8. Correlation between varve thickness (log-transformed and z-score) and discharge for each core for the period 1914-1945.
Core n Max_D Max_FW A1 A2 A3 F1 F2 F3 FNG FN FN2 FG FG2 FG3
C 25 - - 0.20 0.19 - 0.26 0.26 0.23 0.31 0.26 0.23 - - -
7 22 - - - - - - - - - - - - - -
D 25 0.28 0.45 0.27 0.25 0.23 0.42 0.42 0.38 0.29 0.27 - 0.41 0.36 0.28
5 30 - 0.18 - - - - - - 0.18 0.28 0.16 0.28 - -
4 0 - - - - - - - - - - - - - -
1 32 0.32 0.30 0.35 0.37 0.38 0.40 0.41 0.38 0.48 0.41 0.40 0.32 0.28 0.22
2 32 - - - 0.17 0.20 - - - 0.20 0.18 0.24 0.20 0.24 0.25
A 32 - - - - 0.18 0.18 0.19 0.20 0.30 0.28 0.30 0.21 0.21 0.18
B 32 - - - - - - - - 0.23 0.16 0.14 - - -
3 32 0.18 - 0.18 0.16 0.15 - - - 0.20 0.15 - 0.18 0.17 0.14
6 32 - - - - - - - - - - - - - -
E 32 - - - - - 0.22 0.22 0.21 0.29 0.21 0.23 0.14 0.15 0.14
Comp 32 0.22 0.18 0.24 0.23 0.23 0.26 0.25 0.22 0.40 0.34 0.28 0.35 0.29 0.23
ET3 21 0.34 0.35 0.24 0.25 0.24 0.27 0.29 0.27 0.36 0.30 0.27 0.34 0.34 0.31
ET5 21 - - - - - - - - - 0.25 - - - -
Notes: Highest correlation for each core is in bold. Reported r2 values are significant at p < 0.05. n - Number of varves counted; Max_D - Maximum daily discharge (m3 s-1); Max_F - Maximum fall/winter discharge (Aug. 1 – Dec. 31), corrected for missing data; A1, A2, A3 - Annual threshold with 1, 2, or 3 days included; F1, F2, F3 - Fall threshold with 1, 2, or 3 days included; FNG- sum of maximum fall, nival, and glacial peak; FN or F-G - sum of fall and nival or fall and glacial peaks (number denotes number of peaks included).
Table 2.9. Correlation between varve thickness (log-transformed and z-score) and discharge for each core for the period 1946-2004.
Core n Max_D Max_FW A1 A2 A3 F1 F2 F3 FNG FN FN2 FG FG2
C 3 - - - - - - - - - - - - -
7 49 0.23 0.26 0.23 0.25 0.23 0.27 0.29 0.28 0.14 - - 0.18 0.18
D 42 0.26 0.32 0.26 0.22 0.18 0.34 0.31 0.26 0.27 0.24 0.18 0.31 0.24
5 45 0.58 0.52 0.58 0.53 0.48 0.50 0.48 0.44 0.48 0.32 0.29 0.48 0.40
4 48 0.59 0.55 0.59 0.58 0.53 0.55 0.53 0.50 0.50 0.30 0.28 0.49 0.46
1 54 0.18 0.16 0.18 0.16 0.14 0.17 0.12 0.10 0.18 0.12 0.12 0.18 0.13
2 51 0.42 0.40 0.42 0.40 0.35 0.40 0.36 0.30 0.34 0.24 0.20 0.38 0.29
A 43 0.30 0.34 0.30 0.27 0.24 0.34 0.29 0.25 0.31 0.17 0.12 0.36 0.34
B 22 - - - - - - - - - - - - -
3 49 0.59 0.56 0.59 0.55 0.50 0.56 0.52 0.48 0.48 0.28 0.24 0.50 0.45

37
Core n Max_D Max_FW A1 A2 A3 F1 F2 F3 FNG FN FN2 FG FG2
6 41 0.20 0.31 0.20 0.17 0.14 0.32 0.27 0.25 0.27 0.20 0.16 0.31 0.30
E 3 - - - - - - - - - - - - -
Comp 59 0.53 0.55 0.53 0.50 0.46 0.55 0.50 0.46 0.46 0.31 0.28 0.49 0.45
ET3 38 0.37 0.31 0.37 0.35 0.28 0.31 0.31 0.27 0.24 0.21 0.16 0.26 0.18
ET5 36 0.38 0.52 0.38 0.34 0.29 0.52 0.50 0.46 0.32 - - 0.48 0.46
Notes: Highest correlation for each core is in bold. Reported r2 values are significant at p < 0.05. n - Number of varves counted; Max_D - Maximum daily discharge (m3 s-1); Max_F - Maximum fall/winter discharge (Aug. 1 – Dec. 31), corrected for missing data; A1, A2, A3 - Annual threshold with 1, 2, or 3 days included; F1, F2, F3 - Fall threshold with 1, 2, or 3 days included; FNG- sum of maximum fall, nival, and glacial peak; FN or F-G - sum of fall and nival or fall and glacial peaks (number denotes number of peaks included).
Figure 2.9. Residual plot for the composite core, 1914-2004. a. Scatter plot and best-fit regression line between transformed varve thickness and discharge. b. Frequency distribution of residuals. c. Residuals vs. fitted values. d. Residual plot through time.

38
Table 2.10. Number of varve years with a transformed varve thickness larger
than two times the standard deviation (2 ) and larger than the 9th decile (corresponding to peaks in Figure 2.7).
Century Transformed varve thickness
> 2 SD > 9th decile
2000-2004 1 1
1900-1999 6 16
1800-1899 2 14
1700-1799 4 14
1600-1699 5 16
1500-1599 3 5
1400-1499 2 12
1300-1399 - 2
1200-1299 2 2
1170-1199 - 2
2.6. Discussion
In this study, I analysed the relation between varve thickness and discharge for
the period 1914-2004 to determine whether varve thickness can be used as a proxy for
discharge for the longer period of the sediment record. The results indicate that,
although varve thickness is moderately correlated with indices of inflow to Lillooet Lake
for the period 1946-2004, a substantial fraction of variance remains unexplained.
Table 2.11 provides a summary of the different Earth processes and systems
that contribute to the formation of varves. These processes and systems interact with
one another on different time scales. The linkages between these systems and
processes and varve formation have been discussed by Hodder et al. (2007). Jordan &
Slaymaker (1991) provide a conceptual model for Holocene sediment transport in the
Lillooet River watershed that illustrates the complex relations between sediment sources
and sinks. It is evident from Table 2.11 that annual discharge is not the only factor
influencing the thickness and other physical characteristics formation of varves in Lillooet
Lake.

39
Table 2.11. Systems and processes that contribute to the formation of varves in a proglacial environment (adapted from Hodder et al., 2007).
System Annual Decadal Century > Century
Fluvial - Water
- Sediment
Freshet
Glacier melt
Autumn flood
Rare events (e.g. landslides)
Memory (e.g. previous year landslide)
Memory
Lacustrine Density of inflowing water
Lake stratification
Local events (e.g. slumping)
Wind direction
Flocculation
Coriolis effect
Basin geometry
Trap efficiency
Glacier Meltwater amount
Entrainment of sediment
Retreat/advance
Paraglacial slug migration
Retreat/advance
Paraglacial slug
migration
Mass balance
Retreat/advance
Paraglacial slug
formation
Mass balance
Climate Local climate
- temperature
- precipitation
Regional climate
- e.g. SST and SSP
Regional climate
- e.g. SST and SSP
Regional climate
- e.g. SST and SSP
Terrestrial and
biological
Vegetation and slope stability (e.g. forest fires and deforestation)
Engineering
Vegetation and slope stability (e.g. forest fires and deforestation)
Land-use changes (e.g. logging and agriculture)
Engineering (?)
Land-use changes
Geologic and geomorphic
Slope processes (e.g. landslides)
Longer term slope processes (e.g. weathering)
Longer term slope processes
Note: SST = Sea surface temperature, SSP = Sea surface pressure.
2.6.1. Twentieth-century trends
The Lillooet River discharge record for the period 1914-2004 shows that annual
mean maximum daily discharges increased after 1946 (Figure 2.2). Of the ten highest
maximum daily discharges, nine occurred in the period 1946-2004 and seven happened
after 1974. Discharge peaks in the period 1946-2004 show an increasing trend: 790 m3
s-1 in 1980, 1110 m3 s-1 in 1984, 1260 m3 s-1 in 1991, and 1370 m3 s-1 in 2003 (Table
2.12). However, in the nine years since 2003, the highest maximum daily discharges

40
recorded were 674 m3 s-1 in 2010 and 758 m3 s-1 in 2011 (Environment Canada, 2010).
Discharge data used in this study are from the same hydrometric station (08MG005;
Figure 2.1), but there are no data for the earliest part of the twentieth century (Appendix
E). The gauge was manually operated between 1914 and 1947 (Environment Canada,
2010); an automatic recorder has been used since 1947, except between 1956 and
1959 when discharge was measured manually.
It is possible that, because of gaps in the discharge record and the two different
types of recording, floods on Lillooet River have not been properly recorded or have
been missed altogether. Historical reports and data (Decker et al., 1977; Blais-Stevens &
Septer, 2008), however, appear to confirm the floods recorded by the hydrometric
station. I identified only one year, 1921, for which there are no discharge records that
probably had a high maximum daily discharge peak and possibly a flood. A massive,
thick (395 mm) bed of fine silt constitutes the 1921 varve in core 7, which may be the
result of a local slump. Other cores also record a distinct, albeit distinctly thinner sub-
annual event during that year. Heavy precipitation occurred on October 1921 in south-
coastal British Columbia and caused flooding at Britannia Creek on October 28 (Blais-
Stevens & Septer, 2008). It is likely that the same storm affected the Lillooet River
watershed and increased the discharge of the river considerably.
The difference in average varve thickness before and after AD 1946 may stem
from major engineering works (i.e. channelling and dyking) that were undertaken on
Lillooet River beginning in 1946 (Kerr Wood Leidal Associates Ltd., 2002). In addition,
retreat of glaciers in the southern Coast Mountains began to slow at about this time
(Menounos & Clague, 2008). Changes in glacier cover in the watershed probably
affected discharge of Lillooet River, sediment availability, and sediment discharge to
Lillooet Lake.
In summary, correlations between discharge and varve thickness are low to
moderate, leaving a large part of the variance in varve thickness unexplained.
Correlations are higher for the more recent period (1946-2004), likely because these
years are dominated by a single discharge peak. For the earlier part of the record, varve
thickness is best explained by a discharge variable consisting of nival melt, glacial melt,
and fall discharge.

41
Table 2.12. Ten highest maximum annual daily discharges during the period 1914-2004 (Environment Canada, 2010).
Flood number Peak discharge (m3 s-1) Year
1 1370 2003
2 1260 1991
3 1110 1984
4 900 1940
5 823 1981
6 808 1992
7 790 1980
8 790 1968
9 782 1975
10 716 1957
Here I discuss and interpret, in terms of probable causative events, the residuals
in the composite core for the period 1914-2004 (Figure 2.9). Outliers in this plot date to
1915, 1931, 1936, 1941, 1948, 1953, 1973, and 1974. Maximum daily discharge in these
years occurred in May, June, or July, except in 1931 when the maximum daily discharge
was on October 1 (Appendix E).
Two strikingly positive outliers date to 1931 and 1936 (Figure 2.9, panels a and
d). The outlier corresponding to 1931 can be attributed to a large landslide (3 x 10⁶ m3)
near Mount Meager (Friele et al., 2008). The landslide released a large amount of
sediment into Meager Creek and Lillooet River. Even though maximum daily discharge
that year was relatively low (462 m3 s-1), the 1931 varve in Lillooet Lake is thick (23-
105.9 mm). The varve has two grey sub-annual laminae in most cores (Figure 2.4),
which possibly correspond to the initial sediment input after the landslide and to a later
mobilization of sediment during a rainstorm in October of the same year. The 1931 varve
has a distinctive thick, yellow clay cap, unlike the other varves of the historic period. The
landslide was reported to have discoloured the river and transported many newly
uprooted trees (Carter, 1932).
Menounos et al. (2005) found above average varve thicknesses in Cheakamus,
Glacier, Green, Lillooet, and Duffey lakes for the period 1934-1946, which they attributed

42
to increased glacier retreat due to warm and dry summers. They found that micro-
laminated varves were common during this period, and are probably related to the
melting of dirty ice and the exposure of fine-grained sediments in glacier forefields,
despite the fact that summer discharge in these basins did not change significantly in
response to increased glacial retreat. Varve thicknesses are above average for some
years (e.g. 1931, 1936, 1941) in my Lillooet Lake cores, and some micro-laminated
varves are found in proximal core 5 and distal cores 1 and 2, however simple varves are
most common in distal cores during this period.
Other than a response to rapid glacier retreat in the basin, the thick varve in 1936
and other thicker than average varves during the period 1934-1946, could possibly be
the result of remobilization of sediment produced by the 1931 landslide. In August 2010,
a similar, although much larger landslide (48.5 × 10⁶ m3; Roche et al., 2011; Guthrie et
al., 2012) happened near the site of the 1931 landslide. A field study a year after the
event documented large amounts of sediment still being reworked and transported
downstream (Hancock, 2011). Photos taken by Jeff Westlake (former employee of the
Pemberton Valley Dyking District) in the winter of 2011 show that Lillooet Lake was
exceptionally muddy, a consequence of the huge amount of sediment released by the
landslide. Research by others (e.g. James, 1999; Kirchner et al., 2001; Korup, 2004) has
shown that large landslides control the long-term sediment yield in mountainous areas,
with river response times of the order of decades. As in the case of the 1936 varve, the
thick varve of 1941 may be a delayed response to remobilization of sediment during the
flood of 1940. The 1941 varve is thick compared to the annual maximum daily discharge
of that year (564 m3 s-1 on July 19; Figures 2.5 and 2.9d).
Another striking, yet negative, residual dates to 1974. Maximum daily discharge
(504 m3 s-1) was recorded on June 9 and is close to average maximum daily discharge
between 1914-2004 (546 m3 s-1), and summer discharge (June-September) is higher
than average, but the corresponding varve is the thinnest of the hydrometric period
(Figure 2.5 and Figure 2.9, panel d). Climate records (Pemberton BCFS station;
Environment Canada, 2011) show average summer temperatures in 1974, but
September 1974 has highest average maximum daily temperature of the decade 1970-
1980, and only one day of precipitation (total of 12.4 mm). Similarly, the varves of 1972
and 1973 are relatively thin, and like the 1974 varve, these varves all have clay caps of

43
only a couple of millimetres each. The 1971 varve on the other hand, is relatively thick,
maximum daily discharge (530 m3 s-1) is near average, slightly higher than in 1974 (504
m3 s-1). The thin varves of 1972, 1973, and 1974 are possibly the result of lower than
average discharge of Lillooet River during those years and subsequent lower than
average rates of sediment remobilization, and/ or a depletion of sediment in the river
system since 1971. The positive residual dating to 1948 may be the result of increased
sediment availability after the start of engineering works on the river in 1946, as this
varve is relatively thick compared to the discharge of that year.
Complex (or micro-laminated) varves were found only between the mid 1920s
and the late 1950s (Figure 2.3). Changes in glacier cover during this period or
engineering works starting in 1946 may have contributed to larger, more sediment-laden
river inflows at these times. Anomalous sedimentation following river training has also
been reported for Squamish River (Hickin, 1989). Micro-laminated varves are also
common in Green, Duffey, and Cheakamus lakes during the period AD 1934-1946 and
attributed to changes in glacier runoff (Menounos et al., 2005; Menounos & Clague,
2008).
AT-type varves (anomalously thick varves containing one or more sub-annual
laminae) are scattered throughout the cored sediment record, although only one such
varve, dating to 1957, occurs in the period between 1941 and 1974. With one exception,
maximum daily discharge during these years was in June, July, or August. The
exception is 1957, when maximum discharge occurred on September 26 (Appendix E).
Maximum discharges in the periods before 1941 and after 1974 are in October,
November, or December. These periods approximately coincide with warm phases of
the Pacific Decadal Oscillation (PDO) climate system, whereas the period 1947-1976
was a cool phase of the PDO (Mantua & Hare, 2002).
Thick varves related to major floods, such as those deposited in 1940, 1984,
1991, and 2003, may result from entrainment and transport of sediment stored in
channels, along channel margins, the floodplain or elsewhere in the river basin during
extreme flows. James (1999) describes transport of large amounts of sediment during
floods on the Bear River and the American River in northern California after two periods
of hydraulic gold mining in the watersheds. Hancock (2011) documented large

44
adjustments in Lillooet River in the year following the 2010 Mount Meager landslide,
which included bank erosion, channel avulsion, and deposition of large amounts of
sediment. Once the river establishes a new stable channel pattern, large amounts of
sediments will be available within the channels and along its banks for remobilization
during extreme discharge events.
Without documentary information on floods and landslides, it is difficult to
discriminate between thick varves caused by landslides somewhere in the basin and
thick varves produced by floods. For example, the 1931 and 1940 varves are equally
thick. Maximum daily discharge in 1931, however, was low (462 m3 s-1); the greater-than-
average thickness of the 1931 varve is probably due to the landslide near Mount Meager
that occurred that year (Carter, 1932). In contrast, maximum daily discharge in 1940 was
900 m3 s-1 and maximum instantaneous discharge may have been as high as 1640 m3 s-1
(Blais-Stevens & Septer, 2008). The high flows probably entrained and transported large
amounts of sediment without a large landslide in the watershed. This example illustrates
the difficulty in interpreting thick varves in the absence of hydrometric and
meteorological data during the prehistoric period.
2.6.2. Regional varve records and climate proxies for the twentieth century
Varve thickness mirrors annual maximum daily discharge moderately well (r2 =
0.55) for the period 1946-2004, but less so for the period before 1914-1946 (r2 = 0.40)
(Figure 2.5; Table 2.8 and 2.9). Menounos (2006) examined the relation between Lillooet
River discharge and varve thickness in Green Lake, 19 km south of Pemberton, and
found similar results. He attributed the stronger correlation with discharge since 1945 to
less extensive glacier cover during the second half of the twentieth century.
My Pearson’s correlation coefficients correlations are, in general, lower than
those reported by Gilbert (1975) for what he refers to as distal and proximal cores (r2 =
0.6-0.9), but they are similar to or higher than those derived from his mid-lake cores in
the vicinity of and just south of the Ure Creek fan (r2 < 0.4). It should be noted, however,
that all of Gilbert’s cores are from the north basin of the lake, which in my study are
considered proximal sites. Additionally, Gilbert’s (1975) calculations were based on a

45
shorter varve chronology. My values are comparable to those of Desloges & Gilbert
(1994) (r2 = 0.41) for Lillooet Lake varved sediments.
Menounos et al. (2005) report correlations between varve thickness and annual
maximum mean daily discharge of Lillooet River (1930-1999) for several lakes in the
southern Coast Mountains. The highest correlation coefficients come from Lillooet Lake
(r2 = 0.38), followed by Green Lake (r2 = 0.31), Cheakamus Lake (r2 = 0.18), and Glacier
Lake (r2 = 0.12). Differences in watershed location, elevation, glacier cover, and
seasonal timing of floods influence the sediment yield in each of these basins and thus
the relation between varve thickness and maximum discharge (Menounos et al., 2005).
Menounos & Clague (2008) correlated varve thickness in Cheakamus Lake with
streamflow records for Cheakamus River, for the period 1923-1948 and after 1983, and
found that varve thickness is reasonably correlated to the annual maximum daily flood (r2
= 0.56).
As previously discussed, the 1931 and 2010 landslides at Mount Meager were
important sources of sediment to Lillooet Lake. Other large landslides in the Mount
Meager volcanic massif occurred in 1947, 1972, 1975, 1984, 1986, and 1998 (Friele et
al., 2008), but their signals are not obvious in the Lillooet Lake varve record. For
example, a large (estimated 26 × 106 m3) landslide occurred near Pylon Peak in the
volcanic massif in July 1975 (Mokievsky-Zubok, 1977). On November 5, 1975, a rain-on-
snow storm produced the ninth highest discharge recorded on Lillooet River (Table
2.12). Both events contributed to the thick 1975 varve (Figure 2.5).
Glaciers are another important sediment source for the formation of varves in a
proglacial environment (Table 2.11; Hodder et al., 2007; Menounos & Clague, 2008).
Koch et al. (2009) provide an overview of glacier change in nearby Garibaldi Provincial
Park since the Little Ice Age. This period which ended in the late nineteenth century, is
characterized by highly variable, but generally cooler climate, during which glaciers
around the world were more extensive than today (Grove, 1988). At the beginning of the
twentieth century, glaciers in Garibaldi Park terminated near their maximum Little Ice
Age positions. Glaciers retreated slowly during the first two decades of the twentieth
century and then more rapidly between the 1920s and 1960s. From the 1960s to the
early 1980s, most glaciers in the southern Coast Mountains advanced, some by up to

46
300 m. Since the early 1980s, glaciers have retreated and are now up-valley of their
1960s limits. Comparison of this activity to temperature and precipitation data from a
climate station in Agassiz, east of Vancouver, revealed that periods of glacier retreat
were driven by warm climate and lower winter precipitation (Koch et al., 2009). The
frontal response of glaciers in the park lagged about 5-10 years to changes in climate.
Glacier change in Garibaldi Park is also linked to the cold and warm phases of the PDO.
During cold, or negative, PDO phases (1890-1924 and 1947-1976), glaciers in the park
were stable or advancing, whereas during a warm, or positive, PDO phase (1925-1946,
and since 1977), glaciers retreated (Koch et al., 2009).
Average varve thickness in Lillooet Lake is higher before 1946 than after. Osborn
et al. (2007) found that historic varves in nearby Green Lake are thickest between 1920
and 1945. Menounos & Clague (2008) report thick varves for the same period in
Cheakamus Lake, which they attribute to a warmer and drier period during which
glaciers retreated quickly. Green Lake, Cheakamus Lake, and Lillooet Lake are within
30-40 km of each other, thus it is likely that the glaciers in their headwaters responded
similarly to changes in climate. The thicker varves in Lillooet Lake between 1914 and
1945 are thus attributed to accelerated glacier retreat during that period. Menounos et al.
(2005) reported that discharge changes in response to glacier retreat were minor, but
proglacial streams were carrying high concentrations of sediment, as a result of melting
of dirty ice and the availability of large sediment supply from the glacier forefields.
Unlike Cheakamus River and Fitzsimmons Creek, which flows into Green Lake,
Lillooet River has been impacted by engineered works. Meander cut-offs, dyking, and
lowering of Lillooet Lake by 2.5 m have increased the gradient of Lillooet River (Kerr
Wood Leidal Associates Ltd., 2002). These changes led to an initial rapid incision of the
river channel, increased bank erosion, and an increase in the rate of delta advance
compared to the period 1948-1953 (Jordan & Slaymaker, 1991). Jordan & Slaymaker
(1991) attribute the greater sediment delivery to the lake during this period mainly to
engineering, but did not exclude glacier retreat or large landslides as causative factors.
Interestingly, varves in Lillooet Lake do not increase in thickness between 1948 and
1953. However, the 1948-1953 varves in cores 4, 5, 7, and D in the proximal basin and
cores 3 and 6 in the distal basin show multiple sub-annual laminae, some with visible
plant detritus. Some of these varves have vague varve boundaries or lack clear clay

47
caps, engineering works likely carried out during periods of low flow (i.e. early spring or
fall), possibly released additional sediment and organic matter into Lillooet Lake
preventing the formation of distinct varve boundaries or clay caps.
Average varve thickness decreases after 1946. A similar trend has been reported
in Cheakamus Lake by Menounos & Clague (2008) and ascribed to a period of cold, wet
climate. Menounos & Clague (2008) suggest that glaciers during this period were stable
and that less sediment was available from reduced subglacial discharge and melt of
debris-rich ice. However, Cheakamus River is unregulated and has no engineering
works, in contrast to Lillooet River. Studies of the response of rivers to regulation or
training for flood mitigation or generation of hydro-electricity suggest that sediment loads
decrease after completion of the works (Church, 1995; Dominik, 2000; Yang et al.,
2002). Though engineering works have initially increased the channel gradient and
flushed sediments to Lillooet Lake (Jordan & Slaymaker, 1991), less sediment is now
available in a typical year as the dyked and straightened river cannot access sediment
stored on the pre-engineering floodplain.
The Lillooet River watershed has also experienced significant land-use changes
over the past century. Logging and agriculture likely altered sediment supply. In addition,
sediment discharged from the terminus of Lillooet Glacier at the head of the watershed is
now being trapped in Silt Lake (Figure 2.1; Schiefer & Gilbert, 2008). Silt Lake did not
exist prior to 1947. It formed due to retreat of Lillooet Glacier. The formation of the lake
coincides with a decrease in varve thickness in Lillooet Lake. Limited suspended
sediment sampling at the inflow and outflow of Silt Lake by Schiefer & Gilbert (2008)
suggests a lake trap efficiency of about 70%. Annual catchment yield is likely more than
103 Mg km-2 a-1, which Schiefer & Gilbert (2008) estimate to be at least 12% of the
sediment mass delivered to Lillooet Lake on an annual basis.
In conclusion, thinner varves in Lillooet Lake from 1946 to 2004 are a complex
response to a reduction in glacier cover, changes in river planform due to engineering
works, changes in land use, and the recent formation of Silt Lake due to glacier retreat.

48
2.6.3. Comparison to other streamflow proxies
Kaufman et al. (2011) found a relatively low correlation between varve thickness
in Shadow Bay, Alaska, and maximum mean daily discharge of Nuyakuk River for the
period 1953-2007 (r2 = 0.28). However, the correlation between varve thickness and total
annual discharge is much higher (r2 = 0.75). As in the case of Lillooet River, large-scale
sediment transport by Nuyakuk River is not limited to a single annual discharge peak
(i.e. nival snowmelt in spring), but also occurs during autumn storms (Kaufman et al.,
2011).
Sander et al. (2002) found a strong correlation (r2 = 0.76) between varve
thickness in the estuary of the river Ångermanälven in mid-central Sweden and
maximum daily annual discharge of the same river for the period 1909-1971. In contrast
to Lillooet River, however, most of the sediment is transported by the river
Ångermanälven during the one to two month snowmelt season, making maximum daily
annual discharge a good proxy for sediment discharge (Sander et al., 2002).
2.6.4. Anomalous varves in the period AD 1179-2004
Without independent information on prehistoric floods, landslides, and other
processes operating in the Lillooet River watershed, varve thickness cannot reliably be
used to infer and date floods and thus to estimate flood frequency in the future. I am
able, however, to draw some inferences from the prehistoric record and comparisons
with other, regional studies.
Three anomalously thick varves in two distal cores (A and B) date to AD 1493 ±
24, 1511 ± 24, and 1611 ± 26 (Figures 2.5 and 2.10). The AD 1493 varve in core B
consists of massive silt > 100 mm thick, capped by a thick clay layer. The corresponding
AD 1493 varve in core A, although not as thick, shows a distinct peak in particle size
(Figure 2.8). The AD 1511 varve in core B is also dominated by a massive silt bed (ca.
20 mm thick) capped by a thick clay layer. The AD 1511 varve in core A is only slightly
coarser than other sediments in the core. The lower ca. 50 mm of the AD 1611 varve in
core A consists of massive silt, 57 mm thick, which is capped by an over-thickened clay
layer. In core B the silt layer is only about 10 mm thick. The particle size sample of this
varve is coarser than other samples from core A (Figure 2.8). In view of the thickness of

49
the silt beds, the particle size of the AD 1493 and 1611 varves in core A, and the
locations of the cores in the distal basin, it is unlikely that these varves are the result of
extreme discharge events. I attribute them to local events in Lillooet Lake, such as
slumping of lake floor sediments or landslides from adjacent steep mountain slopes. The
floods of 1940, 1980, 1984, and 1991 are recorded in cores A and B in the distal basin
as distinct, darker grey to brown, sub-annual laminae several millimetres thick. These
differ from the thick silt beds of the AD 1493, 1511, and 1611 varves.
Other varves with thicknesses more than 2 standard deviations above the mean
date to AD 1295 ± 21, 1300 ± 21, 1455 ± 23, 1560 ± 25, 1586 ± 26, 1619 ± 26, 1635 ±
26, 1661 ± 27, 1681 ± 27, 1700 ± 27, 1713 ± 28, 1776 ± 29, and 1825 ± 29 (Figure 2.5).
With the exception of the AD 1295, 1300, 1455, 1560, and 1619 varves, all of them can
be confidently traced throughout the proximal and distal basins, suggesting that they
record basin-wide events, possibly floods. The AD 1295, 1300, and 1560 varves were
only recovered in distal core A (Figure 2.11). The AD 1300 varve includes a sub-annual
lamina and an over-thickened clay cap similar to sediments in the AD 1940, 1957, and
1984 flood varves in core A. The thickness and mean particle size (Figure 2.8) of the AD
1300 varve, however, are greater than those of the 1940, 1957, and 1984 varves in core
A. The causative event for the AD 1300 varve thus remains uncertain. The AD 1295
varve consists of a ca. 2-cm-thick silt base, a thin organic layer from which one of the
radiocarbon ages came, and a slightly over-thickened clay cap (Figure 2.11). Given the
presence of organic matter in sediments at this distal location in the lake, I attribute this
varve to a local event such as a subaqueous slump or a landslide off the mountain slope
near the location of core A. The AD 1560 varve has no distinct sub-annual laminae.
Similarly, the AD 1455 and 1619 varves, although thicker than average and recorded in
more than one core, have no marked sub-annual laminae.
2.6.5. Implications for flood frequency
Seven varves between AD 1825 and 2004 – 1906, 1931, 1936, 1940, 1984,
1991, and 2003 – have thicknesses greater than two standard deviations above the
mean (Figure 2.5). Five of these varves correspond to floods on Lillooet River – 1906
(Menounos et al., 2005), 1940, 1984, 1991, and 2003.

50
Figure 2.10. Anomalously thick prehistoric varves. a. core A. b. core B. From left to right, varve years AD 1493, 1511, and 1611. Vertical black bar at bottom left of each varve is 1 cm. Dotted lines denote varve boundaries. Colours have been enhanced for contrast.

51
Figure 2.11. The AD 1295 and 1300 varves in core A. Vertical black bar at lower left of photograph is 1 cm.
The landslide in 1931 accounts for the thick varve of 1931 and probably that of
1936. Varves for these flood years are either the AT or SB type, and all show a sub-
lamina that is traceable across the lake. Assuming that varves representing floods are
thicker than two standard deviations from the mean, and have a sub-lamina that is
traceable through the lake, the average annual frequency of floods during the period AD
1825–2004 is 0.028. However, all five of these floods happened after 1905, giving an
average annual frequency of 0.05. Furthermore, three of them happened since 1984,
suggesting that the frequency of flooding is increasing. The minimum peak discharge
associated with these floods is 900 m3 s-1 (i.e. 1940 flood; Table 2.12).
Eight varves in the period AD 1586-1825 have a varve thickness greater than two
standard deviations from the mean (Figure 2.5) and a traceable sub-annual lamina –

52
1586, 1635, 1661, 1681, 1700, 1713, 1776, and 1825. Based on these criteria, floods
with discharges comparable or larger than in 1940, have an average annual recurrence
of 0.033 during this period. If the varves dating to AD 1825, 1776, and 1586 are the
result of landslides, the average flood frequency drops to 0.021, which is close to the
estimate for the period AD 1825-2004, but much lower than the twentieth-century
frequency. Interestingly, no varves dating to the period AD 1825-1906 meet the criteria
for flooding in the Lillooet River watershed. The increase in floods in the twentieth
century is consistent with the forecast by the Intergovernmental Panel on Climate
Change (2007, 2013) that winter flooding in North America is increasing due to climate
change.
2.6.6. Prehistoric climate proxies
Varves in Lillooet Lake during the prehistoric period may also contain information
on advances of glaciers in the Lillooet River watershed. A consistent picture of late
Holocene glacier activity (Figure 2.12) has emerged from studies in the southern Coast
Mountains (Larocque & Smith, 2003; Reyes & Clague, 2004; Allen & Smith, 2007; Koch
et al., 2007; Clague et al., 2009). In Garibaldi Provincial Park, the Little Ice Age began
sometime around AD 1030-1170 (Koch et al., 2007). An early Little Ice Age advance in
the twelfth century was followed by glacier recession in the thirteenth century. Glaciers in
Garibaldi Park advanced several times in the fourteenth and fifteenth centuries and
achieved their maximum Holocene extent between AD 1690 and 1720 (Koch et al.,
2007). A similar glacial history has been proposed at Bridge Glacier, approximately 85
km northwest of Pemberton (Allen & Smith, 2007): an early Little Ice Age advance about
700 years ago, followed by moraine stabilization during the late thirteenth to early
fourteenth century, and several intervals of advance and retreat from the fifteenth
century through the twentieth century. In the Mount Waddington area, farther north,
glaciers advanced between AD 1203 and 1226 (Larocque & Smith, 2003), retreated in
the fourteenth century, and advanced again. Since the fourteenth century, moraines date
to AD 1443-1458, 1506-1524, 1562-1575, 1597-1621, 1657-1660, 1767-1784, 1821-
1837, 1871-1900, 1915-1928, and 1942-1946 (Larocque & Smith, 2003). Reyes &
Clague (2004) found stratigraphic evidence for Little Ice Age advances of Lillooet
Glacier, but were unable to precisely date them. They argued however, that the first
advance of the glacier in the Little Ice Age was well underway by 450 14C years BP (AD
53
1330-1630). Reyes & Clague (2004) showed that the earlier Neoglacial record of activity
of Lillooet Glacier is similar to that of other glaciers in the Coast Mountains.
Research at Green Lake (Menounos, 2006; Osborn et al., 2007) and Cheakamus
Lake (Menounos & Clague, 2008) indicate that thick varves were deposited from the late
sixteenth century to about AD 1925. My results are in agreement with these conclusions,
showing thicker-than-average varves dating to AD 1425-1455, 1480-1512, 1566-1626,
1677-1827, and 1858-1944. These periods coincide with episodes of glacier advance in
the Mount Waddington area (Larocque & Smith, 2003), Bridge River (Allen & Smith,
2007) and Garibaldi Provincial Park (Koch et al., 2007). As at Green and Cheakamus
lakes, sedimentation rates were higher in Lillooet Lake in the period 1920-1945 than at
any other time in the varve record, but in contrast mark a period of rapid glacier retreat.
The period prior to approximately AD 1425 is characterized by varves that are
thinner than average. However, the period prior to AD 1432 in Lillooet Lake is
represented by only a single distal core, and varve thickness trends at that time should
be considered with caution. Nevertheless, Menounos & Clague (2008) suggest that thin
varves were deposited at times when glaciers were relatively stable.
The second half of the twentieth century is also characterized by varves that are
thinner than average. However, average varve thickness for the period 1977-2004 is
higher than for 1946-1976 (22.0 ± 9.8 and 16.1 ± 6.1 mm respectively). This increase in
varve thickness corresponds to rapid glacier recession in the last two decades of the
twentieth century in Garibaldi Park (Koch et al., 2009), which coincides with a positive
(or warm) phase of the PDO. Glaciers in Garibaldi Park were more stable and even
advanced in the period 1946-1976 (Koch et al., 2009), coincident with the negative (or
cool) phase of the PDO.
2.6.7. Implications for pre-historic flood reconstruction
My results indicate that after 1945, discharge of Lillooet River was less
influenced by glacier runoff and that varve thickness correlates better with autumn
floods. An implication of this is that the Lillooet Lake varve chronology (i.e. sediment load
of Lillooet River) is influenced or ‘tainted’ by glacier fluctuations in the past. To obtain a
reliable proxy flood record, one would have to find a way to objectively correct the varve

54
record for the glacier influence on sediment load or use another proxy other than varve
thickness.
Figure 2.12. Varve thickness in the Lillooet Lake and glacier fluctuations in western Canada (modified from Clague et al., 2009) and Garibaldi Provincial Park (modified from Koch et al., 2007).
It might be possible, for example, to apply absolute age dating techniques to
exposures of sequential flood deposits to derive a flood chronology that pre-dates the
historic period. However, these techniques would only be applicable to floods larger than
the 2003 flood, as deposits from smaller floods would generally be eroded by
subsequent larger floods. Dendrochronologic evidence, such as scars and abnormal ring

55
growth (St. George & Nielsen, 2002; Yanosky & Jarrett, 2002) and other paleostage
indicators (Jarrett & England, 2002) could be used to accurately date floods. By
combining two or more proxy records, for example varves and tree rings, with
stratigraphic evidence from the Lillooet River floodplain, one could better estimate years
or periods with floods and thus determine more accurately long-term flood frequency.
2.7. Conclusions and recommendations
In this study, I explored the use of varve thickness as a proxy for discharge of
Lillooet River. I found that correlations between varve thickness and several measures of
peak discharge are low to moderate. The best correlation is between maximum fall
discharge and varve thickness during the period 1946-2004. Varve thickness for the
earlier period of hydrometric data (1914-1946), a period of rapid glacier retreat and
warmer temperatures in British Columbia, is best explained with a discharge proxy
combining nival melt, glacier melt, and maximum fall discharge. Fall and early winter
floods on Lillooet River occur mostly in two periods, 1914-1941 and 1975-2004, both of
which are warm phases of the PDO. More anomalously thick varves are associated with
the latter period than the former and can be related to autumn or early winter rainstorms.
Between 1947 and 1976, during a cold phase of the PDO, annual maximum daily
discharge on Lillooet River occurred in June, July, or August; this period has only one
anomalously thick varve.
Thick varves in the non-instrumented period of the varve chronology (AD 1179-
1914) may have several explanations. Four thick varves, dating to AD 1295 ± 21, 1493 ±
24, 1511 ± 24, and 1611 ± 26 may have been caused by local landslides in the lake.
Eight other prehistoric, anomalously thick varves show sub-annual laminae that are
traceable through the lake and possibly represent floods. Some of these thick varves,
however, may be associated with large landslides at Mount Meager (Friele et al., 2008).
Given the uncertainties in the ages of these landslides, varve count errors, and the
absence of hydrometric records for these events, I cannot positively attribute a thick
varve to a specific landslide. However, based on the effects of the 1931, 1975, and 2010
landslides at Mount Meager, it is likely that large prehistoric landslides are recorded in
the varve record and can affect varve thicknesses for several years to perhaps a

56
decade. Following the landslides of 1931 and 1975, varves are thicker in the years after
each event. One year after the 2010 landslide Lillooet River was still reported to be
reworking and carrying large amounts of sediment to the lake. Similarly, a large flood in
the watershed can affect sedimentation and varve thickness for years after the event, as
for example happened after the flood of 1940.
The varve chronology for Lillooet Lake and the environmental inferences that can
be drawn from it are consistent with those of other regional studies in British Columbia
(e.g. Menounos, 2006, Osborn et al., 2007, Menounos & Clague, 2008). Thicker varves
deposited from approximately AD 1550 until the early twentieth century are attributable
to an increase in glacier cover in the region and a greater abundance of sediment in
glacierized watersheds during that time. Rapid glacial retreat from approximately 1920
until 1945 is responsible for thick varves in the early twentieth century.
Although the relation between varve thickness and the twentieth-century flood
discharge record is moderate at best, it may be possible to detect sub-annual high
discharge events in the thick varves in Lillooet Lake. In view of the low to moderate
correlations I have found between varve thickness and discharge, however, I believe
that any proxy flood record inferred from this chronology will not be representative of the
real record of river discharge. Notwithstanding this caveat, it is possible to make first-
order estimates of flood frequency based solely on abnormal thickness and
sedimentological characteristics of varves. Estimates of annual flood probability for
Lillooet River are 0.05 for the period AD 1906-2004, 0.028 for AD 1825-2004, and 0.021
for AD 1586-1824. Using the twentieth-century discharge records for Lillooet River and
their signatures in the varve record, the minimum peak discharge of these floods is
about 900 m3 s-1. Stratigraphic information from the Lillooet River floodplain and the use
of tree rings or other paleoflood indicators could provide additional information on the
dates and magnitudes of extreme floods on Lillooet River.
My varve chronology dates back to about AD 1179 in core A in the distal basin.
In order to extend this chronology with sufficiently thick varves to discern sub-annual
inflow patterns, I recommend coring in the northern part of the distal basin, no farther
south than my core 3. However, the entire postglacial sequence of sediments in Lillooet

57
Lake, which is more than 100 m thick, can only be recovered by drilling from a barge
anchored on the lake.

58
3. A 369-year record of suspended sediment yield, Lillooet Lake, Coast Mountains, Canada
3.1. Abstract
Cores of annually laminated sediment recovered from Lillooet Lake and spanning
the period AD 1179-2004, were used to calculate suspended sediment yield for the
watershed and to investigate the origin and persistence of years of anomalously high
yield. Here, I report sediment yields for the period AD 1629-1997, which is the part of the
varve record supported by cores throughout the lake. Average sediment yield during the
369-year period is 213 ± 38 tonnes km-2 a-1; this yield increases to 285 ± 50 tonnes km-2
a-1 during the first half of the twentieth century. The frequency of high-yield events during
the 369-year period is irregular: 11 of the 34 events are in the early part of the twentieth
century, a time when glaciers in the watershed underwent major retreat. I fitted a
Generalized Extreme Value (GEV) model to estimate quantiles of the sediment yield
distribution, and I used epoch analysis to examine persistence of the 34 years with the
largest yields, examining 10 years prior to and 30 years following each of the 34 events.
Persistence is greatest for the most extreme events (i.e. sediment yield with a
recurrence interval greater than once every 100 years; or >Y100), three out of five of
these most extreme events occur in the twentieth century. Persistence is similarly high
for events with recurrence intervals between 10 and 25 years (or Y10-25). Sediment yield
for other events (i.e. those with recurrence intervals between 25 and 50 years, and 50
and 100 years, respectively; or Y25-50 and Y50-100) remain above average for 15 to 17
years. Persistence in all groups, however, is variable and consistent above average
yields are only found up to five years after the event year. This result may indicate that
sediment yield is linked to multi-annual climate cycles that deliver increased amounts of
sediments to the lake. Late twentieth-century events demonstrate that sediment yield is
closely related to the discharge regime of Lillooet River. The results of this study extend
earlier sediment yield estimates and improve understanding of long-term sediment yield

59
processes and linkages to the geomorphology and climate of the Lillooet River
watershed.
3.2. Introduction
Sediment yield is the amount of sediment that leaves a watershed during a
specified period, typically years or days (or mass per unit area per unit time; Onstad,
1984; Schiefer et al., 2010). The total sediment load of a river consists of bedload,
suspended load, and dissolved load. Church et al. (1989) asserted that bed load
constitutes a minor fraction (around 1%) of the total clastic sediment load of many rivers
in the Canadian Cordillera. In such cases, measurements of suspended load would
reflect total clastic sediment yield in the region. However, bedload is a much larger
component, perhaps up to 50%, of the total sediment load of proglacial streams in steep
catchments in western Canada (Schiefer et al., 2010). Similarly, suspended load has
been found to constitute less than 20% of total load in an Alaskan proglacial lake (Loso
et al., 1994).
Sediment yield studies are performed to assess sediment sources, production,
and transport within watersheds. They provide valuable information on the influences of
glacier cover (Desloges, 1994), hydrology and climate (Lamoureux, 2002; Menounos et
al., 2006), land-use changes (O'Hara et al., 1993; Zolitschka, 1998), landslides (Koi et
al., 2008), and other landscape disturbances (Major et al., 2000).
Suspended sediment yield can be estimated from measurements of sediment
discharge made at river gauging stations or by studying sediment fills in reservoirs or
lakes. The former method yields real-time data that are useful for river management and
sediment dredging (Slaymaker, 1972; Walling & Collins, 2008), but the data are
generally limited both in space and time. The latter method provides information on a
longer time scale (hundreds to thousands of years) that can be used to understand the
impacts of changes in climate or land use in a watershed (Walling & Webb, 1996;
Zolitschka, 1998; Lamoureux, 2000).
Lacustrine sediment records are ideal for studying fluctuations in long-term
sediment yield, because lakes trap clastic sediments derived from the upstream

60
watershed (e.g., Zolitschka, 1998). Varved lacustrine records offer an additional
advantage, because these records provide insight into hydroclimatic and depositional
conditions in the basin with annual to sub-annual resolution (Desloges & Gilbert, 1994;
Lamoureux, 2000). Several studies in the Canadian Cordillera have used varved
sediments to estimate sediment yield in proglacial lakes (Desloges, 1994; Menounos et
al., 2006; Schiefer et al., 2010).
Much research documents sedimentation and sediment yield in the Lillooet River
watershed. Gilbert (1972, 1973, 1975) inferred sedimentary and lacustrine processes
responsible for the distribution and character of sediments in Lillooet Lake (Appendix A).
He estimated average total clastic sediment yield in the Lillooet River watershed to be
334 tonnes km-2 a-1. Gilbert (1975) further showed that the lake sediments are annually
laminated (varved) and that varve thickness is related to Lillooet River discharge. Jordan
& Slaymaker (1991) used a sediment budget approach to determine sources, storage,
and yield of sediment in the Lillooet River watershed. They found that sediment input is
highly episodic (Figure 3.1) and that estimated yields from sediment sources they
identified account for only about half of the estimated total yield based on delta advance
and valley aggradation. They attribute the difference to storage of coarser material in the
Lillooet River delta and an underestimation of colluvial and glacial sediment sources.
Schiefer & Gilbert (2008) assessed sedimentation in Silt Lake in the upper
Lillooet River watershed. Since its formation between 1947 and 1962, Silt Lake has
trapped sediment from upper watershed sources that would otherwise have been
transported to Lillooet Lake. Schiefer & Gilbert (2008) postulate that this amount,
together with mass movements in the Mount Meager volcanic complex, could explain the
imbalance that Jordan & Slaymaker (1991) found in their sediment budget. Building on
the earlier work of Gilbert (1973, 1975), Desloges & Gilbert (1994) documented the
distribution of sediment in Lillooet Lake, temporal variations in sediment flux, and
sediment sources; they also inferred causes of extreme sediment delivery events. They
based their estimate of sediment yield on a 125-year varve chronology and showed a
higher frequency of extreme sediment yield events since about AD 1940.
My study builds on and extends previous work. It utilizes an 825-year varve
record to better understand long-term suspended sediment yield in the Lillooet River

61
watershed. I identify years with exceptionally high yields and offer explanations for the
causative events, and as such provide a better understanding of sediment production
and delivery in the watershed. Such information is valuable to flood managers, as the
input of large volumes of sediment can cause rapid aggradation of the river bed, raise
the river bed, and as such aggravate potential flood hazard.
Figure 3.1. Holocene sedimentation in Lillooet River valley (figure not to scale). Red box indicates the period of this study. Adapted from Jordan & Slaymaker (1991).
3.3. Study area
Lillooet Lake is an oligotrophic, dimictic lake in the southern Coast Mountains of
British Columbia (Figure 3.2). The lake is 22 km long, up to 2 km wide, and has a
maximum depth of 137 m (Desloges & Gilbert, 1994). The watershed north of Lillooet
Lake has an area of 3850 km2, 14% of which is glacier ice and persistent snow. Peaks in
the watershed reach as high as 2700 m above sea level (asl), whereas the broad, flat
floor of Lillooet River valley is approximately 200 m asl.
Lillooet River drains a mountainous landscape of mainly Mesozoic granitic and
metamorphic rocks (Read, 1979). The Mount Meager Volcanic Complex, located in the
upper part of the watershed north of Meager Creek, is a late Cenozoic eruptive centre
comprising mainly andesitic and dacitic lavas and pyroclastic rocks, some of which have

62
been hydrothermally altered and are susceptible to landslides (Read, 1990). The most
recent eruption in the volcanic complex occurred about 2400 years ago (Clague et al.,
1995) and left a layer of pumice in nearby areas and ash as far east as Alberta (Nasmith
et al., 1967). Landslides are common on the flanks of the volcanic massif and range
from rare flank collapses with volumes of hundreds of million cubic metres (Friele &
Clague, 2004) to much smaller, annual debris flows during hot weather or rain. The most
recent large landslide happened in 2010 in the headwaters of Capricorn Creek, a
tributary of Meager Creek (Roche et al., 2011; Guthrie et al., 2012). It delivered about
48.5 × 10⁶ m3 of debris to the valleys of Meager Creek and Lillooet River and stemmed
the flow of both streams for a short time. Sediment eroded from the deposit of the 2010
landslide is being transported down-valley by Lillooet River into Lillooet Lake (Hancock,
2011). In their study of mass movements from the Mount Meager massif, Friele &
Clague (2008) report eight large historic landslides (prior to the 2010 event) and 18 large
prehistoric landslides, but they posit that a much larger number of unrecorded landslides
occurred in the Holocene.
Lillooet River is the dominant source of water and sediment to Lillooet Lake. The
river’s source is Lillooet Glacier about 95 km northwest of Lillooet Lake. Silt Lake lies
about 2 km from the terminus of Lillooet Glacier (Schiefer and Gilbert, 2008). The
principle tributaries of Lillooet River are Meager Creek, Ryan River, Birkenhead River,
and Green River (Figure 3.2; Desloges & Gilbert, 1994). Ure, Lizzie, and Joffre creeks
discharge directly into Lillooet Lake, but contribute only a small amount of the total
discharge.
The mountainous part of the Lillooet River watershed receives in excess of 890
mm of water-equivalent precipitation annually, mainly in autumn and winter
(Environment Canada, 2011). The mean annual discharge of Lillooet River is 126 m3 s-1;
in a typical year, the river experiences a nival melt peak of 400-600 m3 s-1 in June and a
similar-size peak related to snow and glacier ice melt in July (Environment Canada,
2010). Floods with peak discharge up to 1370 m3 s-1 (in 2003) occur in the fall during
intense rain or rain-on-snow storms.
Concentrations of suspended sediment of Lillooet River at its mouth vary
throughout the year. In winter, when discharge is lowest, suspended sediment

63
concentrations are as low as 5 mg l-1. In contrast, during the nival and glacier melt
periods in late spring and summer, suspended sediment concentrations are typically
600-800 mg l-1 and may exceed 1200 mg l-1 during floods (Gilbert, 1975).
Most of the sediment deposited in Lillooet Lake is delivered by Lillooet River
(Desloges & Gilbert, 1994). Major sediment sources in the watershed are cirque and
valley glaciers, and landslides at the Mount Meager Volcanic Complex. Smaller amounts
of sediment are produced by logging and agricultural activities, wildfires, and local bank
erosion along tributary channels (Jordan & Slaymaker, 1991).
Figure 3.2. Map of the Lillooet Lake watershed. Inset left: bathymetry of Lillooet Lake and core locations.

64
3.4. Methods
I collected three percussion cores and nine vibracores from Lillooet Lake during
the summers of 2005 and 2006 (Figure 3.2). The cores were collected in water depths
ranging from 78 to 128 m and have lengths ranging from 1.8 m to 11.1 m (Appendix B). I
cut the cores into sections in the field to allow for easier transport to the laboratory.
I processed the cores in the Northern Sedimentary Archives and Environmental
Change Laboratory at the University of Northern British Columbia (UNBC) in Prince
George and in Paleoecology Laboratory at Simon Fraser University (SFU) in Burnaby. I
split the cores lengthwise, and logged, photographed, and sampled them at a 10-cm
interval. To calculate sediment yield, I determined dry density by oven-drying at 100°C or
by freeze-drying the samples for 24 hours. Desloges & Gilbert (1994) found low (<1%)
concentrations of organic matter in their cores. I did not measure the organic matter
content of my samples, but to be conservative, I assumed 5% organic matter content in
all cores. I counted varves and digitally measured their thickness, with a resolution of 0.1
mm using Gimp2 (2012) software to determine the sedimentation rate (SR).
To estimate sediment yield, I first calculated sediment accumulation (SARi) in
each core i, by multiplying the sedimentation rate (SRi) and dry density (DDi):
(eq. 3.1)
Thiessen, or Voronoi, polygons have the “unique property that any location within
that polygon is closer to the polygon’s source point [i.e. core location] than to any other
point” (Verbyla, 2002, p. 28). I determined Thiessen polygons in ArcMap for each core,
and subsequently computed sediment mass (Mi) by multiplying sediment accumulation
rates by core polygon area (Areai):
(eq. 3.2)
I then calculated total sediment mass for each year by summing the masses of
contributing cores for that year. Finally, I calculated suspended sediment yield (Yy) for
each year (y) by dividing the total sediment mass (Mtot) by the catchment area (CA):

65
(eq. 3.3)
Sediment yields were converted to metric tonnes (km-2 a-1) and are reported in
this form in this chapter. Absolute sediment yield estimates are indicated by ’Y’, and
recurrence intervals of specified sediment yields are reported, for example, as Y10, or
Y10-25, denoting sediment yields with, respectively, a recurrence interval of once every
ten years and between once every ten to 25 years.
Errors in sediment yield values arise from each of the above-mentioned steps in
the procedure: varve thickness measurements, dry density estimates, and Thiessen
polygons that assume an area of equal sediment accumulation around each core. Error
is also introduced from organic matter, which was ignored, and the limited number of
cores contributing to the chronology. Each of these variables is measured, or estimated,
with some uncertainty. As sediment yield is a product of the aforementioned variables,
error in sediment yield can be calculated as follows (Taylor, 1982, p. 57):
(eq. 3.4)
where q is the result (e.g. sediment yield), and x, z, u, and w are the measured variables
(e.g. dry density, organic matter, varve thickness). The uncertainty of q (qε) is the
quadratic sum of the error terms of each variable, x ε, z ε, u ε, and w ε:
√(
| |) (
| |) (
| |) (
| |)
or:
| | √(
| |) (
| |) (
| |) (
| |) (eq. 3.5)

66
3.5. Results
3.5.1. Sedimentology
The sediments recovered from Lillooet Lake are clastic varves. Typically, each year is
represented by a couplet comprising a silt base that grades upward into a clay cap.
Couplets may have inter-annual laminae that reflect diurnal or weekly variability in
the discharge of Lillooet River (Desloges & Gilbert, 1994), flood events (Desloges
& Gilbert, 1994; Gilbert et al., 2006), or landslides (Chapter 2) in the watershed. Inter-
annual laminae are generally readily distinguished from varve boundaries. About 70% of
the recovered varves are simple varves (c.f. Desloges & Gilbert, 1994) that contain no
distinct sub-annual laminae. The other 30% have one or more sub-annual laminae, are
anomalously thick, or show micro-laminations. Varves range in thickness from 3.9 mm to
394.9 mm. The average varve thickness decreases from 32.8 mm at the front of the
Lillooet River delta in the north to 13.8 mm at the south end of the lake.
The varve chronology extends from AD 1179 to 2004, but several varves were
excluded from sediment yield calculations. The sediment yield estimate for AD 1921
does not include the anomalously thick (>395 mm), 1921 varve from proximal core 7,
because that varve likely has a local origin (Chapter 2). Similarly, the AD 1946 varve in
core 7 seems to be disturbed and is thicker than the AD 1946 varve in other cores. The
sediment yield estimate for AD 1946 therefore does not include the varve of that year in
core 7. In proximal core C a massive silt bed (>100 mm) marks the start of the AD 1798
varve. As other cores contain only a small, thin, sub-annual lamina in AD 1798, I
attribute this massive silt bed to a local mass flow from the delta and exclude it from the
AD 1798 sediment yield estimate. For these years, as well as other years for which
varves are missing due to core section boundaries or disturbances, I estimated sediment
yield by merging the Thiessen polygon with its closest neighbour(s) and assuming that
sediment accumulation rates in neighbouring cores are representative of that of the
excluded core.

67
3.5.2. Error in sediment yield and estimation of total basin yield
I measured varve thickness with a resolution of about 0.1 mm. To estimate for
the varve thickness error, I re-measured five to eight varves in each core. The average
difference in measurements is 6.1%, which I took to be the varve thickness error.
I estimated the error stemming from missing and false varves in each core. This
error ranges from 0 to 1.61% (Chapter 2). I assume a maximum varve error of 1.61% in
estimating the total error in the sediment yield estimates.
Dry density measurements were not duplicated, thus I calculated mean dry
density and standard deviation for each core to derive an error estimate for this variable.
I divided the average standard deviation dry density for the whole suite of cores by the
average mean dry density for the suite of cores to express deviation around the average
mean as a percentage of the average mean instead of an absolute value. The resulting
estimate of error in dry density measurements is 11.2%.
As mentioned previously, I assumed a maximum organic content of 5% in all
cores. I therefore multiplied measured sediment accumulation rates by 0.95 to correct for
unaccounted organic matter and expressed the difference with measured sediment
accumulation rates as a percentage of the measured accumulation rate. The average
error related to the organic content of the varves is 10.9%.
I estimated error related to the number of cores contributing to the calculation of
total sediment yield for the period AD 1629-1997 by comparing the difference in yield
between estimates based on 10 or 11 cores (i.e. the maximum number of cores
contributing to the chronology in a given year) and estimates based on the five cores
that make up the chronology up to AD 1629. This error is estimated to be 5.5%.
The use of Thiessen polygons assumes that sediment deposition is spatially
uniform throughout each polygon. The polygons, however, likely underestimate
sedimentation in places like the delta front, the lake shoreline, and steep slopes on the
lake bottom. Schiefer (2006) estimated that deltaic sediments in nearby Green Lake are
approximately 10% of the total lake-bottom area and that massive and weakly laminated

68
deposits constitute about 13 and 19%, respectively, of the lake bottom. Varved
sediments in Green Lake are thus present on only 58% of the total lake floor. While
Green Lake and Lillooet Lake differ considerably in size (2.0 km2 vs. 35 km2) and depth
(44 m vs. 137 m), both have similar bathymetries (Schiefer & Klinkenberg, 2004). Gilbert
(1973, 1975) described three morphometric zones, each with different sedimentary
characteristics, in the north basin of Lillooet Lake, and Gilbert and Desloges (1994)
mapped the bathymetry of the south basin. These studies offer useful information on
bottom sediments in Lillooet Lake, but do not provide a lake-wide quantitative spatial
inventory. I speculate that a zone of weakly laminated sediments is recorded near the
areas around proximal cores C and D in Lillooet Lake (Figure 3.2), based on the fact that
varves in these cores are the most difficult to count and trace. Sedimentation in the area
north of cores C and D, therefore, is likely underestimated. This area alone constitutes
nearly 25% of the lake bottom, and together with other places in the lake where
sedimentation might be underestimated, my estimate of the total area of the lake subject
to possible underestimates is 35%. Because the number of cores used in this study is
limited and no cores were taken on the delta front, it is impossible to quantify the error
related to spatial differences in sedimentation.
Applying equation 5, I estimate the total error in suspended sediment yield from
errors in dry density, varve thickness, organic content, varve counting error, and the
number of cores contributing to the yield estimate to be 17.7%. Average suspended
sediment yield thus is 213 ± 38 tonnes km-2 a-1 for the period AD 1629-1997 and 235 ±
41 tonnes km-2 a-1 for the twentieth century.
3.5.3. Characteristics of the long-term sediment yield record
I calculated general statistics for the sediment yield data for the period AD 1629-
1997 (Tables 3.1 and 3.2). The statistics imply a strongly non-normal distribution of
sediment yield estimates, with the maximum sediment yield estimate exceeding the
mean over three times. Extreme value distributions, such as Gumbel, Fréchet, and
Weibull, are typically used in paleoflood hydrology studies (e.g. Hosking & Wallis, 1986)
to estimate the upper quantiles of a probability distribution. I therefore fitted a
generalized extreme value model (Jenkinson, 1955) — a flexible model that estimates
the three parameters determining the Gumbel, Fréchet, and Weibull distributions — to

69
estimate yield quantiles and return intervals for outliers in the AD 1629-1997 sediment
yield chronology. The resulting GEV model had a resulting shape parameter of k >0, and
can thus be classified as a GEV type II or Fréchet-type distribution.
Yield is below the long-term average from the beginning of the record to around
AD 1629 (Figure 3.3). Sediment yield prior to AD 1629 is likely underestimated because
it is based on only two distal cores (cores A and B) and sedimentation rates are much
lower in the distal basin than in the proximal basin (Chapter 2). To test whether this
inference is correct, I correlated the average sediment mass accumulation in cores A
and B with the total basin yield for the period AD 1629-2004. The correlation is poor (r2 =
0.044, p<0.05), which indicates that sedimentation at the two distal cores sites is not
representative of total sediment yield in the basin. I therefore excluded the period prior to
AD 1629 from further analysis. Likewise, the sediment yield record for the period 1998-
2004 is based on one to three cores and was similarly excluded from further analysis.
Figure 3.3. Sediment yield record derived from Lillooet Lake sediments for the period AD 1179-2004.
Sediment yield for the period AD 1629-1997 ranges from 74 to 672 tonnes km-2
a-1; the long-term average value is 213 ± 38 tonnes km-2 a-1 (Table 3.1, Figure 3.4).
Minimum and maximum values for the twentieth century are similar to the long-term
values, 77 tonnes km-2 a-1 (AD 1916) and 659 tonnes km-2 a-1 (AD 1906), but the
average for this period is 11% greater (234 ± 42 tonnes km-2 a-1) than the long-term
average and is the highest centennial average for the period of record (Table 3.2). In

70
addition, the average for the first half of the twentieth century (AD 1900-1945) is much
higher than the average for the second half of the century (AD 1946-1997): 285 ± 50 vs.
183 ± 32 tonnes km-2 a-1.
Table 3.1. Sediment yield estimates for the entire period of record, AD 1179-1629, and 1629-1997.
Table 3.2. Mean sediment yield per century.
Century Sediment yield
(tonnes km-2 a-1)
1900-1997 234.6 ± 41.5
1800-1899 219.3 ± 38.8
1700-1799 212.2 ± 37.5
1629-1699 175.2 ± 31.0
The sediment yield plot for the period 1629-1997 (Figure 3.4) has two interesting
features. First, peaks in sediment yield are unevenly distributed over the 369-year period
of record. I determined recurrence times of peaks in the sediment yield record using a
generalized extreme value model (GEV type II). Peaks in sediment yield with an average
return period of more than 25 years (>Y25) cluster around AD 1776-1825 and AD 1906-
1931; the intervening period lacks such extremes and includes only five peaks with an
average return period ranging from 10 to 25 years (Y10-25). Second, sediment yield is
above average from around AD 1920 to 1946, but is much lower after AD 1946.
Sediment yield peaks with an average return period greater than once every 10
years exceed the AD 1629-1997 mean yield 1.6 to 3.1 times (Figure 3.5). The 369-year
record has five peaks with average return periods greater than 100 years (>Y100), four
Period AD 1179-2004 AD 1179-1628 AD 1629-1997
Sediment yield (tonnes km-2 a-1)
Mean 158.9 ± 28 111.4 ± 20 213.1 ± 38
Minimum 35.5 35.5 74.3
Maximum 1184.1 1184.1 672.3
Standard deviation 103.4 77.0 102.4

71
peaks with return periods between 50 and 100 years (Y50-100), five peaks with return
periods between 25 to 50 years (Y25-50), and 20 peaks with return periods between 10 to
25 years (Y10-25). Years of high sediment yield (>Y10) are unevenly distributed in the 369-
year record (Figures 3.4 and 3.5): 13 of the 34 peaks are in the twentieth century
(Table 3.3), whereas only seven are in the nineteenth century and nine and five are,
respectively, in the eighteenth and seventeenth centuries.
Figure 3.4. Sediment yield record derived from Lillooet Lake sediments for the period AD 1629-1997.
3.5.4. Long-term sediment-yield departures
Cumulative sediment-yield departures for the period AD 1629-1997 demonstrate
the effect of high-yield years on sediment delivery to Lillooet Lake in subsequent years
(Lamoureux, 2002). The sediment yield record for Lillooet Lake shows five periods with
negative trends: AD 1629-1696, 1729-1768, 1777-1792, 1826-1881, and 1945-1997
(Figure 3.6). The onset of each of four subsequent positive-trending periods (AD 1697-
1728, 1769-1776, 1793-1825, 1882-1944), however, is not a high-yield (>Y10) year.

72
Figure 3.5. Estimated return periods for sediment yield estimates, AD 1629-1997, based on a generalized extreme value (GEV) distribution (numbers in black are years with return periods greater than once every 25 years).
Table 3.3. Number of years with sediment yields greater than specified estimated return periods.
Return period
Century (AD) >Y100 Y50-100 Y25-50 Y10-25 Total
1900-1997 3 1 3 6 13
1800-1899 1 1 - 5 7
1700-1799 1 1 1 6 9
1629-1699 - 1 1 3 5
Total 5 4 5 20 34
Note: >Y100 = sediment yield (Y) with an estimated return period greater than once every 100 years; Y50-100 = sediment yields with estimated return periods between 50 and 100 years; etc.
Instead, high-yield years (>Y10) typically occur three to five years following the
start of a positive-trending period. Furthermore, 11 high-yield years (>Y10) are within
negative-trending periods, which constitute 234 of the 369 years of the record. In

73
contrast, 23 such events happen during positive-trending periods (135 years). Sediment
yields with return periods greater than 50 years only occur during positive-trending
periods.
In many instances, high-yield years are ‘stand-alone’ events. Some of these
stand-alone years are immediately followed by a negative trend in cumulative sediment
yield, for example after AD 1647, 1661, and 1991. In other cases, a high-yield year is
followed by a positive trend for two decades, for instance after AD 1712 and 1713, and
after AD 1921.
Two of the highest yield years, both with estimated return periods greater than
100 years (AD 1776, 1825), are separated by only 49 years, but are not associated with
a period of positive-trending years. Remarkably, the 46-year period preceding these two
high-yield years (AD 1729-1775), does not contain any events with average return
periods greater than 10 years, except a smaller (Y25) event in AD 1774, and there are no
such events in the period AD 1776-1825. After AD 1825, cumulative sediment yield has
a negative trend that persists until AD 1881, followed by a 63-year period with a positive
trend until AD 1946. Twelve high-yield events (>Y10) occur during the period AD 1881-
1946, of which three have a return periods greater than 100 years.
These results show that the highest yield years are not necessarily followed by
long periods (e.g. more than a decade) of above-average yields. Only two smaller yield
years (i.e. AD 1712 and 1713) seem to initiate a period of above-average sediment yield
spanning about three decades (Figure 3.6).
3.5.5. Sediment yield trends following high-yield years
The Lillooet Lake sediment yield record includes 34 years with estimated return
periods greater than 10 years (Table 3.3). Examination of cumulative departures in the
30 years immediately after each high-yield year (>Y10) reveals highly variable
sedimentation patterns (Figs. 3.7 and 3.8).
Two years with the highest yields (>Y100; AD 1921 and 1931) are followed by
prolonged periods of above-average yield (Figure 3.7, upper left). The strong positive

74
trend after AD 1921 is attributed to the high yield in AD 1931 and is further influenced by
high yields in 1936 and 1940.
Figure 3.6. Cumulative departure of sediment yield for the period AD 1629-1997.
The average trend in the Y50-100 and Y25-50 groups (Figure 3.7, upper right and
lower left) is positive for the first 12 and 10 years, respectively. Individual signals of
years AD 1823 (Y50-100), 1774 (Y25-50), and 1936 (Y25-50) are influenced by much larger
events two to four years later (i.e. AD 1825, 1776, and 1940, respectively).
The common pattern in the Y10-25 group is above-average sediment yield
immediately after event years (Figure 3.8), but there are many exceptions. The events in
the seventeenth century are noteworthy: all show a negative trend following the high-
yield year. Some events in the eighteenth, nineteenth, and twentieth centuries are
followed by positive-trend periods, whereas others are followed by periods with negative
trends.
3.5.6. Persistence of high-yield years
To further assess the impact of high-yield years on subsequent sedimentation in
Lillooet Lake, I superposed the years in each quantile group. For each high-yield year, I

75
calculated the deviation from the 40-year mean for 10 years prior to and 30 years after
each event (Figure 3.9; Panofsky & Brier, 1958; Lamoureux, 2002). The significance of
high-yield years (>Y10) was tested using the ‘sea’ command in the dplR package of
statistical program R, in which randomly selected years were bootstrap resampled to
determine the significance of departures from the mean.
Figure 3.7. Cumulative departure from AD 1629-1997 mean sediment yield for each group of recurrence interval group (lower left: Y25-50; upper right: Y50-100; upper left: >Y100).
All high-yield years (>Y10) have highly significant (p < 0.05) departures from the
mean. Persistence is evident in two of the first five years immediately after all 34 events
(Figure 3.9, lower left panel), although deviations from the mean are small (<50 tonnes
km-2 a-1). For years with a return period greater than 100 years (Figure 3.9, upper left),

76
the first year after the event has above-average sediment yield, but that year is followed
by four years with below-average yields.
Figure 3.8. Cumulative departure from AD 1629-1997 mean sediment yield for events with a recurrence interval between 10 and 25 years (Y10-25; orange: seventeenth century; green: eighteenth century; blue: nineteenth century; red: twentieth century; black: average cumulative departure of all Q10-25 events).
In the case of the Y50-100 group positive deviations from the mean are evident in
four of the first five years after the high-yield year, but subsequently more years show
negative deviations from the mean than positive deviations. The Y25-50 group (Figure 3.9,
middle left panel) shows an initial positive deviation from the mean, followed by mainly
below-average yields after four years. Similarly, the Y10-25 group (Figure 3.9, middle right
panel) has an initial positive deviation in the first year, with slightly positive and negative
deviations after that.

77
The Y50-100 and Y25-50 groups display above-average yields in, respectively, five
and eight of the ten years prior to the high-yield year. The other two groups have more
negative years leading up to the high-yield year.
Figure 3.9. Deviations from the mean over the period extending from 10 years before to 30 years after each high-yield year for groups with different recurrence intervals, AD 1629-1997. Red column is event year ‘0’.
Persistence in high-sediment yields is more pronounced in the twentieth century
in the Y50-100 and Y25-50 quantile groups than in the other groups. However, 13 of the 34
high-yield years occur in the twentieth century, and 11 of those 13 years are in the
period AD 1900-1946, which is a period of above-average sedimentation (Figure 3.4). It
is therefore difficult to draw conclusions about persistence of sediment yield in the
twentieth century as a whole, because high-yield events (>Y10) occur on average every
4.2 years in the first 46 years of the century, and any persistence in the system is

78
masked by subsequent, possibly unrelated, high-yield events. In comparison to the
persistence pattern for the entire 369-year record (Figure 3.9), there are a larger number
of years with positive deviations in the twentieth century (Figure 3.10), but this too can
be attributed to the frequency of high-yield years in the first half of the century.
Figure 3.10 Deviations from the mean over the period extending from 10 years before to 30 years after each high-yield year for groups with different recurrence intervals; twentieth century. Red column is event year ‘0’.
3.6. Discussion
3.6.1. Comparison to other sediment yield studies
The long-term (AD 1629-1997) average sediment yield estimate is 213 ± 38
tonnes km-2 a-1, which is similar (Table 3.4) to the sediment yield estimates of Desloges
& Gilbert (1994), but substantially lower than earlier estimates by Slaymaker (1972) and
Gilbert (1973). Comparison of the same 125-year interval (AD 1864-1988) Desloges &

79
Gilbert (1994) used, shows that my average value (230 tonnes km-2 a-1) is about 10%
higher than their estimate.
Table 3.4. Comparison of sediment yield estimates derived from this study (AD 1629-2004) and other published values.
Study This study Slaymaker (1972)
Gilbert (1973)
Desloges & Gilbert (1994)
Sediment yield (tonnes km-2 a-1)1
213.1 386.3 3342 188-218
Component of total sediment yield
Average annual long-term suspended sediment yield
Suspended load Annual suspended load
Annual total basin yield, fine fraction3
Estimate derived from
Varves ? Varves +
pro-delta accumulation
Varves
Original reported yield
1450 × 103 tonnes a-1 1.1 × 10⁶ m3 a-1 6.2-7.2 × 10⁵ m3 a-1
Period AD 1629-1997 ? AD 1913-1969 AD 1864-1988
1 Estimates recalculated to tonnes km-2 a-1 to compare with the results of this study. 2 Gilbert estimated the volume of sediment accumulating on the pro-delta to be 5.3 × 10⁷ m3 and in the rest of the lake 6.3 × 10⁶ m3 for the period 1913-1969, which totals to 1.1× 10⁶ m3 a-1, equivalent to 334 tons km-2 a-1. 3 Total basin yield of the fine fraction (< 63 μm). Desloges & Gilbert estimate the total basin yield (fine and coarse fraction) to be 15.5-16.5 × 10⁵ m3 a-1, equivalent to 471.6-500.9 tonnes km-2 a-1.
The varved sediment archives of many lakes in British Columbia have been
studied, notably Harrison Lake (Desloges & Gilbert, 1991), Green Lake (Menounos et
al., 2006; Schiefer et al., 2010), Chilko Lake (Desloges & Gilbert, 1998), Bowser Lake
(Gilbert et al., 1997), and Moose Lake (Desloges & Gilbert, 1995). Studies of several
other small lakes in the Canadian Cordillera have also been done (Desloges, 1994;
Schiefer et al., 2001; Schiefer and Gilbert, 2008). These studies have shown that
sediment yield increases in watersheds up to 3 × 10⁴ km2 in area, consistent with the
findings of Church & Slaymaker (1989). My sediment yield estimates fall within the
regional envelope (Figure 3.11) described by Church & Slaymaker (1989). Results
presented by Schiefer et al. (2001), however, suggest that differences in terrain and
geology lead to considerable scatter.

80
Figure 3.11. Comparison of suspended sediment yield for the Lillooet River watershed (this study; red circle with error bars) and specific sediment yield (i.e. “the quantity of sediment passing a monitored river cross-section per unit area drained upstream of that section”; Church and Slaymaker, 1989, p. 452) in British Columbia. Closed symbols are data from natural landscapes; open symbols are data from landscapes influenced by natural or human disturbances. Measurements for Lillooet Lake from Church et al. (1989) are derived from a 57-year record of lake sedimentation reported by Gilbert (1973). Modified from Church & Slaymaker (1989).
Sediment yield in the Lillooet River watershed in the twentieth century has been affected
by many events, notably landslides, floods, glacier retreat, formation of Silt Lake, river
engineering, and land-use changes in the watershed. In contrast, the watershed of
Green Lake prior to the establishment of the Whistler ski resort in the1960s was largely
undisturbed and not subject to river straightening or dyking (Menounos et al., 2006).
Sediment yield in the Green Lake watershed before the 1960s thus reflects more natural
conditions. Suspended sediment yield, as derived from varved sediments, in Green Lake
during the period 1931-1991 is 10% higher than during the past 3000 years (Menounos
et al., 2006): ± 76 tonnes km-2 a-1 vs. 69.4 tonnes km-2 a-1. Menounos et al. (2006)

81
attributed the higher sediment yield during the twentieth century to increased
sedimentation accompanying retreat of glaciers between 1935 and 1945, although
human disturbances in the watershed between about 1960 and 1991 may also have
played a role.
Schiefer et al. (2010) extended the work of Menounos et al. (2006) in Green
Lake. They studied lake sediment cores, delta progradation, and solute transport, and
concluded that the average annual total sediment yield since the mid-1900s has been
320 ± 40 tonnes km-2 a-1, of which about 35% is suspended load, 50% is bedload, and
15% is dissolved load. The ratios of the three components of sediment yield however,
differ significantly on decadal time scales, which could have important consequences
when short-term sediment yield records are extrapolated and used for the projection of
long-term sediment yield estimates. If the sediment yield fractions for Green Lake are
applicable to Lillooet Lake, and assuming constant ratios through time, total clastic
sediment yield to Lillooet lake would be 671 ± 119 tonnes km-2 a-1 during the twentieth
century and 612 ± 108 tonnes km-2 a-1 for the period AD 1629-1997 period.
Considerable reductions in sediment yield in the second half of the twentieth
century have also been reported for ice-marginal Ape Lake in the central Coast
Mountains and proglacial Berg Lake (Desloges, 1994), as well as Hector Lake (Leonard,
1997) in the Rocky Mountains. Varve-based sediment yield records from the first two
lakes show declining sediment yields throughout the twentieth century, with a further
abrupt decrease after AD 1955. Desloges (1994, p. 139) attributed this decrease to
“reduced contributions from basin glaciers as subglacial sediment becomes exhausted
following retreat from Little Ice Age maxima around AD 1800.” He further attributed the
post-1955 decline in sediment yield to ”de-coupling of the ice/sediment sources as the
glacier retreats behind terminal and recessional moraines and as small proglacial lakes
are opened” (p. 139). Together with depletion of easily eroded Neoglacial sediments, the
formation of proglacial Silt Lake in the Lillooet River watershed contributed to lower
sediment yields in the second half of the twentieth century.
Sediment-yield studies have also been conducted in the Canadian Arctic and in
paraglacial and proglacial mountain environments around the world, for example in the
European Alps (Gurnell & Warburton, 1990), New Zealand (Hicks et al., 1990), and

82
Scandinavia (Elverhøi et al., 1995). Sediment yield in Canadian Arctic watersheds is
substantially lower than in the Lillooet River watershed. Lamoureux (2000, 2002)
reported an average sediment yield of 109.8 tonnes km-2 a-1 from Nicolai Lake, Cornwall
Island, Nunavut. Sedimentation in Nicolai Lake is largely controlled by intense summer
runoff events. Landslides in this low-relief, non-glacierized catchment are rare, in
contrast to the situation in the Lillooet River watershed. Sediment transport during
extreme runoff events is thus of a different scale than in the Coast Mountains, which
have steep terrain, glaciers at higher elevations, and frequent autumn storms. Sediment
yield in Iceberg Lake (Loso et al., 2004), an Alaskan proglacial lake with a small
watershed area (66 km2) and 52% glacier cover, has been estimated at 3.8-4.9 x 10³
tonnes km-2 a-1. Loso et al. (2004) reported that suspended sediment is less than 20% of
the total clastic sediment discharge into Iceberg Lake. Their results indicate that
estimates of total clastic sediment yield based solely on the suspended sediment fraction
may be misleading in some environments.
3.6.2. Sediment sources and storage: persistence in the sediment-yield record
My results indicate some persistence in the sediment yield record derived from
Lillooet Lake sediments. Cumulative sediment yields after the most extreme events
(>Y100) vary, but generally increase (Figure 3.7). Sediment yield remains higher than the
40-year average up to one year after each extreme event (Figure 3.8), but the
persistence of high yields strongly depends on hydrological conditions in the watershed.
A small fraction of the sediment that was mobilized during the extreme event may persist
in the fluvial system for several years in bars in river channels or easily eroded river
banks. Thereafter, hydrological conditions within the watershed determine whether large
amounts of sediment will continued to be mobilized. This conclusion is consistent with
Lamoureux’ (2002) observation that suspended sediment is rapidly transported, and that
suspended sediment yield after an extreme event is not as strongly affected by slower
aggradation and degradation processes that influence bedload yield.
Average cumulative sediment yield gradually increases for five years after Y25-50
and Y50-100 events (Figure 3.7), after which it steadily declines to lower-than-average
values. Average cumulative sediment yield after Y10-25 events (Figure 3.8) remains above

83
average in the 30 post-event years. A possible explanation is that high yields (Y10-100)
occur during multi-annual periods of higher discharge of Lillooet River, coincident with
the periodicities of ENSO or Pacific Decadal Oscillation cycles. Additionally, while
twentieth-century high-yield years (Y10-100) are typically categorized as either
anomalously thick varves or simple varves with a late-season upper graded lamina
(Chapter 2, Figure 2.5), micro-laminated varves, indicative of increased glacier melt
(Menounos et al., 2005), are more common after high yield events (Y10-100) in 1936,
1937, 1940, and 1941 (Chapter 2, Figure 2.5).
Reports and dates are available for twentieth-century events that may have
impacted sediment yield in the Lillooet River watershed. These data allowed me to better
interpret historic high-yield events. I therefore separately assessed persistence of high
sediment-yield events in the twentieth century (Figure 3.10). Persistence in the twentieth
century is however, difficult to evaluate (Figure 3.10), because high-yield events in the
first half of the century happened, on average, once every 4.2 years. The high frequency
of extreme-yield events during the first half of the twentieth century is likely due to
greater sediment availability resulting from glacier retreat from Little Ice Age maximum
positions. More leading years (i.e. years preceding the high yield event or negative lag
years in Figure 3.10) show above-average yields in the twentieth century than during the
AD 1629-1997 period as a whole, respectively seven and four out of the first ten years.
The Y50-100 group shows the largest leading trend (i.e. most preceding years with above-
average yields) in the twentieth century (Figure 3.10, upper right), but includes only one
extreme-yield year (AD 1940). Maximum daily discharge in AD 1940 was far less than in
AD 1991, but the sediment-yield time series for these two high-yield years have opposite
trends (Figure 3.12). This observation suggests that glacier recession contributed to the
increased sediment loads in AD 1940. Only two extreme-yield years (1975 and 1991)
occur after AD 1946, and both are followed by negative sediment-yield trends (Figs. 3.7
and 3.8, respectively).
Lamoureux (2002) documented high sediment yields for periods of 10-30 years
following the 40 largest sedimentation years in Nicolai Lake in the Canadian High Arctic.
He found that the largest annual yields (>Y100) had the most long-lived effects, whereas
smaller yields (Y10, Y25, and Y50) had more variable effects and generally were shorter-
lived. He attributed the largest high-yield events to heavy rainfall that mobilized channel

84
and bank sediments. He concluded that persistent high yields following the event year
resulted from short-term storage of sediment in the channel and erosion from unstable
faces and surfaces in the catchment (Lamoureux, 2002).
In contrast, Green Lake sediments lack notable persistence of high yields in the
years following extreme events. Menounos et al. (2006) attributed this lack of
persistence to a supply-limited sediment transport regime and the importance of rare
meteorological events in moving sediment. Erodible glaciomarine and glaciolacustrine
sediments are present in the Nicolai Lake watershed, and large amounts of sediment are
stored in the fluvial system above the lake (Lamoureux, 2002). In the Green Lake and
Lillooet River watersheds, sediments supplied to the river are mainly derived from
Neoglacial deposits and landslides which are intermittently coupled to the fluvial system.
Figure 3.12. Sediment yield and maximum daily discharge of Lillooet River during the twentieth century. Historic floods and landslides are listed in Appendices D and F.

85
3.6.3. Interpretation of sediment-yield signal
Glacier changes and landslides during the period of the varve record (AD 1629-1997)
Jordan & Slaymaker (1991) provided a conceptual model for Holocene sediment
transport in a glaciated mountainous watershed based on their study of the Lillooet River
basin. They concluded that Neoglacial deposits, debris flows, and landslides are the
main sediment sources in Lillooet River valley (Figure 3.13). Holocene glacier activity in
Western Canada has been documented using proxy records such as tree rings
(Larocque & Smith, 2003; Koch et al., 2009), lichens (Allen & Smith, 2007), and varves
(Menounos et al., 2004). A consistent picture of late Holocene glacier activity has
emerged from studies in the southern Coast Mountains (Larocque & Smith, 2003; Reyes
& Clague, 2004; Allen & Smith, 2007; Koch et al., 2007; Clague et al., 2009). In Garibaldi
Provincial Park just south and west of Lillooet Lake, an early Little Ice Age advance in
the twelfth century was followed by glacier recession in the thirteenth century (Koch et
al., 2007). Glaciers advanced several times in the fourteenth and fifteenth centuries, and
achieved their maximum Holocene extents between AD 1690 and 1720 (Figure 3.14;
Koch et al., 2007). A similar history has been documented at Bridge Glacier,
approximately 85 km northwest of Pemberton (Allen & Smith, 2007): an early Little Ice
Age advance about 700 years ago, followed by moraine stabilization during the late
thirteenth century to the early fourteenth century, and several intervals of advance and
retreat from the fifteenth through twentieth centuries. Reyes & Clague (2004)
documented a similar record of late Holocene glacier fluctuations at Lillooet Glacier.
They found stratigraphic and geomorphic evidence for several advances of Lillooet
Glacier during the Little Ice Age, the first of which was well underway by 450 14C years
BP (AD 1330-1630).
Collectively, the evidence from Garibaldi Park and Bridge and Lillooet glaciers
shows that glaciers in the Lillooet River watershed reached positions near their Little Ice
Age maxima from before AD 1629 (the most reliable part of the Lillooet Lake varve
record) until about AD 1900 (Figure 3.14). Unfortunately, I was unable to use two
recovered cores that date back an additional 450 years (AD 1179) to extend the
sediment yield record back to the onset of Little Ice Age. There are few long-term
sediment yield records in the Coast Mountains to which I can compare the Lillooet Lake

86
record, thus I can only speculate about sediment yield estimates in the Lillooet River
watershed prior to AD 1629. A study in nearby Green Lake (Menounos, 2006), however,
suggested that lower sedimentation rates prior to AD 1600 corresponds to less extensive
glacier ice cover in the watershed than later during the Little Ice Age. Given the apparent
synchronous history of glaciers throughout the southern Coast Mountains, lower
sedimentation rates would be expected in Lillooet Lake prior to AD 1629.
Much research has been conducted on historic and prehistoric landslides at
Mount Meager (Mokievsky-Zubok, 1977; Evans, 1987, Friele & Clague, 2004; Guthrie et
al., 2012). The largest prehistoric landslides generated debris flows that reached as far
south as the present location of Pemberton (Friele et al., 2008) and must have affected
sedimentation in Lillooet Lake. These large landslides, however, are older than the
beginning of my varve record. At least eight landslides with volumes of 105 m3 or more
occurred at Mount Meager during the period spanned by my cores (AD 1179-2004). Two
prehistoric landslides, with calibrated radiocarbon ages of approximately AD 1800 (1740-
1860) and 1740 (1690-1790) are within the period spanned by my cores (Figure 3.14).
Two of the largest sediment yields (>Y100) date to AD 1776 and 1825 and thus fall within
the calibrated age range of these landslides. The year with the tenth largest sediment
yield (AD 1713; Y50-100 category) is also within the age range of the AD 1740 landslide.
The AD 1825 varve has no distinct sedimentological features, other than being thicker
than average, but the AD 1713 and 1776 varves contain a thick sub-annual lamina. The
AD 1776 varve also has a distinctive yellow colour in distal cores and a thick dark silt
bed in proximal cores. This event bed can be confidently correlated from core to core,
and the distinctive yellow colour, possibly indicative of fine volcanic sediment derived
from Mount Meager, is faintly visible in the most distal core (core E, Figure 3.15). The
AD 1931 varve has a similar sedimentological signature (Figure 3.15); it coincides with a
debris flow with a volume of 3 × 10⁶ m3 that descended Devastation Creek, near Mount
Meager (Friele et al., 2008). The prehistoric debris flows of AD 1800 and 1740 had
volumes of 105 -106 m3 (Friele et al., 2008), and are thought to have had sources,
respectively, in the Angel Creek and Capricorn Creek basins; both of these streams are
tributaries of Meager Creek.

87
Figure 3.13. Conceptual model of sediment storage and transfer in Lillooet River valley, showing the most important sediment storage sites (adapted from Jordan & Slaymaker, 1991). Sediment transfers between each storage site operate continuously on all time scales.
Sediment yield in the Lillooet River watershed, although high throughout the
period AD 1629-1997, increases from an average of 175 ± 31 tonnes km-2 a-1 in the
seventeenth century to 234.6 ± 42 tonnes km-2 a-1 in the twentieth century (Table 3.2).
This increase coincides with the expansion of alpine glaciers which reached their Little
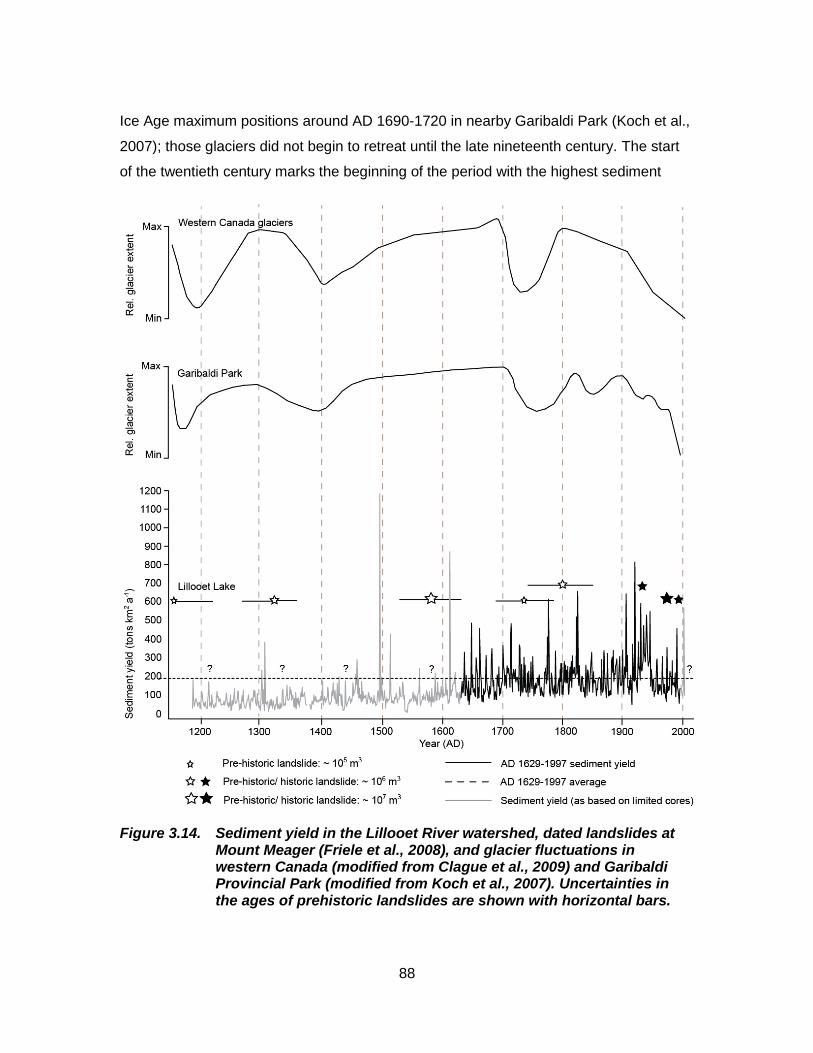
88
Ice Age maximum positions around AD 1690-1720 in nearby Garibaldi Park (Koch et al.,
2007); those glaciers did not begin to retreat until the late nineteenth century. The start
of the twentieth century marks the beginning of the period with the highest sediment
Figure 3.14. Sediment yield in the Lillooet River watershed, dated landslides at Mount Meager (Friele et al., 2008), and glacier fluctuations in western Canada (modified from Clague et al., 2009) and Garibaldi Provincial Park (modified from Koch et al., 2007). Uncertainties in the ages of prehistoric landslides are shown with horizontal bars.

89
yields, with average yields of 285 ± 50 and 183 ± 32 tonnes km-2 a-1 for, respectively, the
AD 1900-1945 and AD 1946-1997 periods. A similar increase in sediment yield in the
early twentieth century has been documented at nearby Green Lake (Menounos et al.,
2006) and Cheakamus Lake (Menounos & Clague, 2008), and has been attributed to
increased availability of sediments following rapid retreat of glaciers from their Little Ice
Age maximum positions.
Figure 3.15. Examples of the (a) AD 1931 and (b) 1776 varves in Lillooet Lake from cores C, 2 and E (left to right; proximal to distal core locations). The vertical black bar at lower left of each photograph is 1 cm.

90
Twentieth century
Sedimentation rates in Lillooet Lake were highest during the period 1920-1945.
Sediment yield during the second half of the twentieth century was considerably lower
than during the first half of the century (Figure 3.12). Glaciers in Garibaldi Park stabilized
and even advanced during the period 1946-1976 (Koch et al., 2009), coincident with the
negative, or cool, phase of the Pacific Decadal Oscillation (PDO). Glaciers receded
markedly during the last two decades of the twentieth century in Garibaldi Park (Koch et
al., 2009) during a positive, or warm, phase of the PDO. Average estimated sediment
yield is about 10% higher during the period AD 1977-1997, the warm phase of the PDO,
than during the period AD 1946-1976, the cold phase of the PDO (190 ± 34 vs. 178 ± 32
tonnes km-2 a-1). This increase in average estimated yield may be related to an increase
in autumn floods in Lillooet River valley (Menounos et al., 2005) and coincides with a
return to the warm phase of the PDO (Figure 3.12).
Proglacial Silt Lake began to form at the toe of Lillooet Glacier sometime
between AD 1947 and 1962 (Schiefer and Gilbert, 2008). It rapidly grew in size with
continued glacier retreat and trapped an increasing amount of suspended sediment
(more than 103 tonnes km-2 a-1) that would otherwise have been transported to Lillooet
Lake. The appearance and growth of Silt Lake may explain part of the decrease in
sedimentation in Lillooet Lake since approximately AD 1946. Schiefer & Gilbert (2008)
found, consistent with continued retreat of Lillooet Glacier, that sedimentation rates in
Silt Lake decreased from the mid-twentieth century until the early 1990s. One would
expect a similar signal in Lillooet Lake, however sediment yield in Lillooet Lake since AD
1947 shows large inter-annual variability (Figure 3.12), with no decreasing trend towards
the end of the century. These observations suggest that other sediment sources, notably
landslides from the Mount Meager massif, were important sediment sources.
Friele et al. (2008) reported at least eight landslides with volumes larger than 105
m3 in the Mount Meager Volcanic Complex during the historic period (Appendix F). Two
of largest historic landslides, in AD 1931 (3 ×10⁶ m3) and 1975 (107 m3), coincide with
peaks in the sediment yield record. Lillooet River also had a high maximum daily
discharge in 1975 (Figure 3.12). Sediment yield in the years following the AD 1975
landslide, however, is below average, corresponding to relatively low discharges of

91
Lillooet River in the late seventies. Other historic landslides in the Lillooet River
watershed did not have an immediate effect on sedimentation in Lillooet Lake, although
a series of small landslides between AD 1986 and 1990 (Figure 3.12; Appendix F) may
have pre-conditioned the watershed for the high sediment yields following the AD 1991
flood.
Major engineering works were undertaken in Lillooet River valley in AD 1946 in
response to the great 1940 flood. The river north of Pemberton to the Forestry Bridge at
the north end of Pemberton Meadows was straightened and dyked between 1946 and
1952. In addition, the level of Lillooet Lake was lowered 2.5 m to increase the
conveyance of water in the river (Jordan & Slaymaker, 1991). The geomorphological and
fluvial responses to these changes included down-cutting and bank erosion by Lillooet
River and an increase in the rate of advance of the Lillooet River delta (Jordan &
Slaymaker, 1991). Although the delta front advanced rapidly during the first five years
after the engineering works were completed, the amount of suspended sediment
deposited farther south in the lake does not appear to have increased (Figure 3.12).
Logging, agriculture, and the increase in population in Lillooet River valley in the
twentieth century have likely had only a minor effect on sedimentation in Lillooet Lake
(Jordan & Slaymaker, 1991). The coincidence of several changes in the watershed
around AD 1946 (as described above) makes it difficult to separate their possible effects
on sediment yield.
3.7. Conclusions
I established an 825-year varve chronology from cores of varved sediments
recovered from Lillooet Lake. The lack of cores spanning the entire 825-year chronology
from proximal locations near the Lillooet River delta limited sediment-yield estimates to
the period AD 1629-1997. My estimate of average suspended sediment yield for this
369-year period is 213 ± 38 tonnes km-2 a-1, similar to a previous estimate made by
Desloges & Gilbert (1994). High sediment-yield years are unevenly distributed over the
period; 13 of 34 extreme yield years were in the twentieth century. Eleven of the
twentieth-century extreme yield years occurred prior to AD 1946.

92
High sediment yields in the seventeenth, eighteenth, and nineteenth centuries
are consistent with maximum Little Ice Age glacier cover within the watershed. I attribute
increased sedimentation in Lillooet Lake in the early part of the twentieth century to
increased sediment availability due to rapid glacier recession in the region. Lower
average sediment yields in the second half of twentieth century appear to be the result of
several events that occurred almost simultaneously: 1) formation of Silt Lake near the
terminus of Lillooet Glacier, which reduced the amount of sediment reaching Lillooet
Lake; 2) river training; and 3) a shift from a warm to a cold phase of the PDO.
Three years with the highest sediment yields (AD 1713, 1776, and 1825) are in
the age windows of large radiocarbon-dated landslides. The AD 1776 varve resembles
the thick AD 1931 varve, which is attributed to a large landslide near Mount Meager.
Sediment yield peaks in the second half of the twentieth century are related to high
Lillooet River discharges. In contrast, a large historic landslide near Mount Meager
Complex in AD 1975, which occurred shortly before a high flow event on Lillooet River,
produced a varve that is only in the Y10-25 category. The thick AD 1991 varve (Y25-50) is
attributed to a series of landslides in the years leading up to the event, in combination
with the highest Lillooet River discharge on record, prior to 2003.
Cumulative sediment yield after individual extreme events is highly variable.
Increasing cumulative yields are seen up to 30 years in the case of the most extreme
(>Y100) events and also for many smaller (Y10-25) events. In the case of the Y100 group,
however, this is mainly due to a series of twentieth century extreme events that occurred
in rapid succession during a period of high sediment availability. In the case of the
intermediate groups (Y25-50 and Y50-100), cumulative sediment yields are showing
increasing trends up to 17 years. Overall persistence in each yield group after an
extreme event however, was only found up to five years after the event, suggesting a
connection with multi-annual climate cycles.
The wide variety of processes that shape the landscape of the mountainous
Lillooet River watershed make it difficult to disentangle causative events. My estimates
of sediment delivery to Lillooet Lake do not include bedload, as a consequence large
uncertainties would be introduced to infer total clastic yield to the lake. Nevertheless,

93
variations in the suspended sediment component of the total clastic yield are consistent
with what is known about the regional glacial and landslide history of the watershed.

94
4. Role of science and technology in flood hazard management in Lillooet River valley
4.1. Abstract
This research explores the extent to which new scientific knowledge and
technology contribute to flood hazard management in the town of Pemberton in Lillooet
River valley, British Columbia. Past studies reveal that natural hazard science is not
effectively communicated to, or used by, government and other public decision makers.
In this context, I provide overviews of scientific literature pertaining to Lillooet River
flooding and recent developments in flood management at the federal, regional, and
local government levels in order to illustrate how the flood hazard is currently managed
in Lillooet River valley. Interviews with local flood and emergency managers illuminate
how available scientific information is perceived and used, and where improvements can
be made.
4.2. Introduction
Lillooet River valley is vulnerable to a range of hazardous natural processes,
notably floods, landslides, and wildfires. The population in the valley has increased
considerably in recent years, resulting in an overall increase in the risk from these
hazards. Scientific research on natural hazards in Lillooet Valley has also increased, but
questions remain whether that new knowledge has reached responsible local officials
and whether it is being used effectively. These questions are pertinent because, in 2003,
the responsibility for flood management in British Columbia was transferred from the
Provincial Government to local governments. What then is the relationship, if any,
between scientific researchers and local governments? What are the most important
concerns or barriers in knowledge transfer from the perspective of local authorities? And
how can this process be improved in the particular case of the Lillooet Valley?

95
Much social science research has been devoted to the process of knowledge
transfer between science and society, and most authors acknowledge the need to
improve the relationship between researchers and policy makers. However, such studies
in the field of natural hazards are few and are mainly general, based, for example on
interviews of different stakeholders (e.g., Fothergill, 2000). Furthermore, Most studies
are in other disciplines, for example health sciences (Lavis et al., 2003; Ross et al.,
2003; Lavis, 2006; Mitchell et al., 2009), which have uncovered different relationships
and problems between scientists and health-care practitioners than natural hazard
studies would.
British Columbia is home to numerous remote small communities, many of which
are at risk from one or more kinds of natural hazard. Although my research is specific to
Lillooet Valley, the results reported herein may illuminate issues faced by decision
makers in other communities in the province. Additionally, the results of my study will
hopefully inform the natural hazard research community about how their work is
perceived and used by local authorities. And finally, this study identifies concerns,
obstacles, and improvements in knowledge transfer that can benefit both communities.
Forecasted changes in global climate are likely to increase the incidence of
flooding in the future (Intergovernmental Panel on Climate Change, 2007, 2013). There
has been much progress in understanding the climate processes that affect natural
hazards, but research on how humans will adapt to future change in climate and to
changes in the occurrence of natural hazards is still in its infancy. Several publications
are available that discuss the transfer of scientific knowledge to communities on global
(e.g. UN/ISDR, 2004), national (e.g. Lemmen et al., 2008), regional (e.g. Columbia Basin
Trust, 2012), and community (e.g. McKenzie-Mohr, 2011) levels.
This case study examines the transfer and utilization of scientific knowledge in
relation to natural hazards. The focus is on the experience of local government decision
makers in Lillooet River valley. The study adds to the existing body of literature by
narrowing the focus to a localized setting (though not unique in the landscape of British
Columbia) and targeting a specific group of natural hazard workers. Although the study
deals with the flood hazard in the valley, it also touches on other hazards.

96
I have structured the chapter as follows. I first provide a brief literature review on
relevant science-society research. Details on the interviews and the interview questions
are presented next, followed by an overview of the study area and the causes of flooding
in Lillooet River valley. I then summarize flood policy developments in British Columbia
and Canada, which reflect increasing knowledge of flooding as a hazard. This section is
followed by an overview of the literature on floods and other natural hazards in the
Lillooet River watershed. The final sections of the chapter are the community interviews,
discussion, and a summary and conclusions.
4.2.1. Science - society relationship
Vannevar Bush’s (1945) report to U.S. President Roosevelt is acknowledged as
one of the most influential post-Second World War discussions of the relationship
between science and policy-making (Stokes, 1997; Jasanoff & Wynne, 1998; Pielke,
2010). The report marked the beginning of the era of modern science policy and led to
the creation of the U.S. National Science Foundation (Pielke, 2010).
In his report, Bush concludes that scientific knowledge and advances are the
answer to societal problems and needs: “… without scientific progress no amount of
achievement … can insure our health, prosperity, and security as a nation in the modern
world” (Bush, 1945, p. 233). For example, he argues that increased knowledge of
diseases would enable us to find medicines to cure them and that new knowledge would
help us to build new and improved weapons for defence against aggression (Bush,
1945).
Bush coined the term ‘basic research’ and said “Basic research is performed
without thought of practical ends. It results in general knowledge and an understanding
of nature and its laws” (Bush, 1945, p. 240). Although basic research may have
important social contributions, practical applications are not the focus of the scientists
conducting this kind of research. Rather, explicitly practical applications of research are
the realm of applied research according to Bush. Nevertheless, Bush believed that
“basic research leads to new knowledge… [and] is the pacemaker of technological
progress” (Bush, 1945, p. 241).

97
Pielke (1997) discusses the popular post-Second World War linear model of
science and society, shaped by Vannevar Bush’s thoughts on science and technology.
The linear model of basic research, leading to applied research and then to the
development of technologies that will benefit society, has been discussed and criticized
by many scholars (e.g. Wise, 1985; Tatum, 1995; Stokes, 1997; Pielke, 2010). The
linear model of scientific research does not capture the true relationship between
science and society. It is a unidirectional model, with society as the receiving end
member; and it isolates science from society and vice versa. Furthermore, not all
scientific advances have been beneficial to society (Pielke, 1997). In short, the linear
model is an inaccurate portrayal of the actual relationship between science and society
(Wise, 1985).
Stokes (1995, 1997) offers the Pasteur’s quadrant of scientific research as an
alternative to the linear model. He describes the relation between the quest for
fundamental understanding on one side of the quadrant and considerations of use on
the other side (Figure 4.1). The quadrant of ‘pure basic research’, for example Niels
Bohr’s quest to understand atomic structure, represents basic or pure science as
originally described by Vannevar Bush. This quadrant is opposite the ‘pure applied
research’ quadrant, which does not pursue a deeper scientific meaning, but instead
focuses on an application of science to society, akin to work done in the laboratory of, for
example, Thomas Edison. With perhaps the exception of some of his most recent work,
Gilbert F. White focused on societal relevance in his studies in geography and natural
hazards; those studies fall within the pure applied research quadrant. A ‘use-inspired
basic research’ quadrant includes work that seeks deeper scientific understanding, but
at the same time considers the use of that knowledge, and is aptly named after Louis
Pasteur’s drive to understand the science of microbiology and its importance for the food
industry. The fourth quadrant includes “research that systematically explores particular
phenomena without having in view either general explanatory objectives or any applied
use” (Stokes, 1997) or research driven by the curiosity of the investigator.
Since Bush’s report, a large body of science and technology research has
focused on the relationship between scientific knowledge and policy making. In the
paragraphs below, I provide representative examples of studies that discuss this
relationship in the context of environmental and natural hazard research.

98
Figure 4.1. Models of knowledge transfer. a) Linear model. b) Pasteur’s quadrant (reproduced from Stokes, 1997).
Knowledge transfer barriers in environmental and natural hazard research
Scientific information on natural hazards is readily available, but many scholars
have concluded that this information is poorly communicated to, and not effectively used
by, decision-makers or practitioners (these terms are used interchangeably in this
chapter; White et al., 2001; Holmes & Clark, 2008).
Studies in the United Kingdom (Holmes & Clark, 2008), United States (Morss et
al., 2005), and Canada (Slaymaker, 1999) mention a lack of collaboration or interaction
between scientists and practitioners as one of the main barriers to effective knowledge
transfer. Scientists and practitioners are regarded as end members in the knowledge
transfer process – researchers produce knowledge and practitioners use it. Typically,

99
however, the scientist does not consult the practitioner before conducting research, and
there is little or no feedback from the practitioner to the scientist once the research has
been done (Morss et al., 2005). Additionally, the different priorities of the two groups and
a lack of clear legislation or science policy (Slaymaker, 1999) hamper this relationship.
Ideally the process of knowledge production should be an interactive, iterative process
between the two parties involved (Morss et al., 2005; Holmes & Clark, 2008).
A consequence of this lack of communication is the inefficient use of knowledge.
Research carried out without consideration of societal needs can result in knowledge
that has no practical value to policy makers. To ensure effective use of knowledge,
scientists and practitioners should, for example, foster respectable professional
relationships (Fothergill, 2000) and collaborate on research projects at an early stage
(Pielke, 1997).
Collaboration and use of scientific knowledge can be improved if scientists and
practitioners understand and appreciate each other’s role (Fothergill, 2000). Lack of
collaboration or poor use of scientific knowledge may, in part, stem from limited access
to information or lack of relevant scientific expertise (Morss et al., 2005) or cultural
differences (Fothergill, 2000). Examples of barriers include the use of scientific jargon,
lack of understanding by scientists of local policy issues, institutional barriers (e.g.
government rules and regulations), and academic pressure to publish in peer-reviewed
journals. Some scholars have suggested that these problems can be overcome by using
science translators or interpreters as intermediaries between researchers and policy
makers (Fothergill, 2000; Morss et al., 2005).
Interviews of U.S. practitioners by Fothergill (2000) reveal similar concerns. Local
practitioners stated that relevant scientific knowledge is not reaching them because it is
not transferred from the federal or state level to the local level, and because researchers
are not disseminating their findings in an appropriate manner to be of value to decision-
makers (e.g. workshops are held in large cities distant from the affected community).
Additionally, a local practitioner interviewed by Fothergill (2000) stated that “the ones
that have the authority and the resources to actually implement mitigation...” (Fothergill,
2000, p. 96) are not included in the knowledge transfer process. And finally, many
researchers do not understand the local context and the obstacles decision-makers face.

100
Fostering the transfer and utilization of scientific knowledge
It is generally acknowledged that scientific knowledge about natural hazards is
widely and readily available (e.g. White et al., 2001; UN/ISDR, 2004; Intergovernmental
Panel on Climate Change 2007, 2013), but this availability has not led to more resilient
and sustainable communities. Some of the barriers to the use of scientific knowledge are
discussed above. Recently, however, several initiatives have been taken to facilitate the
transfer and use of scientific knowledge by communities trying to adapt to climate
change and altered incidences of natural hazards. l briefly discuss two Canadian
examples below.
At the federal level, Lemmen et al. (2008) summarize current scientific
understanding of the impacts of climate change on Canadian provinces and territories.
They also discuss the effects of climate change on Canadians and the degree to which
communities have adapted to the change to date. The authors conclude that some
adaptation is occurring in Canada, but that large differences exist between regions and
populations. They stress the need to implement adaptation measures now, even with
limitations in awareness and availability of knowledge.
The second initiative addresses the impacts climate change on the Canadian
Columbia River Basin (Columbia River Trust, 2012). The report highlights the
importance of continued communication between individuals, communities, businesses,
and governments. It also provides up-to-date scientific information and a range of
adaptation strategies to facilitate better decisions and thus create more resilient and
sustainable communities.
4.2.2. Interviews
I conducted semi-structured interviews with local hazard or emergency managers
in Lillooet River valley to assess the process of knowledge transfer in relation to natural
hazards and the experience of local government decision-makers with this process.
Interviewees were selected based on contacts I established in the earlier, information-
gathering phase of my research. The contacts included employees of the Pemberton
Valley Dyking District, the Squamish Lillooet Regional District, and the Village of
Pemberton.

101
Only three people employed in local or regional government in Lillooet River
valley participated in this study, which is attributable to the limited number of people who
have relevant government positions. Other officials in the community handle floods and
other natural disasters in a reactive manner (e.g., the local fire chief, other emergency
responders, and volunteers). In contrast, the three interviewees are concerned with
proactive natural hazard management and are involved in drafting and implementing
flood policies at the local level. I contacted two other persons to participate in this study,
including a representative of the Lil’wat First Nations community, but they did not
respond to my repeated requests. This thesis focuses on flood hazard in Lillooet River
valley, and I made no attempt to compare my results to the experience of other local
government officials in British Columbia; to my knowledge, no such data are available. It
would, nevertheless, be of interest to learn if other municipalities struggle with similar
issues as those raised by officials in Lillooet River valley. Such a comparison would, of
course, provide better insight into the consequences of the transfer of flood management
responsibility from the provincial to the local government level, but this was not the aim
of this study.
Interview questions pertain to flood hazards and risk, but, where appropriate, I
also discussed natural hazards more generally with the interviewees. Each interview
was approximately 60-90 minutes long and took place in Pemberton, or over the phone,
in September 2012. Each interviewee received a censored version of the questions prior
to the interview in order to give them a better idea of my goal and to allow him or her
time to prepare. To assure anonymity, each participant will be referred to as
‘interviewee’, ‘participant’, or ‘respondent’, followed by a number, in the results and
discussion below.
4.2.3. Research question and interview questions
My research question and the related interview questions involve the terms
‘scientific information’ and ‘scientific knowledge’, which will be used interchangeably.
Scientific information is information published in peer-reviewed scientific journals,
government publications, or commercial reports, or otherwise conveyed by scientists to
local stakeholders. In the context of this paper, scientific information pertains to flood or
hazard management in Lillooet River valley. The focus of this study is on the transfer of

102
knowledge between academic researchers and local practitioners, and the use of this
information by the latter group. Several recent studies pertaining to flood management in
Lillooet River valley have been commissioned by the provincial government and
conducted by consultancy companies; these too are included in my literature review, but
I did not address them specifically during the interviews.
The research question underpinning this study is: How do new scientific
knowledge and technological developments contribute to or impede local flood
management in Lillooet River valley? To address this question, I posed interview
questions under three subheadings. The questions arose from a literature review of
science–society studies, developments in Canadian flood policy, and publically available
earth science literature pertaining to Lillooet River valley. Below is an overview of the
three subheadings (Appendix G lists all of the questions):
1. New scientific knowledge and government flood guidelines are available, but societal changes and demands (e.g. population and infrastructure growth) are challenging or restricting the effective use of this knowledge (c.f. White et al., 2001).
2. New scientific knowledge is available and the local flood manager is aware of it, but does not have the time or resources to study or use the information.
3. New scientific knowledge is available, but the information has no practical value to the local flood manager. New scientific knowledge and technological developments are essentially imposed by researchers on local policy makers (a top-down approach), but this new information does not reflect the needs of the local community.
4.3. Study area
4.3.1. Physical setting
Lillooet River valley is located in the southern Coast Mountains of British
Columbia approximately 160 km north of Vancouver (Figure 4.2). The village of
Pemberton and the First Nations community of Mount Currie are the major centres of
population in the valley. Both communities are located on the valley floor at
approximately 200 m above sea level (asl) and provide spectacular views of the
surrounding mountains, with peaks up to about 2500 m asl. Lillooet River valley is flat-

103
floored, 1.5-2.5 km wide in its lower reaches, and is bordered by steep rock slopes. The
principal tributaries of Lillooet River are Green River, Ryan River, Birkenhead River,
Rutherford Creek, and Meager Creek. Lillooet River discharges into Lillooet Lake just
below the mouth of Birkenhead River. Lillooet Lake is 22 km long, up to 137 m deep,
and has an area of about 20.5 km2 (Desloges & Gilbert, 1994).
Figure 4.2. Map of the study area (adapted from Google Earth).
The Mount Meager Volcanic Complex, which comprises lava flows and
pyroclastic rocks of mainly Plio-Pleistocene age, is located 65 km northwest of
Pemberton, just beyond the Meager Creek – Lillooet River confluence. The volcanic
massif has been deeply eroded by streams and glaciers, and many of its slopes are

104
formed of unstable, hydrothermally altered volcanic rocks. Landslides are common on
these steep slopes (Friele et al., 2008). The volcano last erupted about 2350 years ago
(Clague et al., 1995), producing a pyroclastic flow and an ash fall deposit that has been
found as far east as the Rocky Mountains of Alberta (Nasmith et al., 1967).
4.3.2. Settlement history
Mount Currie First Nations reserve
The First Nations community of Mount Currie is the centre of the Lil’wat nation.
Teit (1912) documented many stories that tell of the history and traditions of the Lil’wat
people in Lillooet River valley, dating back to long before the arrival of the first settlers of
European descent. One of these stories, ‘The flood, and distribution of people’ (Teit,
1912) describes a time when all Lil’wat people were living together around Green Lake
near Whistler, when a long period of continuous rain caused the rivers to flood:
“…A man called Ntci´nemkîn had a very large canoe, in which he took refuge with his family. The other people ascended the mountains for safety; but soon the water covered them too. ….. they begged Ntci´nemkîn to save their children […] Ntci´nemkîn took one child from each family, - a male from one, a female from the next, and so on.…. The canoe drifted about until the waters receded, and it grounded on Smîmelc Mountain. Each stage of the water’s sinking left marks on the sides of this mountain.1 When the ground was dry again, the people settled just opposite the present site of Pemberton. …. he made the young people marry one another. He sent out pairs to settle at all the good food-places through the country. Some were sent back to Green Lake and Green River; others were sent down to Little Lillooet Lake and along the Lower Lillooet River; some were sent up to Anderson and Seaton Lakes.” (Teit, 1912, p. 342)
Since the first settlers of European descent arrived around 1827 (Decker et al.,
1977), the Lil’wat people have strongly opposed the use of their land by the Government
of British Columbia. In 1911 the Lil’wat nation signed the Lillooet Declaration at Spence’s
Bridge, in which they claimed the rights to their traditional lands and denied the
Government of British Columbia the title and use of the land (Lil'wat Nation, 2010a).
1 “This mountain is just opposite Pemberton Meadows, to the northeast, and is rather low and
flat. It has a number of flat terraces on its sides (one above the other), which are said to be the marks of the receding flood.” (Teit, 1912, p. 342)

105
The Traditional Territory of the Lil’wat people covers approximately 780,000 ha
and extends well beyond the Lillooet River valley. Since the arrival of settlers in the area,
the Lil’wat people have been confined to reservations, in total occupying only 3000 ha,
or about 0.4% of the land they claim (Lil'wat Nation, 2010b). Mount Currie is the
administrative seat of the Lil’wat Nation (Village of Pemberton, 2010a) and has the fourth
largest Native reserve population in British Columbia (Lil'wat Nation, 2010b). At present,
918 people reside in Mount Currie (Mount Currie 6 reserve; BCStats, 2012a), and the
total population has increased by 14.9% since the last published census in 2006.
Village of Pemberton
The first European settlers were employees of Hudson’s Bay Company, looking
for routes to link the Canadian interior to the coast. In 1858, Port Pemberton was
established near the north end of Lillooet Lake to provide services to fur traders and gold
miners. Port Pemberton, which was initially one log house, was named after Joseph
Despard Pemberton, Surveyor-General of Vancouver Island (Decker et al., 1977). Soon
thereafter, farmers started to settle the flat meadows north of Lillooet Lake. By the early
1880s, most people had left Port Pemberton and moved to the present locations of
Pemberton and Pemberton Meadows (Village of Pemberton, 2010a). Forestry and
agriculture, principally potatoes, have long been the main drivers of the local economy,
but more recently tourism and its related services have become an important source of
income for residents (Village of Pemberton, 2010a).
Census records for Pemberton extend back to 1961, when the population was
181 (BCStats, 2012b). The late 1960s and early 1970s record a slight decline in
population, followed by marked increases since then, paralleling the growth of the ski
resort of Whistler, 30 km to the south (Table 4.1). In 2006, Pemberton was declared the
fastest growing community in British Columbia, with a rate of growth over the preceding
five years of 33.5% (BCStats, 2012c). By 2011, however, the growth rate had decreased
to 8.1%. Currently about 2400 people reside in the village (BCStats, 2012a).

106
Table 4.1. Census statistics for Pemberton and Mount Currie (BCStats, 2012b).
Census year Pemberton Mount Currie
2011 2369 918
2006 2192 799
2001 1637 704
1996 855 -
1991 502 -
1986 346 -
1981 282 -
1976 254 -
1971 157 -
1966 172 -
1961 181 -
4.3.3. Flooding in Lillooet River valley
Causes of flooding
Climate data are available for several sites near Pemberton and extend back to
1908 (Environment Canada, 2011). At present, however, there is only one
meteorological station in the valley, at Pemberton Airport (station number 1086082); it
has been in operation since 1984. Weather in Pemberton is typical of that of the coastal
Pacific Northwest, a climatic region that extends from Oregon north to Alaska (Melone,
1985). Mean temperatures at Pemberton range from below 0°C during the winter months
to almost 20°C in July and August. Average monthly precipitation ranges from 113 to
145 mm between November and January, but is considerably lower during the summer
months, with a minimum monthly average of 33 mm in August (Figure 4.3).
Floods in mid-size and large watersheds in coastal British Columbia are of two
general types (Melone, 1985): snowmelt or freshet floods in spring or early summer; and
fall or winter floods during periods of torrential rain or rain-on-snow. Snowmelt floods
typically occur on the main stem of major rivers (Melone, 1985). An example is the
Fraser River flood in May and June 1948 (Clague & Turner, 2003), when unusually hot
weather in spring melted an extraordinarily thick mountain snowpack. Some rivers,
including Lillooet River, experience both types of floods (Melone, 1985).

107
The mean annual discharge of Lillooet River is 126 m3 s-1. The river typically
experiences a peak discharge of 400-600 m3 s-1 in June during spring snow melt and a
comparable peak discharge related to snow and glacier ice melt in July or August
(Gilbert et al., 2006). During some years, peak flows in the fall due to rain-on-snow
precipitation are considerably larger than spring-summer peak discharges (Table 4.2;
see Appendix E for details). The flood in October 2003 had the highest discharge of the
period of record (1370 m3 s-1).
Figure 4.3. Mean temperature and mean precipitation at Pemberton Airport, 1984-2011 (Environment Canada, 2011).
Lillooet River can also flood if a large landslide blocks one of its tributaries. For
example, the Mount Meager landslide in August 2010 created a landslide dam on
Meager Creek (Roche et al., 2011; Guthrie et al., 2012). The lake that formed behind the
dam threatened to catastrophically drain, prompting the temporarily evacuation of
Pemberton. Similarly, a debris flow at Capricorn Creek formed a landslide dam on
Meager Creek in July 1998 (Bovis & Jakob, 2000). In both cases the landslide-dammed
lakes drained sufficiently slowly that flooding was averted. Figure 4.4 shows typical
hydrographs for Lillooet River for each type of flood (torrential rain or rain-on-snow,
freshet, and dam breaching).

108
Table 4.2. Summary of important historical hydrological events in Lillooet River valley.
Year Date Discharge1 Type of event Damaging flooding?
2010 September 28 674 Torrential rain No
2010 August 6 282 Secondary2 No
2003 October 18 1370 Rain on snow Yes
1992 October 24 808 Torrential rain Yes
1991 August 30 1260 Torrential rain Yes
1990 November 12 591 Rain (on snow?) Yes
1984 October 8 1110 Rain on snow Yes
1981 November 1 823 Rain on Snow Probably
1980 December 27 790 Rain on snow Yes
1975 November 5 782 Rain on snow Probably
1968 June 27 790 Freshet Not sure
1957 September 6 716 Torrential rain Yes
1940 October 19 900 Rain on snow Yes
1937 October 28 510 Rain (on snow?) Not sure
1931 October 1 462 Secondary3 Probably not
1921 October 28 - Rain (on snow?) Not sure
1906 September - Torrential rain Possibly
1 Maximum daily discharge (m3 s-1). 2 Flood threat in Lillooet River valley due to landslide blockage of Meager Creek. 3 A landslide originating from Pylon Peak caused a flood on Lillooet River (Carter, 1932).
River training
Kerr Wood Leidal Associates Ltd. (2002) provide a comprehensive overview of
engineering studies and works done in Lillooet River valley north of Lillooet Lake
between 1946 and 2002. What follows is a summary of that overview. After the 1940
flood, measures were taken to reclaim and protect agricultural land in the valley.
Between 1946 and 1952, 14 km of river meanders were cut off and 38 km of dykes were
constructed, which led to a shortening of the main river channel by 5.5 km. Additionally,
the level of Lillooet Lake was lowered 2.5 m to provide a steeper gradient for Lillooet
River and greater conveyance of flood waters. After 1953, additional dykes were
constructed and banks armoured by the Pemberton Valley Dyking District and local
landowners (e.g. 1670 m of dykes along Miller Creek). These measures were taken to

109
protect communities from a 1-in-50 year flood. After the December 1980 flood, dykes
were raised about 0.15 m. Dykes and rip-rap armouring have been further upgraded and
maintained during the past two decades.
The 1940, 2003, and 2010 floods
Pre-engineering: The flood of October 17-20, 1940
In 1940, the dykes in Lillooet River valley were small and inadequate for flood protection
(Decker et al., 1977). In October 1940, following early autumn snow, heavy warm rains
produced the fourth largest peak discharge of record on Lillooet River (Table 4.2;
Appendix E). Decker et al. (1977) provide a rich narrative account of the events and
personal distress in the valley during the flood. Almost the entire potato harvest, the
main crop in the valley, was lost and many homes, farms, and machinery were
destroyed. Government support after the flood was limited, consisting mainly of potato
seeds for the following year’s growing season. After the flood, the local Board of Trade
formed The Pemberton Drainage and Reclamation Committee. Supported by the
Farmer’s Institute, this committee prepared a brief recommending dyking and river
straightening to prevent a recurrence of the 1940 flood (Decker et al., 1977).
Post-engineering: The flood of October 16-22, 2003
Several floods have occurred in the valley since the engineering works were
completed in 1946. The river dykes were breached in 1984 during the third largest flood
of record (Scanlon et al., 1985) and again in 2003.
In October 2003, a warm front brought intense rainfall to coastal British Columbia
(Blais-Stevens & Septer, 2008). Four days of rain-on-snow led to the highest recorded
peak discharge of Lillooet River (1370 m3 s-1; Table 4.2; Appendix E). Gilbert et al.
(2006) provide a detailed meteorological description of the event. About 100 m of dykes
along Miller Creek and 200 m of dykes along Ryan River were breached, causing
extensive flooding in Pemberton and Mount Currie (Village of Pemberton, 2010b). The
highway bridge and rail bridge connecting Pemberton to Whistler and Vancouver were
washed out, and landslides blocked the highway between Mount Currie and Lillooet,
isolating residents in the valley from the rest of the province for several days (Blais-
Stevens & Septer, 2008). The runway at Pemberton Airport was submerged, thus

110
transportation in and out of the valley was only possible by helicopter. Approximately
260 residents of Pemberton (The Vancouver Sun, 2003) and 500 people in Mount Currie
(Blais-Stevens & Septer, 2008) were evacuated. Five people were killed when their
vehicles plummeted into Rutherford Creek after the bridge washed out. The flood also
affected Whistler and Squamish. Damage estimates range from $20 to 30 million (Blais-
Stevens & Septer, 2008).
August 6, 2010, Mount Meager landslide and flood
At 03.30 am on August 6, 2010, part of the southern peak of Mount Meager
collapsed. The landslide ran down Capricorn Creek and lowermost Meager Creek into
Lillooet River valley. The landslide debris dammed Meager Creek (Roche et al., 2011;
Guthrie et al., 2012), and temporarily stemmed the flow of Lillooet River. The river
quickly cut through the blockage in Lillooet Valley, but the landslide dam remained in the
valley of Meager Creek at the mouth of Capricorn Creek, and a lake began to form
behind it. There was immediate concern in Pemberton and Mount Currie that the dam
would overtop and fail catastrophically, causing flooding in the communities. Faced with
this threat, an evacuation order was issued to residents of Pemberton and Mount Currie.
About 19 hours after the landslide, the impounded waters in Meager Creek valley
overtopped the landslide dam and the lake drained. Although the flow on Lillooet River
increased considerably (Figure 4.4), there was no damaging flood.
4.4. Policy development and scientific publications
4.4.1. Government flood management
This section provides an overview of federal, provincial, and local government
policies and responsibilities pertaining to flood management in Canada. Additional
details are provided in Appendix H.

111
Figure 4.4. Typical hydrographs of Lillooet River. a. Freshet flood (1968). b. Rain-on-snow flood (2003). c. Secondary flood in response to 2010 landslide (inset at right shows an initial drop in the hydrograph (1) when the landslide blocked Meager Creek and Lillooet River, followed by a recovery in flow (2) as Lillooet River incised the landslide deposit, and finally (3) arrival of the flood wave after Meager Creek breached the landslide dam (adapted from Guthrie et al., 2012).

112
Federal and provincial policies and responsibilities
The Federal Constitution Act of 1867 assigns the primary responsibility for
natural resources, including water, to the provinces (Environment Canada, 1993). The
Federal Government, however, has jurisdiction over matters of national importance such
as fisheries, navigation, federal lands, and international relations. An example is the
water bodies that Canada shares with the United States (Environment Canada, 2012a).
Several federal acts and programs (Figure 4.5) are significant for flood management in
British Columbia, including the Canada Water Conservation Act (1953-1970), Canada
Water Act (1990-ongoing), Flood Damage Reduction Program (1975-1999), and Federal
Water Policy (1987; see Appendix H for references and more detail on each of these
acts and programs).
Flood management has historically been the responsibility of provincial
governments, and many acts and programs have been created to facilitate flood
management in British Columbia (Figure 4.5; Appendix H). In 2003, however, the British
Columbia Government enacted changes to the Local Government Act, as well as the
Flood Hazard Amendment Act, Land Title Act, Dyke Maintenance Act and Drainage,
Ditch and Dyke Act, devolving the primary responsibility for flood management to local
governments (Ministry of Environment, Water Stewardship Division, 2011). Several
provincial ministries, however, remain involved in flood management through programs
and legislation such as the Flood Protection Program and B.C. Flood Response Plan.
Local and regional government bylaws
Three local government bodies in Lillooet River valley are responsible for flood
management: the Village of Pemberton; the Lil’wat First Nation with its government seat
in Mount Currie; and the Pemberton Valley Dyking District (PVDD). One regional
government body, the Squamish Lillooet Regional District (SLRD), also has jurisdiction.
The Village of Pemberton (‘the Village’) is the largest population centre in the
valley (2369 residents. 2011 census; Table 4.1). The Village has an Official Community
Plan (OCP), the latest version of which was adopted as a bylaw in 2011 through the
Local Government Act (Village of Pemberton, 2011). Section 5.1 of the OCP discusses

113
growth of the Village; specific growth areas have been designated within village
boundaries. Section 5.10 of the OCP addresses the need to preserve and protect
Figure 4.5. Provincial and federal water policies.

114
the natural environment and to balance this requirement with community development,
needs, and interests. An example of a required balance is protection of riparian
environments for fish while providing flood control and mitigation. Development Permit
Areas, outlined in Section 7 of the OCP, are designated areas for which a development
permit is required before any subdivision of land, construction, or addition of buildings or
other structures, or alterations of buildings or lands can proceed. Development Area
Permit No. 2 (DPA#2; Section 7.2) defines lands that are subject to natural hazards and
aims to:
• “identify and protect people and buildings, structures and other development from natural hazardous conditions, notably flooding, unstable slopes and wildland fire”; and
• “mitigate or rehabilitate hazardous conditions where possible.” (Village of Pemberton, 2011)
Flood Construction Levels (FCLs) have been determined for Lillooet River and
are specified in a bylaw by the Village (Village of Pemberton, 2012b). Flood Construction
Levels “are used to keep living spaces and areas used for the storage of goods
damageable by floodwaters above flood levels” (Province of British Columbia, 2008, p.
2). Typically, a designated flood level (i.e. the 1-in-200 year flood) is used to determine
the elevation of the Flood Construction Level above the natural floodplain. All
development planned on lands that are prone to flood and debris flow hazards must be
supported by professional documentation that demonstrates the proposed development
is in accordance with Flood Construction Levels for Lillooet River and Pemberton Creek.
In the case of Pemberton Creek, the proposed development cannot be at risk from
debris flows that might travel down that creek (Village of Pemberton, 2011).
The Village is currently updating its 2006 emergency plan (Bettina Falloon,
Emergency Coordinator, Village of Pemberton, personal communication, 2012). The
objective of the 2006 plan is “… to demonstrate the Village of Pemberton’s ability to
respond to and recover from an emergency while maintaining its own ‘continuity of
government’ ” (Village of Pemberton, 2006). The plan outlines the procedures to be
followed in case of an emergency, and it outlines how the Village can cooperate with the
other government bodies in the valley to deal with an emergency.

115
The Lil’wat First Nation is intimately connected with the lands and waters in its
territory. The Land Use Plan of the Lil’wat Nation “… provides management direction to
sustain the plants, animals, and waters of this land, and the health of the Lil’wat
people…” (Lil'wat First Nation, 2006). The main aim of the Plan is to sustain the Lil’wat
culture and to preserve the health of Lil’wat lands by providing fundamental principles
and guidelines for cooperation with others who currently use the land (Lil'wat First
Nation, 2006). Section 6.1 of the Plan recognizes the flood hazard in the Lil’wat Nation
territory, but the Plan focuses more on the threat to the natural environment (e.g. natural
water courses, fish habitat, and water pollution) than the flood threat to the community.
Accordingly, the Plan does not provide guidelines for existing buildings or new
developments on the floodplain. The Lil’wat Nation has an Emergency Plan (Bettina
Falloon, Emergency Coordinator, Village of Pemberton, personal communication, 2012),
but I was unable to obtain a copy of it.
The Pemberton Valley Dyking District (PVDD) is a so-called “improvement
district”, “an autonomous local government body responsible for providing a service that
benefits the residents in a community” (Pemberton Valley Dyking District, 2012). It was
established by the British Columbia Government in 1947 and is responsible for
maintaining and upgrading the valley’s flood protection infrastructure within the
boundaries of the improvement district. Financing for works carried out by the PVDD
comes from taxes levied on the residents of the valley. PVDD works must comply with
the Dyke Maintenance Act, but the PVDD does not enact bylaws.
The Squamish Lillooet Regional District (SLRD), incorporated in 1968, is a
regional agency encompassing the municipalities of Squamish, Whistler, Pemberton,
and Lillooet. It offers regional, sub-regional, and local services, including land-use
planning, waste management, emergency preparedness, recreation, and transit, to
residents within its jurisdiction, in cooperation with the municipalities (Squamish Lillooet
Regional District, 2012). As a regional government, the SLRD may enact bylaws that
affect those living outside municipal boundaries, as governed by the Local Government
Act. The SLRD has the authority to act in emergencies, including floods. It issued an
Emergency Response and Recovery Plan in 2010 to establish the policies and
procedures to be followed in an emergency and to define the roles and responsibilities of

116
local governments and services, including fire departments, search and rescue groups,
and the B.C. Ambulance Service (Squamish Lillooet Regional District, 2010).
The Village of Pemberton, the Lil’ Wat First Nation, and the Squamish Lillooet
Regional District are jointly working on a Hazard and Vulnerability Analysis for Lillooet
River valley to support their emergency management programs (Village of Pemberton,
2012a). A final report of this study was presented to the village Council on October 15,
2013 (Bettina Falloon, Emergency Coordinator, Village of Pemberton, personal
communication, 2013).
4.4.2. Basic and applied scientific research related to flooding
Much scientific research has been done on flooding and flood management in
Canada and is readily available to interested users. Much of this research deals with the
social, psychological, and economic aspects of flooding, but it is beyond the scope of
this study to discuss this literature. What follows are examples of different studies that
have been done on flooding and flood management in the Canadian context; they by no
means constitute a comprehensive catalogue.
Booth & Quinn (1995) discuss national flood programs and policies since 1970
when the Canada Water Act became law. They describe trends in funding of projects in
the 25 years following the passage of the Canadian Water Act. Similarly, Watt (1995)
discusses Canadian flood policy and management prior to, and leading up to, the
implementation of the Flood Damage Reduction Program (FDRP). He reviewed the
program over the period 1975-1995 and concludes that the program was successful “in
identifying urban flood risk areas across Canada and in redirecting flood-prone
development away from high-risk areas” (Watt, 1995, p. 1). However, he expresses
concern that “the federal government is in the process of abandoning the FDR Program
rather than taking its expected leadership role in the maintenance and continuance
phase of the Program” (p. 1).
De Loë (2000) and Shrubsole (2000) also describe floodplain management in
Canada. De Loë (2000) focuses on the impact of the Flood Damage Reduction Program,
which provided the national framework for floodplain management from 1975 to 1999.
Shrubsole (2000) comments that the Canadian flood management program, in general,

117
has been accompanied by increasing flood damage, losses, and vulnerability. Both
authors conclude that Canadian flood policy at the turn of the century was in need of
improvement, and that all levels of government, non-governmental organizations, and
the private sector must cooperate to reduce loss and vulnerability due to flooding. It
should be noted that the aforementioned studies were all published prior to the
devolvement of flood management from the provincial to local governments in 2003. I
have been unable to locate an assessment of current flood management by local
governments.
Haque (2000) similarly recognized that flood losses are increasing in Canada,
partly due to structural interventions to reduce flood hazard and increased human
encroachment onto floodplains. He discusses risk assessment, preparedness, and
response in relation to the Red River valley flood of 1997 and concludes that, aside from
structural control measures, barriers in inter-governmental communication, unwillingness
to implement regulations, and minimal public participation in the decision-making
process contributed to the 1997 flood disaster.
The objectives of much research on river flooding are to understand the natural
system (e.g. (changing) weather systems, the connection between the meteorological,
fluvial and lacustrine system, sediment transport), and (longer-term) consequences of
floods for society. Gilbert et al. (2006), for example, studied sedimentation in Lillooet
Lake after the 2003 flood of record, to study the signature of the sediments deposited in
Lillooet Lake, and to estimate the amount of sediment mobilized by the flood. An
understanding of extreme hydroclimatic events is important, because extreme floods can
have large impacts on sedimentation (e.g. sediment accumulation in river channels and
a subsequent reduction in freeboard of dykes), which in turn can increase flood risk.
Studies by Melone (1985) and Loukas et al. (2000) provide insights into flood-
generating mechanisms in British Columbia. They identify different hydroclimatic zones
in the province, in which floods are generated by rain or rain-on-snow in the fall or
winter, or by snowmelt in the spring and summer. The geomorphic implications of a
glacier outburst flood are discussed by Clague & Evans (1994). Outburst floods from
glacier- and landslide-dammed lakes are potential threats in many places in the southern
Coast Mountains, as illustrated by the 2010 Meager Creek landslide which blocked

118
Meager Creek and Lillooet River. These kinds of floods also mobilize large amounts of
sediment, which can alter river channels and inundate floodplains.
Paleoflood data are often used in flood frequency analysis, prediction, and
modeling. Hosking & Wallis (1986), for instance, assessed whether including a single
paleoflood estimate increases the accuracy of estimates of extreme floods, by using
various flood frequency distributions in computer simulations. They found that paleoflood
information is most useful when a certain kind of flood frequency distribution was used
(i.e. a three-parameter flood frequency distribution), for a single site with a short gauge
record.
The use of digital geographic data in flood prediction is illustrated by Chubey &
Hathout (2004). They used remotely sensed RADARSAT imagery within a geographical
information system (GIS) to estimate the magnitude and spatial extent of future Red
River floods in southern Manitoba.
Scientific publications
Carter (1932) was the first to comment on hazards in the Lillooet River
watershed. He described slope instability on the flank of Mount Meager and speculated
on the source of a landslide that produced a flood along Lillooet River in 1931.
Subsequent scientific research on flooding in Lillooet River valley (Table 4.3) has
focused on historic and prehistoric landslides from the Mount Meager massif (Stasiuk et
al., 1996; Friele & Clague, 2004, Holm et al., 2004; Friele et al., 2005, 2008; Simpson et
al., 2005; Hancock, 2011; Roche et al., 2011; Guthrie et al., 2012). These studies are
important because landslides into Meager Creek are responsible for the high flux of
sediment to Lillooet River and therefore channel aggradation and reduction of dyke
freeboard. Additionally, landslides from the Mount Meager massif have repeatedly
blocked Meager Creek and Lillooet River, creating the possibility that outburst floods
could inundate downstream communities. Only the more recent studies of landslides and
volcanic debris flows include a discussion of possible impacts of these hazardous events
on communities in the valley (Friele & Clague, 2004; Simpson et al., 2006; Friele et al.,
2008; Hancock, 2011; Roche et al., 2011; Guthrie et al., 2012).

119
Sedimentary processes in Lillooet River valley and sedimentation in Lillooet Lake
have been well studied (Gilbert, 1973, 1975; Jordan & Slaymaker, 1991; Desloges &
Gilbert, 1994; Friele et al., 2005; Gilbert et al., 2006), leading to increased understanding
of the transport and deposition of fluvial sediment during periods of high river flow.
Scanlon (1985) report on the effects of the 1984 Lillooet River flood on Pemberton, and
Blais-Stevens & Septer (2008) provide an historical summary of landslides and floods
along the Sea-to-Sky corridor.
Table 4.3. Peer-reviewed scientific publications and reports on natural hazards in Lillooet River valley and hazard management in British Columbia.
Category / Source
Subject Hazard implications?
Government studies and reports
Wester, 1967 Drainage problems near Pemberton
Nesbitt-Porter, 1985 Flood protection recommendations Lillooet River watershed Yes
Province of British Columbia, 1990 Floodplain designation of Lillooet River Yes
Ministry of Environment, Lands and Parks, Hydrology Branch, 1995
Review floodplain designation Yes
Scientific
Carter, 1932 Exploration Lillooet watershed
Gilbert, 1973 Sedimentation in Lillooet Lake
Gilbert, 1975 Sedimentation in Lillooet Lake
Scanlon et al., 1985 Narration of 1984 flooding event Yes
Jordan & Slaymaker, 1991 Sediment budget of Lillooet River
Desloges & Gilbert, 1994 Post-glacial sedimentary record of Lillooet Lake
Stasiuk et al., 1996 2400 BP eruption of Mount Meager
Friele & Clague, 2004 Holocene landslides of Pylon Peak Yes
Holm et al., 2004 Landslide response of alpine basins to glacial thinning and retreat Minimal
Friele et al., 2005 Impact of a Quaternary volcano on sedimentation in Lillooet Valley Yes
Gilbert et al., 2006 Sedimentary record of the 2003 flood in Lillooet Lake
Simpson et al., 2006 Catastrophic debris flows Pemberton valley Yes
Blais-Stevens & Septer, 2008 Historical overview natural hazards along Sea to Sky corridor Yes
Friele et al., 2008 Hazard analysis volcanic debris flows Yes
Roche et al., 2011 Mount Meager landslide of 2010 Yes

120
Category / Source
Subject Hazard implications?
Hancock, 2011 Geomorphic changes to Lillooet River due to Mount Meager landslide
Yes
Hensold, 2011 Slope deformation, Handcar Peak Minimal
Guthrie et al., 2012 Mount Meager landslide Yes
Consultancy reports
Kerr Wood Leidal Associates Ltd., 2002
Engineering study, Lillooet River corridor Yes
Kerr Wood Leidal Associates Ltd., 2007
Gravel management plan, Lillooet River Yes
Kerr Wood Leidal Associates Ltd., 2009
Ryan River hydraulic study Yes
Kerr Wood Leidal Associates Ltd., 2010
Lillooet Lake lowering analysis Yes
Kerr Wood Leidal Associates Ltd., 2011
Cross-section and bathymetric survey, Lillooet River Yes
Consultancy reports
Several consultancy reports prepared over the past decade have addressed
flood hazards in Lillooet River valley (Table 4.3). Kerr Wood Leidal Associates Ltd.
(2002) recommend a Lillooet River gravel management plan and additional flood
protection improvements. They have made several recommendations to the Pemberton
Valley Dyking District and the Lil’wat Nation to reduce flood risk. This company also
prepared several other reports that bear on the flood hazard in Lillooet Valley, including
a gravel management plan for Lillooet River (2007), an assessment of the channel
capacity and the adequacy of dyking along Ryan River (2009), an analysis of the
possible lowering of Lillooet Lake (2010), and a channel cross-section survey of Lillooet
River following the Meager Creek landslide in 2010 (2011).
Government publications
Several government reports on the flood hazard in Lillooet River valley are also
available (Table 4.3). They deal with drainage problems near Pemberton (Wester, 1967),
flood protection recommendations for Lillooet River valley in the wake of the 1984 flood
(Nesbitt-Porter, 1985), floodplain designation (i.e. areas highly susceptible to flooding

121
are marked as designated floodplains) under the federal-provincial Flood Damage
Reduction Program (Province of British Columbia, 2011a), and a review of the 1990
floodplain designation (Ministry of Environment, Lands and Parks, Hydrology Branch,
1995).
4.4.3. Advances in data collection
Climate and hydrologic information for the Lillooet River watershed can help
public authorities with the responsibility for dealing with flood hazards. The discharge of
Lillooet River has been measured almost continuously since 1914 (station number
08MG005) and is one of the longest hydrologic records in southwestern British Columbia
(Environment Canada, 2010). The gauge was operated manually from 1914 until 1947.
Since 1948, except for the period 1956-1959, discharge was automatically measured.
Climate data (precipitation and temperature) have been collected at different
sites in Lillooet Valley since 1908. The current climate station in the valley (1086082) is
located at Pemberton Airport and has been in operation since 1984 (Environment
Canada, 2011).
The River Forecast Centre of the Ministry of Forests, Lands and Natural
Resource Operations (Province of British Columbia, 2011b) collects snowpack data,
which are analysed together with meteorological and streamflow data to issue flood
warnings and forecasts for rivers in British Columbia. The thickness and distribution of
the snowpack are required to forecast the possibility of spring or ‘freshet’ flooding in
snowmelt-dominated watersheds. Flood alerts, which indicate the potential for elevated
spring runoff, are typically issued from February to May (David Campbell, River Forecast
Centre, personal communication, 2012). The River Forecast Centre has collected data
since 1935, and in the upper Lillooet River valley snowpack measurements have been
made since 1953 (Province of British Columbia, 2011b). A flood alert has never been
issued for the Lillooet River watershed, which is not a snowmelt-dominated watershed,
and even when there are large snowpacks, spring flows on Lillooet River are typically
not dangerous (David Campbell, River Forecast Centre, personal communication, 2012).

122
4.5. Community interviews
Before providing detailed results of the interviews, I briefly discuss the types of
scientific information available to the respondents. I did not ask the respondents for their
definition of scientific information, nor did I provide them with a list of scientific
knowledge relevant to this study (i.e., Table 4.3), therefore the concept is broad. The
respondents mainly thought of scientific information as that found within scientific peer-
reviewed articles, although some also mentioned more applied publications, for example
floodplain designation maps published by the provincial government and reports dealing
with flood construction levels. Personal contact with experts was not specifically
mentioned as a source of scientific information by the respondents, but this method of
knowledge transfer was mentioned in response to some of the interview questions
(Appendix G). Although the interview questions were framed to discuss scientific
information, the respondents repeatedly mentioned the importance of anecdotal
information in relation to flood and natural hazard management (Section 4.4).
All respondents were asked the same questions about the role of scientific
knowledge and technology in flood management in Lillooet River valley, but their
responses reflect different perspectives on the role and use of scientific information. In
the sections that follow, I first discuss the respondents’ responsibilities and then
summarize their views on scientific information. In the discussion, I review the results in
more depth and compare my findings to previous research on knowledge transfer
between scientists and practitioners.
4.5.1. Respondent 1: Capacity of local government
The first respondent has been working as the emergency program coordinator for
the Village of Pemberton one day a week for the past two years. Natural hazard-related
issues occupy about 30 to 40% of the respondent’s allocated time (about 3 hours) as the
emergency program coordinator, but she spends very little of that time gathering,
reading, analysing, or using scientific publications.
The respondent commented that scientific knowledge needed for flood
management is generally available and is adequate for understanding the Lillooet River
123
flood hazard. She thinks this knowledge is well documented and that natural hazards are
adequately monitored. For several reasons, however, she rarely uses scientific
publications in her daily work. First, the respondent finds scientific publications mostly
irrelevant to her work. Second, she comments that it takes too much time find relevant
articles, because she does not have access to scientific databases. Third, she finds
most scientific publications too technical or too detailed.
The respondent’s minimal use of scientific publications seems to be related to the
limited resources of the local government. She states: “The village is too small to have
the knowledge in the house, as such the Village usually hires consultants or subject
matter experts on a need-to-know basis.” As the Village has limited knowledge ‘in the
house’, it assumes that the experts or consultants they hire are familiar with the relevant
scientific literature.
Another aspect of the limited capacity of the Village emerged when I asked the
respondent what kind of scientific knowledge is needed for flood management in Lillooet
River valley. She responded that more information is needed to forecast or predict
floods. She mentioned that the Village, in a joint effort with the other local governments,
made a request to the Provincial Government for a stream gauge to be installed on the
Forestry Bridge above Pemberton Meadows to monitor sudden changes in Lillooet River
water level. However, the government has not yet responded, which she believes stems
from a lack of provincial programs that might fund such a request. The respondent also
is of the opinion that available scientific knowledge is currently not well utilized due to
similar financial constraints. She thinks that available scientific knowledge and
technology are sufficient to improve the 1990 floodplain maps and flood estimates that
the Village currently uses, but that the Village does not have the money to update the
maps. A lack of resources for flood management was also mentioned by the second
respondent, who commented that flood management issues lack priority at higher levels
of government, especially during the recent era of government cut-backs.
4.5.2. Respondent 2: Application and relevance of scientific knowledge
The second respondent is the emergency program manager for the Squamish
Lillooet Regional District (SLRD), a position he has had for about three years. His daily
124
work and responsibilities involve “ensuring the level of emergency preparedness for the
SLRD, for all hazards.” During his normal work week (35 hours), he spends about 40%
of his time (14 hours) on natural hazard-related issues, which involve activities such as
planning, responding, lobbying, and researching. His goal is to spend about 3-5% of this
time, or less than one hour per week, reading scientific publications, but other, more
pressing demands on his time take precedent over this activity.
The respondent thinks that scientific knowledge needed for flood management in
Lillooet River valley is readily available, and he uses that information to a degree in his
work. As a practitioner, and with an education in emergency management, he distills
information from scientific publications to the limit of his ability and uses the information.
According to the respondent, scientific knowledge has been well utilized “as far
as understanding the hazards and the potential impacts, but not so much for driving
change.” He states “We have a better idea of the consequences of some of the works
that have been done in the river system, and [only] an emerging idea of future
consequences.” He further feels that scientific knowledge pertinent to development
within the valley is not “getting through”, and several permits have been issued for multi-
million dollar facilities that are vulnerable to flooding.
Although the respondent is familiar with the current body of scientific literature on
Lillooet River valley, he comments that his ability to use the information is limited.
Research topics of interest to the respondent and that would help him in his daily work
include the relation between natural hazards and the human and built environment. He is
particularly interested in “research that can guide us in adapting or creating new land
use plans, so that we can diminish the impact that the river might have over time.” In a
similarly vein, the third respondent states, “We also need to consider the habitat and the
environment. And as the population grows, we really need to be aware we are in a
floodplain.”
According to the respondent, the lack of applicability and relevance of scientific
knowledge is reflected in poor communication between scientists and practitioners. For
example, in the case of the 2010 Mount Meager landslide and the ensuing flood threat,
the scientists involved seemed to be mainly interested in reporting the possible

125
sequence of events, while the respondent, in his position as emergency manager,
needed ‘yes or no’ answers to effectively warn the downstream communities. The
difference in priorities or perspectives of scientists and practitioners was also mentioned
by the third respondent. According to the second respondent, scientific knowledge and
expertise would be more useful to him if scientists would check the assumptions he
makes as an emergency manager in planning, mitigating, or responding to natural
hazards or disasters.
4.5.3. Respondent 3: Communication of scientific knowledge
The third respondent has worked as manager of public works and capital projects
for the Village of Pemberton for about one year. During the previous six years, he was
employed at the Pemberton Valley Dyking District as the operations and maintenance
manager. He is responsible for water, roads, sewers, and parks. The respondent spends
about five hours per week on natural hazard-related issues. He does not have time to
stay up-to-date with scientific information, but he would make time if relevant articles
came to his attention.
The respondent believes that scientific information for flood management in
Lillooet River valley is readily available, and he understands the information that is
presented in scientific publications. He finds scientific publications important in his work,
for example to better understand the flood hazard and its implications for Flood
Construction Levels. Furthermore, he believes that scientific knowledge is useful and
needed for activities such as planning, development, and emergency management, and
he needs scientific information when applying for funding. Although the respondent is
familiar and comfortable with scientific knowledge about Lillooet River valley, he
expressed concern about the communication of knowledge. He states, “There is a
disconnect with getting the information to the community… [as] information is a bit hard
to get by.”
Most scientists with whom the respondent has worked have a very good
understanding of the area, and verbal communication and transfer of knowledge have
been relatively easy, despite differences in perspectives between himself and the

126
scientists. The other two respondents also commented positively on their contact with
scientists and experts, especially in the case of the 2010 Mount Meager landslide.
Although local practitioners interact well with scientists and experts, the transfer
of information through reports and publications can be improved according to the third
respondent. For example, he mentions that the presentation style is in need of
improvement. He comments, in reference to an unsolicited study he received that
included some bold statements about flooding in the valley: “It [scientific knowledge]
should be presented in a way that considers the community and not in a ‘doom or gloom’
kind of way of how the valley will be inundated.” He adds “Hazards are everywhere and
we [local practitioners and the community] are aware of them, people can always make
a big deal out of everything.” Similarly, commenting on a newspaper article that stated
that local practitioners did not take into account recommendations for flood management
made in a recent scientific publication, the respondent says, “The publication was
dropped on the desk of the SLRD and was very descriptive in words. It was just not very
well presented… we were aware of the situation…They [the authors] make their
recommendations, but they did not take into account how much money it costs to deal
with the risk.”
When asked about collaboration between scientists and practitioners, the
respondent replied that most scientists will at least contact the local stakeholders when
gathering information. Interestingly, the other two respondents stated that scientists do
not always make themselves known to local stakeholders when conducting their
research.
4.5.4. Other comments from the respondents
The respondents made several comments that, although related to the topics
discussed in the previous sections, are worthy of mentioning separately. First, although
all the respondents agree that scientific information is readily available, respondent 2
suggests that a centralized repository with information from all different sources would
be useful. As an emergency program manager, he collects information from many
different sources, and a centralized data repository would make it easier for him to find
relevant scientific information. Similarly, respondent 1 comments that she would make

127
more use of scientific studies if she knew that “the information is out there, and also
knowing when scientists are working in the area.” She thinks scientific knowledge should
be publically accessible and thinks Emergency Management British Columbia (EMBC)
should collect and archive that knowledge.
Second, anecdotal information on natural hazards is regarded as important by all
three respondents. As respondent 3 states: “The scientific perspective does not account
for all variables.” He adds that minor changes in the river on a daily basis may not be
detected by scientific studies. Although he concedes that anecdotal information may not
be reliable, he stresses the importance of documenting this historical perspective before
long-term local residents leave the valley or pass away. Similarly, the second
respondent says: “Science is the basis for planning, responding and mitigation in Lillooet
River valley. A lot of knowledge has been gathered in Lillooet River valley over the
years, including anecdotal evidence or experience with natural hazards. This anecdotal
evidence gives the texture to the scientific basis.” To date, this historic information has
not been systematically documented.
Finally, respondent 3 thinks that scientific knowledge sometimes “even gets in
the way.” He explains that when constructing dykes or other types of flood protection,
local practitioners have to “abide by some very stringent rules, which we can’t always
financially afford”. He adds, “I understand the need for scientific research, but it
sometimes makes it harder and more expensive, and as a consequence may stall the
works that need to be done”.
4.6. Discussion
Returning to Bush (1945) and the Pasteur’s quadrant (Stokes, 1995, 1997), it can
be argued that the first published hazard study in the Lillooet River watershed, by Carter
(1932), could be classified as ‘pure basic research’, because he had no other motive
than to explore and map the Lillooet River watershed. More recent peer-reviewed earth
science publications mention the implications or practical importance of research for
communities in a few sentences or, at most, a couple of paragraphs. In terms of
Pasteur’s quadrant (Figure 4.1), these studies can be categorized as ‘use-inspired basic

128
research’. Provincial government publications and reports mainly provide practical
recommendations for dealing with the flood problem (e.g. Flood Designation Map of
1990). The first consultancy reports, commissioned by the local government (i.e. PVDD),
appear at the beginning of the twenty-first century, coincident with the transfer of
responsibility for flood management from the provincial government to local
governments. Although one may question whether government and consultancy reports
qualify as scientific publications, they can be categorized as ‘pure applied research’ in
Pasteur’s quadrant, because their sole purpose is to provide solutions to a practical
problem.
The devolution of responsibility for flood management from the Province of
British Columbia to local governments had much larger implications than the source of
reports or publications. It is evident from examples provided by the interviewees that the
financial and human capacity of local governments in Lillooet River valley is limited and,
as a consequence, flood prevention or monitoring measures are delayed. Local
governments and communities are still dependent on the British Columbia Provincial
Government for funds to mitigate the flood hazard. Another consequence of the
‘rationed’ capacity of local governments is limited in-house scientific knowledge of
natural hazard science. This lack of in-house scientific knowledge may be related to
what the second respondent refers to as “a lack in driving change” in terms of planning
and issuing of permits to mitigate and prevent flooding. Information may be lost or not
well translated when a local government outsources projects that require scientific input.
The problem, however, could simply result from the limited financial capacity of the local
community to implement flood mitigation measures.
The time each respondent has been working in natural hazard-related jobs in
Lillooet River valley is limited, ranging from two to seven years. Limited on-the-job
experience could explain the lack of scientific knowledge or a limited ability to acquire
and understand it. Likewise, two of the three respondents have multiple responsibilities
in their current positions and thus are unable to solely focus on floodplain management.
The Pemberton Valley Dyking District and Squamish Lillooet Regional District
have limited financial and human capital for dealing with flood hazards, but they do have
in-house scientific knowledge and their employees appear to be up-to-date with current

129
scientific publications. The PVDD has an archive of over 70 years of papers and reports
related to flooding in Lillooet River valley, and several technical reports are publically
available on their website (Pemberton Valley Dying District, 2012). Nevertheless, both
emergency managers interviewed for this study mentioned that a centralized repository
of knowledge would be useful. I was unable to resolve whether there is a disconnect in
communication and information sharing among the three respondents or whether the
emergency managers are seeking a different type of information, notably more
interdisciplinary research that explicitly meets the needs of emergency managers or
community planners. Because the community is small and the respondents know each
other, the latter is more likely.
As is evident from Table 4.3, scientific research has evolved from studies that
focus mainly on geologic processes (e.g. Carter, 1932; Gilbert, 1975; Jordan &
Slaymaker, 1991), to studies concerned with the impact of geologic events on
communities in the valley (e.g. Friele et al., 2008; Roche et al., 2011). The latter studies
provide communities with estimates or risk or discuss technologies or other options that
can be used to mitigate flood or landslide risks (e.g. Friele et al., 2008). However, these
options are not viewed as practical by hazard managers in the valley because of the
limited resources that are available. Thus, although the respondents agreed that useful
scientific information is available and that hazards in Lillooet River valley are relatively
well understood, this knowledge is only useful to them if it can be applied in the current
political, societal, and financial landscape.
The relevance of scientific publications is an important issue for the two
emergency managers I interviewed. They would welcome more interdisciplinary studies
in Lillooet River valley. Most research carried out in the valley has focused on natural
science – the occurrence of floods and landslides and sedimentation processes in
Lillooet River and Lillooet Lake, but there is a clear lack of interdisciplinary studies that
integrate the natural and social sciences and address potential impacts of floods on the
growing communities.
Better communication between scientists and practitioners is another recurring
theme in the respondents’ answers to the interview questions. Many other studies have
documented a disconnect in communication between scientists and decision-makers,

130
and have attributed the problem to a variety of issues, including cultural differences
between scientists and practitioners, access to data, and the relevance of research (e.g.
Fothergill, 2000; White et al., 2001; Ross et al., 2003; Morss et al., 2005; Holmes &
Clark, 2008). Strategies for improving the transfer of knowledge between scientists and
practitioners include collaboration across disciplines and professional fields (Fothergill,
2000), facilitators or a “middle persons” to stimulate collaboration (White et al., 2001;
Morss et al., 2005; Holmes & Clark, 2008), iterative feedback and consultation between
scientists and decision-makers to circumvent Bush’s linear model of knowledge transfer
(Pielke, 1997), and acknowledgement of each other’s culture and institutions (Fothergill,
2000).
Consultancy companies employed by local governments may serve a “middle
person” role. The Lillooet River Corridor report published by Kerr Wood Leidal
Associates Ltd. (2002) contained a brief summary of scientific research carried out in the
valley to that time. In the context of Pasteur’s quadrant, consultancy companies perform
mostly ‘pure applied research’ – their work is done to make suggestions and propose
solutions for flood management. In their role as “middle persons”, consultancy
companies might also identify areas that warrant further scientific research. In addition,
because the work of consultancies commonly is problem-oriented, they can more easily
point out the value and impact of scientific knowledge.
This study has provided insight into the daily practices and responsibilities of the
respondents and their use of scientific knowledge, but it was restricted in scope. There
might have been value in additionally assessing the perception and use of scientific
knowledge among a broader group of respondents. Anecdotal evidence, for example,
was mentioned many times during the interviews, and interviews with local farmers and
other residents in the valley might have provided insights into the value of such
evidence. Similarly, another perspective on the value and use of scientific knowledge
perhaps could have been obtained by interviewing construction workers or planners
dealing with Flood Construction Levels. Nevertheless, the intent of the study was to
determine if and how local decision-makers use scientific information and to better
understand the barriers that they face in incorporating it into planning and remediation.

131
4.7. Summary and conclusions
This chapter summarizes flood management in Lillooet River valley in the context
of settlement, natural hazards, the changing flood policy landscape at the federal,
provincial, and local government levels, and an overview of available scientific literature
on floods in the valley. Based on community interviews with local officials responsible for
emergency management, flood management, and public works and capital projects, I
evaluated the use and application of scientific knowledge in dealing with the flood hazard
in Lillooet River valley. The interviews revealed issues centered on science-society
relationships and communication and transfer of knowledge between scientists and
practitioners that are similar to those that have been found more widely by other
researchers.
Reconsidering the research question I posed at the beginning of the chapter –
How do new scientific knowledge and technological developments contribute to or
impede flood management at the local level? – I argue that new scientific knowledge has
contributed significantly to the understanding and awareness of flood hazard in Lillooet
River valley. Flood management is a high priority for the three respondents and their
respective institutions, and all agree that scientific information is fundamental to their
work and has had an impact on flood management.
With reference to the first subheading of my research question (i.e. societal
changes and demands are restricting effective use of scientific information), I conclude
that although scientific research is available, the limited resources of the local
government have stalled projects such as the installation of a discharge gauge on the
Forestry Bridge and the updating of floodplain designation maps. Similarly, as one of the
respondents noted, awareness and understanding of hazards have improved but are not
yet reflected in community response (e.g. infrastructure vulnerable to floods is still being
built).
With regard to the second subheading of my research question (i.e. the local
flood manager does not have time or resources to study or apply new scientific
knowledge), the three interviewees have limited time and resources to deal with floods
or natural hazards in general. As a consequence, at least one of the interviewees is not

132
fully aware of the available scientific information, and new knowledge is not used to its
full potential.
And finally, with regard to the third subheading of my research question (i.e.
scientific knowledge has no practical meaning and is often imposed on local policy
makers), the relevance of scientific knowledge is a major concern for the respondents.
While all interviewees agreed that research is not imposed on them, effective
communication of scientific knowledge is still a major obstacle for local practitioners.
Natural hazards in Lillooet River valley appear to be relatively well studied and
are a high priority for the three local and regional governments. Scientific literature and
consultancy reports focus on the flood hazard from a natural science perspective and
offer little information on societal implications. Technical reports commissioned by the
Pemberton Valley Dyking District provide technical information on the flood problem, but
like recent scientific publications, they typically end with engineering recommendations
to PVDD. They do not provide practical input on how these recommendations can be
implemented, leaving the communities in a difficult situation, given the limited resources
available and the community’s need to balance these measures against preservation of
fish habitats, community planning, finances, political or community will, aboriginal rights,
and private land rights. While natural science knowledge is available and appreciated,
local practitioners identify a need for new types of studies in Lillooet River valley, namely
studies that consider the implications of relevant natural science for community planning,
emergency management, and natural hazard preparation and mitigation. An opportunity
exists for earth science researchers and practitioners in Lillooet River valley to build on
the relationships they have already have established as a result of previous events,
notably the 2003 flood and 2010 landslide, and earlier research projects in the valley. A
significant contribution can be made by planners, communication specialists, and
educators to natural hazard problems in Lillooet River valley. They can provide an
important complementary perspective to that of natural scientists and can help translate
scientific information into flood policies and guidelines, guide community planning, and
build support in the community for a sustainable, hazard-resilient community.

133
5. The value of paleoflood research for flood hazard management
5.1. Introduction
This chapter provides insight into the value of traditional paleoflood research,
such as that described in Chapters 2 and 3, for flood hazard management. I start with a
discussion of historical changes in floodplain management and then review why people
still live on floodplains in spite of our current understanding of the hazard and risk. I then
discuss the role that flood frequency analysis plays in floodplain management and the
added value that paleoflood research can provide for such analysis in watersheds
lacking long discharge records. I conclude by reflecting on my observations and findings
(Chapters 2, 3, and 4), in light of recent changes in floodplain management and
developments in paleoflood research.
5.2. Changes in floodplain management
“Floods are ‘acts of God’, but flood losses are largely acts of man.” (White, 1945, p. 2)
Humans have been battling floods for more than 2000 years (Wohl, 2000). Early
flood-mitigation measures were local and involved construction of levees and dams.
State, provincial, and federal governments had no regional flood-control strategies. The
United States recognized that local efforts did not provide satisfactory protection against
floods and in 1936 passed the U.S. Flood Control Act, marking a “shift toward
engineering-intensive flood control on large spatial scales” (Wohl, 2000, p. 12). At about
the same time, other nations adopted more systematic and large-scale policies that led
to the construction of major flood protection works. Since the late 1970s and early
1980s, ‘soft-engineering’ approaches, for example bank stabilization and construction of

134
pool and riffle sequences, and non-structural approaches including flood insurance,
flood-proofing of structures, floodplain mapping, and land-use zoning have been
increasingly used to protect and mitigate against floods (Wohl, 2000).
Gilbert White’s dissertation (1945) on human adjustment to floods is viewed by
many as a milestone in thinking about responses to flood hazards and has evolved into
a new paradigm, referred to by many as ‘sustainable flood management.’ This paradigm
is based on the idea that humans must co-exist with river flooding and that more room
should be created for rivers to safely leave their channels, for example by floodplain
restoration (White, 2008). This change of emphasis away from structural flood protection
measures, although relatively new, is being adopted more widely in the face of the threat
of climate change and recent catastrophic floods (Werrity, 2006). For example, The
Netherlands, in response to massive flooding in 1993 and 1995, adopted a programme
“Room for the River” (Rijkswaterstaat, 2013) to create more space for river flooding that
is expected with larger amounts of rainfall later in this century, ensuring the safety of
Dutch citizens, while improving the environmental quality of watersheds.
One of the main considerations underpinning sustainable flood management is
that repeated flooding in some areas can result from human interference with rivers,
rather than being solely the result of natural causes (White, 2008). Reconnecting a river
with its floodplain and restoring ecosystems are key to creating sustainable river
systems (Werrity, 2006). However, a problem with this approach is that many urban
areas occupy parts of floodplains, and that any change to a more natural and
sustainable river system must overcome many technological, natural, and social
problems. White (2008) presents three principles that optimize sustainable floodplain
management and can help create an ‘absorbent city’. First, cities need to critically reflect
on past floods. Respecting and learning from these past experiences raises awareness
of geography, climate, and the environment. Second, relevant information must be
acquired and, more importantly, linked to planning. White (2008, p. 155) comments that,
although geographical, geological, and climate knowledge is commonly available, for
example in the form of flood risk maps, “the real challenge [is] to link the knowledge with
spatial planning.” Third, with previous flood experience and knowledge in mind,
populations must adapt to the flood hazard. In an ideal world, areas known to be
susceptible to flooding would be returned to the floodplain as designated green or blue

135
space, which could be inundated without major damage. Many cities and towns,
however, have long existed on, or expanded onto, floodplains, and critical environments
are not easily restored to a natural state. In such cases, cities must find other ways to
deal with floodwaters. Examples of alternate methods for flood adaptation mentioned by
White (2008) include changes to building design (e.g. raised living spaces, tile floors,
elevated electrical outlets), multi-functional infrastructure (e.g. allowing flooding of low-
level railways or motorways to allow temporary storage of floodwaters, urban planning
(e.g. new developments are restricted to areas safe from flooding), and reduction of
paved areas to allow for better water infiltration).
Aside from the shift in flood management from local flood control to centralized
structural measures and sustainable flood management, a variety of technological
developments during the past century have driven improvements in flood prediction,
monitoring, and management. Notable among these developments are vastly improved
computational power, geographical information systems (GIS), weather monitoring and
prediction, and automated discharge gauges.
5.3. Why do people still live on the floodplain in spite of the risk they face?
“Dealing with floods in all their capricious and violent aspects is a problem in part of adjusting human occupance to the floodplain environment so as
to utilize most effectively the natural resources of the plain, and, at the same time, of applying feasible and practicable measures for minimizing
the detrimental impacts of floods.” (White, 1945, p. 2)
Aside from the paradigm shift in flood management, technological advances, and
a greatly improved understanding of natural hazards, property losses from floods and
other hazards have increased in recent decades (White et al., 2001). With the recent
flooding catastrophes in New Orleans in 2005 and Pakistan in 2010 in mind, one
wonders why people continue to live on the floodplains of rivers. Chapter 4 of this thesis
considers increases in flood losses in recent decades and the ineffective use of scientific
knowledge in flood hazard management in a specific area — the Lillooet River valley.

136
There are many reasons why people resist leaving the floodplains on which they
live and why the costs of floods are rising. Some of the main reasons are discussed
below and highlight why the sustainable flood management is still in its infancy and is, in
fact, difficult to achieve. The most obvious reason is that many cities and towns have
expanded in such a way that, while relocation or floodplain restoration may be desirable,
it is economically and socially not possible. A lack of suitable land may drive a municipal
government to further develop a floodplain (Birkland et al., 2003). Second, in many
places that are protected by dams, dykes, or levees, people perceive that they are safe
from flooding. Yet, levees and dykes can increase the potential for disastrous flood loss
(Tobin, 1995). They increase a society’s vulnerability to flooding “by creating a sense of
complacency, which can act to reduce preparedness and by creating incentives to build
structures in areas subject to flooding” (Pielke, 1999, p. 420). Third, although we have
much knowledge about natural hazards that could change our behaviour, knowledge
does not automatically lead to action (Pielke, 1999). Natural hazards compete with many
social, political, and financial problems, and behavioural changes may only occur in the
aftermath of an event when attention and social interest are high. Pielke (1999) argues
that in the absence of an actual extreme event or disaster, several criteria must be met
to reduce a community’s vulnerability: the hazard threat must be real and well defined;
the response must be deemed effective; and the remedial options must be affordable.
5.4. Flood frequency analysis as the underpinning for flood management
"A full range of floodplain management tools should be used to address flooding problems, and assessing the effectiveness of these tools should be done on individual buildings and reaches for floods of up to 500-year
frequency." (White, 2001, Independent Review Panel on Boulder floods)
Floodplain management strategies, whether structural or non-structural, are
dependent on accurate estimates of the flood hazard (Stedinger, 2000). Hydrologists
use several statistical techniques to provide floodplain managers with reliable hazard
estimates (see Stedinger, 2000, for a review). Many decisions in floodplain management
are based on the “100-year flood,” and some decisions rely on estimates of even larger

137
floods, notably the 200- or 500-year floods. Yet even in watersheds with long gauge
records (100 years or more), predictions of extreme floods have large uncertainties.
Klêmês (1994) comments that probabilistic analyses used in hydrological sciences
assume that flood data from gauging stations can be treated as identically distributed,
independent, and random variables, but this assumption is commonly invalid, and
hydrologists must make statistical assumptions to calculate flood quantiles. Other
problems arise in watersheds with relatively short discharge records or where there are
no discharge records at all (Stedinger, 2000). To estimate the 100-year or 200-yeaer
flood in these situations, the hydrologist must extrapolate gauge data or use climatic and
hydrologic data from nearby, similar, gauged watersheds (Stedinger, 2000).
The concept of the widely used “100-year flood” creates further difficulties
(Pielke, 1999). First, the public does not understand the term “100-year flood.” Most
people assume that such a flood occurs every 100 years, when in reality such flood has
an annual probability of 0.01 and could occur two or more years in a row. Second, it is
an arbitrary timeframe and does not convey differences in flood levels on the floodplain.
For example, areas near the river have a higher chance of being flooded than areas at
the edge of the 100-year floodplain. Third, the “100-year flood” is based on the historical
occurrence of floods and does consider changes in flood frequency and magnitude that
are driven, for example, by climate change or change in land use.
5.5. Paleoflood research
“For [Gilbert F.] White, choice is the existential dilemma: how do humans select a course of action in an ambient world replete with risks and
opportunities that are incompletely known?” Mitchell (2008, p. 451)
As mentioned above, floodplain management choices and adjustments are
commonly based on stream gauge records of limited duration. Longer discharge records
are available in some watersheds, mainly in Europe, but older measurements may not
be reliable. As a consequence, estimates of flood frequency and magnitude based on
gauge records 50-100 years long or on incomplete records may not reveal the true flood
hazard within a watershed.

138
Paleoflood research is “the science of reconstructing the magnitude and
frequency of large floods using geological evidence and a variety of interdisciplinary
techniques” (Baker et al., 2002, p. 1). Paleoflood hydrology is a relatively new field of
study in the natural sciences, dating back to the 1970s and 1980s (Baker et al., 2002;
Baker, 2008). It involves studies of “past or ancient floods that occurred without being
recorded by either (1) direct hydrological measurement during the course of operation
(known as instrumental or “systematic” recording), or (2) observation and/or
documentation by non-hydrologists” (Baker, 2008, p. 1). An assumption underpinning
paleoflood research is that all prehistoric occurrences of large floods are archived in the
geological record. The evidence for these floods is mainly slack-water flood sediments
(Kochel & Baker, 1988) and dendrochronological evidence (Yanosky & Jarret, 2002).
Slack-water flood sediments and flood-scarred trees serve as paleostage indicators,
which provide a minimum estimate of the magnitude of past floods (Baker et al., 2002).
The emerging discipline of paleoflood hydrology had to overcome four major
concerns or problems (Baker et al., 2002). First, critics have argued that it would be
impossible to accurately date paleofloods. However, modern geochronological
techniques, such as radiocarbon, optically stimulated luminescence, and terrestrial
cosmogenic age dating, provide ages with relatively high accuracy (Baker et al., 2002).
Second, critics have claimed that it is impossible to accurately estimate paleoflood
discharge. Baker et al. (2002, p. 3) disputes this criticism by pointing out that
conventional stream gauges suffer the same problem because they commonly are
damaged or destroyed during extreme flood events, and “flood magnitude is computed
using indirect methods that are typically used in paleoflood magnitude determination.”
Third, critics have argued there are no appropriate statistical procedures for using
paleoflood data to make accurate estimates of flood frequency, as “errors and
uncertainties in paleoflood data degrade the value of gauging data in flood frequency
analysis” (Baker et al., 2002, p. 4). Blainey et al. (2002), however, show that flood
frequency analysis is improved by combining paleoflood and gauge data. And fourth,
critics have claimed that past climate or land-use changes undermine any future
projections based on past flood-frequency analysis. Baker et al. (2002) point out that,
while most mathematical hydrological calculations assume stationarity through time (i.e.
randomly and constantly occurring processes), many atmospheric phenomena that may

139
lead to extreme floods occur non-randomly. They point out that non-stationarity is a
problem in any flood frequency analysis, whether it is based on gauge records alone or
paleoflood data in combination with gauge data.
Paleoflood research offers an opportunity to study the long-term flood history in a
watershed and to assess flood recurrence based on this history. According to Baker et
al. (2002, p. 2), the greatest value of paleoflood studies is “the reconstruction of flood
discharges over thousands of years”, compared to commonly less than 100 years of
gauge records in traditional flood science. Second, paleoflood studies provide an
increased understanding of the long-term geological, geomorphological, and
climatological processes responsible for flooding in a watershed.
The underlying goal of many flood and other natural hazard studies is to provide
benefits for society by striving to reduce losses from disasters. Baker et al. (2002),
however, point out that research that assumes a linear relationship between science and
society will not achieve this goal because the research is disconnected from a decision-
making process based largely on political, economic, and societal factors (Figure 5.1).
So, what then is the added value of paleoflood research for society? First,
paleoflood research can help in the design of floodplain structures. Paleoflood research
can provide, at relatively low cost, an estimate of the Probable Maximum Flood—the
largest flood that can occur under the most extreme hydrological and meteorological
conditions in a watershed. Structures such as dams, culverts, and dykes must be able to
pass this flood. Extreme flood recurrence intervals (e.g. 500-year flood) are similarly
useful for the design of a nuclear power plant on a floodplain (Baker et al., 2002). And
second, paleoflood research provides flood recurrence information of value to floodplain
managers and the public that may alter their perception of flood hazards within a basin.
Baker et al. (2002) argue that people may be guided to action if they have a better
understanding of past occurrences of floods. Paleoflood research alone cannot solve
Gilbert White’s existential dilemma (Mitchell, 2008), but this type of research can at least
provide valuable information for sustainable flood management.

140
Figure 5.1. Flood-society relationships (after Baker et al., 2002).
5.6. The value of paleoflood research for Lillooet River valley flood management
The towns of Pemberton and Mount Currie have grown rapidly in recent
decades, in spite of their locations on a floodplain and damaging floods in 1940, 1980,
1984, 1991, and 2003. Agriculture and forestry were the major sources of income in
these communities in the past, but now tourism and related services are the dominant
drivers of the economy. In addition, the Lillooet River valley links Metro Vancouver and
the rest of the province via a railway, highway, and fibre-optic cables. Because the valley
is bordered by steep mountain slopes, there is little room to relocate the communities
and to restore the floodplain to a more natural state.
Little is known about flood management, if any, practiced by the Lil’wat First
Nations prior to the arrival of early settlers of European descent, but over the past
141
century flood management in Lillooet River valley has followed global trends. In
response to the 1940 flood, dykes were constructed, Lillooet Lake was lowered, and the
Lillooet River channel was straightened to reduce the impact of future floods. The 2012
flood regulation bylaw enacted by the Village of Pemberton contains non-structural flood
measures aimed at reducing the possibility and impact of flooding (Village of Pemberton
2012b). In addition, the 2011 Pemberton Community Plan recognizes the need to
“integrate development into the natural environment in a way that capitalizes on
ecological functions and avoids or manages risk associated with natural hazards”
(Village of Pemberton, 2011, p. 32).
Lillooet River discharge has been measured since 1914. Although the record is
one of the longest discharge records in the region, the early part of the record contains
several gaps. In addition, prior to 1947 the gauge was operated manually, whereas since
then a recorder has been used. Available historical discharge data were used to
determine the 1-in-200-year flood, which in turn was used in a hydraulic modelling
exercise done for a long-term flood management plan for Pemberton and Mount Currie
(Kerr Wood Leidal Associates Ltd., 2002). Because the Lillooet River discharge record
(1914-2013) is only 100 years long, the 1-in-200-year discharge estimate used in this
exercise carries large uncertainties and may not reflect actual flood hazard in the
watershed.
The paleoflood research presented in Chapters 2 and 3 of this thesis is based on
an 825-year varve record obtained from cores collected in Lillooet Lake. Because varves
are annually layered sediments, they are an excellent proxy for annual variations in
discharge and sediment transport to the lake. Possible errors in varve counts are small,
and two radiocarbon ages confirm annual deposition over the length of the record. I
estimate errors related to varve counts to be very low (<1.61%; Chapter 2).
The Lillooet River watershed is a complex, braided to meandering river system.
Discharge is controlled by seasonal snow and ice melt and by extreme rainfall events.
Sediment delivered to the lake is mainly derived from Lillooet Glacier, landslides
(particularly those on the Mount Meager Volcanic Complex), and other denudational
processes.

142
Although the paleoflood data that I present in this thesis cannot be directly
applied to flood prediction or flood mitigation, they offer valuable information for
sustainable flood management. My results also contribute to a better understanding of
the Lillooet River watershed by illustrating the intricate coupling of different sediment
sources and geologic, geomorphologic, and climatologic processes operating in the
watershed during the late Holocene. Although floodplain managers are mainly interested
in recent historical events and the potential for future floods, the prehistoric record
inferred from Lillooet Lake varves shows that the frequency of floods with maximum daily
discharges of >900 m3 s-1, comparable to the 1940 flood, has increased from an average
of once every 30-48 years between AD 1586 and 1825 to about once every 20 years
between AD 1906 and 2004. With the data available for this study, however, a flood
proxy for the prehistoric period would not yield representative discharges for Lillooet
River. Furthermore, many historic and prehistoric landslides at Mount Meager are
recorded in Lillooet Lake by anomalously thick varves, indicative of high sediment yields.
Persistence of high sediment yield after extreme events is highly variable and may be
controlled by multi-annual climate cycles.
In conclusion, the communities in Lillooet River valley could become more
‘absorbent’ communities in the sense of White (2008). The history of flooding in the
valley is well-known, although the interview respondents mentioned on more than one
occasion the need to collect anecdotal evidence of past floods (Chapter 4). Reflecting on
past events will allow the communities to learn from these experiences and adapt their
flood management strategies as needed. In addition, knowledge about flood hazards is
readily available to emergency managers and local residents. Many scientific research
projects and government studies have been done in the valley (Table 4.3), and the
Pemberton Valley Dyking District is proactively working with consultancy companies on
a variety of flood management issues (Chapter 4). Pemberton is attempting to adapt to
the flood hazard, while respecting the ecosystem of which it is part.

143
6. General conclusions
6.1. General summary
The work I present in this thesis was inspired by recurring floods on the Lillooet
River in recent history. As the valley has seen an explosive growth in population,
potential flood losses have increased. Since the Province of British Columbia devolved
the responsibility for flood management to local governments in 2003, the communities
of Pemberton and Mount Currie (in cooperation with the Pemberton Valley Dyking
District and the Squamish Lillooet Regional District) need to provide sustainable flood
management while at the same time enabling their communities to grow and thrive.
This thesis explores how natural hazard studies, as performed by earth
scientists, might contribute to flood management at the local level. I assessed scientific
data to get better estimates on flood frequency, flood intensity, sediment yield, and the
persistence of high sediment yield events, to provide floodplain managers with better
estimates of hazardous events. I also discussed the availability of and need for such
scientific information with local stakeholders in interviews.
In Chapters 2 and 3, I use the 825-year varve chronology to provide novel
insights into the spatial distribution of sediments and characteristic varves (i.e. marker
beds), and the relation to Lillooet River discharge. I furthermore interpret episodes of
high sediment input into the fluvial system as a response to glacier activity in the region
and the occurrence of landslides and floods. This information confirms existing
knowledge on regional glacial history and climate patterns. The extended sediment yield
chronology similarly confirms previous estimates of sediment yield (Desloges & Gilbert,
1994) in the basin, while at the same time provides new knowledge on the occurrence
and persistence of extreme high yield events during the past 369 years (AD 1629-1997).
Extreme yields are not random and are related to sediment availability (e.g. high yield
events occur simultaneous with increased glacier retreat in the early twentieth century).

144
The correlation between varve thickness and twentieth-century Lillooet River discharge
is moderate at best. Though floods are registered in the lake as thick varves which often
times have distinct sedimentological characteristics, a proxy discharge record for the
pre-historic period would probably not be representative of actual (pre-historic) discharge
conditions of the Lillooet River, as sediment sources and supply change over time.
In Chapter 4, I assess the current state of scientific knowledge at the local level
and the use of that knowledge by local decision-makers. Multiple earth science studies
have been conducted in Lillooet River valley (see Table 4.3). According to the interview
respondents, these scientific studies have contributed significantly to the understanding
and awareness of flood hazard in Lillooet River valley. But while this scientific
understanding is fundamental to the work of flood or emergency managers, the effective
use of such knowledge is compromised by several factors. Limited time and resources of
the local stakeholders, and limited financial and human resources of the local
governments shape the response to natural hazards. Other concerns are the diverging
interests and needs of scientists and local stakeholders, the access to new scientific
knowledge, and effective communication of that knowledge to the local communities.
The communities might benefit from multi-disciplinary studies that assess how
knowledge about natural hazards can be implemented into sustainable community
planning. Such studies should of course be performed in close cooperation with local
stakeholders, and keep in mind the current political framework, and the financial and
human resources available to the local governments.
This study is one of few that provide an overview of relevant scientific knowledge
and the use that knowledge by decision-makers at the local level. My results are likely
transferable to other local jurisdictions in British Columbia and elsewhere in Canada, and
can serve as a starting point for further research on more effective incorporation of
scientific knowledge into the decision-making process.
In Chapter 5, I discuss paradigm changes in floodplain management and the
added value of paleoflood research for sustainable flood management. Flood
management in Lillooet River valley has paralleled global trends.

145
6.2. Recommendations for interdisciplinary research in the field of natural hazards
The main objective of my thesis research was to assess flood hazard in Lillooet
River valley from a multi-disciplinary perspective. Based on my research and the related
literature review, I have several recommendations for researchers who wish to pursue
multi-disciplinary research. These recommendations may also be useful to scientists
with a more narrow focus who make recommendations regarding hazards to the general
public or to stakeholders. To provide useful scientific information to community
stakeholders, a scientist should:
1. Introduce himself/herself and engage stakeholders in the area that is being studied. This proactive approach may open doors or provide opportunities that the scientist had not considered before. Stakeholders, such as local governments, may offer a different viewpoint on the issue at hand or give the scientist relevant local information that would otherwise be unavailable. Also, when local stakeholders are aware of research being conducted in their area, they are more likely to use the results of that research.
2. Familiarize himself/herself with the larger picture. For example, a scientist conducting natural hazard research should be aware of relevant legislation and the responsibilities and resource limitations of the authorities attempting to deal with hazards, so that any recommendations that result from the research are constructive and current.
3. Present results in an appropriate manner, keeping in mind the target audience and their interest in the scientific data being generated. Obviously, the scientist should not report research findings to local stakeholders in the same way as to peers.
6.3. Future work
Much research has been done on the flood hazard in Lillooet River valley, but
more work is needed. Some examples include:
1. Acquisition of longer cores from the proximal part of the lake to provide improved sediment yield estimates and additional information on the spatial distribution of sediment through the lake.
2. A detailed study of sediment transport and deposition following the 2010 Mount Meager landslide. A long-term study of the fate of the 2010 landslide deposit and the response of Lillooet River to

146
movement of sediment from Meager Creek to Lillooet Lake would provide valuable information on the importance of landslides to sediment yield in the watershed. A study of the 2010 varve and varves deposited in subsequent years would provide insights into the persistence of the effect of a large disturbance event on the Lillooet River, thus allowing for an improved interpretation of prehistoric events.
3. A statistical comparison of the Lillooet Lake varve chronology and the PDO index (Mantua and Hare, 2002) and other regional climate proxies might provide insight into the relationship between climate and flooding in the Lillooet River watershed.
4. The relationship between scientists and local emergency managers in dealing with hazards. Scientists may be available to provide expert knowledge, but their priorities and perspectives are different from those of local emergency managers. In the case of Lillooet Valley, it would thus be useful to establish the kinds of scientific information needed by emergency managers, while at the same time providing scientists with the opportunity to collect scientific data.
5. More multi-disciplinary studies into different aspects of flood. As one of the interview respondents mentioned, much knowledge about natural hazards in Lillooet River valley is available, but this knowledge is not adequately incorporated into community policy and action. Multi-disciplinary studies involving scientists and local stakeholders could help the residents create sustainable communities.
6. A comparison with the experiences of other small local governments in British Columbia that have to deal with natural hazard management. Are the issues these communities face the same or different? Is scientific information available to these communities, and to what extend do they use this knowledge and benefit from it? And how can the communities learn from each other’s experiences?
7. In Chapter 4 of this thesis I examined the experiences of local decision makers and their use of scientific knowledge. A broader participatory study, including, for example, teachers, planners, farmers, and the general public, would shed additional light on how scientific knowledge is transferred and how this knowledge is put in practice.
8. The Lil’wat First Nations community should be queried on their use and perception of scientific knowledge in relation to flood hazard and floodplain management. Their experience with historical floods could also provide valuable information.

147
References
Alexander, D. (1991). Natural disasters: A framework for research and teaching. Disasters: The Journal of Disaster Studies and Management, 15, 209-226.
Alexander, D. (1997). The study of natural disasters, 1977-1997: Some reflections on a changing field of Knowledge. Disasters, 21, 284-304.
Allen, S. M. & Smith, D. J. (2007). Late Holocene glacial activity of Bridge Glacier, British Columbia Coast Mountains. Canadian Journal of Earth Sciences, 44, 1753-1773.
Baker, V. R. (2008). Paleoflood hydrology: Origin, progress, prospects. Geomorphology, 101, 1-13.
Baker, V. R., Kochel, R. C. & Patton, P. C. (1979). Long-term flood frequency analysis using geological data. IAHS-AISH Publication, 128, 3-9.
Baker, V. R., Webb, R. H., & House, P. K. (2002). The scientific and societal value of paleoflood hydrology. In P. K. House, R. H. Webb, V. R. Baker and D. R. Levish (Eds.), Ancient floods, modern hazards: Principles and applications of paleoflood hydrology (pp. 1-19). Washington, DC: American Geophysical Union.
BCStats (2012a). 2011 Census of Canada. Retrieved November 8, 2012, from http://www.bcstats.gov.bc.ca/StatisticsBySubject/Census/2011Census.aspx
BCStats (2012b). British Columbia municipal census populations, 1921-2006. Retrieved January 17, 2012, from http://www.bcstats.gov.bc.ca/data/pop/pop/mun/mun1921_2006.asp
BCStats (2012c). 2006 Census of Canada. Retrieved November 8, 2012, from http://www.bcstats.gov.bc.ca/StatisticsBySubject/Census/2006Census.aspx
Benito, G., Lang, M., Barriendos, M., Llasat, M. C., Francés, F., Ouarda, T., Thorndycraft, V. R., Enzel, Y., Bardossy, A., Coeur, D. & Bobée, B. (2004). Use of systematic paleoflood and historical data for the improvement of flood risk estimation; review of scientific methods. Natural Hazards, 31, 623-643.
Birkland, T. A., Raymond, J. B., Conrad, D., Cortner, H. & Michener, W. K. (2003). River ecology and flood hazard mitigation. Natural Hazards Review, 4, 46-54.

148
Blainey, J. B., Webb, R. H., Moss, M. E. & Baker, V. R. (2002). Bias and content of paleoflood data in flood-frequency analysis. In P. K. House, R. H. Webb, V. R. Baker & D. R. Levish (Eds.), Ancient floods, modern hazards: Principles and applications of paleoflood hydrology (pp. 161-174). Washington, DC: American Geophysical Union.
Blais-Stevens, A. & Septer, D. (2008). Historical accounts of landslides and flooding events along the Sea to Sky corridor, British Columbia, from 1855-2007. Geological Survey of Canada Open File 5741.
Blott, S. J. & Pye, K. (2001). Gradistat: A grain size distribution and statistics package for the analysis of unconsolidated sediments. Earth Surface Processes and Landforms, 26, 1237-1248.Booth, L. & Quinn, F. (1995). Twenty-five years of the Canada Water Act. Canadian Water Resources Journal, 20(2), 65-90.
Booth, L. & Quinn, F. (1995). Twenty-five years of the Canada Water Act. Canadian Water Resources Journal, 20, 65-90.
Bovis, M. J. & Jakob, M. (2000). The July 29, 1998, debris flow and landslide dam at Capricorn Creek, Mount Meager volcanic complex, southern Coast Mountains, British Columbia. Canadian Journal of Earth Sciences, 37, 1321-1334.
Brooks, G. R., St. George, S., Lewis, C. F. M., Medioli, B. M., Nielsen, E., Simpson, S. & Thorleifson, L. H. (2002). Geoscientific contributions to understanding flood hazards in the Red River Valley, Manitoba. In: Water Management in a changing "climate". Proceedings of the Canadian Water Resources Association 55th Annual Conference, Winnipeg, Manitoba.
Bruce, J. P. (1976). The National Flood Damage Reduction Program. Canadian Water Resources Journal, 1(1), 5-14.
Bush, V. (1945). Science: The endless frontier. Transactions of the Kansas Academy of Science, 48, 231-264.
Carter, N. M. (1932). Exploration in the Lillooet River watershed. Canadian Alpine Journal, 21, 8-18.
Chubey. M.S. & Hathout, S. (2004). Integration of RADARSAT and GIS modelling for estimating future Red River flood risk. GeoJournal, 59, 237-246.
Church, M. (1995). Geomorphic response to river flow regulation: Case studies and time-scales. Regulated Rivers: Research & Management, 11, 3-22.
Church, M. & Slaymaker, O. (1989). Disequilibrium of Holocene sediment yield in glaciated British Columbia. Nature, 337(6206), 452-454.
Church, M., Kellerhals, R. & Day, T. (1989). Regional clastic sediment yield in British Columbia. Canadian Journal of Earth Sciences, 26, 31-45.

149
Clague, J. J., & Evans, S. G. (1994). Recent climate change and catastrophic geomorphic processes in mountain environments. Geomorphology, 10, 107-128.
Clague, J. & Turner, B. (2003). Vancouver, city on the edge. Living with a dynamic geological landscape. Vancouver, BC: Tricouni Press.
Clague, J. J., Evans, S. G., Rampton, V. N. & Woodsworth, G. J. (1995). Improved age estimates for the White River and Bridge River tephras, western Canada. Canadian Journal of Earth Sciences, 32, 1172-1179.
Clague, J. J., Menounos, B., Osborn, G., Luckman, B. H. & Koch, J. (2009). Nomenclature and resolution in Holocene glacial chronologies. Quaternary Science Reviews, 28, 2231-2238.
Columbia Basin Trust (2012). Climate change, impacts and adaptation in the Canadian Columbia Basin. From dialogue to Action. Retrieved September 25, 2013, from http://www.cbt.org/ climate change
Croft, S.A.S. (1983). Stability assessment of the Capricorn Creek Valley, British Columbia. B.Sc. thesis, University of British Columbia, Vancouver, BC.
Day, J. C. (1999). Planning for floods in the lower Fraser Basin, British Columbia: Toward an integrated approach. Environments, 27(1), 49.
Decker, F., Fougberg, M. & Ronayne, M. (1977). Pemberton: History of a settlement (1st ed.). Pemberton: Pemberton Pioneer Women
De Loë, R. (2000). Floodplain management in Canada: Overview and prospects. The Canadian Geographer, 44, 355-368.
Desloges, J. R. (1994). Varve deposition and the sediment yield record at three small lakes of the southern Canadian Cordillera. Arctic and Alpine Research, 26, 130-140.
Desloges, J. R. & Gilbert, R. (1994). Sediment source and hydroclimatic inferences from glacial lake sediments; the postglacial sedimentary record of Lillooet Lake, British Columbia. Journal of Hydrology, 159, 375-393.
Desloges, J. R. & Gilbert, R. (1995). The sedimentary record of Moose Lake: Implications for glacier activity in the Mount Robson area, British Columbia. Canadian Journal of Earth Sciences, 32, 65-78.
Desloges, J. R. & Gilbert, R. (1998). Sedimentation in Chilko Lake: A record of the geomorphic environment of the eastern Coast Mountains of British Columbia, Canada. Geomorphology, 25, 75-91.
Dominik, J. (2000). Evolution of the Upper Rhone River discharge and suspended sediment load during the last 80 years and some implications for Lake Geneva. Aquatic Sciences, 62, 54-67.

150
Elverhøi, A., Svendsen, J. I., Solheim, A., Andersen, E. S., Milliman, J., Mangerud, J. & Hooke, R. LeB. (1995). Late Quaternary sediment yield from the high arctic Svalbard area. Journal of Geology, 103, 1-17.
EM-DAT: The OFDA/CRED International Disasters Database (2009). Disaster trends. Retrieved February 27, 2013, from http://www.emdat.be/disaster-trends
Emergency Management British Columbia. (2011). Disaster Financial Assistance Program. Retrieved January 16, 2012, from http://www.pep.bc.ca/dfa_claims/dfa.html
Emergency Management British Columbia. (2012). B.C. Flood Response Plan. Victoria, BC: Province of British Columbia.
Environment Canada. (1993). Flooding: Canada water book. Ottawa, ON: Canada Communication Group.
Environment Canada. (2010). Water Survey of Canada - Archived hydrometric data. Retrieved September, 27, 2010, from http://www.wsc.ec.gc.ca/applications/H2O/
Environment Canada. (2011). National Climate Data and Information Archive. Retrieved January 19, 2011, from http://www.climate.weatheroffice.gc.ca/climateData/
Environment Canada. (2012a). Federal policy & legislation. Retrieved July, 5, 2012, from http://www.ec.gc.ca/eau-water/default.asp?lang=En&n=E05A7F81-1
Environment Canada. (2012b). Federal water policy. Retrieved July 5, 2012, from http://www.ec.gc.ca/eau-water/default.asp?lang=En&n=D11549FA-1#part20
Environment Canada. (2012c). Water governance & legislation. Retrieved July 3, 2012, from http://www.ec.gc.ca/eau-water/default.asp?lang=En&n=E05A7F81-1
Evans, S.G. (1987). A rock avalanche from the peak of Mount Meager, British Columbia. Geological Survey of Canada Paper, 87-1A, 929-934.
Fothergill, A. (2000). Knowledge transfer between researchers and practitioners. Natural Hazards Review, 1(2), 91-98.
Friele, P. A. & Clague, J. J. (2004). Large Holocene landslides from Pylon Peak, southwestern British Columbia. Canadian Journal of Earth Sciences, 41(2), 165-182.
Friele, P. A., Clague, J. J., Simpson, K. & Stasiuk, M. (2005). Impact of a Quaternary volcano on Holocene sedimentation in Lillooet River valley, British Columbia. Sedimentary Geology, 176(3-4), 305-322.
Friele, P. A., Jakob, M. & Clague, J. J. (2008). Hazard and risk from large landslides from Mount Meager volcano, British Columbia, Canada. Georisk, 2(1), 48-64.
151
Gilbert, R. (1972). Observations on sedimentation at Lillooet delta, British Columbia. In H. O. Slaymaker & H. J. McPherson (Eds.), Mountain geomorphology: Geomorphological processes in the Canadian Cordillera (B.C. Geographical Series, 14, 187-194). Vancouver, BC: Tantalus Research Limited.
Gilbert, R. (1973). Observations of lacustrine sedimentation at Lillooet Lake, British Columbia. PhD dissertation, University of British Columbia, Vancouver, BC.
Gilbert, R. (1975). Sedimentation in Lillooet Lake, British Columbia. Canadian Journal of Earth Sciences, 12(10), 1697-1711.
Gilbert, R., Desloges, J. R. & Clague, J. J. (1997). The glaciolacustrine sedimentary environment of Bowser Lake in the northern Coast Mountains of British Columbia, Canada. Journal of Paleolimnology, 17, 331-346.
Gilbert, R., Crookshanks, S., Hodder, K. R., Spagnol, J. & Stull, R. B. (2006). The record of an extreme flood in the sediments of montane Lillooet Lake, British Columbia: Implications for paleoenvironmental assessment. Journal of Paleolimnology, 35, 737-745.
Gimp2 (2012). GNU Image Manipulation Program. Retrieved 03/02/2012 from http://www.gimp.org/
Grove, J. M. 1988. The Little Ice Age. Methuen Press, London, UK.
Gurnell, A. M. & Warburton, J. (1990). The significance of suspended sediment pulses for estimating suspended sediment load and identifying suspended sediment sources in alpine glacier basins. In Hydrology in mountainous regions. I- Hydrological measurements; the water cycle. Proceedings of Two Lausanne Symposia, International Association of Hydrological Sciences Publication, no. 193.
Guthrie, R., Friele, P., Allstadt, K. B., Roberts, N., Evans, S. G., Delaney, K., Roche, D.; Clague, J. J. & Jakob, M. (2012). The 6 August 2010 Mount Meager rock slide-debris flow, Coast Mountains, British Columbia; characteristics, dynamics, and implications for hazard and risk assessment. Natural Hazards and Earth System Sciences, 12, 1-18.
Hancock, C. A. (2011). Geomorphic changes to Lillooet River due to the 2010 Mount Meager landslide. Honours B.Sc. thesis, Simon Fraser University, Burnaby, BC.
Haque, C. E. (2000). Risk assessment, emergency preparedness and response to hazards: The case of the 1997 Red River valley flood, Canada. Natural Hazards, 21, 225-245.
Hensold, G. (2011). An integrated study of deep-seated gravitational slope deformations at Handcar Peak, southwestern British Columbia. M.Sc. thesis, Simon Fraser University, Burnaby, BC.

152
Hickin, E. J. (1989). Contemporary Squamish River sediment flux to Howe Sound, British Columbia. Canadian Journal of Earth Sciences, 26, 1953-1963.
Hicks, D. M., McSaveney, M. J. & Chinn, T. J. H. (1990). Sedimentation in proglacial Ivory Lake, southern Alps, New Zealand. Arctic and Alpine Research, 22, 26-42.
Hodder, K. R., Gilbert, R. & Desloges, J. R. (2007). Glaciolacustrine varved sediment as an alpine hydroclimatic proxy. Journal of Paleolimnology, 38, 365-394.
Holm, K., Bovis, M. & Jakob, M. (2004). The landslide response of alpine basins to post-Little Ice Age glacial thinning and retreat in southwestern British Columbia. Geomorphology, 57, 201-216.
Holmes, J. & Clark, R. (2008). Enhancing the use of science in environmental policy-making and regulation. Environmental Science & Policy, 11, 702-711.
Hosking, J. R. M. & Wallis, J. R. (1986). Paleoflood hydrology and flood frequency analyis. Water Resources Research, 22(4), 543-550.
Intergovernmental Panel on Climate Change (2007). Climate Change 2007: Synthesis Report. Adopted at IPCC Plenary XXVII, Valencia, Spain.
Intergovernmental Panel on Climate Change (2013). Intergovernmental Panel on Climate Change. Retrieved September 21, 2013, from http://www.ipcc.ch/organization/organization.shtml#.Uj30nD-TXvg
Jakob, M. (1996). Morphometric and geotechnical controls on debris flow frequency and magnitude in southwestern British Columbia. Ph.D. thesis, University of British Columbia, Vancouver, BC.
James, A. (1999). Time and the persistence of alluvium: River engineering, fluvial geomorphology and mining sediment in California. Geomorphology, 31, 265-290.
Jarrett, R. D. & England, J. F. J. (2002). Reliability of paleostage indicators for paleoflood studies. In P. K. House, R. H. Webb, V. R. Baker & D. R. Levish (Eds.), Ancient floods, modern hazards: Principles and applications of paleoflood hydrology (pp. 91-109). Washington, DC: American Geophysical Union.
Jasanoff, S. & Wynne, B. (1998). Science and decisionmaking. In S. Rayner, & E. L. Malone (Eds.), Human choice and climate change. Volume 1: The societal framework (pp. 1-77). Columbus, OH: Battelle Press.
Jenkinson, A. F. (1955). The frequency distribution of the annual maximum (or minimum) of meteorological elements. Quarterly Journal of the Royal Meteorological Society, 81, 158-171.
Jordan, P. (1994). Debris flows in the southern Coast Mountains, British Columbia: dynamic behaviour and physical properties. Ph.D. thesis, University of British Columbia, Vancouver, BC.

153
Jordan, P. & Slaymaker, O. (1991). Holocene sediment production in Lillooet River basin, British Columbia; a sediment budget approach. Géographie physique et Quaternaire, 45(1), 45-57.
Kaufman, C. A., Lamoureux, S. F. & Kaufman, D. S. (2011). Long-term river discharge and multidecadal climate variability inferred from varved sediments, southwest Alaska. Quaternary Research, 76, 1-9.
Kerr Wood Leidal Associates Ltd. (2002). Engineering study for Lillooet River corridor. KWL File No. 713.002, Burnaby, BC.
Kerr Wood Leidal Associates Ltd. (2007). Lillooet River gravel management plan. KWL File No. 713.004, Burnaby, BC.
Kerr Wood Leidal Associates Ltd. (2009). Ryan River hydraulic model and dyking assessment. KWL File No. 713.029-300, Burnaby, BC.
Kerr Wood Leidal Associates Ltd. (2010). Lillooet Lake lowering analysis (technical memorandum). KWL File No. 0713.037-300, Burnaby, BC.
Kerr Wood Leidal Associates Ltd. (2011). Lillooet River survey (cross section and bathymetry survey). KWL File No. 713.057, Burnaby, BC.
Kirchner, J. W., Finkel, R. C., Riebe, C. S., Granger, D. E., Clayton, J. L., King, J. G. & Megahan, W. F. (2001). Mountain erosion over 10 yr, 10 k.y. and 10 m.y. time scales. Geology, 29, 591-594.
Klêmês, V. (1994). Statistics and probability: Wrong remedies for a confused hydrologic modeler. In V. Barnett & K. F. Turkman (Eds.), Statistics for the environment 2: Water related issues (pp. 345-366). London, UK: John Wiley and Sons.
Koch, J. J., Clague, J. J. & Osborn, G. D. (2007). Glacier fluctuations during the past millennium in Garibaldi Provincial Park, southern Coast Mountains, British Columbia. Canadian Journal of Earth Sciences, 44, 1215-1215.
Koch, J., Menounos, B. & Clague, J. J. (2009). Glacier change in Garibaldi Park, southern Coast Mountains, British Columbia, since the Little Ice Age. Global and Planetary Change, 66, 161-178.
Kochel, R. C. & Baker, V. R. (1988). Paleoflood analysis using slackwater deposits. In V. R. Baker, R. C. Kochel & P. C. Patton (Eds.), Flood geomorphology (pp. 357-376). New York: John Wiley and Sons.
Koi, T., Hotta, N., Ishigaki, I., Matuzaki, N., Uchiyama, Y. & Suzuki, M. (2008). Prolonged impact of earthquake-induced landslides on sediment yield in a mountain watershed: The Tanzawa region, Japan. Geomorphology, 101, 692-702.
Korup, O. (2004). Landslide-induced river channel avulsions in mountain catchments of southwest New Zealand. Geomorphology, 63, 57-80.

154
Lamoureux, S. (2000). Five centuries of interannual sediment yield and rainfall-induced erosion in the Canadian high arctic recorded in lacustrine varves. Water Resources Research, 36, 309-318.
Lamoureux, S. (2001). Varve chronology techniques. In W. M. Last, & J. P. Smol (Eds.), Tracking environmental change using lake sediments; Volume 1, basin analysis, coring, and chronological techniques (pp. 247-260). Dordrecht: Kluwer Academic Publishers.
Lamoureux, S. (2002). Temporal patterns of suspended sediment yield following moderate to extreme hydrological events recorded in varved lacustrine sediments. Earth Surface Processes and Landforms, 27, 1107-1124.
Larocque, S. J. & Smith, D. J. (2003). Little Ice Age glacial activity in the Mt. Waddington area, British Columbia Coast Mountains, Canada. Canadian Journal of Earth Sciences, 40, 1413-1436.
Lavis, J. N. (2006). Research, public policymaking, and knowledge-translation processes: Canadian efforts to build bridges. The Journal of Continuing Education in the Health Professions, 26, 37-45.
Lavis, J. N., Robertson, D., Woodside, J. M., McLeod, C. B. & Abelson, J. (2003). How can research organizations more effectively transfer research knowledge to decision makers? The Milbank Quarterly, 81, 221-248.
Leonard, E. M. (1997). The relationship between glacial activity and sediment production: Evidence from a 4450-year varve record of Neoglacial sedimentation in Hector Lake, Alberta, Canada. Journal of Paleolimnology, 17, 319-330.
Lemmen, D., Warren F., Lacroix, J. et al. (2008). From impacts to adaptation: Canada in a changing climate 2007. Ottawa, Government of Canada.
Lil'wat First Nation. (2006). Lil'wat land use plan: Phase 1 the vision and plan for the land and resources of Lil'wat Nation traditional territory. Retrieved November 8, 2012 from http://www.lilwat.ca/lilwat7ul/our-land/lilwat-land-use-plan.cfm
Lil'wat Nation. (2010a). Lilwat7ul, our history, declaration of the Lillooet tribe. Retrieved January 17, 2012, from http://www.lilwat.ca/lilwat7ul/our-history/declaration-of-the-lilooet-tribe.cfm
Lil'wat Nation. (2010b). Lilwat7ul, our land. Retrieved January 17, 2012, from http://www.lilwat.ca/lilwat7ul/our-land/
Loso, M. G., Anderson, R. S. & Anderson, S. P. (1994). Post-Little Ice Age record of coarse and fine clastic sedimentation in an Alaskan proglacial lake. Geology, 32, 1065-1068.
Loukas, A., Vasiliades, L. & Dalezios, N. R. (2000). Flood producing mechanisms identification in southern British Columbia, Canada. Journal of Hydrology, 227, 218-235.

155
Macdonald, N., Chester, D., Sangster, H., Todd, B. & Hooke, J. (2011). The significance of Gilbert F. White’s 1945 paper ‘Human adjustment to floods’ in the development of risk and hazard management. Progress in Physical Geography, 36, 125-133.
Major, J. J., Pierson, T. C., Dinehart, R. L. & Costa, J. E. (2000). Sediment yield following severe volcanic disturbance - A two-decade perspective from Mount St. Helens. Geology, 28, 819-822.
Mantua, N. J. & Hare, S. R. (2002). The Pacific Decadal Oscillation. Journal of Oceanography, 58, 35-44.
McKenzie-Mohr, D. (2011). Fostering sustainable behavior. An introduction to community-based social marketing. Gabriola Island, BC: New Society Publishers.
Medioli, B. E. & Brooks, G. R. (2003). Diatom and thecamoebian signatures of red River (Manitoba and North Dakota) floods: Data collected from the 1997 and 1999 spring freshets. Journal of Paleolimnology, 29, 353-386.
Melone, A. M. (1985). Flood producing mechanisms in coastal British Columbia. Canadian Water Resources Journal, 10, 46-64.
Menounos, B. (2006). Anomalous early 20th century sedimentation in proglacial Green Lake, British Columbia, Canada. Canadian Journal of Earth Sciences, 43, 671-678.
Menounos, B. & Clague, J. J. (2008). Reconstructing hydro-climatic events and glacier fluctuations over the past millennium from annually laminated sediments of Cheakamus Lake, southern Coast Mountains, British Columbia, Canada. Quaternary Science Reviews, 27, 701-713.
Menounos, B., Koch, J. Osborn, G., Clague, J. J. & Mazzucchi, D. (2004). Early Holocene glacier advance, southern Coast Mountains, British Columbia, Canada. Quaternary Science Reviews, 23, 1543-1550.
Menounos, B., Clague, J. J., Gilbert, R. & Slaymaker, O. (2005). Environmental reconstruction from a varve network in the southern Coast Mountains, British Columbia, Canada. The Holocene, 15, 1163-1171.
Menounos, B., Schiefer, E. & Slaymaker, O. (2006). Nested temporal suspended sediment yields, Green Lake basin, British Columbia, Canada. Geomorphology, 79, 114-129.
Mileti, D. S. (1999). Disasters by design: A reassessment of natural hazards in the United States. Washington, D.C.: Joseph Henry Press.
Ministry of Environment, Lands and Parks, Hydrology Branch. (1995). A review of the floodplain mapping for the Lillooet River near Pemberton, B.C. Victoria, BC: Government of British Columbia, File no. 35100-30/119-0000.

156
Ministry of Environment, Water Stewardship Division (2011). Water Management Branch: Flood hazard land use legislation. Retrieved August 22, 2012, from http://www.env.gov.bc.ca/wsd/ public_safety/flood/fhm-2012/landuse_prov_legs.html
Mitchell, J.K. (2008). Perspectives on alternatives: differentiation and integration in pursuit of a better fit between society and nature. Progress in Human Geography, 32, 451-458.
Mitchell, P., Pirkis, J., Hall, J. & Haas, M. (2009). Partnerships for knowledge exchange in health services research, policy and practice. Journal of Health Services Research & Policy, 14(2), 104-111.
Mokievsky-Zubok, O. (1977). Glacier-caused slide near Pylon Peak, British Columbia. Canadian Journal of Earth Sciences, 15, 1039-1052.
Morss, R. E., Wilhelmi, O. V., Downton, M. W. & Gruntfest, E. (2005). Flood risk, uncertainty, and scientific information for decision making. Bulletin of the American Meteorological Society, 86, 1593-1601.
Nasmith, H., Mathews, W. H. & Rouse, G. E. (1967). Bridge River Ash and some other recent ash beds in British Columbia. Canadian Journal of Earth Sciences, 4, 163-170
Naulet, R., Lang, M., Ouarda T. B. M. J., Coeur, D., Bobée, B., Recking, A. & Moussay, D. (2005). Flood frequency analysis on the Ardèche River using French documentary sources from the last two centuries. Journal of Hydrology, 313, 58-78.
Neppel, L., Renard, B., Lang, M, Ayral, P.-A., Coeur, D., Gaume, E., Jacob, N., Payrastre, O., Pobanz, K. & Vinet, F. (2011). Flood frequency analysis using historical data: Accounting for random and systematic errors. Hydrological Sciences Journal, 55, 192-208.
Nesbitt-Porter, H. H. (1985). Pemberton valley flood protection, 1985 study. Victoria, BC: Province of British Columbia, Ministry of Environment, Water Management Branch.
O'Hara, S. L., Street-Perrott, F. A. & Burt, T. P. (1993). Accelerated soil erosion around a Mexican highland lake caused by prehispanic agriculture. Nature, 362, 48-51.
Onstad, C. A. (1984). Sediment yield modelling. In R. F. Hadley & D. E. Walling (Eds.), Erosion and sediment yield: Some methods of measurement and modelling (pp. 71-89). Norwich, England: Geo Books.
Osborn, G., Menounos, B., Koch, J., Clague, J. J. & Vallis, V. (2007). Multi-proxy record of Holocene glacial history of the Spearhead and Fitzsimmons ranges, southern Coast Mountains, British Columbia. Quaternary Science Reviews, 26, 479-493.

157
Panofsky, H. A. & Brier, G. W. (1958). Some applications of statistics to meteorology, Pennsylvania State University, Pennsylvania, PA.
Pearse, P. H. & Quinn, F. (1996). Recent developments in federal water policy: One step forward, two steps back. Canadian Water Resources Journal, 21, 329-340.
Pemberton Valley Dyking District. (2012). Maintaining, adapting and upgrading the valley's flood protection. Retrieved July 10, 2012, from http://www.pvdd.ca/
Pielke, R. A. (1997). Asking the right questions: Atmospheric sciences research and societal needs. Bulletin of the American Meteorological Society, 78, 255-264.
Pielke, R. A. (1999). Nine fallacies of floods. Climatic Change, 42, 413-438.
Pielke, R. (2010). In retrospect: Science - The endless frontier. Nature, 466, 922-923.
Province of British Columbia (1990). Floodplain Mapping Program, Lillooet River. Drawing no. 88-44, sheets 1-11. Victoria, BC.
Province of British Columbia (1996). Flood Relief Act. Victoria, BC. Retrieved March 8, 2012, from http://www.bclaws.ca/Recon/document/ID/freeside/00_96151_01
Province of British Columbia (2002). Agricultural Land Commission. Retrieved July 4, 2012, from http://www.alc.gov.bc.ca/commission/alc_main.htm
Province of British Columbia (2006). Emergency Management B.C. created (Information Bulletin No. 2006PSSG0055-001371). Victoria, BC: Ministry of Public Safety and Solicitor General.
Province of British Columbia (2008). Flood construction levels and setbacks for farm building situations (Environmental Factsheet, Order No. 823.400-2). Victoria, BC. Ministry of Agriculture and Lands.
Province of British Columbia (2010). Flood Protection Program: 2010 funding application guideline. Victoria, BC: Ministry of Public Safety and Solicitor General.
Province of British Columbia. (2011a). Water stewardship: Index of designated floodplain areas by region. Victoria, B.C.: Ministry of Environment. Retrieved July 9, 2012, from http://www.env.gov.bc.ca/wsd/data_searches/fpm/reports/region2.html
Province of British Columbia, (2011b). River Forecast Centre. Victoria, BC: Ministry of Forests, Lands and Natural Resource Operations. Retrieved January 20, 2012, from http://bcrfc.env.gov.bc.ca/
Read, P. B. (1979). Geology Meager Creek geothermal area, British Columbia. Geological Survey of Canada Open File, 603.
Read, P. B. (1990). Mount Meager Complex Garibaldi Belt, southwestern British Columbia. Geoscience Canada, 17, 167-170.

158
Reyes, A. V. & Clague, J. J. (2004). Stratigraphic evidence for multiple Holocene advances of Lillooet Glacier, southern Coast Mountains, British Columbia. Canadian Journal of Earth Sciences, 41, 903-918.
Rijkswaterstaat (2013). Room for the River Programme. Retrieved May 21, 2013 from http://www.ruimtevoorderivier.nl/meta-navigatie/english/
Roche, A. D., Ellis, E., Guthrie, R. H., Roberts, N. J. & Friele, P. (2011). Once more into the breach: A forensic analysis of the August 2010 landslide dam outburst flood at Meager Creek, BC. Proceedings, Geohazards 5 Conference, Kelowna, BC.
Ross, S., Lavis, J., Rodriguez, C., Woodside, J. & Denis, J.-L. (2003). Partnership experiences: Involving decision-makers in the research process. Journal of Health Services Research & Policy, 8(2), 26-34.
Sander, M., Bengtsson, L., Holmquist, B., Wohlfarth, B. & Cato, I. (2002). The relationship between annual varve thickness and maximum annual discharge (1909-1971). Journal of Hydrology, 263, 35.
Scanlon, J., Conlin, D., Duffy, A., Osborne, G. & Whitten, J. (1985). The Pemberton valley floods: B.C.'s tiniest village responds to a major disaster. Carleton University, Ottawa, ON: Emergency Communications Research Unit.
Schiefer, E. (2006). Contemporary sedimentation rates and depositional structures in a montane lake basin, southern Coast Mountains, British Columbia, Canada. Earth Surface Processes and Landforms, 31, 1311-1324.
Schiefer, E. & Gilbert, R. (2008). Proglacial sediment trapping in recently formed Silt Lake, upper Lillooet valley, Coast Mountains, British Columbia. Earth Surface Processes and Landforms, 33, 1542-1556.
Schiefer, E. & Klinkenberg, B. (2004). The distribution and morphometry of lakes and reservoirs in British Columbia: A provincial inventory. The Canadian Geographer, 48, 345-355.
Schiefer, E., Hassan, M., Menounos, B., Pelpolad, C. & Slaymaker, O. (2010). Interdecadal patterns of total sediment yield from a montane catchment, southern Coast Mountains, British Columbia, Canada. Geomorphology, 118, 207-212.
Schiefer, E., Slaymaker, O. & Klinkenberg, B. (2001). Physiographically controlled allometry of specific sediment yield in the Canadian Cordillera: A lake sediment-based approach. Geografiska Annaler, 83, 55-65.
Shrubsole, D. (2000). Flood management in Canada at the crossroads. Environmental Hazards, 2, 63-75.
Simpson, K. A., Stasiuk, M., Shimamura, K., Clague, J. J. & Friele, P. (2006). Evidence for catastrophic volcanic debris flows in Pemberton valley, British Columbia. Canadian Journal of Earth Sciences, 43, 679-689.

159
Slaymaker, O. (1972). Sediment yield and sediment control in the Canadian Cordillera. In H.O. Slaymaker & H.J. McPherson (Eds.), Mountain geomorphology: Geomorphological processes in the Canadian Cordillera (B.C. Geographical Series No.14, pp. 235-245). Vancouver, BC: Tantalus Research Limited.
Slaymaker, O. (1999). Natural hazards in British Columbia: an interdisciplinary and inter-institutional challenge. International Journal of Earth Sciences, 88, 317-324.
Squamish Lillooet Regional District. (2010). Emergency response and recovery plan for the Squamish Lillooet Regional District. Pemberton, BC
Squamish Lillooet Regional District (2012). Squamish Lillooet Regional District. Retrieved July 10, 2012, from http://www.slrd.bc.ca/
St. George, S. & Nielsen, E. (2002). Flood ring evidence and its application to paleoflood hydrology of the Red River and Assiniboine River in Manitoba. Géographie physique et Quaternaire, 56, 181-190.
Stasiuk, M. V., Russell, J. K. & Hickson, C. J. (1996). Distribution, nature, and origins of the 2400 BP eruption products of Mount Meager, British Columbia; linkages between magma chemistry and eruption behaviour. Geological Survey of Canada Bulletin 486
Stedinger, J. R. (2000). Flood frequency analysis and statistical estimation of flood risk. In E. E. Wohl (Ed.), Inland flood hazards: Human, riparian and aquatic communities (pp. 334-358). Cambridge, UK: Cambridge University Press.
Stoffel, M. & Bollschweiller, M. (2008). Tree-ring analysis in natural hazards research – an overview. Natural Hazards and Earth System Sciences, 8, 187-202.
Stokes, D. (1995). Reviewing the compact between science and government. Proceedings of the 1995 Vannevar Bush II Science for the 21st Century (pp. 15-32). Research Triangle Park, NC: Scientific Research Society.
Stokes, D. (1997). Pasteur's quadrant. Washington, DC: The Brookings Institution.
Stuiver, M. & Reimer, P. (2011). CALIB 6.0. Retrieved 12/15/2011 from http://calib.qub.ac.uk/calib/
Sturm, M. (1979). Origin and composition of clastic varves. In C. Schluchter (Ed.), Moraines and varves: Origin/ genesis/ classification (pp. 281-285). Rotterdam: A.A. Balkema.
Tatum, J. S. (1995). Science, technology and Government: Re-examining the relationship. Technology in Society, 17, 85-102.
Taylor, J. R. (1982). An introduction to error analysis. The study of uncertainties in physical measurement (1st ed.). Mill Valley, CA: University Science Books.

160
Teit, J. (1912). Traditions of the Lillooet Indians of British Columbia. The Journal of American Folk-Lore, XXV(XCVIII), 292-371.
The Vancouver Sun. (2003). Helicopter lifts groceries to isolated Pemberton. The Vancouver Sun, October 21, 2003, pp. A.3-A3.
Tobin, G. A. (1995). ‘The levee love affair: A stormy relationship’. Water Resources Bulletin, 31, 359-367.
UN/ISDR (United Nations Inter-Agency Secretariat of the International Strategy for Disaster Reduction). (2004). Living with risk. A global review of disaster reduction initiatives. Geneva: United Nations.
Verbyla, D. L. (2002). Practical GIS analysis. London, UK: Taylor & Francis.
Village of Pemberton. (2006). Emergency response/ recovery plan.
Village of Pemberton. (2010a). About Pemberton. Retrieved January 17, 2012, from http://www.pemberton.ca/visitors/about-pemberton/
Village of Pemberton. (2010b). Pemberton flood information. 2003 flood presentation. Retrieved June 6, 2012, from http://www.pemberton.ca/residents/emergency-services/flood-information/
Village of Pemberton. (2011). Official Community Plan, Bylaw no. 654U.S.C., Pemberton, BC.
Village of Pemberton. (2012a). Joint hazard risk vulnerability analysis proposal. Pemberton, BC.
Village of Pemberton (2012b). Village of Pemberton. Flood Regulation Bylaw No. 716. Pemberton, BC.
Walling, D. & Webb, B. W. (1996). Erosion and sediment yield: A global overview. In Erosion and sediment yield: Global and regional perspectives (pp. 3-19). Proceedings of the Exeter Symposium, International Association of Hydrological Sciences Publication no. 236.
Walling, D. E. & Collins, A. L. (2008). The catchment sediment budget as a management tool. Environmental Science & Policy, 11, 136-143.
Watt, W. E. (1995). The National Flood Damage Reduction Program: 1976-1995. Canadian Water Resources Journal, 20, 237-247.
Werrity, A. (2006). Sustainable flood management: Oxymoron or new paradigm? Area, 38, 16-23.
Wester, J. (1967). Preliminary report on Pemberton Valley Dyking District drainage proposals. Victoria, BC: Department of Lands, Forests and Water Resources, Victoria, File no. 0242512-27.

161
White, G. F. (1945). Human adjustment to floods: a geographical approach to the flood problem in the United States. University of Chicago, Department of Geography Research Paper no. 29, 225 pp.
White, G. F. (1973). Natural hazards research. In R.J. Chorley (Ed.), Directions in geography (pp. 193-216). London: Methuen.
White, G. F., Kates, R. W. & Burton, I. (1968). The human ecology of extreme geophysical events. Natural Hazard Research, Working Paper 1.
White, G. F., Kates, R. W. & Burton, I. (2001). Knowing better and losing even more: The use of knowledge in hazards management. Environmental Hazards, 3, 81-92.
White, I. (2008). The absorbent city: Urban form and flood risk management. Urban Design and Planning, 161, 151-161.
Wise, G. (1985). Science and technology. Osiris, 1, 229-246.
Wohl, E. E. (2000). Inland flood hazard. In E. E. Wohl (Ed.), Inland flood hazards: Human, riparian and aquatic communities (pp. 3-38). Cambridge, UK: Cambridge University Press.
Yang, S., Zhao, Q. & Belkin, I. M. (2002). Temporal variation in the sediment load of the Yangtze River and the influences of human activities. Journal of Hydrology, 263, 56-71.
Yanosky, T. M. & Jarrett, R. D. (2002). Dendrochronologic evidence for the frequency and magnitude of paleofloods. In P. K. House, R. H. Webb, V. R. Baker & D. R. Levish (Eds.), Ancient floods, modern hazards: Principles and applications of paleoflood hydrology (pp. 77-89). Washington, DC: American Geophysical Union.
Zolitschka, B. (1998). A 14,000 year sediment yield record from western Germany based on annually laminated lake sediments. Geomorphology, 22, 1-17.

162
Appendix A. Lake bathymetry, sedimentation, and varve formation in Lillooet Lake.
Lake bathymetry
Gilbert (1973, 1975) mapped the bathymetry of the north basin of Lillooet Lake with an echo-sounder. He describes three morphometric zones:
1. Classic foreset beds at the mouth of Lillooet River, extending to approximately 6-8 m depth and dipping 20-25° south.
2. A zone of slumped sediment, divided into three subzones:
a. An unstable subzone zone extending to about 40 m depth, with the slope decreasing from about 8° to 4°. Irregularities on the lake floor may be channels eroded by underflows.
b. A subzone between 40 m and 90 m depth, sloping 3-4°, with sediment mounds ranging from less than 1 m to 4-5 m in height.
c. A subzone between 90 m and 120 m depth, sloping 1.4-2.4°, with sediment mounds up to 7 m high and 200 m long.
3. At about 120 m depth, there is an abrupt change from slumped material to nearly flat-lying sediments. This zone constitutes the remainder of the north basin and has a maximum depth of 137 m. At the south end of the basin, the lake floor rises to a subaqueous sill at approximately 100 m depth. No evidence of sediment disturbance is found in this zone.
Desloges & Gilbert (1994) mapped the floor of the south basin of Lillooet Lake with an echo sounder. They describe layered lacustrine sediments beneath the nearly flat floor of the lake and a strong acoustic reflector in the sediments. The reflector lies about 13.5 m below the lake floor near Ure Creek, about 9 m below the lake floor near the south end of the north basin, and 6-7 m below the lake floor in the south basin. A second, moderately strong reflector is present 13- 32 below the lake floor. This second reflector is locally masked by overlying, acoustically impenetrable sediment. Another characteristic feature in the south basin of Lillooet Lake is the fan-delta at the mouth of Lizzie Creek.
Sedimentation in Lillooet Lake
Five factors influence sedimentation in Lillooet Lake (Gilbert, 1973, 1975):
1. the density of the lake waters and inflowing Lillooet River waters, which are controlled by temperature and suspended sediment load;
2. winds and currents generated by inflowing waters;
3. the thermal structure of the lake, which in turn determines water circulation and the depth of thermocline along which interflows occur;
4. diurnal and seasonal fluctuations in water and sediment inflow; and
5. the total annual inflow volume, which on average is approximately 4.5 times the volume of the lake.

163
Lillooet Lake is a dimictic lake. It becomes isothermal in the fall due to cyclonic storms, allowing the waters to mix and freely circulate in the fall and winter. In the spring, the lake develops a three-part thermal structure that is fully formed before June: an epilimnion with water temperatures between 10 and 13°C; an approximately 10-m-thick metalimnion; and, at a depth of about 40 m, a hypolimnion in which water temperatures are lower than 6°C. Temperature and sediment concentrations in the lake are governed by inflow from Lillooet and Green rivers.
During summer, interflows and underflows are the most important sediment transport processes in the lake. Interflow along the base of the epilimnion is an important factor in the formation of varves in Lillooet Lake, because this layer contains considerably more fine sediment than the hypolimnion. Periods of high inflow cause a powerful interflow that is able to weaken the thermocline and aid in the destruction of the thermal structure of the lake. Deposition during these periods can be recognized in the summer layer of a varve as distinct sub-annual laminae.
Underflows of turbid water (600 to 800 mg l-1
suspended sediment) occur at times of high discharge in spring and summer and can last for several hours. When sediment concentrations increase to over 1200 mg l
-1 during periods of high inflow, the underflow may be quasi-continuous
and reach the south end of the lake.
Sediment delivered to the lake during fall floods is not distributed by interflows, because suspended sediment concentrations are still high from summer inflow. Rather it remains suspended in the epilimnion and rains out during the winter months. This process leaves finer clay caps on summer silt layers of varves, allowing couplets to be easily recognized in the stratigraphic record and easily traced throughout the lake.

164
Appendix B. Cores collected in Lillooet Lake in 2005 and 2006.
Year / Core
Coordinates (UTM, zone 10)
Water depth (m)
Total core length (cm)
Number of sections
Type of core
2005
05-LILL(01) 0536180 E, 5564879 N 79 393 1 Percussion
05-LILL(02) 0536124 E, 5564774 N 78 567 2 Vibrasonic
05-LILL(03) 0537003 E, 5562677 N 89 202 1 Percussion
05-LILL(04) 0535001 E, 5566575 N 126 176 1 Percussion
05-LILL(05) 0534903 E, 5566754 N 127 573 1 Vibrasonic
05-LILL(06) 0536428 E, 5557733 N 104 387 1 Vibrasonic
05-LILL(07) 0533725 E, 5567777 N 127 591 2 Vibrasonic
2006
06-LILL(A) 0536518 E, 5564485 N 92 1044 5 Vibrasonic
06-LILL(B) 0536366 E, 5562977 N 91 830 4 Vibrasonic
06-LILL(C) 0532596 E, 5568228 N 128 1106 5 Vibrasonic
06-LILL(D) 0534291 E, 5567283 N 128 1090 5 Vibrasonic
06-LILL(E) 0535869 E, 5555253 N 106 585 3 Vibrasonic

165
Appendix C. Core stratigraphy and bulk properties

166

167

168

169

170

171

172

173

174

175

176

177
Appendix D. Historical floods in Lillooet River valley.
Year Date FiV? Source MDD MID RiC? Description of event
2003 Oct 16-22
Yes B-S & S6 1370 (Oct, 18)
1490 (Oct. 18)
1/12 Rain on snow Widespread flooding in Squamish and Pemberton; evacuation of several hundred people; five people killed; Whistler isolated
1992 Oct 23-26
Yes B-S & S6 808 (Oct. 24)
NA Rainstorm Ryan River dyke break causes flooding in Pemberton
1991 Aug 27-31
Yes B-S & S6 1260 (Aug. 30)
1410 (Aug. 30)
8/12 Torrential rain Flooding in several southwest BC communities; flooding of agricultural land in Lillooet Valley (50% of potato crop lost); evacuation of people stranded near Lillooet Lake
1990 Nov 8-13
Yes B-S & S6, Vancouver
Sun6
591 (Nov. 12)
757 (Nov.12)
5/12 Rain (on snow?) Flooding in many parts of southwest BC; Pemberton Airport under water
19841 Oct 6-12
Yes B-S & S6 1110 (Oct. 8)
1310 (Oct. 8)
11/12 Rain on snow Major flooding in Pemberton, Whistler, and Squamish
1981 Oct 27-31
Not sure B-S & S6 823 (Nov. 1)
897 (Nov. 1)
4/12 Rain on snow 96 mm of rain in Pemberton in 48-hour period
1980 Dec 23-27
Yes B-S & S6 790 (Dec. 27)
993 (Dec. 27)
10/12 Rain on snow Record peak flows on several southwest BC rivers; Gordon Ferguson home in Pemberton hardest hit; Miller Creek bridge damaged; major shift of braided Rutherford Creek
1975 Oct 29-
Nov6
Yes B-S & S6 782 (Nov. 5)
858 (Nov. 5)
10/12 Rain on snow (Oct.-Nov.) 3.2 km of track destroyed by Birkenhead River; washout on Green River A landslide on July 22 dammed Meager Creek and formed a lake, flooding the surrounding area (Mokievsky-Zubok, 1977); minor rise in the level of the Lillooet River due to draining of lake (maximum discharge on July 28 = 357 m3 s-1); no rainfall recorded during this period
19682 Jan 12-20
Not sure B-S & S6 790 (Jun. 27)
827 (Jun. 27)
0/12 Freshet Maximum discharge on Jan16 = 109 m3/s; evacuation of residents of 2 houses on outskirts of Pemberton on Jan. 14
1957 Yes Vancouver Sun6
716 (Sep. 6)
NA 5/12 Torrential rain Flooding in Squamish; Pacific Great Eastern Railway blocked by washout near Pemberton

178
Year Date FiV? Source MDD MID RiC? Description of event
19403 Oct 17-20
Yes B-S & S, Decker et al., 19776
900 (Oct. 19)
1640? (Oct. 19)
11/12 Rain (on snow?) Flooding in Squamish and Pemberton; houses washed away, bridge destroyed, crops lost, cattle drowned
1937 Oct 27-29
Maybe B-S & S6, Vancouver
Sun6
510 (Oct. 28)
NA 7/12 Rain (on snow?) Torrential rain wreaks havoc on BC roads (Vancouver Sun, Oct. 28)
1936 Probably not
Core6 464 (May 30)
NA 6/12 Freshet No extreme rain event in precipitation records
19314 Probably Carter, 19336
462 (Oct. 1)
NA 11/12 Landslide from “The Devastator” (flank of Pylon Peak) into Devastation Creek
1921 Oct28 Possibly Vancouver Sun6,
Decker et al., 19776
NA NA 11/12 Rain (on snow?) Flooding in Coquitlam; Britannia Creek disaster; washouts on the Pacific Great Eastern Railway
1906 Sep Possibly Menounos et al., 20056
NA NA 9/12 Two intense rainstorms in September cause regional damage and fatalities
Notes: MDD = Maximum daily discharge (m3 s-1) MID = Maximum instantaneous discharge (m3 s-1) RiC? = Recorded in cores? 5
FiV? = Flood in valley?
1 1984: Estimated daily maximum and maximum instantaneous discharges include flow through flooded area (dyke breach). Source: Environment Canada, Water Survey of Canada.
2 1968: Flooding on October 29, 1968 (Blais-Stevens & Septer, 2008). A washout 11.2 km south of Pemberton closed Highway 99. No climate data from Whistler or Pemberton.
3 1940: Environment Canada stage-discharge records indicate a daily discharge of 900 m3 s-1. A note in the Lillooet River file at Environment Canada states a maximum instantaneous discharge of 1640 m3 s-1.
4 1931: Carter (1932, p. 15) states: “…ascertain the origin of a devastating flood that swept down Meager Creek in October, 1931”, … “ Bert recounted how he had witnessed from his cabin a succession of sudden floods passing down the Lillooet. The river rose many feet in a few minutes, was highly discoloured, and bore many newly-uprooted trees.”
5 Flood recorded as a subannual lamina in ‘number’ out of 12 cores.
6 Sources: B-S & S: Blais-Stevens, A. and Septer, D. 2008. Historical accounts of landslides and flooding events along the Sea to Sky Corridor, British Columbia, from 1855-2007. Geological Survey of Canada Open File 5741. Carter, N.M. 1933. Exploration in the Lillooet River watershed. Canadian Alpine Journal, 21, 8-18. Decker, F., Fougberg, M. and Ronayne, M. (1977). In G. R. Elliott (Ed.), Pemberton: History of a settlement (1st ed.). Pemberton: Pemberton Pioneer Women. Menounos, B., Clague, J.J., Gilbert, R., and Slaymaker, O. (2005). Environmental reconstruction from a varve network in the southern Coast Mountains, British Columbia, Canada. The Holocene, 15, 1163-1171. Mokievsky-Zubok, O. 1977. Glacier-caused slide near Pylon Peak, British Columbia. Canadian Journal of EarthSciences, 14, 2657-2662.

179
Appendix E. Peak discharge of Lillooet River for the period 1914-2004 (source Environment Canada).
Year Max. instantaneous discharge Max. daily discharge Min. daily discharge
(m3 s-1) Month/day (m3 s-1) Month/day (m3 s-1) Month/day
1914 - - 544 Oct. 14 19.8 Jan. 24
1915 - - 544 Jul. 5 17.0 Dec. 15
1916 - - 456 Jun. 18 14.7 Dec. 1
1917 - - 515 Aug. 18 12.0 Feb. 1
1918 - - 592 Jul. 19 - -
1919 - - - - - -
1920 - - - - - -
1921 - - - - - -
1922 - - - - - -
1923 - - 496 Jul. 14 - -
1924 - - 481 Jul. 4 15.3 Dec. 6
1925 - - - - - -
1926 - - 447 Jul. 12 15.0 Dec. 15
1927 - - - - - -
1928 - - 518 Jul. 24 - -
1929 - - 586 Oct. 16 15.7 Dec. 6
1930 - - 496 Jun. 11 11.9 Jan. 28
1931 - - 462 Oct. 1 19.7 Jan. 1
1932 - - 405 Jun. 15 21.2 Feb. 5
1933 - - 379 Sept. 5 11.6 Feb. 1
1934 - - 464 Jul. 28 29.7 Jan. 6
1935 - - 583 Jul. 24 24.4 Dec. 4
1936 - - 464 May. 30 17.6 Feb. 22
1937 - - 510 Oct. 28 14.9 Feb. 9
1938 - - 428 Jul. 23 19.3 Jan. 20
1939 - - 510 Jul. 29 22.9 Feb. 4
1940 - - 900 Oct. 19 31.1 Dec. 31
1941 - - 564 Jul. 19 22.0 Feb. 24
1942 - - 479 Aug. 19 20.7 Dec. 7

180
Year Max. instantaneous discharge Max. daily discharge Min. daily discharge
(m3 s-1) Month/day (m3 s-1) Month/day (m3 s-1) Month/day
1943 - - 405 Aug. 14 14.2 Jan. 23
1944 - - 462 Jul. 28 16.7 Feb. 29
1945 - - 510 Jul. 11 17.8 Mar. 7
1946 - - 504 Jul. 30 10.6 Nov. 21
1947 - - 513 May. 21 9.06 Dec. 6
1948 - - 623 Jun. 9 13.6 Mar. 20
1949 428 Aug. 17 391 Aug. 17 18.5 Jan. 20
1950 572 Jun. 17 564 Jun. 17 23.1 Jan. 27
1951 518 Jul. 3 484 Jul. 3 20.7 Mar. 14
1952 501 Jul. 15 464 Jul. 15 19.5 Mar. 15
1953 535 Jul.14 515 Jul. 14 21.5 Dec. 27
1954 - - 479 Jul. 2 20.7 Jan. 20
1955 631 Jul. 17 572 Jul. 17 18.1 Mar. 16
1956 - - 564 Sept. 26 6.37 Mar. 14
1957 - - 716 Sept. 6 12.7 Mar. 4
1958 - - 549 May. 27 21.5 Nov. 30
1959 - - 510 Jul. 22 - -
1960 453 Jul. 7 422 Jul. 7 19.4 Mar. 2
1961 609 Aug. 31 578 Jul. 14 21.5 Dec. 9
1962 473 Aug. 20 374 Aug. 20 23.5 Feb. 25
1963 422 Jul. 22 385 Jul. 22 28.9 Dec. 21
1964 603 Jul. 8 564 Jul. 8 22.7 Dec. 25
1965 462 Jul. 8 413 Jul. 8 18.7 Jan. 17
1966 493 Jul. 18 473 Jul. 18 19.5 Mar. 7
1967 660 Jun. 23 617 Jun. 22 26.9 Mar. 13
1968 827 Jun. 27 790 Jun. 27 37.7 Jan. 3
1969 674 Jun. 13 640 Jun. 13 21.0 Feb. 28
1970 580 Jun. 27 513 Jun. 27 19.3 Dec. 22
1971 558 Aug. 1 530 Aug. 1 19.8 Jan. 28
1972 521 Jul. 12 476 Jul. 13 13.3 Feb. 4
1973 436 Jun. 23 396 Jun. 23 - -
1974 538 Jun. 19 504 Jun. 9 - -

181
Year Max. instantaneous discharge Max. daily discharge Min. daily discharge
(m3 s-1) Month/day (m3 s-1) Month/day (m3 s-1) Month/day
1975 858 Nov. 5 782 Nov. 5 15.3 Jan. 27
1976 515 Jul. 9 479 Aug. 8 27.5 Jan. 25
1977 422 Aug. 14 385 Aug. 13 23.8 Dec. 30
1978 464 Jul. 27 416 Jul. 27 17.0 Dec. 31
1979 472 Sept. 3 383 Sep. 3 16.5 Jan. 27
1980 993 Dec. 27 790 Dec. 27 19.0 Jan. 22
1981 897 Nov. 1 823 Nov. 1 27.0 Dec. 31
1982 592 Jun. 21 544 Jun. 21 23.7 Jan. 29
1983 704 Jul. 12 620 Jul. 12 24.6 Feb. 6
1984 1310 Oct. 8 1110 Oct. 8 21.0 Dec. 2
1985 380 Aug. 1 343 Jul. 23 19.0 Nov. 24
1986 683 May. 27 592 May. 26 15.6 Feb. 20
1987 651 Jun. 12 534 Jun. 12 18.0 Jan. 7
1988 379 Jul. 27 358 Jul. 27 15.5 Feb. 9
1989 432 Jun. 14 400 Jun. 14 16.9 Mar. 2
1990 757 Nov. 12 591 Nov. 12 17.6 Feb. 9
1991 1410 Aug. 30 1260 Aug. 30 28.4 Mar. 26
1992 - - 808 Oct. 24 21.0 Dec. 31
1993 543 May. 14 452 May. 14 18.0 Jan. 17
1994 470 Jul. 25 426 Jul. 24 22.1 Feb. 27
1995 - - 439 Jul. 26 19.4 Jan. 26
1996 - - - - - -
1997 851 Jun. 18 676 Jun. 18 27.3 Mar. 17
1998 486 Jul. 29 450 Jul. 17 28.2 Dec. 23
1999 827 Aug. 25 649 Aug. 25 24.0 Jan. 26
2000 548 Jul.28 509 Jul. 28 19.4 Dec. 23
2001 540 Aug. 22 443 Aug. 22 17.9 Feb. 27
2002 559 Jun. 27 532 Jun. 27 17.7 Mar. 19
2003 1490 Oct. 18 1370 Oct. 18 21.7 Mar. 8
2004 515 Jun. 23 464 Jun. 24 20.9 Feb. 11

182
Appendix F. Identified landslides in the historic period (1900-2004).
Event Date Volume
(m3) Discharge (m3 s-1)1
Discharge date
Author
Debris Flow (D) 1931, Oct.? 3 × 10⁶ 462 Oct.1 Carter (1932), Jordan (1994)
Rock avalanche (Cp) 1933? 10 × 106 379 Sep. 5 Croft (1983), Jakob (1996)2
Rock avalanche (D) 1947? 105 513 May 21 Read (1979)
Debris flow (Cp) 1970-19723 2× 10⁵ 476 July 13 Jordan (1994)
Rock avalanche (D) 1975, July 22 1.2 × 10⁷ 782 Nov. 5 Mokievsky-Zubok (1977)
Debris flows (NG) Early 1980s4 ? - - Jordan (1994)
Debris flow (A) 1984, Oct. ? 1110 Oct. 8 Jordan (1994)
Debris flow (HS) 1984, Oct. 6 × 10⁴ 1110 Oct. 8 Jordan (1994)
Rock avalanche (M) 1986, Mar./Apr. 105-106 592 May 26 Evans (1987)
Debris flow (B) 1987, Aug. 5 × 10⁴ 534 June 12 Jordan (1994)
Debris flow (Cn) 1987, Aug. 1 × 10⁴ 534 June 12 Jordan (1994)
Debris flow (B) 1988, Sep. 5 × 10³ 358 July 27 Jordan (1994)
Debris flow (B) 1989, Nov. 25 × 104 400 June 14 Jordan (1994)
Debris flow (NG) 1990, Oct. 1 × 10⁴ 591 Nov. 12 Jordan (1994)
Debris flow (Cn) 1990, Oct. 2 × 10⁴ 591 Nov. 12 Jordan (1994)
Debris flow (Cp) 1998, July 29 1.2 × 10⁶ 450 July 17 Bovis & Jakob (2000)
Notes: A = Affliction Creek; B = Boundary Creek; Cn = Canyon Creek; Cp = Capricorn Creek; D = Devastation Creek; HS = Hot Springs Creek; M= Meager Creek; NG = No Good Creek.
1 Maximum annual daily discharge of Lillooet River.
2 The age of this landslide is uncertain. Croft (1983, p. 6.1) states that the landslide “probably occurred within fifteen years prior to 1937”, whereas dendrochronological studies by Jakob (1996) reveal a date of 1933/1934.
3 Date of debris flow is estimated to be between 1970 and 1972 based on airphotos taken in 1973 (Jordan, 1994).
4 At least three debris flows have travelled down No Good Creek (Jordan, 1994).

183
Appendix G. Interview questions
Participant background information
Participant’s name:_______________________________
Participant’s official employment title:_____________________________
Can you describe your daily work and responsibilities?
How long have you been working in your current position?
What kind of education/ training do you have?
Research question
How do new developments/knowledge in science and technology (including government publications) contribute to or impede flood hazard management at the local level (i.e. in a small town such as Pemberton)?
Subheading 1:
Scientific knowledge and government flood management guidelines are available, but the geographic setting and societal changes and demands (i.e. population growth, infrastructure growth, other societal needs) are preventing their effective use (after White et al., 2001)
Would you agree or disagree with the following statement?
“Scientific knowledge needed for flood management in Lillooet River valley is generally available”
Prompts:
What kinds of knowledge do you think are needed? In particular, what kind of earth science information would you need?
Why do you think this knowledge is unavailable?
Does the local situation (i.e. geographical situation, fast-growing population) require certain types of research or information?
Do you think available scientific knowledge has been well-used in flood management in Lillooet River valley? Why or why not? Can you give an example?
Prompts
Unsolicited research
Are you aware of the article in the Vancouver Sun concerning the lack of use of a scientific study on landslides at Mount Meager and the hazard they pose to Pemberton and Mount Currie? [show article to participant]
How does the local government respond to unsolicited research?
Who decides what to do with the information from unsolicited research? Who decides how relevant the information is?
Have results from unsolicited research had any influence on current flood policy?

184
Have any conflicts arisen (e.g. within the community) regarding to the lack of use of unsolicited studies [again point the participant to the Vancouver Sun article].
Subheading 2:
Scientific knowledge is available and the local flood manager is aware of it, but does not have time or resources to acquire and study it, or to apply it.
Do you use scientific publications, including government publications on topics, such as flood guidelines in your work? If so, how relevant are these studies to your daily work? Why or why not? If not, what is the reason you do not use scientific information in your daily work?
Prompts
Information gathering
Are you responsible for gathering scientific information? If so, where do you acquire information?
Do you attend workshops or conferences related to flood/natural hazards? Which ones? Do you have a budget for this?
Information processing
How much time during your week do you spend on flood/natural hazard issues?
How much time can you spend on keeping up-to-date with new scientific research?
How do you rate the information in scientific publications? (e.g. Is it too technical, too detailed, relevant, irrelevant?)
How do you assess the reliability of scientific studies? (e.g. do you compare with other or previous studies or similar cases? Do you check the credentials/reputation of the authors?)
Contact with experts/ scientists
Do you have contact with local experts on flood/natural hazard issues? Are they easy to reach or locate?
In the case of a hazardous event, such as the 2003 flood or the 2010 landslide, has it been easy or difficult to obtain practical advice from experts? Why do you say that?
Prompts
Are there any communication problems between you and the research community? (e.g. use of scientific jargon, different interests/perspective, misunderstanding of each other’s needs/interests)
Subheading 3
Scientific knowledge is available, but has no practical meaning or application to a local flood manager. New scientific and technological developments are often imposed on local policy makers by well-meaning scientists (top-down approach), but do not necessarily reflect the needs of the local community.
Would you agree or disagree with the following statements? Why or why not?
“Scientific knowledge provides valuable new and practical information for local flood management”
“Scientific studies are often conducted without prior contact with the stakeholders”

185
Prompts
What kind of research is of interest to you?
How can scientific studies improve or better reflect the needs of the local community?
Closing questions
Who else would you recommend that I interview in order to understand how scientific research affects floodplain management in Lillooet River valley?
Do you have any comments or suggestions for researchers who work on a practical problem, such as flooding in Lillooet River valley, for cooperation with local governments?
How can researchers make their work more meaningful to you?
Do you have any other thoughts or comments you wish to share?

186
Appendix H. Flood policies and programs
Federal flood policies and programs
Canada Water Conservation Assistance Act (1953-1970)
The provinces were given primary control over natural resources, including water, in the Constitution Act of 1867 (Environment Canada, 2012a), The Federal Government, however, retained sole jurisdiction over Canada-wide and foreign water matters, such as fisheries, and navigation (Pearse and Quinn, 1996).
The Government of British Columbia formed organized dyking districts in 1873 (Environment Canada, 1993). Before 1953, however, there were no provincial or federal acts or guidelines on flood management in Canada. In 1953, the Federal Government created the Canada Water Conservation Assistance Act, the first act to address water conservation and water control. This act provided federal assistance to provincial governments for projects that exceed their financial capacity. Under the act, the Federal Government is mandated to contribute up to 37.5% of total costs, not to exceed the provincial contribution (Environment Canada, 1993).
Canada Water Act (1970-ongoing)
The Canada Water Conservation Assistance Act was replaced by the Canada Water Act (CWA) in 1970 in response to deficiencies in the former, i.e. limited eligible works, emphasis on engineering, limited input of responsible federal agencies to the planning process, and lack of public participation (Booth and Quinn, 1995). An aim of the new act was to facilitate cooperation between the federal and provincial governments on matters related to water management. The act recognizes that the provinces are owners of freshwater bodies and manage them on a daily basis. The federal government, however, has related responsibilities, such as fisheries, navigation, and external affairs (Environment Canada, 2012c). The CWA ensures that, in the case of water bodies of national interest, the provinces and the Federal Government may jointly perform research, formulate water management plans, and implement water management projects (Environment Canada, 1993; Booth and Quinn, 1995).
Specifically, the Canada Water Act consists of four parts (Booth and Quinn, 1995):
1. A federal-provincial framework that enables “consultative arrangements and … comprehensive agreements to develop and implement plans for the management of water resources of significant national interest” (Booth and Quinn, 1995, p. 66). This framework allows the federal Minister of Energy, Mines and Resources to procure research or collect data directly or cooperatively with any other governments or jurisdictions;
2. The establishment of joint federal and provincial agencies “to plan and implement clean-up programs by charging polluters fees for their effluent where water quality has become “a matter of national concern” (Booth and Quinn, 1995, p. 66);
3. The regulation of the concentration of nutrients in cleaning agents and water conditioners, which is mainly aimed at reducing phosphates in laundry detergents that damage the ecosystems of Canadian lakes and rivers; and
4. The provision of general administration, including public information programs and advisory bodies.
From its inception in 1970 until 1999, about 70 federal-provincial agreements were carried out, and federal contribution through the CWA were more than $200 million dollars (Booth and Quinn,

187
1995). The federal contributions were matched or exceeded by provincial governments. Despite to the aim of reducing emphasis on engineering, about half of the expenditures in the first 15 years of the program were on engineering works in four provinces – British Columbia, Quebec, Ontario, and Manitoba (Booth and Quinn, 1995).
Flood Damage Reduction Program (1975-1999)
The Flood Damage Reduction Program (FDRP) was established in 1975 in response to increasing federal spending on flood damage (Bruce, 1976; Environment Canada, 1993). The reliance on structural works had, until then, led to a false sense of security, which attracted people and investment to floodplains (Bruce, 1976).
The FDRP was a cooperative program between the federal and provincial governments aimed at reducing development in flood-prone areas. Floodplains and other vulnerable areas were to be identified and mapped, and the information made available to the public. The provincial and federal governments agreed on the following:
“1. They will not build, approve or finance flood-prone development in the designated flood risk area;
2. They will not provide flood disaster assistance for any development built after an area becomes designated (except for flood-proofed development in the flood fringe); and
3. The provinces will encourage local authorities to zone on the basis of flood risk.” (Environment Canada, 1993, p. 98)
The Federal Government defined the flood-risk area as that inundated by the 1-in-100-year flood. In the floodplain mapping agreement between Canada and British Columbia, signed in 1987, however, the flood risk-area is defined as the 1-in-200-year flood. The Government of British Columbia does not consider that dikes decrease the size of the floodplain, as they will eventually fail (Environment Canada, 1993). Federal involvement and financial contribution to the FDRP ended in early 1999, leaving the provinces solely responsible for flood damage reduction (De Loë, 2000).
Federal Water Policy Act (1987)
The Federal Water Policy Act was enacted in 1987 after several years of consultation and considering the earlier reactive approach to water issues, growing awareness and concern among the public about water problems, and the huge number of water bodies in Canada that must be protected from pollution and overuse (Environment Canada, 2012b). The Policy has two main goals:
1. To protect and enhance the quality of the water resource; and
2. To promote the wise and efficient management and use of water.
(Environment Canada, 2012b)
Although the Federal Water Policy is not aimed at flood management, its five strategies (water pricing, science leadership, integrated planning, legislation, and public awareness) provide the structure for action on all water-related issues, including flooding, and they guide federal and provincial actions (Environment Canada, 2012b).

188
Provincial policies and programs
Flood management developments 1970-1974
In recognition of the need for both structural and non-structural approaches to reduce flooding, the Government of British Columbia created the Floodplain Management Branch around 1970 (Day, 1999). The Branch adopted an innovative approach to flood control by considering fisheries, agriculture, and recreation activities in addition to flood control. The Branch also worked jointly with western U.S. states on trans-boundary floods and engaged stakeholders across the province in discussions on flood management policies (Day, 1999). The Floodplain Management Branch had 50 employees in the 1980s, but was disbanded in 1994, and most of its work was taken over by the remaining staff (currently 10 full-time staff) of the Water Management Branch (Neil Peters, Inspector of Dikes, Ministry of Forests, Lands, Natural Resource Operations, 2012, personal communication).
In 1973, the Government of British Columbia enacted the Land Commission Act (Day, 1999; Province of British Columbia, 2002). The objective of this act is to protect agricultural lands from development. An ancillary benefit is non-structural flood protection.
Another non-structural flood control measure is within the Land Title Act, which was approved in 1974. This act requires that subdivisions in areas subject to flooding are properly zoned and, where required, appropriate flood-proofing measures taken (Day, 1999).
Floodplain Development Control Program (1975-2003)
In 1975, British Columbia established the Floodplain Development Control Program to control new development on flood-prone lands and reduce future flood impacts. Local governments were required to implement bylaws relating to development on the floodplains in their jurisdiction, under the supervision of the Minister of Environment, Lands and Parks. This program was terminated in 2003 with major legislative changes to British Columbia’s flood policy (Neil Peters, Inspector of Dikes, Ministry of Forests, Lands, Natural Resource Operations, 2012, personal communication).
Disaster Financial Assistance (1990-ongoing)
Provincial disaster financial assistance has been provided in British Columbia for more than 20 years (Johanna Morrow, Manager Recovery and Funding Programs, Emergency Management BC, personal communication, 2012). Since 1995, the Disaster Financial Assistance (DFA) program has operated under the Emergency Program Act of 1993 (revised in 2004). Qualifying homeowners, residential tenants, farm owners, and charitable or volunteer organizations can apply for all uninsured disaster damage exceeding $1000, up to a maximum of $300,000 (Emergency Management BC, 2011). Local governments can apply for DFA to cover emergency response measures authorized by the Provincial Emergency Program (PEP), as well as for “..recovery measures to replace essential materials and rebuild or replace essential public infrastructures to the condition it was in before the disaster” (Emergency Management BC, 2011).
Emergency Program Act, Flood Relief Act (1996-ongoing)
The Emergency Program Act became law in 1996 and is administered under the Ministry of Public Safety and Solicitor General. It provides the Director of the Provincial Emergency Program (PEP) the authority to declare a State of Emergency anywhere in the Province of British Columbia. The Director can then employ or summon non-government personnel, use private property, and initiate evacuations. Similar powers are granted to local authorities that have an emergency plan and emergency coordinators in place (B.C. Ministry of Environment, 2011b).

189
The Flood Relief Act of 1996 gives the Lieutenant Governor in Council the authority for flood-control measures. It furthermore grants powers to municipalities in British Columbia that have been declared a flood-relief area by the Lieutenant Governor in Council (Province of British Columbia, 1996).
Flood Hazard Statutes Amendment Act; Drainage, Ditch and Dike Act; Dike Maintenance Act; Land Title Act; and Local Government Act (2003)
In 2003 major changes were made to flood hazard management in British Columbia (Ministry of Environment, Water Stewardship, 2011). Changes to the Drainage, Ditch and Dike Act allow local governments to form larger dyking districts from several smaller ones. Revisions to the Dike Maintenance Act allow the provincial Inspector of Dikes to set provincial standards for dyke protection and maintenance. The revised Land Title Act allows local and provincial approving officers to determine requirements for subdivisions in flood-prone areas and to request engineering reports on safety for intended use. And, finally, through changes to the Local Government Act, local governments are now responsible for developing flood-hazard bylaws without the requirement for Provincial approval, although within the scope of government policies and guidelines.
Formation of Emergency Management British Columbia (2006)
Emergency Management British Columbia (EMBC) was created in 2006 from the Provincial Emergency Program (PEP), Office of the Fire Commissioner, and the B.C. Coroners Service (Province of British Columbia, 2006). The main aims of EMBC are to increase the state of disaster readiness and to improve disaster response capabilities and efficiencies through coordinated consultation, policy development, planning, resource deployment, and coordinated on-the-ground rescue efforts across agencies (B.C. Ministry of Public Safety and Solicitor General, 2006).
Flood Protection Program (2007-ongoing)
EMBC-eligible applicants (municipalities, regional districts, and dyking authorities) can acquire funding for projects that reduce flood hazard in British Columbia through the Flood Protection Program, established in 2007. Funding comes from EMBC and the Federal Building Canada Plan (BCP; Province of British Columbia, 2010). Eligible projects include construction of new flood-protection infrastructure and maintenance or repair of existing flood-protection works.
All-Hazard Plan and British Columbia Flood Response Plan (2012)
In 2012, EMBC issued the All-Hazard Plan and the British Columbia Flood Response Plan. The All-Hazard Plan applies to all geological and weather-related hazards, hazardous material and spills, disease and pandemics, and terrorism that require the activation of EMBC Emergency Operation Centres (EOCs). The Plan describes the roles and responsibilities of provincial and federal ministries and agencies, non-governmental organizations, volunteers, and the private sector.
The British Columbia Flood Response Plan of 2012 replaces the BC Flood Plan of 2007. It “describes the methodology the provincial government will utilize for coordinating activities to manage a flood event, including clarifying the roles and responsibilities of the ministries involved in flood management during an integrated provincial response event” (Emergency Management British Columbia, 2012). The focus of the Plan is on “readiness and response activities of the provincial government at the regional and local level” (Emergency Management British Columbia, 2012). The Plan is aimed at large floods that require multi-jurisdictional or multi-agency response.