
FLIGHT SUPPORT LECTURE GUIDE AERODYNAMICS T-45TS
134
NAVAL AIR TRAINING COMMAND NAS CORPUS CHRISTI, TEXAS CNATRA P-1287 (Rev. 08-09) PAT FLIGHT SUPPORT LECTURE GUIDE AERODYNAMICS T-45TS, TAILHOOK, AND IUT 2009
Transcript of FLIGHT SUPPORT LECTURE GUIDE AERODYNAMICS T-45TS

NAVAL AIR TRAINING COMMAND NAS CORPUS CHRISTI, TEXAS CNATRA P-1287 (Rev. 08-09) PAT
FLIGHT SUPPORT LECTURE GUIDE
AERODYNAMICS
T-45TS, TAILHOOK, AND IUT
2009


iii
FLIGHT SUPPORT LECTURE GUIDE
FOR
AERODYNAMICS
P-1287

iv
LIST OF EFFECTIVE PAGES
Dates of issue for original and changed pages are: Original...0...15 Sep 99 (this will be the date issued) Revision1…0…07 Oct 09 TOTAL NUMBER OF PAGES IN THIS PUBLICATION IS 134 CONSISTING OF THE FOLLOWING:
Page No. Change No. Page No. Change No
COVER 0
LETTER 0
iii - x 0
1-1 – 1-27 0
1-28 (blank) 0
2-1 – 2-38 0
3-1 – 3-28 0
4-1 – 4-28 0
A-1 – A-2 0

v
INTERIM CHANGE SUMMARY The following Changes have been previously incorporated in this manual:
CHANGE NUMBER
REMARKS/PURPOSE
The following interim Changes have been incorporated in this Change/Revision:
INTERIM CHANGE NUMBER
REMARKS/PURPOSE
ENTERED
BY
DATE

vi
TABLE OF CONTENTS LIST OF EFFECTIVE PAGES.................................................................................................. iv INTERIM CHANGE SUMMARY...............................................................................................v TABLE OF CONTENTS ............................................................................................................ vi TABLE OF FIGURES............................................................................................................... viii CHAPTER ONE - HIGH-SPEED FLIGHT ........................................................................... 1-1
100. INTRODUCTION – N/A ............................................................................................. 1-1 101. LESSON OBJECTIVES............................................................................................... 1-2 102. MOTIVATION............................................................................................................. 1-3 103. OVERVIEW ................................................................................................................. 1-3 104. PRESENTATION......................................................................................................... 1-3 105. SUMMARY................................................................................................................ 1-25 106. CONCLUSION........................................................................................................... 1-26
CHAPTER TWO - SLOW-SPEED FLIGHT, STALL AND SPIN, AND AOA SYSTEM 2-1
200. INTRODUCTION – N/A ............................................................................................. 2-1 201. LESSON OBJECTIVES............................................................................................... 2-2 202. MOTIVATION............................................................................................................. 2-3 203. OVERVIEW ................................................................................................................. 2-3 204. REFRESHER................................................................................................................ 2-4 205. PRESENTATION......................................................................................................... 2-4 206. SUMMARY................................................................................................................ 2-37 207. CONCLUSION........................................................................................................... 2-37
CHAPTER THREE - STABILITY.......................................................................................... 3-1
300. INTRODUCTION – N/A ............................................................................................. 3-1 301. LESSON OBJECTIVES............................................................................................... 3-2 302. MOTIVATION............................................................................................................. 3-3 303. OVERVIEW ................................................................................................................. 3-3 304. REFRESHER................................................................................................................ 3-3 305. PRESENTATION......................................................................................................... 3-4 306. SUMMARY................................................................................................................ 3-28 307. CONCLUSION........................................................................................................... 3-28
CHAPTER FOUR - NATOPS PERFORMANCE CHARTS T-45C CHARTS AND EXAM REVIEW T-45A......................................................................................................................... 4-1
400. INTRODUCTION – N/A ............................................................................................. 4-1 401. LESSON OBJECTIVES............................................................................................... 4-2 402. MOTIVATION............................................................................................................. 4-2 403. OVERVIEW ................................................................................................................. 4-2 404. PRESENTATION......................................................................................................... 4-2 405. SUMMARY................................................................................................................ 4-28 406. CONCLUSION........................................................................................................... 4-28

vii
APPENDIX A - GLOSSARY................................................................................................... A-1 A100. INTRODUCTION – N/A ............................................................................................ A-1

viii
TABLE OF FIGURES Figure 1-1 Pressure Wave Formation................................................................................. 1-4 Figure 1-2 Flow About an Airfoil........................................................................................ 1-5 Figure 1-3 Temperature and Speed of Sound Relationship ............................................. 1-6 Figure 1-4 Critical Mach Number ...................................................................................... 1-7 Figure 1-5 Force Divergence Mach Number...................................................................... 1-8 Figure 1-6 Compression Wave Formation ......................................................................... 1-9 Figure 1-7 Detail of Bow Wave.......................................................................................... 1-10 Figure 1-8 High-Speed Drag Characteristics................................................................... 1-11 Figure 1-9 Airframe Buffeting........................................................................................... 1-12 Figure 1-10 Tuck Under....................................................................................................... 1-12 Figure 1-11 Midspan Vortex................................................................................................ 1-13 Figure 1-12 Transonic Lift Distribution............................................................................. 1-14 Figure 1-13 Cause of Reduced T-45 Stability in Transonic Flight .................................. 1-14 Figure 1-14 Thickness-to-Chord Ratio ............................................................................... 1-15 Figure 1-15 Effect of Low Thickness-to-Chord Ratio Airfoil on Shock Wave
Formation ......................................................................................................... 1-16 Figure 1-16 Effect of Wing Sweep on High-Speed Airflow .............................................. 1-17 Figure 1-17 Effect of Wing Sweep on Drag........................................................................ 1-17 Figure 1-18 Area Rule .......................................................................................................... 1-18 Figure 1-19 Transonic/Supersonic Flight Controls ........................................................... 1-19 Figure 1-20 Transonic/Supersonic Flight Controls ........................................................... 1-20 Figure 1-21 Supersonic Flow in an Engine Inlet................................................................ 1-20 Figure 1-22 Fully Powered Control System ....................................................................... 1-21 Figure 1-23 Conventional Control System ......................................................................... 1-22 Figure 1-24 Vortex Generators on the T-45....................................................................... 1-22 Figure 1-25 Rudder Shock Stabilization Strips ................................................................. 1-23 Figure 1-26 Aft Movement of the Center of Pressure ....................................................... 1-24 Figure 1-27 Transonic Lift Distribution............................................................................. 1-25
Figure 2-1 Slow Flight .......................................................................................................... 2-3 Figure 2-2 Flow Separation ................................................................................................. 2-5 Figure 2-3 Leading Edge Vortexing.................................................................................... 2-6 Figure 2-4 Tip Stall............................................................................................................... 2-7 Figure 2-5 Effect of Geometric Twist, Flaps, and Slats .................................................... 2-9 Figure 2-6 Slats ................................................................................................................... 2-10 Figure 2-7 Vortex Generators ........................................................................................... 2-11 Figure 2-8 Stall Strips......................................................................................................... 2-12 Figure 2-9 Stabilator Vanes ............................................................................................... 2-13 Figure 2-10 T-45 Stall Characteristics................................................................................ 2-14 Figure 2-11 Aerodynamics of a Stall................................................................................... 2-15 Figure 2-12 T-45 Stall........................................................................................................... 2-15 Figure 2-13 Stall Progression Diagram .............................................................................. 2-16 Figure 2-14 Adverse Yaw Departure .................................................................................. 2-17 Figure 2-15 Adverse Yaw Departure .................................................................................. 2-17

ix
Figure 2-16 Cross-controlled Departure ............................................................................ 2-18 Figure 2-17 Cross-controlled Departure ............................................................................ 2-19 Figure 2-18 60-70 Degree Departure .................................................................................. 2-19 Figure 2-19 60-70 Degree Departure .................................................................................. 2-20 Figure 2-20 Pitchdown Departure....................................................................................... 2-20 Figure 2-21 Pitchdown Departure....................................................................................... 2-21 Figure 2-22 Nose High Departures...................................................................................... 2-22 Figure 2-23 80-100 Degree Departure ................................................................................ 2-24 Figure 2-24 80-100 Degree Departure ................................................................................ 2-24 Figure 2-25 Rudder Blowout ............................................................................................... 2-25 Figure 2-26 Spin Characteristics......................................................................................... 2-26 Figure 2-27 Upright Spins.................................................................................................... 2-26 Figure 2-28 Upright Spin ..................................................................................................... 2-27 Figure 2-29 Inverted Spin .................................................................................................... 2-28 Figure 2-30 Inverted Spin .................................................................................................... 2-28 Figure 2-31 Upright Spin Indications ................................................................................. 2-29 Figure 2-32 Inverted Spins (Steady-State Indications) ..................................................... 2-30 Figure 2-33 Stall Progression Diagram .............................................................................. 2-31 Figure 2-34 AOA System Theory ........................................................................................ 2-32 Figure 2-35 AOA Components ............................................................................................ 2-34 Figure 2-36 T-45 Navigation Approach HUD Display...................................................... 2-36
Figure 3-1 T-45...................................................................................................................... 3-3 Figure 3-2 Center of Gravity/Aerodynamic Center Relationship to Stability................ 3-4 Figure 3-3 Fully Powered Control System ......................................................................... 3-5 Figure 3-4 Conventional Control System ........................................................................... 3-6 Figure 3-5 Coefficient of Lift Curve: Straight vs Swept Wing......................................... 3-7 Figure 3-6 Induced Drag...................................................................................................... 3-8 Figure 3-7 Mean Aerodynamic Chord................................................................................ 3-9 Figure 3-8 Aspect Ratio...................................................................................................... 3-10 Figure 3-9 Taper ................................................................................................................. 3-11 Figure 3-10 Thickness .......................................................................................................... 3-11 Figure 3-11 Swept Wing Tip Stall ....................................................................................... 3-12 Figure 3-12 Leading Edge Vortexing.................................................................................. 3-13 Figure 3-13 Effect of Geometric Twist ............................................................................... 3-14 Figure 3-14 Stall Strips......................................................................................................... 3-15 Figure 3-15 Center of Gravity Travel................................................................................. 3-16 Figure 3-16 Center of Gravity/Aerodynamic Center Relationship to Stability.............. 3-17 Figure 3-17 Longitudinal Stability -- Gear, Flap/Slat Extension ..................................... 3-18 Figure 3-18 Longitudinal Stability -- Speed Brake Effect ................................................ 3-19 Figure 3-19 Stabilator Vane................................................................................................. 3-20 Figure 3-20 Landing Gear Doors Effect on Directional Stability .................................... 3-21 Figure 3-21 Stability vs Maneuverability ........................................................................... 3-22 Figure 3-22 Directional Divergence .................................................................................... 3-24 Figure 3-23 Coupling............................................................................................................ 3-25 Figure 3-24 Dutch Roll ......................................................................................................... 3-26

x
Figure 3-25 Spiral Divergence ............................................................................................. 3-27 Figure 3-26 Crosswind Handling ........................................................................................ 3-28
Figure 4-1 NATOPS Chart .................................................................................................. 4-4 Figure 4-2 NATOPS Chartwork Techniques..................................................................... 4-5 Figure 4-3 Density Ratio Chart ........................................................................................... 4-6 Figure 4-4 Takeoff Distance — Half Flaps......................................................................... 4-7 Figure 4-5 Takeoff Distance — Half Flaps, completed ..................................................... 4-8 Figure 4-6 Velocity During Takeoff Ground Run ............................................................. 4-9 Figure 4-7 Velocity During Takeoff Ground Run ........................................................... 4-10 Figure 4-8 Maximum Abort Speed - DRY RUNWAY.................................................... 4-11 Figure 4-9 Maximum Abort Speed - WET RUNWAY ................................................... 4-12 Figure 4-10 Maximum Abort Speed - WET RUNWAY ................................................... 4-13 Figure 4-11 Compressibility Correction to Calibrated Airspeed..................................... 4-14 Figure 4-12 Climb Speed Schedule ..................................................................................... 4-15 Figure 4-13 Time to Climb................................................................................................... 4-16 Figure 4-14 Time to Climb................................................................................................... 4-17 Figure 4-15 BINGO, Gear Up - Flaps Up, Zero Fuel Weight - 10, 500 Pounds ............. 4-18 Figure 4-16 Landing Approach Speed................................................................................ 4-19 Figure 4-17 Landing Distance ............................................................................................. 4-21 Figure 4-18 Landing Distance ............................................................................................. 4-22 Figure 4-19 Dive Recovery................................................................................................... 4-23 Figure 4-20 Dive Recovery................................................................................................... 4-24 Figure 4-21 Operating Envelope ......................................................................................... 4-25 Figure 4-22 T-45 Acceleration Limits................................................................................. 4-26 Figure 4-23 External Stores Limitations ............................................................................ 4-27

HIGH-SPEED FLIGHT 1-1
CHAPTER ONE HIGH-SPEED FLIGHT
100. INTRODUCTION – N/A COURSE/STAGE: - T-45TS, TAILHOOK, AND IUT/Aerodynamics LESSON TITLE: - High-Speed Flight LESSON IDENTIFIER: - T-45A/C TS, TAILHOOK, AND IUT Aero 02 LEARNING ENVIRONMENT: - Classroom ALLOTTED LESSON TIME: - 1.0 hr TRAINING AIDS: 1. T-45 Scale Model 2. Figures
- Figure 1: Flow About an Airfoil - Figure 2: Compression Wave Formation - Figure 3: T-45 Midspan Vortex - Figure 4: Transonic Lift Distribution - Figure 5: Cause of Reduced T-45 Stability in Transonic Flight - Figure 6: Effect of Wing Sweep on High-Speed Airflow - Figure 7: Area Rule - Figure 8: Transonic/Supersonic Flight Controls

CHAPTER ONE T-45TS, TAILHOOK, AND IUT AERODYNAMICS
1-2 HIGH-SPEED FLIGHT
- Figure 9: Transonic/Supersonic Flight Controls - Figure 10 Supersonic Flow in an Engine Inlet - Figure 11: Vortex Generators on the T-45
STUDY RESOURCES: 1. T-45C NATOPS Flight Manual, A1-T45AC-NFM-000 LESSON PREPARATION: - Read:
a. Part IV, Section 11.3, “General Flight Characteristics,” T-45C NATOPS Flight Manual, A1-T45AC-NFM-000
b. Aero-02 Lesson Guide
REINFORCEMENT: - N/A EXAMINATION: The objectives in this lesson will be tested in Aerodynamics 07X. 101. LESSON OBJECTIVES 1. Identify effects of high-speed flight on aircraft 2. Recall T-45 high-speed flight characteristics 3. State methods utilized to overcome the effects and permit high-speed flight

T-45TS, TAILHOOK, AND IUT AERODYNAMICS CHAPTER ONE
HIGH-SPEED FLIGHT 1-3
102. MOTIVATION Flight at high Mach numbers affects an aircraft differently than at low Mach numbers. Understanding the effect of compressibility at high Mach numbers is important to you because of the effects on stability, lift, and drag. Knowing the flight characteristics of the T-45 during high-speed flight will help you, as a pilot, realize the maximum potential of the aircraft. 103. OVERVIEW Aircraft that are capable of high-speed flight look different from those developed for low-speed flight. Many significant differences exist between high-speed and low-speed aerodynamics. The nature and cause of these differences and their application to the T-45 will be discussed in this lecture. In this lesson, we will be discussing: 1. The effects of high-speed flight on aircraft 2. Methods used to overcome effects and permit high-speed flight 104. PRESENTATION Effects of High-speed Flight on Aircraft 1. Flight Regimes
a. Compressibility
i. Normally ignored in study of subsonic flight ii. Not limited to flight greater than speed of sound iii. Progressive and effect may be experienced well below the speed of sound
b. Flight Regimes
i. Subsonic -- all airflow about the aircraft is subsonic ii. Transonic -- there is a mixed airflow about the aircraft, that is part subsonic and
part supersonic iii. Supersonic -- all airflow about the aircraft is supersonic
2. Velocity and Pressure Changes

CHAPTER ONE T-45TS, TAILHOOK, AND IUT AERODYNAMICS
1-4 HIGH-SPEED FLIGHT
Figure 1-1 Pressure Wave Formation
a. Occur as an object moves through an airmass b. Create pressure disturbances in the airflow surrounding the object
i. Series of pressure waves transmitted from one molecule to another
(a). Extend in all directions (b). Spread well ahead of the object when object is traveling at a slow speed (c). Warn the air ahead and help the airflow around the object

T-45TS, TAILHOOK, AND IUT AERODYNAMICS CHAPTER ONE
HIGH-SPEED FLIGHT 1-5
Figure 1-2 Flow About an Airfoil
(d). Spread at the speed of sound
(1). Speed of sound depends on air temperature, i.e., at 59 degrees F, the sea level speed of sound is 662 knots; at 90 degrees, it is 687 knots; at 32 degrees, it is 643 knots
(2). Speed of sound decreases with altitude

CHAPTER ONE T-45TS, TAILHOOK, AND IUT AERODYNAMICS
1-6 HIGH-SPEED FLIGHT
Figure 1-3 Temperature and Speed of Sound Relationship
c. Compressibility effects occur at lower IAS as altitude increases d. Relationship described by Mach number (the ratio of true airspeed to the speed of
sound)
i. Compressibility effects (assume high thickness-to-chord ratio and rounded large radius leading edge)
ii. Local sonic flow on airfoil at speed less than Mach 1 iii. Critical Mach number

T-45TS, TAILHOOK, AND IUT AERODYNAMICS CHAPTER ONE
HIGH-SPEED FLIGHT 1-7
Figure 1-4 Critical Mach Number
(a). Flight Mach number at which the first sonic flow on the aircraft occurs (b). Important reference point because it is the beginning of the transonic
flight regime
(1). Airflow is mixed--part subsonic, part supersonic (2). 0.8 Mach in T-45
i) Occurs on wingtips
ii) Occurs on landing gear door blister
iv. Force divergent Mach number

CHAPTER ONE T-45TS, TAILHOOK, AND IUT AERODYNAMICS
1-8 HIGH-SPEED FLIGHT
Figure 1-5 Force Divergence Mach Number
(a). Approximately 5% above critical Mach number (0.85 Mach in T-45) (b). Pressure waves pile up to form normal compression wave, and flow is
slowed to subsonic. (c). Rapid rise in drag
(1). Due to heating of air being compressed (2). Boundary layer separation
(d). Airflow just in front of compression wave has highest speed and lowest pressure.
NOTE
The following does not occur in the T-45.

T-45TS, TAILHOOK, AND IUT AERODYNAMICS CHAPTER ONE
HIGH-SPEED FLIGHT 1-9
Figure 1-6 Compression Wave Formation
e. Waves continue to move aft and attach to the trailing edge as aircraft speed increases. f. Area in front of waves continues to send out pressure warnings.

CHAPTER ONE T-45TS, TAILHOOK, AND IUT AERODYNAMICS
1-10 HIGH-SPEED FLIGHT
g. As aircraft speed increases, waves pile up and form a bow wave which leading edge catches up to.
i. If leading edge radius is small enough or sharp, the bow wave will attach. ii. If bow wave does not attach, an area of stagnation and large drag values will
occur. iii. Until bow wave attaches, part of flow is subsonic and aircraft remains in the
transonic flight regime; aircraft is not in supersonic flight regime until all airflow about it is supersonic.
Figure 1-7 Detail of Bow Wave
h. Increased by transonic and supersonic flight
i. Occurs at the force divergent Mach number and continues to build ii. Rate of total aircraft drag rise decreases as the bow wave attaches
T-45TS, TAILHOOK, AND IUT AERODYNAMICS CHAPTER ONE
HIGH-SPEED FLIGHT 1-11
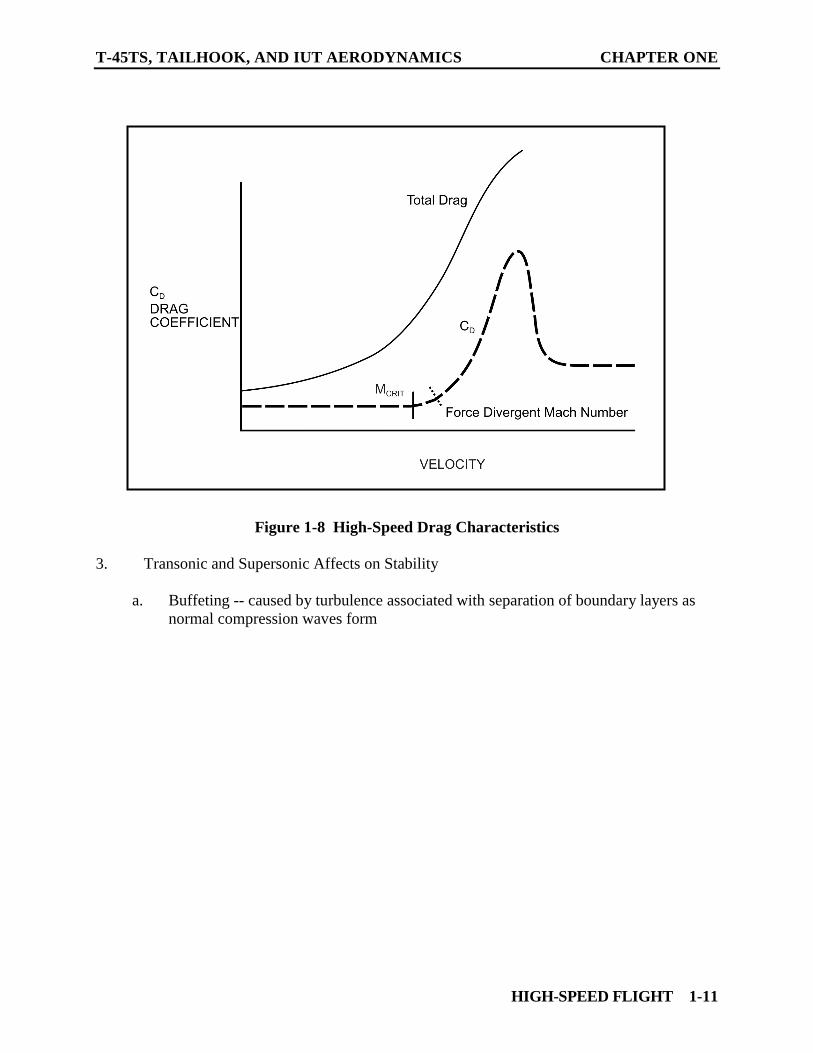
Figure 1-8 High-Speed Drag Characteristics 3. Transonic and Supersonic Affects on Stability
a. Buffeting -- caused by turbulence associated with separation of boundary layers as normal compression waves form

CHAPTER ONE T-45TS, TAILHOOK, AND IUT AERODYNAMICS
1-12 HIGH-SPEED FLIGHT
Figure 1-9 Airframe Buffeting
b. Tuck under
i. Aerodynamic center moves aft, causing a nose down pitch or “tuck under”
Figure 1-10 Tuck Under
ii. Further increase in flight speed causes a bottom shock iii. Transonic pitch characteristics
(a). Dive recovery: 0.85-0.90 Mach

T-45TS, TAILHOOK, AND IUT AERODYNAMICS CHAPTER ONE
HIGH-SPEED FLIGHT 1-13
(b). Nose-up pitch attributed to an increase in the downwash angle at the horizontal tail
(c). Increased downwash attributed to spanwise lift distribution
(1). Strongest lift gradient normally near wingtip, resulting in wingtip
vortexing (2). Midspan shock-induced separation results in reduction in lift over
outer 40% of wing, resulting in large lift gradient at midspan (3). Caused by midspan vortex
Figure 1-11 Midspan Vortex

CHAPTER ONE T-45TS, TAILHOOK, AND IUT AERODYNAMICS
1-14 HIGH-SPEED FLIGHT
Figure 1-12 Transonic Lift Distribution
Figure 1-13 Cause of Reduced T-45 Stability in Transonic Flight

T-45TS, TAILHOOK, AND IUT AERODYNAMICS CHAPTER ONE
HIGH-SPEED FLIGHT 1-15
Methods Used to Overcome Effects and Permit High-speed Flight 1. High-speed aircraft design
NOTE
Aircraft designed to fly at near transonic or supersonic speeds all have features incorporated in their design to delay onset of critical Mach number, reduce wave drag, reduce or eliminate “tuck under”, reduce flow separation, and maintain engine performance.
a. Thin airfoil sections of low thickness-to-chord ratio
Figure 1-14 Thickness-to-Chord Ratio
i. Do not accelerate the air to the extent that a thick airfoil does ii. Compression wave is not as strong, once formed iii. Lack structural strength and volume for landing gear and fuel iv. Sweepback (thin wing with thick section) “fools” air into thinking wing is a thin
airfoil section
(a). Airflow broken into vector components
(1). A component perpendicular to the leading edge contributes to lift; this component is less than the free stream component

CHAPTER ONE T-45TS, TAILHOOK, AND IUT AERODYNAMICS
1-16 HIGH-SPEED FLIGHT
(2). A spanwise component does not contribute to lift; this component at high AOAs/low IAS’s causes tip stalling
(3). Airflow “sees” an airfoil section of lower thickness-to-chord ratio
and smaller leading edge radius
Figure 1-15 Effect of Low Thickness-to-Chord Ratio Airfoil on Shock Wave Formation

T-45TS, TAILHOOK, AND IUT AERODYNAMICS CHAPTER ONE
HIGH-SPEED FLIGHT 1-17
Figure 1-16 Effect of Wing Sweep on High-Speed Airflow
(b). Sweepback effect on drag
Figure 1-17 Effect of Wing Sweep on Drag
(1). Reduces peak drag rise
(2). Higher critical Mach number than straight wing of same planform

CHAPTER ONE T-45TS, TAILHOOK, AND IUT AERODYNAMICS
1-18 HIGH-SPEED FLIGHT
v. Reduce wave drag and help reduce tuck-under tendencies vi. Small leading edge radius
(a). Allows bow wave to move in closer to leading edge or become attached to it
(b). Deflects airstream less than a large radius leading edge, resulting in a
weaker oblique compression wave; this reduces drag of bow wave vii. Point of maximum thickness is at 35-40% or more of the chord length instead of
25% on a conventional airfoil
- Helps reduce the pitching moment associated with shock wave formation and tuck under tendencies
b. Area rule
Figure 1-18 Area Rule
i. Minimizes drag of airplane if the distribution of its cross-sectional area (wings, fuselage, etc.) is made as smooth as possible

T-45TS, TAILHOOK, AND IUT AERODYNAMICS CHAPTER ONE
HIGH-SPEED FLIGHT 1-19
ii. Dictates reduction of cross-sectional area of the fuselage in the region of the wing and tail to compensate for the additional cross-sectional area of these surfaces
iii. At supersonic speeds, continues to provide benefits
c. Horizontal stabilizer configuration with a movable leading edge
i. Slab-type tail (stabilator), i.e., T-45, or trimmable horizontal stabilizer with elevators
ii. Effective as counter to “tuck under,” even when aft portion is behind a
compression wave; portion forward of compression wave remains effective iii. Differential stabilizer, i.e., F-14 and F-18, provide not only pitch moments, but
also rolling moments
Figure 1-19 Transonic/Supersonic Flight Controls

CHAPTER ONE T-45TS, TAILHOOK, AND IUT AERODYNAMICS
1-20 HIGH-SPEED FLIGHT
Figure 1-20 Transonic/Supersonic Flight Controls
Figure 1-21 Supersonic Flow in an Engine Inlet

T-45TS, TAILHOOK, AND IUT AERODYNAMICS CHAPTER ONE
HIGH-SPEED FLIGHT 1-21
d. Fully powered, irreversible control systems
Figure 1-22 Fully Powered Control System
i. Overcome large control forces encountered at high speeds ii. Prevent unwanted aerodynamic feedback often described as control “buzz”
e. Engine installation
- No present operational turbojet/fan engines can ingest supersonic flow
(a). All intake air must be decelerated to subsonic through a series of compression waves
(b). Exhaust gases must be accelerated above supersonic if aircraft is to
achieve supersonic flight; generally achieved through the use of a convergent-divergent duct

CHAPTER ONE T-45TS, TAILHOOK, AND IUT AERODYNAMICS
1-22 HIGH-SPEED FLIGHT
Figure 1-23 Conventional Control System 2. T-45 aircraft design
a. Swept wings (low thickness-to-chord ratio/small radius leading edge) b. Stabilator c. Vortex generators (VGs)
Figure 1-24 Vortex Generators on the T-45

T-45TS, TAILHOOK, AND IUT AERODYNAMICS CHAPTER ONE
HIGH-SPEED FLIGHT 1-23
i. Single row of 20 installed on each wing at 25% of wing chord ii. Reduce boundary layer growth and delay forward migration of the shock and
shock-induced separation iii. Primary purpose to improve longitudinal stability at speeds above Mach 0.80 Rudder Shock Stabilization Strips
d. Rudder shock stabilization strips
Figure 1-25 Rudder Shock Stabilization Strips
i. Two located on each side of vertical tail, one at 50% of tail chord and one just aft of rudder hinge line
ii. Installed after uncontrollable rudder oscillation (rudder buzz) occurred at high
speed, Mach 0.9-0.95
(a). Rudder buzz results from unstable shock wave motion and shock-induced separation
(b). Strips stabilize the shock wave motion
iii. Developed after computational flowfield analysis and flight tests 3. T-45 high-speed flight characteristics (found in NATOPS)
a. Capable of transonic flight ONLY in a dive and in a clean configuration b. Speeds up to Mach 1.04 have been achieved

CHAPTER ONE T-45TS, TAILHOOK, AND IUT AERODYNAMICS
1-24 HIGH-SPEED FLIGHT
i. No pronounced nose-down pitch transient during acceleration ii. High-speed acceleration is moderate and Mach effect is gradual
Figure 1-26 Aft Movement of the Center of Pressure iii. Very stable above Mach 1.0
c. High-speed dives
i. Slight buffeting above Mach 0.9 ii. Some pitch oscillations as center of pressure shifts aft iii. Recovery
(a). Pitch-up at about Mach 0.99 due to wing shock movement (b). Second pitch-up occurs at Mach 0.85 (same as described in VG section) (c). Should be initiated by pulling no more than 4 g’s because of the second
pitchup (this second pitchup could occur prior to Mach 0.85)

T-45TS, TAILHOOK, AND IUT AERODYNAMICS CHAPTER ONE
HIGH-SPEED FLIGHT 1-25
Figure 1-27 Transonic Lift Distribution
iv. “Heavy wing” experienced starting at about Mach 0.92
(a). May take up to 3/4 lateral stick to maintain wings level due to reduced aileron effectiveness from Mach 0.92 to Mach 0.95
(b). Heavy wing and reduced aileron effectiveness caused by shock-induced
separation on the outer 40% of the wing
v. Wing heaviness disappears and aileron effectiveness returns above Mach 0.95
NOTE
Refer to NATOPS for applicable restrictions in regard to high-speed flight maneuvering.
105. SUMMARY This lesson has focused on: 1. The effects of high-speed flight on aircraft 2. Methods used to overcome effects and permit high-speed flight

CHAPTER ONE T-45TS, TAILHOOK, AND IUT AERODYNAMICS
1-26 HIGH-SPEED FLIGHT
106. CONCLUSION Changing the geometry of the airfoil to a low aspect ratio, low camber, swept back configuration provides not only more speed but also greater maneuverability. After you get your wings, you will experience other aircraft with different characteristics and designs. Understanding the aerodynamics associated with these different designs will help you adapt to the unique characteristics of these aircraft.

T-45TS, TAILHOOK, AND IUT AERODYNAMICS CHAPTER ONE
HIGH-SPEED FLIGHT 1-27
NOTES

CHAPTER ONE T-45TS, TAILHOOK, AND IUT AERODYNAMICS
1-28 HIGH-SPEED FLIGHT
THIS PAGE INTENTIONALLY LEFT BLANK

SLOW-SPEED FLIGHT, STALL AND SPIN, AND AOA SYSTEM 2-1
CHAPTER TWO SLOW-SPEED FLIGHT, STALL AND SPIN, AND AOA SYSTEM
200. INTRODUCTION – N/A COURSE/STAGE: - TS, E2-C2, TAILHOOK AND IUT/AERODYNAMICS LESSON TITLE: - Slow-Speed Flight, Stall and Spin, and AOA System LESSON IDENTIFIER: - T-45A/C TS, E2-C2, TAILHOOK & IUT Aero-03 LEARNING ENVIRONMENT: - Classroom ALLOTTED LESSON TIME: - 1.5 hr TRAINING AIDS: 1. T-45 Scale Model 2. Figures
- Figure 1: Leading Edge Vortexing - Figure 2: Tip Stall - Figure 3: Effect of Geometric Twist, Flaps, and Slats - Figure 4: Slats - Figure 5: Stall Strips - Figure 6: T-45 Stall Characteristics - Figure 7: Stall Progression Diagram - Figure 8: Cross-Control Departure - Figure 9: Nose High Departure

CHAPTER TWO T-45TS, TAILHOOK, AND IUT AERODYNAMICS
2-2 SLOW-SPEED FLIGHT, STALL AND SPIN, AND AOA SYSTEM
- Figure 10: Spin Characteristics - Figure 11: Upright Spin Indications - Figure 12: Inverted Spins (Steady State Indications) - Figure 13: AOA System Theory - Figure 14: T-45 Navigation Approach HUD Display
STUDY RESOURCES: 1. Flight Training Instruction, Out of Control Flight Procedures, Intermediate & Advanced Strike 2. T-45A NATOPS Flight Manual, A1-T45AB-NFM-000 3. T-45C NATOPS Flight Manual, A1-T45AC-NFM-000 LESSON PREPARATION: - Read:
a. Aero-03 Lesson Guide b. Part IV, sections 11.6, “High Angle of Attack Characteristics,” T-45A NATOPS
Flight Manual, A1-T45AB-NFM-000 or T-45C NATOPS Flight Manual, A1-T45AC-NFM-000
REINFORCEMENT: - N/A EXAMINATION: - The objectives in this lesson will be tested in Aerodynamics 07X for TS, E2-C2 and Advanced. 201. LESSON OBJECTIVES 1. Identify high AOA characteristics of a swept wing 2. State factors which affect T-45 high AOA characteristics 3. Identify T-45 stall characteristics 4. Recognize causes and indications of out-of-control flight

T-45TS, TAILHOOK, AND IUT AERODYNAMICS CHAPTER TWO
SLOW-SPEED FLIGHT, STALL AND SPIN, AND AOA SYSTEM 2-3
5. State recovery techniques for out-of-control flight 6. State principles and indications of the AOA system 202. MOTIVATION The margin for error in a high performance aircraft flying straight and level at 500 KIAS and 25,000 ft is much larger than the margin for error as you approach the carrier all dirtied up at 120 KIAS with 500 ft of altitude. Most pilot-induced accidents occur during takeoff, approach, and landing; so it is critical that you understand the aerodynamics of slow-speed flight maneuvering.
Figure 2-1 Slow Flight 203. OVERVIEW This lesson is designed to prepare you for slow-speed flight in a high performance aircraft. In this lesson we will be studying: 1. Slow-speed flight 2. Stalls and spins 3. Angle-of-attack (AOA) system

CHAPTER TWO T-45TS, TAILHOOK, AND IUT AERODYNAMICS
2-4 SLOW-SPEED FLIGHT, STALL AND SPIN, AND AOA SYSTEM
204. REFRESHER Recall that: - Changing the wing’s geometry to a lower camber, a lower thickness-to-chord ratio, and a
lower aspect ratio and adding sweepback will lower the total drag of the wing, but the wing will require a higher AOA to produce the same amount of lift as a wing of higher aspect ratio. At high speeds, we benefit from these changes with better performance and maneuverability; however, the high AOA and slow-speed flight characteristics will be degraded.
205. PRESENTATION Slow-speed flight 1. Planform of T-45 aircraft
a. Two-place, lightweight aircraft with tapered (in both chord and airfoil section), swept wing
b. Advantages:
i. Increase in aspect ratio compared to a rectangular, swept wing design, resulting in reduction of induced drag
ii. Lift load decreases toward the tips, reducing need for structure iii. Structural efficiency is increased while maintaining a constant thickness ratio
c. Disadvantages:
i. Tip stall tendencies
ii. Loss of ailerons at stall iii. Negative longitudinal stability at high angles of attack
2. Wing design
- Swept wings normally exhibit tip stall tendencies because of the lower energy level of the boundary level at the tip
i. Lower energy level due to shorter tip chord compared to root chord

T-45TS, TAILHOOK, AND IUT AERODYNAMICS CHAPTER TWO
SLOW-SPEED FLIGHT, STALL AND SPIN, AND AOA SYSTEM 2-5
ii. Flow separation at tip aggravated by spanwise flow due to wing sweep; further aggravated by leading-edge vortexing
Figure 2-2 Flow Separation
(a). On a leading edge of large radius, the flow is smooth (b). On an airfoil with a small radius leading edge (T-45), the air flow tends to
“jump” around the leading edge due to the discontinuity
(1). An area of low pressure forms on the leading upper surface of the small radius leading edge
(2). High pressure air from under the wing comes around the leading
edge creating a leading edge vortex (3). Joins with spanwise flow to give tip stall

CHAPTER TWO T-45TS, TAILHOOK, AND IUT AERODYNAMICS
2-6 SLOW-SPEED FLIGHT, STALL AND SPIN, AND AOA SYSTEM
Figure 2-3 Leading Edge Vortexing

T-45TS, TAILHOOK, AND IUT AERODYNAMICS CHAPTER TWO
SLOW-SPEED FLIGHT, STALL AND SPIN, AND AOA SYSTEM 2-7
iii. As tip stalls
Figure 2-4 Tip Stall

CHAPTER TWO T-45TS, TAILHOOK, AND IUT AERODYNAMICS
2-8 SLOW-SPEED FLIGHT, STALL AND SPIN, AND AOA SYSTEM
(a). Ailerons become ineffective (b). A loss of lateral stability occurs as center of pressure of each wing moves
inboard (c). No stall warning occurs
iv. As centers of pressure move inboard on each wing, they also move forward, shifting the aerodynamic center of the aircraft forward
- If aerodynamic center shifts forward of center of gravity, aircraft will have
negative longitudinal stability, and nose will pitch up 3. High-lift devices in T-45 provide excellent slow flight characteristics
a. Geometric twist (3-1/2 degrees)
i. Reduces angle of attack of tip compared to root ii. Accomplished by reducing angle of incidence used at tip compared to root

T-45TS, TAILHOOK, AND IUT AERODYNAMICS CHAPTER TWO
SLOW-SPEED FLIGHT, STALL AND SPIN, AND AOA SYSTEM 2-9
Figure 2-5 Effect of Geometric Twist, Flaps, and Slats

CHAPTER TWO T-45TS, TAILHOOK, AND IUT AERODYNAMICS
2-10 SLOW-SPEED FLIGHT, STALL AND SPIN, AND AOA SYSTEM
b. Slotted flaps
i. Increase maximum lift coefficient attainable, but at lower AOA ii. Extension affects inboard portion of wing more than outboard portion, causing
root to operate at higher AOA (in degrees) than tip
c. Leading edge slats
Figure 2-6 Slats
i. Reduce leading edge vortexing by increasing leading edge radius ii. Increase lift coefficient over the wing at very high AOA
NOTE
In conjunction with a slat, an automatic slot is opened which allows the high pressure, high energy air from below the wing to flow into the low pressure area above the wing. This airflow is directed along the upper surface in such a manner that it increases the energy and delays boundary layer separation. See the NATOPS flight manual for further discussion of slat operation and malfunctions.
d. Row of vortex generators on leading edge of each wing

T-45TS, TAILHOOK, AND IUT AERODYNAMICS CHAPTER TWO
SLOW-SPEED FLIGHT, STALL AND SPIN, AND AOA SYSTEM 2-11
Figure 2-7 Vortex Generators
i. Small, low aspect ratio airfoils set perpendicular to wing surface with a large AOA
ii. Vortices cause high energy free-stream air to be mixed with low velocity
boundary layer air, reenergizing the boundary layer and delaying separation iii. Reduce boundary layer growth by reenergizing boundary layer
NOTE
The vortex generators were installed on the T-45 to help airflow characteristics during high-speed (high Mach) flight. However, they also improve slow-speed airflow characteristics.
e. Stall strips

CHAPTER TWO T-45TS, TAILHOOK, AND IUT AERODYNAMICS
2-12 SLOW-SPEED FLIGHT, STALL AND SPIN, AND AOA SYSTEM
Figure 2-8 Stall Strips
i. Located on inboard slat and wing leading edges to improve stall characteristics of the aircraft
ii. Cause a premature flow separation at the wing root, contributing to a root stall. iii. Slow the outward progression of stall iv. Contribute to more consistent root stall at all flap/slat settings v. Improve handling qualities at stall by controlling roll-off vi. Do not reduce maximum lift coefficient
f. Stabilator vanes

T-45TS, TAILHOOK, AND IUT AERODYNAMICS CHAPTER TWO
SLOW-SPEED FLIGHT, STALL AND SPIN, AND AOA SYSTEM 2-13
Figure 2-9 Stabilator Vanes
i. Located on both sides of fuselage, just forward of stabilator and above speed brakes
ii. Generate a vortex which passes below the stabilator iii. Vortex energizes flow over stabilator lower surface, keeping it effective,
particularly at maximum leading-edge-down stabilator deflection
NOTE
The overall effect of high-lift devices is to cause the root to stall at a lower AOA than the tip, thus giving the T-45 root stall characteristics.
Stall and Spin 1. Stall defined: when an increase in AOA produces a reduction in CL 2. T-45 stall characteristics

CHAPTER TWO T-45TS, TAILHOOK, AND IUT AERODYNAMICS
2-14 SLOW-SPEED FLIGHT, STALL AND SPIN, AND AOA SYSTEM
Note: All speeds are KIAS above stall speed.
Figure 2-10 T-45 Stall Characteristics
a. Predictable, consistent
i. Nose-high 20-degree pitch ii. Artificial stall warning iii. Airframe buffet iv. Wing drops 25-30 degrees AOB v. Nose falls through
b. Recovery neutral controls
ARTIFICIAL STALL WARNING STALL BUFFET STALL
CLEAN 21.5 Units / 10 25 Units / 1-2 26 Units / 0
APPROACH 21.5 Units / 10 28 Units / 1 29-30 Units / 0

T-45TS, TAILHOOK, AND IUT AERODYNAMICS CHAPTER TWO
SLOW-SPEED FLIGHT, STALL AND SPIN, AND AOA SYSTEM 2-15
Figure 2-11 Aerodynamics of a Stall
Figure 2-12 T-45 Stall

CHAPTER TWO T-45TS, TAILHOOK, AND IUT AERODYNAMICS
2-16 SLOW-SPEED FLIGHT, STALL AND SPIN, AND AOA SYSTEM
Figure 2-13 Stall Progression Diagram 3. Departures
a. Definition--One wing is producing much more lift than the other, causing abrupt pitch, roll, and yaw
i. Aggravated by control inputs ii. Typically followed by post-stall gyrations
b. Types
NOTE
Asterisked (*) maneuvers are not authorized in the T-45 syllabus.
i. Adverse yaw departure*

T-45TS, TAILHOOK, AND IUT AERODYNAMICS CHAPTER TWO
SLOW-SPEED FLIGHT, STALL AND SPIN, AND AOA SYSTEM 2-17
Figure 2-14 Adverse Yaw Departure
(a). Entry example:
(1). Simultaneously displace the aileron to roll the aircraft left while increasing back stick pressure to maximum available
(2). Once the plane has achieved approximately 60 degrees left AOB and
full AFT elevator, abruptly position the flight controls to full right aileron while maintaining aft elevator
(b). Result:
(1). The aircraft will initially roll right, and then the upgoing (left) wing
will achieve such a high AOA that it will stall (2). A snap roll to the left is initially the result, followed by random post-
stall gyrations and then, finally, an extremely nose-low dive recovery
Figure 2-15 Adverse Yaw Departure

CHAPTER TWO T-45TS, TAILHOOK, AND IUT AERODYNAMICS
2-18 SLOW-SPEED FLIGHT, STALL AND SPIN, AND AOA SYSTEM
ii. Cross-controlled departure*
Figure 2-16 Cross-controlled Departure
(a). Entry example:
(1). Simultaneously displace the aileron to the full left position while pushing the rudder to the full right position
(2). Reduce power until AOA rises and stall occurs
(b). Result:
(1). The aircraft will maintain its left-wing-down (LWD) attitude while the AOA increases and, finally, stall occurs over the right (trailing) wing
(2). When the aircraft departs, it will snap roll to the right (in the
direction of the rudder), followed by random post-stall gyrations and then, finally, an extremely nose-low dive recovery

T-45TS, TAILHOOK, AND IUT AERODYNAMICS CHAPTER TWO
SLOW-SPEED FLIGHT, STALL AND SPIN, AND AOA SYSTEM 2-19
Figure 2-17 Cross-controlled Departure
iii. Nose-high, 60-70 degree departure (low airspeed recovery)
Figure 2-18 60-70 Degree Departure
(a). Entry example:
- From medium airspeed, smoothly raise the nose to a wings-level, 60-70 degree attitude
(b). Result:
(1). At approximately 100 KIAS, the nose will smoothly drop below the
horizon despite full aft elevator input (2). Neutral flight controls should be set at this time; the nose will
continue to fall forward, through the horizon, to the vertical

CHAPTER TWO T-45TS, TAILHOOK, AND IUT AERODYNAMICS
2-20 SLOW-SPEED FLIGHT, STALL AND SPIN, AND AOA SYSTEM
(3). No unusual roll or yaw deviations should be expected; airspeed will steadily increase until the controls become effective again
Figure 2-19 60-70 Degree Departure
iv. Pitchdown departure*
Figure 2-20 Pitchdown Departure
(a). Entry example:
(1). From medium airspeed, smoothly raise the nose to a wings-level, 30-40 degree, noseup attitude
(2). Simultaneously displace the aileron to the full left position while
pushing the rudder to the full right position (3). Reduce power until AOA rises and stall occurs, then force the
elevator to a full nosedown position

T-45TS, TAILHOOK, AND IUT AERODYNAMICS CHAPTER TWO
SLOW-SPEED FLIGHT, STALL AND SPIN, AND AOA SYSTEM 2-21
(b). Result:
(1). A violent nosedown, rolling departure occurs to the left (in the direction of the aileron) with no significant warning to the pilot
(2). Negative g and roll rates in excess of 500 degrees per second are
likely (3). Rudder blowout is common due to high aerodynamic loading (4). If any yaw rate is sustained after the initial departure, an inverted
spin is likely to develop
Figure 2-21 Pitchdown Departure
v. Nose-high, 80-90/90-100 degree departure*

CHAPTER TWO T-45TS, TAILHOOK, AND IUT AERODYNAMICS
2-22 SLOW-SPEED FLIGHT, STALL AND SPIN, AND AOA SYSTEM
80-90 Degrees Nose Up 90-100 Degrees Nose Up
Figure 2-22 Nose High Departures (a). Entry example:
(1). From medium airspeed, smoothly raise the nose to a wings-level, 80-
100 degree, noseup attitude

T-45TS, TAILHOOK, AND IUT AERODYNAMICS CHAPTER TWO
SLOW-SPEED FLIGHT, STALL AND SPIN, AND AOA SYSTEM 2-23
(2). Allow the aircraft to slow to zero airspeed
(b). Result:
(1). After achieving zero airspeed, the aircraft will begin a tailslide until control surfaces become effective again at approximately 60-100 KIAS (negative airspeed)
(2). At this point, the aircraft will swap ends abruptly and may overshoot
the vertical by as much as 90 degrees in the pitch axis.
i) From the 80-90 degree departure, the aircraft pitches forward ii) From the 90-100 degree departure, the aircraft will “topple”
backward (Figure 2-22) iii) Ten percent of the nose-high departures flight-tested resulted in
pitchdown departures. A substantial number of tailslides will produce inverted spins due to inadvertent displacement of flight controls from the neutral position
(3). The engine may have its airflow interrupted causing a compressor
stall
NOTE
Nearly all of the flight-tested aircraft developed some type of engine stall under these conditions.
(4). After one or two nose-low oscillations, the airspeed will increase to a
nose-low dive recovery (5). Adverse roll and yaw oscillations are to be expected if the pilot fails
to maintain neutral controls throughout the departure

CHAPTER TWO T-45TS, TAILHOOK, AND IUT AERODYNAMICS
2-24 SLOW-SPEED FLIGHT, STALL AND SPIN, AND AOA SYSTEM
Figure 2-23 80-100 Degree Departure
Figure 2-24 80-100 Degree Departure 4. Post-stall gyration
a. Defined--Random pitch, roll, and yaw b. Problems
i. Control input, especially lateral aggravate

T-45TS, TAILHOOK, AND IUT AERODYNAMICS CHAPTER TWO
SLOW-SPEED FLIGHT, STALL AND SPIN, AND AOA SYSTEM 2-25
ii. Sideslip
(a). Can cause rudder blowout (b). Need in excess of 300 pounds force to neutralize (c). Excessive sideslip can cause yaw and roll, resulting in inverted spin
iii. To recover, neutralize (squadron will teach specific procedures) 5. Spins—general
a. Defined
i. Aggravate stall condition with autorotation, describing helical path ii. Aircraft is in a steady-state, self-sustained mode which is a combination of roll
and yaw
(a). If nose down, pure roll (b). If flat, pure yaw
Figure 2-25 Rudder Blowout

CHAPTER TWO T-45TS, TAILHOOK, AND IUT AERODYNAMICS
2-26 SLOW-SPEED FLIGHT, STALL AND SPIN, AND AOA SYSTEM
Figure 2-26 Spin Characteristics
b. Upright spin*
Figure 2-27 Upright Spins
i. Entry example:
(a). Smoothly raise the nose to a wings-level, noseup attitude (b). Reduce power to IDLE and, as the aircraft slows, program in full left
rudder and full aft stick (c). Hold the control inputs through the post-stall gyration phase until the
aircraft has developed a significant yaw rate

T-45TS, TAILHOOK, AND IUT AERODYNAMICS CHAPTER TWO
SLOW-SPEED FLIGHT, STALL AND SPIN, AND AOA SYSTEM 2-27
ii. Result:
(a). Classically, an aircraft will initially enter some short post-stall gyrations, to be immediately followed by a nearly wings-level, slightly nosedown, steady-state rotation about the center of gravity
(b). To date, the T-45 has demonstrated no tendency to spin in an upright
mode with symmetrical loading
Figure 2-28 Upright Spin
iii. Modes
(a). 30-degree true AOA
AOA above 28 units; airspeed about 180 kts; 1,200 ft per turn (10 turns per minute); transitions either to 45-degree true AOA mode or inverted spin mode
(b). 45-degree true AOA
AOA at 30 units; airspeed 100-110 kts; 1,000 ft per turn (15 turns per minute)
iv. Steady-state indications
(a). Positive g (b). Pegged turn needle (in direction of spin) (c). 30 units AOA
c. Inverted spin*
i. Entry example:

CHAPTER TWO T-45TS, TAILHOOK, AND IUT AERODYNAMICS
2-28 SLOW-SPEED FLIGHT, STALL AND SPIN, AND AOA SYSTEM
(a). See “Nose-high, 80-90/90-100 degree” or “Pitchdown departure” entries (b). At first indication of stall, hold the elevator in a position somewhere
forward of neutral
Figure 2-29 Inverted Spin
Figure 2-30 Inverted Spin ii. Result:
(a). The T-45 has demonstrated some tendency to enter inverted spins after
post-stall gyrations where FWD stick and yaw are introduced (b). The aircraft will rotate about the center of gravity from an inverted,
slightly nose-low and wings-level attitude

T-45TS, TAILHOOK, AND IUT AERODYNAMICS CHAPTER TWO
SLOW-SPEED FLIGHT, STALL AND SPIN, AND AOA SYSTEM 2-29
Figure 2-31 Upright Spin Indications
iii. Modes
(a). Low speed
(1). -60-degree true AOA Nose 30 to 50 degrees below horizon; may see horizon; 3-4 seconds
per turn or 15-20 turns per minute; altitude loss of 1,000 ft per turn or 15-20,000 fpm, airspeed of 50-120 KIAS (Figure 2-32)
(2). -40-degree true AOA Nose 30 to 50 degrees below horizon; probably will not see horizon;
3-4 seconds per turn or 15-20 turns per minute; altitude loss of 1,000 ft per turn or 15-20,000 fpm airspeed of 100-160 KIAS (Figure 2-32)
(b). High speed
(1). -25-degree true AOA
Nose 65 degrees below horizon; will not see horizon; 6 seconds per turn or 10 turns per minute; altitude loss of 1,100 ft per turn or 11,000 fpm airspeed of 140-200 KIAS (Figure 2-32)
iv. Steady-state indications

CHAPTER TWO T-45TS, TAILHOOK, AND IUT AERODYNAMICS
2-30 SLOW-SPEED FLIGHT, STALL AND SPIN, AND AOA SYSTEM
Figure 2-32 Inverted Spins (Steady-State Indications)

T-45TS, TAILHOOK, AND IUT AERODYNAMICS CHAPTER TWO
SLOW-SPEED FLIGHT, STALL AND SPIN, AND AOA SYSTEM 2-31
Figure 2-33 Stall Progression Diagram
(a). Negative g (b). Pegged turn needle (in direction of spin) (c). Zero units AOA

CHAPTER TWO T-45TS, TAILHOOK, AND IUT AERODYNAMICS
2-32 SLOW-SPEED FLIGHT, STALL AND SPIN, AND AOA SYSTEM
Angle of Attack (AOA) System
Figure 2-34 AOA System Theory 1. Provides the pilot with information necessary to obtain optimum aircraft performance, particularly at low airspeeds and high AOAs 2. Used primarily during the approach and landing phases of flight
NOTE
Aerodynamically, AOA is indicated airspeed (IAS). By controlling the AOA, the pilot controls IAS.
3. Indicates for each AOA a percentage of the maximum lift coefficient available for the flap configuration being used
a. During flight at a constant AOA (approach and landings), a constant coefficient of lift is maintained

T-45TS, TAILHOOK, AND IUT AERODYNAMICS CHAPTER TWO
SLOW-SPEED FLIGHT, STALL AND SPIN, AND AOA SYSTEM 2-33
NOTE
Recall that as aircraft weight decreases, so must lift (basic lift formula). This is accomplished in the T-45 by holding AOA constant and reducing IAS as weight is reduced.
b. Flying correct AOA and maintaining proper glideslope (using power) will obtain
optimum landing speed, landing attitude, and sink rate
i. Reduces possibility of in-flight engagements ii. Reduces overstressing of the aircraft
4. Use during landings is more desirable than use of the pitot-static system
a. AOA more accurately measures aircraft performance than pitot-static system at low speeds; as speed decreases, position error increases
b. Optimum landing AOA is not affected by weight, bank angle, g load, or density
altitude; IAS is affected c. A change in AOA is easier to detect than a change in airspeed; in landing
configuration, 1 unit AOA is equal to 3 KIAS d. Changes in flap settings are compensated for e. Instrument scan is reduced f. Pilot workload is reduced by eliminating the need for weight and speed calculations
5. AOA components

CHAPTER TWO T-45TS, TAILHOOK, AND IUT AERODYNAMICS
2-34 SLOW-SPEED FLIGHT, STALL AND SPIN, AND AOA SYSTEM
Figure 2-35 AOA Components
a. Probe transmitter
i. Probe aligns itself with the relative wind and sends out electrical signal ii. Transmitter amplifies signal and sends it to other system components
b. Carrier approach lights
i. Located on nose landing gear strut ii. Used to aid LSO in determining if T-45 is being flown at optimum AOA iii. Controlled by AOA indicator; red, amber, and green lights show if AOA is low,
optimum, or high
c. Rudder pedal shaker
i. Controlled by forward cockpit AOA indicator
ii. Provides an artificial stall warning through the left rudder pedal

T-45TS, TAILHOOK, AND IUT AERODYNAMICS CHAPTER TWO
SLOW-SPEED FLIGHT, STALL AND SPIN, AND AOA SYSTEM 2-35
d. AOA indicator
i. Indicates AOA in nondimensional units; a specific unit is used as a reference for each phase of flight
ii. Conventional round dial displays AOA information (pointer read against fixed
dial) iii. AOA for approach and landing in Navy aircraft is always at the 3 o’clock
position (17 units AOA for the T-45)
NOTE
Stall warning (pedal shaker and aural tone) and stall AOA are indexed on the T-45.
e. AOA indexer
i. Presents AOA information by use of three lights ii. Operates only when landing gear down and locked iii. Receives information from forward cockpit AOA indicator iv. Display consists of low-speed symbol (upper chevron), high-speed symbol
(lower chevron), and on-speed symbol (donut) v. Mounted on glare shield for easy scanning while looking forward through
windshield vi. Displays AOA and indicates airspeed relative to an optimum approach AOA
and speed vii. Cannot be used as a rate instrument (unlike the indicator) or to maintain an
airspeed in event of a pitot-static system failure
f. ADI Display (T-45C) i. Digital AOA in tenths of units ii. AOA units prefix is the "alpha" symbol

CHAPTER TWO T-45TS, TAILHOOK, AND IUT AERODYNAMICS
2-36 SLOW-SPEED FLIGHT, STALL AND SPIN, AND AOA SYSTEM
Figure 2-36 T-45 Navigation Approach HUD Display
g. HUD indications
i. Uses AOA information from AOA probe to present AOA information in with digital and graphical symbols
ii. AOA bracket "E" shows AOA in relationship to waterline (T-45A) or velocity
vector (T-45C)
6. Actual flight path of T-45 at particular AOA depends on thrust selected by pilot
a. Example: A particular thrust setting will maintain level flight at 17 units AOA, a higher thrust setting will result in a climb, and a lower thrust setting will cause the aircraft to descend; a pilot would thus use AOA to control airspeed and thrust to control altitude
7. AOA system is subject to failure
a. Perform an AOA check prior to landings b. If system fails, IAS is then used to fly the approach and landing
i. Proper speed for T-45 in landing configuration is approximately 117 KIAS with 1,000 pounds of fuel; this speed is increased 5 knots per 1,000 pounds of fuel
ii. Stall, glide, and other speeds vary approximately 5 knots per 1,000 pounds of
weight

T-45TS, TAILHOOK, AND IUT AERODYNAMICS CHAPTER TWO
SLOW-SPEED FLIGHT, STALL AND SPIN, AND AOA SYSTEM 2-37
206. SUMMARY In this lesson we have studied: 1. Slow-speed flight 2. Stalls and spins 3. Angle of attack system 207. CONCLUSION Although slow-speed flight does not represent a difficult or dangerous condition, it can amplify errors of basic flying technique; therefore, slow-speed flight requires precise control of power and pitch to ensure a safe approach and landing.

CHAPTER TWO T-45TS, TAILHOOK, AND IUT AERODYNAMICS
2-38 SLOW-SPEED FLIGHT, STALL AND SPIN, AND AOA SYSTEM
NOTES

STABILITY 3-1
CHAPTER THREE STABILITY
300. INTRODUCTION – N/A COURSE/STAGE: - TS, E2-C2, TAILHOOK & IUT/Aerodynamics LESSON TITLE: - Stability LESSON IDENTIFIER: - T-45A/C TS, E2-C2, TAILHOOK & IUT Aero-04 LEARNING ENVIRONMENT: - Classroom ALLOTTED LESSON TIME: - .5 hr TRAINING AIDS: 1. T-45 Scale Model 2. Figures
- Figure 1: Fully Powered Control System - Figure 2: Coefficient of Lift Curve, Straight vs Swept Wing - Figure 3: Aspect Ratio - Figure 4: Swept Wing (Tip Stall) - Figure 5: Center of Gravity Travel - Figure 6: Landing Gear Door Effect on Directional Stability - Figure 7: Spiral Divergence - Figure 8: Crosswind Handling

CHAPTER THREE T-45TS, TAILHOOK, AND IUT AERODYNAMICS
3-2 STABILITY
STUDY RESOURCES: 1. T-45A NATOPS Flight Manual, A1-T45AB-NFM-000 2. T-45C NATOPS Flight Manual, A1-T45AC-NFM-000 LESSON PREPARATION: 1. Review:
- Aero-01 Lesson Guide 2. Read:
- Aero-04 Lesson Guide REINFORCEMENT: - N/A EXAMINATION: - The objectives in this lesson will be tested in Aerodynamics 07X for TS, E2-C2 and Advanced. 301. LESSON OBJECTIVES 1. Identify stability characteristics of the T-45 aircraft 2. State the factors which affect T-45 stability and flight characteristics

T-45TS, TAILHOOK, AND IUT AERODYNAMICS CHAPTER THREE
STABILITY 3-3
302. MOTIVATION Knowing what to expect from the T-45 and understanding why the T-45 possesses certain flight characteristics will help you to obtain the maximum performance from the aircraft.
Figure 3-1 T-45 303. OVERVIEW This lesson will discuss the flight and stability characteristics of the T-45 as follows: 1. T-45 Flight Controls 2. Stability (Generic) 3. T-45 Stability (General) 4. Factors Affecting T-45 Stability 304. REFRESHER Recall that: 1. As aircraft become more maneuverable, they become less stable 2. The relationship between the center of gravity and the aerodynamic center affects both the stability and controllability of an aircraft

CHAPTER THREE T-45TS, TAILHOOK, AND IUT AERODYNAMICS
3-4 STABILITY
Figure 3-2 Center of Gravity/Aerodynamic Center Relationship to Stability 305. PRESENTATION T-45 Flight Controls 1. T-45 has irreversible flight control system
a. Elevator b. Stabilator c. Aerodynamic pressures are not fed back to pilot from control surface

T-45TS, TAILHOOK, AND IUT AERODYNAMICS CHAPTER THREE
STABILITY 3-5
Figure 3-3 Fully Powered Control System 2. T-45 has conventional rudder
a. Aerodynamic forces may feed back to rudder pedals b. Rudder pedals will be displaced due to side loads during post-stall gyration or spin c. Up to 300 pounds of pressure may be required to counter air loads on rudder during
post-stall gyration or spin

CHAPTER THREE T-45TS, TAILHOOK, AND IUT AERODYNAMICS
3-6 STABILITY
Figure 3-4 Conventional Control System Stability (General) 1. Stall
a. Condition when any increase in angle of attack (AOA) results in decrease in coefficient of lift (CL)
b. Stalling AOA is AOA that stall commences or coefficient of lift max (CL)max c. Swept wing aircraft generate less CL
i. stall at higher AOA than straight wing aircraft ii. stall less dramatic, flatter CL curve

T-45TS, TAILHOOK, AND IUT AERODYNAMICS CHAPTER THREE
STABILITY 3-7
Figure 3-5 Coefficient of Lift Curve: Straight vs Swept Wing 2. Induced Drag
a. Product of generating lift b. Greater at low airspeeds

CHAPTER THREE T-45TS, TAILHOOK, AND IUT AERODYNAMICS
3-8 STABILITY
Figure 3-6 Induced Drag 3. Mean Aerodynamic Chord (MAC)
a. Center of pressure (CP)
i. Located along sweep angle of wing ii. Determined overall aerodynamic center (AC) of aircraft; AC hard to determine
for swept wing aircraft, as are overall pitch

T-45TS, TAILHOOK, AND IUT AERODYNAMICS CHAPTER THREE
STABILITY 3-9
Figure 3-7 Mean Aerodynamic Chord
b. Concept
- Treats wing as if it were rectangular in planform, which makes pitching moments easy to determine
c. Precisely determined as to both location and length
i. MAC for T-45 is 69.96 inches ii. Leading edge of MAC (LEMAC) is 240.9 inches aft of datum, which is the tip
of the nose boom
d. Center of gravity (CG) computations and limits normally expressed as % MAC; CG range of T-45 is 14-22% of MAC
e. Used as primary reference for longitudinal stability considerations by aerodynamic
engineers
4. Aspect Ratio (AR)
a. Ratio of span of the wing divided by average chord

CHAPTER THREE T-45TS, TAILHOOK, AND IUT AERODYNAMICS
3-10 STABILITY
b. Fineness ration of the wing that affects aerodynamic characteristics and structural weight
Figure 3-8 Aspect Ratio 5. Taper
a. Gradual reduction in chord length from root to tip b. Affects lift distribution and structural weight of wing

T-45TS, TAILHOOK, AND IUT AERODYNAMICS CHAPTER THREE
STABILITY 3-11
Figure 3-9 Taper 6. Thickness is the cross sectional height of airfoil measured perpendicular to chordline
Figure 3-10 Thickness 7. Swept Wings
a. Advantage over straight wing
i. Delays onset of all compressibility effect ii. Delays critical Mach (Mcrit) and force divergence Mach number iii. Lower aspect ratio results in higher speed capability less parasite drag

CHAPTER THREE T-45TS, TAILHOOK, AND IUT AERODYNAMICS
3-12 STABILITY
Figure 3-11 Swept Wing Tip Stall
b. Disadvantage over straight wing
i. Tip stall from wing sweep and taper ii. Loss of ailerons at stall (some aircraft) iii. Negative longitudinal stability or pitch up at high AOA
8. Tip Stall
a. Stall of the outer portion of wing b. May cause loss of ailerons c. Cause center of pressure to move forward d. Aircraft could pitch up if aerodynamic center moves forward of the center of gravity
9. Leading Edge Vortexing
a. At high angle of attack, high-pressure air from the bottom of wing jumps past leading edge to lower pressure area on top of wing
b. Results in loss of lift and possibly loss of control

T-45TS, TAILHOOK, AND IUT AERODYNAMICS CHAPTER THREE
STABILITY 3-13
Figure 3-12 Leading Edge Vortexing 10. Geometric Twist
a. The wing is designed with a twist that reduces the angle of incidence at the tip b. Wing tip less prone to stall, compared to the root

CHAPTER THREE T-45TS, TAILHOOK, AND IUT AERODYNAMICS
3-14 STABILITY
Figure 3-13 Effect of Geometric Twist 11. Stall Strips
a. Short triangular strips on leading edge of slat and on wing leading edge, under the slat b. Cause root to stall earlier c. Works in conjunction with geometric twist to cause root and tip to stall at about same
AOA

T-45TS, TAILHOOK, AND IUT AERODYNAMICS CHAPTER THREE
STABILITY 3-15
Figure 3-14 Stall Strips 12. Tip versus Root Stall
a. Undesirable traits of tip stall with a swept wing design
i. Little stall warning ii. Serious reduction in lateral control iii. Forward shift of center of pressure causing pitch up
b. Aerodynamic modifications to T-45 changed tip to root stall characteristics
i. 3.5 degrees of geometric twist delays outboard leading edge stall ii. Stall strips enhance root stall to point that wing tip stalls only slightly before
root iii. Stall strips induce airframe buffeting prior to stall (1-2 knots clean, 1 knot dirty)
13. Center of Gravity (CG) Limitations

CHAPTER THREE T-45TS, TAILHOOK, AND IUT AERODYNAMICS
3-16 STABILITY
Figure 3-15 Center of Gravity Travel
a. Point at which weight of an object can be considered concentrated b. Aircraft designed for certain range of CG movement c. Factors affecting CG location in a tactical aircraft
i. landing gear position ii. fuel burned iii. wing sweep iv. ordnance v. ejection of aft seat

T-45TS, TAILHOOK, AND IUT AERODYNAMICS CHAPTER THREE
STABILITY 3-17
14. Aerodynamic Center (AC)
a. Point along chord where all changes in lift effectively take place b. Aerodynamic Center forms moment arm with CG that affects aircraft performance
i. When AC is far aft of CG the aircraft is very stable but less maneuverable ii. When AC moves forward, closer to the CG, the aircraft becomes less stable but
more maneuverable
c. When an aircraft is very slow, the AC may move forward of the CG creating a very unstable pitch up situation that can not be stopped by full nose down stabilator
Figure 3-16 Center of Gravity/Aerodynamic Center Relationship to Stability
d. Flap/Slat Extension
i. Moves AC forward 3.49 inches (extending landing gear moves CG aft) ii. Aircraft less stable but more maneuverable

CHAPTER THREE T-45TS, TAILHOOK, AND IUT AERODYNAMICS
3-18 STABILITY
Figure 3-17 Longitudinal Stability -- Gear, Flap/Slat Extension 15. Speed Brakes
a. Extending the speed brakes is destabilizing b. Turbulent flow on lower surface of horizontal stabilizer reduces pressure causing
aircraft to pitch up c. Speed Brake to stabilator Interconnect (SBI) is one of Control Augmentation System
functions that reduces pitch transients during speed brake extension and retraction

T-45TS, TAILHOOK, AND IUT AERODYNAMICS CHAPTER THREE
STABILITY 3-19
Figure 3-18 Longitudinal Stability -- Speed Brake Effect
i. Reduces positive pitch transients (speed brake extension) from 0.2 to 0.7 Mach ii. Reduces negative pitch transients (speed brake extension) above 0.7 Mach
during speed brake iii. Control stick does not move
16. Stabilator Vanes
a. Located on both sides of fuselage above the speed brakes, forward of the stabilator b. Generates vortex to energize flow over lower surface of stabilator to keep it effective
CHAPTER THREE T-45TS, TAILHOOK, AND IUT AERODYNAMICS
3-20 STABILITY
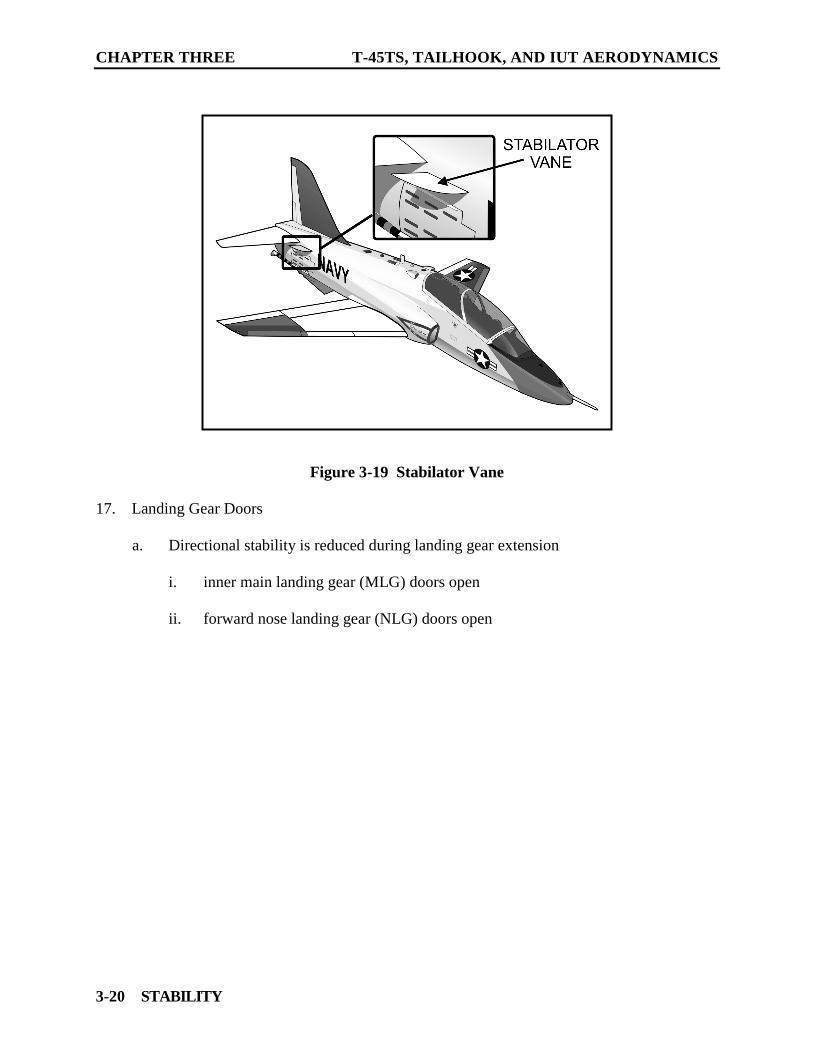
Figure 3-19 Stabilator Vane 17. Landing Gear Doors
a. Directional stability is reduced during landing gear extension
i. inner main landing gear (MLG) doors open ii. forward nose landing gear (NLG) doors open

T-45TS, TAILHOOK, AND IUT AERODYNAMICS CHAPTER THREE
STABILITY 3-21
Figure 3-20 Landing Gear Doors Effect on Directional Stability
b. Yawing tendency caused by the increased sail area of the opened MLG doors and the forward NLG doors that are forward of the CG
c. MLG and forward NLG doors close when the landing gear is fully extended d. During emergency gear extension
i. Inner MLG doors remain open ii. Forward nose landing gear doors partially closed by an electric motor
e. In emergency gear extension configuration
i. Aircraft is less stable directionally ii. Controlling the slight yaw excursions that may occur requires coordinated stick
and rudder
18. Stability versus Maneuverability
a. Aircraft design is tradeoff between many variables including stability and maneuverability
b. The balance determined based on many factors but primarily dictated by aircraft
mission c. Maneuverability implies a responsive aircraft that may be less stable

CHAPTER THREE T-45TS, TAILHOOK, AND IUT AERODYNAMICS
3-22 STABILITY
Figure 3-21 Stability vs Maneuverability i. Transports mission dictates a very stable, and therefore a less responsive design ii. The fighter mission demands maximum maneuverability, and therefore stability
is less important iii. T-45 is between the fighter and transport extremes
(a). Student training dictates a stable platform (b). Lead in training for tactical fleet missions require more maneuverability
d. The relationship of longitudinal stability to maneuverability is inverse e. The relative location of the CG and AC determine the degree of longitudinal stability
to maneuverability that exists

T-45TS, TAILHOOK, AND IUT AERODYNAMICS CHAPTER THREE
STABILITY 3-23
f. Displacement of the AC from the CG creates a moment arm with the CG as the fulcrum
i. The longer the moment arm, assuming the force remains constant, the more
stable and less maneuverable the aircraft ii. The shorter the moment arm the aircraft is more controllable but less stable
T-45 Stability (General) 1. T-45 Roll Rate
a. Depends on airspeed b. 180 degrees per second can be achieved between 0.7 and 0.9 Mach
2. Longitudinal Control
a. Below 0.85 Mach the T-45
i. is highly maneuverable ii. has predictable flying qualities iii. Stick forces are moderate and provide good feedback
b. Above 0.84 Mach
i. stick forces become noticeably more sensitive ii. A region of reduced longitudinal stability exists within trim AOA band at
approximately 0.87 true Mach number (a). pilot perceives this as stick force lightening or pitch up (b). less than three pounds of stick force can result in g excursions from +1 to
+3g (c). Excursions are highest at aft CGs
c. Use caution in high speed dive recoveries to avoid overstress in the pitch up regions
of 0.99 and 0.87 Mach d. Pullout at no more than 4.0 g’s and ease the back pressure in the pitch up regions to
maintain a maximum of 4.0 g’s

CHAPTER THREE T-45TS, TAILHOOK, AND IUT AERODYNAMICS
3-24 STABILITY
3. Directional Divergence
a. Results from negative directional stability b. T-45 and other aircraft do not exhibit this condition
Figure 3-22 Directional Divergence Factors Affecting T-45 Stability 1. Coupling
a. Interaction of simultaneous roll and yaw movements

T-45TS, TAILHOOK, AND IUT AERODYNAMICS CHAPTER THREE
STABILITY 3-25
Figure 3-23 Coupling
b. T-45 may exhibit the following tendencies:
i. Dutch Roll
(a). Lateral stability stronger than directional stability (b). Induced drag increases on wing into wind when aircraft yaws (c). Weak directional stability allows adverse yaw, that causes roll and yaw in
opposite direction (d). Increase lateral stability at high AOA may produce Dutch roll tendency (e). T-45 has dutch rolling tendency at slow speeds
(1). Countered by yaw damper system (2). With yaw dampener/SBI inoperative, quite noticeable but
controllable, resulting in an increased pilot workload

CHAPTER THREE T-45TS, TAILHOOK, AND IUT AERODYNAMICS
3-26 STABILITY
Figure 3-24 Dutch Roll
ii. Spiral Divergence
(a). strong directional stability relative to weak lateral stability (b). bank angle keeps relative wind moving off nose (c). aircraft continues to chase relative wind (d). tight descending spiral develops (e). stop spiral by raising wing with aileron (f). directional stability usually design stronger than lateral stability in most
aircraft

T-45TS, TAILHOOK, AND IUT AERODYNAMICS CHAPTER THREE
STABILITY 3-27
Figure 3-25 Spiral Divergence
(g). T-45 characteristics
(1). demonstrated a slowly divergent spiral mode with asymmetrical stores loadings
(2). Onset is slow, with bank angle doubling every 25 seconds
2. T-45 Landing in a Crosswind
a. T-45 will track away from a crosswind
i. Crosswind will cause the upwind wing to have more lift ii. Upwind wing will come up iii. Downwind wing will have more weight on its gear iv. Downwind gear with more weight will have more drag, which produces a large
turning moment away from the crosswind
NOTE The squadron will brief you on proper crosswind flight procedures.

CHAPTER THREE T-45TS, TAILHOOK, AND IUT AERODYNAMICS
3-28 STABILITY
Figure 3-26 Crosswind Handling 306. SUMMARY This lesson has focused on the following topics: 1. T-45 Flight Controls 2. Stability (Generic) 3. T-45 Stability (General) 4. Factors Affecting T-45 Stability 307. CONCLUSION Knowing the factors that affect T-45 stability and the aircraft’s stability characteristics will help you to obtain the maximum performance from the aircraft as you progress through your flight training.

NATOPS PERFORMANCE CHARTS T-45C CHARTS AND EXAM REVIEW T-45A 4-1
CHAPTER FOUR NATOPS PERFORMANCE CHARTS T-45C CHARTS AND EXAM REVIEW T-45A
400. INTRODUCTION – N/A COURSE/STAGE: - TS, E2-C2, TAILHOOK & IUT / Aerodynamics LESSON TITLE: - NATOPS Performance Charts T-45C Charts and Exam Review T-45A LESSON IDENTIFIER: 1. T-45C TS, TAILHOOK & IUT Aero-06 2. T-45A TS & E2-C2 Aero-07, TAILHOOK & IUT Aero-06 LEARNING ENVIRONMENT: - Classroom ALLOTTED LESSON TIME: - 2.5 hr T-45C and 1.5 hr T-45A TRAINING AIDS: - T-45 Scale Model STUDY RESOURCES: 1. T-45A NATOPS Flight Manual, A1-T45AB-NFM-000 2. T-45C NATOPS Flight Manual, A1-T45AC-NFM-000 3. T-45 NATOPS Flight Manual, A1-T45AB-NFM-300 LESSON PREPARATION: 1. Review:
- Aero-01

CHAPTER FOUR T-45TS, TAILHOOK, AND IUT AERODYNAMICS
4-2 NATOPS PERFORMANCE CHARTS T-45C CHARTS AND EXAM REVIEW T-45A
2. Bring to class:
- T-45 NATOPS Flight Manual, A1-T45AB-NFM-300 REINFORCEMENT: - N/A EXAMINATION: The objectives in this lesson will be tested in Aerodynamics 07X for TS, E2-C2 and Advanced. 401. LESSON OBJECTIVES - Determine aircraft performance data 402. MOTIVATION Charts published in the NATOPS Flight Manual provide the pilot with information which enables him to realize the maximum performance capabilities of the aircraft. Use of chart material for preflight planning and application of prescribed operating procedures will result in the optimum effectiveness of the aircraft. 403. OVERVIEW In this lesson, instruction is provided on how to use T-45 aircraft performance charts. 404. PRESENTATION NATOPS Performance Charts Section Layout 1. Presented in a standard order in all NATOPS manuals
a. General b. Takeoff c. Climb d. Cruise e. Endurance f. Descent g. Landing

T-45TS, TAILHOOK, AND IUT AERODYNAMICS CHAPTER FOUR
NATOPS PERFORMANCE CHARTS T-45C CHARTS AND EXAM REVIEW T-45A 4-3
h. Flight Planning i. Combat Performance
2. The introduction to each section has: a. Definitions b. Explanations c. Conditions and assumptions used in charts d. Sample problems
Techniques 1. Use the correct chart
a. Aircraft model b. Configuration
2. Read all chart notes 3. Carefully work the chart
a. Lay the chart flat, if possible b. Determine the values of each grid c. Go from previous chart position to next “baseline” d. Parallel “Guidelines” to next correction e. Continue to next baseline f. General Rule Baseline, correction, baseline correction g. If correction is above baseline, the same procedure applies

CHAPTER FOUR T-45TS, TAILHOOK, AND IUT AERODYNAMICS
4-4 NATOPS PERFORMANCE CHARTS T-45C CHARTS AND EXAM REVIEW T-45A
Figure 4-1 NATOPS Chart 4. Read all the notes, making any necessary corrections 5. Ask yourself, “Does this answer make sense?”

T-45TS, TAILHOOK, AND IUT AERODYNAMICS CHAPTER FOUR
NATOPS PERFORMANCE CHARTS T-45C CHARTS AND EXAM REVIEW T-45A 4-5
Figure 4-2 NATOPS Chartwork Techniques
INSTRUCTOR NOTE
The following material applies to T-45C Aero. NATOPS Charts 1. Density Ratio Chart
a. Combines effect of temperature and pressure altitude on engine performance b. Density ratio must be computed before using the takeoff and landing charts

CHAPTER FOUR T-45TS, TAILHOOK, AND IUT AERODYNAMICS
4-6 NATOPS PERFORMANCE CHARTS T-45C CHARTS AND EXAM REVIEW T-45A
Figure 4-3 Density Ratio Chart 2. Takeoff Distance Chart
a. Shows main wheel lift-off speed for various gross weights b. Used to compute no wind or a headwind or tailwind takeoff distance solution c. Also total distance from start of takeoff roll to clear a 50' obstacle d. Takeoff Distance Computation
i. Gross Weight determines main wheel lift-off speed ii. Enter chart on density ratio scale

T-45TS, TAILHOOK, AND IUT AERODYNAMICS CHAPTER FOUR
NATOPS PERFORMANCE CHARTS T-45C CHARTS AND EXAM REVIEW T-45A 4-7
iii. Project a line from density ratio to takeoff gross weight reference line iv. From intersection of density ration and gross weight, extend line vertically
down to determine ground roll without wind
Figure 4-4 Takeoff Distance — Half Flaps
v. Extend no wind ground roll line down to headwind/tailwind graph
vi. Parallel headwind or tailwind guideline to takeoff wind velocity vii. From intersection of takeoff wind velocity and ground roll line, project line
down vertically to determine ground roll with wind viii. Extend ground roll with wind down to distance over 50-foot obstacle graph ix. Continue ground roll with wind line down to reflector line

CHAPTER FOUR T-45TS, TAILHOOK, AND IUT AERODYNAMICS
4-8 NATOPS PERFORMANCE CHARTS T-45C CHARTS AND EXAM REVIEW T-45A
x. From intersection of ground roll with wind line and reflector line project a horizontal line to left to determine distance over a 50-foot obstacle
xi. Computing takeoff distance using NATOPS sample problem
Figure 4-5 Takeoff Distance — Half Flaps, completed 3. Velocity during Takeoff Ground Run (Line Speed)
a. Used to determine speed to which the aircraft should accelerate in a given distance during takeoff
b. If aircraft does not achieve the calculated, abort Use the Velocity during Takeoff
Ground Run chart to calculate the line check speed. Enter the chart with the distance from the commencement of takeoff roll to the selected object
c. Line Speed Computation

T-45TS, TAILHOOK, AND IUT AERODYNAMICS CHAPTER FOUR
NATOPS PERFORMANCE CHARTS T-45C CHARTS AND EXAM REVIEW T-45A 4-9
Figure 4-6 Velocity During Takeoff Ground Run
i. Enter chart at desired distance down runway
ii. Project horizontal line from desired distance down runway to gross takeoff weight reference line
iii. From intersection of desired distance down runway and gross takeoff weight
reference line project vertically down to determine velocity in KCAS iv. Extend the velocity line down to the density ration graph v. Extend horizontal line from density scale on left vi. Project the velocity line down parallel to the reference line to the horizontal
density ratio line vii. From intersection of velocity line and density ratio line extend line down
vertically down to velocity graph

CHAPTER FOUR T-45TS, TAILHOOK, AND IUT AERODYNAMICS
4-10 NATOPS PERFORMANCE CHARTS T-45C CHARTS AND EXAM REVIEW T-45A
viii. Extend vertical line down to reflector line then to the left to determine ground velocity at desired distance down runway
ix. Computing takeoff distance using NATOPS sample problem
Figure 4-7 Velocity During Takeoff Ground Run 4. Maximum Abort Speed
a. Used to calculates the maximum speed to which an aircraft can accelerate and then abort on the remaining runway length
b. Individual charts for dry or wet runway c. Maximum Abort Speed — Dry Runway Computation

T-45TS, TAILHOOK, AND IUT AERODYNAMICS CHAPTER FOUR
NATOPS PERFORMANCE CHARTS T-45C CHARTS AND EXAM REVIEW T-45A 4-11
Figure 4-8 Maximum Abort Speed - DRY RUNWAY
i. Enter chart on density ratio scale ii. From density ratio scale, project horizontal line the available runway length
reference line iii. From intersection of density ratio and available runway length reference line,
extend a vertical line down to gross weight reference line on maximum abort speed chart
iv. Extend line down to gross takeoff weight line v. From intersection of vertical reference line and gross weight reference line
project a horizontal line to the left side of the graph to determine the maximum abort speed KCAS
d. Maximum Abort Speed — Wet Runway Computation

CHAPTER FOUR T-45TS, TAILHOOK, AND IUT AERODYNAMICS
4-12 NATOPS PERFORMANCE CHARTS T-45C CHARTS AND EXAM REVIEW T-45A
i. Enter chart on density ratio scale ii. From density ratio scale, project horizontal line the available runway length
reference line iii. From intersection of density ratio and available runway length reference line,
extend a vertical line down to gross weight reference line on maximum abort speed chart
iv. Extend line down to gross takeoff weight line v. From intersection of vertical reference line and gross weight reference line
project a horizontal line to the left side of the graph to determine the maximum abort speed KCAS
Figure 4-9 Maximum Abort Speed - WET RUNWAY
e. There is a significant decrease in maximum abort speed on a wet runway versus a dry runway

T-45TS, TAILHOOK, AND IUT AERODYNAMICS CHAPTER FOUR
NATOPS PERFORMANCE CHARTS T-45C CHARTS AND EXAM REVIEW T-45A 4-13
Figure 4-10 Maximum Abort Speed - WET RUNWAY 5. Compressibility Correction to Calibrated Airspeed
a. Indicates subsonic air is compressible at higher speeds b. CAS and TAS gain over those computed in charts c. At the extreme limits of The T-45’s envelope, 550 KCAS and 40,000’, the
compressibility correction would be 75 KCAS d. Under most circumstances, it will be less than half of compressibility correction at
550 KCAS

CHAPTER FOUR T-45TS, TAILHOOK, AND IUT AERODYNAMICS
4-14 NATOPS PERFORMANCE CHARTS T-45C CHARTS AND EXAM REVIEW T-45A
Figure 4-11 Compressibility Correction to Calibrated Airspeed 6. Climb Speed Schedule
a. Determine climb speed for combination of drag index and pressure altitudes b. Simplified normal climb speed schedule, independent of weight, in constant indicated
airspeed or Mach number

T-45TS, TAILHOOK, AND IUT AERODYNAMICS CHAPTER FOUR
NATOPS PERFORMANCE CHARTS T-45C CHARTS AND EXAM REVIEW T-45A 4-15
Figure 4-12 Climb Speed Schedule 7. Time, Fuel, and Distance to Climb
a. Charts used to determine time, fuel, or distance required to climb to selected altitude at MRT and using Climb Speed Schedule
b. All three charts presented in similar manner c. Time to climb computation

CHAPTER FOUR T-45TS, TAILHOOK, AND IUT AERODYNAMICS
4-16 NATOPS PERFORMANCE CHARTS T-45C CHARTS AND EXAM REVIEW T-45A
Figure 4-13 Time to Climb
i. Enter chart with initial gross weight ii. Project horizontally from initial gross weight to desired pressure altitude
reference line iii. From intersection of initial gross weight and pressure altitude reference line
project vertically down to drag index reference line iv. From intersection of the vertical line and the drag index reference line project
horizontally left to the zero temperature deviation from standard day line v. From the zero temperature deviation from standard day line parallel the hotter
or colder guide line to the temperature deviation from standard day line vi. From the temperature deviation from standard day line project a line
horizontally to the left of the graph to determine time, fuel or distance to climb as appropriate

T-45TS, TAILHOOK, AND IUT AERODYNAMICS CHAPTER FOUR
NATOPS PERFORMANCE CHARTS T-45C CHARTS AND EXAM REVIEW T-45A 4-17
d. The time, fuel and distance to climb charts take into account the kinetic energy corrections due to rate of climb
Figure 4-14 Time to Climb 6. Bingo
a. Bingo charts located in NATOPS manual and pocket checklist b. T-45 bingo based on flying profile and landing with a fuel reserve of 300 pounds, no
wind c. Bingo used to go to divert airfield due to carrier deck not ready or runway closed d. Used to determine fuel, time and speed for bingo profile or sea level divert for
various zero fuel weights, configurations and drag indexes e. BINGO computation

CHAPTER FOUR T-45TS, TAILHOOK, AND IUT AERODYNAMICS
4-18 NATOPS PERFORMANCE CHARTS T-45C CHARTS AND EXAM REVIEW T-45A
Figure 4-15 BINGO, Gear Up - Flaps Up, Zero Fuel Weight - 10, 500 Pounds
i. Enter with the distance to divert field and appropriate drag index ii. In succeeding columns, read fuel required, time required, climb speeds,
optimum range cruise, and maximum range descent iii. Notes are important to flying proper profile
NOTE
Bingo charts fuel requirement includes 300 pounds fuel reserve. This reserve fuel is yours to burn if circumstances warrant. It will be on your fuel gauge but only should be used in an emergency. Anticipate that a runway might be closed suddenly and for a long period.
iv. Sea level divert data is included in last three columns

T-45TS, TAILHOOK, AND IUT AERODYNAMICS CHAPTER FOUR
NATOPS PERFORMANCE CHARTS T-45C CHARTS AND EXAM REVIEW T-45A 4-19
f. The NATOPS bingo charts have one deficiency. Winds are not considered
i. You must factor winds into chart data ii. Use briefed or known winds iii. Mentally or on the wheel (EGB computer) determine headwind component iv. With significant headwind component, 60 knots for example, select higher
mileage line on bingo chart and fly that profile
7. Landing Approach Speed
a. Calculates a steady 17 units angle of attack approach speed for a gross weight b. Calculate the gross weight from
Figure 4-16 Landing Approach Speed

CHAPTER FOUR T-45TS, TAILHOOK, AND IUT AERODYNAMICS
4-20 NATOPS PERFORMANCE CHARTS T-45C CHARTS AND EXAM REVIEW T-45A
i. Zero fuel weight of particular bureau number aircraft ii. Weight of external stores iii. Fuel on board
c. Landing Approach Speed calculation
i. Approach speed matrix at top of chart
ii. Approach speed matrix in thousand of pound increments iii. Enter approach speed graph with this total weight iv. From total weight go up to the appropriate flap configuration line v. From the flap reference line project a line to the left for the 17 units AOA
approach speed in KCAS vi. The weight to speed relation is a constant; each 200 pounds change in weight
increases or decreased approach speed by 1 knot vii. Each increment of flaps less than full flaps adds 18 knots to the approach speed viii. 17 units angle of attack to airspeed calculation used to cross check these to
indications ix. If airspeed doesn’t correspond to calculation, fly 17 units or calculated airspeed
whichever is the higher airspeed
NOTE
The LSO can verify approach speed from the aircraft attitude on approach.
8. Landing Distance
a. Used to determine landing ground roll distance for
i. Various flap configurations ii. Gross weights iii. Runway conditions dry, wet or icy iv. Density ration (temperature and pressure altitude)

T-45TS, TAILHOOK, AND IUT AERODYNAMICS CHAPTER FOUR
NATOPS PERFORMANCE CHARTS T-45C CHARTS AND EXAM REVIEW T-45A 4-21
Figure 4-17 Landing Distance
b. Landing distance data is for a normal 17-unit AOA approach and landing using moderate braking coefficients
c. Landing Distance Computation
i. Enter chart with the density ratio ii. Extend line horizontally from density ratio to approach gross weight line iii. From the intersection of the density ratio line and approach gross weight line
extend a line vertically down to the wind speed graph iv. From the wind speed baseline, parallel the nearest headwind or tailwind
guideline down to the appropriate headwind or tailwind component in knots

CHAPTER FOUR T-45TS, TAILHOOK, AND IUT AERODYNAMICS
4-22 NATOPS PERFORMANCE CHARTS T-45C CHARTS AND EXAM REVIEW T-45A
v. From the intersection of the line paralleling the guideline and the headwind or tailwind component project a line down vertically to the ground roll distance graph
vi. Continue the line down to the appropriate runway condition reference line vii. From the intersection of the vertical line and runway condition reference line,
project a horizontal line to the left to determine ground roll
d. For total landing distance from 50 feet over the runway, add 715 feet to computed ground roll distance, e.g. crossing approach end of runway at 50 feet
Figure 4-18 Landing Distance 9. Dive Recovery
a. This chart is used to compute the altitude loss during a dive recovery

T-45TS, TAILHOOK, AND IUT AERODYNAMICS CHAPTER FOUR
NATOPS PERFORMANCE CHARTS T-45C CHARTS AND EXAM REVIEW T-45A 4-23
b. Altitude loss based on a dive recovery with a 2 g per second buildup to a sustained 4-g’s or maximum usable lift
c. Dive recovery computation
Figure 4-19 Dive Recovery
i. Enter chart at altitude at start of dive recovery ii. Extend horizontal line from altitude at start of dive recovery to the Mach
number or airspeed at start of dive recovery reference line iii. From the intersection of the altitude line and Mach number or airspeed
reference line extend a vertical line down to the initial dive-angle reference line

CHAPTER FOUR T-45TS, TAILHOOK, AND IUT AERODYNAMICS
4-24 NATOPS PERFORMANCE CHARTS T-45C CHARTS AND EXAM REVIEW T-45A
iv. From the intersection of the vertical line and the initial dive angle reference line extend a line horizontally to the left to determine altitude lost in the pullout
d. Subtract altitude lost during pullout from the altitude the pullout was initiated at to
find the minimum altitude after pullout
Figure 4-20 Dive Recovery 10. Operating Envelope
a. T-45 operating Envelope is a graphic representation of the airspeed and altitude limits b. Portions of the envelope impose additional restrictions on throttle movement and
position

T-45TS, TAILHOOK, AND IUT AERODYNAMICS CHAPTER FOUR
NATOPS PERFORMANCE CHARTS T-45C CHARTS AND EXAM REVIEW T-45A 4-25
Figure 4-21 Operating Envelope 11. Acceleration Limits
a. Symmetrical and unsymmetrical maneuvering limits are shown graphically b. Depicts the T-45 load limits under various conditions
i. Gross weight ii. Altitude iii. Airspeed
c. Unsymmetrical maneuvers are rolling maneuvers at other than 1-G flight

CHAPTER FOUR T-45TS, TAILHOOK, AND IUT AERODYNAMICS
4-26 NATOPS PERFORMANCE CHARTS T-45C CHARTS AND EXAM REVIEW T-45A
Figure 4-22 T-45 Acceleration Limits 12. External Stores Limitations
a. Matrix shows specific external stores limitations for
i. Station loading ii. Airspeed iii. Acceleration iv. Dive angle v. AOA vi. Center of gravity

T-45TS, TAILHOOK, AND IUT AERODYNAMICS CHAPTER FOUR
NATOPS PERFORMANCE CHARTS T-45C CHARTS AND EXAM REVIEW T-45A 4-27
Figure 4-23 External Stores Limitations
NOTE
Some limitations are listed as “LBA” or Limit Basic Aircraft. This means that limitations are the same as the basic aircraft limitations.
b. Also shown
i. Stores weight ii. Applicable notes
LESSON NOTES
Remember to bring the T-45C NATOPS to the Aerodynamics exam (Aero-07X).

CHAPTER FOUR T-45TS, TAILHOOK, AND IUT AERODYNAMICS
4-28 NATOPS PERFORMANCE CHARTS T-45C CHARTS AND EXAM REVIEW T-45A
405. SUMMARY This lesson has focused on the following topics: 1. NATOPS performance charts section layout 2. Techniques 3. NATOPS charts 406. CONCLUSION Having practiced working the charts, you are now prepared to use the NATOPS charts for preflight planning and apply prescribed operating procedures for optimum effectiveness of your aircraft.

GLOSSARY A-1
APPENDIX A GLOSSARY
A100. INTRODUCTION – N/A

APPENDIX A T-45TS, TAILHOOK, AND IUT AERODYNAMICS
A-2 GLOSSARY
THIS PAGE INTENTIONALLY LEFT BLANK


