FLIGHT MODEL IDENTIFICATION -...
40
Mig-21-FM-Identification-Rev. 14 Page - 1 FLIGHT MODEL IDENTIFICATION Mig-21M-izd.96A / L-15 Mikoyan-Gourevitch Corporation (Tumanskiy R-11F2SK-300) - Mig-21MF-izd.96F / L-16 Mikoyan-Gourevitch Corporation (Tumanskiy R-13-300) - Mig-21Bis-izd.75A / L-17 Mikoyan-Gourevitch Corporation (Tumanskiy R-25-300) CAUTION STATEMENT : This document is to be use only for simulation. Do not try to apply the procedures and or advices contained in it if you have the opportunity to fly this plane in real life. By the way, if you had (or still have) flew this aircraft, your comments, criticism and more are welcome. LICENSE : This document has been created by J.M. LANGERON / TOPOLO, (http://topolo.free.fr/ ) with the help of Tomislav Mesaric and Chuck Canyon. If you want to use these data, or part of it, please contact the author by personal message to TOPOLO on check-six forum: (http://www.checksix-forums.com/ )
Transcript of FLIGHT MODEL IDENTIFICATION -...

Mig-21-FM-Identification-Rev. 14
Page - 1
FLIGHT MODEL IDENTIFICATION
Mig-21M-izd.96A / L-15
Mikoyan-Gourevitch Corporation
(Tumanskiy R-11F2SK-300)
-
Mig-21MF-izd.96F / L-16
Mikoyan-Gourevitch Corporation
(Tumanskiy R-13-300)
-
Mig-21Bis-izd.75A / L-17
Mikoyan-Gourevitch Corporation
(Tumanskiy R-25-300)
CAUTION STATEMENT : This document is to be use only for simulation. Do not try to apply the procedures
and or advices contained in it if you have the opportunity to fly this plane in real life. By the way, if you had (or
still have) flew this aircraft, your comments, criticism and more are welcome.
LICENSE : This document has been created by J.M. LANGERON / TOPOLO, (http://topolo.free.fr/) with the
help of Tomislav Mesaric and Chuck Canyon. If you want to use these data, or part of it, please contact the
author by personal message to TOPOLO on check-six forum: (http://www.checksix-forums.com/)
Mig-21-FM-Identification-Rev. 14
Page - 2
1. Mig-21 M / iz.96A ........................................................................................................................... 3
General data. ........................................................................................................................................ 3
Level Flight Acceleration tables. ......................................................................................................... 4
Lift laws. ............................................................................................................................................ 11
Sustained load factor tables. .............................................................................................................. 14
2. Mig-21 bis / iz.75A. ...................................................................................................................... 17
General data. ...................................................................................................................................... 17
Military Thrust Law identification. ................................................................................................... 18
Maximum After Burner Thrust Law identification. .......................................................................... 22
Special After Burner Thrust Law identification. ............................................................................... 25
Sustained load factor - validation. ..................................................................................................... 27
3. Mig-21 MF / iz.96F ....................................................................................................................... 33
Thrust Law validation. ...................................................................................................................... 34
4. Annexes. ........................................................................................................................................ 37
Standard Atmosphere and Corrected Air Speed (CAS). ................................................................... 37
Load factor limits (Ng). ..................................................................................................................... 38
5. Change Log. .................................................................................................................................. 40

Mig-21-FM-Identification-Rev. 14
Page - 3
1. Mig-21 M / iz.96A
General data.
Empty weight (including pilot, no pylon, no
gun ammo) : 12,715 lbs / 5,760 kg
Reference Area : 247.57 sq.ft / 23.0 m2
Internal fuel : 2,600 l @ 0.83kg/l
: 2,158 Kg / 4,763 lbs
Speed limitations:
Speed limited to (first reached)
- 1,300 km/h (702 Kts) IAS
- Mach 2.1
Load factor limitations:
Load Factor (Ng) limitation depend on
external loads, Mach number and internal fuel
weight.
They are assumed to be the same for Mig-
21M/iz.96A and Mig-21MF/iz.96F. (refer to
appendix)
Mach number < 0.8
- Clean or 2 R-3S
o Fuel < 1,200 l : 8.5g
o Fuel < 1,600 l : 8g
o Fuel > 1,600 l : 7g
- 4 R-3S : 7g
- External tank(s) : 5g
- Rocket pods : 5g
- Bombs : 4g
Mach number > 0.8
- Clean or 2 R-3S
o Fuel < 1,200 l : 7g
o Fuel > 1,200 l : 6g
- 4 R-3S : 6g
- External tank(s) : 5g
- Rocket pods : 5g
- Bombs : 4g
Configuration definition.
Combat configuration “A”
Aircraft loaded with 50% of usable internal
fuel, Center Line pylon (but no CL Tank), 2 R-
3S missiles with their pylon and launching
rails under external wing stations.
- Aircraft (zero usable fuel) : 5,760 kg
- 200 gun ammo (Gsh 23) : 75 kg
- 1 Center line pylon : 24 kg
- 2 Under-wing pylon : 45 kg
- Equipped zero usable fuel : 5,904 kg
- 50% usable internal fuel : 1,005 kg
(2,219 lbs @0.83 g/cm3)
- Clean Combat Weight : 6,909 kg
- 2 APU-3S rails for R-3S : 41 kg
- 2 Missile R-3S : 150 kg
- Conf. “A” Combat weight : 7,100 kg
This defines a gross weight of 7,100 kg
(15,673 lbs) and a Drag Index of 12.
Total fuel volume approximated to 1,300l
Load factor limitation set to :
- 8.0 (mach < 0.8)
- 6.0 (mach > 0.8)
Combat configuration “B”:
Aircraft loaded with 50% of internal fuel,
Center Line pylon (but no CL Tank), 4 R-3S
missiles with their pylon and launching rails
under wing (internal and external).
- Aircraft (zero usable fuel) : 5,760 kg
- 200 gun ammo (Gsh 23) : 75 kg
- 1 Center line pylon : 24 kg
- 2 Under-wing pylon : 45 kg
- Equipped zero usable fuel : 5,904 kg
- 50% usable internal fuel : 1,005 kg
(2,219 lbs @0.83 g/cm3)
- Clean Combat Weight : 6,909 kg
- 2 additional wing pylons : 45 kg
- 4 APU-3S rails for R-3S : 82 kg
- 4 Missile R-3S : 300 kg
- Conf. “B” Combat weight :7,336 kg
This defines a gross weight of 16,194 lbs /
7,336 kg and a Drag Index of 13.
Total fuel volume approximated to 1,300l
Load factor limitation set to :
- 7.0 (mach < 0.8)
- 6.0 (mach > 0.8)
Mig-21-FM-Identification-Rev. 14
Page - 4
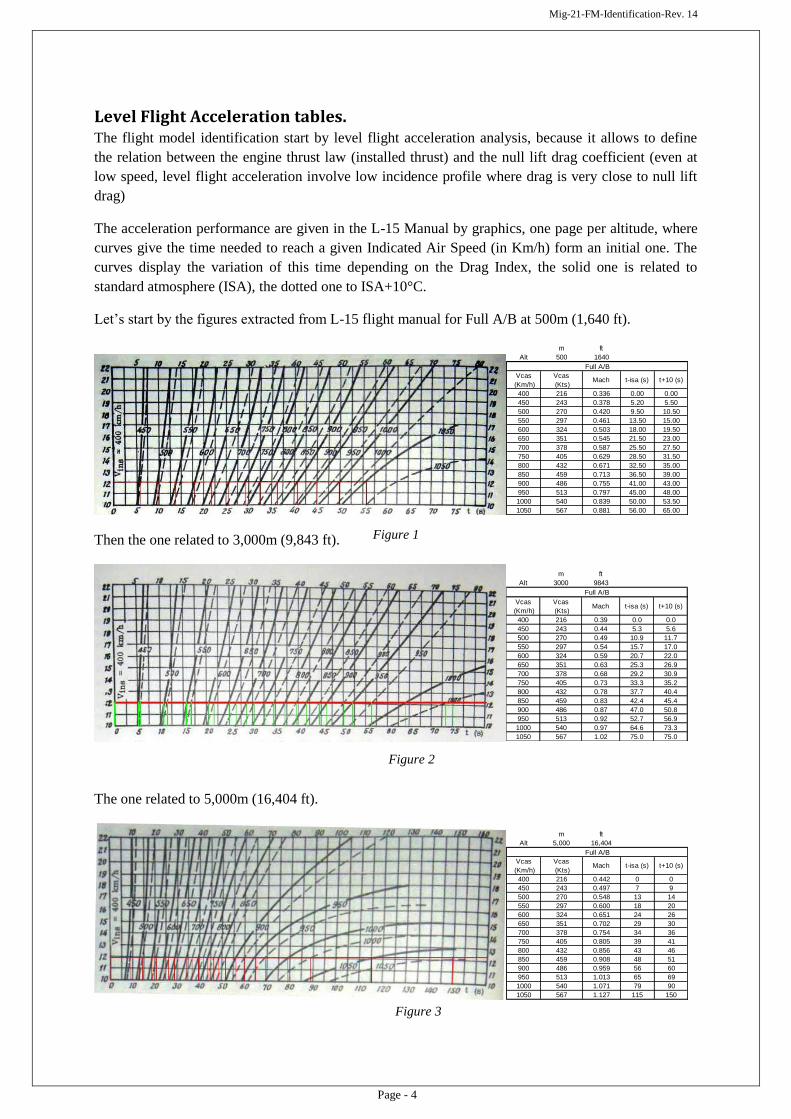
Level Flight Acceleration tables. The flight model identification start by level flight acceleration analysis, because it allows to define
the relation between the engine thrust law (installed thrust) and the null lift drag coefficient (even at
low speed, level flight acceleration involve low incidence profile where drag is very close to null lift
drag)
The acceleration performance are given in the L-15 Manual by graphics, one page per altitude, where
curves give the time needed to reach a given Indicated Air Speed (in Km/h) form an initial one. The
curves display the variation of this time depending on the Drag Index, the solid one is related to
standard atmosphere (ISA), the dotted one to ISA+10°C.
Let’s start by the figures extracted from L-15 flight manual for Full A/B at 500m (1,640 ft).
m ft
Alt 500 1640
Vcas
(Km/h)
Vcas
(Kts)Mach t-isa (s) t+10 (s)
400 216 0.336 0.00 0.00
450 243 0.378 5.20 5.50
500 270 0.420 9.50 10.50
550 297 0.461 13.50 15.00
600 324 0.503 18.00 19.50
650 351 0.545 21.50 23.00
700 378 0.587 25.50 27.50
750 405 0.629 28.50 31.50
800 432 0.671 32.50 35.00
850 459 0.713 36.50 39.00
900 486 0.755 41.00 43.00
950 513 0.797 45.00 48.00
1000 540 0.839 50.00 53.50
1050 567 0.881 56.00 65.00
Full A/B
Then the one related to 3,000m (9,843 ft).
m ft
Alt 3000 9843
Vcas
(Km/h)
Vcas
(Kts)Mach t-isa (s) t+10 (s)
400 216 0.39 0.0 0.0
450 243 0.44 5.3 5.6
500 270 0.49 10.9 11.7
550 297 0.54 15.7 17.0
600 324 0.59 20.7 22.0
650 351 0.63 25.3 26.9
700 378 0.68 29.2 30.9
750 405 0.73 33.3 35.2
800 432 0.78 37.7 40.4
850 459 0.83 42.4 45.4
900 486 0.87 47.0 50.8
950 513 0.92 52.7 56.9
1000 540 0.97 64.6 73.3
1050 567 1.02 75.0 75.0
Full A/B
The one related to 5,000m (16,404 ft).
m ft
Alt 5,000 16,404
Vcas
(Km/h)
Vcas
(Kts)Mach t-isa (s) t+10 (s)
400 216 0.442 0 0
450 243 0.497 7 9
500 270 0.548 13 14
550 297 0.600 18 20
600 324 0.651 24 26
650 351 0.702 29 30
700 378 0.754 34 36
750 405 0.805 39 41
800 432 0.856 43 46
850 459 0.908 48 51
900 486 0.959 56 60
950 513 1.013 65 69
1000 540 1.071 79 90
1050 567 1.127 115 150
Full A/B
Figure 1
Figure 2
Figure 3
Mig-21-FM-Identification-Rev. 14
Page - 5
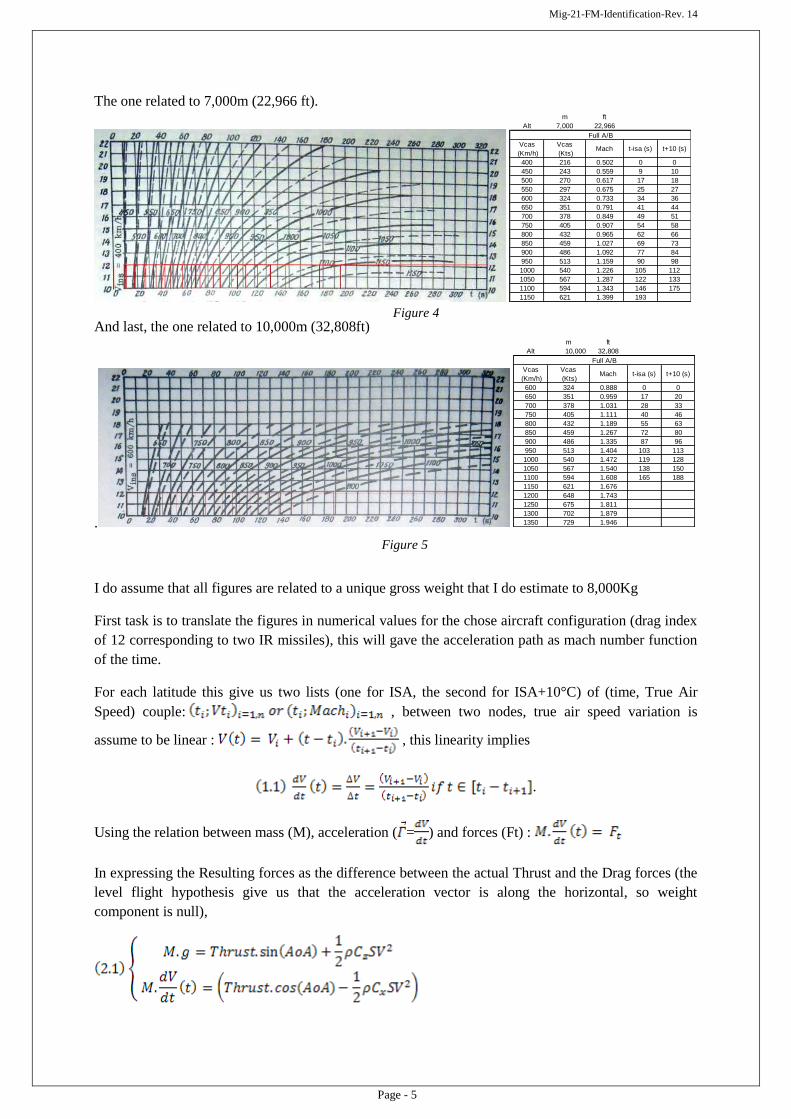
The one related to 7,000m (22,966 ft).
m ft
Alt 7,000 22,966
Vcas
(Km/h)
Vcas
(Kts)Mach t-isa (s) t+10 (s)
400 216 0.502 0 0
450 243 0.559 9 10
500 270 0.617 17 18
550 297 0.675 25 27
600 324 0.733 34 36
650 351 0.791 41 44
700 378 0.849 49 51
750 405 0.907 54 58
800 432 0.965 62 66
850 459 1.027 69 73
900 486 1.092 77 84
950 513 1.159 90 98
1000 540 1.226 105 112
1050 567 1.287 122 133
1100 594 1.343 146 175
1150 621 1.399 193
Full A/B
And last, the one related to 10,000m (32,808ft)
.
m ft
Alt 10,000 32,808
Vcas
(Km/h)
Vcas
(Kts)Mach t-isa (s) t+10 (s)
600 324 0.888 0 0
650 351 0.959 17 20
700 378 1.031 28 33
750 405 1.111 40 46
800 432 1.189 55 63
850 459 1.267 72 80
900 486 1.335 87 96
950 513 1.404 103 113
1000 540 1.472 119 128
1050 567 1.540 138 150
1100 594 1.608 165 188
1150 621 1.676
1200 648 1.743
1250 675 1.811
1300 702 1.879
1350 729 1.946
Full A/B
I do assume that all figures are related to a unique gross weight that I do estimate to 8,000Kg
First task is to translate the figures in numerical values for the chose aircraft configuration (drag index
of 12 corresponding to two IR missiles), this will gave the acceleration path as mach number function
of the time.
For each latitude this give us two lists (one for ISA, the second for ISA+10°C) of (time, True Air
Speed) couple: , between two nodes, true air speed variation is
assume to be linear : , this linearity implies
.
Using the relation between mass (M), acceleration ( = ) and forces (Ft) :
In expressing the Resulting forces as the difference between the actual Thrust and the Drag forces (the
level flight hypothesis give us that the acceleration vector is along the horizontal, so weight
component is null),
Figure 4
Figure 5

Mig-21-FM-Identification-Rev. 14
Page - 6
If we assume that incidence angle is so small that we can also consider Thrust being along horizontal
(sin(AoA) = 1.0), formula become:
There is also a relation between acceleration and Extra Specific Power (or instantaneous climb rate)
(V true air speed in m/s, Ps and Vz in m/s, g = 9.81 m/s2), or
that give the global equation system
(3.3)

Mig-21-FM-Identification-Rev. 14
Page - 7
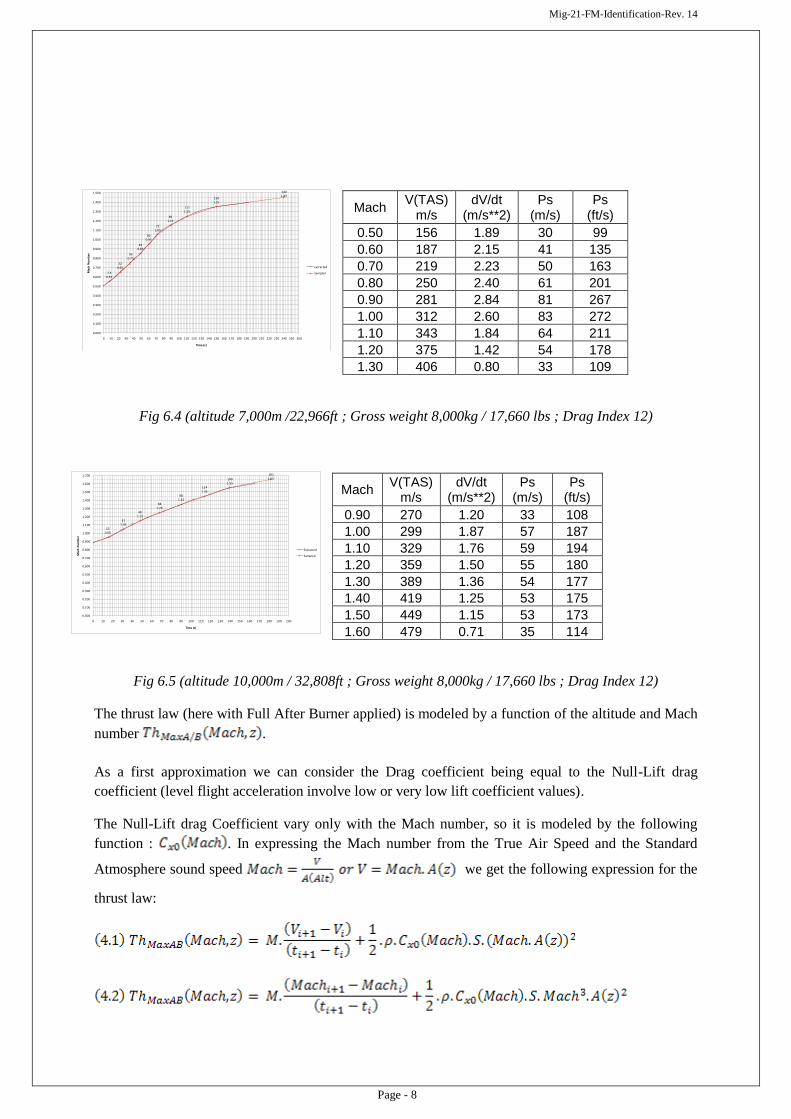
For each altitude, we can first build the table in fitting the Mach(t) interpolated
curve:
Mach V(TAS)
m/s dV/dt
(m/s**2) Ps
(m/s) Ps
(ft/s)
0.40 135 3.22 44 146
0.50 169 3.56 61 202
0.60 203 3.98 82 270
0.70 237 3.38 82 268
0.80 271 3.08 85 278
0.90 305 2.18 68 222
Fig 6.1 (altitude 500m / 1,640ft ; Gross weight 8,000kg / 17,660 lbs ; Drag Index 12)
Mach V(TAS)
m/s dV/dt
(m/s**2) Ps
(m/s) Ps
(ft/s)
0.40 131 2.99 40 131
0.50 164 3.13 52 172
0.60 197 3.46 70 228
0.70 230 3.87 91 297
0.80 263 3.46 93 304
0.90 296 2.35 71 232
1.00 329 1.37 46 150
Fig 6.2 (altitude 3,000m / 9,843ft ; Gross weight 8,000kg / 17,660 lbs ; Drag Index 12)
Mach V(TAS)
m/s dV/dt
(m/s**2) Ps
(m/s) Ps
(ft/s)
0.40 128
0.50 160 2.67 44 143
0.60 192 2.91 57 187
0.70 224 3.37 77 253
0.80 256 3.37 88 289
0.90 288 2.67 79 258
1.00 321 1.78 58 191
1.10 353 0.57 21 67
Fig 6.3 (altitude 5,000m / 16,404ft ; Gross weight 8,000kg / 17,660 lbs ; Drag Index 12)
6.50.45
170.55
26.50.65
350.75
44.50.85
58.50.95
82.51.05
0.00
0.10
0.20
0.30
0.40
0.50
0.60
0.70
0.80
0.90
1.00
1.10
0 10 20 30 40 50 60 70 80 90
Mac
h N
um
be
r
Time (s)
Extracted
Sampled
10.45
130.55
240.65
33.50.75
430.85
550.95
731.05
1291.15
0.000
0.100
0.200
0.300
0.400
0.500
0.600
0.700
0.800
0.900
1.000
1.100
1.200
0 10 20 30 40 50 60 70 80 90 100 110 120 130 140
Mac
h N
um
be
r
Time (s)
Extracted
Sampled
20.35
12.50.45
220.55
30.50.65
40.50.75
51.50.85
670.95
0.000
0.100
0.200
0.300
0.400
0.500
0.600
0.700
0.800
0.900
1.000
0.00 10.00 20.00 30.00 40.00 50.00 60.00 70.00 80.00
Mac
h N
um
be
r
Time (s)
Extracted
Sampled
Mig-21-FM-Identification-Rev. 14
Page - 8
Mach V(TAS)
m/s dV/dt
(m/s**2) Ps
(m/s) Ps
(ft/s)
0.50 156 1.89 30 99
0.60 187 2.15 41 135
0.70 219 2.23 50 163
0.80 250 2.40 61 201
0.90 281 2.84 81 267
1.00 312 2.60 83 272
1.10 343 1.84 64 211
1.20 375 1.42 54 178
1.30 406 0.80 33 109
Fig 6.4 (altitude 7,000m /22,966ft ; Gross weight 8,000kg / 17,660 lbs ; Drag Index 12)
Mach V(TAS)
m/s dV/dt
(m/s**2) Ps
(m/s) Ps
(ft/s)
0.90 270 1.20 33 108
1.00 299 1.87 57 187
1.10 329 1.76 59 194
1.20 359 1.50 55 180
1.30 389 1.36 54 177
1.40 419 1.25 53 175
1.50 449 1.15 53 173
1.60 479 0.71 35 114
Fig 6.5 (altitude 10,000m / 32,808ft ; Gross weight 8,000kg / 17,660 lbs ; Drag Index 12)
The thrust law (here with Full After Burner applied) is modeled by a function of the altitude and Mach
number .
As a first approximation we can consider the Drag coefficient being equal to the Null-Lift drag
coefficient (level flight acceleration involve low or very low lift coefficient values).
The Null-Lift drag Coefficient vary only with the Mach number, so it is modeled by the following
function : . In expressing the Mach number from the True Air Speed and the Standard
Atmosphere sound speed we get the following expression for the
thrust law:
7.50.55
220.65
360.75
490.85
600.95
721.05
891.15
1111.25
1501.35
2401.45
0.000
0.100
0.200
0.300
0.400
0.500
0.600
0.700
0.800
0.900
1.000
1.100
1.200
1.300
1.400
1.500
0 10 20 30 40 50 60 70 80 90 100 110 120 130 140 150 160 170 180 190 200 210 220 230 240 250 260
Mac
h N
um
be
r
Time (s)
Extracted
Sampled
150.95
311.05
481.15
681.25
901.35
1141.45
1401.55
1821.65
0.000
0.100
0.200
0.300
0.400
0.500
0.600
0.700
0.800
0.900
1.000
1.100
1.200
1.300
1.400
1.500
1.600
1.700
0 10 20 30 40 50 60 70 80 90 100 110 120 130 140 150 160 170 180 190 200
Mac
h N
um
be
r
Time (s)
Extracted
Sampled
Mig-21-FM-Identification-Rev. 14
Page - 9
If we want to avoid to approximate drag coefficient by only null-lift one, we may have to take into
account the induced drag (induced by lift) in defining the Drag coefficient by
.
This evaluation of the Drag coefficient (with a k assumed being constant) is quite accurate for low lift
and low incidence value. It can be determined by small variation of the regular formula related to
elliptic wing ( where is the aspect ratio and e is the wing efficiency factor. The
aspect ratio is computed from l (the wing span) and S the Reference area. (The elliptic wing formula
assume e equal to 1.00)
For the Mig-21 (all version) with a Reference area of 23m2
and a wing span of 7.15m, λ=2.225 the k
coefficient should be 0.143 for a wing efficiency of 1.00 but this will lead to a much too high Lift to
Drag ratio.
Based on the assumption of a maximum Lift to Drag ratio between 7 and 8 (common for the Mig-21
generation delta wing aircraft), I’ve chosen a value of 0.21 for k at low incidence, corresponding to a
wing efficiency coefficient (e) equal to 0.68.
Based on these hypothesis, for all value of Mach number inside the list the thrust
computation is done as follow
(5.2)
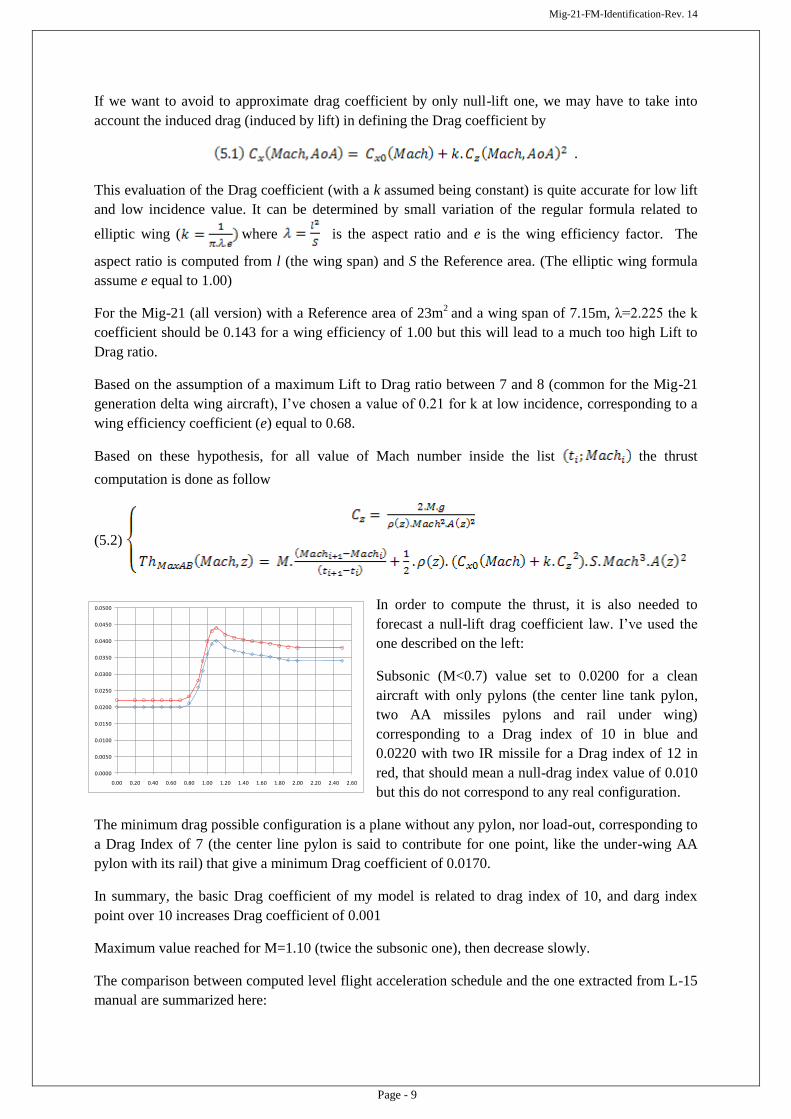
In order to compute the thrust, it is also needed to
forecast a null-lift drag coefficient law. I’ve used the
one described on the left:
Subsonic (M<0.7) value set to 0.0200 for a clean
aircraft with only pylons (the center line tank pylon,
two AA missiles pylons and rail under wing)
corresponding to a Drag index of 10 in blue and
0.0220 with two IR missile for a Drag index of 12 in
red, that should mean a null-drag index value of 0.010
but this do not correspond to any real configuration.
The minimum drag possible configuration is a plane without any pylon, nor load-out, corresponding to
a Drag Index of 7 (the center line pylon is said to contribute for one point, like the under-wing AA
pylon with its rail) that give a minimum Drag coefficient of 0.0170.
In summary, the basic Drag coefficient of my model is related to drag index of 10, and darg index
point over 10 increases Drag coefficient of 0.001
Maximum value reached for M=1.10 (twice the subsonic one), then decrease slowly.
The comparison between computed level flight acceleration schedule and the one extracted from L-15
manual are summarized here:
0.0000
0.0050
0.0100
0.0150
0.0200
0.0250
0.0300
0.0350
0.0400
0.0450
0.0500
0.00 0.20 0.40 0.60 0.80 1.00 1.20 1.40 1.60 1.80 2.00 2.20 2.40 2.60

Mig-21-FM-Identification-Rev. 14
Page - 10
The diagrams are (t,Mach), i.e. time requested to reach a given mach number.
The continuous black curves are computed from the flight model described here and standard
atmosphere (ISA).
The heavy colored segments delimit the time required to reach a given mach number in ISA and
ISA+10°C condition in the L-15/Mig-21M manual.
The length of the segment also describes the potential dispersion of the measures, and consequently
the admissible error in forecast.
All data are related to a configuration where gross weight is 8,000 kg and Drag index is 12 (2 K-13
missiles):
0
15
30
45
60
75
90
105
120
135
150
165
180
0.30 0.40 0.50 0.60 0.70 0.80 0.90 1.00 1.10 1.20 1.30 1.40 1.50 1.60
Tim
e (
s)
Mach
Acceleration (Max A/B Thrust)ISA Conditions
1,640
9,843
16,404
L-15 Manual500m
L-15 Manual3,000m
L-15 Manual5,000m
ISA + 10°C
ISA
0
15
30
45
60
75
90
105
120
135
150
165
180
0.30 0.40 0.50 0.60 0.70 0.80 0.90 1.00 1.10 1.20 1.30 1.40 1.50 1.60 1.70 1.80 1.90 2.00 2.10 2.20
Tim
e (
s)
Mach
Acceleration (Max A/B Thrust)ISA Conditions
22,966
32,808
39,370
L-15 Manual7,000m
L-15 Manual10,000m
Figure 6
Mig-21-FM-Identification-Rev. 14
Page - 11
Lift laws.
This section deals with the definition of the maximum lift, maximum lift can be reached by reaching
the incidence value that give the maximum lift coefficient, or by reaching the maximum possible
incidence due to the lack of efficiency of the pitch command.
Our first step will be to define the Lift coefficient law along incidence angle.
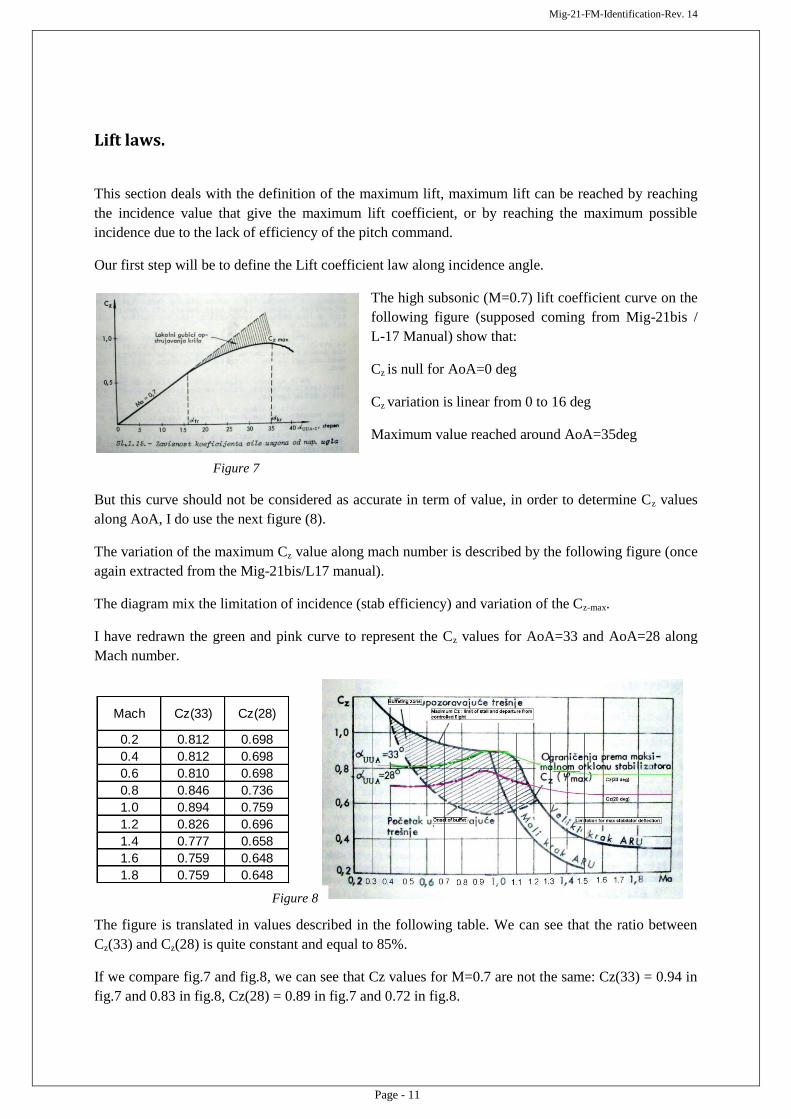
The high subsonic (M=0.7) lift coefficient curve on the
following figure (supposed coming from Mig-21bis /
L-17 Manual) show that:
Cz is null for AoA=0 deg
Cz variation is linear from 0 to 16 deg
Maximum value reached around AoA=35deg
But this curve should not be considered as accurate in term of value, in order to determine Cz values
along AoA, I do use the next figure (8).
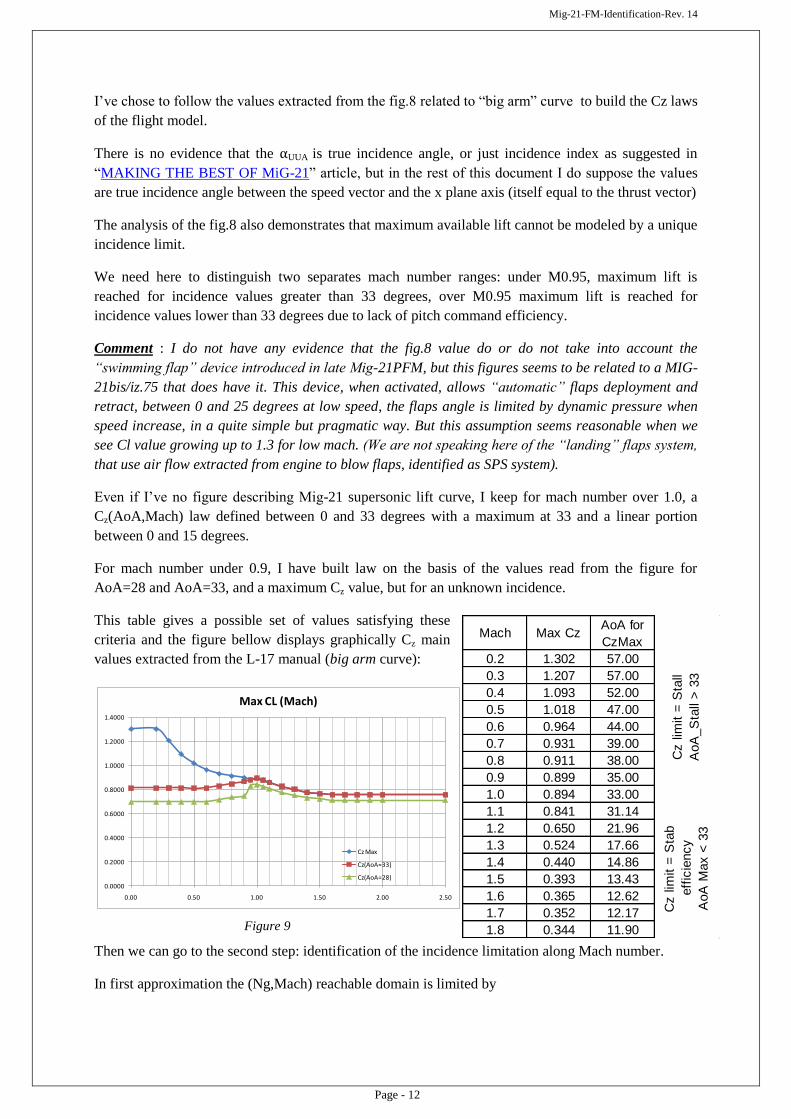
The variation of the maximum Cz value along mach number is described by the following figure (once
again extracted from the Mig-21bis/L17 manual).
The diagram mix the limitation of incidence (stab efficiency) and variation of the Cz-max.
I have redrawn the green and pink curve to represent the Cz values for AoA=33 and AoA=28 along
Mach number.
The figure is translated in values described in the following table. We can see that the ratio between
Cz(33) and Cz(28) is quite constant and equal to 85%.
If we compare fig.7 and fig.8, we can see that Cz values for M=0.7 are not the same: Cz(33) = 0.94 in
fig.7 and 0.83 in fig.8, Cz(28) = 0.89 in fig.7 and 0.72 in fig.8.
Mach Cz(33) Cz(28)
0.2 0.812 0.698
0.4 0.812 0.698
0.6 0.810 0.698
0.8 0.846 0.736
1.0 0.894 0.759
1.2 0.826 0.696
1.4 0.777 0.658
1.6 0.759 0.648
1.8 0.759 0.648
Figure 7
Figure 8
Mig-21-FM-Identification-Rev. 14
Page - 12
I’ve chose to follow the values extracted from the fig.8 related to “big arm” curve to build the Cz laws
of the flight model.
There is no evidence that the αUUA is true incidence angle, or just incidence index as suggested in
“MAKING THE BEST OF MiG-21” article, but in the rest of this document I do suppose the values
are true incidence angle between the speed vector and the x plane axis (itself equal to the thrust vector)
The analysis of the fig.8 also demonstrates that maximum available lift cannot be modeled by a unique
incidence limit.
We need here to distinguish two separates mach number ranges: under M0.95, maximum lift is
reached for incidence values greater than 33 degrees, over M0.95 maximum lift is reached for
incidence values lower than 33 degrees due to lack of pitch command efficiency.
Comment : I do not have any evidence that the fig.8 value do or do not take into account the
“swimming flap” device introduced in late Mig-21PFM, but this figures seems to be related to a MIG-
21bis/iz.75 that does have it. This device, when activated, allows “automatic” flaps deployment and
retract, between 0 and 25 degrees at low speed, the flaps angle is limited by dynamic pressure when
speed increase, in a quite simple but pragmatic way. But this assumption seems reasonable when we
see Cl value growing up to 1.3 for low mach. (We are not speaking here of the “landing” flaps system,
that use air flow extracted from engine to blow flaps, identified as SPS system).
Even if I’ve no figure describing Mig-21 supersonic lift curve, I keep for mach number over 1.0, a
Cz(AoA,Mach) law defined between 0 and 33 degrees with a maximum at 33 and a linear portion
between 0 and 15 degrees.
For mach number under 0.9, I have built law on the basis of the values read from the figure for
AoA=28 and AoA=33, and a maximum Cz value, but for an unknown incidence.
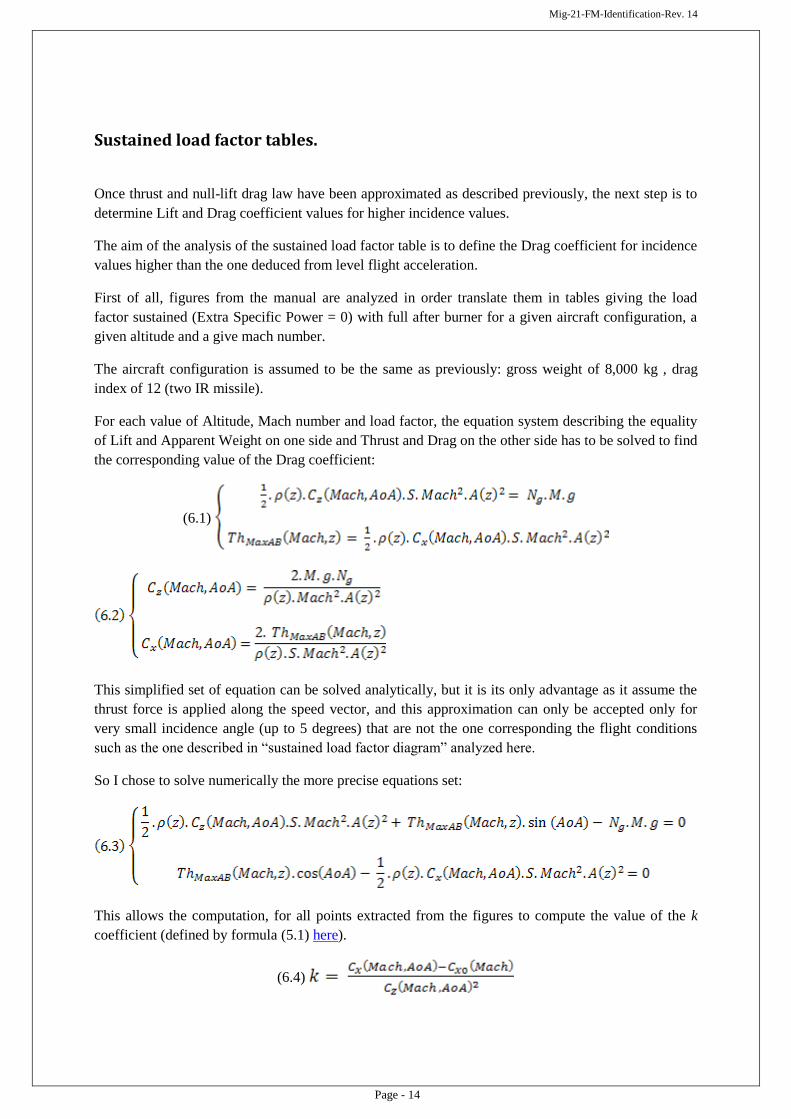
This table gives a possible set of values satisfying these
criteria and the figure bellow displays graphically Cz main
values extracted from the L-17 manual (big arm curve):
Then we can go to the second step: identification of the incidence limitation along Mach number.
In first approximation the (Ng,Mach) reachable domain is limited by
Mach Max CzAoA for
CzMax
0.2 1.302 57.00
0.3 1.207 57.00
0.4 1.093 52.00
0.5 1.018 47.00
0.6 0.964 44.00
0.7 0.931 39.00
0.8 0.911 38.00
0.9 0.899 35.00
1.0 0.894 33.00
1.1 0.841 31.14
1.2 0.650 21.96
1.3 0.524 17.66
1.4 0.440 14.86
1.5 0.393 13.43
1.6 0.365 12.62
1.7 0.352 12.17
1.8 0.344 11.90
Cz lim
it =
Sta
ll
AoA
_S
tall
> 3
3
Cz lim
it =
Sta
b
eff
icie
ncy
AoA
Max <
33
0.0000
0.2000
0.4000
0.6000
0.8000
1.0000
1.2000
1.4000
0.00 0.50 1.00 1.50 2.00 2.50
Max CL (Mach)
Cz Max
Cz(AoA=33)
Cz(AoA=28)
Figure 9

Mig-21-FM-Identification-Rev. 14
Page - 13
- Structural limit load factor (7G under Mach 0.8, 6G over M0.8).
- Maximal value of incidence angle that prevent from stall (maximum lift or pitch instability),
- Maximum reachable incidence due du pitch command efficiency.
I’ve chosen to represent the two last criteria by a unique Incidence limit law (Max_AoA(mach))
described by the following table:
Mach 0.00 0.10 0.20 0.30 0.40 0.50 0.60 0.70 0.80 0.90 1.00 1.10 1.20 1.30 1.40 1.50 1.60 1.70 1.80 1.90 2.00
Max_AoA (deg)57 57 57 57 52 47 44 39 38 35 33 31 22 18 15 13 13 12 12 12 12
In using such criteria, it is possible to compute, for a given gross weight and altitude, the relation
between the Mach number and maximum reachable load factor (independently from structural
limitation).
These curves (max Ng along Mach) are part of the L-17/Mig-21bis manual, the following figure
compare the colored curves (computed from the fig.9 values), but the manual’s figure assume an
incidence never exceeding 28 degrees (operational limit) so they fit what can be computed from fig.9
only for Mach number over 1.15.
It seems the incidence indicator
display a Yellow-Black between to
[21; 28] degrees and a Red-Black
between 28 and 35 degrees, the red
(forbidden) area is over this value I
assume being the operational limit.
This last assumption clearly does
not help to choose how the
performance charts (especially
Energy Mach diagrams that contain
the maximum reachable load factor
and turn rates) should be build.
Should I take into account the
maximum available lift in all cases,
or should I take into account the
incidence limitation of 28 degrees. It seems than the manual I’ve been able to read limit the flight
domain by a maximum incidence value of 28 or 33, but as I try to figure out the maximum capabilities
of the aircraft and not its documented operational usage, I’ve computed all turn performance charts
with the maximum available lift for all cases, with a dedicated curve corresponding to an incidence
limit of 28 degrees.
Mig-21-FM-Identification-Rev. 14
Page - 14
Sustained load factor tables.
Once thrust and null-lift drag law have been approximated as described previously, the next step is to
determine Lift and Drag coefficient values for higher incidence values.
The aim of the analysis of the sustained load factor table is to define the Drag coefficient for incidence
values higher than the one deduced from level flight acceleration.
First of all, figures from the manual are analyzed in order translate them in tables giving the load
factor sustained (Extra Specific Power = 0) with full after burner for a given aircraft configuration, a
given altitude and a give mach number.
The aircraft configuration is assumed to be the same as previously: gross weight of 8,000 kg , drag
index of 12 (two IR missile).
For each value of Altitude, Mach number and load factor, the equation system describing the equality
of Lift and Apparent Weight on one side and Thrust and Drag on the other side has to be solved to find
the corresponding value of the Drag coefficient:
(6.1)
This simplified set of equation can be solved analytically, but it is its only advantage as it assume the
thrust force is applied along the speed vector, and this approximation can only be accepted only for
very small incidence angle (up to 5 degrees) that are not the one corresponding the flight conditions
such as the one described in “sustained load factor diagram” analyzed here.
So I chose to solve numerically the more precise equations set:
This allows the computation, for all points extracted from the figures to compute the value of the k
coefficient (defined by formula (5.1) here).
(6.4)
Mig-21-FM-Identification-Rev. 14
Page - 15
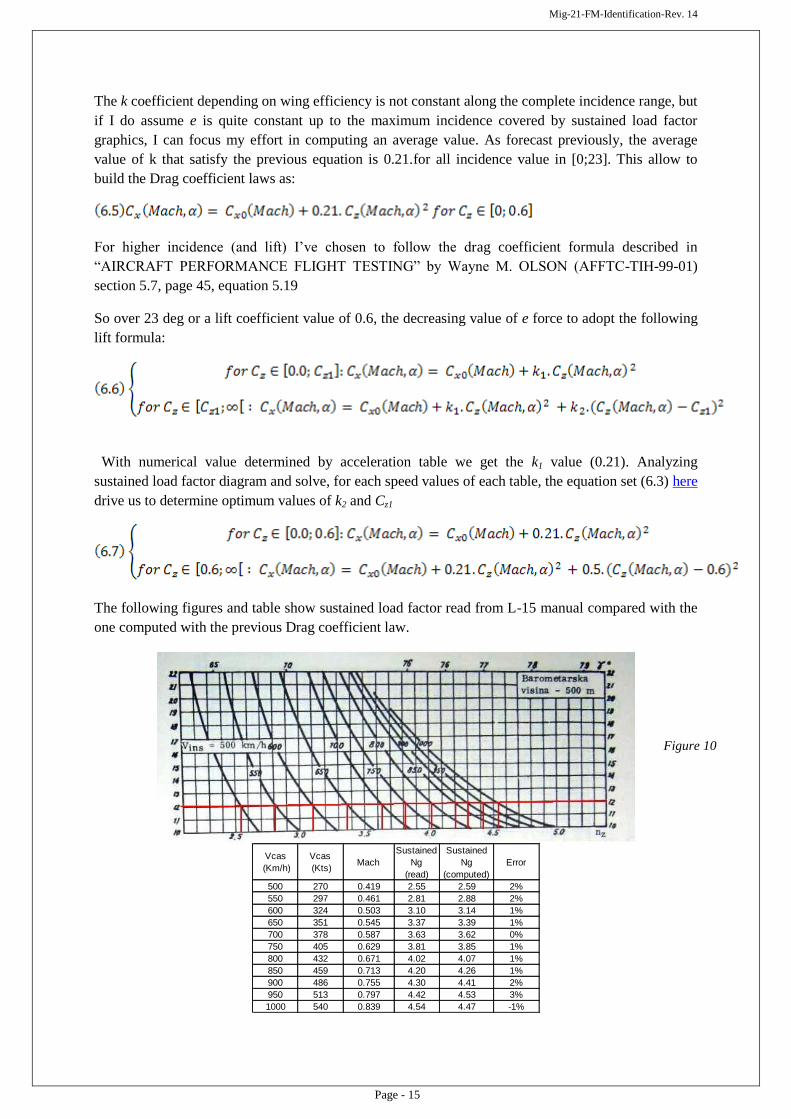
The k coefficient depending on wing efficiency is not constant along the complete incidence range, but
if I do assume e is quite constant up to the maximum incidence covered by sustained load factor
graphics, I can focus my effort in computing an average value. As forecast previously, the average
value of k that satisfy the previous equation is 0.21.for all incidence value in [0;23]. This allow to
build the Drag coefficient laws as:
For higher incidence (and lift) I’ve chosen to follow the drag coefficient formula described in
“AIRCRAFT PERFORMANCE FLIGHT TESTING” by Wayne M. OLSON (AFFTC-TIH-99-01)
section 5.7, page 45, equation 5.19
So over 23 deg or a lift coefficient value of 0.6, the decreasing value of e force to adopt the following
lift formula:
With numerical value determined by acceleration table we get the k1 value (0.21). Analyzing
sustained load factor diagram and solve, for each speed values of each table, the equation set (6.3) here
drive us to determine optimum values of k2 and Cz1
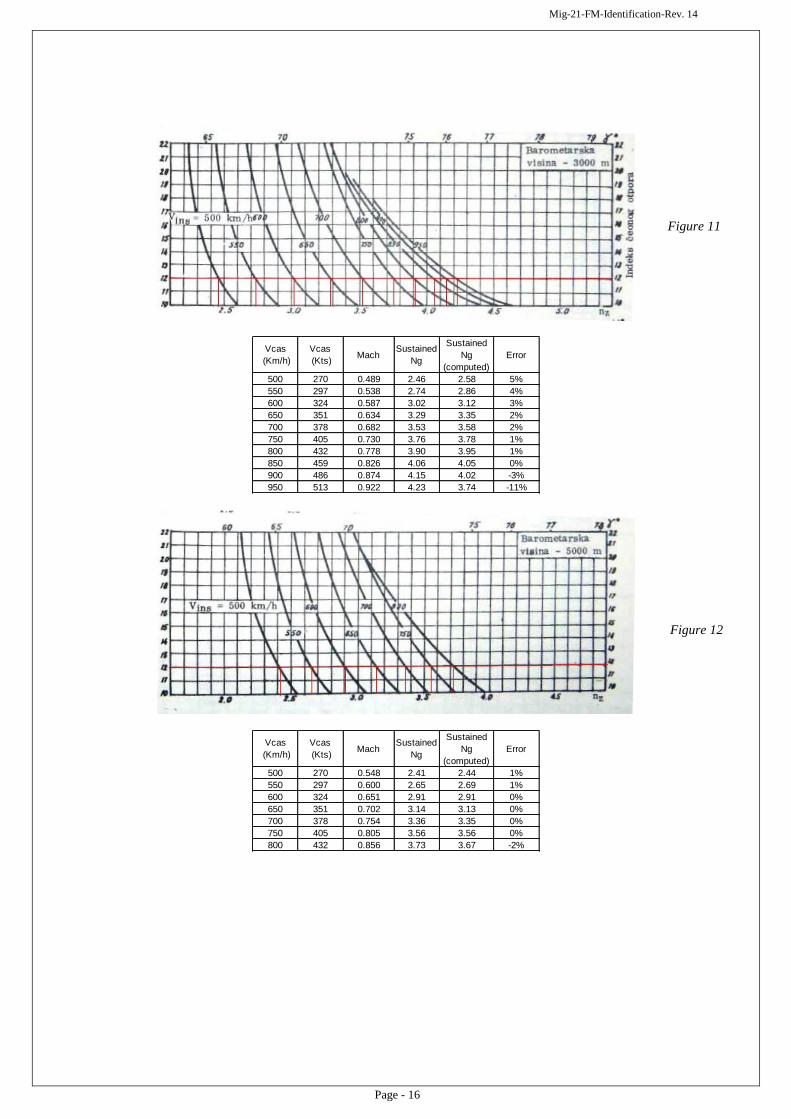
The following figures and table show sustained load factor read from L-15 manual compared with the
one computed with the previous Drag coefficient law.
Vcas
(Km/h)
Vcas
(Kts)Mach
Sustained
Ng
(read)
Sustained
Ng
(computed)
Error
500 270 0.419 2.55 2.59 2%
550 297 0.461 2.81 2.88 2%
600 324 0.503 3.10 3.14 1%
650 351 0.545 3.37 3.39 1%
700 378 0.587 3.63 3.62 0%
750 405 0.629 3.81 3.85 1%
800 432 0.671 4.02 4.07 1%
850 459 0.713 4.20 4.26 1%
900 486 0.755 4.30 4.41 2%
950 513 0.797 4.42 4.53 3%
1000 540 0.839 4.54 4.47 -1%
Figure 10
Mig-21-FM-Identification-Rev. 14
Page - 16
Vcas
(Km/h)
Vcas
(Kts)Mach
Sustained
Ng
Sustained
Ng
(computed)
Error
500 270 0.489 2.46 2.58 5%
550 297 0.538 2.74 2.86 4%
600 324 0.587 3.02 3.12 3%
650 351 0.634 3.29 3.35 2%
700 378 0.682 3.53 3.58 2%
750 405 0.730 3.76 3.78 1%
800 432 0.778 3.90 3.95 1%
850 459 0.826 4.06 4.05 0%
900 486 0.874 4.15 4.02 -3%
950 513 0.922 4.23 3.74 -11%
Vcas
(Km/h)
Vcas
(Kts)Mach
Sustained
Ng
Sustained
Ng
(computed)
Error
500 270 0.548 2.41 2.44 1%
550 297 0.600 2.65 2.69 1%
600 324 0.651 2.91 2.91 0%
650 351 0.702 3.14 3.13 0%
700 378 0.754 3.36 3.35 0%
750 405 0.805 3.56 3.56 0%
800 432 0.856 3.73 3.67 -2%
Figure 11
Figure 12

Mig-21-FM-Identification-Rev. 14
Page - 17
2. Mig-21 bis / iz.75A.
General data. The L-17 is assumed to be a Mig-21bis /iz.75A
with strengthened airframe.
The flight model of the Mig-21bis is built from
the one of the Mig-21M.
The hypotheses are the following:
- Same aerodynamics : CL(Mach ,AoA) and
CD(Mach, AoA) laws (we will see later on that
this assumption cannot be kept exactly)
- Internal fuel capacity set to 2,750 l (2,200 kg /
4,857 lbs @ 0.83 kg/l, but only 2,120 kg /
4,680 lbs usable)
- Empty weight set to 6,003 Kg / 13,251 lbs
(including pilot and non usable fuel).
- Engine changed from Tumanskiy R-11F2SK-
300 to R-25-300
o Military Thrust set to 40.20kN
o Full After-Burner set to 69.65kN
o Special After-Burner Regime (under
4,000m /13,123 ft) set to 97.20kN
Speed limitations:
Speed limited to (first reached)
- 1,300 km/h (702 Kts) IAS
- Mach 2.05
Load factor limitations:
Load Factor (Ng) limitation depend on
external loads, Mach number and internal fuel
weight.
They have been defined in reference to the
table in appendix.
Mach number < 0.8
- Clean or 2 R-3S or R-60
o Fuel < 900 l : 8.5g
o Fuel < 4,100 l : 8g
- 4 R-3S / R-60 : 7g
- External tank(s) : 5g
- Rocket pods : 5g
- Bombs : 4g
Mach number > 0.8
- Clean or 2 R-3S
o Fuel < 900 l : 7g
o Fuel > 900 l : 6g
- 4 R-3S : 6g
- External tank(s) : 5g
- Rocket pods : 5g
- Bombs : 4g
Configuration definition.
Combat configuration “A”
Aircraft loaded with 50% of usable internal
fuel, Center Line pylon (but no CL Tank), 2 R-
60 missiles with their pylon and launching rails
under external wing stations.
- Aircraft (zero usable fuel) : 6,003 kg
- 200 gun ammo (Gsh 23) : 95 kg
- 1 Center line pylon : 24 kg
- 2 Under-wing pylon : 50 kg
- Equipped zero usable fuel : 6,172 kg
- 50% usable internal fuel : 1,060 kg
@0.80 g/cm3
- Clean Combat Weight : 7,232 kg
- 2 APU-60IM rails for R-60 : 70 kg
- 2 Missile R-60 : 90 kg
- Conf. “A” Combat weight : 7,392 kg
This defines a gross weight of 7,392 kg
(16,318 lbs) and a Drag Index of 11.
Total fuel volume approximated to 1,375l
Load factor limitation set to :
- 8.0 (mach < 0.8)
- 6.0 (mach > 0.8)
Combat configuration “B”:
Aircraft loaded with 50% of internal fuel,
Center Line pylon (but no CL Tank), 2 R-60
missiles with their pylon and launching rails
under external wing station, plus two R-13M
with their pylon and launching rails under
internal wing stations.
- Aircraft (zero usable fuel) : 6,003 kg
- 200 gun ammo (Gsh 23) : 95 kg
Mig-21-FM-Identification-Rev. 14
Page - 18
- 1 Center line pylon : 24 kg
- 2 Under-wing pylon : 50 kg
- Equipped zero usable fuel : 6,172 kg
- 50% usable internal fuel : 1,060 kg
@0.83 g/cm3
- Clean Combat Weight : 7,232 kg
- 2 APU-60IM rails for R-60 : 70 kg
- 2 Missile R-60 : 90 kg
- 2 additional wing pylons : 50 kg
- 2 APU-13 rails for R-13M : 60 kg
- 2 Missile R-13M : 184 kg
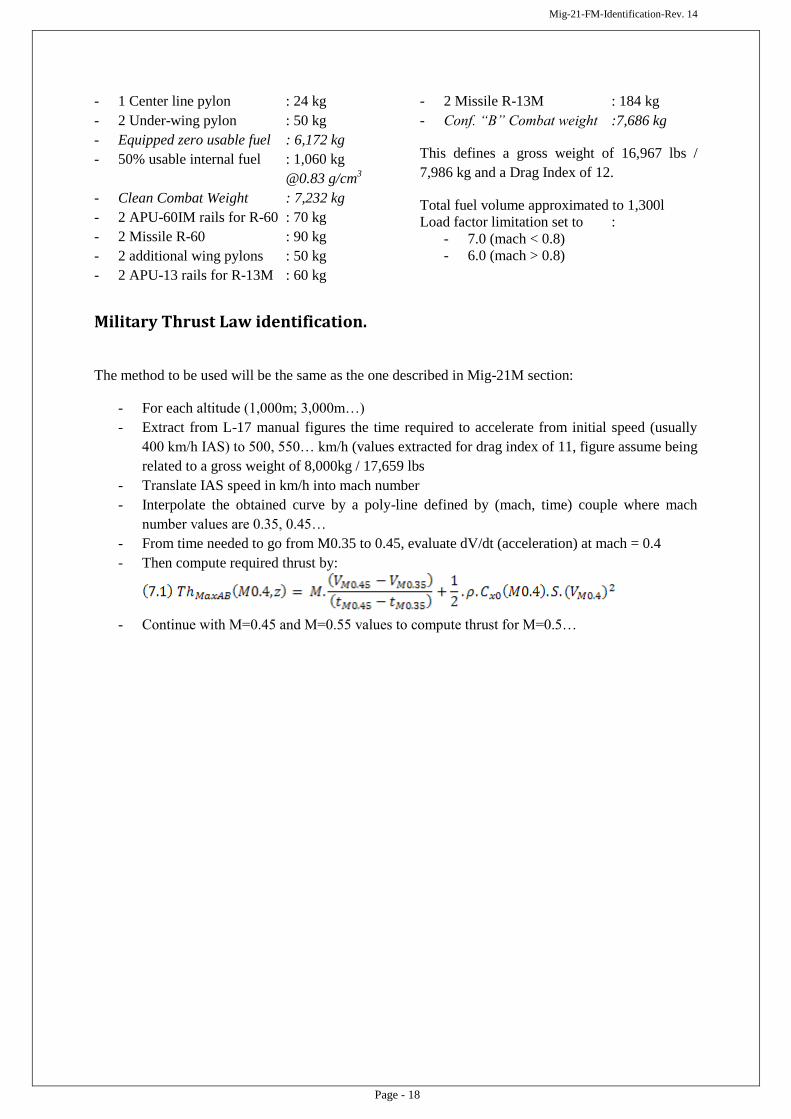
- Conf. “B” Combat weight :7,686 kg
This defines a gross weight of 16,967 lbs /
7,986 kg and a Drag Index of 12.
Total fuel volume approximated to 1,300l
Load factor limitation set to :
- 7.0 (mach < 0.8)
- 6.0 (mach > 0.8)
Military Thrust Law identification.
The method to be used will be the same as the one described in Mig-21M section:
- For each altitude (1,000m; 3,000m…)
- Extract from L-17 manual figures the time required to accelerate from initial speed (usually
400 km/h IAS) to 500, 550… km/h (values extracted for drag index of 11, figure assume being
related to a gross weight of 8,000kg / 17,659 lbs
- Translate IAS speed in km/h into mach number
- Interpolate the obtained curve by a poly-line defined by (mach, time) couple where mach
number values are 0.35, 0.45…
- From time needed to go from M0.35 to 0.45, evaluate dV/dt (acceleration) at mach = 0.4
- Then compute required thrust by:
- Continue with M=0.45 and M=0.55 values to compute thrust for M=0.5…
Mig-21-FM-Identification-Rev. 14
Page - 19
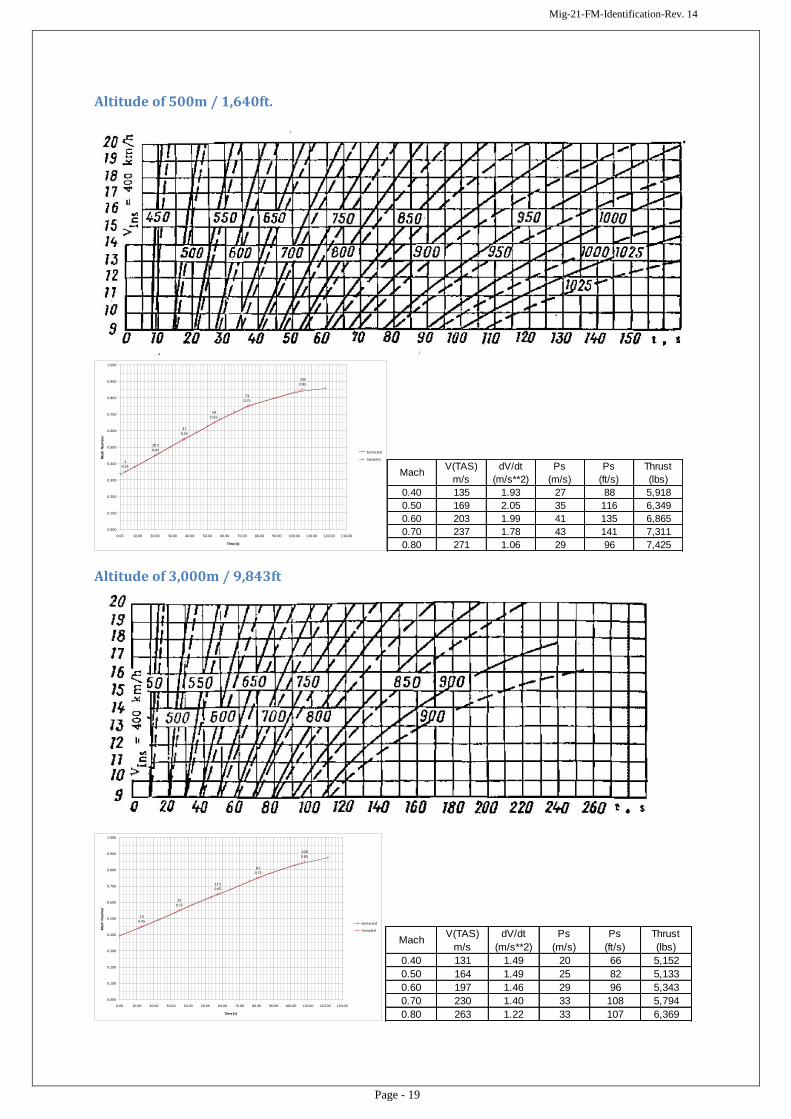
Altitude of 500m / 1,640ft.
30.35
20.50.45
370.55
540.65
730.75
1050.85
0.000
0.100
0.200
0.300
0.400
0.500
0.600
0.700
0.800
0.900
1.000
0.00 10.00 20.00 30.00 40.00 50.00 60.00 70.00 80.00 90.00 100.00 110.00 120.00 130.00
Mac
h N
um
be
r
Time (s)
Extracted
Sampled
MachV(TAS)
m/s
dV/dt
(m/s**2)
Ps
(m/s)
Ps
(ft/s)
Thrust
(lbs)
0.40 135 1.93 27 88 5,918
0.50 169 2.05 35 116 6,349
0.60 203 1.99 41 135 6,865
0.70 237 1.78 43 141 7,311
0.80 271 1.06 29 96 7,425
Altitude of 3,000m / 9,843ft
130.45
350.55
57.50.65
810.75
1080.85
0.000
0.100
0.200
0.300
0.400
0.500
0.600
0.700
0.800
0.900
1.000
0.00 10.00 20.00 30.00 40.00 50.00 60.00 70.00 80.00 90.00 100.00 110.00 120.00 130.00
Mac
h N
um
be
r
Time (s)
Extracted
Sampled
MachV(TAS)
m/s
dV/dt
(m/s**2)
Ps
(m/s)
Ps
(ft/s)
Thrust
(lbs)
0.40 131 1.49 20 66 5,152
0.50 164 1.49 25 82 5,133
0.60 197 1.46 29 96 5,343
0.70 230 1.40 33 108 5,794
0.80 263 1.22 33 107 6,369

Mig-21-FM-Identification-Rev. 14
Page - 20
Altitude of 5,000m / 16,404ft
20.45
340.55
620.65
930.75
1270.85
1650.95
0.000
0.100
0.200
0.300
0.400
0.500
0.600
0.700
0.800
0.900
1.000
0.00 10.00 20.00 30.00 40.00 50.00 60.00 70.00 80.00 90.00 100.00 110.00 120.00 130.00 140.00 150.00 160.00 170.00 180.00
Mac
h N
um
be
r
Time (s)
Extracted
Sampled MachV(TAS)
m/s
dV/dt
(m/s**2)
Ps
(m/s)
Ps
(ft/s)
Thrust
(lbs)
0.40 128 0.94 12 40 4,186
0.50 160 1.00 16 54 4,186
0.60 192 1.14 22 74 4,557
0.70 224 1.03 24 78 4,654
0.80 256 0.94 25 81 5,126
0.90 288 0.84 25 81 6,346
In this case, thrust computed for M=0.4 and 0.9 (first and last value) are questionable, because it is
quite difficult to estimate the local acceleration before M0.4 and after M0.9
Altitude of 7,000m / 22,966ft
380.55
860.65
1340.75
1800.85
0.000
0.100
0.200
0.300
0.400
0.500
0.600
0.700
0.800
0.900
1.000
0.00 10.00 20.00 30.00 40.00 50.00 60.00 70.00 80.00 90.00 100.00 110.00 120.00 130.00 140.00 150.00 160.00 170.00 180.00 190.00
Mac
h N
um
be
r
Time (s)
Extracted
Sampled
MachV(TAS)
m/s
dV/dt
(m/s**2)
Ps
(m/s)
Ps
(ft/s)
Thrust
(lbs)
0.50 156 0.38 6 20 3,248
0.60 187 0.65 12 41 3,558
0.70 219 0.65 14 48 3,683
0.80 250 0.68 17 57 4,125

Mig-21-FM-Identification-Rev. 14
Page - 21
The comparison between the computed data and the one extracted from the L-17 manual is
summarized by the following figure: the computed values are displayed as B&W curves, the values
extracted from manual are displayed as big colored dots.
0
15
30
45
60
75
90
105
120
135
150
165
180
0.30 0.40 0.50 0.60 0.70 0.80 0.90 1.00 1.10 1.20 1.30 1.40 1.50 1.60
Tim
e (
s)
Mach
Level flight Acceleration
1,640
9,843
16,404
22,966
RL 500m
RL 3,000m
RL 5,000m
RL 7,000m
Figure 13

Mig-21-FM-Identification-Rev. 14
Page - 22
Maximum After Burner Thrust Law identification. The same procedure will be applied using maximum after burner manual figures, but we have to
consider to following obvious error in all these figures: initial speed is said 550km/h (indicated) when
the first curve indicated the time required to reach 550 km/h, so I have to consider that initial speed is,
in fact, 500 km/h indicated:
Altitude of 1,000m / 3,281ft
10.45
80.55
150.65
220.75
290.85
410.95
551.05
861.15
0.300
0.400
0.500
0.600
0.700
0.800
0.900
1.000
1.100
1.200
0.00 10.00 20.00 30.00 40.00 50.00 60.00 70.00 80.00 90.00 100.00
Mac
h N
um
be
r
Time (s)
Extracted
Sampled
MachV(TAS)
m/s
dV/dt
(m/s**2)
Ps
(m/s)
Ps
(ft/s)
Thrust
(lbs)
0.40 135 5.61 77 252 5,743
0.50 168 4.81 82 270 11,822
0.60 202 4.81 99 324 12,141
0.70 235 4.81 115 379 12,589
0.80 269 4.81 132 433 13,531
0.90 303 2.80 87 284 13,531
1.00 336 2.40 82 270 16,720
1.10 370 1.09 41 134 18,883
Altitude of 3,000m / 9,843ft
40.55
110.65
18.50.75
250.85
320.95
44.51.05
651.15
1031.25
0.400
0.500
0.600
0.700
0.800
0.900
1.000
1.100
1.200
1.300
0.00 10.00 20.00 30.00 40.00 50.00 60.00 70.00 80.00 90.00 100.00 110.00
Mac
h N
um
be
r
Time (s)
Extracted
Sampled
MachV(TAS)
m/s
dV/dt
(m/s**2)
Ps
(m/s)
Ps
(ft/s)
Thrust
(lbs)
0.50 164 4.69 79 258 10,812
0.60 197 4.69 94 309 11,113
0.70 230 4.38 103 337 11,127
0.80 263 5.06 135 444 13,296
0.90 296 4.69 141 464 14,551
1.00 329 2.63 88 289 15,174
1.10 361 1.60 59 194 16,634
1.20 394 0.86 35 114 17,065
Mig-21-FM-Identification-Rev. 14
Page - 23
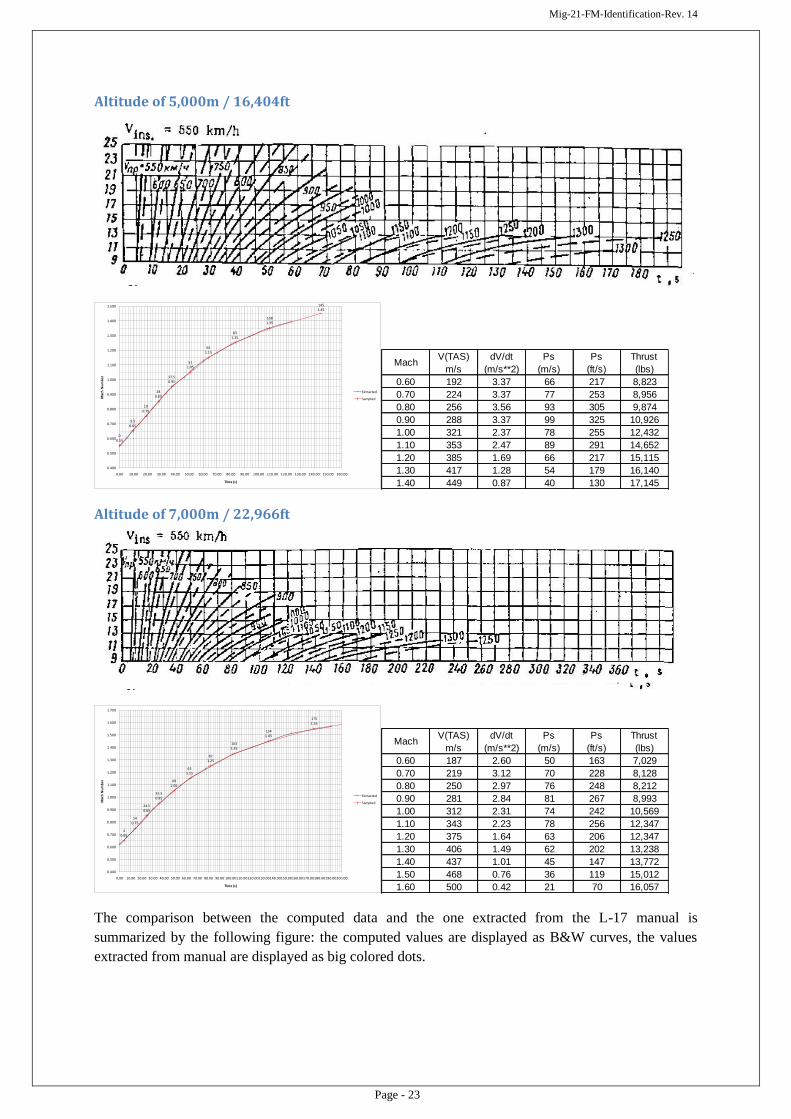
Altitude of 5,000m / 16,404ft
00.55
9.50.65
190.75
280.85
37.50.95
511.05
641.15
831.25
1081.35
1451.45
0.400
0.500
0.600
0.700
0.800
0.900
1.000
1.100
1.200
1.300
1.400
1.500
0.00 10.00 20.00 30.00 40.00 50.00 60.00 70.00 80.00 90.00 100.00 110.00 120.00 130.00 140.00 150.00 160.00
Mac
h N
um
be
r
Time (s)
Extracted
Sampled
MachV(TAS)
m/s
dV/dt
(m/s**2)
Ps
(m/s)
Ps
(ft/s)
Thrust
(lbs)
0.60 192 3.37 66 217 8,823
0.70 224 3.37 77 253 8,956
0.80 256 3.56 93 305 9,874
0.90 288 3.37 99 325 10,926
1.00 321 2.37 78 255 12,432
1.10 353 2.47 89 291 14,652
1.20 385 1.69 66 217 15,115
1.30 417 1.28 54 179 16,140
1.40 449 0.87 40 130 17,145
Altitude of 7,000m / 22,966ft
40.65
140.75
24.50.85
35.50.95
491.05
631.15
821.25
1031.35
1341.45
1751.55
0.400
0.500
0.600
0.700
0.800
0.900
1.000
1.100
1.200
1.300
1.400
1.500
1.600
1.700
0.00 10.00 20.00 30.00 40.00 50.00 60.00 70.00 80.00 90.00 100.00110.00120.00130.00140.00150.00160.00170.00180.00190.00200.00
Mac
h N
um
be
r
Time (s)
Extracted
Sampled
MachV(TAS)
m/s
dV/dt
(m/s**2)
Ps
(m/s)
Ps
(ft/s)
Thrust
(lbs)
0.60 187 2.60 50 163 7,029
0.70 219 3.12 70 228 8,128
0.80 250 2.97 76 248 8,212
0.90 281 2.84 81 267 8,993
1.00 312 2.31 74 242 10,569
1.10 343 2.23 78 256 12,347
1.20 375 1.64 63 206 12,347
1.30 406 1.49 62 202 13,238
1.40 437 1.01 45 147 13,772
1.50 468 0.76 36 119 15,012
1.60 500 0.42 21 70 16,057
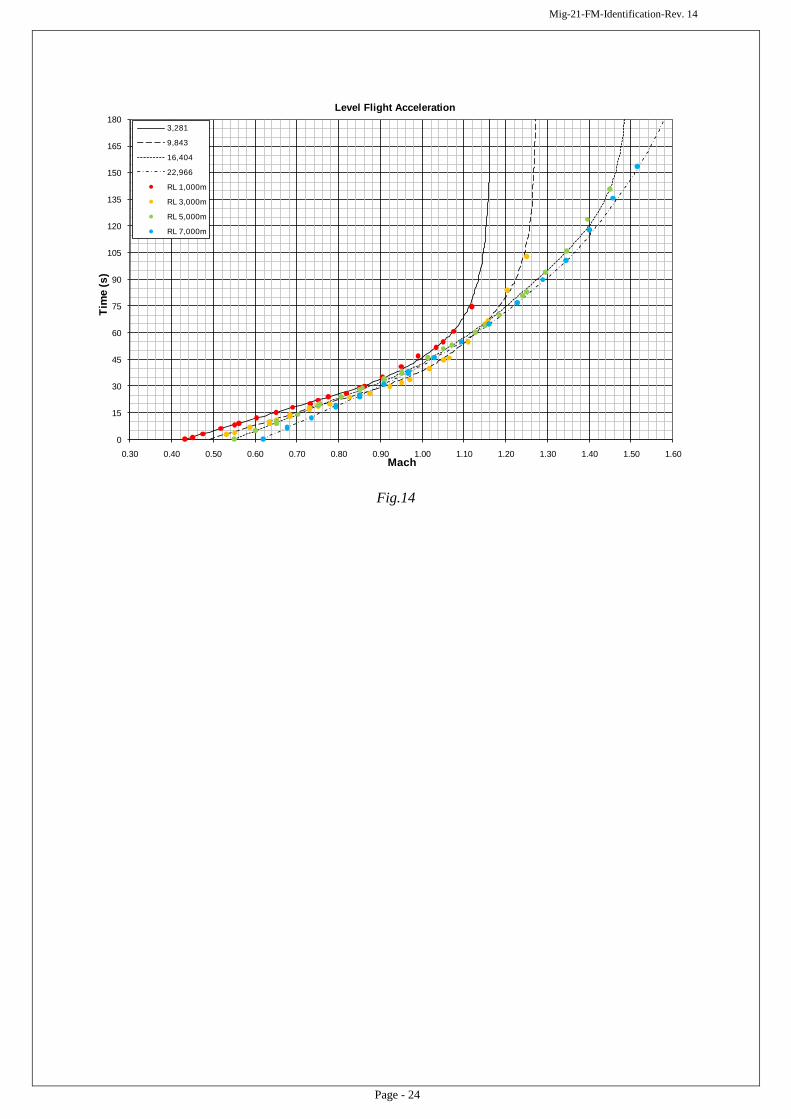
The comparison between the computed data and the one extracted from the L-17 manual is
summarized by the following figure: the computed values are displayed as B&W curves, the values
extracted from manual are displayed as big colored dots.
Mig-21-FM-Identification-Rev. 14
Page - 24
0
15
30
45
60
75
90
105
120
135
150
165
180
0.30 0.40 0.50 0.60 0.70 0.80 0.90 1.00 1.10 1.20 1.30 1.40 1.50 1.60
Tim
e (
s)
Mach
Level Flight Acceleration
3,281
9,843
16,404
22,966
RL 1,000m
RL 3,000m
RL 5,000m
RL 7,000m
Fig.14
Mig-21-FM-Identification-Rev. 14
Page - 25
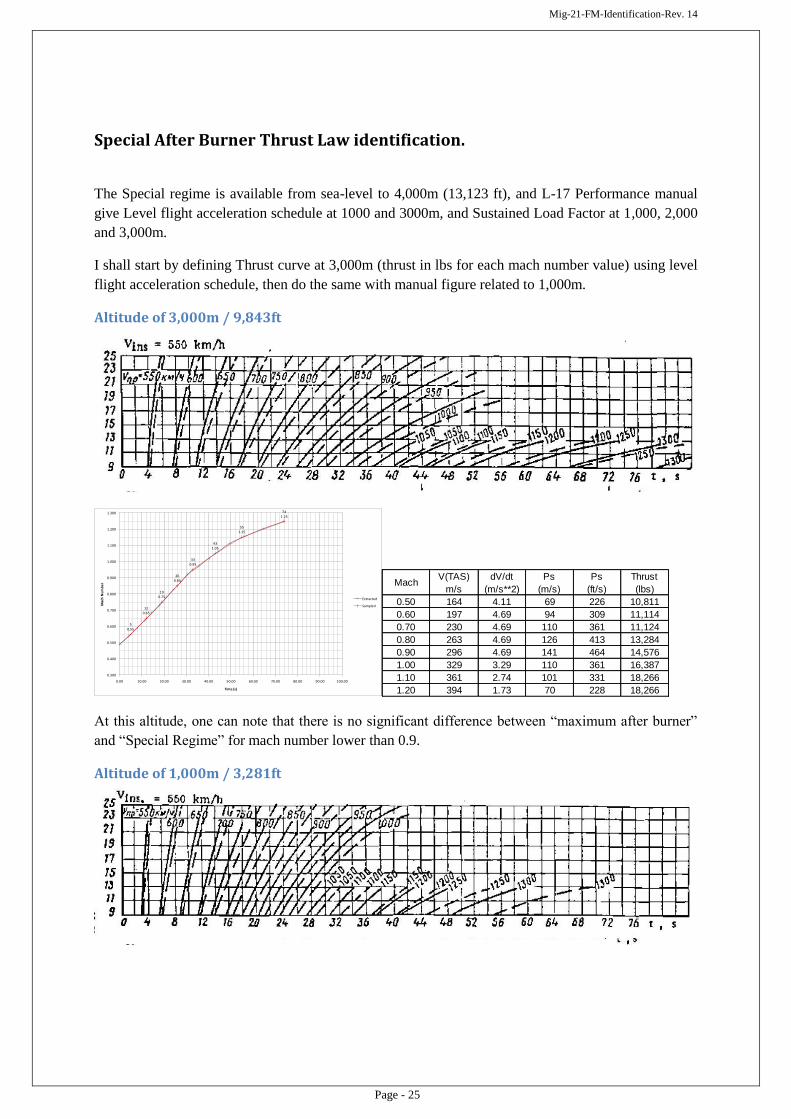
Special After Burner Thrust Law identification.
The Special regime is available from sea-level to 4,000m (13,123 ft), and L-17 Performance manual
give Level flight acceleration schedule at 1000 and 3000m, and Sustained Load Factor at 1,000, 2,000
and 3,000m.
I shall start by defining Thrust curve at 3,000m (thrust in lbs for each mach number value) using level
flight acceleration schedule, then do the same with manual figure related to 1,000m.
Altitude of 3,000m / 9,843ft
50.55
120.65
190.75
260.85
330.95
431.05
551.15
741.25
0.300
0.400
0.500
0.600
0.700
0.800
0.900
1.000
1.100
1.200
1.300
0.00 10.00 20.00 30.00 40.00 50.00 60.00 70.00 80.00 90.00 100.00
Mac
h N
um
be
r
Time (s)
Extracted
Sampled
MachV(TAS)
m/s
dV/dt
(m/s**2)
Ps
(m/s)
Ps
(ft/s)
Thrust
(lbs)
0.50 164 4.11 69 226 10,811
0.60 197 4.69 94 309 11,114
0.70 230 4.69 110 361 11,124
0.80 263 4.69 126 413 13,284
0.90 296 4.69 141 464 14,576
1.00 329 3.29 110 361 16,387
1.10 361 2.74 101 331 18,266
1.20 394 1.73 70 228 18,266
At this altitude, one can note that there is no significant difference between “maximum after burner”
and “Special Regime” for mach number lower than 0.9.
Altitude of 1,000m / 3,281ft
Mig-21-FM-Identification-Rev. 14
Page - 26
1.50.45
80.55
140.65
19.50.75
25.50.85
32.50.95
41.51.05
621.15
0.300
0.400
0.500
0.600
0.700
0.800
0.900
1.000
1.100
1.200
1.300
0.00 10.00 20.00 30.00 40.00 50.00 60.00 70.00 80.00 90.00 100.00
Mac
h N
um
be
r
Time (s)
Extracted
Sampled
MachV(TAS)
m/s
dV/dt
(m/s**2)
Ps
(m/s)
Ps
(ft/s)
Thrust
(lbs)
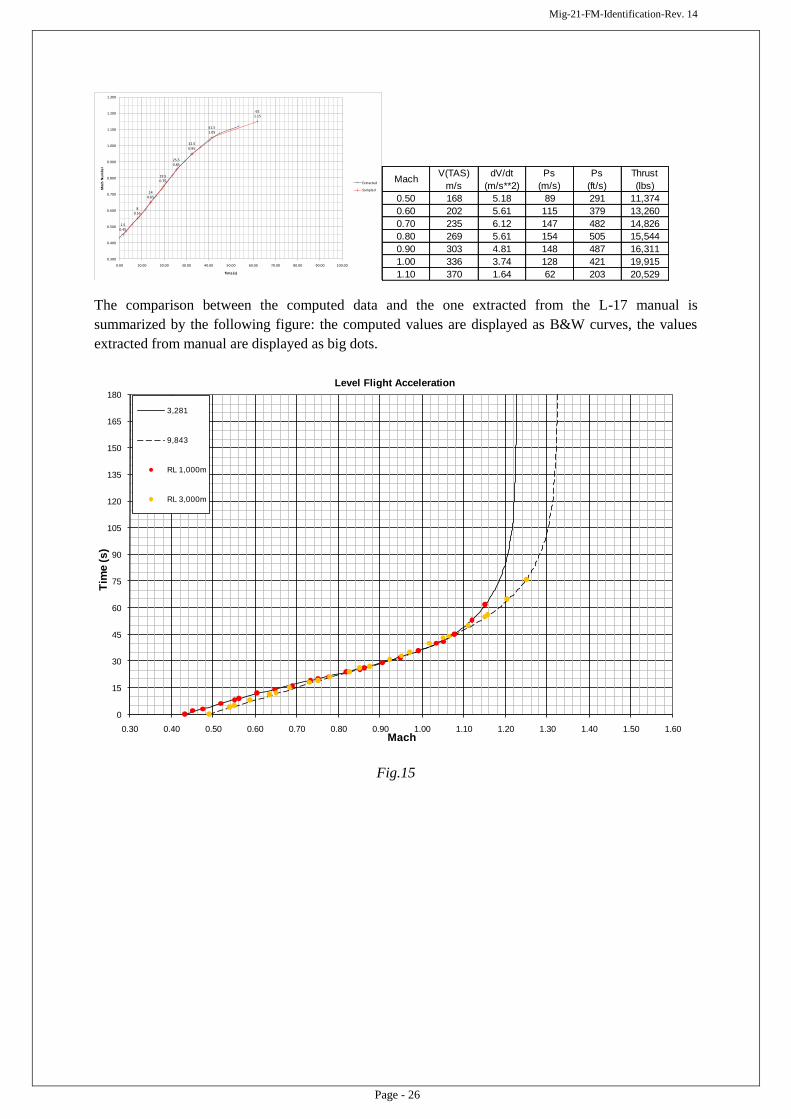
0.50 168 5.18 89 291 11,374
0.60 202 5.61 115 379 13,260
0.70 235 6.12 147 482 14,826
0.80 269 5.61 154 505 15,544
0.90 303 4.81 148 487 16,311
1.00 336 3.74 128 421 19,915
1.10 370 1.64 62 203 20,529
The comparison between the computed data and the one extracted from the L-17 manual is
summarized by the following figure: the computed values are displayed as B&W curves, the values
extracted from manual are displayed as big dots.
0
15
30
45
60
75
90
105
120
135
150
165
180
0.30 0.40 0.50 0.60 0.70 0.80 0.90 1.00 1.10 1.20 1.30 1.40 1.50 1.60
Tim
e (
s)
Mach
Level Flight Acceleration
3,281
9,843
RL 1,000m
RL 3,000m
Fig.15
Mig-21-FM-Identification-Rev. 14
Page - 27
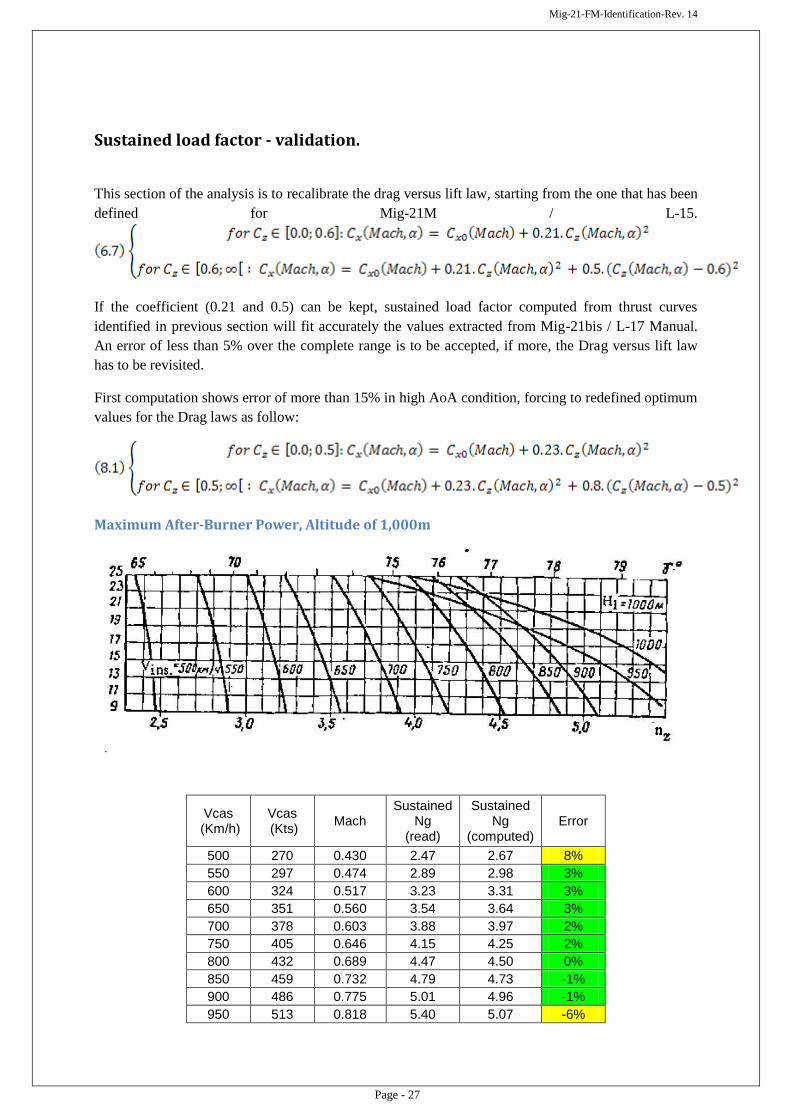
Sustained load factor - validation.
This section of the analysis is to recalibrate the drag versus lift law, starting from the one that has been
defined for Mig-21M / L-15.
If the coefficient (0.21 and 0.5) can be kept, sustained load factor computed from thrust curves
identified in previous section will fit accurately the values extracted from Mig-21bis / L-17 Manual.
An error of less than 5% over the complete range is to be accepted, if more, the Drag versus lift law
has to be revisited.
First computation shows error of more than 15% in high AoA condition, forcing to redefined optimum
values for the Drag laws as follow:
Maximum After-Burner Power, Altitude of 1,000m
Vcas (Km/h)
Vcas (Kts)
Mach Sustained
Ng (read)
Sustained Ng
(computed) Error
500 270 0.430 2.47 2.67 8%
550 297 0.474 2.89 2.98 3%
600 324 0.517 3.23 3.31 3%
650 351 0.560 3.54 3.64 3%
700 378 0.603 3.88 3.97 2%
750 405 0.646 4.15 4.25 2%
800 432 0.689 4.47 4.50 0%
850 459 0.732 4.79 4.73 -1%
900 486 0.775 5.01 4.96 -1%
950 513 0.818 5.40 5.07 -6%

Mig-21-FM-Identification-Rev. 14
Page - 28
Maximum After-Burner Power, Altitude of 3,000m
Vcas (Km/h)
Vcas (Kts)
Mach Sustained
Ng (read)
Sustained Ng
(computed) Error
500 270 0.489 2.33 2.64 13%
550 297 0.538 2.70 2.95 9%
600 324 0.587 2.97 3.25 9%
650 351 0.634 3.23 3.53 9%
700 378 0.682 3.50 3.78 8%
750 405 0.730 3.80 4.11 8%
800 432 0.778 4.12 4.52 10%
850 459 0.826 4.41 4.74 7%
900 486 0.874 4.61 4.74 3%
The error relative values are greater for 3,000m/9,843ft than for other altitude, I have no idea why. For
other altitudes (1,000m and 5,000m), thrust law deduced from level flight acceleration combined with
a unique aerodynamic model (independent from altitude) give the same range of values for relative
error.
Please note also that, even in the worst case, sustained load factor error remain less than 0.31G
Let’s try to analyze the solving of one of this configuration (Vcas=650Km/h)
We start from thrust definition by level flight acceleration at 3,000m, assuming that a Vcas of
650Km/h is equivalent to a mach number of 0.634 (ISA at 9,843ft), we will use section b) data (raw)
and the values after curve smoothing (fig.15),:
Mach number Raw Ps Raw Thrust Smoothed Ps Smoothed Thrust
0.600 309 ft/s 11,113 lbs 306 ft/s 11,114 lbs
0.634 317 ft/s 11,118 lbs
0.700 337 ft/s 11,127 lbs 334 ft/s 11,124 lbs
The smoothed thrust values are computed in solving equation (3.3) for Mach=0.634 and Ps=317 ft/s

Mig-21-FM-Identification-Rev. 14
Page - 29
(3.3)
Where:
- g = 9.81 m/s2
- Ps = 317 ft/s (96.62 m/s)
- M = 17,659 lbs (8,000 Kg)
- A(z=3,000m) = 1,078 ft/s (328.58 m/s)
- (z=3,000m) = 0.001764522 slug/ft3
- S = 247.57 sqr.ft (23 m2)
- Cz is linear vs AoA between
o Cz(M=0.6, AoA=0) = 0 and Cz (M=0.6, AoA=28) = 0.698
o Cz (M=0.7, AoA=0) = 0 and Cz (M=0.7, AoA=28) = 0.717
- Cx = (Cx0 + 0.23*Cz2) + 0.002 for Cz < 0.5
- Cx = (Cx0 + 0.23*Cz2 + 0.8*( Cz -0.5)
2) + 0.002 for Cz > 0.5
o Cx0 = 0.0200 (for Drag Index of 10)
o the 0.002 extra points being related to the Drag index of 12
At Mach=0.634, the solution is:
- AoA = 6.4 deg
- Cx = 0.02799
- Cz = 0.16094
- Thrust = 11,118 lbs
Then we will solve:
If we fix Ng=3.23, the solution is:
- AoA = 20.9 deg
- Cx = 0.086299
- Cz = 0.526081
- Thrust = 9,428 lbs
If we fix Thrust = 11,118 lbs, the solution is:
- AoA = 22.62 deg
- Cx = 0.100578723
- Cz = 0.569262599
- Ng = 3.53
So the difference of 9% in sustained load factor is equivalent to a thrust difference of 15.2%

Mig-21-FM-Identification-Rev. 14
Page - 30
Now compare this analysis with one where the difference between the value read in the manual and
the one predict by the model is very low: let’s chose 750 Km/h (IAS) at 1,000m (Mach 0.646)
The level flight acceleration curve analysis requires an Excess Specific Power of 357 ft/s giving a
thrust of 12,437 lbs.
The flight model (with the hypotheses used for our 3,000m computation) and this thrust value give:
- AoA = 20.6 deg
- Cx = 0.084714
- Cz = 0.51998
- Ng = 3.25 (+2%)
The sustained load factor is said (in manual) to be 4.15g that can be reached (with the hypotheses used
for our 3,000m computation) with:
- AoA = 20.16 deg
- Cx = 0.081746
- Cz = 0.50883
- Thrust = 11,844 lbs (-3.5%)
We can see that the flight model is valid (2%) for mach number close to 0.640 and AoA close to 21
deg at 1,000m but less accurate at 3,000m (9%)
Maximum After-Burner Power, Altitude of 5,000m
Vcas (Km/h)
Vcas (Kts)
Mach Sustained
Ng (read)
Sustained Ng
(computed) Error
500 270 0.548 2.22 2.36 6%
550 297 0.600 2.47 2.61 5%
600 324 0.651 2.73 2.85 4%
650 351 0.702 2.97 3.07 4%
700 378 0.754 3.19 3.34 5%
750 405 0.805 3.48 3.58 3%
800 432 0.856 3.72 3.74 1%
850 459 0.908 3.85 3.82 -1%
Mig-21-FM-Identification-Rev. 14
Page - 31
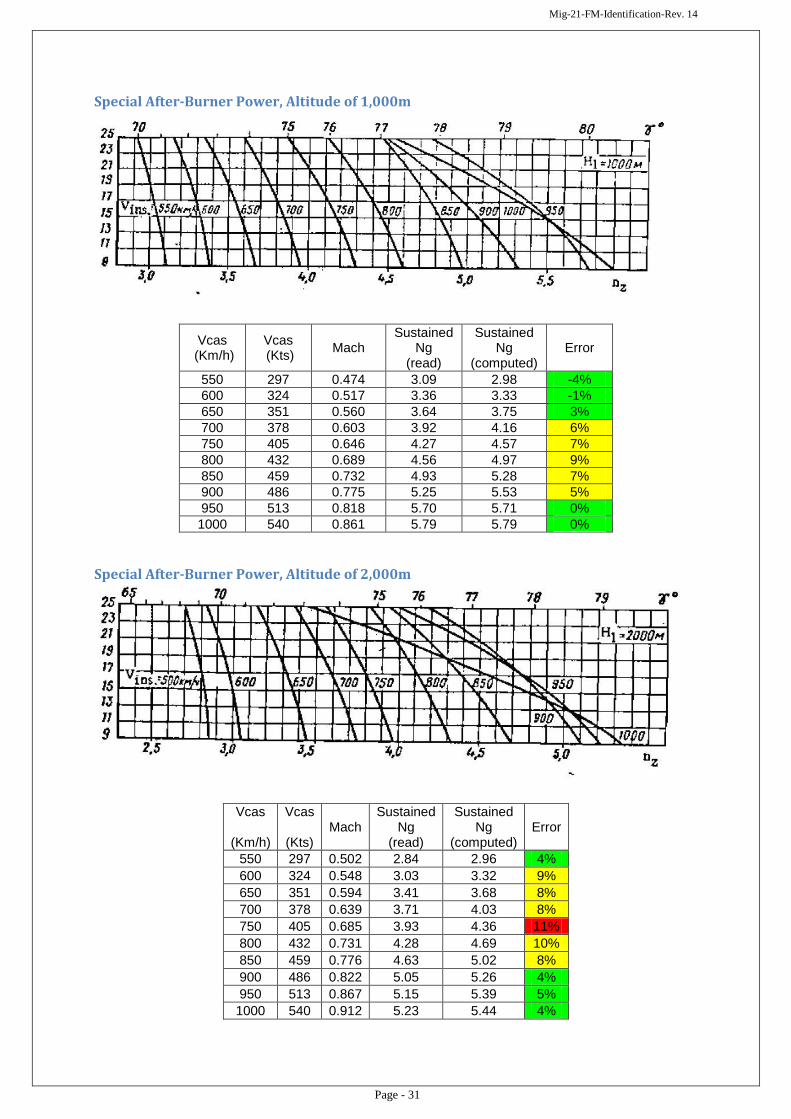
Special After-Burner Power, Altitude of 1,000m
Vcas (Km/h)
Vcas (Kts)
Mach Sustained
Ng (read)
Sustained Ng
(computed) Error
550 297 0.474 3.09 2.98 -4%
600 324 0.517 3.36 3.33 -1%
650 351 0.560 3.64 3.75 3%
700 378 0.603 3.92 4.16 6%
750 405 0.646 4.27 4.57 7%
800 432 0.689 4.56 4.97 9%
850 459 0.732 4.93 5.28 7%
900 486 0.775 5.25 5.53 5%
950 513 0.818 5.70 5.71 0%
1000 540 0.861 5.79 5.79 0%
Special After-Burner Power, Altitude of 2,000m
Vcas
(Km/h)
Vcas
(Kts) Mach
Sustained Ng
(read)
Sustained Ng
(computed) Error
550 297 0.502 2.84 2.96 4%
600 324 0.548 3.03 3.32 9%
650 351 0.594 3.41 3.68 8%
700 378 0.639 3.71 4.03 8%
750 405 0.685 3.93 4.36 11%
800 432 0.731 4.28 4.69 10%
850 459 0.776 4.63 5.02 8%
900 486 0.822 5.05 5.26 4%
950 513 0.867 5.15 5.39 5%
1000 540 0.912 5.23 5.44 4%
Mig-21-FM-Identification-Rev. 14
Page - 32
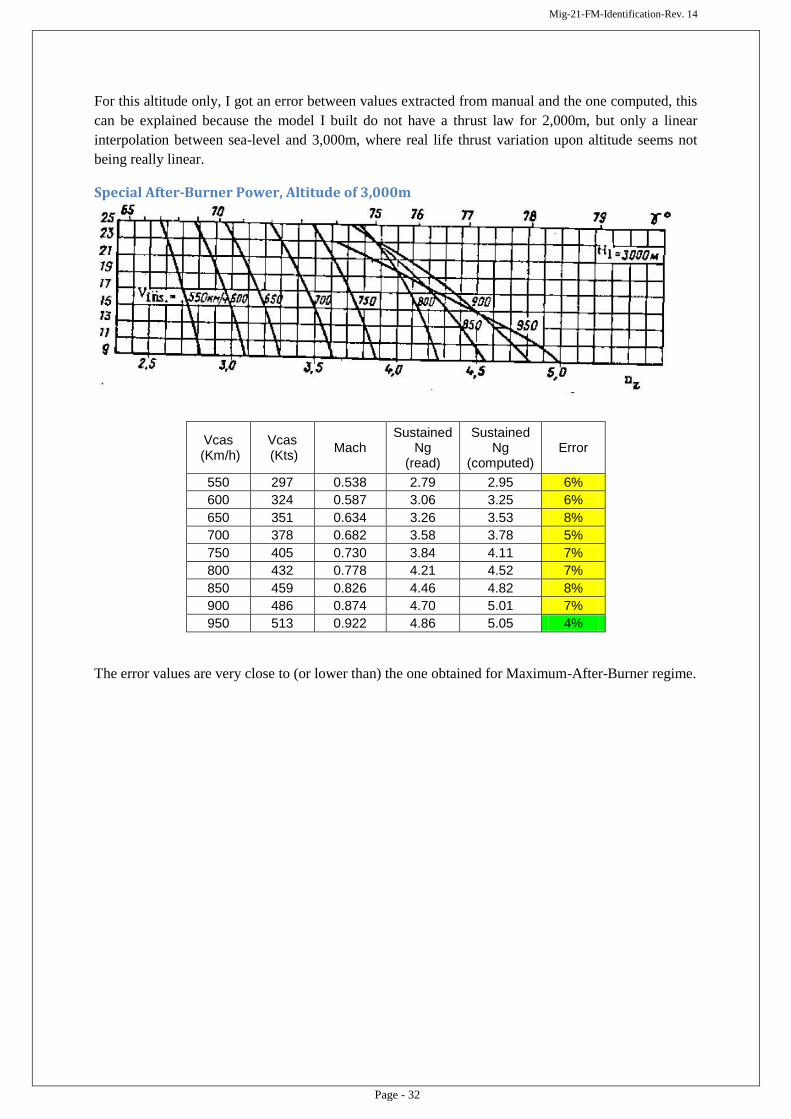
For this altitude only, I got an error between values extracted from manual and the one computed, this
can be explained because the model I built do not have a thrust law for 2,000m, but only a linear
interpolation between sea-level and 3,000m, where real life thrust variation upon altitude seems not
being really linear.
Special After-Burner Power, Altitude of 3,000m
Vcas (Km/h)
Vcas (Kts)
Mach Sustained
Ng (read)
Sustained Ng
(computed) Error
550 297 0.538 2.79 2.95 6%
600 324 0.587 3.06 3.25 6%
650 351 0.634 3.26 3.53 8%
700 378 0.682 3.58 3.78 5%
750 405 0.730 3.84 4.11 7%
800 432 0.778 4.21 4.52 7%
850 459 0.826 4.46 4.82 8%
900 486 0.874 4.70 5.01 7%
950 513 0.922 4.86 5.05 4%
The error values are very close to (or lower than) the one obtained for Maximum-After-Burner regime.
Mig-21-FM-Identification-Rev. 14
Page - 33
3. Mig-21 MF / iz.96F The flight model of the Mig-21MF is built
from the one of the Mig-21M and Mig-21bis
due to the fact that very few performance data
are available for this particular type (also
identified as L-16).
The basic hypotheses are the following:
- Same aerodynamics as Mig-21M/iz.96A :
CL(Mach ,AoA) and CD(Mach, AoA)
curves
- Empty weight is said (source is an ex
Mig-21 Cuban pilot, Cuban Air Force
operating both Mig-21MF and bis) 220-
240 Kg lighter than the Mig-21bis. If we
take 6,003 Kg as empty weight for Mig-
21bis/iz.75A, this give a Mig-
21MF/iz.96F empty weight between
5,763 and 5,783Kg, knowing that Mig-
21M/iz.96A empty weight is 5,760Kg, we
can consider that Mig-21MF/iz.96F
empty weight is the same.
- Engine changed to Tumanskiy R-13-300
(in between R-11F2SK-300 and R-25-
300)
o Military Thrust from set to 39.90kN
(between 38.14kN and 40.20kN)
o Full After-Burner thrust set to
63.70kN (between 60.05kN and
69.65 kN)
General data.
Empty weight (including pilot, no pylon, no
gun ammo) : 12,715 lbs / 5,760 kg
Reference Area : 247.57 sq.ft / 23.0 m2
Internal fuel : 2,600 l @ 0.83kg/l
: 2,158 Kg / 4,763 lbs
Speed limitations:
Speed limited to (first reached)
- 1,300 km/h (702 Kts) IAS
- Mach 2.1
Load factor limitations:
Load Factor (Ng) limitation depend on
external loads, Mach number and internal fuel
weight.
They are assumed to be the same for Mig-
21M/iz.96A and Mig-21MF/iz.96F. (refer to
appendix)
Mach number < 0.8
- Clean or 2 R-3S
o Fuel < 1,200 l : 8.5g
o Fuel < 1,600 l : 8g
o Fuel > 1,600 l : 7g
- 4 R-3S : 7g
- External tank(s) : 5g
- Rocket pods : 5g
- Bombs : 4g
Mach number > 0.8
- Clean or 2 R-3S
o Fuel < 1,200 l : 7g
o Fuel > 1,200 l : 6g
- 4 R-3S : 6g
- External tank(s) : 5g
- Rocket pods : 5g
- Bombs : 4g
Configuration definition.
Combat configuration “A”
Aircraft loaded with 50% of usable internal
fuel, Center Line pylon (but no CL Tank), 2 R-
3S missiles with their pylon and launching
rails under external wing stations.
- Aircraft (zero usable fuel) : 5,760 kg
- 200 gun ammo (Gsh 23) : 75 kg
- 1 Center line pylon : 24 kg
- 2 Under-wing pylon : 45 kg
- Equipped zero usable fuel : 5,904 kg
- 50% usable internal fuel : 1,005 kg
(2,219 lbs @0.83 g/cm3)
- Clean Combat Weight : 6,909 kg
- 2 APU-3S rails for R-3S : 41 kg
- 2 Missile R-3S : 150 kg
- Conf. “A” Combat weight : 7,100 kg
This defines a gross weight of 7,100 kg
(15,673 lbs) and a Drag Index of 12.
Mig-21-FM-Identification-Rev. 14
Page - 34
Total fuel volume approximated to 1,300l
Load factor limitation set to :
- 8.0 (mach < 0.8)
- 6.0 (mach > 0.8)
Combat configuration “B”:
Aircraft loaded with 50% of internal fuel,
Center Line pylon (but no CL Tank), 4 R-3S
missiles with their pylon and launching rails
under wing (internal and external).
- Aircraft (zero usable fuel) : 5,760 kg
- 200 gun ammo (Gsh 23) : 75 kg
- 1 Center line pylon : 24 kg
- 2 Under-wing pylon : 45 kg
- Equipped zero usable fuel : 5,904 kg
- 50% usable internal fuel : 1,005 kg
(2,219 lbs @0.83 g/cm3)
- Clean Combat Weight : 6,909 kg
- 2 additional wing pylons : 45 kg
- 4 APU-3S rails for R-3S : 82 kg
- 4 Missile R-3S : 300 kg
- Conf. “B” Combat weight :7,336 kg
This defines a gross weight of 16,194 lbs /
7,336 kg and a Drag Index of 13.
Total fuel volume approximated to 1,300l
Load factor limitation set to :
- 7.0 (mach < 0.8)
- 6.0 (mach > 0.8)
Thrust Law validation.
Concerning the Military Thrust table, the values have been set using a proportional law:
As there is no available data to validate this information, I decide to keep it as it is.
The only available performance data available at the moment for Mig-21MF are 2 diagrams describing
sustained load factor and instantaneous climb rate (extra specific power) at 500m along air speed (but
the gross weight is unknown)
I shall use these figures to calibrate Thrust curve in using a constant factor (k) defined by:
It is clear that if the k factor is far away from 1.00, we would have to find an explanation.
Validation by Sustained load factor fitting:
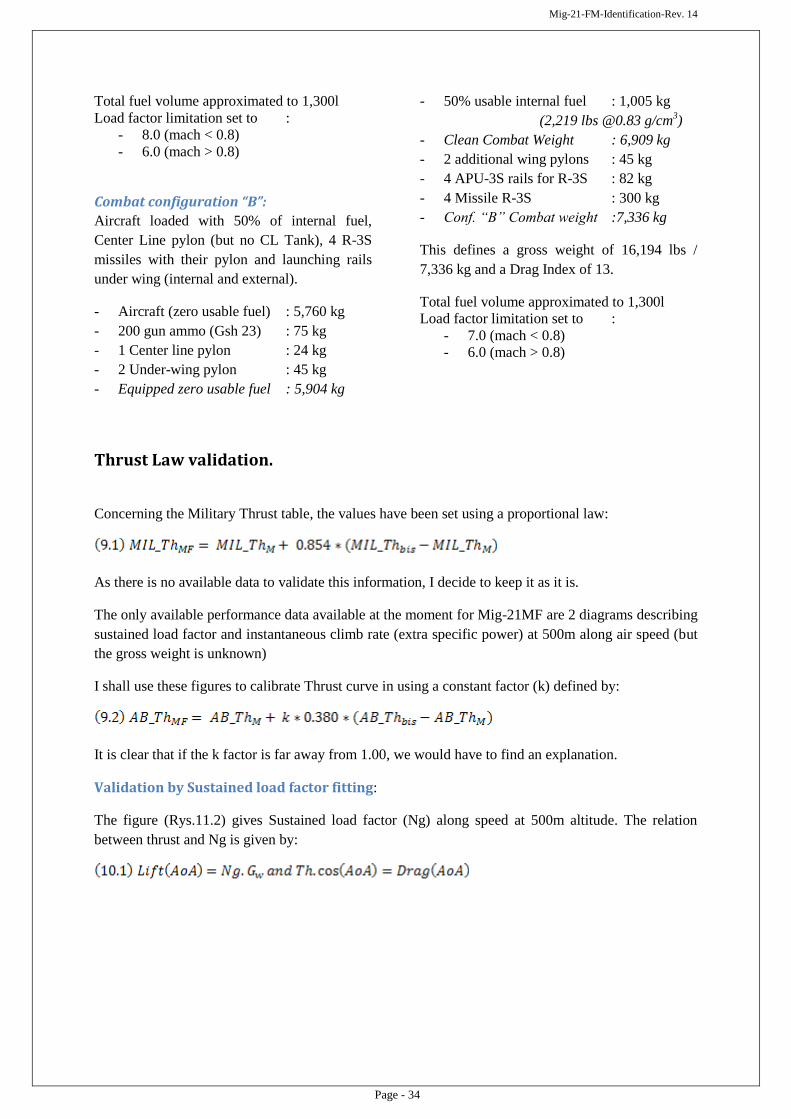
The figure (Rys.11.2) gives Sustained load factor (Ng) along speed at 500m altitude. The relation
between thrust and Ng is given by:
Mig-21-FM-Identification-Rev. 14
Page - 35
The values read from the figure are the following:
If I do assume this figure is related to a clean configuration (nor payload nor pylon, giving a Drag
Index of 7) with a gross weight of 6,500 kg (14,350 lbs, with around 60% of internal fuel) with
Standard atmosphere (ISA) I can compare computed performance to those extracted from figure. Here
are the results with a k factor set to 1.00:
Mach Ng
(figure)
Ng
(computed)
Difference
(%)
Turn Rate
(figure)
Turn Rate
(Computed)
Difference
(deg/s)
0.50 3.91 3.94 1% 12.56 12.66 0.10
0.60 4.67 4.87 4% 12.63 13.20 0.57
0.70 5.37 5.58 4% 12.52 13.03 0.51
0.80 6.14 6.11 0% 12.58 12.52 -0.06
0.90 6.23 5.76 -8% 11.35 10.47 -0.88
1.00 4.92 3.74 -24% 8.00 5.99 -2.02
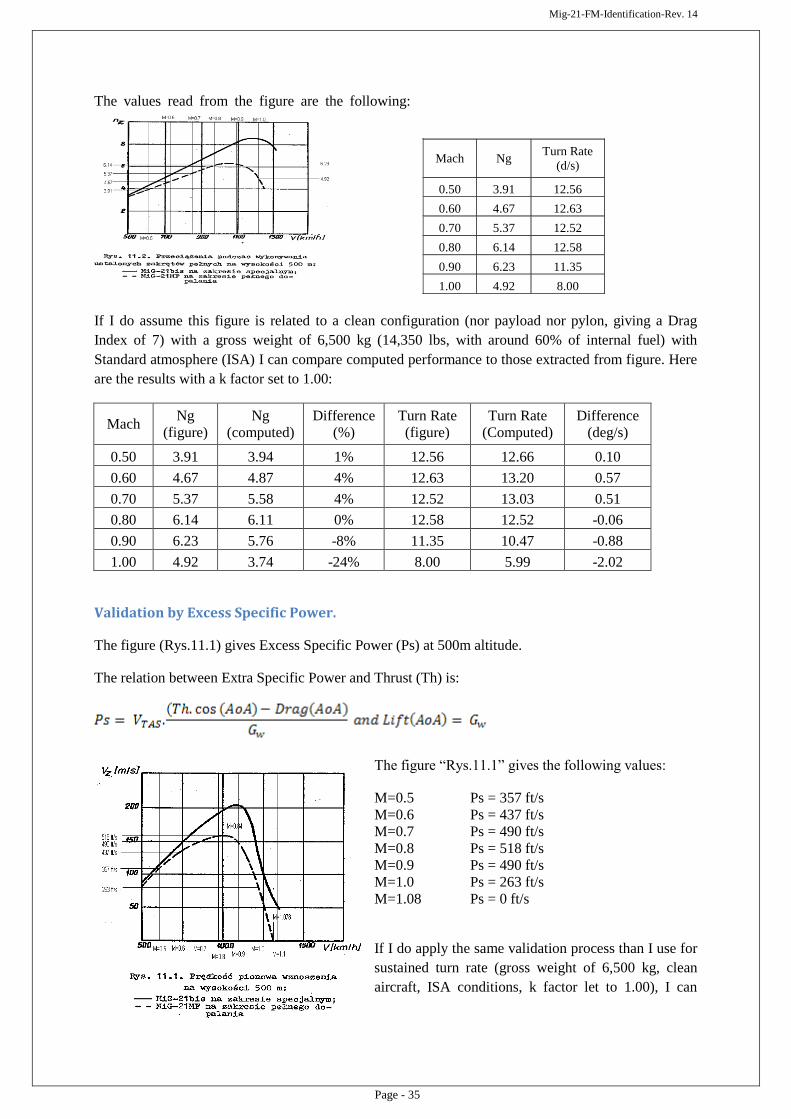
Validation by Excess Specific Power.
The figure (Rys.11.1) gives Excess Specific Power (Ps) at 500m altitude.
The relation between Extra Specific Power and Thrust (Th) is:
The figure “Rys.11.1” gives the following values:
M=0.5 Ps = 357 ft/s
M=0.6 Ps = 437 ft/s
M=0.7 Ps = 490 ft/s
M=0.8 Ps = 518 ft/s
M=0.9 Ps = 490 ft/s
M=1.0 Ps = 263 ft/s
M=1.08 Ps = 0 ft/s
If I do apply the same validation process than I use for
sustained turn rate (gross weight of 6,500 kg, clean
aircraft, ISA conditions, k factor let to 1.00), I can
Mach Ng Turn Rate
(d/s)
0.50 3.91 12.56
0.60 4.67 12.63
0.70 5.37 12.52
0.80 6.14 12.58
0.90 6.23 11.35
1.00 4.92 8.00

Mig-21-FM-Identification-Rev. 14
Page - 36
produce the following comparison table:
Mach Ps ft/s
(figure)
Ps ft/s
(computed)
Difference
(%)
0.50 357 311 -13%
0.60 437 380 -13%
0.70 490 433 -12%
0.80 518 458 -12%
0.90 490 362 -26%
1.00 263 132 -50%
The difference of 12-13% measured from M0.5 to M0.8 is not possible to explain for me without
imagining an aerodynamic behavior really far away the one of Mig-21M or Mig-21bis, so I can only
have doubt about the accuracy of the figure Rys.11.1
Mig-21-FM-Identification-Rev. 14
Page - 37
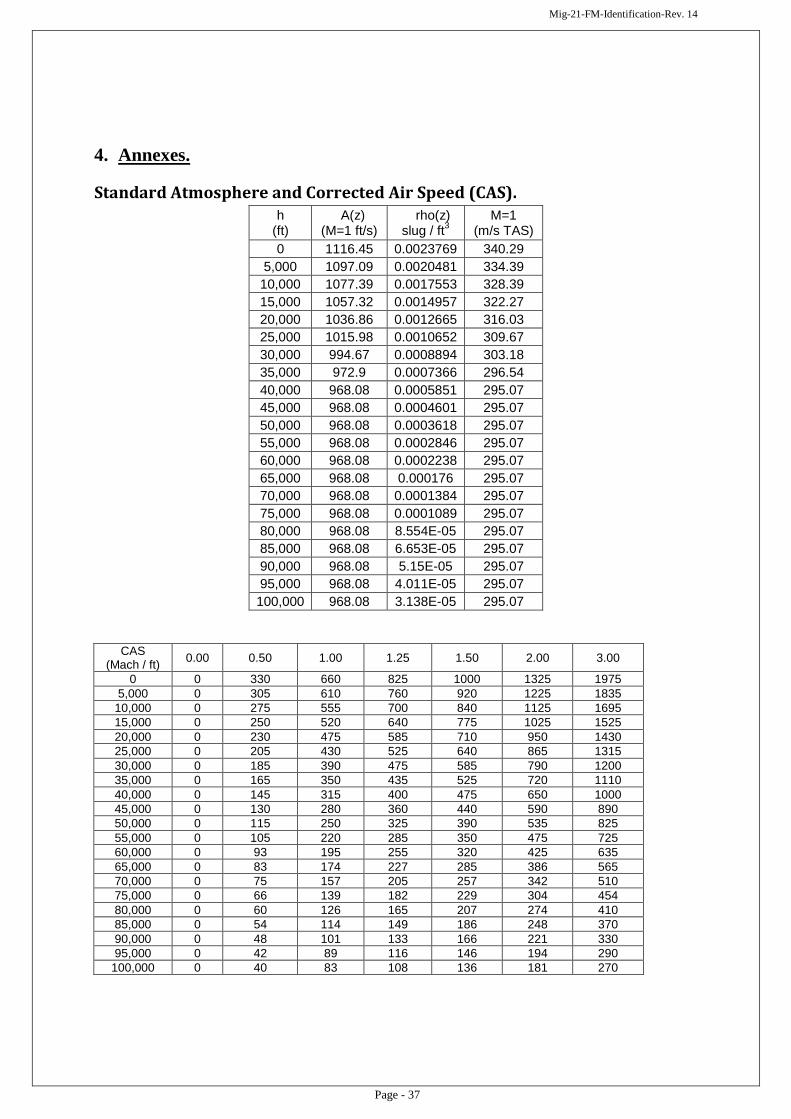
4. Annexes.
Standard Atmosphere and Corrected Air Speed (CAS). h
(ft) A(z)
(M=1 ft/s) rho(z) slug / ft
3
M=1 (m/s TAS)
0 1116.45 0.0023769 340.29
5,000 1097.09 0.0020481 334.39
10,000 1077.39 0.0017553 328.39
15,000 1057.32 0.0014957 322.27
20,000 1036.86 0.0012665 316.03
25,000 1015.98 0.0010652 309.67
30,000 994.67 0.0008894 303.18
35,000 972.9 0.0007366 296.54
40,000 968.08 0.0005851 295.07
45,000 968.08 0.0004601 295.07
50,000 968.08 0.0003618 295.07
55,000 968.08 0.0002846 295.07
60,000 968.08 0.0002238 295.07
65,000 968.08 0.000176 295.07
70,000 968.08 0.0001384 295.07
75,000 968.08 0.0001089 295.07
80,000 968.08 8.554E-05 295.07
85,000 968.08 6.653E-05 295.07
90,000 968.08 5.15E-05 295.07
95,000 968.08 4.011E-05 295.07
100,000 968.08 3.138E-05 295.07
CAS (Mach / ft)
0.00 0.50 1.00 1.25 1.50 2.00 3.00
0 0 330 660 825 1000 1325 1975
5,000 0 305 610 760 920 1225 1835
10,000 0 275 555 700 840 1125 1695
15,000 0 250 520 640 775 1025 1525
20,000 0 230 475 585 710 950 1430
25,000 0 205 430 525 640 865 1315
30,000 0 185 390 475 585 790 1200
35,000 0 165 350 435 525 720 1110
40,000 0 145 315 400 475 650 1000
45,000 0 130 280 360 440 590 890
50,000 0 115 250 325 390 535 825
55,000 0 105 220 285 350 475 725
60,000 0 93 195 255 320 425 635
65,000 0 83 174 227 285 386 565
70,000 0 75 157 205 257 342 510
75,000 0 66 139 182 229 304 454
80,000 0 60 126 165 207 274 410
85,000 0 54 114 149 186 248 370
90,000 0 48 101 133 166 221 330
95,000 0 42 89 116 146 194 290
100,000 0 40 83 108 136 181 270
Mig-21-FM-Identification-Rev. 14
Page - 38
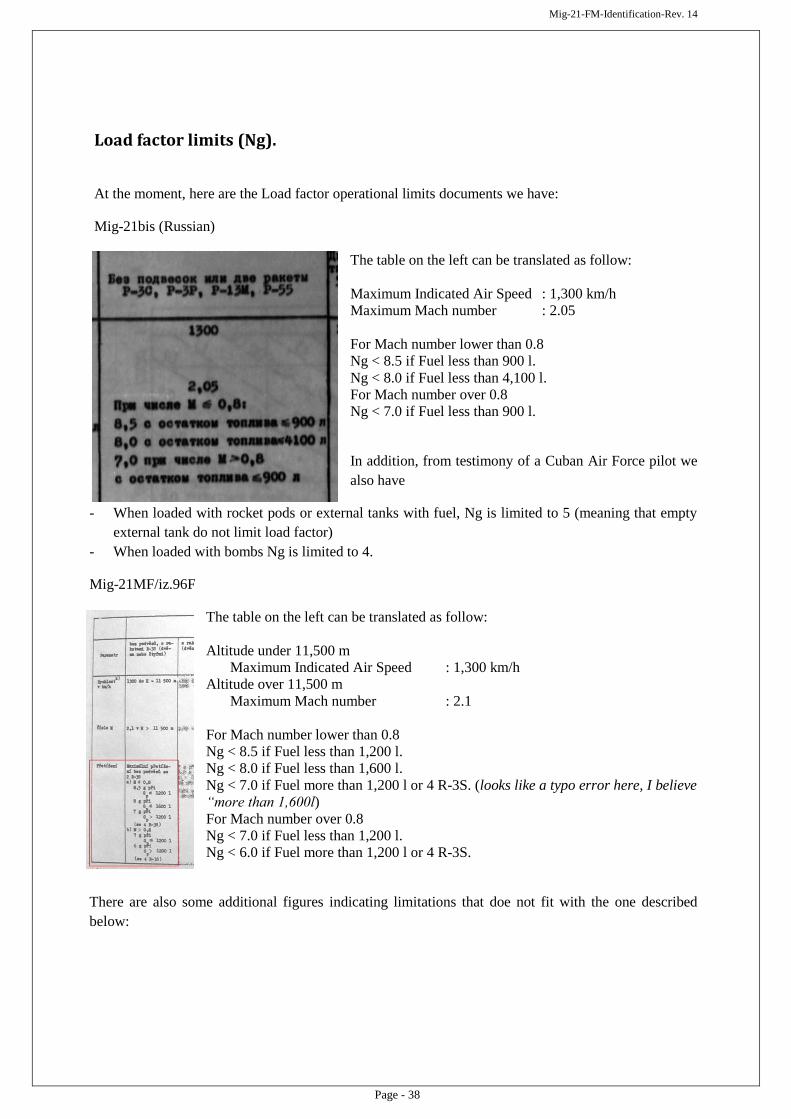
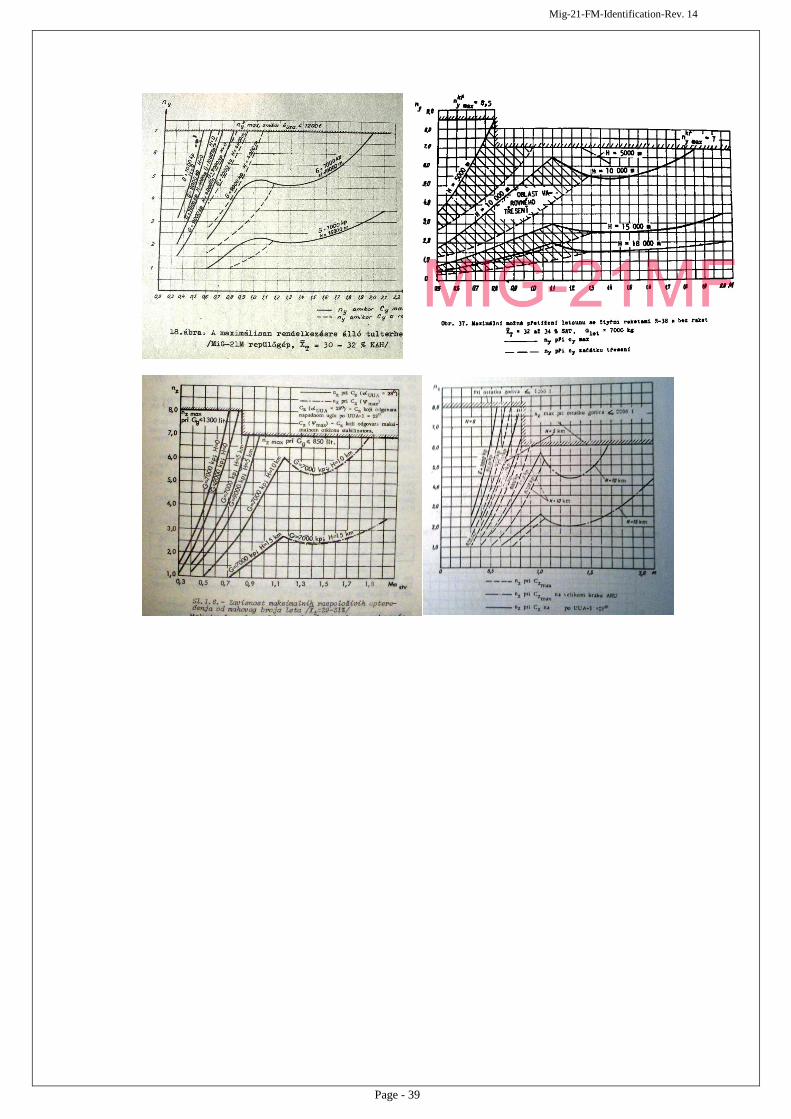
Load factor limits (Ng).
At the moment, here are the Load factor operational limits documents we have:
Mig-21bis (Russian)
The table on the left can be translated as follow:
Maximum Indicated Air Speed : 1,300 km/h
Maximum Mach number : 2.05
For Mach number lower than 0.8
Ng < 8.5 if Fuel less than 900 l.
Ng < 8.0 if Fuel less than 4,100 l.
For Mach number over 0.8
Ng < 7.0 if Fuel less than 900 l.
In addition, from testimony of a Cuban Air Force pilot we
also have
- When loaded with rocket pods or external tanks with fuel, Ng is limited to 5 (meaning that empty
external tank do not limit load factor)
- When loaded with bombs Ng is limited to 4.
Mig-21MF/iz.96F
The table on the left can be translated as follow:
Altitude under 11,500 m
Maximum Indicated Air Speed : 1,300 km/h
Altitude over 11,500 m
Maximum Mach number : 2.1
For Mach number lower than 0.8
Ng < 8.5 if Fuel less than 1,200 l.
Ng < 8.0 if Fuel less than 1,600 l.
Ng < 7.0 if Fuel more than 1,200 l or 4 R-3S. (looks like a typo error here, I believe
“more than 1,600l)
For Mach number over 0.8
Ng < 7.0 if Fuel less than 1,200 l.
Ng < 6.0 if Fuel more than 1,200 l or 4 R-3S.
There are also some additional figures indicating limitations that doe not fit with the one described
below:
Mig-21-FM-Identification-Rev. 14
Page - 39
Mig-21-FM-Identification-Rev. 14
Page - 40
5. Change Log.
Revision 14:
- Correction of load factor limitations for all versions.
- Correction of Mig-21MF Empty weight according Cuban pilot testimony.
- Weight refining for MIG-21M (-7kg), MIG-21Bis (-40kg)
- Load factor limits description changed, and addition of limits with 4 AA (R-3S or R-60)
missiles loaded
- Introduction of the “B” configurations for the 3 versions, all with 4 AA missiles.
Revision 13:
- Page 12: mention of the swimming flaps device and its impact on lift.
- Page 29: addition of the analysis of the difference between forecast and measured value for
MIG-21bis maximum sustained load factor at maximum after burner regime at 3,000m