Flex IR Presentation Feb 2016
66
Sketch to Scale Solutions Investor Presentation February 2016
-
Upload
flex-investor-relations -
Category
Investor Relations
-
view
7.228 -
download
1
Transcript of Flex IR Presentation Feb 2016

Sketch to Scale Solutions
Investor Presentation
February 2016
1
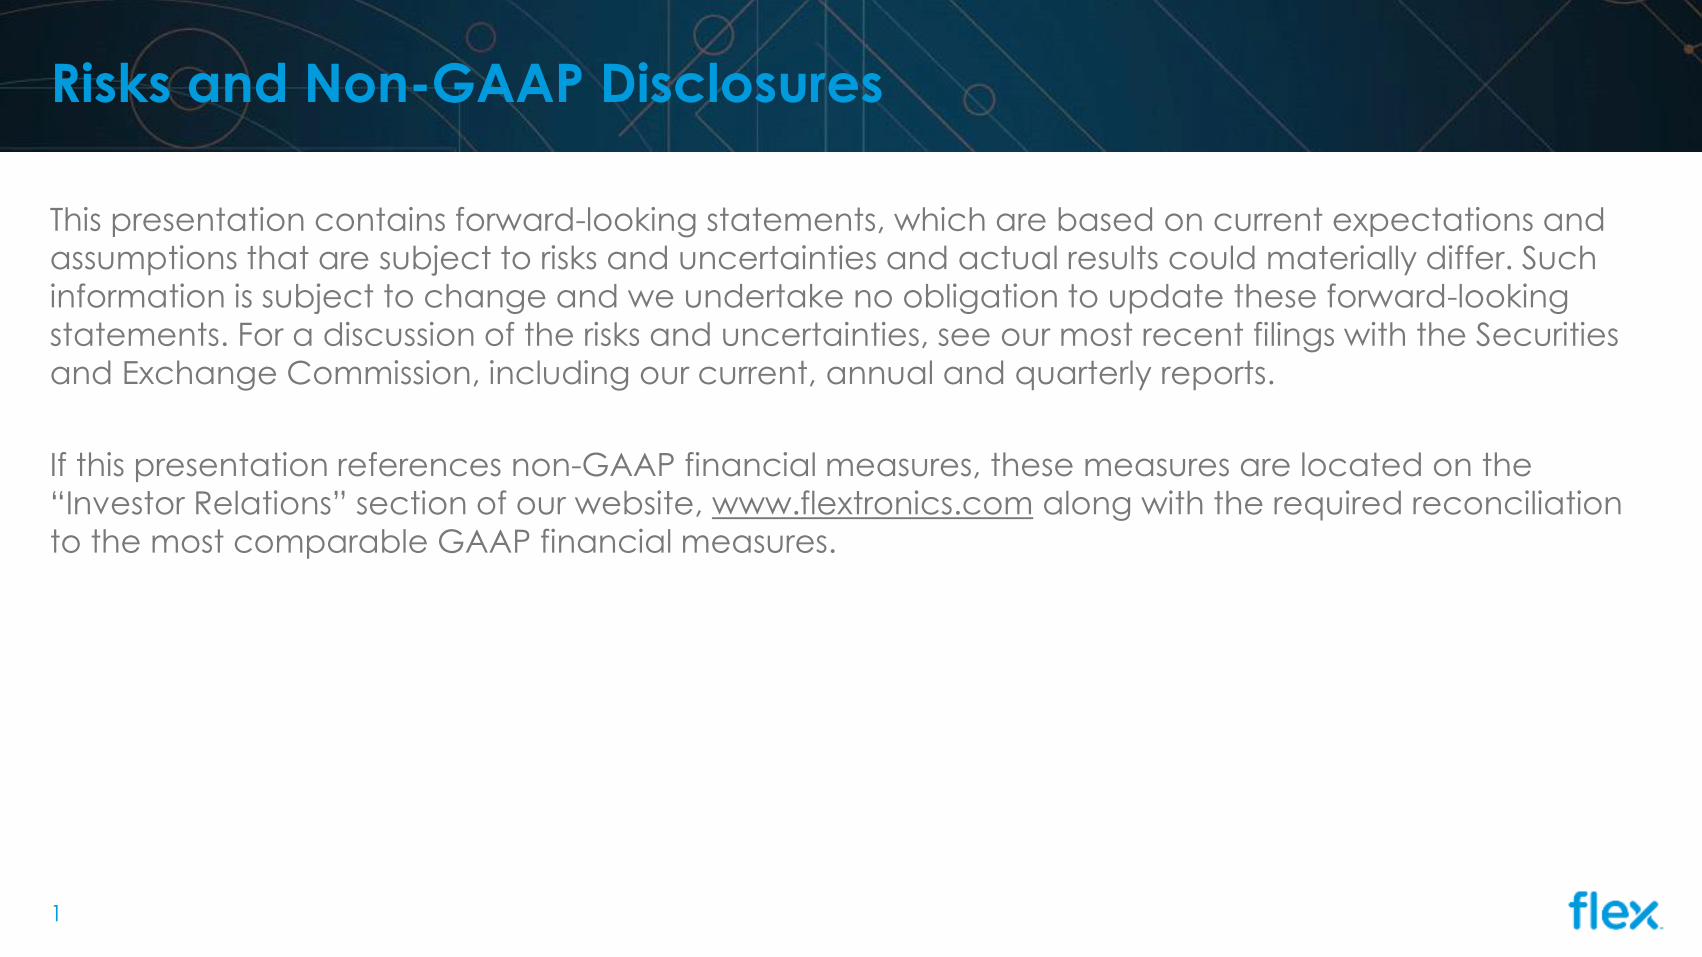
Risks and Non-GAAP Disclosures
This presentation contains forward-looking statements, which are based on current expectations and
assumptions that are subject to risks and uncertainties and actual results could materially differ. Such
information is subject to change and we undertake no obligation to update these forward-looking
statements. For a discussion of the risks and uncertainties, see our most recent filings with the Securities
and Exchange Commission, including our current, annual and quarterly reports.
If this presentation references non-GAAP financial measures, these measures are located on the
“Investor Relations” section of our website, www.flextronics.com along with the required reconciliation
to the most comparable GAAP financial measures.

2
Table of Contents
Richer Business MixStrategically Positioned
To WinWhy Flex? Flex: Ready for the Future
Strategic M&A / Financial
Update
Why Invest in Flex?
Continually Evolving Our
Portfolio
Growing Our Operating
Income & Margin
Expansion
Continued Discipline in
Execution
Fundamentally Structured
for Value Creation & Free
Cash Flow Generation
4
5
6
7
8-11
The World is Changing...
Flex is Ready
Our Powerful Solution for
Engagement & Higher
Margin
Global Scale and Reach
Our Evolving Value
Proposition Forms an
Expanding TAM
An Ecosystem For The
Intelligence Age
Elementum
12-13
14
15
16
17
18
Increasing our Visibility
into Strategies &
Innovations
Strategic Scope:
Purposefully Positioned
Worldwide
Strong Strategic
Relationships &
Revolutionary
Partnerships
Innovation from Sketch-
to-Scale
Ready for Mega Trends
In Every Business Group
20
21
22-23
24-28
29-35
Structured to Deliver
Earnings Growth
Consumer Technology
Group (CTG)
Integrated Network
Solutions (INS)
Industrial & Emerging
Industries (IEI)
High Reliability Solutions
(HRS)
37
38-41
42-45
46-49
50-53
Selective M&A
Transactions
NEXTracker
MCi
Wink
Farm Design
Latest Financial Update
IR Contact Info
55
56
57
58
59
60-64
65

Why Flex?
3

4
Why Invest in Flex?
Evolving our portfolio to provide more predictable earnings and higher margin
Committed to 5-10% annual net income growth
Strong sustainable free cash flow
Committed to return over 50% of free cash flow
1
2
3
4
19%
5
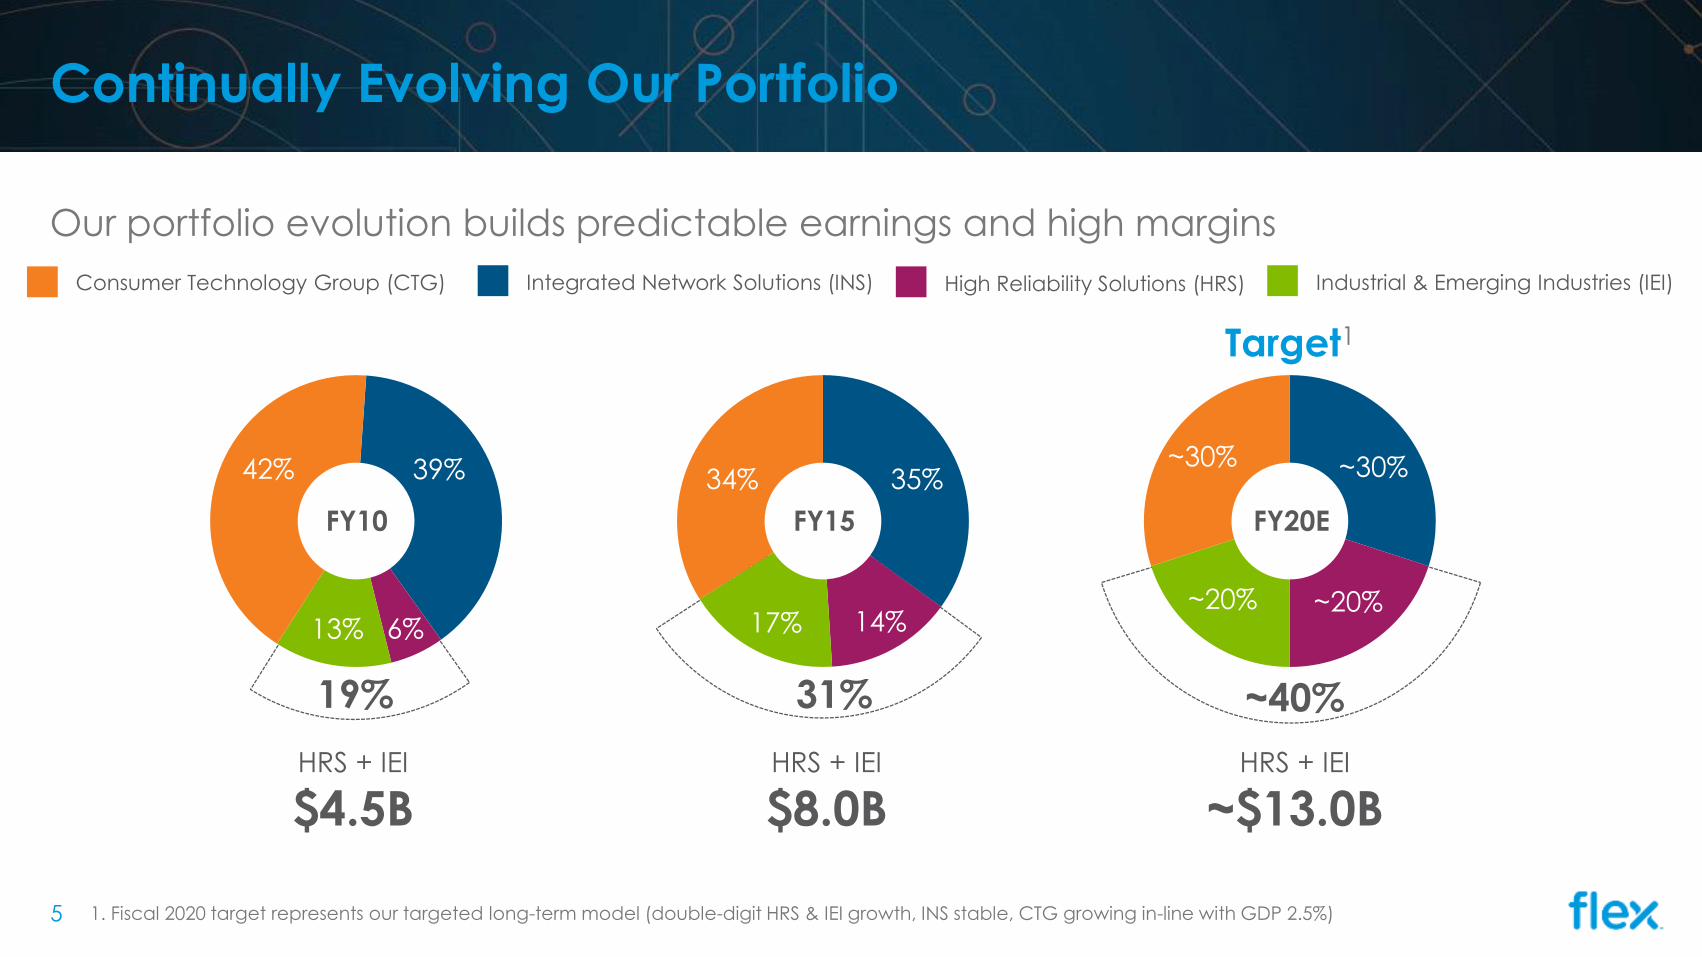
Continually Evolving Our Portfolio
Our portfolio evolution builds predictable earnings and high margins
1. Fiscal 2020 target represents our targeted long-term model (double-digit HRS & IEI growth, INS stable, CTG growing in-line with GDP 2.5%)
Target1
FY20E
~20% ~20%
~30% ~30%
~40%
FY10
6%13%
42% 39%
FY15
17% 14%
34% 35%
31%
HRS + IEI
$8.0BHRS + IEI
$4.5BHRS + IEI
~$13.0B
Consumer Technology Group (CTG) Integrated Network Solutions (INS) High Reliability Solutions (HRS) Industrial & Emerging Industries (IEI)
6
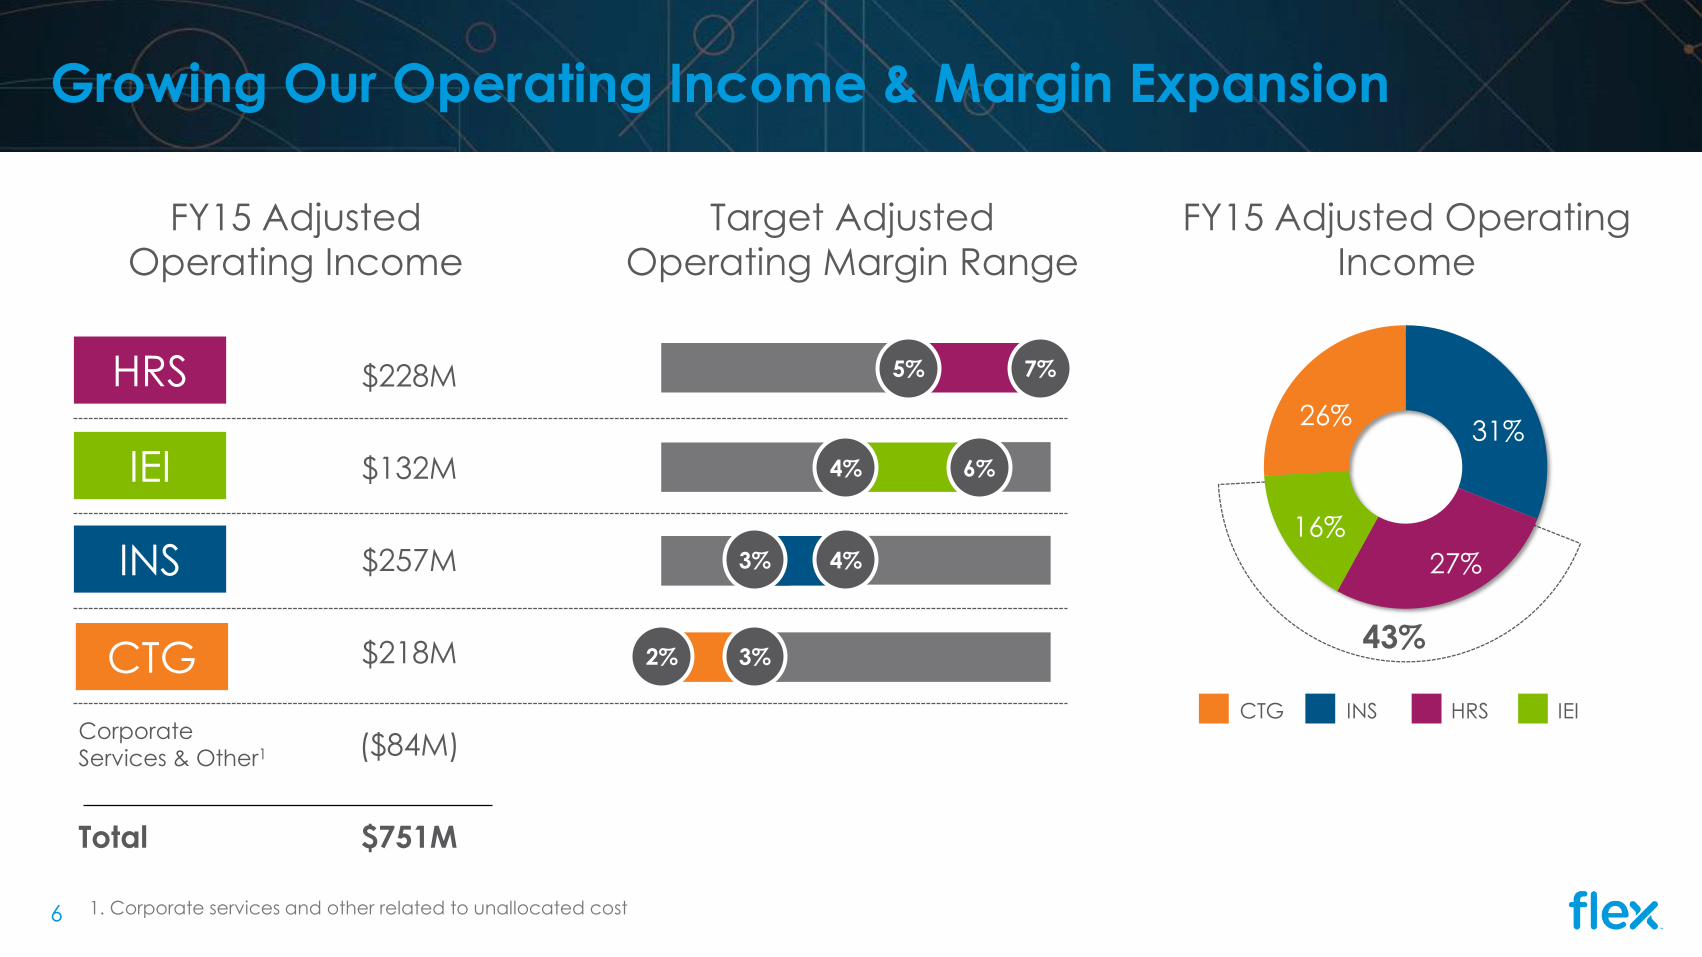
FY15 Adjusted
Operating Income
Growing Our Operating Income & Margin Expansion
Target Adjusted
Operating Margin Range
FY15 Adjusted Operating
Income
$228M
$132M
$257M
$218M
Corporate Services & Other1 ($84M)
Total $751M
HRS
IEI
CTG
INS
2% 3%
4%
5%
6%
7%
4%3%
16%
27%
26%31%
CTG INS HRS IEI
43%
1. Corporate services and other related to unallocated cost

7
Continued Discipline in Execution
~$24~$26 ~$26
~$19
FY13 FY14 FY15 FY16 YTD
+11%
$611 $665$751
$591
FY13 FY14 FY15 FY16 YTD
$0.84 $0.89 $1.08
$0.85
FY13 FY14 FY15 FY16 YTD
19%22% 24% 22%
FY13 FY14 FY15 Q3 FY16
Revenue($ in Billions)
Adj. Operating Income($ in Millions)
+23%
+29%
Adj. EPS(per share)
Return on Invested Capital1
(ROIC%)
1. Return on Invested Capital (ROIC) is calculated by dividing the Company's last twelve months after-tax Non-GAAP operating income by the net invested capital asset base as of each date. After-tax non-GAAP
operating income excludes charges for stock-based compensation expense and restructuring charges. The net invested capital asset base is defined as the sum of shareholders' equity and net debt averaged over
the last five quarters.

8
Structured to Generate Strong Sustainable Free Cash Flow
$715M
$855M
$622M
$463M$416M
$680M $701M
$554M $526M
FY08 FY09 FY10 FY11 FY12 FY13 FY14 FY15 FY16 YTD FY17E
5 Year Result
$3 Billion
5 Year Target
$3 - $4 Billion

$400M
$510M
$322M
$475M$416M
$332M
813757
684639
591 563 551
FY10 FY11 FY12 FY13 FY14 FY15 FY16 YTD
Repurchased ($ millions)
Shares Outstanding
65Mshares
82Mshares
52Mshares
60Mshares
39Mshares
29Mshares
9
Unwavering Shareholder Return Commitment
Share Repurchase since FY11
($ Millions)
Free Cash Flow Returned to
Shareholders (%)
Over $2.4 Billion in stock
Over 300 Million shares
Over 30% of net shares outstanding
75%
63%
75%1-YrFY15
3-YrFY13-15
5-YrFY11-15
Committed to returning over 50% of
annual free cash flow returned to
shareholders

10
Guided By Our Return On Invested Capital
Return on Invested Capital1(ROIC %)
19%
22%
24%
FY13 FY14 FY15
24.1% 23.7%22.9% 22.7% 22.4%
Q3FY15 Q4FY15 Q1FY16 Q2FY16 Q3FY16
AnnualQuarterly
• Improving earnings
efficiency
• Disciplined capital
deployment
• Internal target
threshold stands at
20%
• ROIC well above
WACC
1. Return on Invested Capital (ROIC) is calculated by dividing the Company's last twelve months after-tax Non-GAAP operating income by the net invested capital asset base as of each date. After-tax non-GAAP
operating income excludes charges for stock-based compensation expense and restructuring charges. The net invested capital asset base is defined as the sum of shareholders' equity and net debt averaged over
the last five quarters.

11
Balanced Capital Structure
Debt Maturities ($ millions)
(Calendar Year)
• Solid liquidity
• No near-term maturities
• Low cost of debt ~3.5%
• Strong credit metrics (Debt / EBITDA (LTM) : 2.3x)
$585$555 $500 $500
$600
2016 2017 2018 2019 2020 2021 2022 2023 2024 2025
~$3.1BTotal Liquidity
$1.5BRevolver
$1.6B Cash
4.625% Notes
5% Notes
Term Loans LIBOR + 125 & 137.5 bps
Capital Structure as of Q3 FY2016 earnings announcement 1/28/2016
4.75% Notes
$54
EURIBOR + 100 bps

The World is Changing… Flex is Ready
12

Big Trends Are Affecting Our World
Increased
RegionalizationGrowth of
Asian OEMs
Faster Product
Cycles
More Disruptive
ProductsNew Hardware
OEMsGlobal
Citizenship
Intelligence of
Things
Supply Chain
Complexity
Innovation
on the Rise13

14
Our Powerful Solution for Engagement & Higher Margins
Our Platform is built on real-time information, around a broad scope of services and across a
physical infrastructure that is absolutely top-notch.
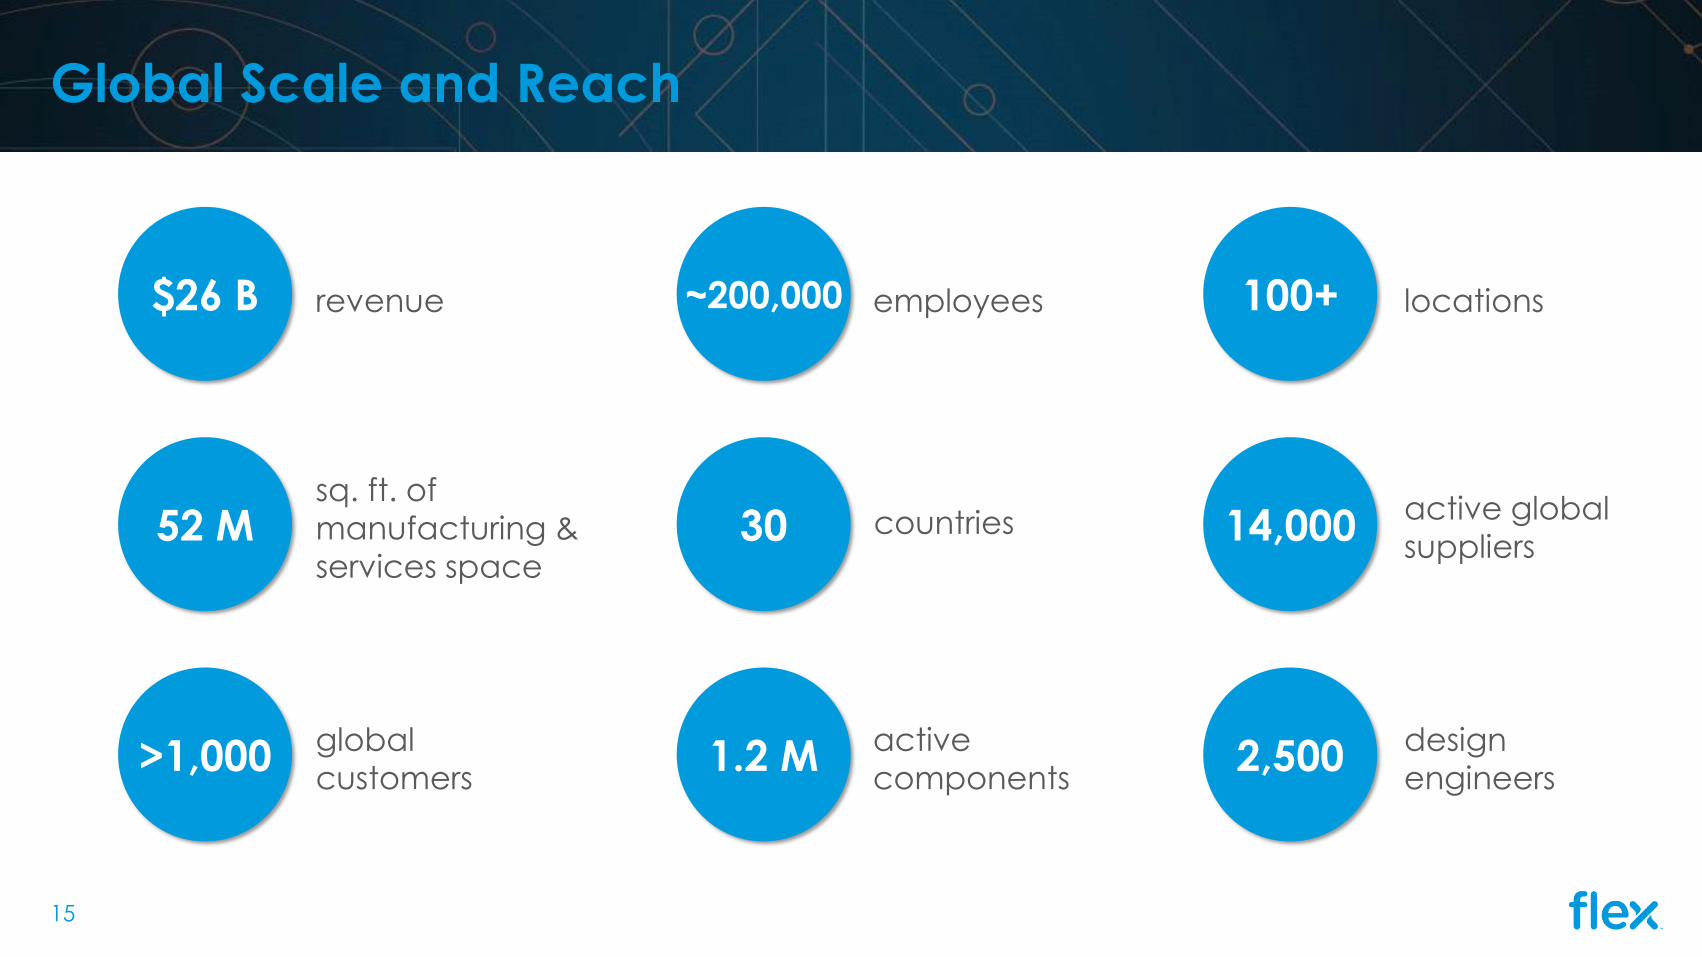
Global Scale and Reach
revenue$26 B
sq. ft. of
manufacturing &
services space52 M
global
customers>1,000
employees~200,000
countries30
active
components1.2 M
locations 100+
active global
suppliers14,000
design
engineers2,500
15
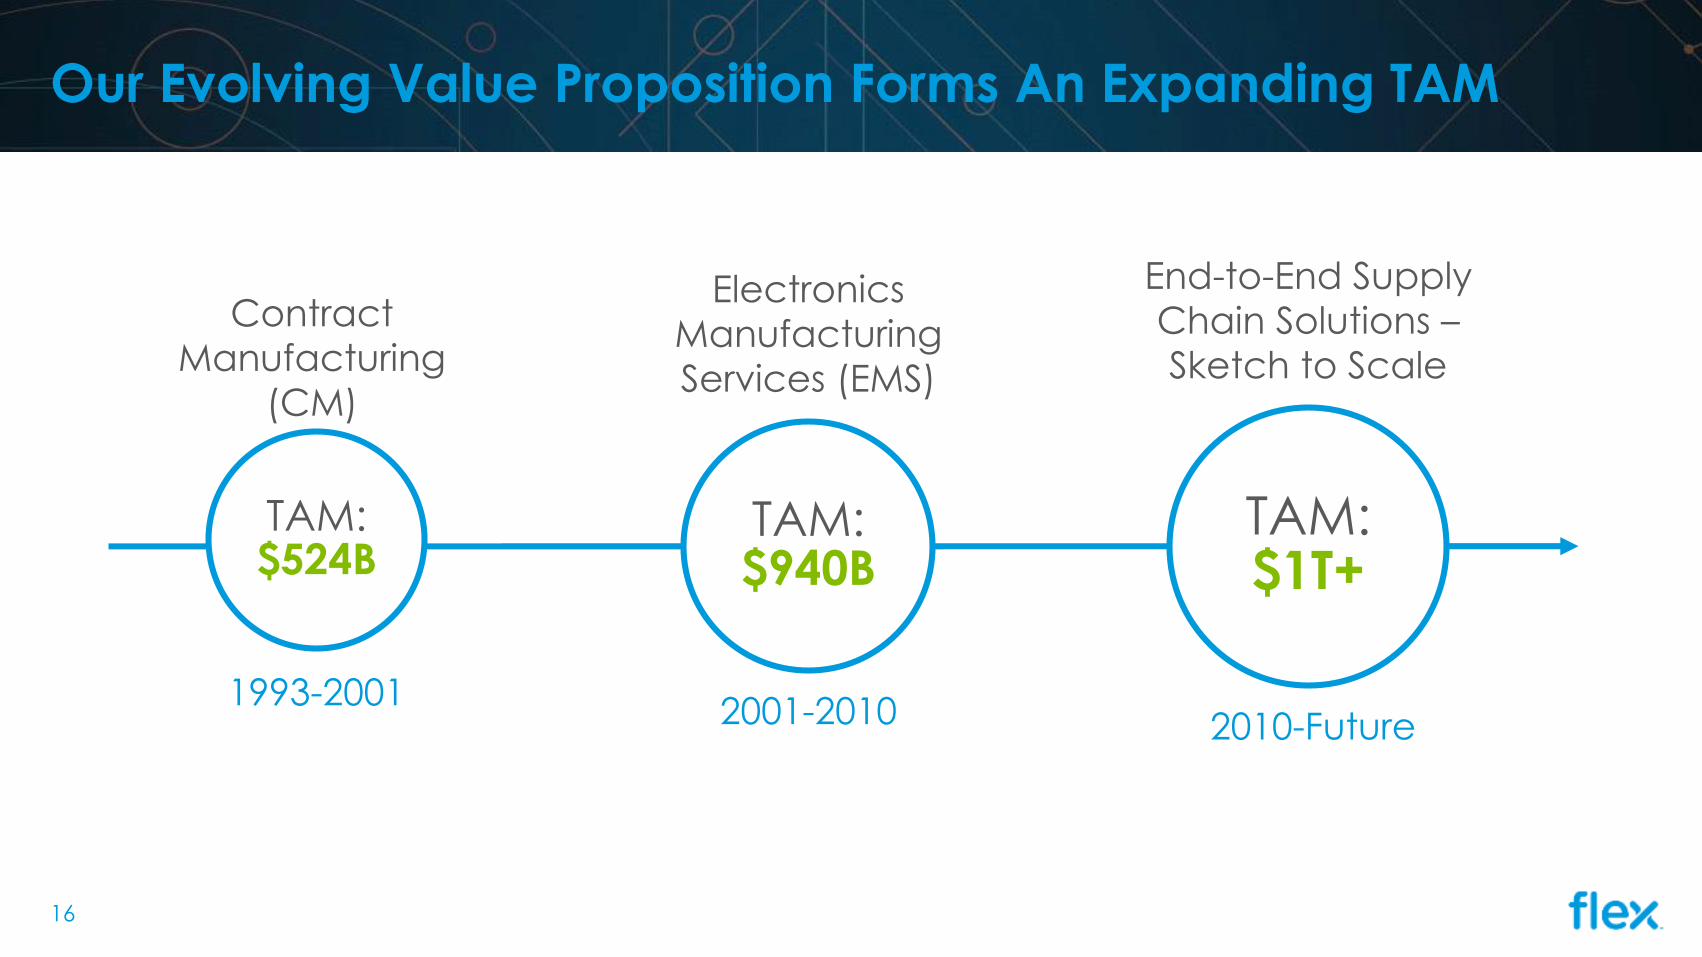
Contract
Manufacturing
(CM)
16
Our Evolving Value Proposition Forms An Expanding TAM
TAM:$940B
TAM:$524B
1993-20012001-2010 2010-Future
TAM:$1T+
Electronics
Manufacturing
Services (EMS)
End-to-End Supply
Chain Solutions –
Sketch to Scale
17
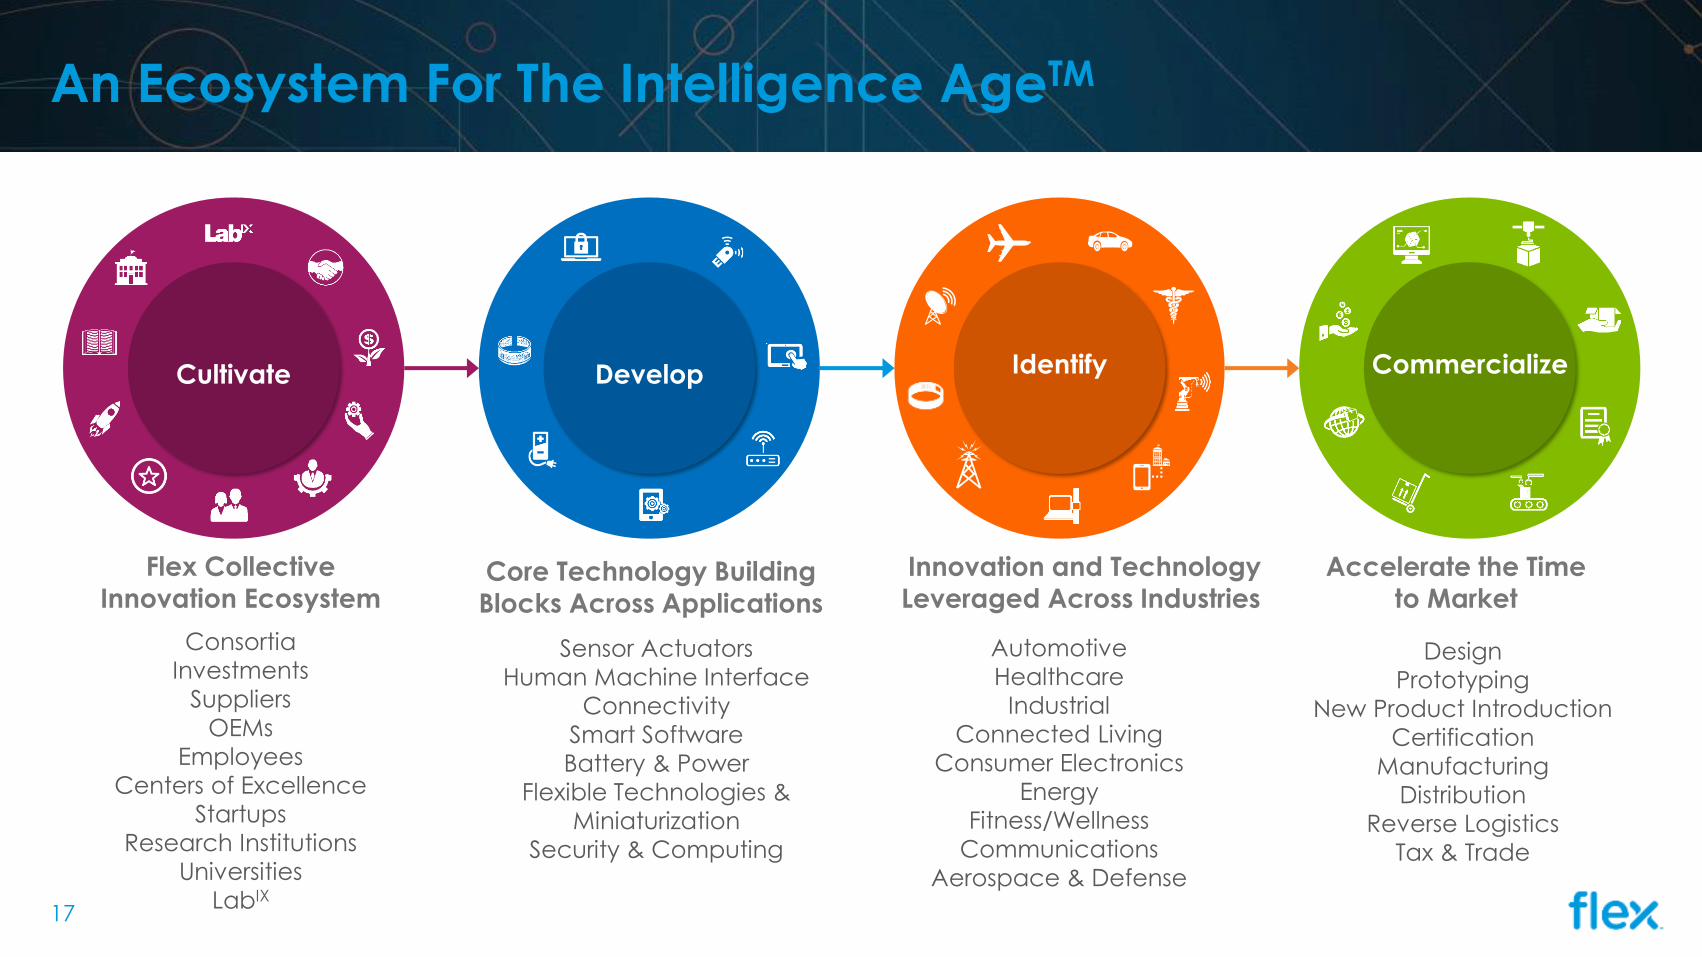
An Ecosystem For The Intelligence AgeTM
Cultivate CommercializeIdentifyDevelop
Automotive
Healthcare
Industrial
Connected Living
Consumer Electronics
Energy
Fitness/Wellness
Communications
Aerospace & Defense
Consortia
Investments
Suppliers
OEMs
Employees
Centers of Excellence
Startups
Research Institutions
Universities
LabIX
Sensor Actuators
Human Machine Interface
Connectivity
Smart Software
Battery & Power
Flexible Technologies &
Miniaturization
Security & Computing
Design
Prototyping
New Product Introduction
Certification
Manufacturing
Distribution
Reverse Logistics
Tax & Trade
Flex Collective Innovation Ecosystem
Core Technology Building
Blocks Across Applications
Innovation and Technology
Leveraged Across Industries
Accelerate the Time
to Market

18
Elementum: Real-Time Solutions to Improve Decision Making
Powered by Elementum: mobile software for end-to-end supply chain management
Incubated in 2012 by Flex – Now a
majority-owned subsidiary of Flex • Consolidated financial with Flex
• Flex owns the majority of outstanding
equity and Board of Directors control
Board of Directors, Advisory Board and
Investors include:• Lightspeed Venture Partners
• Workday
• Silverlake
• Flex
• Yahoo
Over $60M in total funding

Strategically Positioned to Win
19
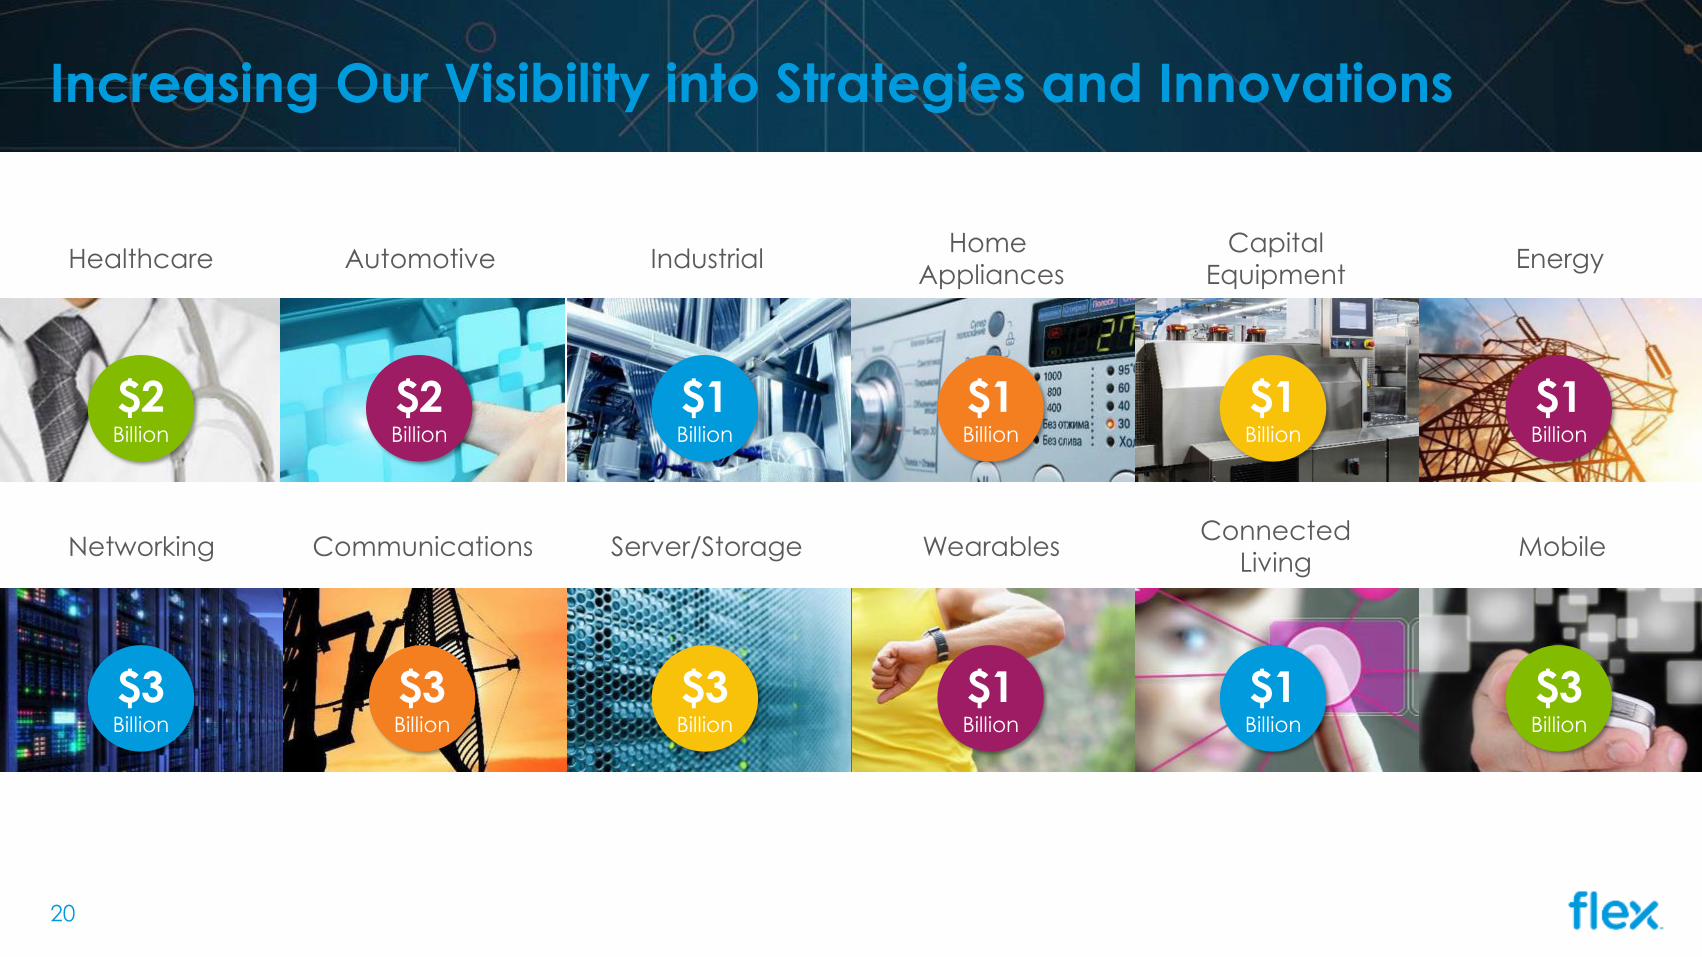
Increasing Our Visibility into Strategies and Innovations
Healthcare
$2Billion
Automotive
$2Billion
Industrial
$1Billion
Home
Appliances
$1Billion
Capital
Equipment
$1Billion
Energy
$1Billion
Networking
$3Billion
Communications
$3Billion
Server/Storage
$3Billion
Wearables
$1Billion
Connected
Living
$1Billion
Mobile
$3Billion
20

Purposefully Positioned in 100+ Sites and 30 Countries
Austin, TX ●●●●Dallas, TX ●●
Fort Worth, TX ●Houston, TX ●
Plano, TX ●
Milpitas, CA ●●●●Morgan Hill, CA ●
San Jose, CA ●San Carlos, CA ● Ashville, NC ●
Charlotte, NC ●Raleigh, NC ●●
Stuttgart, Germany ●
Althofen, Austria ●●
Columbia, SC ●
Northfield, MN ●
Aguascalientes, MX ●●
Guadalajara, MX ●●●
Tijuana, MX ●●
Manaus, Brazil ●●
Jaguariuna, Brazil ●Sorocaba, Brazil ●●
Budapest, Hungary ●Gyal, Hungary ●Pecs, Hungary ●Sarvar, Hungary ●●Tab, Hungary ●Zalaegerszeg, Hungary ●
Leitrim, Ireland ●Cork, Ireland ●
Limerick, Ireland ●●
Migdal Haemek, Israel ●●Ofakim, Israel ●Yavne, Israel ●
Lodz, Poland ●Tczew, Poland ●●
Timisoara, Romania ●●
Ronneby, Sweden ●●
Mukachevo, Ukraine ●
Bangalore, India ●Chennai, India ●●
Milan, Italy ●●Treviso, Italy ●Trieste, Italy ●
Valencia, CA ●
Memphis, TN ●
Louisville, KY ●
Dubai, UAE ●
Manchester, UK ●Swindon, UK ●
Istanbul, Turkey ●
Oostrum, Netherlands ●Venray, Netherlands ●
Brno, Czech Republic ●Pardubice, Czech Republic ●
Global Services
Design
Manufacturing
Overland Park, KS ●
Gushu (Shenzhen), China ●●Huang Tian (Shenzhen), China ●●Nanjing, China ●Shanghai, China ●●Shenzhen, China ●●Suzhou, China ●Wuzhong (Suzhou), China ●●●Zhuhai, China ●●
Changi, Singapore ●Joo Koon Singapore ●●Kallang, Singapore ●
Batam, Indonesia ●
Penang, Malaysia ●●Port of Tanjung Pelepas (Johor), Malaysia ●●Senai (Johor), Malaysia ●●Skudai (Johor), Malaysia ●
Tianjin, China ●
Delhi, India ●Mumbai, India ●
Taipei, Taiwan ●●
Ibaraki, Japan ●●
Chengdu, China ●●
Mechanicals
Zurich, Switzerland ●
Dalingshan (Dongguan), China ●Hong Kong, China ●●Qiaotou (Dongguan), China ●Atlanta, GA ●
Burlington, Canada ●Newmarket, Canada ●Ottawa, Canada ●Toronto, Canada ●
Coopersville, MI ●●Farmington Hills, MI ●
Tempe, AZ ●
Buffalo Grove, IL ●
Manchester, CT ●
Sonderborg, Denmark ●
Headquarters
Juarez, MX ●●●Reynosa, MX ●
21
22
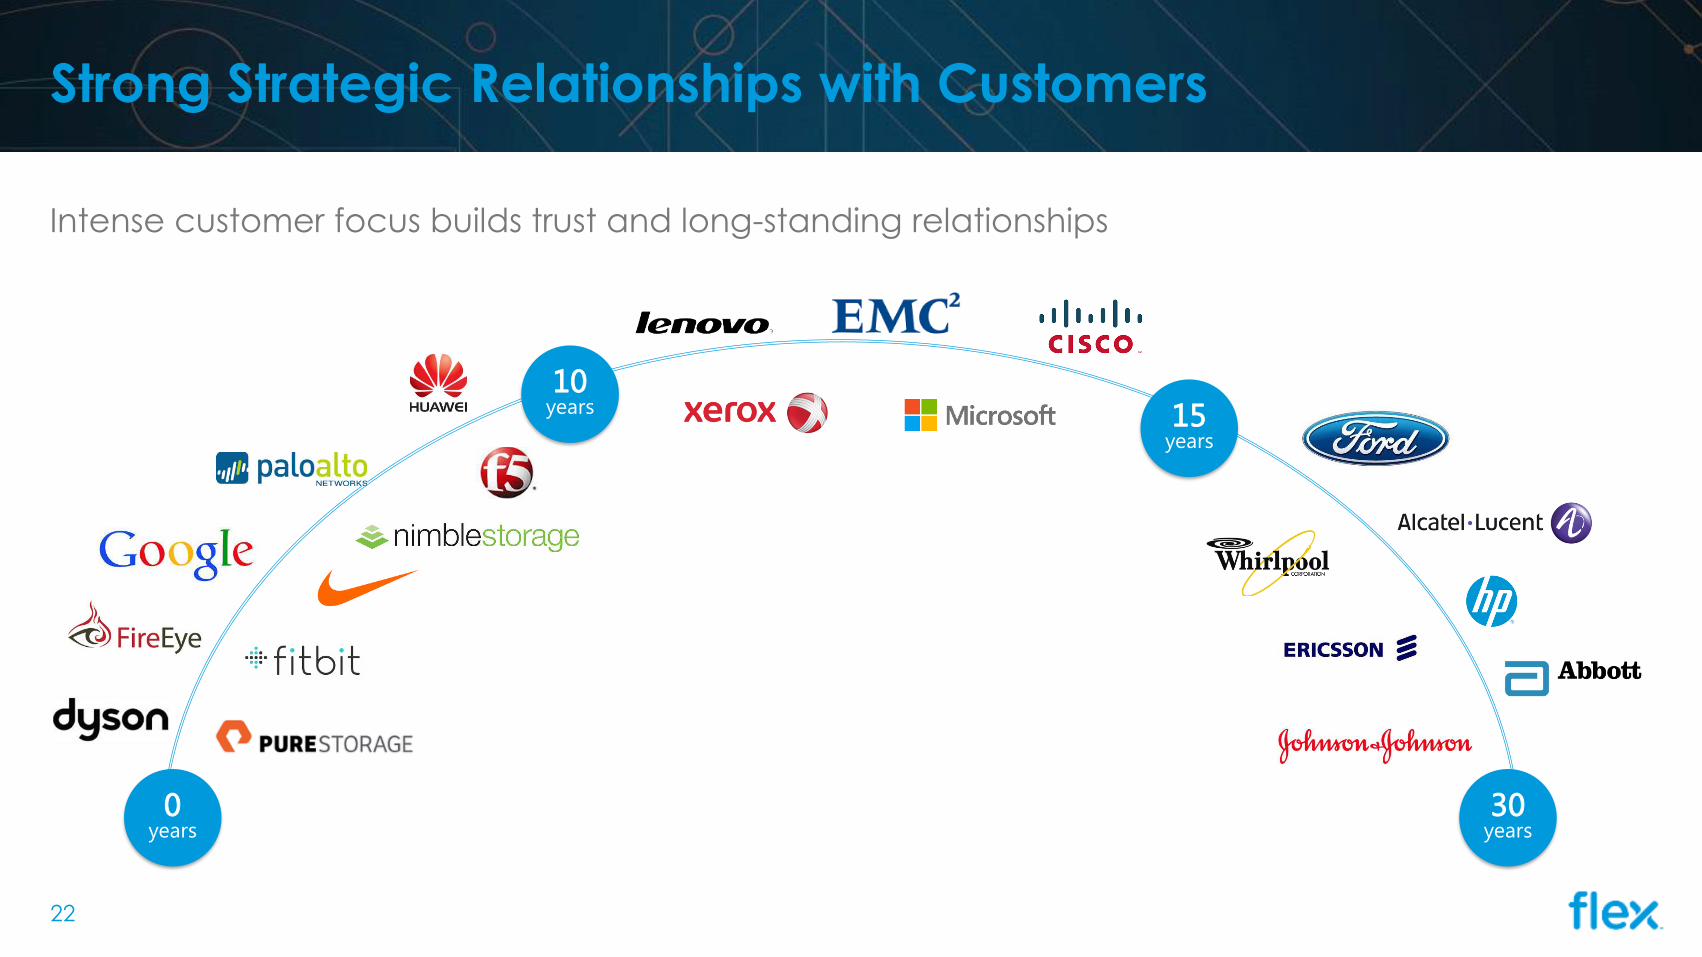
Strong Strategic Relationships with Customers
Intense customer focus builds trust and long-standing relationships
30years
15years
10years
0years

Situation: Nike needed a step change in their operations to
address new concerns, such as macro challenges like labor rate inflation and time-to-market requirements.
Solution: After an extended assessment of learning Nike’s
business, and Nike understanding Flex’s capability and
commitment, a partnership was formed to manufacture
athletic shoes – initial production at our Product Innovation
Center in California. Nike will leverage the Flex Platform, with
emphasis on:
• Automation
• IT systems
• Production reporting
• Responsiveness to demand
• Customization
Revolutionary Partnerships
23
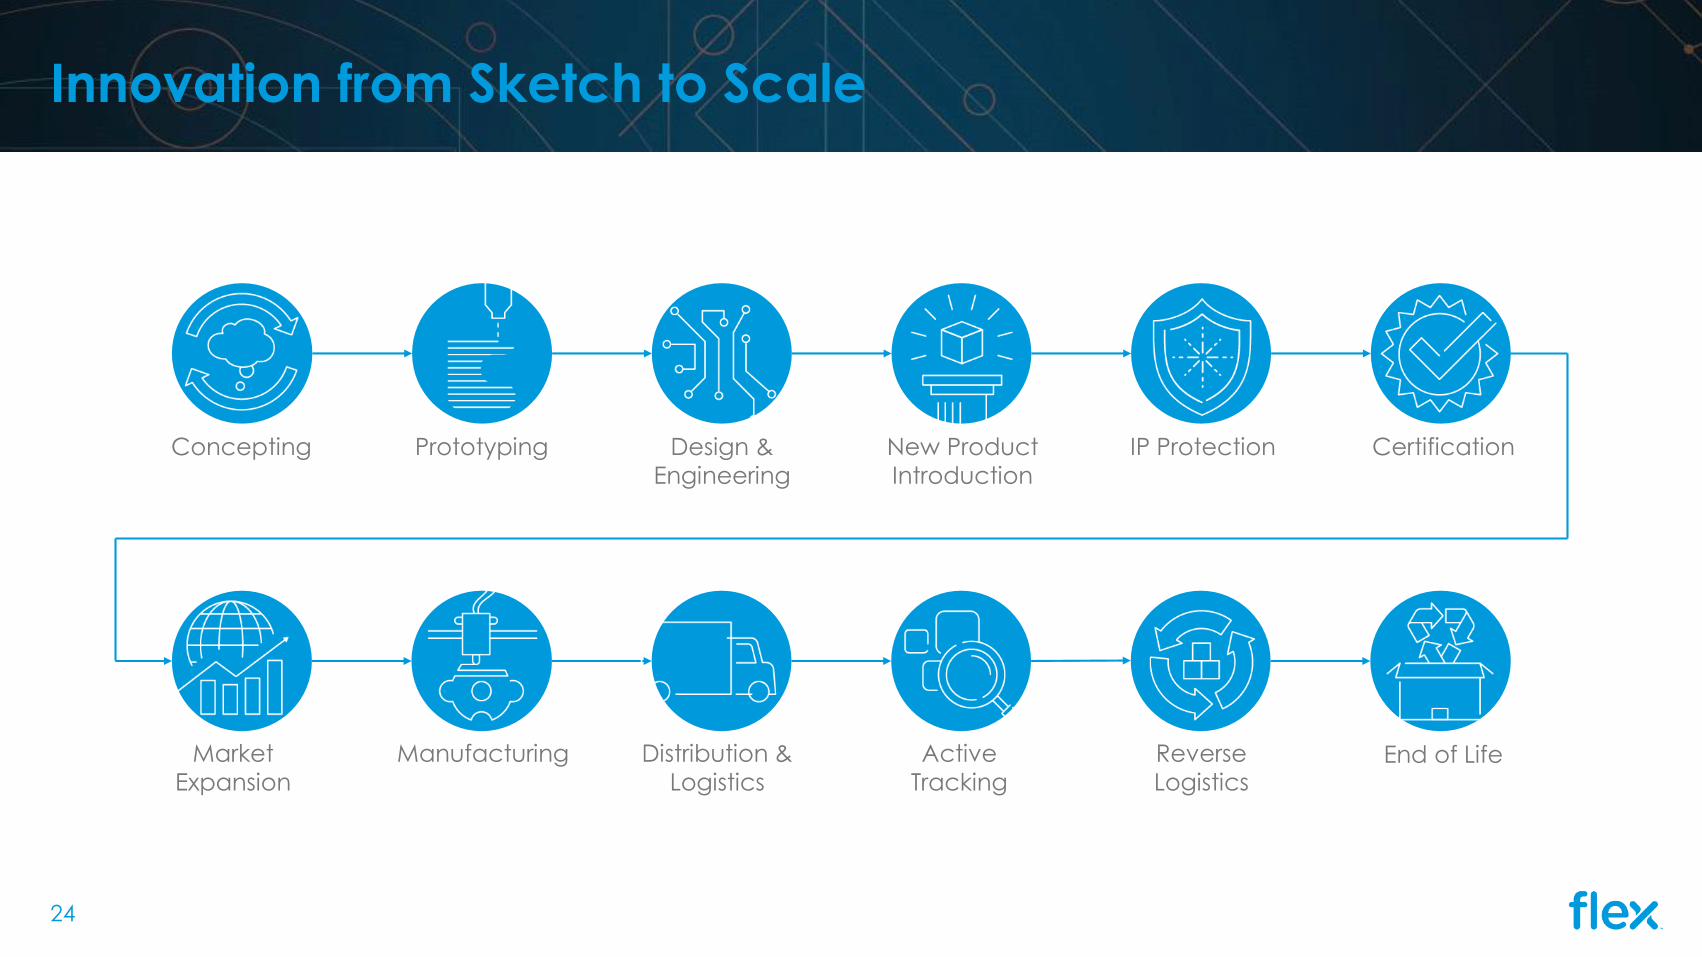
Innovation from Sketch to Scale
New Product
Introduction
Active
Tracking
Concepting
Manufacturing
Design &
Engineering
Market
ExpansionEnd of LifeDistribution &
Logistics
IP Protection CertificationPrototyping
Reverse
Logistics
24
25
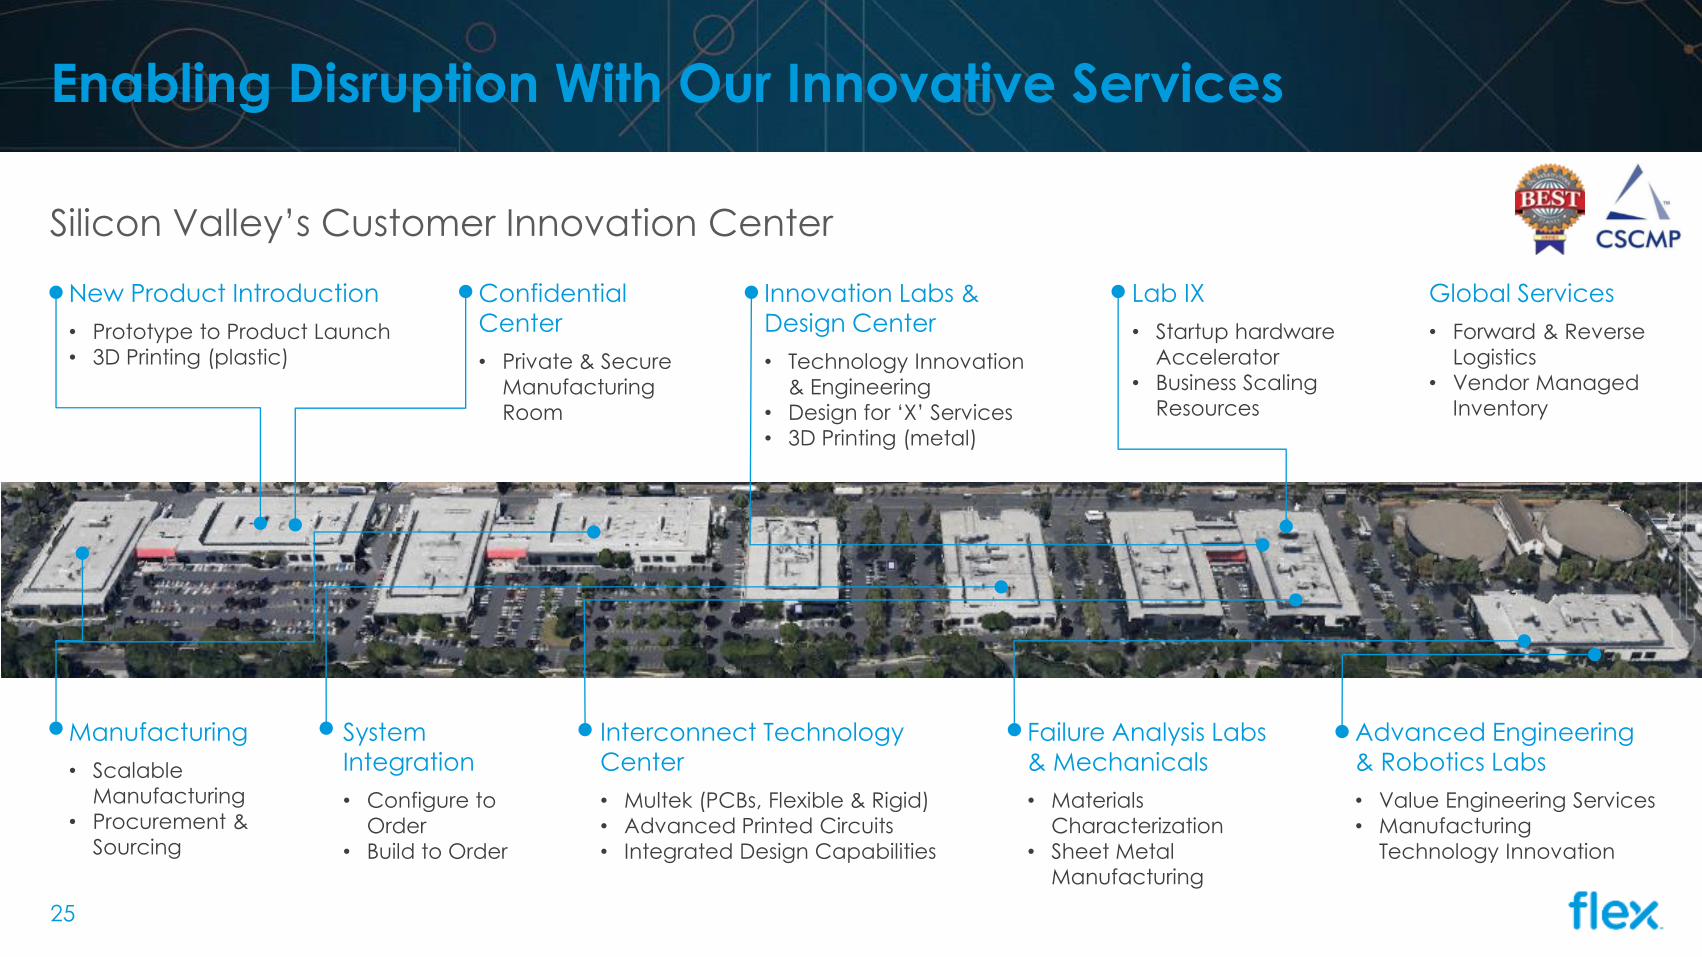
Enabling Disruption With Our Innovative Services
Silicon Valley’s Customer Innovation Center
Manufacturing
• Scalable
Manufacturing
• Procurement &
Sourcing
Advanced Engineering
& Robotics Labs
• Value Engineering Services
• Manufacturing
Technology Innovation
Interconnect Technology
Center
• Multek (PCBs, Flexible & Rigid)
• Advanced Printed Circuits
• Integrated Design Capabilities
Failure Analysis Labs
& Mechanicals
• Materials
Characterization
• Sheet Metal
Manufacturing
System
Integration
• Configure to
Order
• Build to Order
New Product Introduction
• Prototype to Product Launch
• 3D Printing (plastic)
Confidential
Center
• Private & Secure
Manufacturing
Room
Lab IX
• Startup hardware
Accelerator
• Business Scaling
Resources
Global Services
• Forward & Reverse
Logistics
• Vendor Managed
Inventory
Innovation Labs &
Design Center
• Technology Innovation
& Engineering
• Design for ‘X’ Services
• 3D Printing (metal)

26
Accelerating Technology in Flex Innovation Portfolio Companies
Connected
Living Digital Health Smart EnergyConnected
Transportation
Mobility /
Cloud
Smart
AutomationWearables
Biometric
smart clothing
Multi-feature wearable
enabling commerce
3D augmented interactive
reality platform
Wearable fitness
tracking
Shared, interactive
shopping list
3D display
technology for personal
use
Mood enhancing /
altering wearable
Women's health
device
Brain sensing
headband
Stretchable
biometric circuits
and sensors
Ultrathin, flexible,
rechargeable
batteries
Rechargeable
battery
management
system
Smart adapter to wirelessly
control lights
Wireless charging for
personal devices
Smart drones for
transportation
Autonomous crime
prevention robots
High-speed
contactless data
connectivity
Low power Wi-Fi
chip for wireless
peripherals
Integrated,
configurable wireless
modules
Miniaturized global
navigation modules
Electro-adhesion
technology
Force-sensitive
touch technology Smartphones as
dashboard cameras
Wireless soil and
environment monitoring
Analytics for home &
building automation
Landscape computing
solutions for smart cities

Access to new & tested technology building blocks
Development partnerecosystem
Experienced design & engineering teams
Entry into new & adjacent markets
Improved product reliability
Early stage engagement & accelerated time to market
Proven and Sustainable Innovation
130technology
Building
blocks
30+collective
innovation
members
270+patents
filed in
FY15
1,500customer
projects
in FY15
330design
customers
in FY15
1,000design
wins
in FY15
27

28
Innovation Today Builds a Strong Core Tomorrow
Leading next generation technology and cutting edge trends
• Micro-electronics
encapsulation
(flex circuits)
• Sensor Integration
• Optics (image capture)
• Smart Watch Packaging
(computing/mechanics)
• Bendable / Stretchable
Electronics
• Waterproofing
• Flexible substrates
• Precision bulk forming
• Integrated antenna
• Low pressure molding
• Rigid Flex design, assembly
and integration
• Wireless charging
integration
• Watertight sealing
• Fabrics and sensors
• GSR insert molding
• Dynamic bending
• HRM optical design
• LED transmittance
• Insert molded touch
displays

29
Ready for Megatrends Affecting Each Business Group
Automotive Medical
Communications Industrial Consumer
Zero
Accidents
Car
Connectivity
Zero
Emissions
Improved
Compliance
Patient
Centric
Smart
Connected
Solutions
Human
Machine
Interfacing
Emerging
Wireless
Connectivity
Converged
Infrastructure
Smart
EnergyFlexibility
Connected
Lifestyle

30
Automotive Repositioned to Focus on Growth Industries
Clean TechSmart Electronics Lighting
• Smart rearview camera
• Connectivity & infotainment
products
• Motion & power controls
• Center high mounted stop
lights (CHMSL)
• Overhead consoles &
ambient lighting
• LED driver modules
• Flexible LED lighting
(Q-Prime)
• Power & signal distribution
• Electrohydraulic controls
• Power conversion, storage &
charging

31
Medical Innovations in the Connected World
Health Monitoring Drug Delivery Health Treatment
• DIVG delivery patches
• Insulin pump patches
• Electromechanical drug
delivery systems
• Smart patches
• 3D motion sensors
• Hearing aids
• EEG/EMG devices
• Electronic glasses
• Wearable sensor patches
• Electronic tattoos
• Artificial limbs
• Smart pills
• Bionic eye
• Dental hearing systems
• Smart implants

32
Involved With 10 Out of the 12 Networking Disruptor IPOs
2010 2012 2013 2014
IPO Date: July 2012
Product: Security Appliances
Flex Exclusive
IPO Date: Sept 2013
Product: Security Appliances
Flex Exclusive
IPO Date: Dec 2013
Product: Converged Storage
Flex Exclusive
IPO Date: Nov 2009
Product: Security Appliances
IPO Date: May 2013
Product: Optical
Products & SDN
Flex Exclusive
IPO Date: April 2012
Product: Network Control
IPO Date: Sept 2013
Product: SSD Enterprise
Storage
IPO Date: Nov 2012
Product: Wireless
Networking
IPO Date: June 2014
Product: SDN Solutions (Gigabit
Ethernet Switches)
IPO Date: Oct 2015
Product: Converged Storage
2015

33
Innovation and Manufacturing in the Energy Market
Energy Management Renewable Energy Energy Storage
design, engineer, manufacture for leading global electric meter
companies
over 10 million micro-inverters
shipped
over 1.7GW production capacity
over 25%of North American
electric meters
produced for all major
OEMs
cost optimization through alternate
material systems
full spectrum capabilities to
support residential, commercial
and utility scale products
largest crystalline silicon solar module
manufacturer, outside of China
34
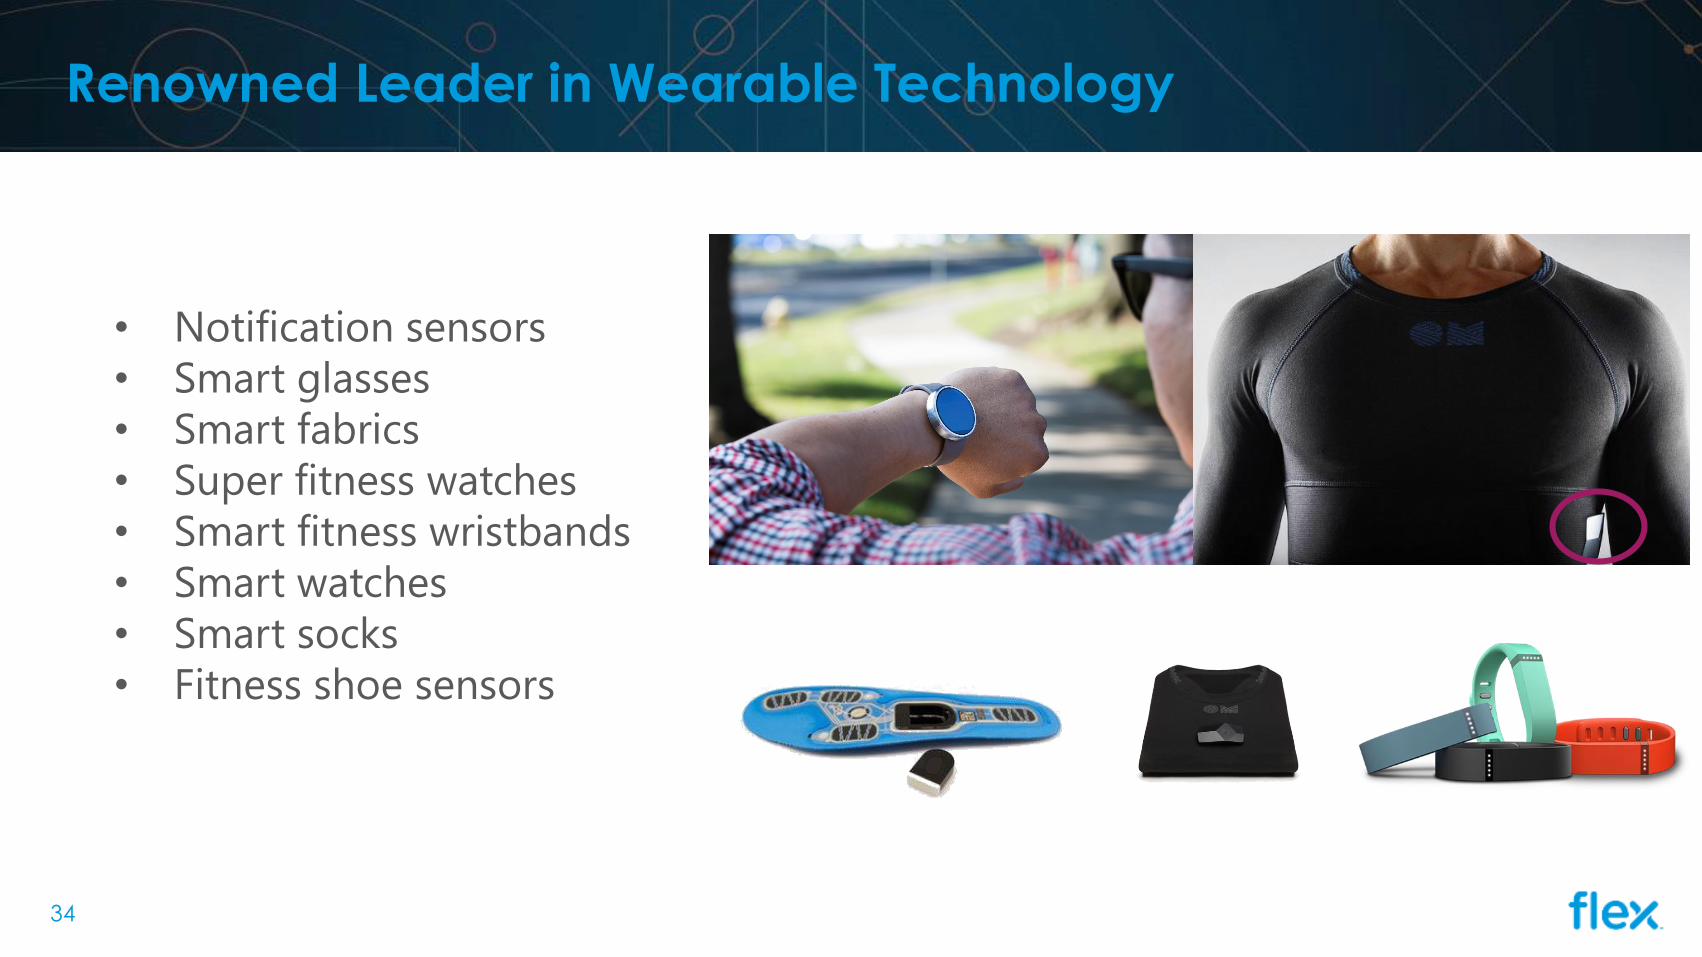
Renowned Leader in Wearable Technology
• Notification sensors
• Smart glasses
• Smart fabrics
• Super fitness watches
• Smart fitness wristbands
• Smart watches
• Smart socks
• Fitness shoe sensors

35
We Design the Connected Home: Sketch-to-Scale
• Energy management /
thermostats
• Smart home controllers
• Cloud analytics
• Streaming video and IPTV
• Smart sensors and lighting
controls
• Streaming audio
Richer Business Mix
36

37
Target Model Features
Structured to Deliver Earnings Growth
Target Fiscal 2020 Potential
Operating Profit Contribution
Revenue
Growth
Operating
Margin
Double digit 5-7%
Double digit 4-6%
Stable 3-4%
Better mix 2-3%
~30%~30%
~20% ~20%
~60%
CTG INS HRS IEI
HRS
IEI
CTG
INS

38
Consumer Technology Group (CTG)
Revenue(millions)
Fiscal2010
Fiscal2015
19%
6%13%
42%
39%
31%
17% 14%
34% 35%$9,358 $8,940
$5,634
FY14 FY15 FY16
YTD
CTG INS HRS IEI
39
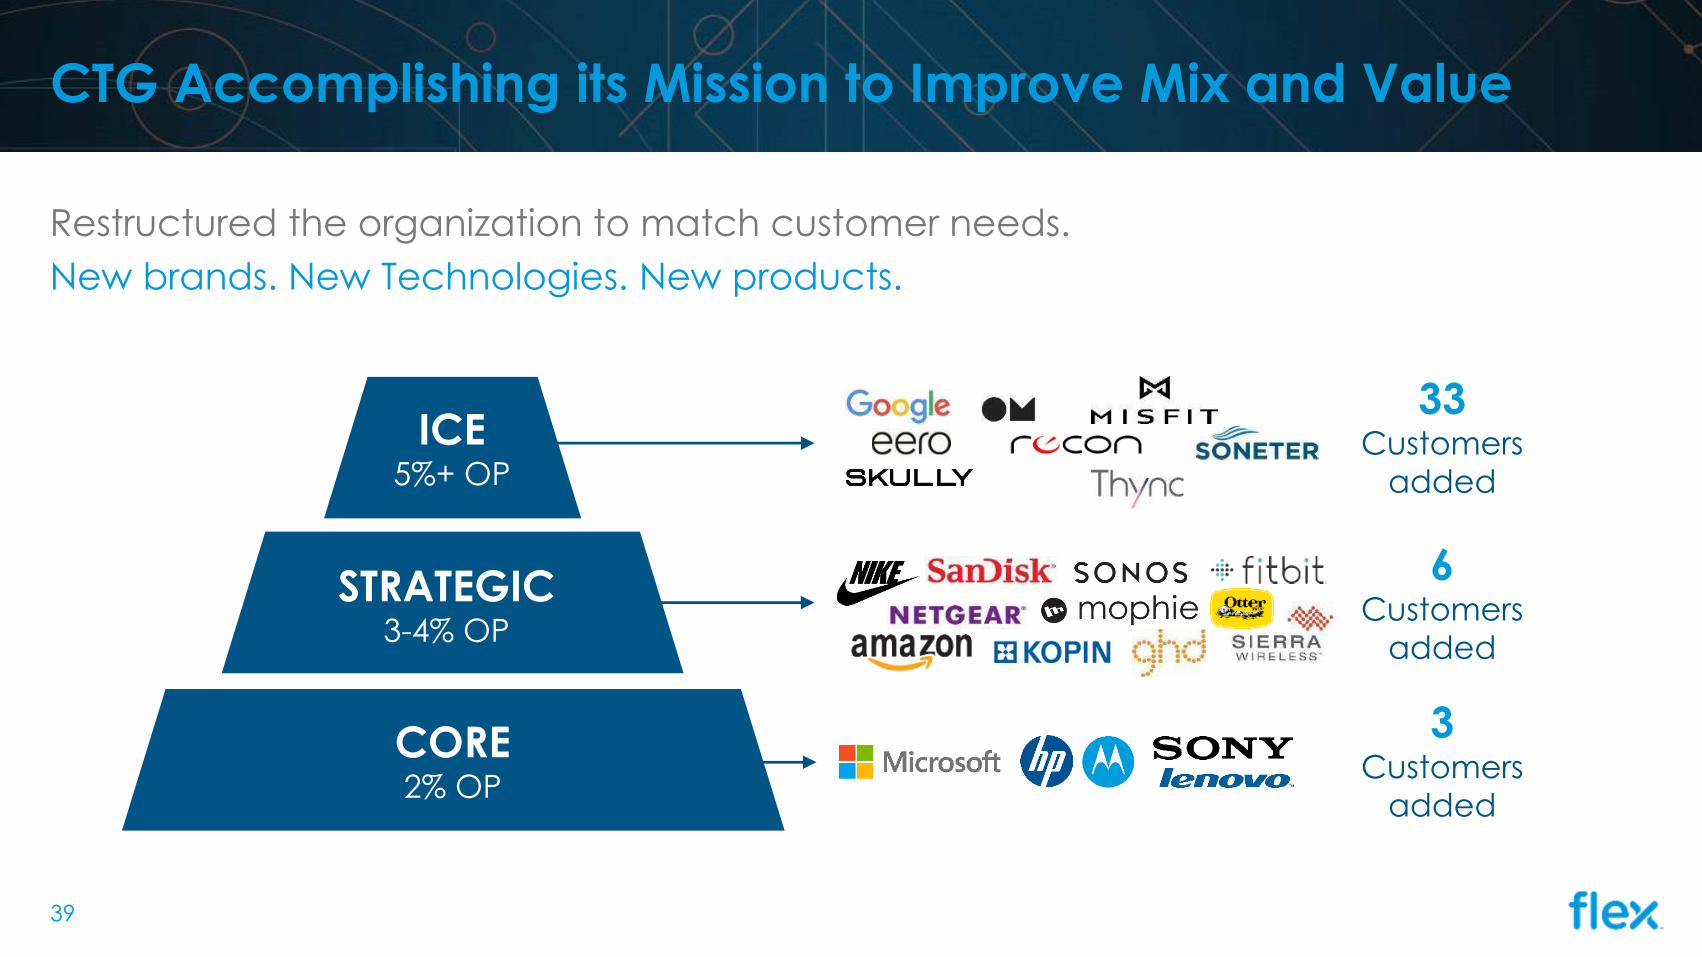
CTG Accomplishing its Mission to Improve Mix and Value
Restructured the organization to match customer needs.
New brands. New Technologies. New products.
ICE5%+ OP
STRATEGIC3-4% OP
CORE2% OP
33Customers
added
6Customers
added
3Customers
added

Gaming Personal Systems Wearables Connected Living Fashion Consumer Health
40
CTG Markets Lead in Next Generation Technology
81% CAGRin connected
home
300% CAGR in
wearables
#1in wearables
market
Multiplenew growth
vectors
Basic wearables include wrist worn bands but excludes smartwatches, chest straps, apparel and glasses
1 A better mix of customers and products
2Actively engaging new markets for richer opportunities and
new growth
3Leveraging our innovation to bring the Intelligence of Things™
to consumer products
4Running a lean operation of highly talented individuals to
consistently achieve stated financial results
41
CTG Going Forward
42
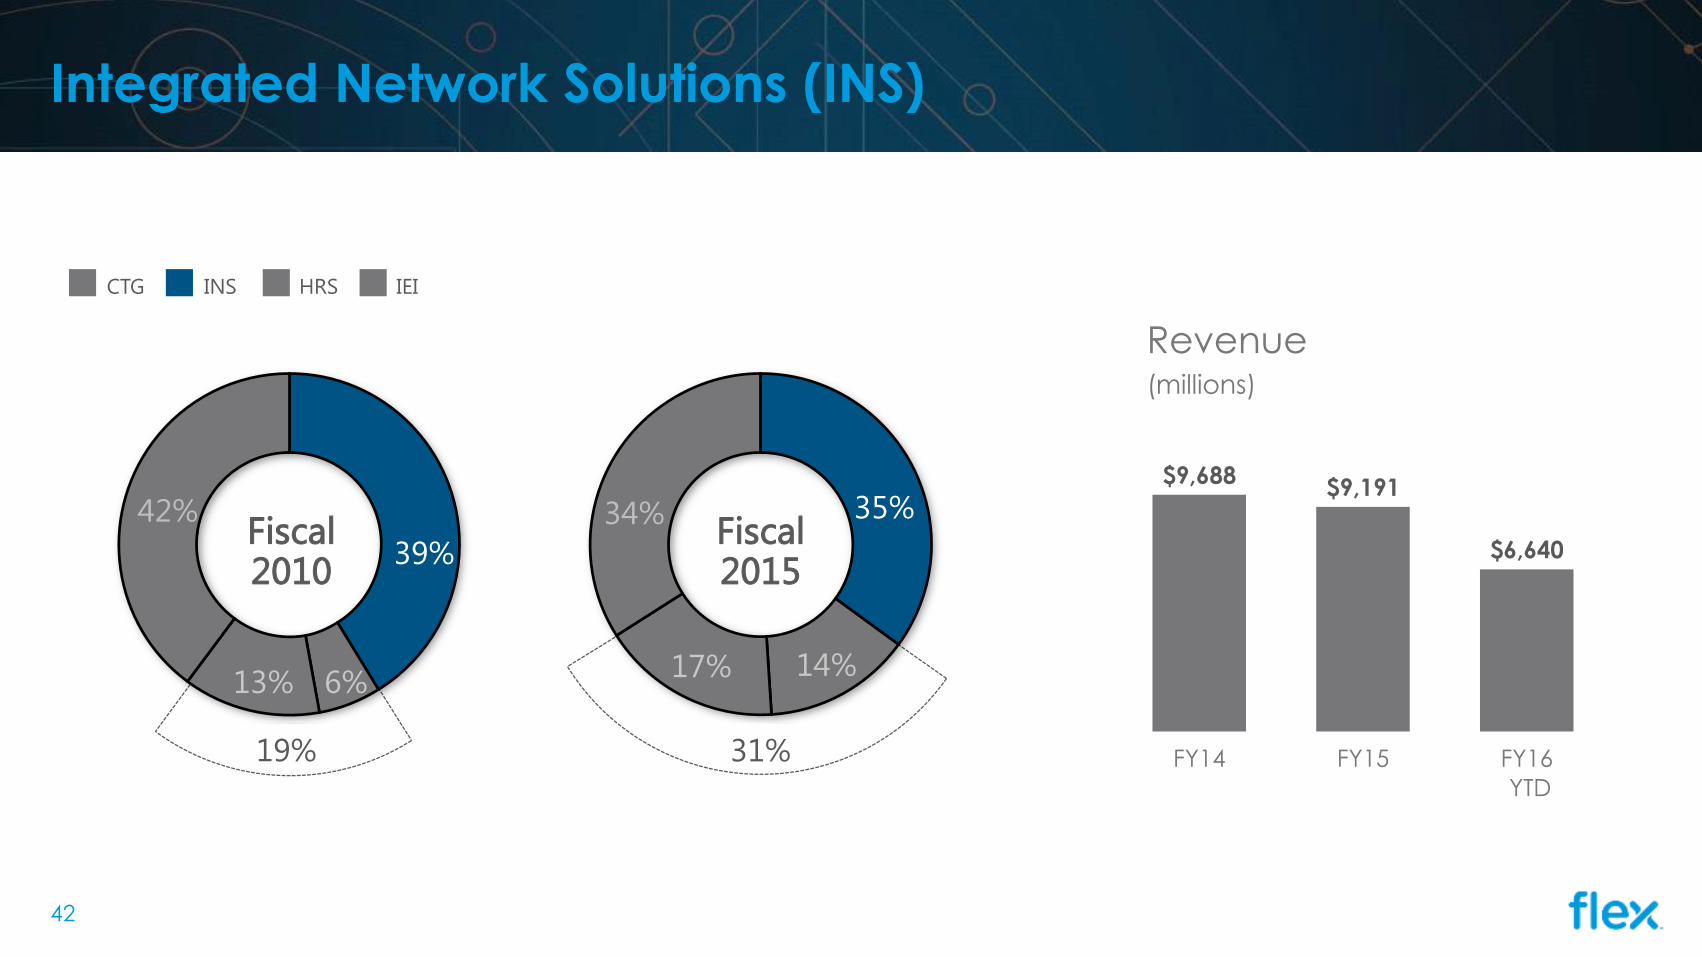
Integrated Network Solutions (INS)
$9,688$9,191
$6,640
FY14 FY15 FY16
YTD
Fiscal2010
Fiscal2015
19%
6%13%
42%
39%
31%
17% 14%
34% 35%
CTG INS HRS IEI
Revenue(millions)
43
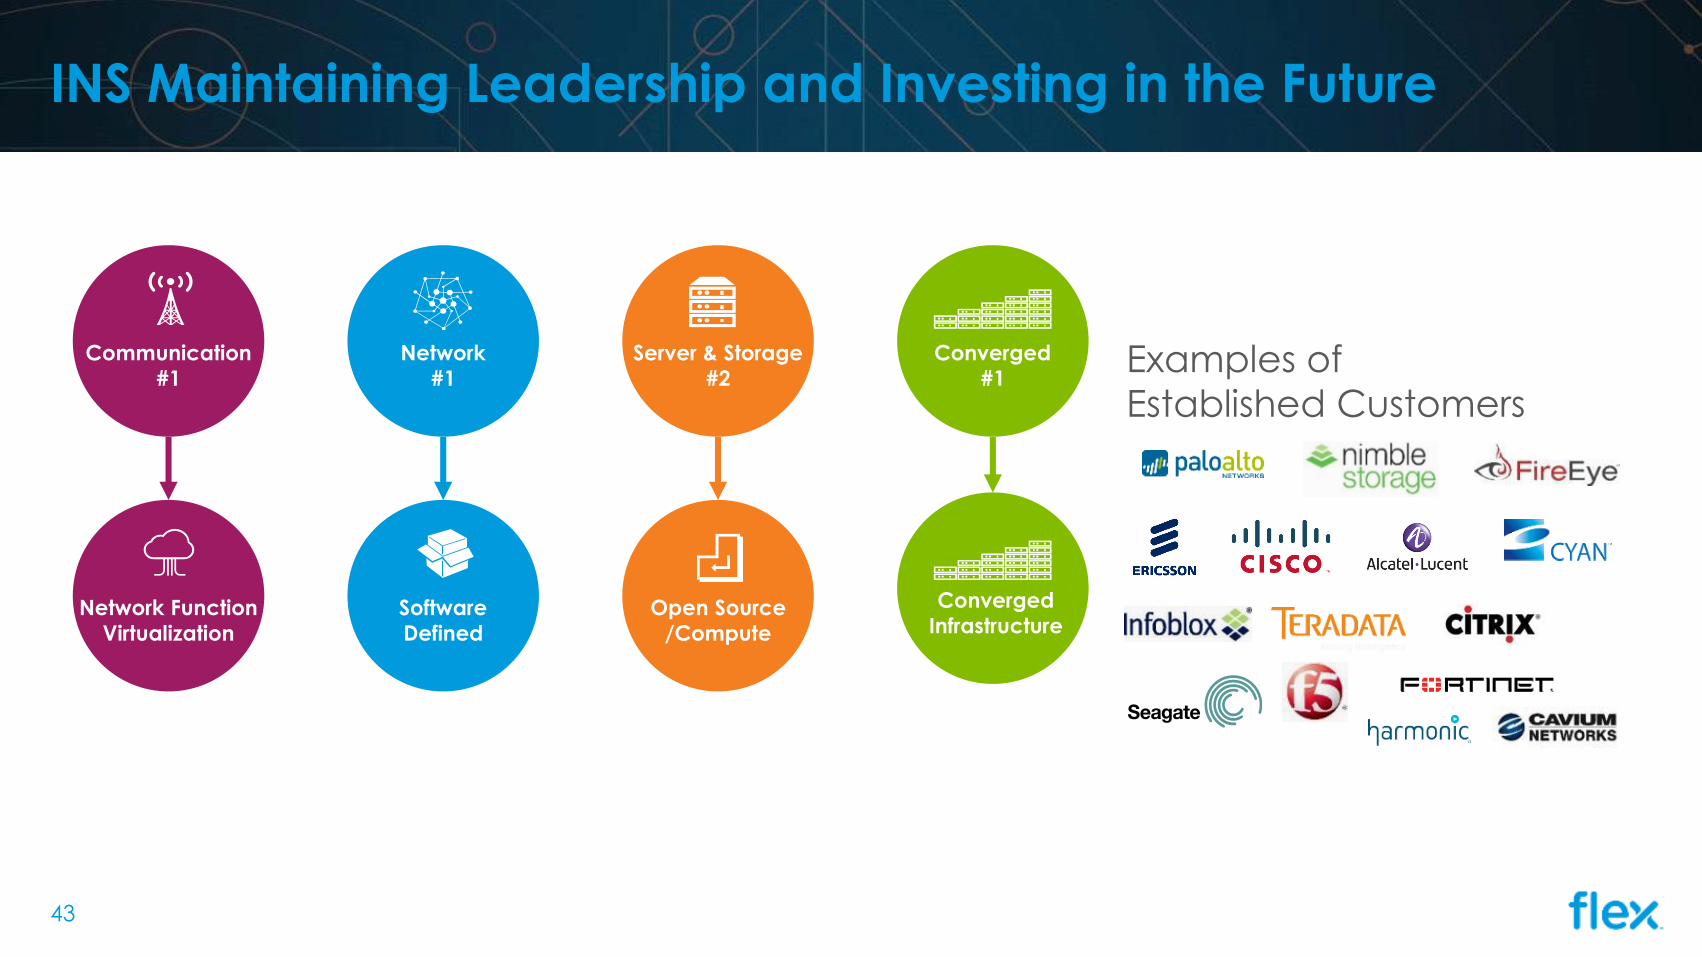
INS Maintaining Leadership and Investing in the Future
Examples of
Established Customers
Converged
#1
Converged
Infrastructure
Communication
#1
Network Function
Virtualization
Network
#1
Software
Defined
Server & Storage
#2
Open Source
/Compute

Communications Networking Server & Storage Converged
44
INS Markets Lead the Industry and Win
10 out of 12IPOs in
industry
~$9.2BGlobal
Revenue
#1worldwide
~$1BConverged
Networking
business
1 Continue to stabilize revenue
2 Provide stable and strong operating cash flow
3 Broad deep market penetration
4Provide capital efficiency by maintaining market
leadership and investing in innovation
45
INS Going Forward

$3,788
$4,459
$3,490
FY14 FY15 FY16
YTD
46
Industrial & Emerging Industries (IEI)
Fiscal2010
Fiscal2015
19%
6%13%
42%
39%
31%
17% 14%
34% 35%
CTG INS HRS IEI
Revenue(millions)

47
IEI Leveraging Capabilities for a More Connected World
Connected CityIndustrial Smart Home
Reduce cost
Lighting
TAM: $72B
Automation
TAM: $102BCapital Equipment
TAM: $140BAgriculture
TAM: $36B
Connected Home & Lifestyle
TAM: $198BEnergy
TAM: $371B
Smart Farm
Improve current
business
Enable new
revenue
2014 Flex TAM’s

48
Broad IEI Markets are Long-Term Growth Engines
Industrial
AutomationAppliances Lifestyles Self-service HVAC
Capital
Equipment
Measurement
Instrumentation
& Test
Building
Automation
Safety &
SecuritySmart Grid Oil & Gas
Water Transport
& Treatment
~$4.5Bbusiness group
300+ customers
80% of customers have $20M or
less in revenue
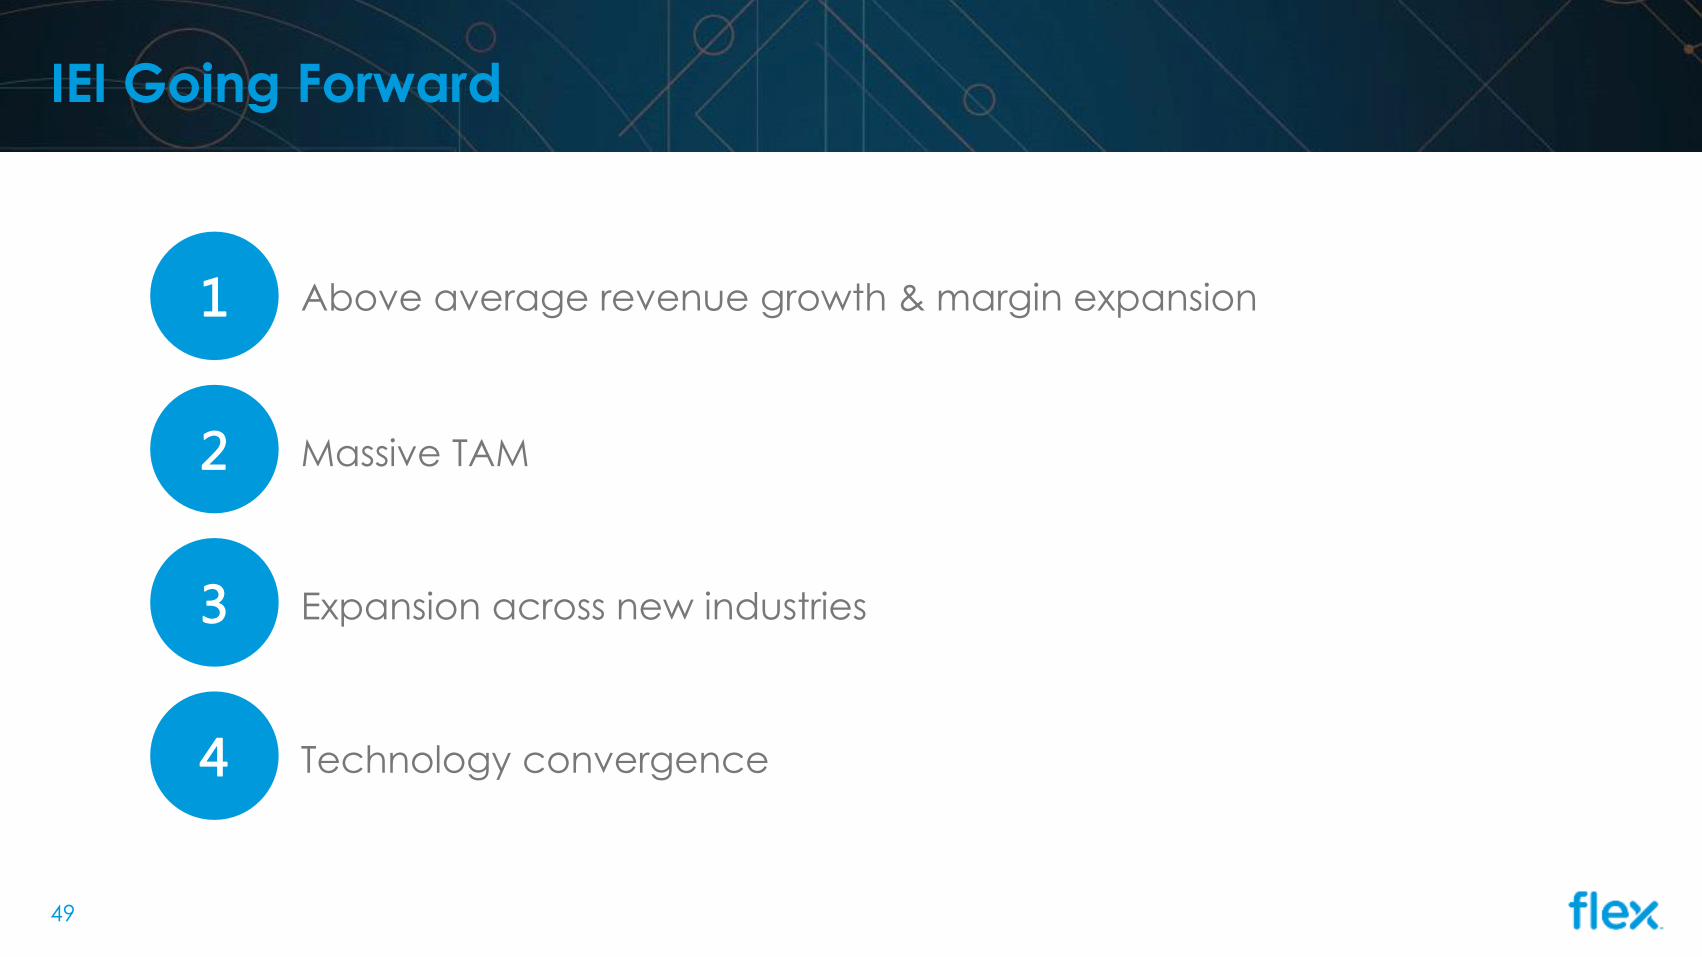
1 Above average revenue growth & margin expansion
2 Massive TAM
3 Expansion across new industries
4 Technology convergence
49
IEI Going Forward
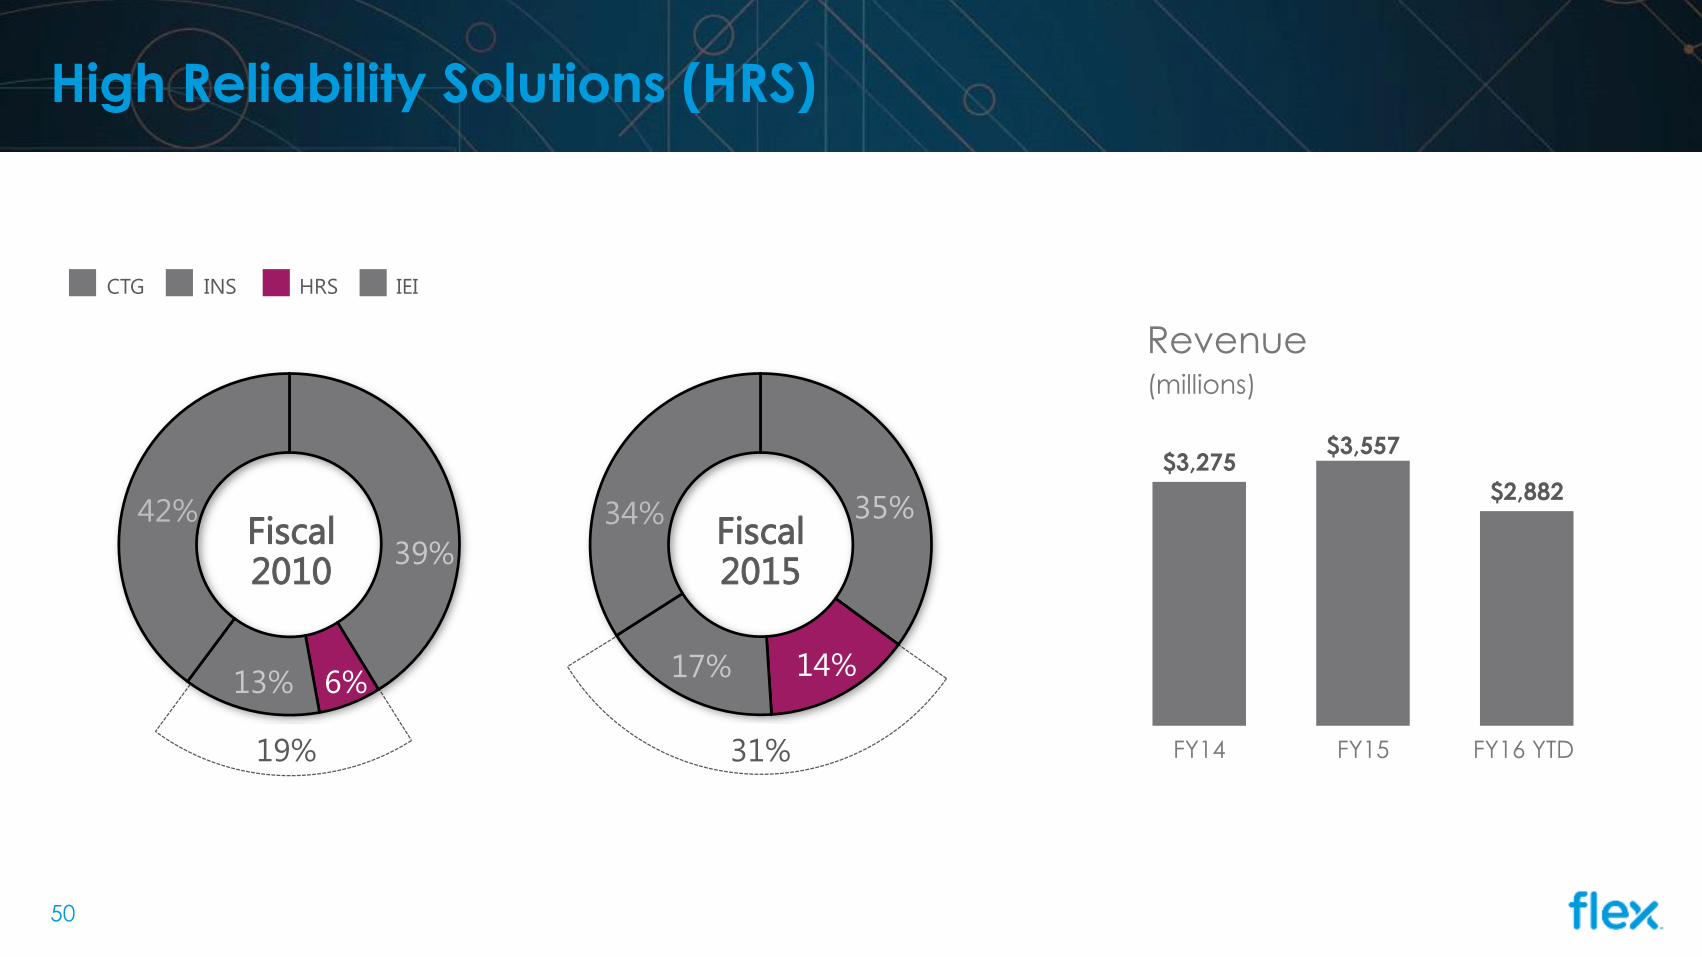
$3,275$3,557
$2,882
FY14 FY15 FY16 YTD
50
High Reliability Solutions (HRS)
Fiscal2010
Fiscal2015
19%
6%13%
42%
39%
31%
17% 14%
34% 35%
CTG INS HRS IEI
Revenue(millions)

51
HRS is Positioning for Long Term Value Creation
Revenue Bookings
FY16 FY17 FY18
95%Booked
92%Booked
85%Booked
FY10 FY11 FY12 FY13 FY14 FY15 FY16 FY17 FY18
~21%
10%+

52
HRS Markets Grow With Predictability & Longer Life Cycles
Automotive Medical Aerospace & Defense
16FDA regulated
sites
~$2BAuto segment
~$1.6BMedical segment
#1Industry*(Technology &
Revenue)
#1Industry*(Technology &
Revenue)
79%(Bookings
increase over
FY14)
Over 65 Medical products
designed
Over 60 Manufacturing
transfers made
9,000Auto employees
25+Locations
15countries
* Compared to traditional competitors
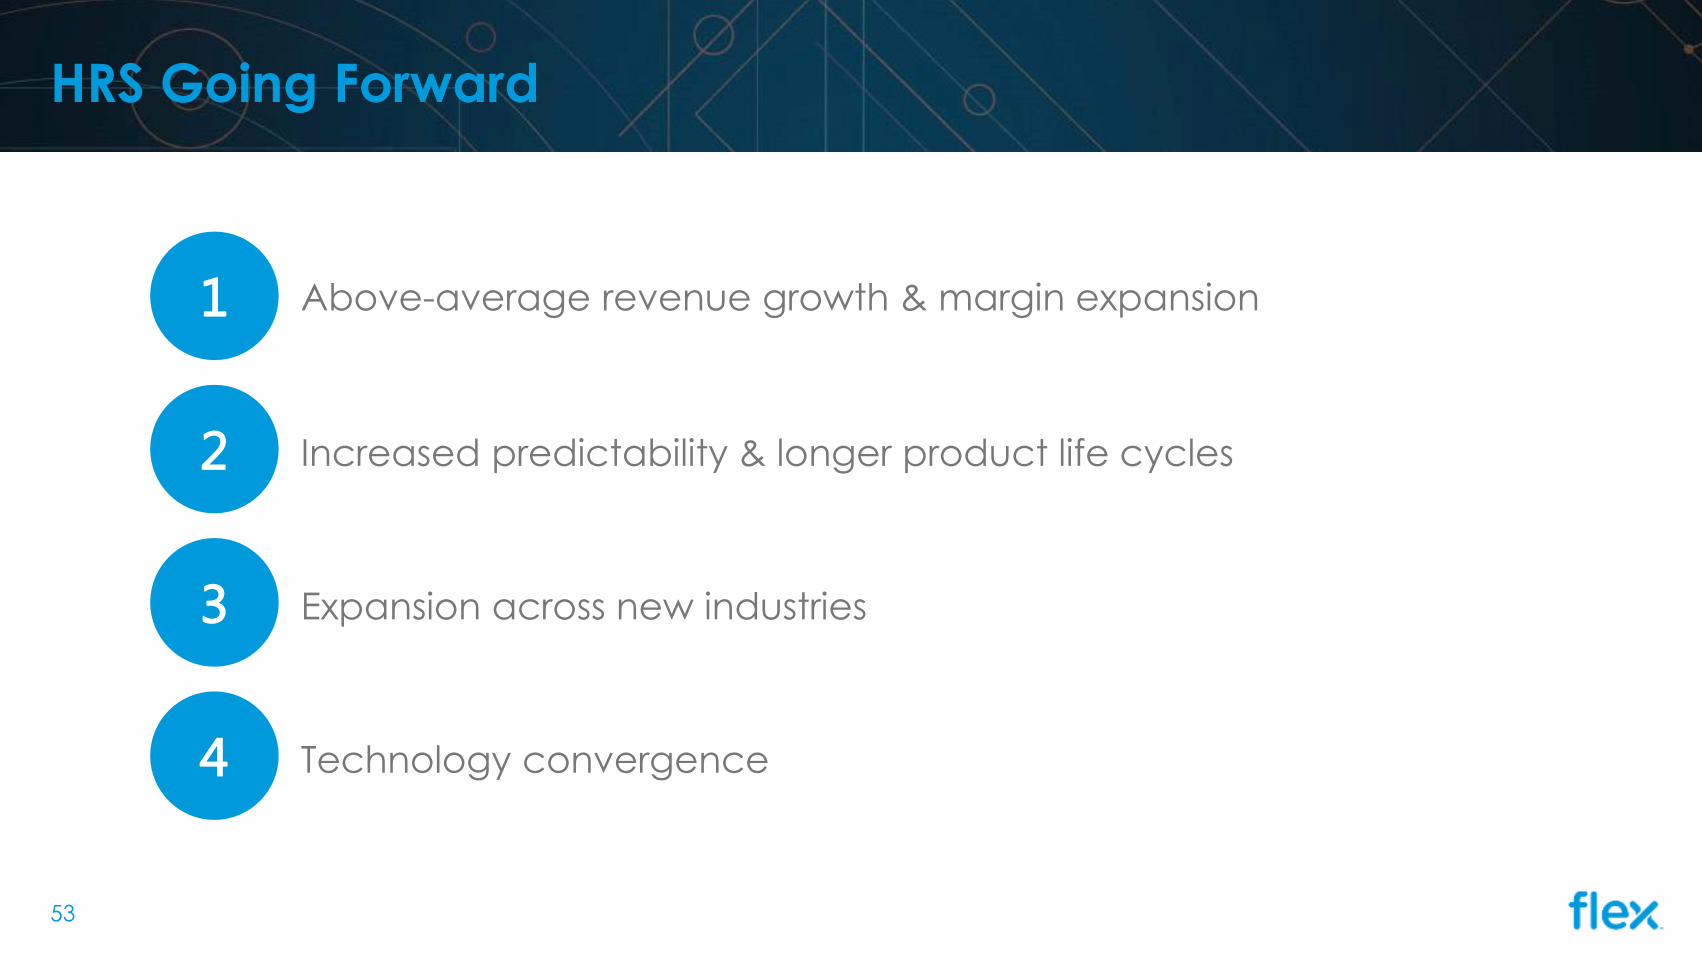
1 Above-average revenue growth & margin expansion
2 Increased predictability & longer product life cycles
3 Expansion across new industries
4 Technology convergence
53
HRS Going Forward
Strategic M&A
54

55
Selective M&A Transactions
Primarily focused on investing to expand our HRS & IEI capabilities
• Target capabilities
• Strategic customers
• Longer product
lifecycles
• Barriers to entry
• Higher margins
• EPS accretive
Key Criteria
Reflects M&A transactions completed from FY13 to FY16, excludes OEM asset acquisitions
>$100M
38
<$100M Purchase Price

56
Expanded Solar Offerings Through a Strategic Acquisition
Smart, connected, and most efficient solar panel
tracker technology on market
• 120 degree tracking range yields more 20-40% more
energy than competitors
• Trackers are only 15% of total installed base of utility
grade solar installations, and we think it will grow to 25%
in the next three years with the possibility to climb to
100% eventually
• This technology is immediately accretive to EPS and
Operating Margin
Now: Trackers 15% of total installed base of utility grade
solar installations
Future: Market to grow to 25% within 3 years and climb
to 100% eventually

57
Smart Investment to Extend Leadership in Smart Tech
Customer and Global Expansion
• Accelerates our position with strategic OEM’s
• #1 market share leader in China
• Specified by the OEM’s
Extends Flex’s market leadership in Automotive
• #1 global market share leader in exterior mirror motion controls
• Extends existing motion control business
• “Smart” mirror embedded with electronics
Strategic Flex Investment
• Hits our key M&A investment criteria
• Compelling strategic rationale
• Solid financial framework

Doubling down on the Intelligence of Things
• Smart Home platform connecting
devices seamlessly and globally
• 3rd largest connected home
software company on the planet
• 30+ OEM partners, most of which
are Flex customers
• Synergy for Flex to drive new and
exciting relationships
58
59
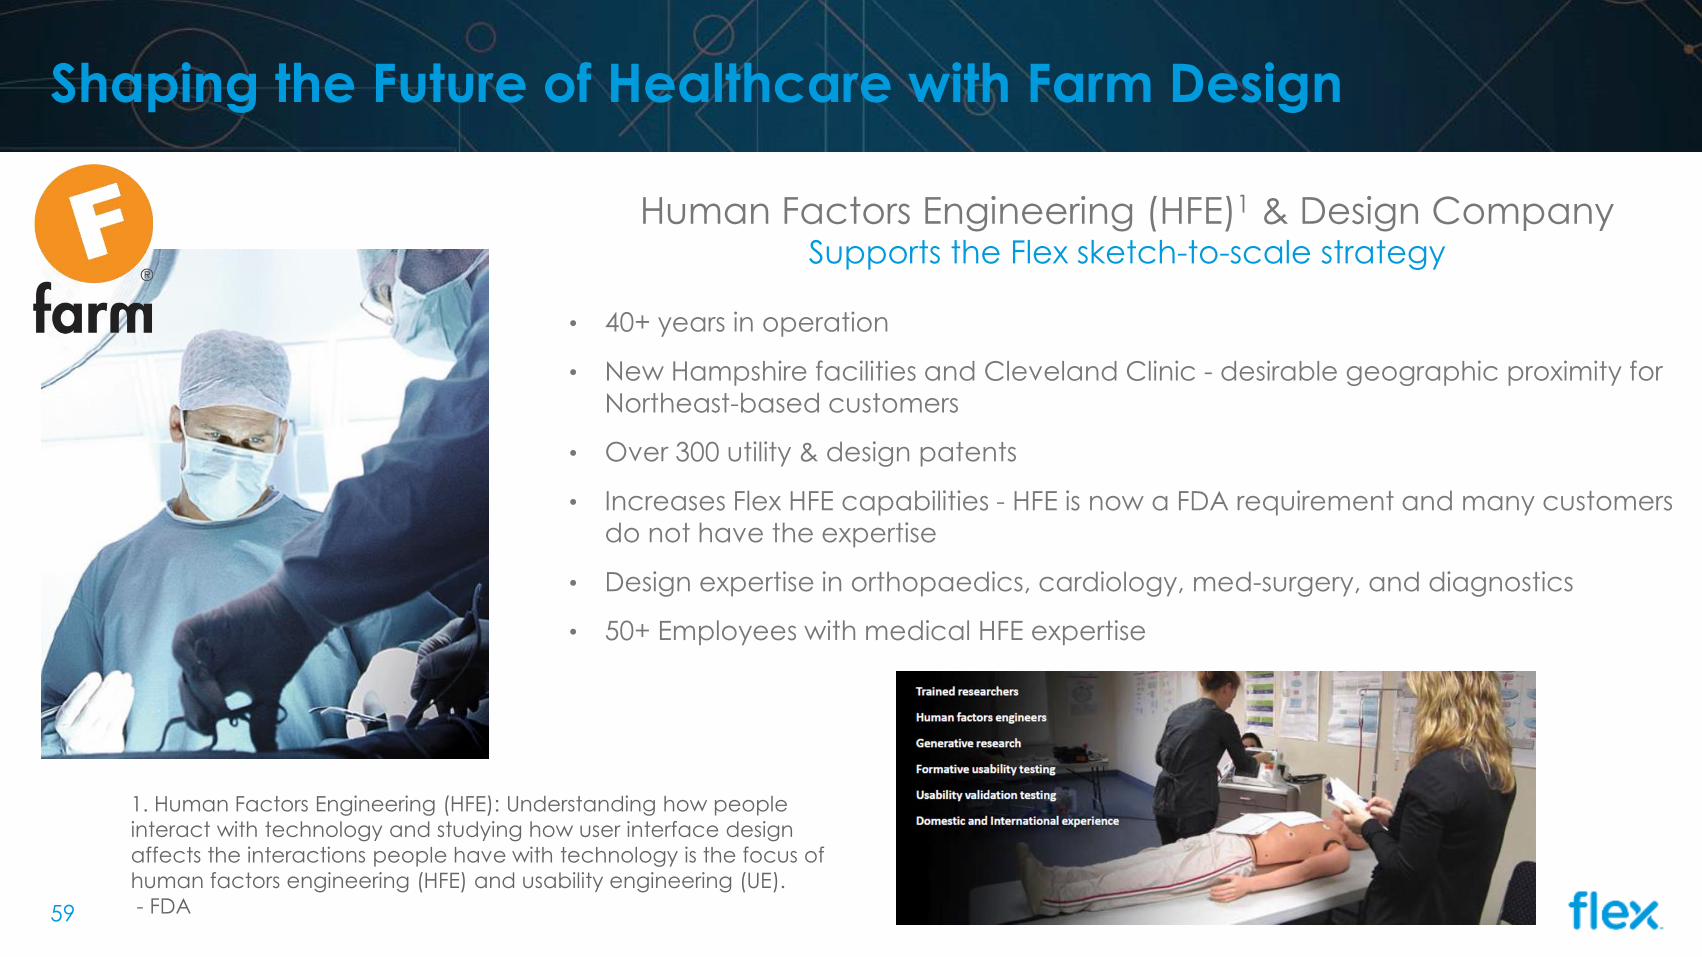
Shaping the Future of Healthcare with Farm Design
Human Factors Engineering (HFE)1 & Design CompanySupports the Flex sketch-to-scale strategy
• 40+ years in operation
• New Hampshire facilities and Cleveland Clinic - desirable geographic proximity for
Northeast-based customers
• Over 300 utility & design patents
• Increases Flex HFE capabilities - HFE is now a FDA requirement and many customers
do not have the expertise
• Design expertise in orthopaedics, cardiology, med-surgery, and diagnostics
• 50+ Employees with medical HFE expertise
1. Human Factors Engineering (HFE): Understanding how people
interact with technology and studying how user interface design
affects the interactions people have with technology is the focus of
human factors engineering (HFE) and usability engineering (UE).
- FDA

Latest Financial UpdateResults for Q3 Fiscal 2016
Earnings Announcement: Jan 28, 2016
60
61
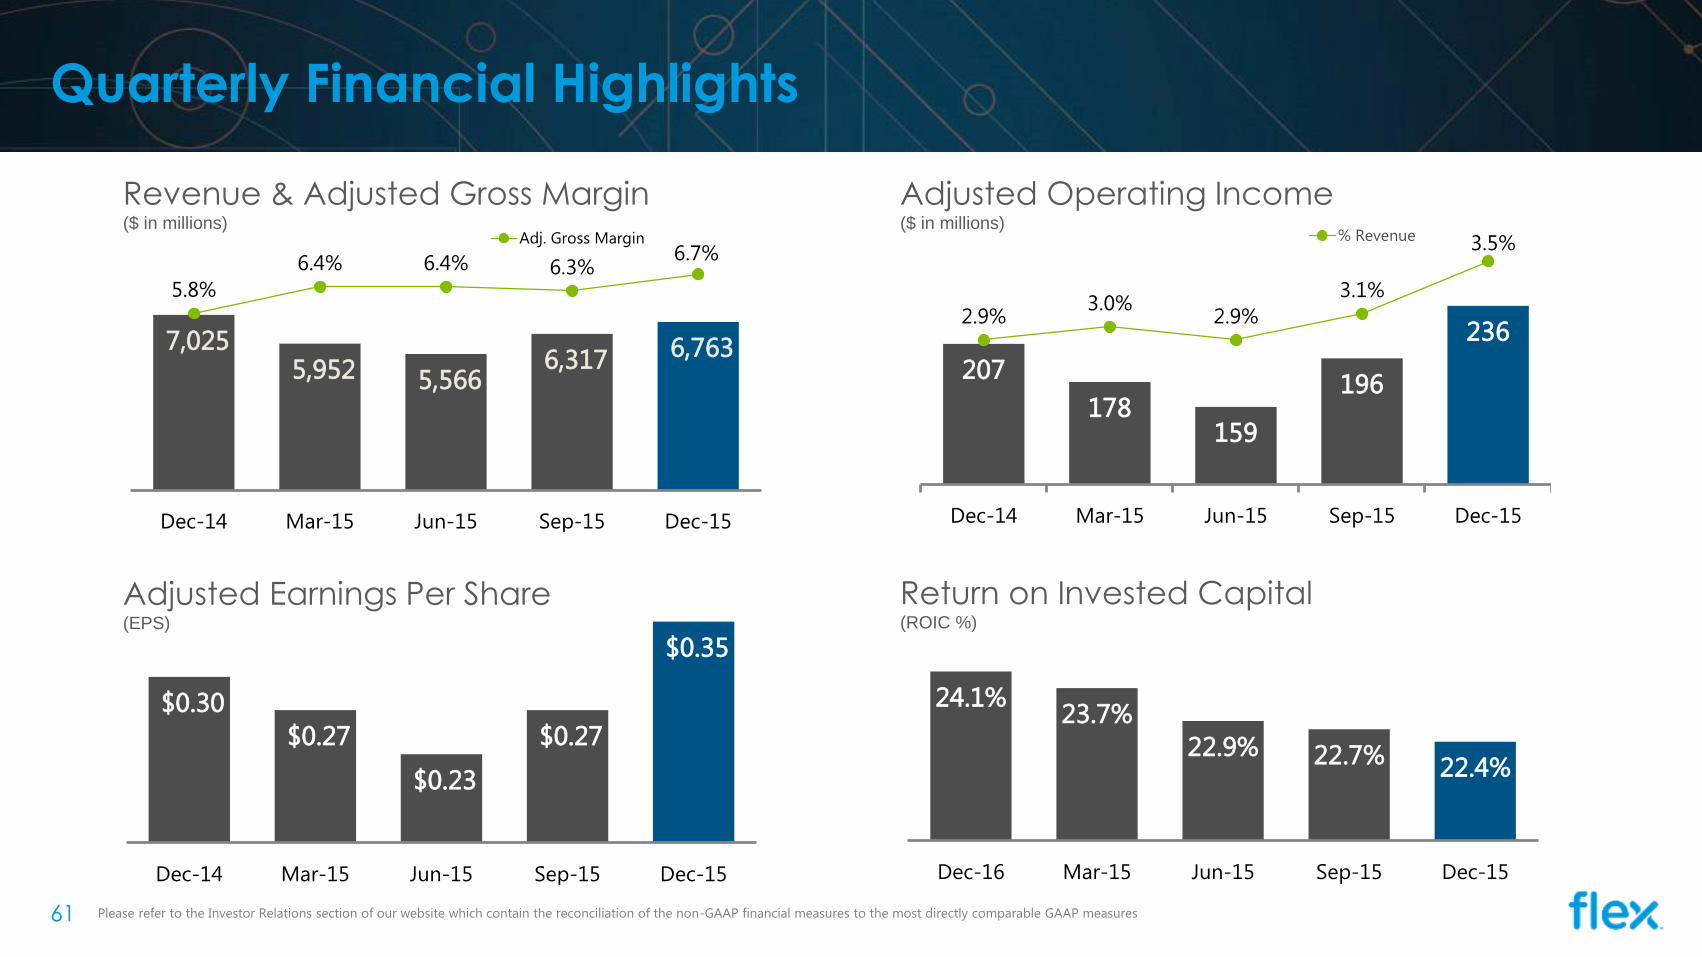
Quarterly Financial Highlights
Please refer to the Investor Relations section of our website which contain the reconciliation of the non-GAAP financial measures to the most directly comparable GAAP measures
24.1%23.7%
22.9% 22.7% 22.4%
Dec-16 Mar-15 Jun-15 Sep-15 Dec-15
Return on Invested Capital(ROIC %)
$0.30
$0.27
$0.23
$0.27
$0.35
Dec-14 Mar-15 Jun-15 Sep-15 Dec-15
Adjusted Earnings Per Share (EPS)
7,025 5,952 5,566
6,317 6,763
5.8%
6.4% 6.4% 6.3%6.7%
Dec-14 Mar-15 Jun-15 Sep-15 Dec-15
Adj. Gross Margin
Adjusted Operating Income ($ in millions)
207
178159
196
2362.9%
3.0%2.9%
3.1%
3.5%
Dec-14 Mar-15 Jun-15 Sep-15 Dec-15
% Revenue
Revenue & Adjusted Gross Margin($ in millions)

62
Quarterly Operating Performance by Business Group
Target Adjusted
Operating Margin Range
OP$ OP%
$83M 8.1%
$49M 4.1%
$76M 3.1%
$49M 2.4%
Corporate Services & Other1 ($21M)
Total $236M 3.5%
HRS
IEI
CTG
INS
2% 3%
4%
5%
6%
7%
4%3%
1. Corporate services and other related to unallocated cost
Please refer to the Investor Relations section of our website which contain the reconciliation of the non-GAAP financial measures to the most directly comparable
GAAP measures
Q3 FY16(Dec-15)
Improved utilization and successful new ramps
Driving a richer sketch-to-scale engagement model
Strong execution across both Auto and Medical
Improved yields, productivity, and NEXTracker ramp
37%
18%15%
30%33%
16%13%
38%
63
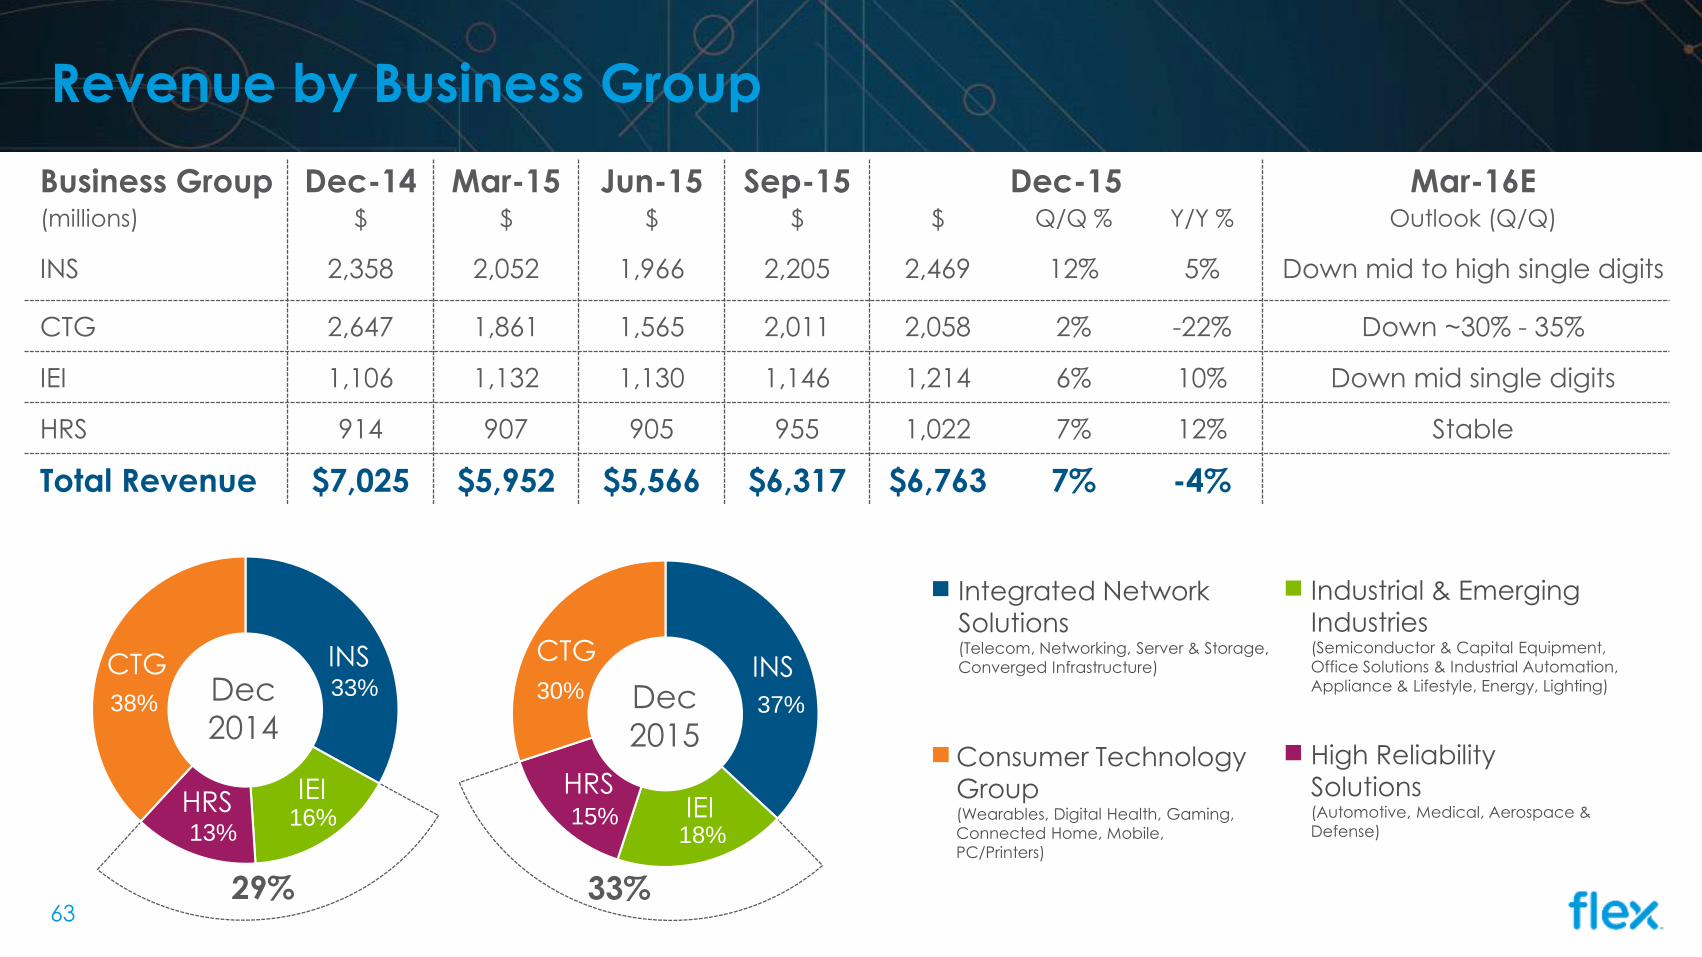
Revenue by Business Group
HRSIEI
CTGINS
Dec
2015
Integrated Network
Solutions(Telecom, Networking, Server & Storage,
Converged Infrastructure)
Consumer Technology
Group(Wearables, Digital Health, Gaming,
Connected Home, Mobile,
PC/Printers)
Industrial & Emerging
Industries(Semiconductor & Capital Equipment,
Office Solutions & Industrial Automation,
Appliance & Lifestyle, Energy, Lighting)
High Reliability
Solutions(Automotive, Medical, Aerospace &
Defense)
Dec
2014
HRS IEI
CTG INS
Business Group Dec-14 Mar-15 Jun-15 Sep-15 Dec-15 Mar-16E(millions) $ $ $ $ $ Q/Q % Y/Y % Outlook (Q/Q)
INS 2,358 2,052 1,966 2,205 2,469 12% 5% Down mid to high single digits
CTG 2,647 1,861 1,565 2,011 2,058 2% -22% Down ~30% - 35%
IEI 1,106 1,132 1,130 1,146 1,214 6% 10% Down mid single digits
HRS 914 907 905 955 1,022 7% 12% Stable
Total Revenue $7,025 $5,952 $5,566 $6,317 $6,763 7% -4%
33%29%

64
March Quarter Guidance – Q4 FY2016
Other Information:
Adjusted SG&A Expense ~$215 million
Interest & Other Expense ~$25 million
Adjusted Income Tax Rate 8-10% range
GAAP EPS $0.18 - $0.24
WASO ~558 million shares
($ in millions, except per share amounts)
Adjusted operating income excludes approximately $21 million for stock based compensation, of which approximately $18 million is excluded from adjusted SG&A.
GAAP EPS reflects approximately $0.07 for intangible amortization and stock-based compensation expense.
$5,500 - $6,100Revenue
$175 - $215Adjusted Operating Income
$0.25 - $0.31Adjusted Earnings Per Share
For more information contact:
Kevin Kessel
VP, Investor Relations
(408) 576 - 7985
Or visit us at investors.flextronics.com
Creating a smarter, more connected world
Mary Lee
Sr. Manager, Investor Relations
(408) 576 - 5167