
Fletcher Building Annual Report 2010 – The year in full ... · Fletcher Building Annual Report...
92
Fletcher Building Annual Report 2010 – The year in full STRENGTH THROUGH DIVERSITY
Transcript of Fletcher Building Annual Report 2010 – The year in full ... · Fletcher Building Annual Report...

Fletcher Building Annual Report 2010 – The year in full
STRENGTH THROUGH DIVERSITY

Fletcher Building Annual Report 2010

Financial review Page 30
Financial statements Page 32
You can obtain an electronic copy of the Annual Report by going to the following website address: fletcherbuilding.com/reports/10This report is dated 17 September 2010 and is signed on behalf of the board of Fletcher Building Limited:
Annual shareholders’ meeting
The Fletcher Building 2010 annual shareholders’ meeting is to be held at 10.30 am on Wednesday 17 November 2010 at Eden Park, Mt Eden, Auckland, New Zealand. The notice of meeting, voting form and RSVP card will be mailed to shareholders closer to that time.
Ralph Waters Chairman of Directors
Jonathan Ling Managing Director
Fletcher Building’s strength lies in its diversity.
Through a vertically integrated value chain, our 40 businesses deliver a diverse range of building products and construction materials.
From our strong Australasian base, we operate in a diverse range of geographies – Asia, the Americas, Europe, and the South Pacific.
We harness the skills and experience of a diverse international workforce of 16,000, drawing them together through a culture that encourages people to help each other succeed, and achieve excellence.
Our diversity has allowed us to find opportunities despite the subdued global economic climate. In a world of continuing uncertainty, that diversity means we are well placed to respond to emerging areas of growth.
Strength through diversity
Chief Executive’s review Page 5
Board of Directors Page 18
Environment and Society Page 14
Corporate governance Page 20
Chairman’s review Page 3
Highlights Page 2
Remuneration report Page 23
Audit report Page 73
Trend statement Page 74
Regulatory disclosures Page 75
Investor information Page 86
Directory Page 87
Divisional reviews Page 8
Building Products
Distribution
Infrastructure
Laminates & Panels Laminex Formica
Steel

Fletcher Building Annual Report 2010
Looking at 2010
Highlights
$301mNet earnings after tax before unusual items, on revenues of $6.8 billion. Operating earnings (earnings before interest and tax) before unusual items were $521 million compared with $558 million in the previous year.
$522mCashflow from operations. Ongoing focus on tight working capital management and a reduction in capital expenditure resulted in strong operating cashflow from operations.
53%Reduction in Total Recordable Injury Frequency Rate per million hours (TRIFR) which this year was 11.24 compared with 23.79 in 2009. Lost time injury frequency rate (LTIFR) was 3.42, compared with 5.81 in 2009.
29c per shareDividend for the 2010 financial year, with a final dividend of 15 cents per share.

3
Chairman’s review
Read further:Financial Review pages 30-31
Ralph WatersChairman
Looking forward
Part of this stems from the geographic and business diversification that has been a strategic priority since 2001. It is also due to the restructuring initiatives that we undertook in 2009. As a result, we have come through the economic downturn with our businesses leaner and more efficient, and poised to capitalise on improving market conditions when they return.
Operating performanceFor the year ended 30 June 2010, the group recorded net earnings before unusual items of $301 million. The result compares with $314 million recorded in the previous year.
Operating earnings (earnings before interest and tax) before unusual items were $521 million compared with $558 million in the previous year. Cashflow from operations was $522 million compared with $533 million in 2009.
The result was driven by improved performances within a number of business units as a result of the cost reduction initiatives implemented during the year, and improved trading conditions in the New Zealand and Australian residential housing markets. Operating earnings in the Laminates & Panels division almost doubled to $141 million. The Steel division had lower operating earnings following a record earnings result in the prior year, and reduced concrete product volumes adversely impacted the Infrastructure division’s earnings.
While the underlying earnings figure is in line with last year’s, the composition is quite different, reflecting the significant changes we have seen in our markets in the past year. Residential markets in Australia and New Zealand have shown modest recovery, but they remained weak in Europe and North America. Government funded infrastructure spending in New Zealand and Australia has continued to underpin results, but commercial construction activity in most of our key markets remained subdued. The result is therefore a strong one in the context of these mixed market conditions.
You will find details of the performance of each of the businesses in the divisional reviews on the following pages.
Shareholder returnsEarnings per share excluding unusual items were 49.7 cents, compared with 59.7 cents in the previous year.
Total returns to shareholders were 24.5 percent, compared with 14.1 percent in the prior year, with strong share price appreciation during that period. Return on funds employed improved to 12.7 percent from 11.9 percent in the prior year, excluding unusual items.
Unusual itemsAs indicated in June, an unusual tax expense of NZ$29 million was incurred in the financial results for the year ended 30 June 2010. The unusual expense arises from the significant taxation changes announced by the New Zealand Government in its budget in May 2010. These include the elimination of depreciation on buildings for tax purposes, and a reduction in the corporate taxation rate from 30 percent to 28 percent, both with effect from 1 July 2011.
Based on a review of our future tax obligations in the light of these changes, we have determined that we need to increase the provision for deferred tax by NZ$29 million. The increased provision is a one-off accounting entry that is non-cash in nature and it has not affected underlying profitability or the dividend payout in respect of the 2010 financial year. Whilst the recognition of the deferred tax liability is non-cash in nature, the elimination of the tax deductibility on buildings will result in a small increase in future income tax payments.
DividendA final dividend of 15.0 cents per share will be paid on 20 October 2010, bringing the total dividend for the year to 29 cents per share. It remains the board’s intention to maintain a steady and ever increasing dividend, in line with the group’s earnings performance.
For New Zealand resident shareholders, the dividend has been imputed at a 30 percent tax rate to the extent of 3.2143 cents per share. The final dividend is not franked for Australian tax purposes. To maximise the value of available franking credits the group’s policy is to accumulate them and attach these to dividends only when the franking percentage is at or near to 100 percent, rather than spreading them over every dividend.
In view of the group’s strong balance sheet and low level of gearing at present, the dividend reinvestment plan will not be operative for this dividend payment.
Balance sheetWe have continued to maintain the prudent balance sheet parameters that we established last year with the equity raising. As such, our gearing, net debt as a percentage of net debt plus equity, was 26.8 percent. This is well below our target range of 40 to 50 percent. The board feels that is prudent to maintain a low gearing level while there continues to be uncertainty in the international banking environment and where the availability of funds at reasonable cost cannot be wholly assured.
The past year has been a challenging one because of the impacts of the global financial crisis on most of our major markets. Yet Fletcher Building has performed well in these conditions.
View the Chairman’s review online:fletcherbuilding.com/10/chairman

Fletcher Building Annual Report 2010
Chairman’s review
PeopleOur people have worked exceptionally hard in the past year in the face of a difficult and demanding economic climate. The fact that the group has survived the economic downturn in such good shape has been due in no small measure to the efforts and focus of our people.
Last year saw significant restructuring undertaken across the business, with significant reductions in our total employee numbers. As economic conditions have improved we have seen staff numbers stabilise. Against this difficult backdrop, it has been especially pleasing to witness the dedication and resourcefulness of our people and their commitment to helping the group meet or exceed its financial and operation goals.
Also pleasing has been the progress we have made in further developing our senior managers. This has been part of an ongoing programme designed to ensure that Fletcher Building has the appropriate talent pool within its ranks to succeed and lead in the future.
Board changesAt the end of March, Roderick Deane retired as Chairman of Fletcher Building. Roderick was the inaugural chairman of Fletcher Building and made a significant contribution to the growth of the company. Roderick, who joined the board of Fletcher Challenge in 1994, successfully steered the Fletcher group of companies through the restructuring a decade ago, and was instrumental in the creation of Fletcher Building. Under Roderick‘s leadership Fletcher Building has grown to become the largest building materials company in Australasia. On behalf of the board I would like to extend here our sincerest appreciation and best wishes to Roderick for the enormous contribution he made to Fletcher Building in his long association with the company.
Further changes were announced during the year to the composition of the board, in accordance with the company’s succession arrangements for directors.
Mr Tony Carter was appointed to the board as an independent director with effect from 1 September 2010. Tony will bring an important perspective to the board with his extensive background in distribution and retailing and his familiarity with the broader New Zealand business environment, and we look forward to working with him.
Also during the year, we announced that Sir Dryden Spring will retire from the board with effect from 30 September 2010. I would like to record here the board’s thanks to Sir Dryden for his involvement with the board of Fletcher Building. Sir Dryden first joined the board of Fletcher Challenge in 1999, and helped to oversee the evolution of Fletcher Building. He has made a significant contribution as a director to the growth of Fletcher Building through the quality of his strategic insights and operational experience, and as Chairman of the Remuneration Committee.
OutlookCaution is required in formulating an outlook for the current year. With the effects of the global financial crisis still being felt around the world, there continues to be uncertainty around the timing and pace of a recovery in economic activity.
In New Zealand, the residential market is expected to continue a slow and gradual recovery in new building activity, albeit remaining below mid-cycle levels. Removal of the present monetary policy stimulus is expected to constrain the rate of growth in new housing starts. Commercial construction activity is expected to remain at very low levels throughout 2011.
The volume of government funded infrastructure projects is expected to reduce in 2011, with a number of large projects scheduled for completion later in the current calendar year. A rebound is anticipated in the 2012 year with several significant new projects scheduled to commence.
In Australia, the rebound in residential activity seen in 2010 is expected to continue in the current year. Government infrastructure spending should remain strong, but this will only partially offset weakness in the commercial construction sector. The Australian insulation business will need to work through high inventory levels following the abrupt termination of the Australian government insulation scheme, but with improved manufacturing efficiency it is strongly positioned once that process has been completed.
Trading conditions in both North America and Europe continue to remain uncertain and no recovery of significance is expected in these markets in the near term. Markets in China, South-East Asia and Taiwan are exhibiting growth which is expected to continue throughout the current year.
Despite these mixed market conditions, and the risk of further economic deterioration in some parts of the world, the group is focused on growing earnings and continuing to generate strong returns to shareholders. With our robust balance sheet and excellent portfolio of businesses, the group is very well placed to deliver on this.

5
The benefits of diversity
Chief Executive’s review
View the Chief Executive’s results presentation online: fletcherbuilding.com/10/chiefexecutive
Jonathan Ling Chief Executive
Volumes in most of our businesses have been lower but we have seen excellent outcomes from the cost reduction initiatives we have undertaken. This has ensured that we are appropriately scaled in terms of our manufacturing capacity to optimise earnings with lower activity levels. This, coupled with our strong balance sheet, positions us well for the future, and will allow us to pursue further growth opportunities.
A summary of the performance of each of our business divisions is set out below. Unless otherwise stated, the divisional commentaries exclude unusual items from the prior year’s results.
Building Products recorded eight percent growth in operating earnings to $114 million. Key factors affecting earnings were the benefits of cost rationalisation and restructuring, a strengthening of residential construction markets, the impact of the New Zealand government insulation scheme, and reduced raw material prices in the roof tiles business. These were partially offset by the impact of the termination of the Australian insulation scheme, and weakness in the New Zealand non-residential construction sector.
PlaceMakers’ sales were in line with the prior year, but with a noticeable increase in residential building activity in New Zealand emerging in the latter part of the year. Operating earnings were 28 percent higher at $38 million driven by reduced costs and steady margins.
A 13 percent increase in New Zealand residential building consents from 2009 assisted the results.
The building materials market has, however, continued to be impacted by the low level of residential building consents and the decline in non-residential consents.
Total sales for Infrastructure were down two percent with lower sales for most construction materials products in New Zealand and Australia; however, billings in the construction business were
up on last year. Operating earnings declined by $39 million to $164 million as market activity weakened. In New Zealand, the significant decline in commercial construction activity and recent completion of a number of large infrastructure projects were only partially mitigated by an increase in residential construction activity. Operating earnings at Golden Bay Cement were down 40 percent due to reduced volumes. In Australia, the pipeline products business experienced weaker demand for most products while the quarry business recorded a solid result despite a noticeable slowdown in building activity.
The backlog of construction work is currently $930 million, with approximately $450 million worth of further work where the group is either the preferred bidder or in final contractual negotiations. The backlog at the same period last year was $1.1 billion, and the decline is due to the completion of several large projects and fewer major contracts secured during the year. Government funded work remains strong, however, and currently accounts for most of our construction backlog.
Earnings from Fletcher Residential increased by $6 million to $18 million with higher average margins due to a favourable sales mix and stronger demand for houses in Auckland.
Laminex’s operating earnings were $107 million for the year which included $16 million of one-off gains from the closure and sale of the Welshpool and Kumeu sites. Australian domestic revenues were marginally higher, driven by improvements in the new housing and alterations and additions sectors, while conditions in the commercial sector remained constrained. Partly offsetting this was a decline in Australian export sales due to the closure of the medium density fibreboard facility in Western Australia, and tight conditions in the commercial market. New Zealand revenues were below the prior year due to the continued slowdown in the commercial sector.
Formica’s operating performance for the current year improved substantially over the previous year. Operating earnings were $34 million, compared with $18 million in the prior year, including $7 million of redundancy costs. Volumes in North America were down by a further five percent on the prior year, and while activity in the new housing sector showed some recovery in the USA, this was from a low base. Commercial markets in North America continued to contract during the year. The main markets in Northern Europe showed some improvement, Central Europe and the UK remained relatively flat, but Southern Europe including Spain was lower. Markets in Asia have remained solid with volumes up by six percent on last year. A moderate pick up
This year’s result again demonstrates the benefit of the Fletcher Building group’s diversity. While conditions in our markets have varied widely, and the effects of the global financial crisis have been felt around the world, we have been able to deliver a strong result.

Fletcher Building Annual Report 2010
in volumes in China and Thailand was achieved after last year’s slowing in activity levels, while conditions in Taiwan and other Asian markets have also been firm.
Steel’s operating earnings for the year were $82 million, which was 47 percent lower than the prior year’s record levels. Prior year earnings were driven by historically high steel prices and very strong demand in the first half of the year. The global financial crisis subsequently resulted in the steel industry reducing global inventories in response to lower demand. Accordingly, 2010 was a difficult operating environment characterised by uncertain demand and declining prices.
Financial positionThe balance sheet continued to be strengthened during the year with positive operating cashflows used to further reduce debt levels. Our gearing continued to reduce, down from 31 percent to 27 percent.
The group had total available funding of $2,349 million as at 30 June 2010, of which $1,130 million was undrawn. Debt requiring refinancing within the next 12 months is very low at approximately $116 million.
Interest coverage for the year was 4.9 times and represents a further improvement on the 4.0 times for the prior year.
CashflowCashflow from operations was $522 million compared with $533 million in the prior year. The continued strong positive cashflow was driven by our ongoing focus on tight working capital management and a reduction in capital expenditure. We expect that cashflow from operations will be negatively impacted by increasing inventory and debtor levels as sustained market growth emerges.
Capital expenditure for the year was $191 million compared with $289 million in the prior year. Of this, $137 million related to ‘stay-in-business’ capital expenditure, and $54 million to new growth initiatives. Significant projects included completion of Golden Bay Cement’s new cement storage facility in Auckland; the upgrading of the Laminex MDF plant in Queensland, and the Fletcher Insulation plant investment in Victoria. Divestments for the year totalled $38 million compared with $52 million in the prior year.
PeopleAs at 30 June 2010, Fletcher Building employed some 16,000 people in business units worldwide. This number was similar to that recorded at the December half year, and is indicative of the fact that most of the restructuring work has now been completed and the workforce stabilised. Regrettably, redundancies were necessary in Fletcher Insulation following the sudden termination of the Australian Government’s insulation scheme in February 2010.
Despite the difficult economic conditions of the past year, all learning and development programmes were maintained. Through their capability, performance and diversity our employees differentiate our group,
deliver value to our shareholders, customers and communities and are the foundation of the group’s future success.
Health and safetyWe have a strong commitment to health and safety. This commitment starts at the top, with an executive-led Health and Safety Council and senior management participation in safety education and training programmes. The group has a vision of zero harm based on the principle that all accidents are preventable.
As a result, significant progress has been made in the last year. The group’s primary performance indicator for safety, Total Recordable Injury Frequency Rate per million hours (TRIFR) defines recordable injuries as both lost time and medical treatment injuries. In the last year, this rate has dropped to 11.24, from 23.79 in 2009. Its Lost Time Injury Frequency Rate (LTIFR) was 3.42, compared to 5.81 the year prior.
This year, we have also introduced a wellbeing programme to streamline initiatives across the group and ensure it is an important part of each business unit’s health and safety plan.
Despite our progress, fatalities and injuries still occur. An employee of Fletcher Construction (South Pacific) lost his life in the last year at a construction site in Apia, Samoa and is a tragic reminder that we must remain proactive in our quest for zero harm.
Environmental sustainability and climate changeThe New Zealand government introduced its Emissions Trading Scheme on 1 July 2010 and as the group’s cement and steel manufacturing operations emit process CO2 they are directly affected. These operations are emissions-intensive, trade-exposed industries and will receive free allocation of emission units to offset these increased costs. Fletcher Building’s initiatives to reduce emissions and improve energy efficiency will also ensure the costs are further reduced.
Fletcher Building is committed to ensuring its use of natural resources, including the emissions of CO2
from operations, products and services, are reduced.
The group has set a target to reduce its CO2 emissions in 2012 to five percent below the 2008 level on a normalised basis. By 31 December 2009, the group was two years into the five-year policy and had decreased its absolute emissions by 18 percent.
Chairman’s review
Read further:Environment, People and Health & Safety pages 14-17

7
Chief Executive’s review
StrategyThe strategy for the Fletcher Building group is centred on improving the reliability of our earnings through geographic and industry expansion to counter the effects of industry cycles. In addition, we seek to maintain and improve our internal capabilities through business transformation initiatives and growth-oriented capital expenditure, and to pursue any acquisition opportunities which meet our investment criteria.
The past two years have seen us focus on conserving cash and strengthening the group’s financial position. However, in the year ahead capital expenditure is expected to increase as we look to strongly position our businesses to capture the benefits from improved economic conditions.
Beyond stay-in-business investment, we will pursue opportunities to invest in areas of organic growth and potential acquisition opportunities where appropriate. Australasia continues to be the principal area of focus for further expansion.
The strategic priorities for each of our divisions can be summarised as follows:
For Building Products, increased focus is being given to innovation and new product development, with the goal of achieving sustained organic growth and expansion into adjacent product and service areas.
Distribution’s strategy is focused on growing market share by better servicing of the trade builder segment, and leveraging the strength of the joint-venture partner network.
Infrastructure will continue to develop organic growth opportunities where high returns are achievable in existing or adjacent product areas.
Laminates & Panels will maintain a focus on further improvements in operational performance and capability, emphasising service and product innovation especially in mature markets. Growth opportunities in Asia and other developing markets will be actively pursued.
Steel will continue to explore high-return growth opportunities. Improving the resilience of the business for the longer term remains an overarching objective.

Fletcher Building Annual Report 2010
Building Products
Divisional reviews
Chris Ellis Chief Executive, Building Products
Building Products provides building product solutions, from foundation to roof. The division’s core plasterboard, insulation and metal roof tile business streams have leading market positions and respected brands.
Building Products’ businesses include:• WinstoneWallboards,thesoleNewZealand
manufacturer of plasterboard.• FletcherInsulationinAustralia,andTasman
Insulation in New Zealand. These businesses lead the Australasian market in glasswool insulation, and own four of the six glasswool manufacturing plants in the region.
• FormanGroup,theleaderincommercialandindustrial insulation and commercial ceiling and wall systems in New Zealand, and Tasman Access Floors, a leading provider of access flooring systems in Australia.
• RoofTileGroupcomprisingAHIRoofing,withmanufacturing plants in New Zealand, Malaysia and Hungary, and Decra Roofing Systems in the USA, make Fletcher Building the leading global supplier of stone chip coated metal roof tiles.
• DVSHealthyHomesdedicatedtoimprovinghome health and comfort for New Zealanders through offering a complete range of insulation and building solutions through group businesses DVS, PinkFit, and Home&Dry Group.
Complementary businesses in the division include Tasman Sinkware in Australia which manufactures high-end sinkware, and Fletcher Aluminium which designs and manufactures aluminium window and door systems.
Performance overviewBuilding Products recorded eight percent growth in operating earnings to $114 million, up from $106 million in the previous year, while sales increased four percent to $798 million. Key factors affecting earnings were the benefits of cost rationalisation and restructuring, a strengthening of residential construction markets, the impact of the New Zealand government insulation scheme, and strong sales in the roof tiles business. These benefits were partially offset by the termination of the Australian insulation scheme, and weakness in the New Zealand non-residential construction sector.
Cashflow benefited from strong control of capital expenditure and working capital.
Operating earnings for the plasterboard business were up three percent despite lower sales. This was due to cost rationalisation undertaken in the previous period, and a strengthening of the New Zealand residential construction market in the second half.
The business also consolidated its strategic focus with the divestment of the Hong Kong based commercial interiors operation at 30 June.
Operating earnings for the insulation business were down ten percent due to the termination in February of the Australian government’s home insulation scheme. This resulted in the suspension of operations at the Sydney glasswool manufacturing plant and significant restructuring at the Melbourne plant. Consequently, restructuring charges of $18 million were incurred in the second half of the year. New Zealand glasswool volumes were stronger, driven by the New Zealand government’s insulation scheme. The year also saw the consolidation of various New Zealand home performance initiatives under the Healthy Home Group banner. The commercial insulation, and ceiling and wall systems businesses were affected by further weakening of conditions in the New Zealand non-residential construction sector.
Operating earnings for the roof tiles business were up 59 percent due to improved raw material prices, strong volumes into Africa, improved volumes in New Zealand and the receipt of final insurance proceeds from the fire at the United States plant in the previous year. These were partially offset by the impact of a strong New Zealand dollar on export returns and weak volumes in Europe and Japan. The new Hungarian plant continues to operate to expectations, although weaker European volumes reduced manufacturing efficiencies. The business undertook significant global restructuring and consolidation during the period.
Looking aheadSignificant cost rationalisation across the division as markets turned down, together with the major upgrade undertaken at the Melbourne glasswool manufacturing plant during the period, has left the division with strong operating leverage. This was an advantage as economic activity started to improve during the year. This strong base is supported with a sharpened strategic focus and an emphasis on new product development. The combination of these factors has positioned the division to achieve further improvement as key residential markets continue to turn up.
A key focus of the New Zealand insulation businesses will be to continue to work with New Zealand’s Energy Efficiency and Conservation Authority, EECA, and respond to the opportunity presented by the New Zealand government insulation scheme, and to public interest in sustainability and energy efficiency through the DVS Healthy Home Group. Over the course of the coming year the Australian insulation business will need to work through a large inventory of batts left over from the termination of the Australian government insulation scheme, but with an improved manufacturing footprint it is strongly positioned once that process has been completed.
Case study
From the ground up in Africa
Fletcher Building’s Roof Tile Group has established its brands in sub-Saharan Africa over the last ten years, as emerging middle classes and fast growing commercial sectors have fuelled building activity. The quality of Decra® and Gerard® roofing products has been promoted, and the brands have been positioned for the long term with the development of strong distribution channels and community relationships.
That decade of investment gave the Roof Tile Group a strong foundation from which to respond when economic growth slowed as African economies were hit by the global financial crisis.
The Roof Tile Group responded to shaky markets with competitively packaged offers enabling property developers to progress approved projects and win new business. It encouraged developers and home owners alike to see investment in quality branded roofing products as a way of adding value to their buildings, increasing the overall saleability of properties at a time of increased business risk.
The strategy paid off. Sales of Roof Tile Group’s brands in its African markets increased by more than 40 percent over the year.
While economic growth in sub-Saharan economies slowed during the global financial crisis from around five percent per annum to just two percent, growth of six to seven percent is predicted for the next two years. The Roof Tile Group is ready for growth, established as a respected company that delivers for its customers whatever the economic weather.
More online: fletcherbuilding.com/divisions/building-products

9
Distribution
More online: fletcherbuilding.com/ divisions/distribution
John Beveridge Chief Executive, Distribution
Fletcher Building’s distribution business, PlaceMakers, is the premier supplier of building materials to New Zealand’s commercial and residential construction markets.
PlaceMakers leads the market in its core trade segments and provides an important distribution channel for Fletcher Building products. There are 62 stores, most of which are operated in partnership with local owners. Frame and truss manufacturing is a key feature of the division’s offering.
PlaceMakers works closely with joint venture operators and key suppliers to deliver value to customers through credible trade products, and great services through the quality of its employees and its customer relationships. These are key points of difference underpinning PlaceMakers competitive success.
Performance overviewPlaceMakers sales were in line with the prior year, but with increased residential building activity in New Zealand emerging in the latter part of the year. Operating earnings were 27 percent higher at $38 million driven by reduced costs and steady margins.
A 13 percent increase in New Zealand residential building consents from 2009 assisted the results. The building materials market has, however, continued to be affected by the low level of residential building consents, and the decline in non-residential consents. Forward indicators for commercial building materials markets have been slowing, while those for residential have improved in metropolitan areas but remain weak in rural and coastal areas.
The competitive landscape has seen most industry participants continuing to compete aggressively on price and margin to retain share.
Pressure on the trade segment continues, but PlaceMakers’ market share has been maintained with the joint-venture ownership model proving resilient. An active margin management programme also mitigated pricing pressure.
The trade and serious DIY segments remain the core business. Successful marketing and promotional campaigns have brought a fresh focus and added customer appeal to our ‘Know How Can Do’ brand.
The growth in operating earnings was attributable in part to a five percent reduction in employee and facility costs, and improved freight cost recovery.
Working capital increased by three percent mainly as a result of inventory price increases, but free cashflow was 43 percent higher than the prior years. Cashflow management remained a primary focus.
This helped Distribution achieve an annualised return of 27 percent on funds employed.
Enhancements to delivery management improved freight cost recovery. Productivity gains were achieved in frame and truss manufacturing, a core trade product, through improvements to the plant network, production scheduling, quality control and plant layout. Capital expenditure was limited during the year principally to store maintenance and high pay back projects. Planning for redevelopment and relocation of existing stores is underway and an increase in activity is planned for 2011 with a number of store refits and relocations. This will extend our lead in Trade and serious DIY markets.
The transition to a new leadership team is complete. Key appointments from within the wider industry have been made, including the CEO, National Sales, HR, Supply Chain and IT general managers. Twelve new branch operators have been appointed who will also help drive performance and growth.
Health and safety remains a lead engagement strategy with a 39 percent reduction in the TRIFR rate in the 2010 year. New training, auditing and performance management will support this strategy in the year ahead. Renewed focus is also being given to staff development and talent management as we move into thinking about growth and how to best capture the benefits of improving market conditions. New talent and performance management frameworks have been established.
Looking aheadImproved trade customer services to grow market share will be driven off PlaceMakers strong base of trade relationship skills, and product and industry knowledge. Training and development will be expanded via our ‘Know How’ Academy and related programmes. Strategies will be focused on partnership and growth. The existing collaboration with Joint Venture partners on strategy development and execution will be expanded.
DIY customers will be advantaged by the relaunched Know How loyalty card and major promotional programmes. Value-added initiatives for trade customers around installation solutions, and project and job planning, will significantly improve the overall attractiveness of PlaceMakers to this market.
Improvements to supply chain and logistics effectiveness are also a priority.
Case study
Know How for the DIY market
DIY is an important complementary market to PlaceMaker’s core building trade business. In recognition of this, PlaceMakers launched its Know How loyalty card in 2005, which offered DIY customers bonus vouchers to encourage repeat store visits. The card, and ‘Know How, Can Do’ advertising, has helped position PlaceMakers as a household brand.
PlaceMakers’ commitment to DIYers has paid off. While trade sales softened over 2008 and 2009, sales to Know How Card members remained at similar levels to previous years. But PlaceMakers is not taking its DIY customers for granted. Competition for the DIY dollar is strong, and customers need to be engaged online as well as in-store.
A review of the Know How Card loyalty programme has seen it relaunched with added features and benefits. Members now have options such as bonus vouchers being delivered by email. Higher value customers are being recognised through the addition of two premium tiers to the programme, DIY PLUS and DIY PRO. These customers receive exclusive offers and invitations to branch events designed specifically for them. Competitive advantage for PlaceMakers over other DIY retailers is supported with a platform of tools for powerful and effective direct marketing.
The Know How Card relaunch is a ‘can do’ response to securing an important market at a challenging time.
Divisional reviews

Fletcher Building Annual Report 2010
Divisional reviews
More online: fletcherbuilding.com/ divisions/infrastructure
A record of delivery
Case study
Mark BinnsChief Executive, Infrastructure
When private sector construction around the world dried up with the global financial crisis, new opportunities emerged as governments increased investment in infrastructure to provide economic stimulus. In New Zealand, Fletcher Construction’s reputation has helped the company secure involvement in many of the country’s recent infrastructure developments. Through a range of different contractual models, Fletcher is involved in construction of the Manukau Harbour crossing, Auckland’s Victoria Park tunnel, the McKay’s Crossing to Peka Peka expressway north of Wellington, the redevelopment of Eden Park for the Rugby World Cup, and new facilities at Mt Eden prison.
The scale and significance of such investment is increasingly encouraging contractor-selection based on non-price attributes. While many companies compete for these contracts, Fletcher Construction’s bids are backed with a strong balance sheet and a record of delivery of some of the country’s largest and most complex structures, on time and on budget. Government and delivery partners are also attracted by the company’s stable experienced management, its investment in areas such as health and safety, and its ‘pride of place’ culture anchored in 100 years of tradition. These attributes build confidence that the billions of dollars of public money being invested are in safe hands.
The Infrastructure division is a vertically integrated business supplying aggregates, cement, readymix concrete and a range of concrete products in New Zealand; and concrete pipeline products and a range of aggregate sands throughout Australia. It is the largest construction contractor and residential builder in New Zealand.
Performance overviewTotal sales for Infrastructure were down two percent with lower sales for most construction materials products in New Zealand and Australia; however, billings in the construction business were up on last year. Operating earnings declined by $39 million to $164 million as market activity weakened. In New Zealand, the significant decline in private commercial construction activity and recent completion of a number of large infrastructure projects were only partially mitigated by an increase in residential construction activity.
Operating earnings from the New Zealand and Australian concrete businesses declined by $37 million to $105 million. Sales volumes of most products in New Zealand were significantly below last year. Cost savings could not mitigate the impact of the substantial declines in volumes and an increasingly competitive environment. In Australia, concrete sleeper and pipe related volumes were down, and the market for sand in New South Wales was more difficult than anticipated. Construction activity remained strong but earnings declined by $4 million while property and residential operations improved by $2 million.
Operating earnings from the cement business were $12 million lower primarily due to reduced volumes. In New Zealand, volumes were nine percent lower and, while export sales volumes and prices increased, export margins remained low. Domestic prices were flat while production and distribution unit costs increased. Manufacturing performance was excellent with the best continuous run time since the upgrade was completed. The new cement storage facilities on the Auckland waterfront were commissioned in December 2009.
Aggregates sales volumes were 16 percent lower than last year and 31 percent below peak cycle volumes. The business continued to make significant progress in lowering its costs as the market deteriorated but earnings declined by $5 million. A new construction and demolition waste recycling facility in Auckland will be commissioned in October 2010.
Readymix and masonry operating earnings were 26 percent lower. Sales volumes of concrete dropped by ten percent as a number of large infrastructure jobs were completed in the year. Masonry sales volumes were similar to the previous year due to the increased volumes as a result of the Stevenson masonry business acquisition in March 2009.
The concrete pipe and precast markets softened throughout the year resulting in overall earnings
27 percent below last year. Concrete product sales volumes (pipe and precast products) declined by ten percent in the year. Overall margins were lower, due to mix, competitive pricing and slightly higher input costs. Some recovery was seen in the latter part of the year, and forward orders are seven percent higher than last year although overall margins are lower.
In Australia, the pipeline and quarry businesses performed well, in the economic environment, with combined operating earnings of $52 million compared with $64 million in 2009. The pipeline products business experienced weaker demand for most products, with operating conditions being the most difficult since the business was acquired in 2005. Orders on hand are 16 percent lower than at the same time last year. The quarry business recorded a solid result despite a noticeable slowdown in building activity and particularly weak demand in New South Wales.
Construction’s operating earnings were $39 million compared to $43 million in the previous year. The backlog of construction work is currently $930 million. The group is either the preferred bidder or in final contractual negotiations for approximately $450 million worth of further work. The backlog at the same period last year was $1.1 billion, and the decline is due to the completion of several large projects and fewer major contracts secured during the year. Government commitment to infrastructure investment should provide opportunities across the New Zealand-based operations but the lead time is such that conditions in the construction market will remain challenging in the short term.
Earnings from property related activities include those from quarry end use and the residential business. Earnings from Fletcher Residential increased by $6 million to $18 million with higher average margins due to a favourable sales mix and stronger demand in Auckland. Property sales earned $2 million compared to $6 million last year and market conditions are not expected to improve materially in 2011.
Looking aheadThe division continues to experience very weak demand in New Zealand and the economic outlook is uncertain in the short term. The Australian businesses expect underlying demand to remain stable. There has been significant cost rationalisation over the last two years and further business improvement initiatives will be implemented this year. These will mitigate, to some extent, the impact of any further downturn in activity should that eventuate. The division has significant operating leverage which places it in a very good position when market conditions improve.
In the meantime the division will also continue to explore high-returning organic growth initiatives. In August, Australian Construction Products was acquired, which is a market leader in the supply of road barriers and associated roading products in Australia.
Infrastructure

11
Laminates & Panels
More online: fletcherbuilding.com/ divisions/laminates
Fundamental rethink, exponential profit growth
Case studyDivisional reviews
The Laminates & Panels division comprises the Laminex Group and Formica Group which manufacture, market and distribute a range of decorative and durable laminates and panels. These businesses have strong international brand profiles and leading market positions. Operating earnings for Laminates & Panels were $141 million, compared with $74 million in the previous year. Sales were 7 percent lower at $1,930 million.
LaminexThe Laminex Group is the leading Australasian manufacturer, marketer and distributor of decorative surface laminates, component products, particleboard and medium density fibreboard (MDF).
Performance overviewLaminex’s operating earnings were $107 million for the year which included $16 million of one-off gains from the closure and sale of the Welshpool and Kumeu sites. Operating earnings excluding these one-off items were $91 million, up 63 percent compared with the prior year.
Australian domestic revenues were marginally higher, driven by improvements in the new housing, and alterations and additions sectors, while conditions in the commercial sector remained constrained. Australian export sales declined year on year as a result of the closure of the Welshpool MDF facility in Western Australia, which more than offset the increase in domestic sales. The tight conditions in the commercial market saw a higher proportion of commodity products sold into the general market.
New Zealand revenues were below the prior year due to low demand continuing in the commercial sector.
Tighter conditions in Australia and the contraction in the New Zealand commercial market lead to intensified competition, with prices either flat or slightly lower. Programmes addressing customer cost-to-serve and product profitability were undertaken during the year. These and other cost saving initiatives have resulted in a reduction in employee numbers and, combined with a reduction in resin costs, have more than offset the impact of the lower revenue and pricing pressure.
The closures of the plant in Welshpool, and the particleboard facility at Kumeu in Auckland have rationalised the manufacturing footprint, reducing costs and better aligning capacity with domestic demand. Laminex is now well placed to maintain and grow market share in an upturn.
Manufacturing facilities performed very well during the year. All sites are now running at or around full capacity with the exception of the high pressure laminate (HPL) facility in Melbourne. A new short cycle laminating line is to be installed, and warehousing and logistics capability improved at the MDF facility in Queensland, with commissioning due late 2011.
Laminex continued to undertake new product initiatives during the year with 25 new product launches and range updates.
Laminex is also continuing to expand the breadth of its Formica range in Australia and New Zealand, which includes releasing 15 new decors and introducing Formica Colourcore and Tightform products into the market. Laminex has also released a new gloss low pressure melamine (LPM) Formica and Laminex range and relaunched its EssaStone range.
Looking aheadThe business continues to see weak demand in New Zealand with continued price and margin pressures. In Australia, the housing and alterations and additions sectors are forecast to improve modestly but the commercial sector is continuing to decline.
Laminex entered the financial year planning to grow profit exponentially after three external shocks had wiped over $55 million off the bottom line in the previous year. Disruption to the company’s energy supplies from the Varanus Island fire was a one-off event, but the global financial crisis, and sharp increases in commodity prices required a fundamental rethink of the business. Laminex’s business revitalisation programme, Reset, was created to position Laminex to make money even if the reduction in market demand lasted for years, while maintaining the company’s capacity to respond quickly when markets recovered.
Reset enabled important strategic and operational choices to be made. A decision was made to focus on valuable, strategically important domestic markets rather than low margin export markets. Customer profitability reviews saw Laminex take some simple steps to increase profitability, such as simplifying deliveries. Laminex reduced the number of transport companies it used, and achieved more competitive pricing from the remaining suppliers. A similar approach to input commodity suppliers saw reductions in costs, such as paper and resin.
The impact was substantial. Margin optimisation activities alone delivered around $10 million to the bottom line, and procurement initiatives saw the cost of raw materials reduce $22 million. In total, Reset initiatives delivered a $44 million benefit.
David WorleyChief Executive, Laminates & Panels – Laminex

Fletcher Building Annual Report 2010
More online: fletcherbuilding.com/ divisions/laminates
Divisional reviews
A luxury look at a fraction of the price
Formica
Formica Corporation manufactures, and distributes high pressure decorative surface laminates, in three major regions, namely North America, Europe and Asia. Its main geographic markets within those regions are the USA, Canada and Mexico in North America, the UK, Spain, France, the Nordic regions and the Benelux countries in Europe, and Taiwan, China and Thailand in Asia.
A significant proportion of sales are through the commercial sector, including retail and office fit outs, schools, hospitals and other developments. Formica also has a high exposure to both new housing and renovations. The brand is recognised and respected globally and in countries in which it has manufacturing facilities Formica either leads the market or holds the second largest share.
Performance overviewFormica’s operating performance for the current year improved substantially over last year largely as a result of continuing operational improvements and efficiency gains in all key areas of the business.
Operating earnings were $34 million, compared with $18 million in the prior year. The result included $7 million of redundancy costs. Sales were 13 percent lower, although this was due to the relative changes in the value of the New Zealand dollar versus trading currencies. In local currencies sales were down by only three percent on last year.
Market conditions however varied significantly across the world. Volumes in North America were down by five percent on the prior year with continued depressed levels of demand. While activity in the new housing sector has shown some recovery in the USA, this was from a low base and had minimal impact on the business. Commercial markets in North America, and to a lesser extent Europe, continued to contract during the year and in both these regions the business has a higher dependency on commercial than residential activity.
Conditions in Europe have been less variable declining by a further two percent over last year. The main markets in Northern Europe showed some improvement, Central Europe and the UK remained relatively flat. Southern Europe, including Spain, was lower. Markets in Asia have remained solid with volumes up by six percent on last year. A moderate pick up in volumes in China and Thailand was achieved after last year’s slowing in activity levels, while conditions in Taiwan and other Asian markets have also been firm.
During the year Formica undertook an extensive rationalisation of its product range. Low volume and low margin products were eliminated, and the product range was consolidated across the three regions. This enabled the business to better leverage its scale in purchasing, with larger tonnages of raw material paper able to be procured at lower prices.
Initiatives to consolidate logistics and freight providers were also undertaken.
Operations at the main manufacturing and distribution facilities, particularly in North America, continued to improve. Further reductions in manufacturing scrap rates, increased machine utilisation, and reductions in fixed factory operating costs were achieved.
Service levels generally improved across all regions and as a result Formica was able to increase market shares in some of its larger markets while maintaining share in all other significant markets.
Product prices were subject to competitive pressure, but initiatives aimed at improving service, and new product innovations, enabled Formica to improve both pricing and margins in some areas. Input costs for major materials such as resins and papers generally remained stable throughout the year.
Capital expenditure focused on major upgrades and replacements of key pieces of machinery, especially at the largest sites in North America and the United Kingdom.
During FY10 Formica Group launched a major new product, true scale granite.
The product, released in North America in August 2009, has been highly successful with over US$10 million of revenue. This product is planned to be released in Europe in FY11.
Europe introduced its new Specification Collection into the commercial market, including the Rigato finish which has already had great success in Asia.
Looking aheadTrading conditions in both North America and Europe continue to remain uncertain and no recovery of significance is expected in these markets in the near term. Continuing growth is expected to occur in China, Taiwan and Asean markets. The Group will continue to focus on improving its operational performance, and capability. Service and innovation will be emphasised, especially in developed markets, and growth opportunities will be pursued in Asia and other developing markets.
Mark AdamsonChief Executive, Laminates & Panels – Formica
Commercial and residential building activity in North America is at its lowest level in decades but Formica is achieving results through outstanding design, use of new printing technology and smart marketing. Its new collection of laminates, marketed under the 180fx™ brand name, is created for a residential market looking for quality products that won’t break the bank.
180fx™ replicates the look and scale of exotic natural granite slabs. Unlike conventional laminates, the 180fx patterns don’t continually repeat across the width of a 5-foot (1.524m) sheet. Each sheet displays the rich colour variations and veining that would be found in a similar sheet of real granite. That means home builders and renovators can enjoy the practical advantages of a laminate product while getting the luxury look of stone at a fraction of the price.
While 180fx™ costs much less than granite, the quality and range of designs and finishes still allows Formica to sell the product at a premium price relative to other laminates. The use of Formica’s premiumfx™ finishes on the 180fx™ product further supports a premium price positioning.
180fx™ has been the right response to the market, at the right time, delivering ‘affordable luxury on a luxurious scale’. Sales and revenue in North America are five times higher than predicted.
Case study

13
Paul Zuckerman Chief Executive, Steel
Steel
More online: fletcherbuilding.com/ divisions/steel
The Steel division operates a diversified portfolio of steel businesses across three broad business lines, primarily in Australia and New Zealand. Each of the division’s businesses has a leading market position and widely recognised brands.
• Therollformingandcoatingsbusinessescomprise Stramit, Dimond and Pacific Coil Coaters (PCC).
• LongSteelbusinessesconsistofPacificSteel,Pacific Wire, Fletcher Pacific Steel (Fiji) and a 50 percent interest in Sims-Pacific Metals
• Thedistributionandservicesbusinesses include the EasySteel steel merchandising business, the CSP hot-dip galvanising business and Fletcher Reinforcing.
Performance overviewSteel’s operating earnings for the year were $82 million, 47 percent lower than the prior year’s record levels. Prior year earnings were driven by historically high steel prices and very strong demand in the first half of the year. Since the global financial crisis, the steel industry has been in a consolidation phase whilst global inventories re-aligned to the reduced demand environment. Accordingly, 2010 was a difficult operating environment characterised by uncertain demand and declining prices.
Sales for the year declined by 11 percent to $1,172 million, continuing the trend seen in the second half of the prior year.
Capacity reduction initiatives implemented in the prior year meant that businesses were well positioned for a sustained downturn, and as such only modest restructuring was required in 2010.
The rollforming and coated steel businesses in both Australia and New Zealand experienced volume declines over the prior year. Rollforming volumes in the residential and light commercial markets continued to be weak in 2010, although Australian government stimulus spending in schools and other areas boosted sales. Competition in rollforming was intense, reducing margins, particularly in the New Zealand market. Operating earnings declined by 14 percent.
Operating earnings in the long steel businesses declined by 63 percent with a reversal in the record steel prices seen in 2009. In Pacific Steel, average selling prices reduced by 30 percent from the prior year. Volumes were four percent higher
with an increase in export volumes offsetting lower demand within New Zealand. Although earnings were significantly lower than the prior year the result demonstrates that Pacific Steel can be profitable throughout the economic cycle.
The consistency of Pacific Steel’s earnings has been achieved through a focus on improved customer service, including investment to reduce plant shut-down risk, improve delivery time reliability and an expanded product offering.
Earnings in the distribution and services business declined by 63 percent. The primary driver of this decline was the Easysteel distribution business. Easysteel’s operating earnings were well down on the prior year due to a combination of contracting margins and low volumes. Easysteel’s margins contracted as lower selling prices caused the value of existing inventories to reduce.
Looking aheadAlthough 2010 has been a very difficult year the businesses within the Steel division have focused on reducing costs and maximizing cashflow and seeking out new profitable customers.
With the existing base businesses well positioned to participate in any economic recovery the focus is on exploring high return growth opportunities and improving the resilience of our businesses for the longer term. The Steel division is assessing a number of organic growth opportunities and continues to explore potential acquisitions.
Divisional reviews
Adding value, at a profit
Stramit Building Products’ sales staff are adding value for customers without compromising profitability.
Stramit manufactures roll-formed steel building products and delivers these across Australia from its network of manufacturing and distribution centres. In the past, the Stramit sales team lacked robust information on the profitability of various products, and the cost of delivering those products to customer sites. That meant that while the team could increase sales volumes, they would not know if they were doing so at a profit. To enable sustainable growth, a comprehensive analysis of product and logistics costs was completed last year and shared with the team.
Today, each salesperson can see the total costs – and potential profit – for each order. They know that the cost of delivering a single roller door to a building project may be similar to the cost of delivering a whole ‘basket’ of products. That allows them to talk to customers about supplying all the items required for a project at a price that is competitive to the customer, and profitable to Stramit. The strategy is working. Over the last three months the value of the average order in target segments has increased by four percent.
Case study

Fletcher Building Annual Report 2010
More online: fletcherbuilding.com/environment
Environment and Society
Environment Reduce, reuse, recycle
The efficient use of natural resources is one of the biggest challenges facing our generation; a challenge which Fletcher Building takes very seriously. We are committed to ensuring that the use of natural resources, including the emission of CO2 from our operations, products and services are reduced.
New Zealand’s emissions trading scheme (ETS) extended coverage to industrial and transport emissions on 1 July 2010. The ETS has been designed so that energy suppliers rather than energy users have to buy emissions units (or carbon credits) and surrender these to the Government. Our operations that emit CO2 from fossil fuel combustion do not directly participate in the ETS. Instead, they are subject to higher energy costs, as these are passed down by energy suppliers.
Our cement and steel manufacturing operations, however, emit process CO2, and our cement plant uses imported coal. This means that these operations are direct participants in the ETS. Cement and steel manufacturing also meet the threshold texts for offsetting the costs of the ETS on emissions-intensive, trade-exposed industries. Both will receive a free allocation of emission units to partly offset their increased costs.
The ETS will impose additional costs on our New Zealand operations, but with the free allocation available to cement and steel these costs will not be material. Our efforts to continually reduce emissions and improve energy efficiency will ensure that these costs are further reduced.
Climate change and environmental sustainabilityFletcher Building has an executive Climate Change and Environmental Sustainability Council which is chaired by the chief executive. Established in 2008, it directs company-wide programmes of work in carbon accounting and emissions trading, internal efficiency programmes, employee engagement, and external communications.
Much of the Council’s efforts in the last year have been directed at emissions trading and carbon reporting, with the introduction of the ETS in New Zealand, and the energy and carbon reporting requirements in Australia. There has been a focus on identifying energy efficiency opportunities, to enable us to achieve our commitment to reducing our CO2 emissions by 5 percent between 2008 and 2012. Internally, we are developing tools to assist waste reporting and reduction initiatives.
Our energy and CO2 inventory is updated every six months, and provisional figures for this financial year shows total CO2 emissions of 1,218,793 tonnes. This includes the CO2 emitted during the generation of electricity used by Fletcher Building. New Zealand’s emissions totalled 708,319 tonnes, while Australia emitted 351,329 tonnes. Of those business units with a high CO2 output, the largest single emitter was the Golden Bay Cement plant with 528,440 tonnes. The
major manufacturing plants for laminates and panels emitted a total of 363,619 tonnes and the Pacific Steel and Wire plants emitted 64,524 tonnes.
Emissions reductionBy 31 December 2009, two years into our five year CO2 emissions reduction programme, our emissions were analysed to assess our progress. Absolute emissions had decreased from 1,526,854 tonnes for 2007 to 1,248,475 tonnes CO2, a decline of 18 percent. Production levels in 2009 were less than 2007, and when emissions were normalised for revenue and production levels, it was concluded that there has been very little change in emissions intensity.
The manufacture of cement in 2007 resulted in the emission of 0.795 tonnes of CO2 per tonne in 2007 and 0.794 tonnes of CO2 per tonne in 2009. In 2009 CO2 emissions intensity improved slightly through the increase in biomass fuel substitution from 11 percent (2007) to 20 percent of thermal energy. However, this was offset by reduced energy efficiency resulting from reduced production and consequent difficulty in optimising the thermal efficiency of the kiln.
Of the group’s other emissions-intensive products, fibre-glass insulation recorded a significant improvement in emissions efficiency. This results from the significant reduction in the Auckland plant, where the conversion from a gas-fired furnace to an electric fired furnace reduced emissions intensity per tonne by 50 percent. The electric furnace is more energy-efficient and also benefits from the use of New Zealand’s electricity with its comparatively low emissions factor.
In order to achieve our target over the next three years, we will require further projects in our energy-intensive plants and a focus on energy efficiency in our other operations.
Fletcher Building participated in the Carbon Disclosure Project for the fifth time this year. This required a complete inventory of all our 2009 CO2 emissions and a report describing how the company manages the risks and opportunities from future climate change. All NZX50 and ASX100 companies are asked to participate.
Other achievementsWe currently participate in a number of organisations that are leading sustainability practices and policies. In New Zealand, this includes an industry joint venture to develop a single residential rating tool. We have also contributed to a number of important Green Star-rated buildings across Australia and New Zealand, either through being a construction contractor or a supplier of accredited materials.
We have recently completed a resource recovery facility in Kumeu, north of Auckland, which sorts and, where possible, recycles construction and demolition waste. The facility utilises the buildings and some of the process equipment of our recently-closed particleboard plant, an efficient use of a substantial existing investment in an emerging area of business opportunity.
Waste reduction is central to New Zealand’s national sustainability strategy but few facilities exist for business recycling. In the Auckland region, less than one percent of industrial, demolition, and construction waste – timber, gib board, steel, cardboard and plastics – is recycled.
Winstone Aggregates, and joint venture partner Kalista, are developing a resource recovery centre at the former Laminex particleboard factory at Kumeu. The CIDRR plant (commercial, construction, industrial and demolition resource recovery) will divert up to 150,000 tonnes of waste from regional landfills each year. Companies will be able to dispose of waste responsibly, at a competitive rate, with construction projects getting the added benefit of earning real Green Star points. Resources recovered will be processed and sold. Bulk commodity markets for recovered steel and wood already exist, while new product markets for material such as gypsum are being developed.
The use of the Laminex site is an example of ‘reduce, reuse, recycle’ in action, with the existing 10,000m2 building and some existing processing plant being adapted for resource recovery. The plant will ultimately process around 500 tonnes of waste a day, and employ 20 people directly and up to 100 indirectly.
Case study

15
Peter Merry Executive General Manager, Human Resources
At 30 June 2010 Fletcher Building employed some 16,000 people in its business units across New Zealand, Australasia, Asia, Europe, North America and the South Pacific.
Through their capability, performance and diversity our employees differentiate our group, deliver value to our shareholders, customers and communities and reinforce our foundation for sustainable success. An engaged workforce aligned in a high performance culture is key to the delivery of our business strategy and we strive to foster inclusive workplaces of choice that engage and enable talented high calibre people of all backgrounds to fulfil their potential.
Our workplaces are shaped by our values which promote individual and team creativity, mutual respect, commitment, and a focus on achieving results. These values underpin our code of behaviour, the Fletcher Building Way. This builds on our heritage of constructive, enduring relationships within Fletcher Building, and with our stakeholders. All Fletcher Building leaders are required to promote and model the Fletcher Building Way.
Our values-based, structured approach to people management is managed regionally within a framework of group policies and practices. These are framed to enhance the appeal of our employment brand – a powerful sustainable resource, that delivers significant intangible value to our stakeholders.
Talent identification, attraction and recruitmentFletcher Building is committed to the development and advancement of employees from within the group, supplemented by high calibre new hires when appropriate. The group adopts an active approach to the attraction of talented new employees through online and print communications and by fostering links with a range of external sources including recruitment professionals, academic institutions and professional associations. The group’s Australasian in-house recruitment centre is a further key conduit of good people; in the last year over 350 people were hired through this source, delivering savings of over $2.5 million.
Leadership and management developmentThe group recognises that as its business grows and diversifies, excellent leaders are needed to run its substantial businesses and functions, many of which trade internationally. Several of our businesses would rank as major enterprises in their own right. The development of an internationally focused high-performing leadership team is thus a key strategic priority.
Our top talent pool has considerable experience and depth. Over 43 percent of the 350 most senior executives have more than 10 years’ service with the group, while 28 percent have more than 15 years’ service. We now have 71 executives at general manager or more senior levels in our business. Of these, 30 percent lead our offshore operations. With the growth of our international business, we are building a leadership group with global perspective; over 25 percent of this executive group have at least one year of experience working in a business outside their home country.
A comprehensive leadership assessment and development programme is in place for Fletcher Building’s 300 most senior executives. The programme offers a mix of in-house development programmes, challenging work assignments under experienced mentors, and external executive education programmes at leading business schools in New Zealand, Australia, the USA and the UK.
Since our diverse and geographically-dispersed operations differ significantly, each business is encouraged to source and deliver in-house training programmes specific to its needs.
These are supplemented by an integrated range of centrally co-ordinated regional programmes, designed to drive the high performance leadership and culture that is central to the group’s business strategy. Our regional programmes deliver economies and efficiencies of scale, help build internal networks, promote common processes and business tools, and foster the Fletcher Building Way.
The company believes that it is essential to invest in future talent, even in difficult times. For this reason, all learning and development programmes in the last year were maintained. These programmes were supported in Australia and New Zealand by the Fletcher Building Employee Educational Fund which paid out grants of over $4 million in support of group, employee, and employee dependant training.
Reward and recognitionThe group strives to offer market-competitive pay and benefits in each country of operation. Our general policy is to benchmark total remuneration at the third quartile, with appropriate regard to individual and business performance, market conditions, employees’ priorities, needs and lifestyles, and reward practice in each location.
More online: fletcherbuilding.com/about/our-people
Asia 1,100
Europe 1,300
USA 1,100
South Pacific 1,000
Australia 3,800
New Zealand 7,700
Environment and Society
People

Fletcher Building Annual Report 2010
Labour relationsFletcher Building enjoys a history of constructive relationships based on partnership and mutual respect with the many labour unions active within its business.
Some 32 percent of the group’s employees belong to labour unions. There are more than 130 negotiated workplace agreements in place across the company.
Employee share ownershipFletcher Building wants its employees to feel directly involved in the performance of the business and so encourages and supports employee share ownership.
Certain senior managers are required to acquire and hold shares in the company in their own names as a condition of employment. A broader group is eligible to participate in a long-term cash incentive requiring investment in the company’s shares. Details can be found in the Remuneration Report section of the annual report.
Communicating with our peopleKeeping our people informed about what is happening in Fletcher Building, and monitoring employee views and perspectives of the group, is important to the group. We deliver information and encourage employees to provide feedback through a variety of channels including online webcasts, web seminars, web chats and email bulletins, and face-to-face briefing sessions, conferences and employee reviews.
‘Faircall’ and ‘Safe2Say’ are free, independently-administered, international 24 hour confidential telephone hotlines for employees to raise ethical issues and report grievances. All calls are logged and investigated by the appropriate function and are subject to regular Audit Committee review. All matters are brought to the attention of the CEO and the board.
We regularly survey our employees at group and at business unit levels to gather their opinions.
In the last year, the group’s international leadership group was surveyed through a confidential questionnaire available in five languages. An 82 percent response rate was achieved. Despite the workplace pressures of the global financial crisis, we were pleased that participants awarded the group a higher overall rating than in the previous survey, conducted in 2007. Amongst the highest scoring items were statements of commitment to the group (81 percent); pride in the group (80 percent); and acknowledgement of the group’s progress on workplace safety.
Equal opportunity and diversityA workplace that welcomes and supports all employees is central to the group’s values. We aim for an inclusive workplace in which our people are able to rise to their full potential regardless of gender, age, ethnicity, disability, creed, or caring responsibilities.
Currently some 35 percent of the group’s workforce is aged over 50 and 62 percent is aged over 40 years. Women comprise around 19 percent of the group’s workforce overall, although representation is higher in some countries, reflecting national trends. A measure of the ethnic diversity of our global workforce is that from time to time we produce corporate communications in nine languages.
Recognising the diversity of backgrounds and needs of our increasingly multi-cultural workforce, we offer a range of adult learning and re-skilling opportunities including literacy training and access to occupational programmes leading to nationally accredited qualifications awarded by third parties. These initiatives help to offset educational and language barriers to advancement and promote our high performance ethic.
We continue to look for opportunities to advance more leaders who are women, and members of minorities.
Within the community, we are proud co-sponsors of the New Zealand Employers’ Disability Network and the New Zealand Equal Employment Opportunity Trust, and strongly endorse their efforts to advance the representation of minorities in the workforce. The group also sponsors the First Foundation which assists academically talented, financially disadvantaged young New Zealand students to reach their full potential.
Work-life balancePeople have different needs and work preferences at various stages in their careers. Fletcher Building recognises this through providing options such as alternative work arrangements – including flexible work, telecommuting and job-sharing to help employees balance their personal and professional commitments.
Employees who require support with personal or work-related problems have free access to a confidential counselling service through specialist providers.
New Zealand employees who experience personal hardship through unexpected misfortune may apply to the independent Fletcher Building Employee Welfare Fund for financial assistance.
Environment and Society

17
Fletcher Building’s decentralised structure places operational responsibility for health and safety with each business unit. However, safety is not just an operational issue. The maintenance of safe workplaces is also a strategic issue because of the correlation between productivity and improved health and safety, and because of the high human cost of injuries and fatalities. That means we seek to balance the strategic importance of safe work places with the benefits of operational control by business units.
Health and safety vision, policy and standards for Fletcher Building are established by an executive-led Health and Safety Council chaired by the chief executive. Each year, the Council produces a safety plan which details priorities, requirements, and programmes for the whole group. Performance targets are cascaded down to divisions and business units.
To support divisional and business unit health and safety activities, high quality health and safety resources have been progressively developed by the group over recent years. These include tools to ensure that variability in basic safety standards is reduced, a common health and safety electronic reporting system, and a health and safety Intranet site. Guidelines and resources have been produced to ensure that common hazards are managed in a more consistent manner.
Currently, the group is investigating the various techniques and tools available internationally that we can use to better understand and improve the safety culture across our sites.
An executive-led initiative each year reinforces our commitment to safety in the workplace. In this last year, ‘The Ripple Effect’ DVD was produced which described the effects of serious injuries and fatalities on the families and friends of accident victims. The DVD and its accompanying workshop had a profound effect at every level of the business. This initiative was selected as a finalist in the 2010 Safeguard New Zealand Workplace Health and Safety Awards. Our business units have also been externally recognised. A safety video created by Firth won first place in the 31st Annual Telly Awards held in New York, and in the same awards, a safety video created by Fletcher Aluminium was awarded second place.
This year, our health and safety focus extended to improving employee wellbeing. While some business units already had specific objectives
in their health and safety plans relating to the wellbeing of employees, Fletcher Building created its own support programme, LifeTime. This provides policy direction and acts as a central resource to streamline wellbeing in the group while complementing existing programmes already established elsewhere in the business.
Health and safety achievements across the group are recognised through the annual Fletcher Building Health and Safety Awards. This was the third year in which these awards were held.
The effect of all these initiatives has been significant progress in reducing injury rates. Our primary injury rate measure is the 12 month rolling average Total Recordable Injury Frequency Rate per million hours (TRIFR), with total injuries being the sum of lost-time and medical treatment injuries. In the last year, this rate has dropped from 23.79 to 11.24. (In June 2006, this rate was 59.63). Our lost time injury frequency rate has dropped from 5.81 to 3.42. (In June 2006, this rate was 9.84).
Despite our progress, however, we are far from satisfied with this level of performance. Fatalities and injuries still occur. Tragically, an employee of Fletcher Construction (South Pacific), died in Apia, Samoa after falling from a height within the Ministry of Education, Sports and Culture Headquarters building project on 15 June.
Fletcher Building understands that a further reduction in total injuries must occur to reduce the risk of serious injuries and fatalities. Our health and safety vision of zero harm is based on the principle that all accidents are preventable. The participation of senior management in our programmes, and the investment of significant resources in safety education and training, continues to demonstrate the group’s strong commitment to health and safety.
In New Zealand, Fletcher Building retained primary-level membership of the Accident Compensation Corporation Partnership Programme following an external audit in November 2009. Australian manufacturing sites are subject to differing injury management requirements, based on state regulation and the range of schemes available. Self-insurance is usually the preferred option and additional operations are moving into self-insurance schemes.
Health and Safety
Environment and Society
More online:fletcherbuilding.com/ society/health-and-safety

Fletcher Building Annual Report 2010
Ralph Graham WatersCPEng, FIE Aust, M BusIndependent Non-Executive Chairman of DirectorsChairman of the Nominations CommitteeFirst appointed 10 July 2001
Mr Waters, 61, has extensive management experience in the Australasian building products industry including as managing director of Email, a major Australian industrial company, and until 31 August 2006 as the chief executive officer and managing director of Fletcher Building. He is chairman of Fisher & Paykel Appliances Holdings and a director of Fonterra Co-operative Group, Westpac New Zealand and Fletcher Building Finance. Mr Waters is a Chartered Professional Engineer and a Fellow of the Institution of Engineers Australia.
Antony John CarterBE (Hons), ME, MPhil (Loughborough)Independent Non-Executive DirectorMember of the Remuneration and Nominations Committees First appointed 1 September 2010
Mr Carter, 53, is currently managing director of Foodstuffs (Auckland) and Foodstuffs (New Zealand), New Zealand’s largest retail organisation, and a director of a number of related companies. Mr Carter joined the board in September ahead of his retirement from Foodstuffs at the end of this year. He has extensive experience in retailing, having joined Foodstuffs in 1994. Prior to this he owned and operated several Mitre 10 hardware stores, and was a director and later chairman of Mitre 10 New Zealand Limited. Mr Carter is a director of Vector and Fletcher Building Finance and a trustee of the Maurice Carter Charitable Trust.
Hugh Alasdair FletcherMCom (Hons), MBA (Stanford), BScIndependent Non-Executive DirectorMember of the Audit and Nominations CommitteesFirst appointed 23 March 2001
Mr Fletcher, 62, has had extensive management experience and now holds a number of directorships and advisory positions. He is a director of Rubicon, Fletcher Building Finance, the Reserve Bank of New Zealand, Vector and Insurance Australia Group, a member of the New Zealand advisory board of L.E.K. Consulting, a councillor of The University of Auckland and a trustee of the New Zealand Portrait Gallery.
Alan Trevor JacksonBEng (Hons), PhD (Auckland) MBA (IMD Management Institute) Independent Non-Executive DirectorMember of the Remuneration and Nominations CommitteesFirst appointed 1 September 2009
Dr Jackson, 57, was until 2009 chairman Australasia, senior vice president and director of The Boston Consulting Group. He has been an international management consultant since 1987 with The Boston Consulting Group and has proven experience at the most senior levels of international and government business. Dr Jackson has worked across a range of industries including resources, diversified industrials, building products and construction sectors. Dr Jackson is a Fellow of the Institution of Professional Engineers. He is chairman of the Housing Shareholders’ Advisory Group, a director of Fletcher Building Finance and a trustee of The Icehouse Auckland.
Board of Directors
From left to right: Ralph Waters Tony Carter Hugh Fletcher Alan Jackson John Judge Jonathan Ling Sir Dryden Spring Gene Tilbrook Kerrin Vautier

19
John Frederick JudgeBCom, FCAIndependent Non-Executive DirectorChairman of the Audit Committee and member of the Nominations CommitteeFirst appointed 9 June 2008
Mr Judge, 56, has considerable experience in Australasian business and brings further financial and analytical knowledge to the board. His highly successful career includes various roles within Ernst & Young culminating in the position of chief executive of Ernst & Young New Zealand. He is a director of ANZ National Bank and Fletcher Building Finance and chairman of the Accident Compensation Corporation, the Auckland Art Gallery Foundation and the Museum of New Zealand Te Papa Tongarewa and a member of the Otago University Business School advisory board.
Jonathan Peter LingB Eng, MBA, FIPENZManaging DirectorFirst appointed 1 September 2006
Mr Ling, 56, is the chief executive officer and managing director of the company. He has extensive management experience in competitive manufacturing business through his senior management roles in the Laminates & Panels division from 2003 to 2006, and before that in Pacifica, Visy and Nylex. Mr Ling is also a director of ASB Bank and Fletcher Building Finance. He is a member of the Business Council of Australia Sustainable Growth Taskforce and during 2008 and 2009 served on the New Zealand-Government appointed Capital Market Development Taskforce.
Sir Dryden SpringDSc (Hon)Independent Non-Executive DirectorChairman of the Remuneration CommitteeMember of the Nominations CommitteeFirst appointed 23 March 2001
Sir Dryden, 70, has a long-standing record of leadership in a range of industries. He is chairman of ANZ National Bank and a director of Port of Tauranga, Sky City Entertainment Group and Fletcher Building Finance. He is a member of the New Zealand Business and Parliament Trust and a Distinguished Fellow of the Institute of Directors, a member emeritus of the International Policy Council on Agriculture, Food and Trade and is on the advisory board of Visy Industries. Sir Dryden will be retiring from the boards of Fletcher Building and Fletcher Building Finance on 30 September 2010.
Gene Thomas TilbrookBSc, MBA (University of Western Australia) Independent Non-Executive DirectorMember of the Audit and Nominations CommitteesFirst appointed 1 September 2009
Mr Tilbrook, 59, was finance director at Wesfarmers Limited until his retirement in May 2009. He led Wesfarmers’ business development group, becoming executive director, business development in 2002 and finance director in 2005. Mr Tilbrook is chairman of Transpacific Industries Group and a director of Fletcher Building Finance, Queensland Rail, the GPT Group and the Australian broadband company, NBN. He is a councillor of Curtin University of Technology and a fellow of the Australian Institute of Company Directors (WA).
Kerrin Margaret VautierCMG, BA, FINSTD, LEANZFIndependent Non-Executive DirectorMember of the Audit and Nominations CommitteesFirst appointed 23 March 2001
Mrs Vautier, 65, is a research economist specialising in competition law and economics. She has served on a number of Government agencies, including as a member of the New Zealand Commerce Commission, and has been a director of several New Zealand listed companies. Currently, she is a director of the Reserve Bank of New Zealand and Fletcher Building Finance and adviser to the Partnership Board of Deloitte. She also chairs the Musica Sacra Trust. Mrs Vautier is a lay member of the High Court under the Commerce Act.
For Director bios visit: fletcherbuilding.com/10/boardofdirectors
Martin Farrell Company Secretary and General Counsel
For Executive team bios visit: fletcherbuilding.com/10/executiveteam

Fletcher Building Annual Report 2010
Corporate governanceFletcher Building is a New Zealand-based building materials manufacturer whose securities are listed on the New Zealand and Australian stock exchanges.
These exchanges require formal adoption of approved corporate governance practices by listed company boards of directors. Accordingly, the board of Fletcher Building confirms that it is committed to the highest standards of behaviour and accountability, and has adopted policies and procedures that reflect this commitment.
The company has adopted the principles recognised by the ASX Corporate Governance Council as an appropriate way to organise its corporate governance policies and reporting. In establishing its corporate governance procedures, the company reviews the practices and trends in corporate governance in other jurisdictions, and has incorporated these where appropriate.
The company believes that the practices it has adopted ensure that it meets the requirements of NZX’s Corporate Governance Best Practice Code and the Securities Commission’s Corporate Governance in New Zealand Principles.
Fletcher Building’s corporate governance practices, including matters reserved for the board and those delegated to senior executives, are fully detailed on its website and shareholders seeking an in-depth review are encouraged to access information from this source.
This section on corporate governance contains commentary on seven of the eight principles recognised by the ASX Corporate Governance Council. Commentary on principle eight - remunerating fairly and responsibly – is contained in the Remuneration Report.
1. Ensuring solid foundations for management and oversightThe company’s procedures are designed to: •Enabletheboardtoprovidestrategicguidance
for the company and effective oversight of management.
•Clarifytherespectiverolesandresponsibilities of board members and senior executives in order to facilitate board and management accountability to both the company and its shareholders.
•Ensureabalanceofauthoritysothatnosingleindividual has unfettered powers.
The board has an obligation to protect and enhance the value of the company’s assets, and to act in its interests. It exercises this obligation through the approval of appropriate corporate strategies and processes, with particular regard to portfolio composition and return expectations. These include approval of transactions relating to acquisitions, divestments and capital expenditures above delegated authority limits, financial and dividend policy and the review of performance against strategic objectives.
As part of its review of the strategic direction of the company, a strategy session is held with senior management each year. Senior management are expected to address strategic issues in the business as part of their monthly review. Where appropriate, special strategic reviews are held of business groups or units, where material change is evident or contemplated.
The company achieves board and management accountability through written terms of reference for the chairman, directors and management, and a formal delegation of authority to the chief executive. The effect of this framework is that whilst the board has statutory responsibility for the activities of the company, this is exercised through delegation to the chief executive, who is charged with the day-to-day leadership and management of the company. As part of its annual review of its governance processes, the board reviews the delegations to the chief executive each year.
The terms of reference for directors and the chairman, the charters for board committees and the delegation to the chief executive officer all provide for reviews of the performance of directors and senior management. The nominations committee assesses the composition and effectiveness of the board and its committees annually. The chair of the nominations committee undertakes one-on-one reviews annually with all directors on the effectiveness of the board.
The board evaluates annually the performance of the chief executive and the chief executive’s direct reports. The evaluation is based on criteria that include the performance of the business and the accomplishment of long-term strategic objectives, and other non-quantitative objectives established at the beginning of each year. During the most recent financial year, performance evaluations of senior executives were conducted in accordance with this process.
In addition to these annual performance reviews, significant policy issues and capital expenditure or divestment decisions of management are required to undergo a formal peer group review process, including approval by the company’s executive committee or the board where necessary.
The governance procedures require the board to be comprised of a majority of independent directors and for there to be a separation of the role of chairman from that of the chief executive. These policies also provide that a director who has been employed in an executive capacity in the last three years cannot be considered an independent director. Therefore, R G Waters has been an independent director from 1 September 2009. With J P Ling being an executive director, eight of the nine directors are independent directors.

21
2. Structuring the board to add valueThe directors believe that for the board to be effective it needs to facilitate the efficient discharge of the duties imposed by law on the directors and add value to the company. To achieve this, the board is organised in such a way that it: •Obtainsaproperunderstandingof,and
competence to deal with, the current and emerging issues of the business.
•Caneffectivelyreviewandchallengetheperformance of management and exercise independent judgement.
•Canassistintheidentificationofdirector candidates for shareholder vote.
Board compositionWhile the constitution provides that the appropriate size for the board is between three and nine members, the board has determined that eight is an appropriate number at this time to ensure proper rotation arrangements. At least one-third of all directors stand for election every year although this can be increased due to requirements of the stock exchanges. The directors who retire in each year are those who have been longest in office since their last election or, if there are more than one of equal term, those determined by agreement. Subject to continued shareholder support, the standard term for a non-executive director is six years from the date that he or she initially stands for election. At the end of this term the director will offer his or her resignation. The board may, if it considers it appropriate, offer a further term of up to three years.
The board has constituted a nominations committee, chaired by the chairman of the company and composed of all the non-executive directors. This committee assists in the identification of appropriate directors and, through the committee chair, reviews the performance of existing directors.
CommitteesCommittees established by the board review and analyse policies and strategies, usually developed by management, which are within their terms of reference. They examine proposals and, where appropriate, make recommendations to the full board. Committees do not take action or make decisions on behalf of the board unless specifically mandated by prior board authority to do so. A committee or an individual director may engage separate independent counsel at the expense of the company in appropriate circumstances, with the approval of the chairman.
The current committees of the board are audit, remuneration and nominations. These meet when necessary and consist entirely of non-executive directors. From time to time, the board may create ad hoc committees to examine specific issues on its behalf.
Board processAlthough directors are elected by the shareholders to bring special expertise or perspectives to board deliberations, decisions of the board are made as a group, after taking each perspective into account and the best interests of the company.
The directors receive comprehensive information on the company’s operations before each meeting and have unrestricted access to any other information or records. To assist in ensuring information is timely, focused and concise, board papers are prepared and distributed electronically. Where directors cannot participate in a meeting they forward their views to another director in advance of the meeting. Senior management are also available at each meeting to address queries, and to assist in developing the board’s understanding of the issues facing the company and the performance of its businesses.
Director participation remains very high, with only one apology for absence from the ten regular meetings during the year. In addition to these meetings were five site visits and a strategic session with senior management. The audit committee met on two occasions, the nominations committee once and the remuneration committee met twice during the year. Some special committee meetings were also convened to review issues relating to the offer of replacement shares to directors, as subsequently approved at the 2009 annual shareholders’ meeting.
3. Promoting ethical and responsible decision-makingThe company has written procedures to: •Clarifythestandardsofethicalbehaviourrequired
of company directors and key executives, and ensure observance of those standards through a code of conduct and the terms of reference for directors and management.
•Prescribethecircumstanceswheredirectors and employees can trade in company securities.
The company has a written code of values and a code of conduct with which all employees are required to comply.
The company has a written policy on illegal and unethical conduct. It reinforces this policy with promotional programmes to employees and provides a FairCall confidential telephone hotline to enable reporting of inappropriate behaviour. The FairCall line is operated by an independent party, and the outcome of all matters raised is reported to the audit committee.
New Zealand legislation and the company’s securities trading code of conduct prevent short-term trading and dealing in the company’s securities whilst directors and senior executives are in possession of non-public material and relevant information.
More online: fletcherbuilding.com/10/governance

Fletcher Building Annual Report 2010
3. Promoting ethical and responsible decision-making – continuedThe company reinforces these measures by requiring that any of the 95 persons comprising executives and directors, who are currently designated as having the opportunity to access price-sensitive information, can transact in its securities only with the prior approval of the company secretary.
The company recognises that it has a number of legal and other obligations to non-shareholder stakeholders such as employees, clients, customers and the community as a whole. Its commitment to these obligations is captured in the code of values, and in various policies and procedures for ethical conduct, the responsibilities of employees, conflicts of interest, and relationships with suppliers and customers. These are incorporated into the employment terms of all employees.
4. Safeguarding the integrity in financial reportingWhile the ultimate responsibility to ensure the integrity of the company’s financial reporting rests with the board, the company has in place a structure of review and authorisation designed to ensure truthful and factual presentation of its financial position. This includes: •Anappropriatelyresourcedauditcommittee
operating under a written charter. •Reviewandconsiderationbytheauditcommittee
of the accounts and the preliminary releases of results to the market.
•Aprocesstoensuretheindependenceandcompetence of the company’s external auditors.
•Establishmentofaninternalauditfunctioninthecorporate office, with reporting responsibility to the audit committee.
•Responsibilityforappointmentoftheauditorsresiding with the audit committee.
5. Making timely and balanced disclosureThe company has in place procedures designed to ensure compliance with the NZX and ASX Listing Rules such that: •Allinvestorshaveequalandtimelyaccessto
material information concerning the company, including its financial situation, performance, ownership and governance.
•Companyannouncementsarefactualandpresented in a clear and balanced way.
Accountability for compliance with disclosure obligations is with the company secretary. Significant market announcements, including the preliminary announcement of the half year and full year results, the accounts for those periods and any advice of a change in earnings forecast require prior approval by either the audit committee or the board.
6. Respecting the rights of shareholdersThe company seeks to ensure that its shareholders understand its activities by: •Communicatingeffectivelywiththem.•Givingthemreadyaccesstobalancedand
clear information about the company and corporate proposals.
•Makingiteasyforthemtoparticipatein general meetings.
To assist with this, a company website is maintained with relevant information, including copies of presentations, reports and media releases. The corporate governance procedures are also included on the website. To further assist shareholders the company prepares and distributes its accounts in electronic format to shareholders who have so requested. This annual report is also available in electronic format. The company has continued to provide to all shareholders an annual review which is a summary of the group’s operations and financial performance for the year.
7. Recognising and managing riskThe company has a formalised system for identifying, overseeing, managing and controlling risk. The processes involved require the maintenance of a risk register that identifies key risks facing the business and the status of initiatives employed to reduce them. The risk register is reviewed regularly, including as part of the internal audit reviews.
During the most recent financial year, management has reported to the board on the effectiveness of the company’s management of its material business risks. As part of that report, appropriate assurances were received from management that the system of risk management and internal control is operating effectively in all material respects in relation to financial reporting risks.
Corporate governance

23
Remuneration reportThis Remuneration Report contains commentary on principle eight of the ASX Corporate Governance Council principles.
Remunerating fairly and responsiblyThe company seeks to ensure that its remuneration policies attract and maintain talented and motivated directors and employees as a way of enhancing the performance of the company.
Non-executive directors’ remunerationThe fees paid to non-executive directors for services in their capacity as directors during the year ended 30 June 2010 were:
The remuneration policy for non-executive directors does not include participation in either a share or share option plan. Non-executive directors or their associates are nevertheless required to hold at least 20,000 shares in the company.
The company’s policy is to align directors’ remuneration with that for comparably sized Australian companies. Directors’ fees are normally reviewed annually by the nominations committee unless it is apparent that a significant market movement has occurred.
As part of its 2010 review of remuneration, the company commissioned an independent report on directors’ remuneration in Australia, which indicated that some increase in fees was justified having regard to market changes. Nevertheless, directors decided that no change will be made at this time. Accordingly, the base director’s fee remains at $121,000, with committee fees of $23,000, $17,500 and $8,500 per annum for participation on the audit, remuneration
and nominations committees respectively. The maximum aggregate fees payable in any year was set at $1,500,000 at the 2006 annual shareholders meeting.
Committee chairs receive a 50 percent premium to the committee fee. The board chairman’s fee has been reduced from three times to two and a half times the base fee paid to directors, and inclusive of the time committed by the chairman for participation on board committees. In acknowledgement of the additional time commitment required of any Australian-based director, a travelling allowance of $12,000 per annum is also payable. Where an ad hoc committee is convened, such as for due diligence, additional remuneration may be payable at $1,200 per half day.
The company believes that this provides an appropriate remuneration structure which recognises the increased global focus of the company’s activities and the increased corporate governance obligations imposed on directors.
Base Fees Committee Other Total
Fees Fees
RS Deane 1 272,250 272,250
H A Fletcher 121,000 31,500 152,500
A T Jackson 100,614 21,620 122,234
J F Judge 121,000 43,000 164,000
Sir D Spring 121,000 35,000 156,000
G T Tilbrook 100,614 26,193 9,978 136,785
K M Vautier 121,000 31,500 152,500
R G Waters 181,500 19,500 12,000 213,000
Total 1,138,978 208,313 21,978 1,369,269
1 As advised in the Fletcher Challenge Building Information Memorandum dated 30 January 2001, Fletcher Building Limited assumed responsibility for the payment of directors’ retirement allowances which had accrued prior to Separation in respect of three directors of Fletcher Challenge Limited who became directors of Fletcher Building. Fletcher Building received payment for those allowances from Fletcher Challenge. In addition to the above fees, Dr Deane, who retired on 31 March 2010, was paid the sum of $25,000 being the retirement allowance in respect of his directorship of Fletcher Challenge.

Fletcher Building Annual Report 2010
More online: fletcherbuilding.com/10/remuneration
Remuneration report
Executive director’s remunerationJ P Ling’s remuneration as chief executive officer comprises base remuneration, a short-term incentive if specified annual performance targets are satisfied of up to 100 percent of his base remuneration and participation in the company’s long-term incentive scheme of up to 80 percent of base remuneration. In addition, his total remuneration includes a portion of the assessed value of options granted to him in September 2009. The total earnings opportunity for Mr Ling for the year ended 30 June 2010 was $3,724,000.
The actual remuneration received by Mr Ling in the financial year was $2,713,494 comprising base remuneration of $1,260,000, a short-term incentive payment of $1,228,500 and $224,994 paid in October 2009 in respect of the shares vesting pursuant to the 2006 Executive Performance Share Scheme.
As required by the NZSX and ASX Listing Rules, shareholder approval of the two components of Mr Ling’s long-term incentives was received at the annual shareholders’ meetings on 14 November 2006 and on 12 November 2008. His long-term incentives consist of the grant of 1,000,000 options, and entitlement to shares in the company previously granted pursuant to the Executive Performance Share Scheme and in the Executive Long-Term Share Scheme. The value of the 75,937 shares in the company acquired under the Executive Long-Term Share Scheme of 9 November 2009 was $624,960.
The initial grant of 500,000 options was made with effect from 1 September 2006, being the date of Mr Ling’s appointment with a further grant of 500,000 options being made with effect from 8 September 2009. Each option was granted for no cash consideration, at an exercise price for the initial grant of $9.24, being the volume weighted price of Fletcher Building shares sold on the NZX in the ten business days immediately preceding the announcement of his appointment on 10 May 2006. The exercise price for the second grant is $7.78, being the volume weighted price of Fletcher Building shares sold on the NZX in the ten business days immediately preceding the date of grant. The exercise prices are increased annually, with effect from the date of grant, by the company’s cost of capital, less any dividends actually paid. There is a restrictive period of three years from the date of grant during which the options may not be exercised. Subject to the company’s rules on the trading of securities, options may be exercised at any time between the third and sixth anniversary of the date of grant.
Directors are satisfied that they have received independent advice that Mr Ling’s terms of employment provide an appropriate remuneration package for the role of chief executive officer.
As an executive director, Mr Ling did not receive any further remuneration in his capacity as a director of Fletcher Building Finance Limited or other subsidiaries.
Directors’ and officers’ indemnification and insuranceThe company has arranged a programme of directors’ and officers’ liability insurance covering directors, executives and employees in managerial positions acting on behalf of the company. Cover is for damages, judgements, fines, penalties, legal costs awarded and defence costs arising from wrongful acts committed whilst acting for the company.
Actions not covered include dishonest, fraudulent or malicious acts or omissions; wilful breach of a statute, regulation or a duty to the company; improper use of information to the detriment of the company; and breach of professional duty. The insurance cover is supplemented by indemnification by the company, but this does not cover liability for criminal acts.
Senior management remunerationThe company’s remuneration strategy aims to attract, retain and motivate high calibre employees at all levels of the organisation, and so drive performance and sustained growth in shareholder value. Underpinning this strategy is a philosophy that total remuneration should be provided that is competitive in the markets in which the company operates – particularly for delivering superior performance that contributes to improved business results.
Total remuneration for executives comprises fixed pay, including the value of any benefits, and a short-term variable incentive in the form of an annual performance related bonus that forms a significant portion of the total package.
All executive performance bonuses require achievement of a mixture of company financial and personal targets.
The company’s remuneration committee is kept fully appraised of relevant market information and best practice, obtaining advice from external advisors when necessary. Remuneration levels are reviewed annually for market competitiveness.
Fixed remunerationIt is the company’s policy to pay fixed remuneration comparable to the median and total compensation comparable to the upper quartile for equivalent roles in the country or region in which the incumbent is located. For the purposes of determining total remuneration within the senior executive group, it is assumed that senior executives will on average achieve 75 percent of their potential incentives over time, such percentages to be reassessed periodically in the light of the actual earnings achieved over the business cycle. It is considered appropriate that 50 percent of variable incentives be achieved over a normal business cycle.

25
Short-term incentive remunerationShort-term incentive remuneration is available to recognise the contribution of senior executives to company and individual performance objectives. Short-term incentive remuneration targets are expressed as a percentage of fixed remuneration which is up to 100 percent of the fixed remuneration for the chief executive and the direct reports to the chief executive, and up to 40 percent for all other senior executives.
Participation in the plan is by annual invitation, at which time the target incentive is established. This involves each participant being notified of a financial target and several challenging, measurable personal objectives for the financial year. Personal and financial objectives are independently assessed such that a participant can achieve their personal objectives even if the minimum financial target is not achieved.
The financial measures include the operating earnings target for the applicable division or business unit and the corporate Economic Value Added (EVA) target. Corporate executives are measured on a mix of EVA and personal objectives.
The target for commencement and determination of variable incentive payments is an assessed measure for each business unit or operating division, and is based on the approved budget. In most years the starting point for any variable compensation payments is at 90 percent of target, with 50 percent of the financial component earned at 100 percent of target, and 100 percent of the financial component earned at 105 percent of target.
Individual variable compensation payments are offered entirely at the discretion of the board.
Long-term incentivesThe company has implemented long-term cash-based performance incentive schemes, targeted at around 300 executives most able to influence financial results. Where performance targets are met, a cash bonus is payable with the after-tax amount invested in the company’s shares. Participation in any year is by invitation, renewable annually and at the complete discretion of the company.
Where permitted by securities legislation in the relevant jurisdiction, participants purchase shares in the company at the offer price with an interest-free loan. The offer price is established at market value at the time of offer, which will normally be each 30 September. The shares are held by a trustee on behalf of participants until the end of a three year restrictive period which may be extended for one further year for up to 50 percent of the entitlement. Provided certain performance criteria are met and participants remain employed with the company throughout the restrictive period, legal title in the shares will be transferred to them at the end of the restrictive period.
The schemes are either share-ownership based for New Zealand and Australian executives or are designed to deliver the same economic value as the
share scheme and is for a small number of executives in other jurisdictions where offering a share scheme is not optimal.
The cash-based share-ownership scheme, the Executive Long-Term Share Scheme (ELSS), will be offered to all eligible executives this year, and is described in detail below. This scheme replaced the Executive Performance Share Scheme (EPSS) and is designed to deliver the same economic value as that scheme.
There are some legacy schemes, based on the EPSS, which were offered from 2004 to 2008 and which will terminate over the next three years. Details of those are described in the Corporate Governance section on the company’s website at fletcherbuilding.com
Executive Long-Term Share Scheme The ELSS is a cash-based long-term scheme as, to the extent any performance targets are met, the company will pay a cash bonus to facilitate the acquisition of a number of shares in the company.
Under the ELSS, vesting of up to 50 percent of the shares allocated to a participant will be dependent on achieving the total shareholder return (TSR) target and vesting of up to the other 50 percent of the shares will be dependent on achieving the earnings per share (EPS) target. The primary reasons for dual performance measures are:
•AstheTSRperformancerequirementisdeterminedby relative performance against a peer group of Australasian companies it focuses on management rather than general market changes;
•EPSisseenasstronglylinkedtoshareholderwealth, as a consistent growth in earnings should lead to dividend growth;
•cumulativecompoundEPSrecognisestheimportance of underlying earnings even in cyclical industries to generate value for investors;
•EPSprovidesarelevantinternalperformancemeasure, operating independently of capital markets;
•TSRandEPSwerethemostwidelyusedcombination of performance measures based on external benchmarking data.
The main terms of the ELSS are as follows:
(a) It enables participants to purchase shares in the company at market value with the assistance of an interest free loan. Vesting of the shares in the participants is subject to their continued employment and the achievement of the performance objectives.
Remuneration report

Fletcher Building Annual Report 2010
•Vestingof50percentofthesharesintheparticipants requires achievement of certain levels of TSR relative to a comparator group of New Zealand and Australian companies over a minimum three year restrictive period, or as may be extended by the one year retesting period.
•Vestingoftheremaining50percentofthesharesinthe participants requires achievement of certain EPS targets over a three year restrictive period. Each year the board will, in its discretion, set an EPS target for the group. EPS is measured by the Fletcher Building group’s net earnings attributable to shareholders for financial reporting purposes, divided by the weighted average number of shares on issue. The one year retesting period will not apply to the EPS tranche of shares.
(b) If at the end of the minimum three year restrictive period the TSR performance target has not been met in full, the restrictive period will be extended (either automatically or at the election of the participant, depending on the target level achieved) for a further one year period. If a retesting period applies, it will apply in relation to all the participant’s shares in the TSR tranche. During this one year retesting period, the company will assess (mid-way through the period and at the end of the retesting period) whether the TSR performance objective has been achieved. If the TSR performance declines during the retesting period, the participant’s entitlements (if any) will be determined on this lower TSR performance result.
(c) The value of a participant’s entitlement and the number of shares to be acquired is determined annually on 1 October.
(d) At the expiry of the minimum three year restrictive period, and, if applicable, on the testing dates during the retesting period, transfer of legal title to some or all shares in the TSR tranche may occur. The extent to which shares are transferred is determined by a sliding scale, with 50 percent of shares vesting if the 51st percentile of the TSR performance of the comparator group is met and 100 percent of shares vesting if the 75th percentile of the TSR Performance is met.
(e) At the expiry of the three year restrictive period, transfer of legal title to some or all shares in the EPS tranche (i.e. 50 percent of shares allocated to a participant) may occur. Each year the board will, in its discretion, set the vesting scale for the EPS tranche offered that year (including the minimum and maximum vesting thresholds) having regard to current circumstances.
(f) To the extent that either the EPS or TSR performance objectives are met and any conditions on the transfer of shares are satisfied (including continued employment), legal title to the relevant number of Fletcher Building shares will be transferred to the participant and a bonus paid to the participant such that the after-tax amount of that bonus will
equal, or exceed, the outstanding balance of the loan in respect of the shares transferred, taking into account any dividends which have been paid by the company during the restrictive period including any retesting period.
(g) The restrictive period may terminate early in certain defined circumstances. These include a participant ceasing employment with the group for a qualifying reason (for example, due to redundancy or sickness), a takeover offer being made for the company or if the company is a party to a Court approved reorganisation, merger or reconstruction. If such an event occurs, a determination will be made of the extent to which the TSR and EPS performance objectives have been met at the relevant date and the extent to which legal title to the shares will pass to the participant. The bonus entitlements noted in (f) still apply to the shares transferring.
(h) To the extent that the EPS or TSR performance objectives are not met at the end of the applicable restrictive period, or if a participant ceases to be employed by the Fletcher Building group other than for a qualifying reason, some or all of the shares will be forfeited to the trustee without compensation unless the trustee in its discretion determines otherwise.
(i) During the restrictive period (including any retesting period) the shares are held by a trustee and may not be sold or used as security for another loan. Participants can direct the trustee how to vote on the shares. Participants are also entitled to the benefits of any dividends, capital returns or other distributions declared by Fletcher Building and to the benefit of any rights issues, bonus issues or other entitlements offered to shareholders. After any adjustment for additional taxation on any such distributions and entitlements, the after-tax value will be withheld by the trustee and applied in part repayment of the loan provided to acquire shares.
In circumstances where shares cannot be acquired under the applicable securities legislation, equivalent economic entitlements are conveyed by way of cash bonus entitlements.
The comparator group of Australasian companies used to determine relative TSR performances for the 2010 offer comprises Adelaide Brighton, Alesco, Amcor, Bluescope, Boral, Brickworks, Crane Group, CSR, F & P Appliances, Gunns, GWA International, James Hardie, Leighton Holdings, Nuplex, OneSteel, Sims Group and Steel & Tube. This is unchanged from that applied for the 2009 ELSS offer. The minimum and maximum EPS targets for the 2010 offer are for EPS for the year ended 30 June 2010 to increase by 8 percent per annum and 14 percent per annum respectively.
On 30 September 2010 the three year restrictive period in respect of the third issue under the EPSS ends. Present indications are that the TSR of the
Remuneration report

27
Remuneration report
company for the period will be in the 58th percentile of the comparator group of companies and accordingly participating executives will be entitled to take up ownership of around 167,000 Fletcher Building shares.
SuperannuationParticipation in defined benefit and defined contribution retirement savings plans is made available to executives as required by remuneration practices in relevant jurisdictions. For those participating, an amount to recognise the value of the employer contributions required is included in the remuneration information later in this report.
Holding the company’s securitiesA standard term in the senior executive employment contract is a requirement that, over time, senior executives must acquire and maintain a holding in the company’s ordinary shares until such time as the sum so invested, or the market value of their shareholding, exceeds 50 percent of their fixed remuneration. In meeting this obligation executives are required, from the date of receipt of the first payment under the senior executive short-term variable incentive plan, to apply at least half of the after tax proceeds so earned in acquiring shares.
The company believes this shareholding strengthens the alignment of senior executives with the interests of shareholders and puts their own remuneration at risk to long-term company performance. Apart from the long-term cash-based performance incentive schemes outlined above where an agreed percentage of any cash received is to be invested in purchasing shares, executives are left to their own discretion to organise acquiring the shares within the normal insider trading rules, and no allowance is made for the restriction on trading those shares. Directors may, in any year at their discretion, ease the share investment percentage required in terms of this policy in respect of any incentive payment arising in that year.
Shares issued to executives under the long-term incentive scheme, but still subject to the restrictive period, do not count towards the required minimum shareholding obligation.
The company does, however, allow New Zealand-based executives to meet their requirement to hold the company’s shares by having an economic exposure to the shares through a defined contribution investment account in the Fletcher Building Retirement Plan, the value of which is calculated by reference to the Fletcher Building share price.
Disclosure policyThe New Zealand Companies Act 1993 requires the disclosure of all remuneration payable over $100,000 per annum in $10,000 bands. As the company must comply with this obligation, it has chosen not to also make detailed disclosure of the remuneration of the
five highest paid executives as is considered best practice under the ASX Corporate Governance Guidelines.
Compliance with ASX corporate governance guidelinesThe company meets all the best practice requirements of the ASX Corporate Governance Council other than making detailed disclosure of the five highest executives’ remuneration. As is noted above, the company makes the remuneration disclosures required of a New Zealand company under the Companies Act 1993.

Fletcher Building Annual Report 2010
Employee remunerationSection 211 (1) (g) of the New Zealand Companies Act 1993 requires disclosure of remuneration and other benefits, including redundancy and other payments made on termination of employment, in excess of $100,000 per year, paid by the company or any of its subsidiaries worldwide to any employees who are not directors of the company. To give more appropriate information on total employees’ remuneration, where there is a contractual commitment to provide incentive remuneration in respect of the year ended 30 June 2010, the amount accrued as at 30 June 2010 has also been included in the total remuneration disclosed below.
Number of employees
From NZ$
To NZ$
International Business Activities
New Zealand Business Activities
Total
100,000 110,000 346 260 606
110,000 120,000 259 176 435
120,000 130,000 177 143 320
130,000 140,000 151 88 239
140,000 150,000 105 83 188
150,000 160,000 88 51 139
160,000 170,000 67 42 109
170,000 180,000 65 24 89
180,000 190,000 49 23 72
190,000 200,000 44 22 66
200,000 210,000 25 15 40
210,000 220,000 17 16 33
220,000 230,000 13 7 20
230,000 240,000 15 21 36
240,000 250,000 14 6 20
250,000 260,000 11 5 16
260,000 270,000 9 6 15
270,000 280,000 9 4 13
280,000 290,000 4 4 8
290,000 300,000 7 4 11
300,000 310,000 6 3 9
310,000 320,000 6 2 8
320,000 330,000 7 1 8
330,000 340,000 5 4 9
340,000 350,000 6 2 8
350,000 360,000 1 4 5
360,000 370,000 3 2 5
370,000 380,000 7 5 12
380,000 390,000 3 2 5
390,000 400,000 1 1
400,000 410,000 4 5 9
410,000 420,000 1 4 5
420,000 430,000 3 4 7
430,000 440,000 6 6
440,000 450,000 1 1
450,000 460,000 1 1 2
460,000 470,000 3 2 5
470,000 480,000 1 2 3
480,000 490,000 1 2 3
Remuneration report

29
Employee remuneration – continued
Number of employees
From NZ$
To NZ$
International Business Activities
New Zealand Business Activities
Total
490,000 500,000 3 3
500,000 510,000 3 3
510,000 520,000 1 1
520,000 530,000 1 1
550,000 560,000 1 1 2
560,000 570,000 2 2
570,000 580,000 1 1
610,000 620,000 1 1
630,000 640,000 1 1
660,000 670,000 1 1
670,000 680,000 1 1
680,000 690,000 1 1
740,000 750,000 1 1 2
760,000 770,000 1 1
770,000 780,000 2 2
790,000 800,000 1 1
810,000 820,000 1 1
910,000 920,000 1 1
920,000 930,000 1 1
950,000 960,000 1 1
1,250,000 1,260,000 1 1
1,260,000 1,270,000 1 1
1,340,000 1,350,000 1 1 2
1,730,000 1,740,000 1 1
1,561 1,058 2,619
Remuneration report

Fletcher Building Annual Report 2010
Financial reviewThe financial statements have been prepared in accordance with New Zealand standards that comply with International Financial Reporting Standards (NZ IFRS).
ResultsThe results for the year are set out in the highlights section at the beginning of this report and commentary is provided at the group level in the reviews by the chairman and chief executive. Segmental results and operating information are set out in the divisional reviews on pages 8 to 13.
Unusual itemsAs indicated in June, an unusual tax expense of NZ$29 million was incurred in the financial results for the year ended 30 June 2010. The unusual expense arises from the significant taxation announcement by the New Zealand Government in its budget in May 2010. The changes include the elimination of depreciation on buildings for tax purposes, and a reduction in the corporate taxation rate from 30 percent to 28 percent, both with effect from 1 July 2011.
Based on a review of its future tax obligations in the light of these changes, the company has assessed that it is required to increase its provision for deferred tax by NZ$29 million. The increased provision is a one-off accounting entry that is non-cash in nature and it has not affected underlying profitability or the dividend payout in respect of the 2010 financial year. Whilst the recognition of the deferred tax liability is non-cash in nature, the elimination of the tax deductibility on buildings will result in a small increase in future income tax payments.
Cashflow and capital expenditureCashflow from operations was $522 million compared with $533 million in the prior year. The continued strong positive cashflow was driven by the ongoing focus on tight working capital management and a reduction in capital expenditure. It is expected that cashflow from operations will be negatively impacted by increasing inventory and debtor levels as sustained market growth emerges.
Capital expenditure for the year was $191 million compared with $289 million in the prior year. Of this, $137 million related to “stay-in-business” capital expenditure, and $54 million to new growth initiatives. Significant projects included completion of the new port cement facility in Auckland; the upgrading of the Laminex MDF plant in Queensland, and the insulation plant investment in Victoria.
$164 million was distributed to shareholders and minority interests.
Capital management and fundingThe balance sheet continued to be strengthened during the year with positive operating cashflows used to further reduce debt levels. Gearing at 30 June 2010 was 26.8 percent compared with 31.1 percent at the end of the prior financial year. It is intended to maintain a low level of gearing until a sustained improvement has been seen in the liquidity and accessibility of both domestic and international debt markets.
The group had total available funding of $2,349 million as at 30 June 2010 including capital notes, of which $1,130 million was undrawn. Debt facilities from banks account for 50 percent of total available funding, US private placement 33 percent, and capital notes 17 percent. Debt requiring refinancing within the next 12 months is very low
04
Gearingpercentage
05 06 07 08 09
43.1
44.4
37.1
22.2
40.1
31.1
10
26.8
04
Return on fundspercentage
05 06 07 08
24.7 29
.3
26.1
24.8
19.0
3.4
10
12.7
0904
Interest covertimes
05 06 07 08
6.1
8.0
7.7 8.0
5.6
4.0
10
4.9
09
Net debt/Net debt plus equity EBIT/Interest expense EBIT/Average funds

31
at approximately $116 million. This includes $68 million of capital notes subject to interest rate and term reset, $18 million of expiring drawn facilities, and $30 million of undrawn facilities.
The average maturity of the drawn debt of $1,219 million is over 5 years and the currency split is 52 percent Australian dollar; 18 percent New Zealand dollar; 23 percent US dollar; 5 percent Euro; and 1 percent Pounds Sterling.
Approximately 93 percent of all borrowings have fixed interest rates with an average duration of 4.4 years and at a rate of 7.5 percent. Inclusive of the floating rate borrowings the average interest rate on debt is currently 7.3 percent. All interest rates are inclusive of margins but not fees.
Interest coverage for the year was 4.9 times and represents a further improvement on the 4.0 times for the prior year.
Risk management The company has an integrated programme to manage risk associated with movements in interest rates, commodity prices and exchange rates. This aims to ensure a base level of profitability and reduces volatility of earnings. Further details are provided in note 27 of the financial statements.
Retirement plansThe company operates a number of defined benefit retirement plans for its employees. The largest of these is the New Zealand plan, which has 1,180 members and pensioners and investments of $277 million at 31 March 2010. The total assets in all plans totalled $659 million at 30 June 2010.
The plans are accounted for in accordance with NZ IAS 19 Employee Benefits, which has the effect of smoothing volatility in returns by amortising the difference between expected and actual returns over the remaining life of the members. At balance date, $123 million of net losses were to be accounted for in future periods.
During the year the company contributed $24 million towards funding these plans. The group expects to contribute $22 million to its overseas defined benefit plans during the year to June 2011.
Download the financial statements: fletcherbuilding.com/10/downloads
Bill Roest Chief Financial Officer
04
Operating cashflow$million
05 06 07 08
424 47
9 560
483
434
533
10
522
09
Return on equitypercentage
04 05 06 07 08
24.3
29.5
24.6
26.0
19.0
10
9.1
-1.6
09
Total shareholder returnpercentage
04 05 06 07 08 09
32.5
61.4
42.0
-42.
9 14.1
10
24.5
40.2
Net earnings/ Average shareholders’ funds
Gross dividends plus share price appreciation/ Opening share price
Proforma earnings
Fletcher Building Group
Year endedJune 2010
NZ$M
Year endedJune 2009
NZ$M
Operating earnings before unusuals 521 558Funding costs (107) (140)Taxation expense on ordinary activities (103) (96) Earnings attributable to minority interests (10) (8)Net earnings before unusual items 301 314 Net unusual items (29) (360) Net earnings 272 (46)

Financial statements
Fletcher Building Annual Report 2010
Earnings statement For the year ended 30 June 2010
Fletcher Building Group Fletcher Building Limited
NOTESYear endedJune 2010
NZ$M
Year endedJune 2009
NZ$M
Year endedJune 2010
NZ$M
Year endedJune 2009
NZ$M
Sales 6,799 7,103
Cost of goods sold (5,141) (5,442)
Gross margin 1,658 1,661
Selling and marketing expenses (645) (668)
Administration expenses (510) (469)
Share of profits of associates 21 26 24
Other investment income/(expense) 2 2 (13)
Intercompany investment income 32 4 300
Other gains/(losses) 3 (10) 8
Unusual items - restructurings and impairments 4 (399)
Operating earnings/(loss) (EBIT) 3 521 159 (9) 300
Funding costs 6 (107) (140) (51) (74)
Earnings/(loss) before taxation 414 19 (60) 226
Taxation expense 7 (132) (57) 19 22
Earnings/(loss) after taxation 282 (38) (41) 248
Earnings attributable to minority interests (10) (8)
Net earnings/(loss) attributable to the shareholders 272 (46) (41) 248
Net earnings per share (cents) 9
Basic 44.9 (8.7)
Basic (excluding unusuals) 49.7 59.7
Diluted 44.7 (8.7)
Weighted average number of shares outstanding (millions of shares) 9
Basic 606 526
Diluted 624 526
Dividends declared per share (cents) 29.0 38.0
The accompanying notes form part of and are to be read in conjunction with these financial statements.
On behalf of the Board, 18 August 2010:
Ralph Waters Chairman of Directors
Jonathan Ling Managing Director

33
Statements of comprehensive income and movements in equity For the year ended 30 June 2010
Fletcher Building Group Fletcher Building Limited
Year endedJune 2010
NZ$M
Year endedJune 2009
NZ$M
Year endedJune 2010
NZ$M
Year endedJune 2009
NZ$M
Statement of comprehensive income
Net earnings - parent interest 272 (46) (41) 248
Net earnings - minority interest 10 8
Net earnings 282 (38) (41) 248
Movement in cashflow hedge reserve 4 (25) 4 (25)
Movement in currency translation reserve (88) 28
Income and expenses recognised directly in equity (84) 3 4 (25)
Total comprehensive income for the year 198 (35) (37) 223
Statement of movements in equity
Total equity
At the beginning of the year as previously published 2,990 2,756 1,832 1,319
Change in accounting policy (6) (6)
At the beginning of the year as restated 2,984 2,750 1,832 1,319
Total comprehensive income for the year 198 (35) (37) 223
Movement in minority equity (8) (17)
Movement in reported capital 20 535 20 535
Dividends (169) (245) (169) (245)
Movement in share option reserve 1 1
Less movement in shares held under the treasury stock method (3) (4)
Total equity 3,023 2,984 1,647 1,832
The accompanying notes form part of and are to be read in conjunction with these financial statements.

Fletcher Building Annual Report 2010
Balance sheetAs at 30 June 2010
Fletcher Building Group Fletcher Building Limited
NOTESJune 2010
NZ$MJune 2009
NZ$MJune 2010
NZ$MJune 2009
NZ$M
Assets
Current assets:
Cash and liquid deposits 15 112 99 56 39
Current tax asset 25 19 22
Debtors 16 1,114 1,112 86 74
Stocks 17 1,091 1,044
Total current assets 2,317 2,255 161 135
Non current assets:
Fixed assets 18 1,909 2,014
Goodwill 19 820 846
Intangibles 20 409 421
Investments in associates 21 189 195
Investments - other 21 70 74 3,419 3,419
Advances to subsidiaries 32 637 577
Total non current assets 3,397 3,550 4,056 3,996
Total assets 5,714 5,805 4,217 4,131
Liabilities
Current liabilities:
Provisions 22 61 96 2 2
Creditors and accruals 23 1,116 996 89 66
Current tax liability 25 25 27
Contracts 24 96 91
Borrowings 26 86 103 63 (1)
Advances from subsidiaries 32 2,345 2,026
Total current liabilities 1,384 1,313 2,499 2,093
Non current liabilities:
Provisions 22 17 20
Creditors and accruals 23 64 66
Retirement plan liability 34 44 56
Deferred taxation liability 25 49 14 (3)
Borrowings 26 1,133 1,352 74 206
Total non current liabilities 1,307 1,508 71 206
Total liabilities 2,691 2,821 2,570 2,299
Equity
Reported capital 11 1,912 1,895 1,928 1,908
Revenue reserves 12, 13 999 896 (274) (64)
Other reserves 12, 13 78 161 (7) (12)
Shareholders' funds 2,989 2,952 1,647 1,832
Minority equity 14 34 32
Total equity 3,023 2,984 1,647 1,832
Total liabilities and equity 5,714 5,805 4,217 4,131
The accompanying notes form part of and are to be read in conjunction with these financial statements.

35
Statement of cashflows For the year ended 30 June 2010
Fletcher Building Group Fletcher Building Limited
Year endedJune 2010
NZ$M
Year endedJune 2009
NZ$M
Year endedJune 2010
NZ$M
Year endedJune 2009
NZ$M
Cashflow from operating activities:
Receipts from customers 6,796 7,281 19
Dividends received 24 38 4 300
Interest received 4 1 2
Total received 6,820 7,323 24 302
Payments to suppliers, employees and other 6,100 6,531 3
Interest paid 108 148 52 74
Income tax paid 90 111
Total applied 6,298 6,790 52 77
Net cash from operating activities 522 533 (28) 225
Cashflow from investing activities:
Sale of fixed assets 38 52
Total received 38 52
Purchase of fixed assets 189 288
Purchase of investments 2 1
Purchase of subsidiaries 3
Total applied 191 292
Net cash from investing activities (153) (240)
Cashflow from financing activities:
Issue of shares 2 516 2 516
Advances from subsidiaries 262
Issue of capital notes 184 45
Total received 2 700 264 561
Net debt settlements 145 668 68 76
Repurchase of capital notes 47 93 93
Advances to subsidiaries 381
Distribution to minority shareholders 13 20
Dividends 151 226 151 226
Total applied 356 1,007 219 776
Net cash from financing activities (354) (307) 45 (215)
Net movement in cash held 15 (14) 17 10
Add opening cash and liquid deposits 99 111 39 29
Effect of exchange rate changes on net cash (2) 2
Closing cash and liquid deposits 112 99 56 39
The accompanying notes form part of and are to be read in conjunction with these financial statements.

Fletcher Building Annual Report 2010
Fletcher Building Group Fletcher Building Limited
Year endedJune 2010
NZ$M
Year endedJune 2009
NZ$M
Year endedJune 2010
NZ$M
Year endedJune 2009
NZ$M
Cash was received from:
Net earnings 272 (46) (41) 248
Earnings attributable to minority interests 10 8
282 (38) (41) 248
Adjustment for items not involving cash:
Depreciation, depletions, amortisation and provisions 198 129
Unusual items included in earnings 336
Taxation 42 (54) (19) (22)
Non cash adjustments 240 411 (19) (22)
Cashflow from operations 1 522 373 (60) 226
Less (gain)/loss on disposal of affiliates and fixed assets (10) 2
Cashflow from operations before net working capital movements 512 375 (60) 226
Net working capital movements 10 158 32 (1)
Net cash from operating activities 2 522 533 (28) 225
Net working capital movements:
Debtors (8) 203 (12) (13)
Stocks (70) 101
Contracts 6 (24)
Creditors 82 (122) 44 12
10 158 32 (1)
1 Includes (gain)/loss on disposal of affiliates and fixed assets.2 As per the statement of cashflows.
The accompanying notes form part of and are to be read in conjunction with these financial statements.
Reconciliation of net earnings to net cash from operating activities For the year ended 30 June 2010

37
Accounting policies
Basis of presentationThe financial statements presented are those of Fletcher Building Limited (the company) and its subsidiaries (the group). Fletcher Building Limited is a company domiciled in New Zealand, is registered under the Companies Act 1993, and is an issuer in terms of the Securities Act 1978 and the Financial Reporting Act 1993. The registered office of the company is 810 Great South Road, Penrose, Auckland. Fletcher Building Limited is a profit oriented entity.
The financial statements comprise the earnings statement, statement of comprehensive income, statement of movements in equity, balance sheet, statement of cashflows, and significant accounting policies, as well as the notes to these financial statements.
Accounting conventionThe financial statements are based on the general principles of historical cost accounting, except that financial assets and liabilities as described below are stated at their fair value. These financial statements have been prepared in accordance with Generally Accepted Accounting Practice in New Zealand which is the New Zealand equivalent to International Financial Reporting Standards (NZ IFRS). They also comply with International Financial Reporting Standards.
The accounting policies have been applied consistently by all group entities, except as disclosed in note 1, changes in accounting policies.
Segmental reportingSegmental information is presented in respect of the group’s industry and geographical segments. The use of industry segments as the primary format is based on the group’s management and internal reporting structure, which recognises groups of assets and operations with similar risks and returns. Inter-segment pricing is determined on an arm’s length basis.
EstimatesThe preparation of financial statements in conformity with NZ IFRS requires the directors to make estimates and assumptions that affect the reported amounts of assets and liabilities, disclosure of contingent assets and liabilities at the date of the financial statements and the reported amounts of sales and expenses during the reporting period. Actual results could differ from those estimates. The estimates and assumptions are reviewed on an ongoing basis. For further information on areas of estimation and judgement, refer to the notes to the financial statements, in particular note 19.
Basis of consolidationThe consolidated financial statements comprise the company and its subsidiaries and the group’s interest
in associates, partnerships and joint ventures. Inter-company transactions are eliminated in preparing the consolidated financial statements.
SubsidiariesSubsidiaries are included in the consolidated financial statements using the acquisition method of consolidation, from the date control commences until the date control ceases.
AssociatesThe equity method has been used for associate entities in which the group has a significant but not controlling interest.
Goodwill on acquisitionFair values are assigned to the identifiable assets and liabilities of subsidiaries and associates of the group at the date they are acquired. Goodwill arises to the extent of the excess of the cost of the acquisition over the fair value of the assets and liabilities.
Goodwill is stated at cost, less any impairment losses. Goodwill is allocated to cash generating units and is not amortised, but is tested annually for impairment. Goodwill in respect of associates is included in the carrying amount of associates. Negative goodwill, or a discount on acquisition is recognised directly in earnings on acquisition.
Joint ventures and partnershipsWhere the ownership interest in the joint venture is in the net residue of the business and does not give rise to an economic or controlling interest in excess of 50 percent, the share of the net assets and liabilities and earnings of the investment is included on an equity basis. If the interest does give rise to a controlling interest in excess of 50 percent, the investment is consolidated.
Joint ventures in which the ownership interest is directly in the assets and liabilities, rather than the net residue, are included on a proportional basis with assets, liabilities, revenues and expenses based on the group’s proportional interest.
Valuation of assetsLand, buildings, plant and machinery, fixtures and equipmentThe cost of purchasing land, buildings, plant and machinery, fixtures and equipment is the value of the consideration given to acquire the assets and the value of other directly attributable costs which have been incurred in bringing the assets to the location and the condition necessary for their intended service, including subsequent expenditure.
The costs of self constructed assets include, where appropriate, the costs of all materials used in construction, direct labour on the project, site preparation and installation costs, costs of obtaining resource consents, financing costs that are directly attributable to the project, variable and fixed overheads and unrecovered operating costs incurred during planned commissioning. Costs cease to be capitalised as soon as the asset is ready for

Fletcher Building Annual Report 2010
productive use. All feasibility costs are expensed as incurred.
Leases in which the group assumes substantially all the risks and rewards of ownership are classified as finance leases and are measured at the lower of their fair value or the present value of the minimum lease payments at the inception of the lease.
Land, buildings, plant and machinery, leased assets and fixtures and equipment are stated at cost, less accumulated depreciation.
InvestmentsInvestments are valued at historical cost. Impairments in the value of investments are written off to earnings as they arise.
StocksTrading stock, raw materials and work in progress are valued at the lower of cost or net realisable value, determined principally on the first-in, first-out basis. Cost includes direct manufacturing costs and manufacturing overheads at normal operating levels.
DebtorsDebtors are valued at estimated net realisable value. The valuation is net of a specific provision maintained for doubtful debts. All known losses are written off to earnings in the period in which it becomes apparent that the debts are not collectable. Trade debtors normally have 30 to 90 day terms.
Construction work in progressConstruction work in progress is stated at cost plus profit recognised to date, less progress billings and any provision for foreseeable losses. Cost includes all expenditure directly related to specific projects and an allocation of fixed and variable overheads incurred in the group’s contract activities based on normal operating capacity.
CashCash and liquid deposits comprise cash and demand deposits with banks or other financial institutions and highly liquid investments that are readily convertible to cash.
ImpairmentImpairment is deemed to occur when the recoverable amount falls below the book value of the asset. The recoverable amount is determined to be the greater of the fair value, less disposal costs or the sum of expected future discounted net cashflows arising from the ownership of the asset. Future net cashflows take into account the remaining useful life and the expected period of continued ownership, including any intended disposals, and any costs or proceeds expected to eventuate at the end of the remaining useful life or the end of the expected period of continued ownership.
For the purposes of considering whether there has been an impairment, assets are grouped at the lowest level for which there are identifiable cashflows
that are largely independent of the cashflows of other groups of assets. When the book value of a group of assets exceeds the recoverable amount an impairment loss arises and is recognised in earnings immediately.
Goodwill and brands with an indefinite life are tested for impairment in June of each year. Other assets are tested for impairment when an indication of impairment exists.
BrandsBrands for which all relevant factors indicate that there is no limit to the foreseeable net cashflows, are considered to have an indefinite useful life and are held at cost and are not amortised, but are subject to an annual impairment test.
Retirement plansThe group’s net asset in respect of its retirement plans is calculated separately for each plan by an independent actuary, as being the fair value of the plan’s assets less the present value of the future obligations to the members. The value of the asset recognised cannot exceed in aggregate the total value of any deferred actuarial loss, the present value of any future refunds from the plans or reductions in future contributions to the plans.
Foreign currencyTranslation of the financial statements of foreign operationsThe assets and liabilities of the group’s overseas operations are translated into New Zealand currency at the rates of exchange ruling at balance date. The revenue and expenditure of these entities are translated using an average exchange rate reflecting an approximation of the appropriate transaction rates. Exchange variations arising on the translation of these entities are recognised directly in the currency translation reserve.
Exchange differencesMonetary assets and liabilities in foreign currencies at balance date which are not covered by forward exchange contracts are translated at the rates of exchange ruling at balance date. Monetary assets and liabilities in foreign currencies at balance date which are covered by forward exchange contracts are effectively translated at the exchange rates specified in those contracts.
Non-monetary assets and liabilities in foreign currencies are translated at the exchange rates in effect when the amounts of these assets and liabilities were determined.
Net investments in foreign operationsExchange differences arising from the translation of the net investment in foreign operations, and of related hedges, are taken to the currency translation reserve and are released to earnings upon disposal.
Accounting policies

Accounting policies
39
Financial instrumentsNon-derivative financial instrumentsNon-derivative financial instruments comprise borrowings, trade and other payables, cash and cash equivalents, and trade and other receivables.
Non-derivative financial instruments are recognised initially at fair value. Subsequent to initial recognition, non-derivative financial instruments are measured at amortised cost using the effective interest method, less any impairment losses.
Derivative financial instrumentsDerivative financial instruments including foreign exchange contracts, interest rate swaps, currency swaps, options, forward rate agreements and commodity price swaps are utilised to reduce exposure to market risks.
Group policy specifically prohibits the use of derivative financial instruments for trading or speculative purposes. All the group’s derivative financial instruments are held to hedge risk on underlying assets, liabilities and forecast and committed trading transactions.
The fair values of derivative financial instruments, as disclosed in the financial instrument note, are determined by applying quoted market prices.
The group holds derivative instruments until expiry except where the underlying rationale from a risk management point of view changes, such as when the underlying asset or liability which the instrument hedges no longer exists, in which case early termination occurs.
Derivative financial instruments are initially recorded at fair value and are then revalued to fair value at each balance sheet date. The gain or loss on revaluation is recorded either in earnings or equity depending on whether the instruments qualify for hedge accounting and the nature of the item being hedged. For a derivative instrument to be classified and accounted for as a hedge, it must be highly correlated with, and effective as a hedge of the underlying risk being managed. This relationship must be documented from inception.
Fair value hedgesWhere a derivative financial instrument is designated as a hedge of a recognised asset or liability, or of a firm commitment, any gain or loss is recognised directly in earnings together with any changes in the fair value of the hedged risk.
Cashflow hedgesWhere a derivative financial instrument is designated as a hedge of the variability in cashflows of assets or liabilities, or of a highly probable forecasted transaction, the effective part of any gain or loss is recognised directly in the cashflow hedge reserve within equity and the ineffective part is recognised immediately in earnings. The effective portion is transferred to earnings when the underlying cashflows affect earnings.
Net investment hedges Where the derivative financial instruments are designated as a hedge of a net investment in a foreign operation, the derivative financial instruments are accounted for on the same basis as cashflow hedges through the currency translation reserve within equity.
Derivatives that do not qualify for hedge accountingWhere a derivative financial instrument does not qualify for hedge accounting, or where hedge accounting has not been elected, any gain or loss is recognised directly in earnings.
Valuation of liabilitiesTaxationThe provision for current tax is the estimated amount due for payment during the next 12 months by the group. The provision for deferred taxation has been calculated using the balance sheet liability method. Deferred tax is recognised on the temporary difference between the carrying amount of assets and liabilities and their taxable value.
Deferred tax assets are not recognised on temporary differences and tax losses unless recovery is considered probable.
Finance leasesFinance leases are capitalised to reflect the borrowings incurred and the cost of the asset acquired. Such obligations are classified within borrowings. The finance cost portion of lease payments is written off to earnings. The leased asset is depreciated on a straight line basis over the estimated useful life of the asset with regard to residual values.
BorrowingsInterest bearing borrowings are initially recognised at fair value.
CreditorsTrade creditors and other liabilities are stated at cost or estimated liability where accrued.
Annual leaveAnnual leave is recognised on an accrual basis.
ProvisionsA provision is recognised when the group has a current obligation and it is probable that economic benefits will be required to settle it.
Intercompany guaranteesWhere the company enters into financial guarantee contracts to guarantee the performance or indebtedness of other companies within the group, the company considers these to be insurance arrangements and accounts for them as such. In this respect, the company treats the guarantee contract as a contingent liability until such time as it becomes probable that the company will be required to make a payment under the guarantee.

Fletcher Building Annual Report 2010
Accounting policies
EquityShare capitalOrdinary shares are classified as shareholders funds. Costs directly attributable to the issue of new shares or options are shown in shareholders funds as a reduction from the proceeds.
Dividends are recognised as a liability in the period in which they are declared.
Where a member of the group purchases the company’s share capital the consideration paid is deducted from equity under the treasury stock method as if the shares are cancelled, until they are reissued or otherwise disposed of.
Income determinationSales recognitionSales are recognised in accordance with the terms of sale when the benefits of ownership and risk of loss passes to the customer. Earnings on residential contracts are recognised on settlement.
Construction contractsEarnings on construction contracts (including sub-contracts) are determined using the percentage-of-completion method. Earnings are not recognised until the outcome can be reliably estimated. The company uses its professional judgement to assess both the physical completion and the forecast financial result of the contract. Provision is made for estimated future losses on the entire contract from the date it is first recognised that a contract loss may be incurred.
Investment revenueDividends and distributions are taken to earnings when received, or accrued where declared prior to balance date.
Funding costsNet funding costs comprise interest expense, interest income, amortisation of prepaid expenses and gains/losses on certain financial instruments that are recognised in earnings.
DepreciationDepreciation of fixed assets is calculated on the straight line method. Expected useful lives, which are regularly reviewed on a weighted average basis are:
Buildings 30 years
Plant and machinery 13 years
Fixtures and equipment 5 years
Leased assets capitalised 10 years
Leasing commitmentsExpenditure arising from operating leasing commitments is written off to earnings in the period in which it is incurred.
Retirement plan expenseObligations for contributions to defined contribution plans are recognised in earnings as incurred.
The actuarial cost of providing benefits under defined benefit plans is expensed as it accrues over the service life of the employees, after taking account of the income expected to be earned by the assets owned by the plans.
All actuarial gains or losses are amortised to earnings over the remaining average service life of plan members employed by the group.
Long service leaveLong service leave is recognised in earnings on an actuarial basis.
Research and developmentExpenditure on research activities is recognised in earnings as incurred.
Executive share schemesThe company has implemented long term cash-based performance incentive schemes targeted at the company’s executives most able to influence the results of the company with an agreed percentage of any cash received to be invested in purchasing the company’s shares.
The executive performance share scheme introduced in 2004 allows group executives to acquire shares in the company at market price, funded by an interest free loan from the group. The executives are entitled to vote on the shares and to receive cash dividends, the proceeds of which are used to repay the loan. The shares are held in trust for the executives by the Trustee, Fletcher Building Share Schemes Limited. Payment of any benefit under the executive performance share scheme is dependent upon the group’s total shareholder return exceeding the 51st percentile of the total shareholder return of a comparative group of companies over a three year restricted period.
In 2008, the executive long-term share scheme was introduced for a small number of senior executives. Payment of half of any benefit is dependent upon total shareholder return and payment of the other half of any benefit is dependent upon the group achieving an earnings per share target. In addition, in respect of the benefit which is dependent on total shareholders return, the three year restricted period is automatically extended for up to one year if total shareholders return is less than the 51st percentile. Executives can elect to extend the restricted period for up to one year if total shareholders return is between the 51st and 75th percentile. No extension is permitted for the benefit which is dependant upon achieving an earnings per share target. In 2009, all eligible executives joined the executive long-term share scheme. The executive performance share scheme was not offered to executives in 2009 and will terminate in 2011.
At the end of the restricted period or any extension, the group will pay a bonus to the executives to the extent that performance targets have been met, the after tax amount of which will be sufficient for the executives to repay the balance of the loan for the shares which vest.

Accounting policies
41
If the performance obligations are not met or are only partially met, the trustee will acquire the beneficial interest in some or all of the shares. The loan provided in respect of those shares which do not transfer to the executives (the forfeited shares) will be novated to the trustee and will be fully repaid by the transfer of the forfeited shares.
The group will recognise an expense in earnings over the restricted period to provide for the maximum bonus payable.
The group is accounting for the share schemes under the treasury stock method. The receivable owing from the executives, representing the shares held in the group, is deducted from the group’s paid up capital. If the performance targets based on total shareholder return are not met and the shares do not vest, the after tax amount of the bonus provision will be transferred to equity and will not be released to earnings. If the performance targets based on earnings per share are not met and the shares do not vest, the after-tax amount of the bonus provision will be released to earnings. The shares will continue to be deducted from equity until they are disposed of by the trustee. To the extent that the performance targets are met and the shares vest the bonus will be paid enabling repayment of the loan, and to the extent of this loan repayment paid up capital will increase.

Notes to the financial statements
Fletcher Building Annual Report 2010
3. Operating earnings
Fletcher Building Group Fletcher Building Limited
Year endedJune 2010
NZ$M
Year endedJune 2009
NZ$M
Year endedJune 2010
NZ$M
Year endedJune 2009
NZ$M
Operating earnings includes:
Net periodic pension cost 21 16
Employee related short term costs 1 1,135 1,192
Other long term employee related benefits 45 38
Research and development 3 2
Bad debts written off 8 15
Foreign exchange in trading accounts (2) (1) 13
Donations and sponsorships 1 2
Maintenance and repairs 160 175
Operating lease expense 142 135
Other gains/(losses) 2 (10) 8
Auditors' fees and expenses payable for:
Statutory audit - KPMG 3 4
Other services - KPMG 3 1 1
(10) 8
1 Remuneration for the executive committee included in the above is disclosed in note 32.
2 Other gains/(losses) include the following:
1. Changes in accounting policiesDuring the year, the group complied with amendments to NZ IAS 38, Intangible Assets. This standard requires the group to expense marketing stock, previously capitalised. A charge of $6 million has been recorded against opening equity to reflect this change.
The International Accounting Standards Board has issued a number of other standards, amendments and interpretations which are not yet effective. The group has not yet applied these in preparing these financial statements although the application of these standards, amendments and interpretations would require further disclosures, but they are not expected to have a material impact on the group’s results.
There have been no other changes in accounting policies in the year ended 30 June 2010, however certain comparatives have been restated to conform with the current year’s presentation.
2. AcquisitionsDuring the 2010 year the group did not acquire any subsidiaries (2009: $3 million).
Sale of land 13 12
Net redundancies and restructuring costs (20)
Other (3) (4)
(10) 8
3 Fees paid to the auditors during the year for other services are mainly with respect to the half year review, other assurance services and tax compliance work.

Notes to the financial statements
43
4. Unusual items
Fletcher Building Group Fletcher Building Limited
Year endedJune 2010
NZ$M
Year endedJune 2009
NZ$M
Year endedJune 2010
NZ$M
Year endedJune 2009
NZ$M
Restructuring and redundancy 117
Goodwill impairment 61
Fixed asset impairment 166
Write-off of stock 47
Write-off of investments 8
Total unusual items - EBIT 399
Write-off of tax losses 60
Tax benefit (99)
Tax expense - recognition of deferred tax liability on buildings (NZ) 29
Total unusual cost - net earnings 29 360
5. Discontinued operationsThere were no discontinued operations in either the current or the comparative year.
6. Funding costs
Interest expense:
Loans and derivatives 49 98 8 4
Capital notes 38 36 13 16
Other 9
Subsidiary companies 28 54
Interest income:
Cash and deposits (1) (3) (1) (2)
95 131 48 72
Plus bank fees, registry and issue expenses 12 9 3 2
107 140 51 74
Included in interest expense above is the net settlement of the group’s interest rate swaps. This consisted of $51 million of interest income and $58 million of interest expense (2009: $53 million interest income; $50 million interest expense).
For the year ended 30 June 2010 the group incurred an unusual tax expense of $29 million. This arises from the significant tax changes announced by the New Zealand Government in its budget in May 2010, which includes the elimination of depreciation on buildings for tax purposes, and a reduction in the corporate tax rate. This has resulted in an increase in the provision for deferred tax of $29 million. During the year ended 30 June 2009 the group incurred $360 million of unusual items. Refer to the Fletcher Building 2009 annual report for further details.

Notes to the financial statements
Fletcher Building Annual Report 2010
7. Taxation expense
Fletcher Building Group Fletcher Building Limited
Year endedJune 2010
NZ$M
Year endedJune 2009
NZ$M
Year endedJune 2010
NZ$M
Year endedJune 2009
NZ$M
Earnings before taxation 414 19 (60) 226
Taxation at 30 cents per dollar 124 6 (18) 68
Adjusted for:
Benefit of lower tax rate in overseas jurisdictions (1) 2
Tax benefit arising from the conversion of branch equivalent tax account debit balance (31)
Non assessable income (6) (6) (1) (90)
Non deductible expenses 4 28
Write-off of tax losses 60
Tax losses not recognised 7
Benefit of tax losses not recognised (3)
Tax in respect of prior years (8) 1
Valuation allowance 29
Recognition of deferred tax liability on buildings (NZ) 29
Other permanent differences (15) (31)
132 57 (19) (22)
Tax on operating profits pre unusual items 103 96 (19) (22)
Tax benefit of unusual items (99)
Unusual tax expense - recognition of deferred tax liability on buildings (NZ) 29
Unusual tax expense - write-off of tax losses 60
132 57 (19) (22)
Total current taxation expense 112 (6) (19) (22)
Total deferred taxation expense 20 63
132 57 (19) (22)

Notes to the financial statements
45
8. Shareholder tax credits
Fletcher Building Group Fletcher Building Limited
Year endedJune 2010
NZ$M
Year endedJune 2009
NZ$M
Year endedJune 2010
NZ$M
Year endedJune 2009
NZ$M
Imputation credit account
Imputation credits at the beginning of the year (22) 28 (23) (55)
Taxation paid 33 14
Imputation credits received 3 2 37 98
Imputation credits attached to dividends paid (27) (66) (27) (66)
(13) (22) (13) (23)
Fletcher Building Limited has until 31 March 2011 to fund any deficiency in its imputation credit account.
Franking credit account
Franking credits at the beginning of the year 7 19
Taxation paid 8 28
Franking credits received 6 2 1 42
Franking credits attached to dividends paid (42) (42)
21 7 1
Branch equivalent tax account
Branch equivalent tax account at 1 April 2009 32 39
Utilisation of branch equivalent tax account (32) (7)
Branch equivalent tax account at 31 March 2010 32

Notes to the financial statements
Fletcher Building Annual Report 2010
Fletcher Building Group Fletcher Building Limited
Year endedJune 2010
NZ$M
Year endedJune 2009
NZ$M
Year endedJune 2010
NZ$M
Year endedJune 2009
NZ$M
Numerator
Net earnings 272 (46)
Numerator for basic earnings per share 272 (46)
Dilutive capital notes distribution 7
Numerator for diluted net earnings per share 279 (46)
Denominator (millions of shares)
Denominator for basic net earnings per share 606 526
Conversion of dilutive capital notes 18
Denominator for diluted net earnings per share 624 526
10. Dividends
Dividends paid to shareholders 169 245 169 245
169 245 169 245
On 18 August 2010 the directors declared a dividend of 15 cents per share, payable on 20 October 2010.
11. Capital
Reported capital at the beginning of the year 1,908 1,373 1,908 1,373
Issue of shares 20 546 20 546
Cost of share issue (11) (11)
Reported capital at the end of the year including treasury stock 1,928 1,908 1,928 1,908
Treasury stock (16) (13)
1,912 1,895 1,928 1,908
All ordinary shares are issued and fully paid, and carry equal rights in respect of voting, dividend payments and distribution upon winding up. Costs directly attributable to the issue of new shares are shown as a deduction from the proceeds. Shares held by the trustee of the Fletcher Building executive performance share scheme and the executive long-term share scheme are deducted from the group’s capital until the shares vest, are reissued or otherwise disposed of. When such shares do vest, are reissued or otherwise disposed of, any consideration received is included in the group’s equity.
Number of ordinary shares:
Number of shares on issue at the beginning of the year 604,466,028 503,361,742 604,466,028 503,361,742
Issue of shares 291,174 98,417,199 291,174 98,417,199
Shares issued under the dividend reinvestment plan 2,189,791 2,687,087 2,189,791 2,687,087
Total number of shares on issue 606,946,993 604,466,028 606,946,993 604,466,028
Less accounted for as treasury stock (1,901,981) (1,543,586)
605,045,012 602,922,442 606,946,993 604,466,028
9. Net earnings per share The diluted net earnings per share calculation uses the weighted average number of shares as determined for basic net earnings per share, adjusted for dilutive securities. Capital notes and options are convertible into the company’s shares and are therefore considered dilutive securities for diluted net earnings per share. Fletcher Building may, at its option, purchase or redeem the capital notes for cash at the principal amount plus any accrued but unpaid interest. For the year ended 30 June 2009, all capital notes were anti-dilutive.

Notes to the financial statements
47
11. Capital – continued Share options:On 1 September 2006, the Company issued 500,000 share options under the executive option scheme. The exercise price of the share options is $9.24 and is increased annually by the company’s cost of capital, less actual dividends paid. As at 30 June 2010 the exercise price is $10.33. The final exercise date is 1 September 2012. A further 500,000 share options were issued on 8 September 2009, at an exercise price of $7.78 and is increased annually by the company’s cost of capital less actual dividends paid. As at 30 June 2010 the exercise price is $8.03. The restrictive period is until 1 September 2012 and the final exercise date is 1 September 2015. The options carry no dividend or voting rights. The company has calculated the fair value of granting these options and has expensed $615,000 in respect of the 2006 share options and $196,000 in respect of the 2009 share options to an option premium reserve.
12. Reserve balances
Fletcher Building Group Fletcher Building Limited
June 2010NZ$M
June 2009NZ$M
June 2010NZ$M
June 2009NZ$M
Reserves comprise:
Retained earnings 999 896 (274) (64)
Cashflow hedge reserve (8) (12) (8) (12)
Share option reserve 1 1
Currency translation reserve 85 173
1,077 1,057 (281) (76)
13. Reserve movements
Retained earnings
Retained earnings at the beginning of the year as previously published 902 1,193 (64) (67)
Changes in accounting policy (6) (6)
896 1,187 (64) (67)
Net earnings for the year - parent interest 272 (46) (41) 248
Dividends paid during the year (169) (245) (169) (245)
999 896 (274) (64)
Share option reserve
Share option reserve at the beginning of the year
Arising in the year 1 1
1 1
Cashflow hedge reserve
Cashflow hedge reserve at the beginning of the year (12) 13 (12) 13
Arising in the year 4 (25) 4 (25)
(8) (12) (8) (12)
Currency translation reserve
Currency translation reserve at the beginning of the year 173 145
Arising in the year (88) 28
85 173

Notes to the financial statements
Fletcher Building Annual Report 2010
16. Debtors
Trade debtors 821 808
Contract debtors 116 74
Contract retentions 20 36
Less provision for doubtful debts (35) (33)
Trade and contract debtors 922 885
Other receivables 192 227 86 74
1,114 1,112 86 74
Current 721 673
0 – 30 days over standard terms 163 163
31 – 60 days over standard terms 24 28
61+ days over standard terms 49 54
Provision (35) (33)
Trade and contract debtors 922 885
17. Stocks
Raw materials 322 327
Work in progress 113 110
Finished goods 599 551
Consumable stores and spare parts 57 56
1,091 1,044
Stock held at cost 1,074 1,022
Stock held at net realisable value 17 22
1,091 1,044
The group also has conditional commitments for the purchase of land to be used for residential construction totalling $106 million (June 2009 $76 million). Delivery of this land is expected to take place over the period to 2012.
14. Minority equity
Fletcher Building Group Fletcher Building Limited
June 2010NZ$M
June 2009NZ$M
June 2010NZ$M
June 2009NZ$M
Share capital 23 26
Reserves 11 6
34 32
15. Cash and liquid deposits
Cash and bank balances 61 63 6 9
Short-term deposits 51 36 50 30
112 99 56 39

Notes to the financial statements
49
18. Fixed assets
Fletcher Building Group
LandNZ$M
BuildingsNZ$M
Plant & Machinery
NZ$M
Fixtures &Equipment
NZ$M
ResourceExtraction
NZ$M
LeasedAssetsNZ$M
TotalNZ$M
Gross value at 1 July 2009 261 408 1,915 335 102 2 3,023
Additions 16 146 22 5 189
Disposals (13) (39) (20) (3) (1) (76)
Currency translation (10) (14) (58) (3) (85)
Gross value at 30 June 2010 238 410 1,964 334 104 1 3,051
Accumulated depreciation at 1 July 2009 (82) (680) (232) (13) (2) (1,009)
Disposals 3 26 15 3 1 48
Depreciation expense (17) (152) (31) (6) (206)
Currency translation 3 20 2 25
Accumulated depreciation at 30 June 2010 (93) (786) (246) (16) (1) (1,142)
Net book value at 30 June 2010 238 317 1,178 88 88 1,909
Gross value at 1 July 2008 265 409 1,777 364 94 5 2,914
Additions 4 18 231 28 12 293
Disposals (9) (27) (41) (25) (3) (3) (108)
Impairments in the income statement (3) (140) (33) (176)
Other movements 6 75 81
Currency translation 1 5 13 1 (1) 19
Gross value at 30 June 2009 261 408 1,915 335 102 2 3,023
Accumulated depreciation at 1 July 2008 (60) (496) (214) (11) (4) (785)
Disposals 4 25 20 3 2 54
Impairments in the income statement 2 8 10
Depreciation expense (19) (149) (38) (5) (211)
Other movements (10) (71) (81)
Currency translation 1 3 4
Accumulated depreciation at 30 June 2009 (82) (680) (232) (13) (2) (1,009)
Net book value at 30 June 2009 261 326 1,235 103 89 2,014
As at 30 June 2010, fixed assets includes $83 million of assets under construction (June 2009 $110 million).

Notes to the financial statements
Fletcher Building Annual Report 2010
19. Goodwill
Fletcher Building Group Fletcher Building Limited
June 2010NZ$M
June 2009NZ$M
June 2010NZ$M
June 2009NZ$M
Goodwill acquired at cost 802 804
Accumulated currency translation 79 103
Accumulated impairment (61) (61)
Goodwill at the end of the year 820 846
Goodwill at the beginning of the year 846 854
Acquisition restatement during the year (2) 4
Impaired during the year (61)
Currency translation (24) 49
820 846
Formica Asia 284 302
The Laminex Group 176 179
Stramit Corporation 111 115
Fletcher Insulation Australia 92 93
Forman Insulation 46 46
Tasman Insulation New Zealand 43 43
Tasman Sinkware 42 42
Other subsidiaries 26 26
Goodwill by major subsidiaries 820 846
Impairment of goodwillGoodwill has been tested for impairment in June 2010. Each business unit which carries goodwill has prepared a discounted cashflow on a value-in-use basis. They have used their past experience of sales growth, operating costs and margin, and external sources of information where appropriate, to determine their expectations for the future. These cashflow projections are based on the group’s three year strategic plan approved by the directors, which has been extended for a further two years. Cashflows beyond the five year period have been extrapolated using estimated terminal growth rates which do not exceed the long term average growth rate for the industries in which the business units operate. The growth rates used range from two percent to three percent, with the majority of the business units using two percent. The cashflows are discounted using a nominal rate of ten percent after tax, with the exception of Formica which has used nine percent. This adjustment to the standard rate of ten percent reflects the risk profile for the countries in which Formica operates. The valuation models used are most sensitive to changes in the terminal year earnings and cashflows.
The group has identified certain business units which face particular challenges. The group operates in cyclical markets and currently faces uncertain market conditions that make it difficult to predict future profitability. Residential markets have declined in New Zealand, Australia, the USA, Spain and the UK, however there are reasonable growth prospects in Asia. There is also divergence in those markets between the prospects for infrastructure and commercial activities. The exercise confirmed that there is headroom over the carrying value and based on the analysis performed there are no impairment issues necessitating a further write-down of goodwill. New management have been appointed in certain business units to achieve an appropriate improvement in their operating earnings. If this improvement does not eventuate there may be a need for a future impairment.
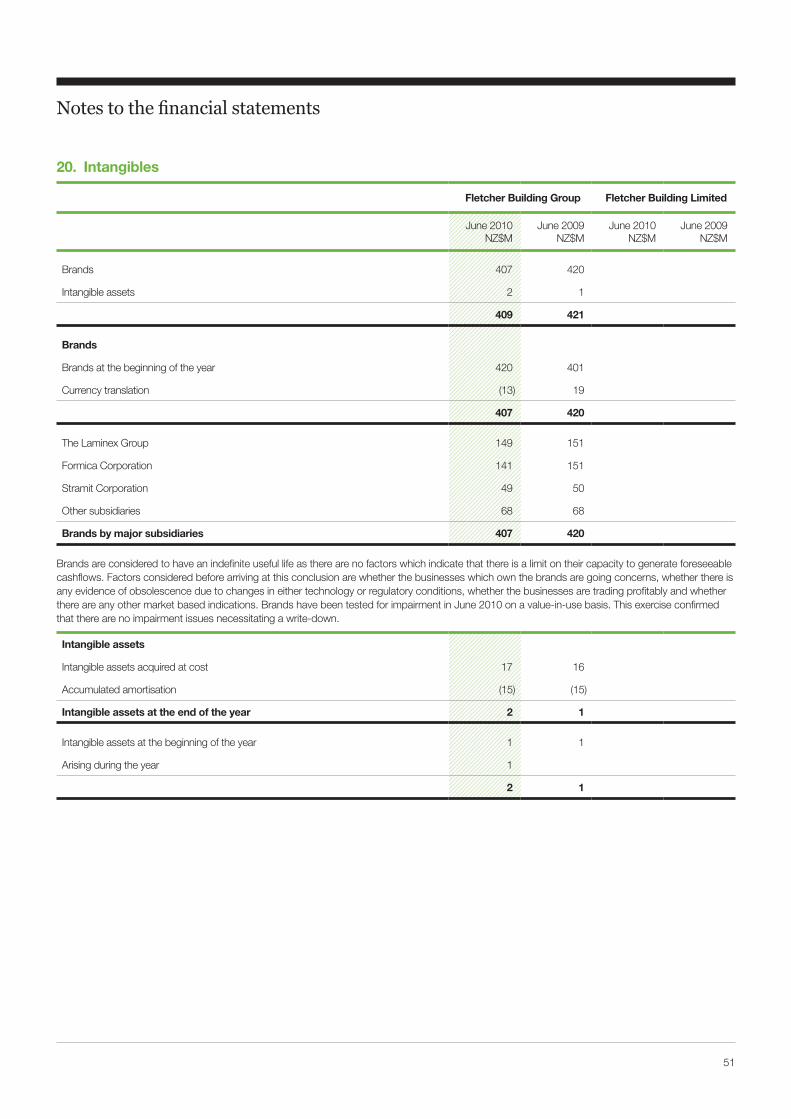
Notes to the financial statements
51
20. Intangibles
Fletcher Building Group Fletcher Building Limited
June 2010NZ$M
June 2009NZ$M
June 2010NZ$M
June 2009NZ$M
Brands 407 420
Intangible assets 2 1
409 421
Brands
Brands at the beginning of the year 420 401
Currency translation (13) 19
407 420
The Laminex Group 149 151
Formica Corporation 141 151
Stramit Corporation 49 50
Other subsidiaries 68 68
Brands by major subsidiaries 407 420
Brands are considered to have an indefinite useful life as there are no factors which indicate that there is a limit on their capacity to generate foreseeable cashflows. Factors considered before arriving at this conclusion are whether the businesses which own the brands are going concerns, whether there is any evidence of obsolescence due to changes in either technology or regulatory conditions, whether the businesses are trading profitably and whether there are any other market based indications. Brands have been tested for impairment in June 2010 on a value-in-use basis. This exercise confirmed that there are no impairment issues necessitating a write-down.
Intangible assets
Intangible assets acquired at cost 17 16
Accumulated amortisation (15) (15)
Intangible assets at the end of the year 2 1
Intangible assets at the beginning of the year 1 1
Arising during the year 1
2 1

Notes to the financial statements
Fletcher Building Annual Report 2010
21. Investments
Fletcher Building Group Fletcher Building Limited
June 2010NZ$M
June 2009NZ$M
June 2010NZ$M
June 2009NZ$M
Investments:
Investment in associates 189 195
Investment in other companies 1
Retirement plan surplus - see note 34 70 73
Investment in subsidiary companies1 3,419 3,419
259 269 3,419 3,419
Carrying amount of associates:
Carrying amount at the beginning of the year 195 214
Loans to associates 3 1
Equity accounted earnings of associates 26 24
Impairment of associate (8)
Currency translation (13) 1
Dividends from associates (22) (37)
Investment in associates 189 195
Investment by associate:
Homapal Plattenwerk GmbH & Co. KG. 53 65
Westpine Industries Pty Limited 51 53
Dynea Industries WA Pty Limited 21 21
Sims Pacific Metals Limited 21 14
Mt Marrow Blue Metal Quarries Pty Limited 10 10
Mittagong Sands Pty Limited 5 6
Other 28 26
189 195
Associate information:
Balance sheet information for associates - 100%
Assets 362 332
Liabilities (186) (174)
Equity 176 158
Equity - Fletcher Building share 67 71
Goodwill acquired at cost 104 109
Plus loans to associates at the end of the year 18 15
Investment in associates 189 195
Equity accounted earnings comprise:
Sales - 100% 556 582
Earnings before taxation – 100% 64 48
Earnings before taxation - Fletcher Building share 32 28
Taxation expense (6) (4)
Earnings after taxation - Fletcher Building share 26 24
1 The principal subsidiaries included within investment in subsidiary companies are disclosed in note 33, principal operations.

Notes to the financial statements
53
22. Provisions
June 2010 Fletcher Building Group
Restructuring NZ$M
Construction Claims NZ$M
Property NZ$M
Warranty & Environmental
NZ$M Other NZ$M
TotalNZ$M
Carrying amount at the beginning of the year 60 6 2 30 18 116
Currency translation (4) (2) (6)
Charged to earnings 4 1 9 1 15
Settled or utilised (28) (1) (1) (7) (2) (39)
Released to earnings (6) (1) (1) (8)
26 5 1 30 16 78
June 2009
Carrying amount at the beginning of the year 23 10 3 29 12 77
Currency translation 1 1 2
Charged to earnings 68 1 2 6 77
Settled or utilised (30) (3) (1) (1) (1) (36)
Released to earnings (1) (2) (1) (4)
60 6 2 30 18 116
June 2010 Fletcher Building Limited
Carrying amount at the beginning of the year 2 2
2 2
June 2009
Carrying amount at the beginning of the year 2 2
2 2
During the year the group utilised $28 million in respect of restructuring obligations at certain businesses, primarily in the Laminates & Panels division. The remaining balance of restructuring claims are expected to be utilised in the next two years. Construction claims relate to disputes on jobs and provisions in regard to the wind-down of overseas operations and are expected to be utilised over the next two years. Property provisions relate to onerous lease obligations and are expected to be utilised over two years. Warranty and environmental provisions relate to products sold and services provided and are expected to be utilised over the next three years. Other provisions relate to miscellaneous matters with no individual amounts being significant.
Fletcher Building Group Fletcher Building Limited
June 2010NZ$M
June 2009NZ$M
June 2010NZ$M
June 2009NZ$M
Current portion 61 96 2 2
Non current portion 17 20
Carrying amount at the end of the year 78 116 2 2

Notes to the financial statements
Fletcher Building Annual Report 2010
23. Creditors and accruals
Fletcher Building Group Fletcher Building Limited
June 2010NZ$M
June 2009NZ$M
June 2010NZ$M
June 2009NZ$M
Trade creditors 671 613
Contract retentions 35 27
Accrued interest 20 21 5 4
Other liabilities 254 218 84 62
Employee entitlements 180 163
Workers' compensation schemes 20 20
1,180 1,062 89 66
Current portion 1,116 996 89 66
Non current portion 64 66
Carrying amount at the end of the year 1,180 1,062 89 66
The non current portion of creditors and accruals relates to long service employee entitlement obligations.
24. Contracts
Gross construction work in progress plus margin to date 1,985 2,027
Progress billings (2,081) (2,118)
Work in progress / (money received in advance) (96) (91)
Construction contracts with net work in progress 8 5
Construction contracts with net money received in advance of cost and margin (104) (96)
Carrying amount at the end of the year (96) (91)
Included in sales is $1,023 million of contract revenue (June 2009 $973 million).

Notes to the financial statements
55
25. Taxation
Fletcher Building Group Fletcher Building Limited
June 2010NZ$M
June 2009NZ$M
June 2010NZ$M
June 2009NZ$M
Provision for current taxation:
Opening provision for current taxation (27) (40) 22 14
Currency translation 1 (3)
Taxation in the earnings statement (112) 6 19 22
Transfer from deferred taxation 18 (106)
Intercompany payment (22) (14)
Minority share of taxation expense 5 3
Taxation in reserves 2
Net taxation payments 90 111
(25) (27) 19 22
Provision for deferred taxation:
Opening provision for deferred taxation (14) (61) (5)
Currency translation 1 (1)
Taxation in the earnings statement (20) (63)
Transfer to current taxation (18) 106
Taxation in reserves 2 3 3 5
Changes in accounting policy 2
(49) (14) 3
Composed of:
Provisions 135 127
Debtors 8 8
Fixed assets (87) (57)
Brands (124) (127)
Tax losses 16 17
Other 3 18 3
(49) (14) 3
There are no significant deferred tax liabilities in respect of the undistributed profits of subsidiaries and associates.The group has recognised tax losses available in UK, Spain, Finland and other jurisdictions on the basis that the respective companies will have
future assessable income. Where necessary, the companies financial affairs have been restructured during the year to assist in generating future assessable income. Further tax planning opportunities are available and will be utilised to ensure that the tax losses will be realised. The tax losses have been recognised on the basis of the forecasted operating earnings set out in the companies strategic plans approved by the directors and the discounted cashflows prepared for the purposes of impairment testing. The group will review this situation annually and will consider further opportunities to assist the companies should it be necessary. If the forecasted operating earnings are not achieved the asset may have to be written off. Formica has not recognised tax losses in the USA, France, Spain and Sweden of $98 million representing $317 million of gross tax losses (2009: $138 million, $414 million gross losses).

Notes to the financial statements
Fletcher Building Annual Report 2010
26. Borrowings
Fletcher Building Group Fletcher Building Limited
June 2010NZ$M
June 2009NZ$M
June 2010NZ$M
June 2009NZ$M
Other loans 30 36 7 6
Capital notes 68 75 68
Foreign currency revaluation on debt derivatives (12) (8) (12) (7)
Current borrowings 86 103 63 (1)
Bank loans 119 45
US private placements 775 808
Other loans 49 57 2
Capital notes 333 373 98 167
Foreign currency revaluation on debt derivatives (24) (5) (24) (8)
Non current borrowings 1,133 1,352 74 206
1,219 1,455 137 205
For further information about the terms of these loans, please refer note 27. The fair value adjustment in respect of interest is not included in the carrying amount of borrowings.
Unused committed lines of creditAt 30 June 2010 the group had $1,949 million of committed facilities of which $1,130 million was undrawn (June 2009 $2,149 million; $1,142 million). The undrawn facilities have a weighted average maturity of 2.3 years (June 2009 1.9 years).
Negative pledgeThe group borrows certain funds based on a negative pledge arrangement. The negative pledge includes a cross guarantee from a number of wholly owned subsidiaries, ensures that external senior indebtedness ranks equally in all respects and includes the covenant that security can be given only in very limited circumstances.
Borrowing covenants The group borrows certain funds based on borrowing covenants. The borrowing covenants relate to gearing and interest cover and at 30 June 2010 the group was in compliance with all its covenants.
Bank loans At 30 June 2010 the group had syndicated revolving credit facilities on an unsecured, negative pledge and borrowing covenant basis. The funding syndicate is comprised of ANZ National Bank, Bank of Tokyo Mitsubishi UFJ, Bank of New Zealand, Commonwealth Bank of Australia, Citibank N.A., The Hong Kong and Shanghai Banking Corporation and Westpac Banking Corporation and the funds can be borrowed in United States dollars, Australian dollars and New Zealand dollars.
US private placements The group borrowed funds from private investors (primarily US based) on an unsecured, negative pledge and borrowing covenant basis. These borrowings comprise NZ$144 million, AU$132 million, US$194 million and US$132 million with maturities between 2015 and 2020.
Other loans Includes bank overdrafts, short term loans, working capital facilities, financial leases, PlaceMakers joint venture funding and discounted receivables. At 30 June 2010 the Group had $64 million (June 2009 $74 million) of loans which are secured against the subsidiaries’ own balance sheet or against specific assets. Unsecured loans at 30 June 2010 were $15 million (June 2009 $19 million) and a number of these loans are subject to the negative pledge.
Foreign currency revaluation on debt derivatives This is the foreign currency revaluation of derivatives that have been specifically taken out to hedge the currency risk on various borrowings and includes cross currency interest rate swaps and foreign exchange forwards. The majority of these instruments have the benefit of the negative pledge.
Capital notes Capital notes are long-term fixed rate unsecured subordinated notes. On each election date, the coupon rate and term to the next election date of that series of the capital notes is reset. Holders may then choose either to keep their capital notes on the new terms or to convert the principal amount and any interest into shares, at approximately 98 percent of the current market price. Instead of issuing shares to holders who choose to convert, Fletcher

Notes to the financial statements
26. Borrowings – continued
57
Building may, at its option, purchase or redeem the capital notes for cash at the principal amount plus any interest. Under the terms of the capital notes, non-payment of interest is not an act of default although unpaid interest is accrued and is interest bearing at the same rate as the principal of the capital notes. Fletcher Building Limited has covenanted not to pay dividends to its shareholders while interest that is due and payable on capital notes has not been paid.
The capital notes do not carry voting rights and do not participate in any change in value of the issued shares of Fletcher Building Limited.If the principal amount of the capital notes held at 30 June 2010 were to be converted to shares, 52 million shares (June 2009 65 million shares)
would be issued at the share price as at 30 June 2010, of $7.85 (June 2009 $6.58).As at 30 June 2010 the group held $131 million (30 June 2009 $83 million) of capital notes as treasury stock.
Credit rating The company has not sought and does not hold a credit rating from an accredited rating agency.
27. Financial instruments Financial risk management overview Exposures to credit, liquidity, currency, interest rate, and commodity price risks arise in the normal course of the group’s business. The principles under which these risks are managed are set out in policy documents approved by the board. The policy documents identify the risks and set out the group’s objectives, policies and processes to measure, manage and report the risks. The policies are reviewed periodically to reflect changes in financial markets and the group’s businesses. Risk management is carried out by the group’s central treasury, which ensures compliance with the risk management policies and procedures set by the board.
The group enters into derivative financial instruments to assist in the management of the identified financial risks. The group does not enter into derivative financial instruments for trading or speculative purposes. All derivative transactions entered into are to hedge underlying physical positions arising from normal business activities.
Risks and mitigation
(a) Credit riskTo the extent the group has a receivable from another party there is a credit risk in the event of non-performance by that counterparty and arises principally from receivables from customers, derivative financial instruments and the investment of cash.
(i) Trade receivables Management has a credit policy in place under which customers are individually analysed for credit worthiness and assigned a purchase limit. If no external ratings are available, the group reviews the customers’ financial statements, trade references, bankers’ references and/or credit agencies’ reports to assess credit worthiness. These limits are reviewed on a regular basis. Due to the group’s industry and geographical spread at balance date there were no significant concentrations of credit risks in respect of trade receivables. Please refer to note 16 for debtor aging analysis.
Most goods are sold subject to retention of title clauses, so that in the event of non-payment the group may have a secured claim. The group does not require collateral in respect of trade receivables.
(ii) Derivative financial instruments and the investment of cashThe group enters into derivative financial instruments and invests cash with various counterparties in accordance with established limits as to credit rating and dollar value and does not require collateral or other security. In accordance with the established counterparty restrictions, there are no significant concentrations of credit risk in respect of the financial instruments and no loss is expected.
The group has not renegotiated the terms of any financial assets which would otherwise be past due or impaired. The carrying amount of non-derivative financial assets represents the maximum credit exposure.
(b) Liquidity riskLiquidity risk is the risk that the group will encounter difficulty in meeting its financial commitments as they fall due. The group manages its liquidity risk by maintaining a target level of undrawn committed credit facilities and a spread of the maturity dates of the group’s debt facilities. The group reviews its liquidity requirements on an ongoing basis. The following maturity analysis table sets out the remaining contractual undiscounted cashflows, including estimated interest payments for non-derivative liabilities and derivative financial instruments. Creditors and accruals are excluded from this analysis as they are not part of the Group’s assessment of liquidity risk.

Notes to the financial statements
27. Financial instruments – continued
(b) Liquidity risk – continued
Fletcher Building Annual Report 2010
June 2010 Fletcher Building Group
Contractual Cashflows
NZ$M
Up to 1 YearNZ$M
1-2 YearsNZ$M
2-5 YearsNZ$M
Over 5 YearsNZ$M
Capital notes 401 68 59 227 47
US private placements 775 775
Other loans 79 30 49
Non-derivative financial liabilities - principal cashflows 1,255 98 108 227 822
Gross settled derivatives - to pay 670 368 149 153
Gross settled derivatives - to receive (706) (380) (155) (171)
Debt derivatives financial instruments - principal cashflows (36) (12) (6) (18)
Contractual interest cashflows 413 79 69 172 93
Total contractual cashflows 1,632 165 171 381 915
June 2009 Fletcher Building Group
Contractual Cashflows
NZ$M
Up to 1 YearNZ$M
1-2 YearsNZ$M
2-5 YearsNZ$M
Over 5 YearsNZ$M
Capital notes 448 75 68 246 59
Bank loans 119 119
US private placements 808 808
Other loans 93 36 57
Non-derivative financial liabilities - principal cashflows 1,468 111 68 422 867
Gross settled derivatives - to pay 735 672 63
Gross settled derivatives - to receive (748) (680) (68)
Debt derivatives financial instruments - principal cashflows (13) (8) (5)
Contractual interest cashflows 515 91 84 209 131
Total contractual cashflows 1,970 194 152 626 998

Notes to the financial statements
27. Financial instruments – continued
(b) Liquidity risk – continued
59
June 2010 Fletcher Building Limited
Contractual Cashflows
NZ$M
Up to 1 YearNZ$M
1-2 YearsNZ$M
2-5 YearsNZ$M
Over 5 YearsNZ$M
Capital notes 166 68 59 39
Other loans 7 7
Non-derivative financial liabilities - principal cashflows 173 75 59 39
Gross settled derivatives - to pay 670 368 149 153
Gross settled derivatives - to receive (706) (380) (155) (171)
Debt derivatives financial instruments - principal cashflows (36) (12) (6) (18)
Contractual interest cashflows (4) 11 2 (6) (11)
Total contractual cashflows 133 74 55 15 (11)
June 2009 Fletcher Building Limited
Contractual Cashflows
NZ$M
Up to 1 YearNZ$M
1-2 YearsNZ$M
2-5 YearsNZ$M
Over 5 YearsNZ$M
Capital notes 167 68 59 40
Bank loans 45 45
Other loans 8 6 2
Non-derivative financial liabilities - principal cashflows 220 6 70 104 40
Gross settled derivatives - to pay 736 672 64
Gross settled derivatives - to receive (751) (679) (72)
Debt derivatives financial instruments - principal cashflows (15) (7) (8)
Contractual interest cashflows 22 18 11 3 (10)
Total contractual cashflows 227 17 81 99 30

Notes to the financial statements
27. Financial instruments – continued
Fletcher Building Annual Report 2010
(c) Foreign currency risk
(i) Currency translation risk Currency translation risk arises from net investments in foreign operations. It is the group’s policy to hedge this foreign currency translation risk by borrowing in the currency of the asset in proportion to the group’s long term debt to equity ratio. This reduces the variability in the debt to equity ratio due to currency translation. Where the underlying debt in any currency does not equate to the required proportion of total debt, debt derivatives such as foreign exchange forwards, swaps and cross currency interest rate swaps are entered into for up to seven years. Net investment and fair value hedge accounting is applied to these instruments. In addition the group has entered into foreign exchange derivatives to hedge the taxation exposure arising from the translation of certain assets for up to eight years, cashflow hedge accounting is applied to these instruments.
(ii) Currency transaction risk Currency transaction risk arises from committed or highly probable trade and capital expenditure transactions that are denominated in currencies other than the operation’s functional currency. The objective in managing this risk is to reduce the variability from changes in currency exchange rates on the operation’s income and cashflow to acceptable parameters. It is group policy that no currency exchange risk may be entered into or allowed to remain outstanding should it arise on committed transactions. In addition the group hedges some highly probable forecast transactions for up to three years. When exposures are incurred by operations in currencies other than their functional currency, currency forwards, swaps and options are entered into to eliminate the exposure. The majority of these transactions have maturities of less than one year. Cashflow hedge accounting is applied to forecast transactions. The main currencies hedged are the Australian dollar, the United States dollar, the Japanese yen, the Euro and the Great British pound. The gross value of these foreign exchange derivatives is NZ$374 million (June 2009 NZ$269 million)
The group’s exposure to foreign currency translation risk on financial instruments is summarised as follows:
Fletcher Building Group Fletcher Building Limited
June 2010NZ$M
June 2009NZ$M
June 2010NZ$M
June 2009NZ$M
Australian dollars 637 713 466 510
Euro's 63 60 47 58
Great British pounds 17 33 17 20
New Zealand dollars 224 305 (199) (175)
United States dollars 278 344 (194) (208)
Currency translation risk - foreign currency borrowings 1,219 1,455 137 205
(d) Interest rate riskInterest rate risk is the risk that the value of a financial instrument or cashflows associated with the instrument will change due to changes in market interest rates and arises primarily from the group’s interest bearing borrowings. The group manages the fixed interest rate component of its debt and capital notes obligations and aims to maintain this ratio between 40 to 70 percent, however the group is currently over 90 percent fixed. The position in this range is managed depending upon underlying interest rate exposures and economic conditions. Cross currency, interest rate swaps, forward rate agreements and options are entered into to manage this position. Currently cross currency interest rate swaps and interest rate swaps have been entered into in Australian dollars, United States dollars, Euros, British pounds and New Zealand dollars which mature over the next ten years in relation to the maturity of the related loans.
Hedge accounting is applied on these instruments for floating-to-fixed instruments as cashflow hedges or for fixed-to-floating as fair value hedges.

61
Notes to the financial statements
27. Financial instruments – continued(d) Interest rate risk – continuedInterest rate repricingThe following tables set out the interest rate repricing profile and weighted average interest rate of interest bearing financial assets and liabilities.
June 2010 Fletcher Building Group
Weighted Average Interest Rate %
FloatingNZ$M
FixedUp to
1 YearNZ$M
Fixed1-2 Years
NZ$M
Fixed2-5 Years
NZ$M
FixedOver
5 YearsNZ$M
TotalNZ$M
Capital notes 8.7 68 59 227 47 401
US private placements 5.7 305 470 775
Debt derivatives - to pay 6.0 613 53 666
Debt derivatives - to receive 4.0 (681) (21) (702)
Other loans 5.0 79 79
Cash and liquid deposits 1.7 (112) (112)
Interest rate swaps - to pay 5.6 401 631 145 1,177
Interest rate swaps - to receive 6.1 (631) (150) (396) (1,177)
Total (26) 68 59 740 266 1,107
June 2009 Fletcher Building Group
Weighted Average Interest Rate %
FloatingNZ$M
FixedUp to
1 YearNZ$M
Fixed1-2 Years
NZ$M
Fixed2-5 Years
NZ$M
FixedOver
5 YearsNZ$M
TotalNZ$M
Capital notes 9.0 75 68 246 59 448
Bank loans 4.2 119 119
US private placements 5.3 308 500 808
Debt derivatives - to pay 3.7 671 64 735
Debt derivatives - to receive 3.0 (727) (21) (748)
Other loans 2.4 93 93
Cash and liquid deposits 1.4 (99) (99)
Interest rate swaps - to pay 5.1 509 62 277 363 1,211
Interest rate swaps - to receive 4.8 (702) (92) (150) (267) (1,211)
Total 172 45 68 416 655 1,356

Notes to the financial statements
27. Financial instruments – continued
Fletcher Building Annual Report 2010
(d) Interest rate risk – continued
June 2010 Fletcher Building Limited
Weighted Average Interest Rate %
FloatingNZ$M
FixedUp to
1 YearNZ$M
Fixed1-2 Years
NZ$M
Fixed2-5 Years
NZ$M
FixedOver
5 YearsNZ$M
TotalNZ$M
Capital notes 8.1 68 59 39 166
Debt derivatives - to pay 6.0 613 53 666
Debt derivatives - to receive 4.0 (681) (21) (702)
Other loans 2.8 7 7
Cash and liquid deposits 2.8 (56) (56)
Interest rate swaps - to pay 5.6 401 631 145 1,177
Interest rate swaps - to receive 6.1 (631) (150) (396) (1,177)
Total (347) 68 59 552 (251) 81
June 2009 Fletcher Building Limited
Weighted Average Interest Rate %
FloatingNZ$M
FixedUp to
1 YearNZ$M
Fixed1-2 Years
NZ$M
Fixed2-5 Years
NZ$M
FixedOver
5 YearsNZ$M
TotalNZ$M
Capital notes 8.2 68 59 40 167
Bank loans 3.4 45 45
Debt derivatives - to pay 3.7 672 64 736
Debt derivatives - to receive 3.0 (729) (22) (751)
Other loans 2.7 8 8
Cash and liquid deposits 2.6 (39) (39)
Interest rate swaps - to pay 5.1 509 62 277 363 1,211
Interest rate swaps - to receive 4.8 (702) (92) (150) (267) (1,211)
Total (236) (30) 68 228 136 166

Notes to the financial statements
27. Financial instruments – continued
63
(e) Commodity price riskCommodity price risk arises from committed or highly probable trade and capital expenditure transactions that are linked to traded commodities. Where possible the group manages its commodity price risks through negotiated supply contracts and, for certain commodities, by using commodity price swaps and options. The group manages its commodity price risk depending on the underlying exposures, economic conditions and access to active derivatives markets. Currently the group’s guideline is to hedge up to 100 percent of the New Zealand business units’ electricity requirements for up to five years. Cashflow hedge accounting is applied to commodity derivative contracts.
At balance date, the notional value of fixed electricity exposure was as follows:
June 2010 Fletcher Building Group and Limited
Average Hedge Price
NZ$/MWh
Up to 1 YearNZ$M
1-2 YearsNZ$M
2-5 YearsNZ$M
Over 5 YearsNZ$M
TotalNZ$M
Electricity price swaps 90 7 33 41 81
June 2009
Electricity price swaps 83 19 32 23 74
(f) Sensitivity analysisThe numbers in the sensitivity analysis for foreign currency risk, interest rate risk and commodity price risk have not been adjusted for tax and are based only on the group’s financial instruments held at balance date and assumes that all other variables remain constant, except for the chosen change in the risk variable.
(i) Foreign currency riskIt is estimated a 10 percent weakening of the New Zealand dollar against the major foreign currencies the group is exposed to through financial instruments would result in a decrease to equity of approximately $100 million (June 2009 $88 million) and no material impact on earnings. If the translation of the net assets of the foreign operations were included this would result in an increase to equity of approximately $186 million (June 2009 $185 million).
(ii) Interest rate riskIt is estimated a 1 percent increase in interest rates would have increased the group’s interest costs in a year by approximately $1.7 million on the group’s debt portfolio exposed to floating rates at balance date (June 2009 $2.0 million). The group’s increase in interest costs is limited as the interest is largely fixed.
(iii) Commodity price riskIt is estimated a 10 percent increase in the New Zealand electricity spot price at balance date would have increase the group’s profit by $1 million as the group had fixed 98 percent of its electricity usage (June 2009 $1 million, fixed 107 percent).

Notes to the financial statements
27. Financial instruments – continued
Fletcher Building Annual Report 2010
(g) Fair valuesThe estimated fair values measurements for financial assets and liabilities are compared to their carrying values in the balance sheet, are as follows:
Fletcher Building Group
June 2010 June 2009
NZ$M ClassificationCarrying
Value Fair ValueCarrying
Value Fair Value
Bank loans Amortised cost 119 119
US private placements Amortised cost 775 779 808 776
Other loans Amortised cost 79 79 93 93
Capital notes Amortised cost 401 412 448 446
Creditors and accruals Amortised cost 1,096 1,096 957 957
Trade and other receivables Loans and receivables (1,045) (1,045) (1,059) (1,059)
Cash and liquid deposits Loans and receivables (112) (112) (99) (99)
Forward exchange contracts - cashflow hedge Fair value though P&L (3) (3) 1 1
Forward exchange contracts - net investment hedge Fair value though P&L (10) (10) (7) (7)
Forward exchange contracts - fair value hedge Fair value though P&L (4) (4) (1) (1)
Cross currency interest rate swaps - net investment hedge Fair value though P&L (24) (24) (1) (1)
Interest rate swaps - fair value hedge Fair value though P&L (39) (39) (26) (26)
Interest rate swaps - cashflow hedge Fair value though P&L 10 10 (2) (2)
Electricity price swaps - cashflow hedge Fair value though P&L 3 3 14 14
1,127 1,142 1,245 1,211
Fletcher Building Limited’s fair values are materially the same as the carrying values.
Fair value measurementThe only financial instruments measured and recognised at fair value are derivatives. Base metal price swaps are measured under level 1. All other derivatives are measured under level 2 valuations using quoted forward exchange rates and discounted using yield curves derived from quoted interest rates matching maturities of the contract. The fair value of electricity price swaps are measured using a derived forward curve and discounted using yield curves derived from quoted interest rates matching maturities of the contracts. Interest rate derivatives are calculated by discounting the future principal and interest cashflows at current market interest rates that are available for similar financial instruments.(Level 1) Quoted prices (unadjusted) in active markets for identical assets or liabilities. The fair value of base metal price swaps is based on the quoted market prices of those instruments.(Level 2) Inputs other than quoted prices included within level 1 that are observable for the asset or liability, either directly (as prices) or indirectly (derived from prices).(Level 3) Inputs for the asset or liability that are not based on observable market data (unobservable inputs).
Fair value disclosuresThe fair values of borrowings used for disclosure are measured by discounting future principal and interest cashflows at the current market interest rate that are available for similar financial instruments.
The interest rates across all currencies used to discount future principal and interest cashflows are between 0.9 percent and 8.4 percent (June 2009 0.9 percent and 9.65 percent) including margins.
(h) Capital risk managementThe group’s objectives when managing capital are to safeguard the group’s ability to continue as a going concern in order to provide returns to shareholders and benefits for other stakeholders and to maintain an optimal capital structure to reduce the cost of capital.
In order to maintain or adjust the capital structure, the group may adjust the amount of dividends paid to shareholders, return capital to shareholders, issue new shares or sell assets to reduce debt.
The group monitors capital on the basis of debt to debt plus equity and aims to maintain this ratio between 40 percent to 50 percent in the long term.

Notes to the financial statements
65
28. Capital expenditure commitments of plant and investments
Fletcher Building Group
June 2010NZ$M
June 2009NZ$M
Approved by the directors but uncommitted at year end 32 7
Committed at year end 71 56
103 63
29. Lease commitmentsThe expected future minimum rental payments required under operating leases that have initial or remaining non-cancellable lease terms in excess of one year are at year end:
within one year 114 119
within two years 93 102
within three years 67 77
within four years 51 61
within five years 61 48
after five years 132 161
518 568
30. Contingent liabilitiesProvision has been made in the ordinary course of business for all known and probable future claims but not for such claims as are considered remote. Contingent liabilities arise in respect of the following categories:
Contingent liabilities with respect to guarantees extended on trading transactions, performance bonds and other transactions
158 219
Letters of credit 14 11
31. InsuranceThe company monitors its capacity to retain otherwise insurable losses. The directors believe that the group’s risk management programmes are adequate to protect its assets and earnings against losses incurred. Based on past experience, the company does not anticipate that future losses within these levels would have a significant impact on the group’s financial position or performance. In general terms, the group-wide insurance policies are with insurers having a Standard & Poor’s A grade rating (or equivalent) or better.
Fletcher Building Group
June 2010 $M
June 2009$M
The following risks are insured at 1 July 2010 in respect of each event up to a maximum of:
Public and product liability US$100 US$100
Loss or damage to group property including business interruption NZ$900 NZ$800
Marine public liability NZ$50 NZ$50
Public liability resulting from construction activities NZ$100 NZ$50
Contract works - separate cover is arranged for each contract and the insured value will generally exceed the contract value
NZ$20 NZ$20

Notes to the financial statements
Fletcher Building Annual Report 2010
32. Related party transactions
Fletcher Building Group Fletcher Building Limited
June 2010NZ$M
June 2009NZ$M
June 2010NZ$M
June 2009NZ$M
Trading activities with related parties:
Purchase of scrap metal from Sims Pacific Metals Limited 112 123
Amounts owing relating to the purchase of scrap metal from Sims Pacific Metals Limited, and is included within creditors
5 4
Purchase of raw materials from Wespine Industries Pty Limited and Dynea Industries WA Pty Limited
32 46
Amounts owing relating to the purchase of raw materials from Wespine Industries Pty Limited and Dynea Industries WA Pty Limited, and is included within creditors
3 1
Purchase of materials from Dongwha Pattina NZ Limited 15 16
Amounts owing relating to the purchase of materials from Dongwha Pattina NZ Limited, and is included within creditors
1 1
Purchase of materials from Homapal Plattenwerk GmbH & Co 11 16
Amounts owing relating to the purchase of materials from Homapal Plattenwerk GmbH & Co, and is included within creditors
1 2
Key management personnel compensation
Directors fees 2 2
Executive committee remuneration paid, payable or provided for:
Short term employee benefits 11 7
Share based payments 2 3
Dividend income received from subsidiary companies 4 300
Payment of foreign exchange gain to Fletcher Building Holdings Limited 17
Term receivable owing from subsidiary companies 1 637 577
Liability owing to subsidiary companies 2 948 589
Liability owing to subsidiary companies 3 323 363
Liability owing to subsidiary company 4 1,074 1,074
1 These unsecured advances represent long term funding even though they are for no fixed term and bear interest at 10.2 percent. 2 These unsecured advances represent long term funding even though they are for no fixed term and bear interest at 6.7 percent.3 These unsecured advances represent long term funding even though they are for no fixed term and bear interest at 9.75 percent. 4 The unsecured advance represents long term funding even though it is for no fixed term and is non interest bearing.
Fletcher Building Limited is the holding company of the Fletcher Building group. Fletcher Building Limited has a relationship with each of its subsidiaries, associates and joint ventures. A full list of all the subsidiaries of the group is included in the Regulatory Disclosures section of the annual report.
Fletcher Building Retirement PlanAs at 30 June 2010, Fletcher Building Nominees Limited (the New Zealand retirement plan) held $7,400,000 of shares and $18,500,000 of capital notes in Fletcher Building Limited, (June 2009 $8,200,000 of shares; $18,500,000 of capital notes) in respect of economic interests that members of the retirement plan have in Fletcher Building shares and capital notes.

Notes to the financial statements
67
33. Principal operationsFletcher Building Limited is the holding company of the Fletcher Building group. The principal subsidiaries and associates, as at 30 June 2010, are outlined below:
Country of Domicile
% Holding Principal Activity
Principal subsidiaries
Fletcher Building Holdings Limited NZ 100 Holding company
Fletcher Building Products Limited NZ 100 Building products
Fletcher Concrete and Infrastructure Limited NZ 100 Concrete products
Fletcher Distribution Limited NZ 100 Merchandising
Fletcher Steel Limited NZ 100 Steel production
Fletcher Residential Limited NZ 100 Housing
The Fletcher Construction Company Limited NZ 100 Construction
Winstone Wallboards Limited NZ 100 Gypsum plasterboard
Fletcher Property Limited NZ 100 Property management
PlaceMakers subsidiaries NZ 50.1 Retail
Fletcher Building Finance Limited NZ 100 Finance
Tasman Insulation New Zealand Limited NZ 100 Insulation
AHI Roofing Limited NZ 100 Roofing
Forman Group Limited NZ 100 Insulation
Fletcher Building (Fiji) Limited Fiji 100 Infrastructure
Laminex Group Limited Australia 100 Building products
Fletcher Building (Australia) Pty Limited Australia 100 Holding company
Tasman Insulation Pty Limited Australia 100 Insulation
Tasman Sinkware Pty Limited Australia 100 Sinks
Tasman Access Floors Pty Limited Australia 100 Flooring
Rocla Pty Limited Australia 100 Concrete products
Stramit Corporation Pty Limited Australia 100 Steel production
Insulation Solutions Pty Limited Australia 100 Insulation
Fletcher Construction (Solomon Islands) Limited Solomon Is. 100 Construction
Fletcher Morobe Construction Pty Limited PNG 100 Construction
Fletcher Building Netherlands B.V. Netherlands 100 Finance
Tasman Investments (Netherlands Antilles) N.V. Neth Antilles 100 Finance
Decra Roofing Systems Inc. United States 100 Roofing
Formica Corporation United States 100 Building products
Formica Canada Inc. Canada 100 Building products
Formica Limited United Kingdom 100 Building products
Formica S.A. Spain 100 Building products
Shanghai Formica Decorative Material Co. Ltd China 100 Building products
Formica IKI Oy Finland 100 Building products
Formica Skandinavien AB Sweden 100 Building products
Formica (Thailand) Co., Ltd Thailand 100 Building products
Associates
Wespine Industries Pty Limited Australia 50 Saw miller
Dynea Industries WA Pty Limited Australia 50 Building products
Mt Marrow Blue Metal Quarries Pty Limited Australia 50 Quarrying
Mittagong Sands Pty Limited Australia 50 Quarrying
Sims Pacific Metals Limited NZ 50 Metal recycling
Dongwha Pattina NZ Limited NZ 20 Building products
Homapal Plattenwerk GmbH & Co. KG. Germany 50 Building products

Notes to the financial statements
Fletcher Building Annual Report 2009Fletcher Building Annual Report 2010
34. Retirement plansFletcher Building Limited is the principal sponsoring company of a plan that provides retirement and other benefits to employees of the group in New Zealand. Participation in this plan has been closed for a number of years, although defined contribution savings plans have been made available. Various defined benefit and defined contribution plans exist in Australia following the acquisition of the Amatek, Tasman Building Products, and the Laminex groups which companies contribute to on behalf of their employees. All of these plans’ obligations are wholly funded. Various defined benefit plans and medical plans exist in other countries as a result of the acquisition of the Formica group, which companies contribute to on behalf of their employees. All of these plans have a deficit in their funded status and the companies are making additional contributions, as recommended by the trustees of the plans, to improve the funded status.
The calculation of the defined benefit obligations are based on years of service and the employees’ compensation during their years of employment. Contributions are intended to provide not only for benefits attributed to service to date but also for those expected to be earned in the future. These obligations are accounted for in accordance with NZ IAS 19 Employee Benefits, which has the effect of smoothing the volatility in the returns earned by the plans through amortising gains and losses over the life of the plans. At 30 June 2010, $123 million of deferred actuarial losses (June 2009 $88 million) will be amortised in future years.
Fletcher Building Limited has an obligation to ensure that the funding ratio of the New Zealand plan’s assets is at least 115% of the plan’s actuarial liability. This is based upon any two consecutive annual actuarial valuations as calculated by the plan’s actuary. This calculation is done on the plan’s funding basis which differs from the calculation under NZ IAS 19. At 31 March 2010 the value of the assets was 122.6% of the actuarial liability and the funded surplus was $51 million (31 March 2009 115.1%, $33 million).
During the year the company contributed $5 million in respect of its Australian defined benefit plans and $21 million in respect of its Australian defined contribution plans. It contributed $17 million in respect of its Formica defined benefit and medical plans and $2 million to its New Zealand plan on behalf of its employees as part of their salary sacrifice arrangements.
June 2010NZ$M
June 2009NZ$M
Net periodic pension (cost)/benefit
Service cost (12) (16)
Interest cost (35) (41)
Actual return on assets 80 (86)
Experience adjustments on plans assets - the difference between the expected and actual return (43) 131
Effect of settlements and curtailments (4)
Amortisation of deferred actuarial (loss)/deferred actuarial gain (11)
Net periodic pension (cost)/benefit - recognised in operating earnings (21) (16)
Recognised net asset/(liability)
Assets of plans 659 622
Projected benefit obligation (756) (693)
Funded surplus/(obligation) (97) (71)
Deferred actuarial loss/deferred actuarial (gain)1 123 88
Recognised net asset/(liability) 26 171 The deferred actuarial loss is being amortised over nine years.
Recognised net asset/(liability) by jurisdiction:
New Zealand plan 61 64
Australian plans 9 9
Retirement plan surplus - recognised within note 21, Investments 70 73
Other overseas plans (44) (56)
Retirement plan liability - recognised within non current liabilities (44) (56)
Recognised net asset/(liability) 26 17

Notes to the financial statements
69
June 2010NZ$M
June 2009NZ$M
Movement in recognised net asset/(liability)
Recognised net asset/(liability) at the beginning of the year 17 (35)
Currency translation 7 (3)
Acquisitions (1)
Net periodic pension (cost)/benefit (21) (16)
Employer contributions 24 71
Recognised net asset/(liability) 26 17
Assets of the plans
Assets of plans at the beginning of the year 622 707
Actual return on assets 80 (86)
Total contributions 28 75
Benefit payments (50) (50)
Settlements and curtailments 1 (31)
Acquisition adjustment 4
Currency translation (26) 7
659 622
Assets of the plans consist of:
Australasian equities 81 71
International equities 245 210
Property 23 22
Bonds 255 164
Cash and short term deposits 30 126
Other assets 25 29
659 622
Projected benefit obligation
Projected benefit obligation as at the beginning of the year (693) (750)
Service cost (12) (16)
Interest cost (34) (41)
Member contributions (4) (4)
Actuarial gain/(loss) arising on movements in the discount rate (70) 14
Actuarial gain/(loss) arising on other assumptions - experience adjustments (21) 33
Benefit payments 50 50
Settlements and curtailments (1) 30
Acquisition adjustment (5)
Currency translation 34 (9)
(756) (693)
34. Retirement plans – continued

Notes to the financial statements
Fletcher Building Annual Report 2010
34. Retirement plans – continuedAssumptions usedThe following table provides the weighted average assumptions used to develop the net periodic pension cost and the actuarial present value of projected benefit obligations for the group’s plans:
2010 %
2009 %
Assumed discount rate on benefit obligations 4.76 5.38
Expected annual rate of return on plan assets 6.16 6.30
Annual rate of increase in future compensation levels 3.41 3.47
Expected returns on plan assets have been determined by the independent actuaries as the weighted average of the expected return after tax and investments fees for each asset class by the target allocation of assets to each class.
The group expects to contribute $22 million to its Australian and other overseas defined benefit plans during the year to 30 June 2011.
35. Share based paymentsExecutive share schemes
The group has implemented long term cash based incentive schemes targeted at the executives most able to influence the results of the group, with an agreed percentage of any cash received to be invested in purchasing the company’s shares. For all participants in the 2006 and 2007 schemes, and for most participants in the 2008 scheme, payment of any benefit is dependent upon the group’s total shareholder return exceeding the 51st percentile of the total shareholder return of a comparative group of companies over a three year restricted period. For a small number of participants in the 2008 scheme and all participants in the 2009 scheme, a variation was implemented whereby the three year restricted period is automatically extended by up to one further year if total shareholder return does not exceed the 51st percentile. Participants may elect to extend the restricted period if total shareholder return is between the 51st and 75th percentiles.
In addition, for the relevant participants in the 2008 and 2009 schemes, payment of half of any benefit is dependent upon total shareholder return, including the one-year extension of the restricted period, and payment of the other half of any benefit is dependent upon the group achieving an earnings per share target over the three year restricted period. No one-year extension is made for any benefit which is dependent upon the earnings per share performance target.
The group provides interest free loans to executives, who instruct the trustee to purchase shares on their behalf. The shares purchased by executives are held by the trustee with executives entitled to vote and receive dividends, the proceeds of which are used to repay the interest free loan.
At the end of the restricted period the group will pay a bonus to the executives to the extent the performance targets have been met, sufficient for the executives to repay the balance of the interest free loan on those shares which vest. The shares upon which performance targets have been met will then fully vest to the executives. The loan owing on shares upon which performance targets have not been met (the forfeited shares) will be novated from the executives to the trustee and will be fully repaid by the transfer of the forfeited shares. The receivable from the executives, which is secured only against the shares held in the company, has been accounted for under the treasury stock method and deducted from paid up capital.
The following are details in regards to the share schemes:
2009 Scheme 2008 Scheme 2007 Scheme 2006 Scheme
Grant date 1 October 2009 1 October 2008 1 October 2007 1 October 2006
Number of shares granted 811,927 964,128 341,401 438,410
Market price per share at grant date $8.23 $6.94 $12.69 $8.36
Total consideration paid $6,682,159 $6,691,048 $4,332,379 $3,665,108
Vesting date 30 September 2012 30 September 2011 30 September 2010 30 September 2009
Maximum bonus payable - expensed over three years $13,063,404 $13,845,976 $8,518,744 $6,285,603
Number of shares originally granted 811,927 964,128 341,401 438,410
Less forfeited over life of scheme (18,551) (100,078) (75,149) (76,214)
Less vested over life of scheme (509) (19,616) (1,572) (362,196)
Number of shares held at 30 June 2010 792,867 844,434 264,680
June 2010 NZ$ June 2009 NZ$
Total amount expensed in year for executive performance share schemes 10,597,112 8,779,376
Liability recognised at year end for bonus payable 19,856,176 14,731,441

Notes to the financial statements
71
36. Segmental information
Industry segments
Building Products
NZ$MSteel
NZ$MDistribution
NZ$MInfrastructure
NZ$M
Laminates & Panels
NZ$MOther
NZ$MTotal Group
NZ$M
Year ended 30 June 2010
Sales - gross 881 1,231 894 2,110 1,963 7 7,086
Sales - inter segment (83) (59) (16) (90) (33) (6) (287)
Sales - external 798 1,172 878 2,020 1,930 1 6,799
Operating earnings (EBIT) 114 82 38 164 141 (18) 521
Total assets 796 728 246 1,512 2,208 224 5,714
Total liabilities 122 175 128 464 453 1,349 2,691
Capital expenditure including acquisitions 24 17 9 65 75 1 191
Depreciation expense 26 25 9 70 76 206
Year ended 30 June 2009
Sales - gross 873 1,407 893 2,161 2,137 6 7,477
Sales - inter segment (102) (86) (10) (109) (61) (6) (374)
Sales - external 771 1,321 883 2,052 2,076 7,103
Operating earnings (EBIT) 90 147 (9) 199 (252) (16) 159
Unusual items included in operating earnings (16) (7) (39) (4) (326) (7) (399)
Total assets 783 752 233 1,492 2,341 204 5,805
Total liabilities 136 169 118 412 450 1,536 2,821
Capital expenditure including acquisitions 56 26 21 100 88 1 292
Depreciation expense 25 22 10 70 83 1 211

Notes to the financial statements
36. Segmental information – continued
Fletcher Building Annual Report 2010
Geographic segments
New Zealand NZ$M
Australia NZ$M
Nth America NZ$M
Asia NZ$M
Europe NZ$M
Other NZ$M
Group NZ$M
Year ended 30 June 2010
Sales - external 3,358 2,286 436 238 388 93 6,799
Operating earnings (EBIT) 256 209 13 30 4 9 521
Total assets 2,271 2,188 402 485 314 54 5,714
Total liabilities 1,186 1,184 125 41 111 44 2,691
Capital expenditure including acquisitions 82 66 17 6 18 2 191
Depreciation expense 91 74 18 9 12 2 206
Year ended 30 June 2009
Sales - external 3,584 2,200 489 274 442 114 7,103
Operating earnings (EBIT) 249 123 (45) 20 (197) 9 159
Unusual items included in operating earnings (93) (63) (38) (10) (195) (399)
Total assets 2,243 2,162 443 516 390 51 5,805
Total liabilities 1,246 1,313 130 49 146 44 2,928
Capital expenditure including acquisitions 122 74 30 13 50 3 292
Depreciation expense 96 69 17 9 17 3 211

Audit report
73
To the shareholders of Fletcher Building Limited:
We have audited the financial statements on pages 32 to 72. The financial statements provide information about the past financial performance and financial position of the company and group as at 30 June 2010. This information is stated in accordance with the accounting policies set out on pages 37 to 41.
Directors’ responsibilitiesThe directors are responsible for the preparation of financial statements which give a true and fair view of the financial position of the company and group as at 30 June 2010 and the results of their operations and cashflows for the year ended on that date.
Auditors’ responsibilitiesIt is our responsibility to express an independent opinion on the financial statements presented by the directors and report our opinion to you.
Basis of opinionAn audit includes examining, on a test basis, evidence relevant to the amounts and disclosures in the financial statements. It also includes assessing:• the significant estimates and judgements
made by the directors in the preparation of the financial statements;
• whether the accounting policies are appropriate to the company’s and group’s circumstances, consistently applied and adequately disclosed.
We conducted our audit in accordance with New Zealand Auditing Standards. We planned and performed our audit so as to obtain all the information and explanations which we considered necessary in order to provide us with sufficient evidence to obtain reasonable assurance that the financial statements are free from material misstatements, whether caused by fraud or error. In forming our opinion we also evaluated the overall adequacy of the presentation of information in the financial statements.
Our firm has also provided other services to the company and certain of its subsidiaries in relation to taxation and other assurance services. Partners and employees of our firm may also deal with the company and group on normal terms within the ordinary course of trading activities of the business of the company and group. These matters have not impaired our independence as auditors of the company and group. The firm has no other relationship with, or interest in, the company or any of its subsidiaries.
Unqualified opinionWe have obtained all the information and explanations we have required.In our opinion:• proper accounting records have been kept by the
company and group as far as appears from our examination of those records;
• the financial statements on pages 32 to 72:− comply with New Zealand generally accepted
accounting practice;− give a true and fair view of the financial position
of the company and group as at 30 June 2010 and the results of their operations and cashflows for the year ended on that date.
Our audit was completed on 18 August 2010 and our unqualified opinion is expressed as at that date.
KPMG Auckland, New Zealand
More online: fletcherbuilding.com/10/audit

Fletcher Building Annual Report 2010
Trend statementJune 2010
NZ$M
June 2009
NZ$M
June 2008
NZ$M
June 2007
NZ$M
June 2006
NZ$M
June 2005
NZ$M
June 2004
NZ$M
June 2003
NZ$M
June 2002
NZ$M
June 2001
NZ$M
Notes 7 6 5 4 2 1, 2, 3
Financial performance
Operating sales/revenue 6,799 7,103 7,091 5,926 5,520 4,636 3,958 3,221 2,966 2,273
Operating earnings (EBIT) 521 159 768 703 675 612 460 331 210 (87)
Net earnings 272 (46) 467 484 379 347 240 168 93 (288)
Cashflow from operations 522 533 434 483 560 479 424 276 187 251
Earnings per share - basic (cents per share)
44.9 (8.7) 93.2 101.9 81.3 77.6 55.7 43.4 27.0 (83.7)
Dividends for the period (cents per share) 29.0 38.0 48.5 45.0 40.0 32.0 25.0 19.0 14.0 12.0
Balance sheet
Current assets 2,317 2,255 2,549 2,074 1,699 1,484 1,171 1,021 794 851
Non current assets 3,397 3,550 3,686 2,359 2,400 2,173 1,611 1,427 842 985
Total assets 5,714 5,805 6,235 4,433 4,099 3,657 2,782 2,448 1,636 1,836
Current liabilities 1,384 1,313 1,436 1,187 1,207 1,239 818 776 669 681
Non current liabilities 1,307 1,508 2,043 950 1,092 991 918 812 376 615
Total liabilities 2,691 2,821 3,479 2,137 2,299 2,230 1,736 1,588 1,045 1,296
Capital 1,912 1,895 1,364 1,325 970 929 754 628 455 449
Reserves 1,077 1,057 1,351 926 786 455 252 195 109 89
Minority equity 34 32 41 45 44 43 40 37 27 2
Total equity 3,023 2,984 2,756 2,296 1,800 1,427 1,046 860 591 540
Total liabilities and equity 5,714 5,805 6,235 4,433 4,099 3,657 2,782 2,448 1,636 1,836
Other financial data
Return on average funds (%)8 12.7 3.4 19.0 24.8 26.1 29.3 24.7 24.4 23.1 (8.6)
Return on average equity (%)9 9.1 (1.6) 19.0 26.0 24.6 29.5 24.3 23.0 16.9 (43.8)
Net debt/net debt plus equity (%) 26.8 31.1 40.1 22.2 37.1 44.4 43.1 49.9 40.2 49.2
Net tangible assets per share ($) 2.90 2.80 2.90 3.25 2.47 2.11 1.68 1.54 1.60 1.52
Market capitalisation (NZ$m) 4,763 3,967 3,197 6,166 4,296 3,207 1,987 1,490 953 817
Total shareholders return (%) 24 14 (43) 42 40 61 33 43 24 6
1 On 23 March 2001 Fletcher Challenge Limited - Building Operations, a targeted share of Fletcher Challenge Limited became a stand alone publicly listed company, Fletcher Building Limited. The proforma accounts consolidate the results of both entities for the year.
2 In the year ended 30 June 2001 the results of the Distribution division were included on an equity accounted basis. In the 2002 year the results were for 15 months on a consolidated basis.
3 For the year ended 30 June 2001, capital notes were treated as a component of equity. Interest on the capital notes of $16m after tax was previously recorded as a distribution from equity, rather than in funding costs. This has been restated.
4 The Laminex group was acquired on 13 November 2002. 5 The Tasman Building Products group was acquired on 30 September 2003. The balance sheet at June 2004 has been restated under NZ IFRS.6 The Amatek Holdings group was acquired on 1 March 2005. The results for June 2005 have been restated under NZ IFRS.7 The Formica Corporation group was acquired on 2 July 2007. 8 EBIT / Average (net debt + equity + capital notes - deferred tax asset).9 Net earnings/average shareholders’ funds.

75
Regulatory disclosuresDirectors’ relevant interests in equity securities at 30 June 2010
Ordinary shares Capital notes
Directly heldHeld by
Associated Persons
Directly heldHeld by
Associated Persons
H A Fletcher 811,793
A T Jackson 8,000
J F Judge 22,513
J P Ling 1 1,037,873 248,970
D T Spring 39,344 10,716
G T Tilbrook 12,000
K M Vautier 55,692 22,461 29,000 75,500
R G Waters 1,000,093
1,152,909 2,116,546 29,000 75,500
1 Includes 1,000,000 options
Securities dealings by directorsDuring the year, directors disclosed in respect of section 148(2) of the Companies Act 1993 that they acquired or disposed of a relevant interest in securities as follows:
Director
Number of securities acquired
Number of securities disposed
Consideration $ Date
J P Ling 2 500,000 N/A 8/09/09
H A Fletcher 28,500 $222,647 11/09/09
H A Fletcher 133 $1,113 15/10/09
J F Judge 17 $142 15/10/09
J P Ling 484 $4,049 15/10/09
J P Ling 3 75,937 $624,962 15/10/09
K M Vautier 979 $8,190 15/10/09
P E A Baines 4 1,707 $9,132 16/10/09
R S Deane 4 6,387 $34,170 16/10/09
H A Fletcher 4 142,375 $761,706 16/10/09
D T Spring 4 1,362 $7,287 16/10/09
R G Waters 4 139,343 $745,485 16/10/09
A T Jackson 3,000 $24,557 30/10/09
H A Fletcher 200,000 $1,595,151 12/11/09
P E A Baines 5 1,707 $9,132 18/11/09
R S Deane 5 6,387 $34,170 18/11/09
H A Fletcher 5 142,375 $761,706 18/11/09
D T Spring 5 1,362 $7,287 18/11/09

Fletcher Building Annual Report 2010
Director
Number of securities acquired
Number of securities disposed
Consideration $ Date
R G Waters5 139,343 $745,485 18/11/09
D T Spring 400 400 $3,188 19/11/09
G T Tilbrook 5,000 $40,571 18/02/10
H A Fletcher 40,000 $40,000 15/03/10
H A Fletcher 134 $1,127 21/04/10
J F Judge 17 $143 21/04/10
J P Ling 478 $4,019 21/04/10
K M Vautier 987 $8,299 21/04/10
R G Waters 16,100 $127,512 13/05/10
A T Jackson 5,000 $41,038 31/05/10
2 Issue of additional tranche of options3 Relevant interest acquired through the Executive Long-Term Share Scheme with vesting subject to performance obligations4 Disposal of shares acquired on 12 May 2009 under the Company’s Top-Up Offer to ensure compliance with ASX waiver terms5 Replacement shares for those previously issued under the April 2009 Top-Up Offer pursuant to shareholder approval
Directors’ interests registerDirectors’ certificates to cover entries in the interests register in respect of remuneration, dealing in the company’s securities, insurance and other interests have been disclosed as required by the Companies Act 1993.
In accordance with Section 140(2) of the Companies Act 1993, directors have advised changes in their interests during the year ended 30 June 2010 of:
H A Fletcher Appointed as a trustee of the New Zealand Portrait Gallery 7/09/09
D T Spring Resigned as a director of Northport 8/10/09
R G Waters Appointed as chairman of Fisher & Paykel Appliances 26/11/09
R S DeaneCeased as a member of the Advisory Board of Pacific Road Corporate Finance and appointed as chairman of Pacific Road Group
20/01/10
K M Vautier Appointed as director of the Reserve Bank of New Zealand 9/02/10
J P Ling Appointed as director of ASB Bank 30/03/10
A T JacksonAppointed as chairman of the Housing Shareholders’ Advisory Group
17/02/10
G T Tilbrook Appointed as director of QR (Queensland Rail) 27/04/10
G T Tilbrook Appointed as director of The GPT Group 11/05/10
G T Tilbrook Appointed as chairman of Transpacific Industries Group 3/06/10
Securities dealings by directors – continued
Regulatory disclosures

77
Regulatory disclosures
Stock exchange listingsThe company’s shares are listed on the New Zealand (NZX) and Australian (ASX) stock exchanges.
20 largest shareholders as at 31 July 2010
NameNumber of
Shares% of Shares
New Zealand Central Securities Depository Limited 271,080,447 44.66
National Nominees Limited 47,975,574 7.90
RBC Dexia Investor Services Australia Nominees Pty Limited 43,288,334 7.13
JP Morgan Nominees Australia Limited 33,934,923 5.59
Citicorp Nominees Pty Limited 17,682,128 2.91
HSBC Custody Nominees (Australia) Limited 12,964,322 2.14
Cogent Nominees Pty Limited 12,641,089 2.08
Custodial Services Limited 8,776,942 1.45
UBS Nominees Pty Limited 4,135,742 0.68
Investment Custodial Services Limited 4,010,246 0.66
FNZ Custodians Limited 3,758,393 0.62
Masfen Securities Limited 3,540,070 0.58
AMP Life Limited 3,068,081 0.51
Forsyth Barr Custodians Limited 2,187,639 0.36
Fletcher Building Educational Fund Limited 2,069,462 0.34
Fletcher Building Share Schemes Limited 1,901,981 0.31
Private Nominees Limited 1,547,558 0.25
J B Were (NZ) Nominees Limited 1,357,665 0.22
ASB Nominees Limited 1,025,601 0.17
Queensland Investment Corporation 974,873 0.16
New Zealand Central Securities Depository Limited provides a custodial depository service that allows electronic trading of securities to its members and does not have a beneficial interest in these shares. Its major holders of Fletcher Building shares are:
NameNumber of
Shares% of Shares
National Nominees New Zealand Limited 104,072,145 17.15
HSBC Nominees (New Zealand) Limited 67,283,704 11.09
New Zealand Superannuation Fund Nominees Limited 17,883,086 2.95
Accident Compensation Corporation 16,748,202 2.76
Citibank Nominees (New Zealand) Limited 16,004,349 2.64
Premier Nominees Limited 9,292,493 1.53
Tea Custodians Limited 8,000,970 1.32
NZGT Nominees Limited 5,258,772 0.87
AMP Investments Strategic Equity Growth Fund 4,461,878 0.74
Asteron Life Limited 3,627,113 0.60

Fletcher Building Annual Report 2010
Regulatory disclosures
Substantial security holdersAccording to notices given to the company under the Securities Markets Act 1988, as at 31 July 2010, the substantial security holders in the company and their relevant interests are noted below. The total number of issued voting securities of Fletcher Building Limited as at that date was 606,946,993.
Substantial Security HoldersNumber of voting
securitiesDate of notice
Perennial Value Management 34,327,434 9/07/07
The Capital Group Companies, Inc 36,750,610 29/01/09
IOOF Holdings 30,400,783 10/06/10
Perpetual Trustees Australia 71,769,287 13/07/10
Distribution of shareholders and holdings as at 31 July 2010
Size of HoldingsNumber of
Shareholders%
Number of Shares
%
1 to 999 12,598 35.21 5,389,584 0.89
1,000 to 4,999 17,503 48.92 38,658,179 6.37
5,000 to 9,999 3,454 9.65 23,084,402 3.80
10,000 to 49,999 2,002 5.60 34,770,881 5.73
50,000 to 99,999 103 0.29 6,849,101 1.13
100,000 to 499,999 74 0.21 15,120,857 2.49
500,000 and over 42 0.12 483,073,989 79.59
Total 35,776 100.00 606,946,993 100.00
Geographic distributionNumber of
Shareholders%
Number of Shares
%
New Zealand 30,863 86.26 417,866,314 68.85
Australia 4,207 11.76 187,254,885 30.85
United States of America 120 0.34 253,109 0.04
Rest of the World 586 1.64 1,572,685 0.26
Total 35,776 100.00 606,946,993 100.00
All shares issued are fully paid and have full voting rights. The number of shareholders holding less than the marketable parcel of A$500 under the listing rules of the ASX is 193.

79
Regulatory disclosures
Distribution of capital noteholders and holdings as at 31 July 2010
Fletcher Building Limited
Size of HoldingNumber of
Noteholders%
Number of Capital Notes
%
1 to 4,999 1,587 28.78 4,641,166 1.86
5,000 to 9,999 1,242 22.53 8,334,166 3.33
10,000 to 49,999 2,183 39.60 43,423,417 17.37
50,000 to 99,999 340 6.17 20,249,500 8.10
100,000 to 499,999 134 2.43 21,279,500 8.51
500,000 and over 27 0.49 152,072,251 60.83
Total 5,513 100.00 250,000,000 100.00
Fletcher Building Finance Limited
Size of HoldingNumber of
Noteholders%
Number of Capital Notes
%
1 to 4,999 1 0.02 4,000 0.00
5,000 to 9,999 593 13.69 3,323,000 1.18
10,000 to 49,999 2,787 64.32 55,475,500 19.72
50,000 to 99,999 569 13.13 31,986,000 11.37
100,000 to 499,999 342 7.89 53,935,000 19.17
500,000 and over 41 0.95 136,596,500 48.56
Total 4,333 100.00 281,320,000 100.00
Limitations on the acquisition of the company’s securitiesThe terms of the company’s admission to the ASX and ongoing listing require the following disclosures.
The company is incorporated in New Zealand. As such it is not subject to Chapters 6, 6A, 6B and 6C of the Australian Corporations Act dealing with the acquisition of shares (such as substantial holdings and takeovers). Limitations on acquisition of the securities are, however, imposed on the company under New Zealand law:
(a) Securities in the company are in general freely transferable and the only significant restrictions or limitations in relation to the acquisition of securities are those imposed by New Zealand laws relating to takeovers, overseas investment and competition.
(b) The New Zealand Takeovers Code creates a general rule under which the acquisition of more than 20 percent of the voting rights in the company or the increase of an existing holding of 20 percent or more of the voting rights in the company can only occur in certain permitted ways. These include a full takeover offer in accordance with the Takeovers Code, a partial takeover offer in accordance with the Takeovers Code, an acquisition approved by an ordinary resolution, an allotment approved by an ordinary resolution, a creeping acquisition (in certain circumstances) or compulsory acquisition if a shareholder holds 90 percent or more of the shares in the company.
(c) The New Zealand Overseas Investment Act and Overseas Investment Regulations regulate certain investments in New Zealand by overseas persons. In general terms, the consent of the New Zealand Overseas Investment Office is likely to be required where an “overseas person” acquires shares or an interest in shares in the company that amount to more than 25 percent of the shares issued by the company or, if the overseas person already holds 25 percent or more, the acquisition increases that holding.
(d) The New Zealand Commerce Act 1986 is likely to prevent a person from acquiring shares in the company if the acquisition would have, or would be likely to have, the effect of substantially lessening competition in a market.
(e) On 31 March 2009, ASX granted the company an ongoing waiver from ASX Listing Rule 7.1 which regulates the circumstances where companies listed on ASX are required to seek shareholder approval for the issue of securities. One of the conditions of the waiver is that the company remains subject to, and complies with, the listing rules of NZX with respect to the issue of new securities.
In accordance with the requirements of the ASX waiver, the company certifies that during the 12 months to 30 June 2010 it has been subject to, and has complied with, the requirements of the NZX with respect to the issue of new securities and that it continues to comply with those requirements.
The other equity securities on issue are 531 million of capital notes, which can convert to ordinary shares of the company on the basis of 98 per cent of the then current value of the shares. There were 9,846 holders of the capital notes at 31 July 2010. These securities are quoted on the NZX but are unquoted on the ASX.

Fletcher Building Annual Report 2010
Regulatory disclosures
Subsidiary company directorsSection 211(2) of the New Zealand Companies Act 1993 requires the company to disclose, in relation to its subsidiaries, the total remuneration and value of other benefits received by directors and former directors and particulars of entries in the interests registers made during the year ended 30 June 2010.
Apart from some overseas subsidiaries which have independent directors or are required to have a specific number of local residents as directors, no wholly owned subsidiary has directors who are not full-time employees of the group. The company had 233 subsidiaries worldwide at 30 June 2010.
No employee of Fletcher Building Limited appointed as a director of Fletcher Building Limited or its subsidiaries receives, or retains any remuneration or other benefits, as a director. The remuneration and other benefits of such employees, received as employees, are included in the relevant bandings for remuneration disclosed previously in the Remuneration report. Except where shown below, no other director of any subsidiary company within the group receives director’s fees or other benefits as a director.
The following persons respectively held office as directors of subsidiary companies at the end of the year, or in the case of those persons with the letter (R) after their name ceased to hold office during the year. Alternate directors are indicated by the letter (A) after their name.
Companies placed in liquidation during the year are indicated by the letter (L) after their name
AHI Roofing (Malaysia) SDN BHD Z Bin Mat Desa, P Binti Mohamad, W Roest, C Ellis, P Wilson, P Stichbury (R)
AHI Roofing (Middle East) Limited W Roest, C Ellis
AHI Roofing Gyarto Es Kereskedelmi Korlatolt Felelossegu Tarasag C Ellis, A O’Brien, M Adamson, P Wilson, P Stichbury (R)
AHI Roofing Limited W Roest, C Ellis
AHI Roofing Proisvodnja In Distribucija Stresnih Sistemov D.O.O. C Ellis, M Adamson, P Wilson, P Stichbury (R)
AHI Roofing Pty Limited D Le Quesne, C Ellis
Aickin Timber Limited W Roest, J Beveridge, D Edwards (R)
Amatek Holdings Limited M Farrell, D Le Quesne, W Roest, V Gulia
Amatek Industries Pty Limited D Le Quesne, W Roest, V Gulia
Amatek Investments Limited M Farrell, D Le Quesne, W Roest, V Gulia
Amtel Pty Limited T Richards, P Zuckerman
Anson Building Supplies Limited A Anson, J Beveridge, R de Raat (A), D Edwards (R)
Aramis Investments Limited W Roest, M Farrell
Auckland Frame and Truss Supplies Limited O Lyttleton, D King, J Beveridge, D Deavoll, A Sellar, M Fegan (R), D Edwards (R)
Australian Fibre Glass Pty Limited D Le Quesne, V Gulia
Bandelle Pty Limited D Le Quesne, V Gulia
Baron Insulation Pty Ltd C Ellis, D Isaacs
Boden Building Supplies Limited P Boden, J Beveridge, R de Raat (A), D Edwards (R)
Builders Hardware Company Limited J Beveridge, R de Raat (A), R Callon (A), P Dolheguy, D Edwards (R)
Building Choices Limited D Close, J Beveridge, R de Raat (A), D Edwards (R)
Burford Building Choices Limited A Burford, J Beveridge, R de Raat (A), D Edwards (R)
Building Products Superannuation Fund Pty Limited C Chick, S Hart, W Roest, L Box, J McCabe (A)
Calder Building Supplies Limited J Beveridge, R de Raat (A), D Edwards (R)
Calvert Building Supplies Limited J Beveridge, R de Raat (A), M Calvert (R), D Edwards (R)
Campbell Building Supplies Limited J Beveridge, R de Raat, D Edwards (R)
Caravan Components Pty Limited D Le Quesne, V Gulia
Christchurch Frame & Truss Limited J Beveridge, D Close, D Edwards (R)
Cleaver Building Supplies Limited M Cleaver, J Beveridge, R de Raat (A), D Edwards (R)
Collier Building Supplies Limited J Beveridge, R de Raat (A), D Edwards (R)
Consort Laminates Limited M Adamson, P Hall, P Alderson (R)
Creeks Metal Industries Pty Limited D Le Quesne, V Gulia

81
Regulatory disclosures
Cullen Building Supplies Limited R Cullen, J Beveridge, R de Raat (A), D Edwards (R)
Cullity Timber Holdings Pty Limited W Roest, D Worley, L Box (A)
Dale King Building Supplies Limited J Beveridge, D King, R de Raat (A), C Tucker (A), D Edwards (R)
Davis & Casey Building Supplies Limited T Davis, J Beveridge, R de Raat (A), D Edwards (R)
Deavoll Building Supplies Limited J Beveridge, D Deavoll, R de Raat (A), C Tucker (A), D Edwards (R)
Decorative Surfaces Holding AB M Adamson, H Lindegard, M Nordgren
Decra Roofing Systems, Inc. W Hudson, C Ellis
Delcon Holdings (No. 1) Limited P Zuckerman, W Roest
Delcon Holdings (No. 2) Limited P Zuckerman, W Roest
Delcon Holdings (No. 3) Limited C Ellis, W Roest, A Cadman
Delcon Holdings (No. 8) Limited W Roest, C Ellis
Delcon Holdings (No. 10) Limited M Farrell, W Roest
Delcon Holdings (No. 11) Limited M Farrell, W Roest
DVS Healthy Homes Limited M Farrell, W Roest
DVS Limited C Ellis, W Roest
EFA Technologies Pty Limited M Binns, G West
Engineered Timber Solutions Ltd J Beveridge, D Edwards (R)
Evans Building Supplies Limited M Evans, J Beveridge, R de Raat (A), D Edwards (R)
FBHS (Aust) Pty Limited T Richards
FDL No. 26 Limited J Beveridge
FDL No. 27 Limited J Beveridge
FDL No. 28 Limited J Beveridge
FDL No. 29 Limited J Beveridge
FDL No. 30 Limited J Beveridge
Fegan Building Supplies Limited J Beveridge, R de Raat (A), D Edwards (R)
Fletcher Building (Australia) Finance Pty Limited V Gulia, D Le Quesne
Fletcher Building (Australia) Pty Limited M Farrell, V Gulia, D Le Quesne, W Roest
Fletcher Building (Fiji) Limited M Binns, P Thumath, A Kumar
Fletcher Building Finance Limited J Judge, A Jackson, H Fletcher, J Ling, Sir D Spring, K Vautier, R Waters, G Tilbrook, Dr. R Deane (R)
Fletcher Building Holdings Limited W Roest, M Farrell
Fletcher Building Holdings USA Inc. W Hudson, C Ellis
Fletcher Building Netherlands Antilles B.V. M Farrell, E Rakers, W Roest, S Coeriel (US $3,919)
Fletcher Building Netherlands B.V. M Farrell, W Roest, P Ruoff, A Van De Werken (EUR 2,500)
Fletcher Building Nominees Limited J McDonald, G Niccol, M Farrell, W Roest, P Merry, C Munkowits, G Key (R)
Fletcher Building Products Limited C Ellis, W Roest
Fletcher Building Share Schemes Limited P Merry, G Niccol, J McDonald
Fletcher Challenge Building Bolivia S.A. M Binns, K Cowie, H Ritchie
Fletcher Challenge Building UK Limited J Ollard, D Wood
Fletcher Challenge Finance Investments Limited W Roest, M Farrell
Fletcher Challenge Forest Industries Limited M August, J Ollard, D Wood
Fletcher Challenge Industries S.A. M Binns, K Cowie, H Ritchie

Fletcher Building Annual Report 2010
Regulatory disclosures
Fletcher Challenge Investments Overseas Limited W Roest, M Farrell
Fletcher Challenge Overseas Holdings Limited W Roest, M Farrell
Fletcher Composite Research Limited W Roest, P Zuckerman
Fletcher Concrete (Fiji) Limited M Binns, P Thumath, A Kumar
Fletcher Concrete & Infrastructure Limited M Binns, W Roest
Fletcher Construction (Malaysia) SDN BHD (L) I Liew (R), T Chan (R)
Fletcher Construction (Nouvelle Caledonie) Limited A Brown
Fletcher Construction (Solomon Islands) Limited A Brown, L Gray
Fletcher Construction Australia Pty Limited M Binns, C Munkowits, C Wickham (R), K Davey (R)
Fletcher Construction Company (Fiji) Limited A Brown, L Gray, G Crum
Fletcher Construction Pty Limited M Binns, C Munkowits, C Wickham, V Gulia
Fletcher Distribution Limited W Roest, J Beveridge, D Edwards (R)
Fletcher Insulation (Vic) Pty Limited C Ellis, D Isaacs
Fletcher Insulation Pty Limited C Ellis, D Isaacs
Fletcher Morobe Construction Pty Limited A Brown, L Gray, L Mathias, K Fletcher
Fletcher Pacific Steel (Fiji) Limited D Hargovind, W Roest, I Jones, P Zuckerman, J Beveridge (R)
Fletcher Property Developments UK Limited M August, J Ollard, D Wood
Fletcher Property Investments UK Limited M August , J Ollard, D Wood
Fletcher Property Limited M Binns, W Roest
Fletcher Residential Limited M Binns, W Roest
Fletcher Steel Limited W Roest, P Zuckerman
Fletcher Wood Panels (Australia) Pty Limited W Roest, D Worley, L Box (A)
FM Holdings Inc. W Roest, D Worley, M Adamson
FMB Comércio Importacão e Exportacão de Laminados Decorativos Ltda G Pikielny
Forman Building Systems Limited C Ellis, W Roest
Forman Building Systems Pty Limited C Ellis, D Isaacs
Forman Commercial Interiors Limited C Ellis, W Roest
Forman Group Limited C Ellis, W Roest
Forman Insulation Limited C Ellis, W Roest
Forman Manufacturing Limited C Ellis, W Roest
Formica (Asia) Ltd C Wang, D Wang, S Kuo (R)
Formica (Malaysia) Sdn. Bhd. C Wang, T Ren, J Yang, K Leong, S Kuo (R), S Tye (R), S Geh (R)
Formica (N.Z.) Limited D Worley, W Roest
Formica (Nederland) B.V. M Adamson, J Ruurd de Pater
Formica (Singapore) Pte. Ltd C Wang, C Chang, S Kuo (R), S Neo (R)
Formica (Thailand) Co. Ltd W Kunanantakul, S Oetama, D Wang, C Wang, S Kuo (R)
Formica Canada Inc. C Sarrazin, M Adamson, L Box
Formica Corporation W Roest, D Worley, M Adamson
Formica Danmark A/S U Hector, H Lindegard, J Whisker
Formica de Mexico SA DE CV J Oritz, M Adamson, L Box
Formica Finance Limited M Adamson, P Hall, W Roest, P Alderson (R)

83
Regulatory disclosures
Formica Global LLC M Adamson, L Box, R Bollman, M Vernon
Formica Holdco UK Limited M Adamson, P Hall, P Alderson (R)
Formica Holding Corp. W Roest, D Worley, M Adamson
Formica Holding GmbH M Adamson
Formica Holdings Limited M Adamson, J Whisker, P Hall, R Pollington, P Alderson (R)
Formica II Corporation W Roest, D Worley, M Adamson
Formica Iki Oy M Adamson, H Lindegard, J Whisker, P Alderson (R)
Formica International LLC M Adamson, L Box, R Bollman, M Vernon
Formica Korea Corporation C Wang, T Ren, S Kuo (R)
Formica Limited M Adamson, L Box, P Hall, R Pollington, W Roest, J Whisker, D Worley, D Pallas, P Alderson (R)
Formica LLC D Worley
Formica Middle East B.V. M Adamson
Formica Norge A/S S Berge, H Lindegard, J Whisker
Formica PSM Limited M Adamson, P Hall, P Alderson (R)
Formica S.A. (France) M Adamson, P Hall, R Lambert
Formica S.A. (Spain) M Adamson, A Amorebieta, P Hall, H Nindl, A Inchausti (R)
Formica Skandinavien AB M Adamson, H Lindegard, J Whisker
Formica SP.zo.O. M Adamson
Formica Taiwan Corporation C Wang, S Oetama, T Ren, S Kuo (R), S Limboonyaprasert (R)
Formica Vertriebs GmbH M Adamson, J Schuster
Geoff Brown Building Supplies Limited G Brown, J Beveridge, R de Raat (A), D Edwards (R)
Graeme Joy Building Supplies Limited G Joy, J Beveridge, R de Raat (A), D Edwards (R)
Gravure et Polissage de Surfaces Metalliques M Adamson, P Hall, R Lambert
Gray Building Supplies Limited J Beveridge, R de Raat (A), C Gray (R), D Edwards (R)
Hedges Building Supplies Limited J Beveridge, R de Raat (A), C Tucker (A) (R), R Hedges (R), D Edwards (R)
Homapal Plattenwerk GmbH & Co KG F Homann, M Adamson
Home&Dry Limited M Farrell, W Roest
Hooper Building Supplies Limited J Beveridge, R de Raat (A), D Edwards (R)
Insulation Solutions Holdings Pty Limited D Le Quesne, V Gulia
John Cockburn Building Supplies Limited J Cockburn, J Beveridge, R de Raat (A), D Edwards (R)
Ken Jones Building Supplies Limited K Jones, J Beveridge, R de Raat (A), D Edwards (R)
Kenna Building Supplies Limited L Kenna, J Beveridge, R de Raat (A), D Edwards (R)
Kevin Jarvis Building Supplies Limited K Jarvis, J Beveridge, R de Raat (A), D Edwards (R)
KH Consolidated Industries (Canberra) Pty Limited D Le Quesne, P Zuckerman
Kimura Building Supplies Limited J Kimura, J Beveridge, R de Raat (A), C Tucker (A), D Edwards (R)
Kinsey Kydd Building Supplies Limited J Beveridge, S Kinsey, R de Raat (A), C Tucker (A), D Edwards (R)
Kusabs Building Supplies Limited J Beveridge, G Kusabs, R de Raat (A), C Tucker (A), D Edwards (R)
Laminates Acquisition Co. M Adamson, W Roest, D Worley
Laminates Holdings Pty Limited W Roest, D Worley
Laminex (Australia) Pty. Ltd. D Worley, W Roest, L Box (A)
Laminex Finance Pty Limited V Gulia, D le Quesne

Fletcher Building Annual Report 2010
Regulatory disclosures
Laminex Group (N.Z.) Limited D Worley, W Roest
Laminex Group Pty Limited D Worley, W Roest, L Box (A)
Laminex Inc. W Roest, D Worley
Laminex Overseas Holdings Pty Limited D Le Quesne, D Worley, V Gulia
Laminex US Holdings Pty Limited D Le Quesne, V Gulia
Langford-Lee Building Supplies Limited J Beveridge, R de Raat (A), D Edwards (R), M Langford-Lee (R), C Tucker (A) (R)
MacReady Building Supplies Limited J Beveridge, R de Raat, J MacReady, D Edwards (R)
McDonald Building Supplies Limited I McDonald, J Beveridge, R de Raat (A), D Edwards (R)
McGill Building Supplies Limited J Beveridge, R de Raat (A), J McGill (R), D Edwards (R), C Tucker (A) (R)
Meleccio Enterprises Limited M Binns, W Roest
Minnell Building Supplies Limited J Beveridge, D Minnell, R de Raat (A), C Tucker (A), D Edwards (R)
Morinda Australia Pty Limited T Richards
Mount Timber & Hardware Limited W Roest, J Beveridge, D Edwards (R)
NCB (2006) Limited G Florence, A Lanigan, R Scott, J Beveridge, D Edwards (R)
New Zealand Ceiling & Drywall Supplies Limited D Jones
Nick Letica Building Supplies Limited N Letica, J Beveridge, R de Raat (A), C Tucker (A), D Edwards (R)
Nock Building Supplies Limited M Nock, J Beveridge, R de Raat (A), C Tucker (A), D Edwards (R)
Pacific Trade & Export Limited M Binns, W Roest
Perstorp Warerite Limited M Adamson, P Hall, P Alderson (R)
PinkFit Limited M Farrell, W Roest, D Jones (R), D Thomas (R)
PlaceMakers Limited W Roest, J Beveridge, D Edwards (R)
Raoul Holdings Limited M Binns, W Roest
Rocla Australia Pty Limited M Binns, D Le Quesne, G West
Rocla Concrete Pipes Pty Limited M Binns, D Le Quesne
Rocla Drilling Pty Limited M Binns, D Le Quesne, G West
Rocla Group Superannuation Fund Pty Limited J Gardiner, W Roest, L Box
Rocla Industries Pty Limited D Le Quesne, V Gulia
Rocla Masonry Pty Limited M Binns, D Le Quesne, G West
Rocla Materials Pty Limited M Binns, G West
Rocla NSW Pty Limited M Binns, D Le Quesne
Rocla Pty Limited M Binns, G West, S Baker
Rocla SA Pty Limited M Binns, D Le Quesne, G West
Rocla Vic Pty Limited D Le Quesne, V Gulia
Rolleston Building Supplies Limited R Rolleston, J Beveridge, R de Raat (A), C Tucker (A), D Edwards (R)
Seabar Holdings (No 16) Limited M Binns, W Roest
Servicios Formica de Mexico SA DE CV J Oritz, M Adamson, L Box
Shanghai Formica Decorative Material Co. Ltd J Hu, H Lee, S Yiu, C Wang, S Kuo (R), T Ren (R)
Shed Boss NZ Limited M Farrell, W Roest
Sisalation Pty Limited C Ellis, D Isaacs
South Auckland Prenail and Truss Company Limited J Beveridge, D Edwards (R)

85
Regulatory disclosures
Southbound Building Supplies Limited A Rance, J Beveridge, R de Raat (A), D Edwards (R)
Steven Marshall Building Supplies Limited S Marshall, J Beveridge, R de Raat (A), C Tucker (A), D Edwards (R)
Stickland Building Supplies Limited L Stickland, J Beveridge, R de Raat (A), C Tucker (A), D Edwards (R)
Stramit (Preston) Pty Limited D Le Quesne, P Zuckerman
Stramit Corporation Pty Limited T Richards, P Zuckerman
Stramit Industries (SEA) Pte Limited W Roest, P Dessent, D Kiew
Stramit Pty Limited D Le Quesne, P Zuckerman
Sullivan & Armstrong Building Supplies Limited J Sullivan, J Beveridge, R de Raat (A), C Tucker (A), D Edwards (R)
Surface Materials Iki Oy M Adamson, P Alderson, J Kerbs
Tango Warkworth Limited J Beveridge, C Loughlin
Tasman Access Floors Pty Limited D Le Quesne, C Ellis
Tasman Australia Pty Limited D Le Quesne, V Gulia
Tasman Building Products Pty Limited D Le Quesne, V Gulia
Tasman Insulation New Zealand Limited W Roest, C Ellis
Tasman Investments (Netherlands Antilles) N.V. E Rakers, M Farrell, S Coeriel (US $3,808), W Roest
Tasman Sinkware North America, Inc. C Ellis
Tasman Sinkware Pty Limited C Ellis, J Bayer
TBP Group Pty Limited D Le Quesne, V Gulia
Ted Harper Building Supplies Limited E Harper, J Beveridge, R de Raat (A), C Tucker (A), D Edwards (R)
Tenedora Formica Mexico, S.A. de C.V. J Oritz, M Adamson, L Box
Terrace Insurances (PCC) Limited M Eades (£2,500), J Crowder, M Farrell, W Roest
Terry Mellsop Building Supplies Limited T Mellsop, J Beveridge, R de Raat (A), D Edwards (R)
The Diller Corporation W Roest, D Worley, M Adamson
The Fletcher Construction Company Cook Islands Limited A Brown, L Gray
The Fletcher Construction Company Limited M Binns, W Roest
The Fletcher Organisation (Vanuatu) Limited A Brown, L Gray, Diract Limited, Lotim Limited
The Fletcher Trust and Investment Company Limited M Binns, W Roest
The O’Brien Group Limited W Roest, D Worley
Thomas Street Pty Limited D Le Quesne, M Binns
Trade Mart Limited W Roest, J Beveridge, D Edwards (R)
Trademates Limited W Roest, J Beveridge, D Edwards (R)
Trevor Cockburn Building Supplies Limited J Beveridge, R de Raat (A), D Edwards (R), T Cockburn (R)
Unidur GmbH M Adamson, J Schuster
Ward Building Supplies Limited R Ward, J Beveridge, R de Raat (A), C Tucker (A), D Edwards (R)
Waterman Building Supplies Limited J Beveridge, R de Raat (A), D Edwards (R)
Wellington Frame & Truss Limited J Beveridge, D Edwards (R)
Wesfi Limited D Le Quesne, W Roest, L Box (A), D Worley
Wesfi Manufacturing Pty Limited W Roest, D Worley, L Box (A)
Winstone Wallboards Limited W Roest, C Ellis

Fletcher Building Annual Report 2010
Investor informationAnnual shareholders’ meetingThe Annual Shareholders’ Meeting of Fletcher Building Limited will be held at Eden Park, Mt Eden, Auckland, New Zealand, at 10.30am on Wednesday 17 November 2010.
Dividend Reinvestment PlanFletcher Building shareholders (excluding those in jurisdictions where the issue of shares is not permitted by law) can participate in a Dividend Reinvestment Plan, under which they have the opportunity to reinvest their dividends in additional shares. To participate, please contact the share registry.
Further information onlineDetails on Fletcher Building, its governance policies, and its operations for the year ended 30 June 2010 can be viewed at the Fletcher Building website, at fletcherbuilding.com. This website contains all news releases to the NZX and other financial presentations made by the company.
Shareholder communicationsThe company is not required to send printed copies of the annual report and half year review to security-holders. Instead, Fletcher Building sends an annual review which is a summary of the group’s operational and financial activities for the year, although security holders can view the reports on the company’s website. In addition, they have a right to receive a copy of these reports on request.
Direct crediting of interest and dividendsTo minimise the risk of fraud and misplacement of interest and dividend cheques shareholders and noteholders are strongly recommended to have all payments made by way of direct credit to their nominated bank account. This can be done by simply giving the share registry written notice.
Share registriesDetails of the company’s share registries are given in the Directory on the inside back cover of this report. Shareholders with enquiries about share transactions, changes of address or dividend payments should contact the share registry in the country in which their shares are registered.
Final dividend informationThe company has declared a final dividend for the year of 15 cents per share payable on 20 October 2010. This is in addition to the interim dividend of 14 cents per share paid in April 2010. Partial New Zealand tax credits are attached to the final dividend. No Australian franking credits are attached. The Dividend Reinvestment Plan will not be operative for the final dividend.
2010 Final dividend summary table 1
NZ cents per share NZ residentsAustralian residents
Other non-residents
Dividend declared 15.0000 15.0000 15.0000
NZ tax credits 2 3.2143
NZ supplementary dividend 3 1.3235 1.3235
Australian franking tax credits 4 0.0000
Gross dividend for NZ tax purposes 18.2143 16.3235 16.3235
NZ tax (33%) 5 (6.0107)
NZ non-resident withholding tax (15%) 6 (2.4485) (2.4485)
Net cash received after NZ tax 12.2036 13.8750 13.8750
Australian tax (15%) 7 (2.4485)
Reduced by credit for NZ non-resident withholding tax 2.4485
Net cash dividend to shareholders 12.2036 13.8750 13.8750
1 This summary is of a general nature and the tax rates used and the calculations are intended for guidance only. As individual circumstances will vary, shareholders are advised to seek independent tax advice.
2 These tax credits are not received in cash but are relevant in determining the gross dividend received for NZ tax purposes. They are comprised wholly of imputation credits and do not include and dividend withholding payment credits. The dividend has imputation credits attached at the rate of 3.2143 cents per share.
3 The supplementary dividend is payable to non-New Zealand shareholders and has the effect of removing the cost of New Zealand non-resident withholding tax on that part of the dividend which is fully imputed. From 1 February 2010, non-resident shareholders with 10% or greater shareholding and/or shareholders from jurisdictions for which the NRWT rate on dividends paid from New Zealand is less than 15% are no longer eligible to receive supplementary dividends. These shareholders are eligible for an exemption from NRWT to the extent the dividend is fully imputed.
4 There are no Australian franking credits attached to this dividend. Refer to the governance section on the Fletcher Building website for the company’s franking tax crediting policy.5 For all NZ resident shareholders who do not hold an exemption certificate, resident withholding tax (RWT) is required to be deducted at 33% from that part of the gross dividend
which has not been credited with imputation credits and at 3% from that part of the gross dividend which has been credited with imputation credits at 30%. Accordingly, for those shareholders, a deduction of 2.7964 cents per share will be made on the date of payment from the dividend declared of 15.0 cents per share and forwarded to Inland Revenue. Resident shareholders who have a tax rate less than 33% will need to file a tax return to obtain a refund of the RWT.
6 NZ non-resident withholding tax at the rate of 15% on the gross dividend for NZ tax purposes.7 This summary uses the 15% income tax rate applicable in Australia to complying superannuation funds, approved deposit funds and pooled superannuation trusts. Different tax rates
will apply to other Australian shareholders, including individuals, depending on their circumstances.

87
DirectoryExecutive committee
Jonathan LingChief Executive Officer and Managing Director BEng (Melbourne); MBA (RMIT), FIPENZ
Mark AdamsonChief ExecutiveLaminates & Panels - Formica BA (UK)
John BeveridgeChief ExecutiveDistributionBA (Economics)
Mark BinnsChief ExecutiveInfrastructureLLB (Auckland)
Chris EllisChief ExecutiveBuilding ProductsBEng Civil (Christchurch); MSci (Stanford)
Martin FarrellCompany Secretary and General CounselBCom; LLB (Otago); CA (NZ)
Peter MerryExecutive General ManagerHuman ResourcesBBus Sci (Cape Town); MBA (Cape Town)
Bill RoestChief Financial OfficerFCCA (UK); ACA (NZ)
David WorleyChief ExecutiveLaminates & Panels - LaminexBCom (Auckland); MBA (Auckland)
Paul ZuckermanChief ExecutiveSteelBSci Chem (New York), MBus Admin (Ohio)
Registered officesNew Zealand Fletcher Building LimitedPrivate Bag 92 114Victoria Street WestAuckland 1142New Zealand
Fletcher House810 Great South RoadPenrose, Auckland 1061New ZealandT. +64 9 525 9000
AustraliaFletcher Building Australia Locked Bag 7013, Chatswood DC 2067, NSW 2067, Australia
Level 11, Tower B, Zenith Centre 821 Pacific Highway Chatswood, NSW 2067, Australia T. +61 2 8986 0900 ARBN 096 046 936
Shareholder enquiriesChanges to address, payment instructions and investment portfolios can be viewed and updated online: fletcherbuilding.com/registry
Enquiries may be addressed to the Share Registrar, Computershare Investor Services:
New ZealandComputershare Investor Services Limited Private Bag 92 119 Victoria Street WestAuckland 1142New Zealand
Level 2, 159 Hurstmere RdTakapuna, North Shore City 0622New ZealandT. +64 9 488 8777F. +64 9 488 8787E. [email protected]
AustraliaComputershare Investor Services Pty LimitedGPO Box 2975Melbourne, VIC 3001, Australia
Yarra Falls, 452 Johnston StreetAbbotsford, VIC 3067, AustraliaT. 1800 501 366 (within Australia)T. +61 3 9415 4083 (outside Australia)F. +61 3 9473 2009
Trustee for capital noteholdersPerpetual Trust LimitedPO Box 3376Shortland StreetAuckland 1140New Zealand
Level 12, AMP Centre29 Customs Street West Auckland 1010New ZealandT. +64 9 366 3290
Other investor enquiriesFletcher Building LimitedPrivate Bag 92114Victoria Street WestAuckland 1142, New ZealandT. +64 9 525 9000F. +64 9 525 9032E. [email protected] W. fletcherbuilding.com
Download the full 2010 Annual Report online: fletcherbuilding.com/10/downloads
Please recycle me.Printed on 9Lives Ambassador Satin. Manufactured with 55% recycled fibre and 45% Chain of Custody certified virgin fibre.
Philip King General Manager Investor Relations
More online: fletcherbuilding.com/ 10/investor

Fletcher Building Annual Report 2010
Notes


Fletcher Building Annual Report 2010


