By Angel Kaohsiung Municipal Jhong Siao Junior High School X.
Upload
ethan-diamondCategory
view
220download
5
FLEET PLANNING
Carmen DiepNancy HoSiao ChinChristian Wittkopf

Hello Again!

Model Selection
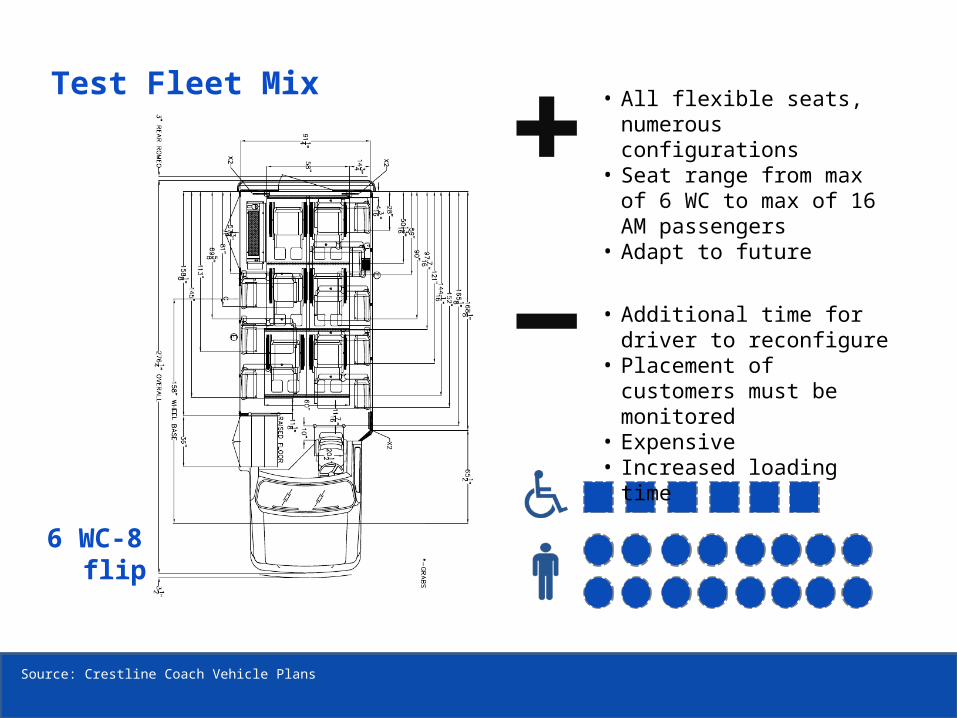
6 WC-8 flip
Source: Crestline Coach Vehicle Plans
Test Fleet Mix • All flexible seats, numerous configurations
• Seat range from max of 6 WC to max of 16 AM passengers
• Adapt to future
• Additional time for driver to reconfigure
• Placement of customers must be monitored
• Expensive• Increased loading time
Source: Crestline Coach Vehicle Plans
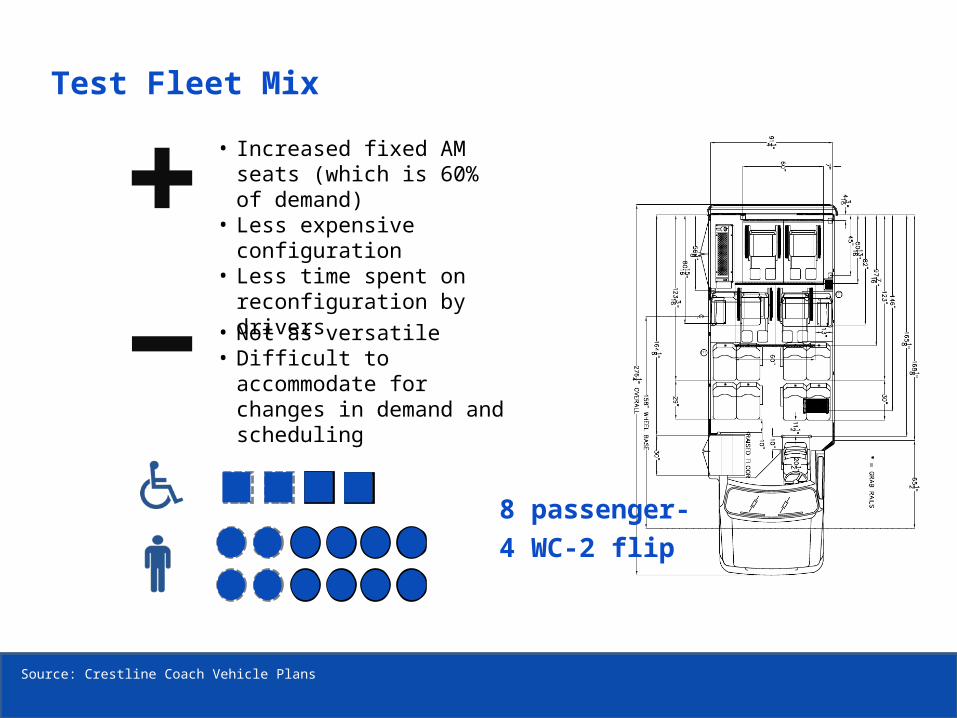
Test Fleet Mix
8 passenger-4 WC-2 flip
• Increased fixed AM seats (which is 60% of demand)
• Less expensive configuration
• Less time spent on reconfiguration by drivers
• Not as versatile• Difficult to accommodate for
changes in demand and scheduling
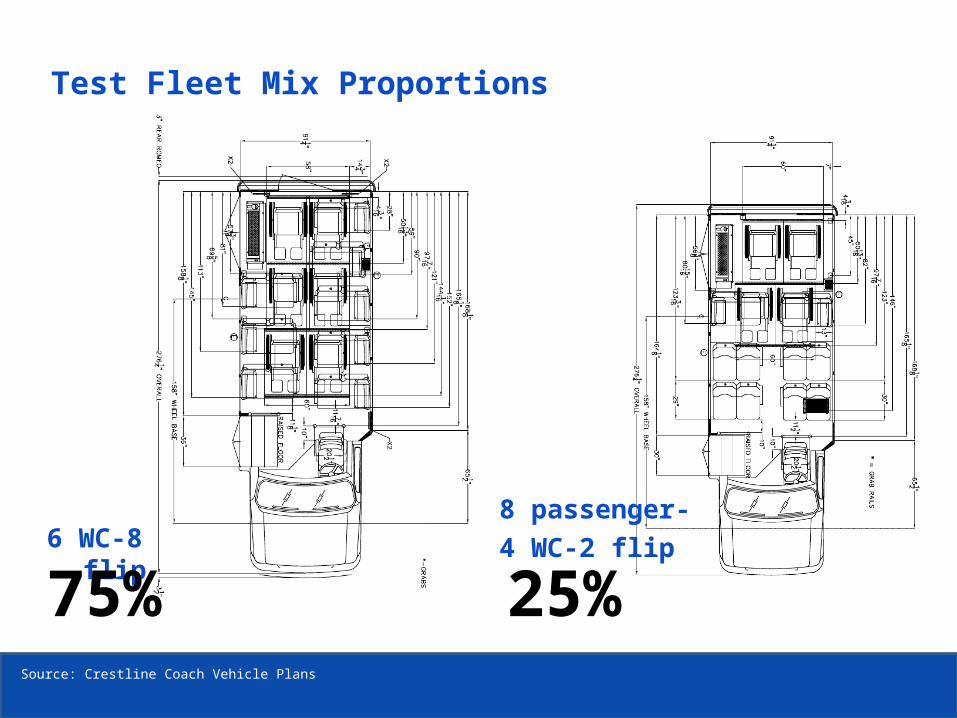
6 WC-8 flip
Source: Crestline Coach Vehicle Plans
75% 25%
Test Fleet Mix Proportions
8 passenger-4 WC-2 flip

Preliminary Analysis

Current DATS Seat type Utilization (Feb. 03)
Source: DATS 2010Trips.xlsx > test1day.xlsx – MGTSC468 2011 Group 2
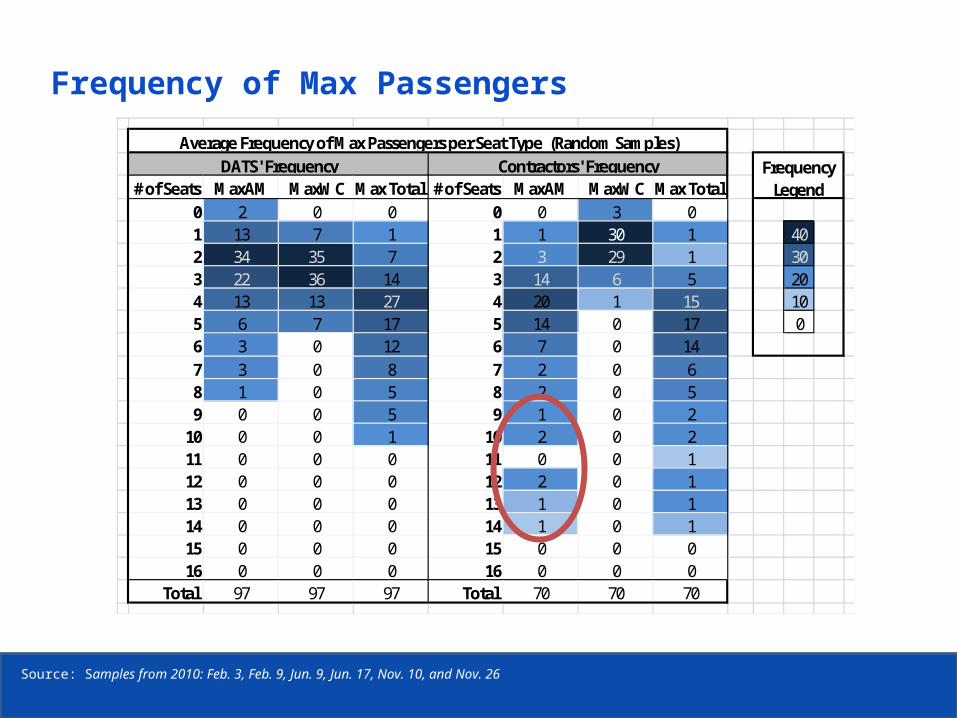
Source: Samples from 2010: Feb. 3, Feb. 9, Jun. 9, Jun. 17, Nov. 10, and Nov. 26
# of Seats MaxAM MaxWC Max Total # of Seats MaxAM MaxWC Max Total 0 2 0 0 0 0 3 01 13 7 1 1 1 30 1 402 34 35 7 2 3 29 1 303 22 36 14 3 14 6 5 204 13 13 27 4 20 1 15 105 6 7 17 5 14 0 17 06 3 0 12 6 7 0 147 3 0 8 7 2 0 68 1 0 5 8 2 0 59 0 0 5 9 1 0 2
10 0 0 1 10 2 0 211 0 0 0 11 0 0 112 0 0 0 12 2 0 113 0 0 0 13 1 0 114 0 0 0 14 1 0 115 0 0 0 15 0 0 016 0 0 0 16 0 0 0
Total 97 97 97 Total 70 70 70
Average Frequency of Max Passengers per Seat Type (Random Samples)DATS' Frequency Contractors' Frequency Frequency
Legend
Frequency of Max Passengers
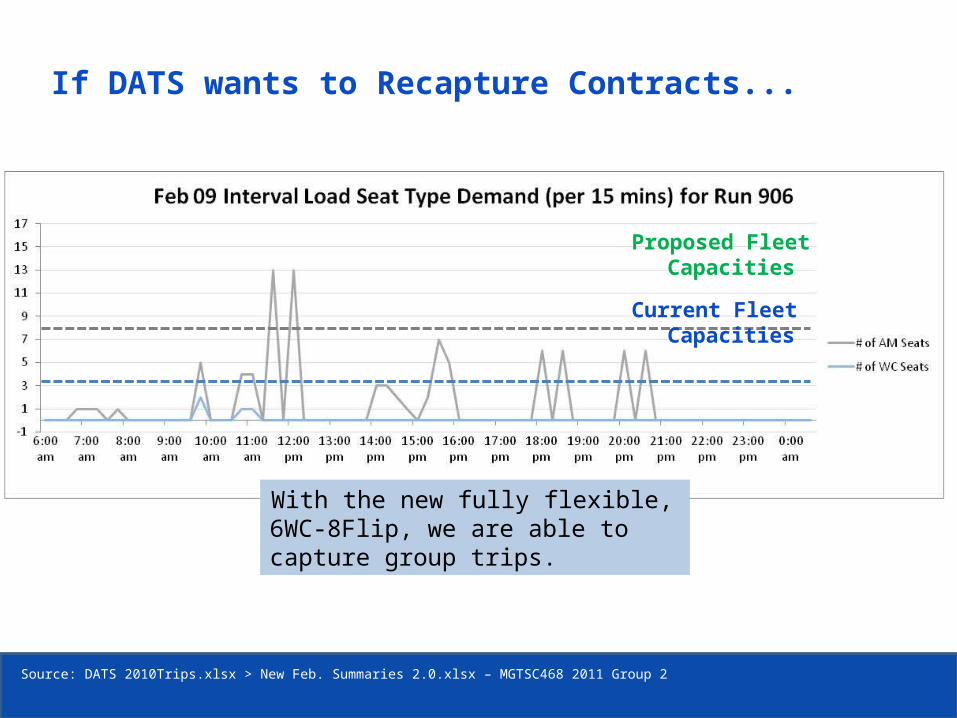
If DATS wants to Recapture Contracts...
With the new fully flexible, 6WC-8Flip, we are able to capture group trips.
Source: DATS 2010Trips.xlsx > New Feb. Summaries 2.0.xlsx – MGTSC468 2011 Group 2
Current Fleet Capacities
Proposed Fleet Capacities

Test Results
Source: 20110317130631173.pdf - March 17, 2011 Results
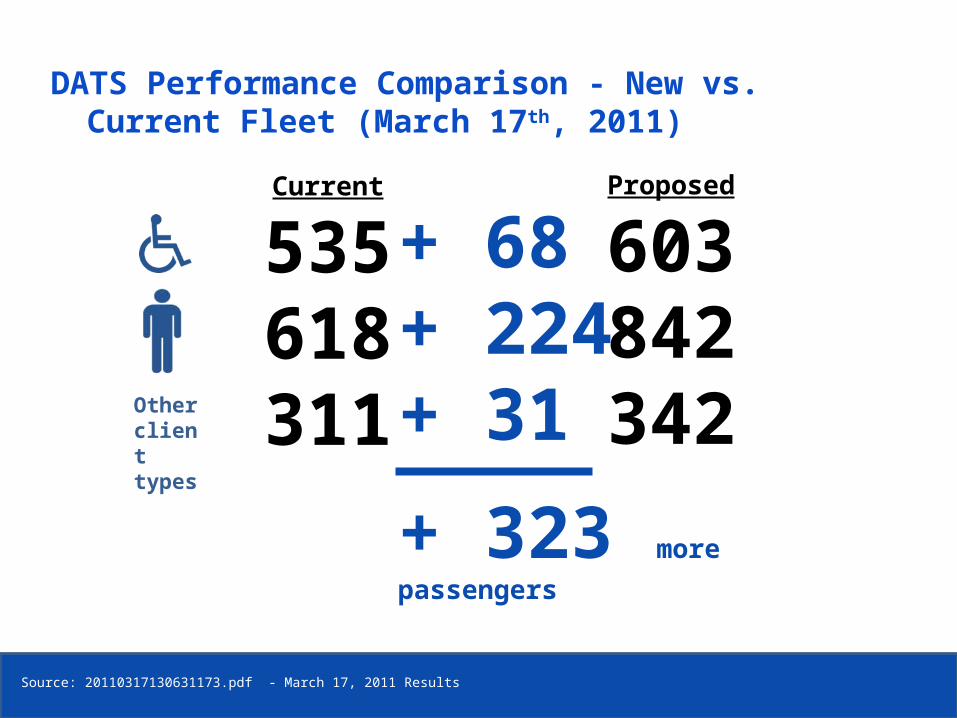
DATS Performance Comparison - New vs. Current Fleet (March 17th, 2011)
Current
535618311
Proposed
603842342Other
client types
+ 68+ 224+ 31
+ 323 more passengers
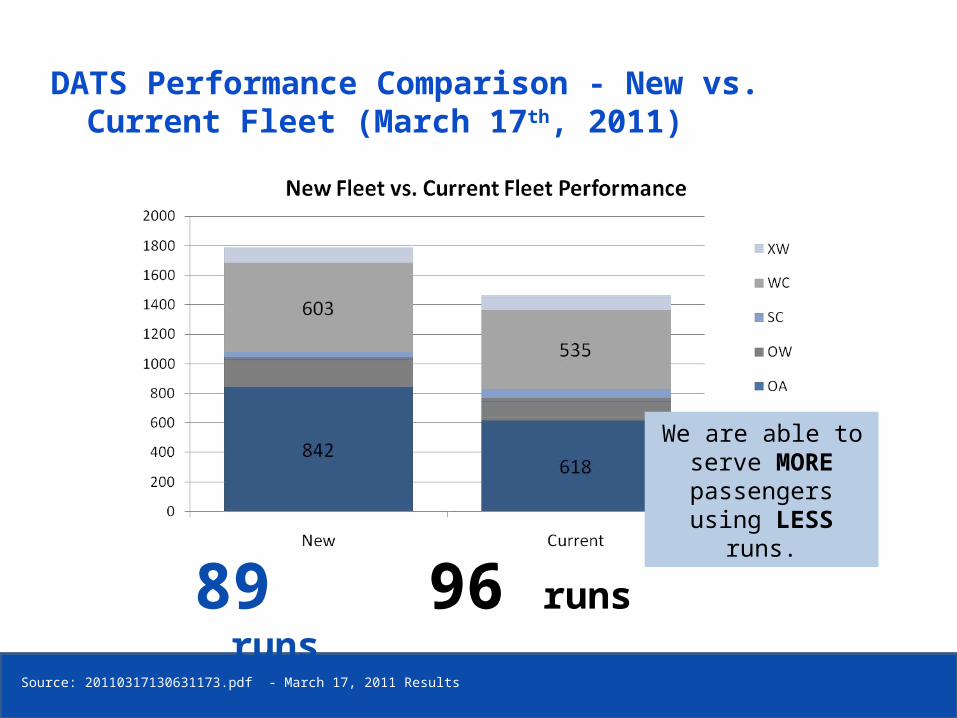
Source: 20110317130631173.pdf - March 17, 2011 Results
DATS Performance Comparison - New vs. Current Fleet (March 17th, 2011)
96 runs89 runs
We are able to serve MORE
passengers using LESS runs.

Final Recommendation
-+
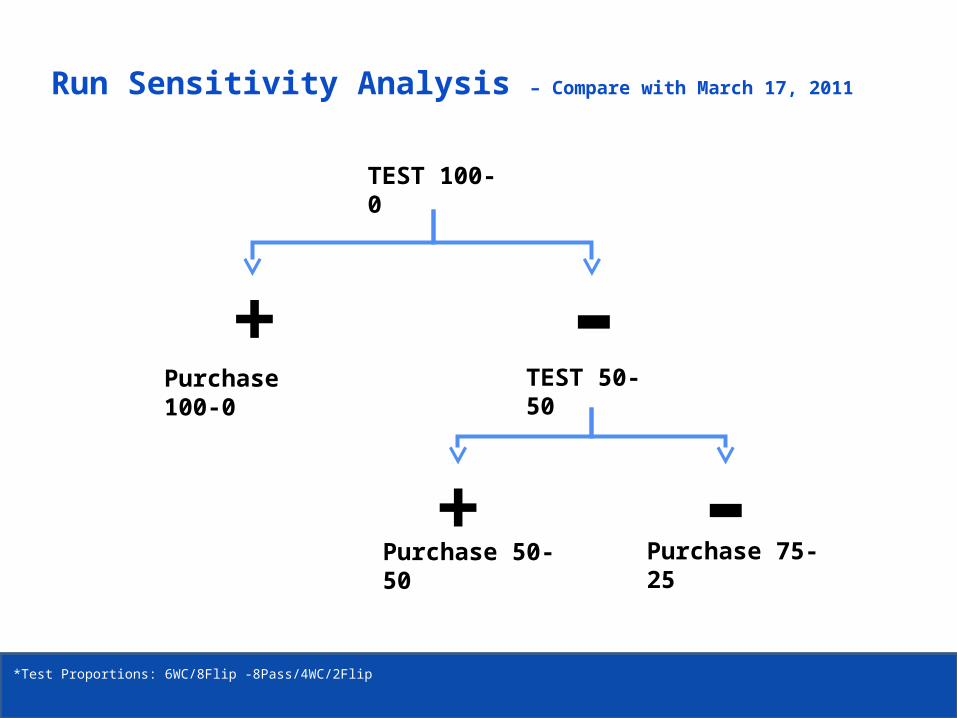
Run Sensitivity Analysis – Compare with March 17, 2011
TEST 100-0
*Test Proportions: 6WC/8Flip -8Pass/4WC/2Flip
TEST 50-50
-+Purchase 75-25Purchase 50-50
Purchase 100-0
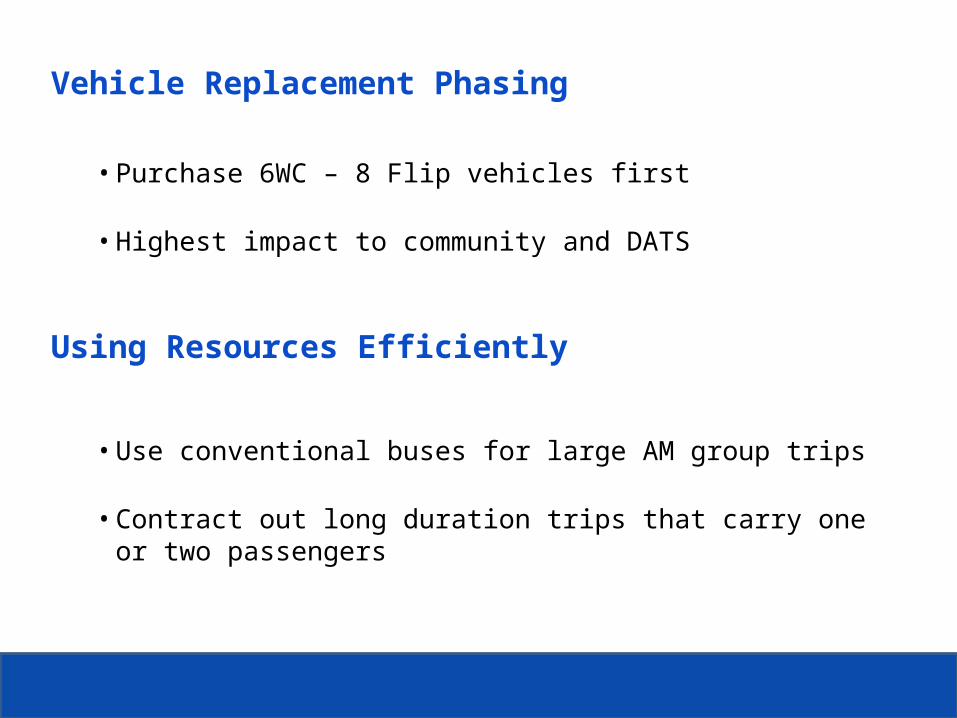
Vehicle Replacement Phasing
• Purchase 6WC – 8 Flip vehicles first
• Highest impact to community and DATS
• Use conventional buses for large AM group trips
• Contract out long duration trips that carry one or two passengers
Using Resources Efficiently
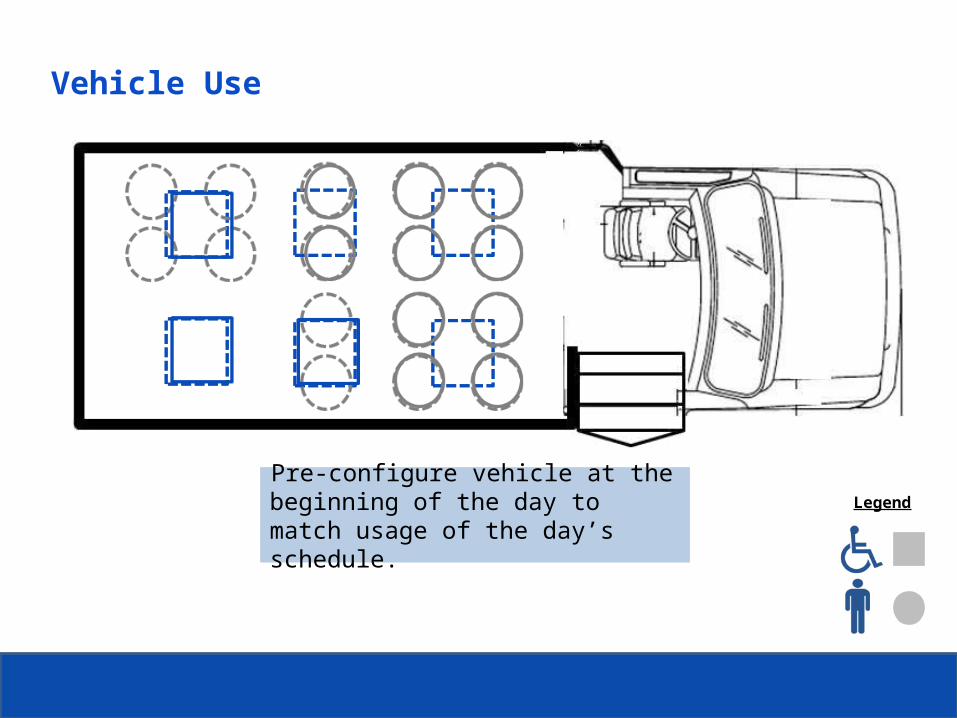
LegendPre-configure vehicle at the beginning of the day to match usage of the day’s schedule.
Vehicle Use
ETS Mission
Customer-focused, safe, reliable and affordable public transit services that link people and places

QUESTIONS?

THANK YOU!

APPENDIX
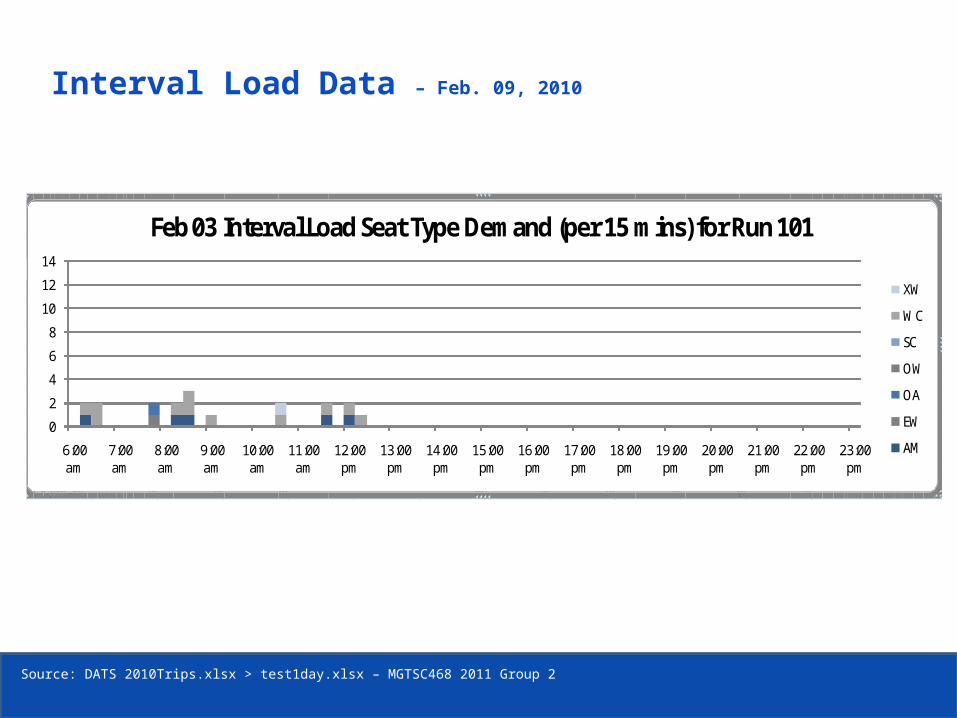
Interval Load Data – Feb. 09, 2010
Total # of clients on the vehicle at one time (including escorts)Row LabelsAM EW OA OW SC WC XW Grand Total101 # of AM Seats# of WC SeatsTotal # of AM Seats# of WC Seats
6:00 am 0 0 0 0 0 0 0 0 0 2 26:15 am 1 0 0 1 0 2 1 1 26:30 am 0 0 0 2 0 2 0 2 26:45 am 0 0 0 0 0 0 0 0 07:00 am 0 0 0 0 0 0 0 0 07:15 am 0 0 0 0 0 0 0 0 07:30 am 0 0 0 0 0 0 0 0 07:45 am 0 1 1 0 0 2 2 1 38:00 am 0 0 0 0 0 0 0 0 0
Max
0
2
4
6
8
10
12
14
6:00 am
7:00 am
8:00 am
9:00 am
10:00 am
11:00 am
12:00 pm
13:00 pm
14:00 pm
15:00 pm
16:00 pm
17:00 pm
18:00 pm
19:00 pm
20:00 pm
21:00 pm
22:00 pm
23:00 pm
Feb 03 Interval Load Seat Type Demand (per 15 mins) for Run 101
XW
WC
SC
OW
OA
EW
AM
Source: DATS 2010Trips.xlsx > test1day.xlsx – MGTSC468 2011 Group 2
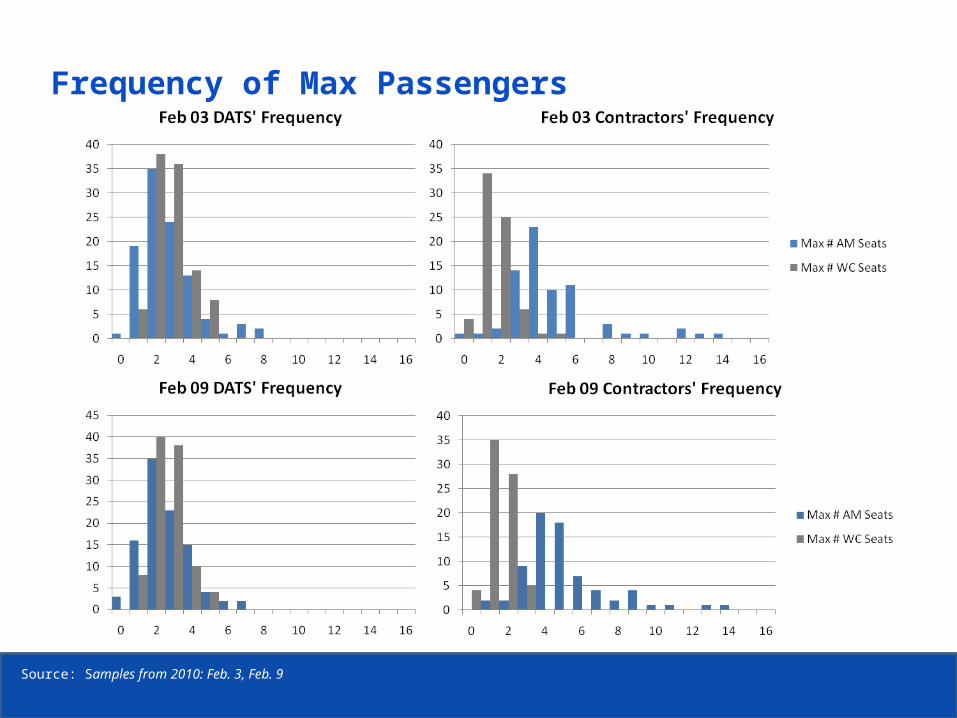
Source: Samples from 2010: Feb. 3, Feb. 9
Frequency of Max Passengers
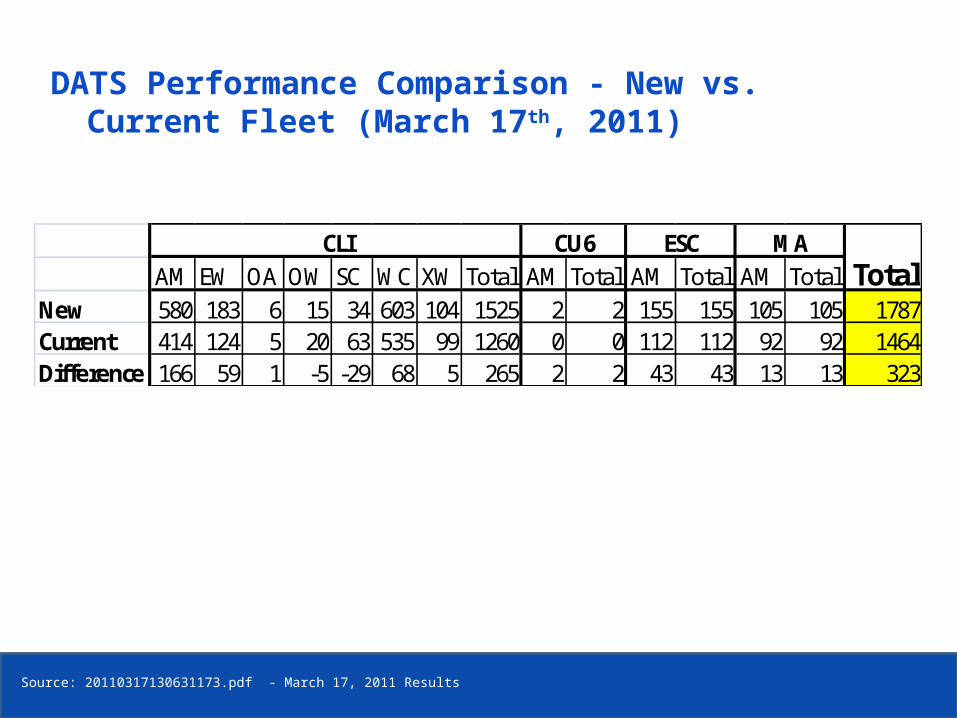
Source: 20110317130631173.pdf - March 17, 2011 Results
DATS Performance Comparison - New vs. Current Fleet (March 17th, 2011)
AM EW OA OW SC WC XW Total AM Total AM Total AM TotalNew 580 183 6 15 34 603 104 1525 2 2 155 155 105 105 1787Current 414 124 5 20 63 535 99 1260 0 0 112 112 92 92 1464Difference 166 59 1 -5 -29 68 5 265 2 2 43 43 13 13 323
CLI CU6 ESC MATotal