Fleet Mobityli Services Fleet Electrification Update ...
16
FMS Fleet Mobility Services Connected, Sustainable, Data-Driven Fleet Emerging Technologies Fleet Electrification Update Fleet Analytics Date: 6/13/2019
Transcript of Fleet Mobityli Services Fleet Electrification Update ...
FMS Fleet Mobility ServicesConnected, Sustainable, Data-Driven Fleet
Emerging Technologies
Fleet Electrification UpdateFleet Analytics
Date: 6/13/2019
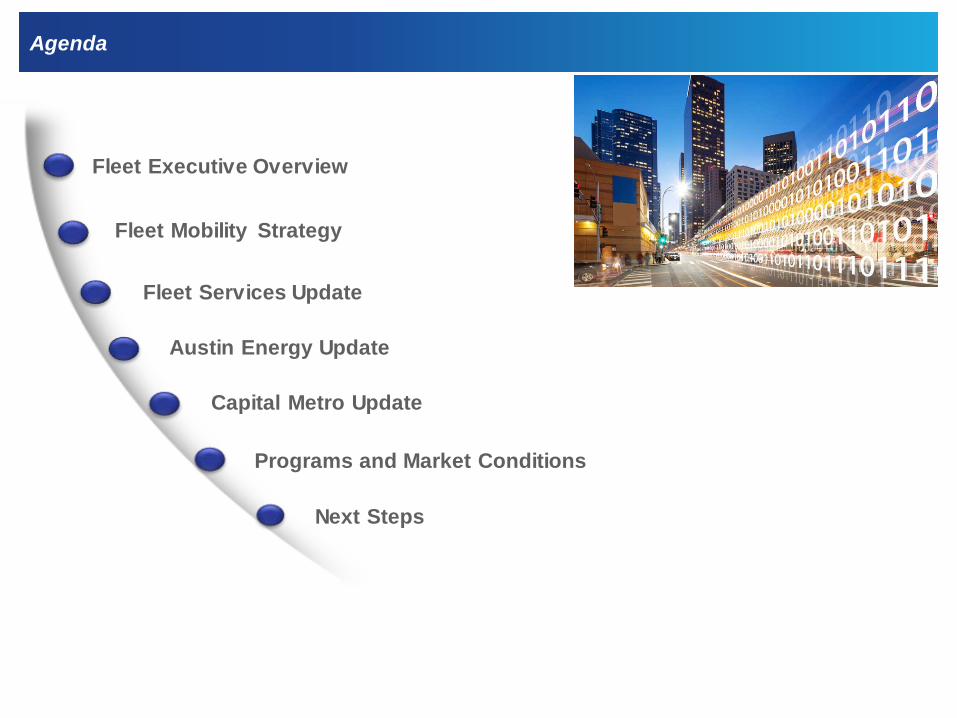
Agenda
Fleet Mobility Strategy
Fleet Executive Overview
Fleet Services Update
Austin Energy Update
Capital Metro Update
Programs and Market Conditions
Next Steps
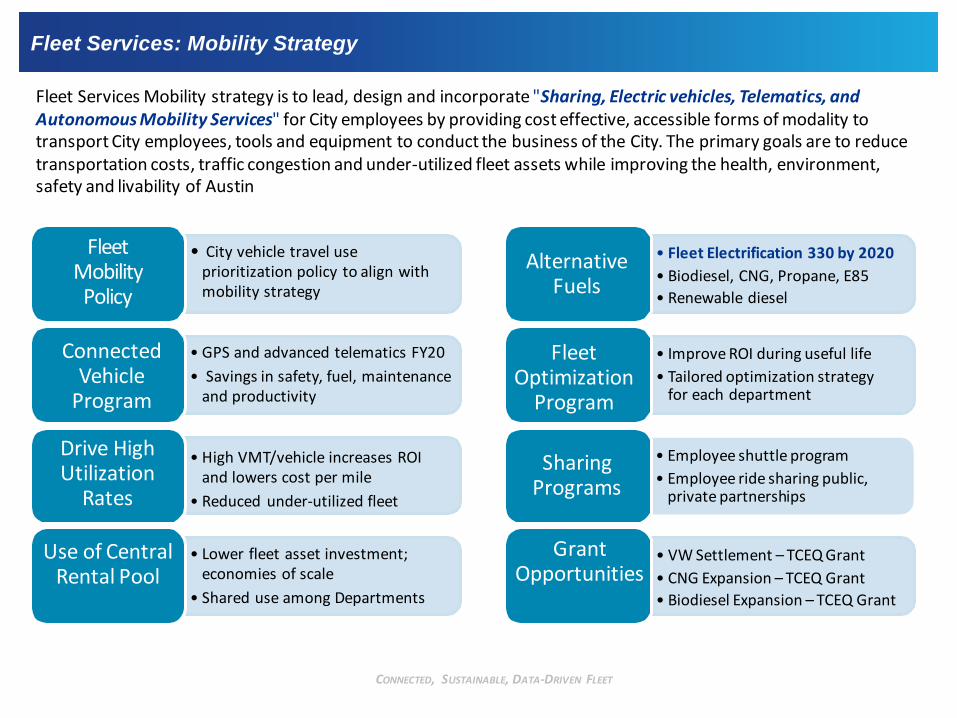
Fleet Services: Mobility Strategy
• City vehicle travel use prioritization policy to align with mobility strategy
Fleet Mobility Policy
• GPS and advanced telematics FY20• Savings in safety, fuel, maintenance
and productivity
• High VMT/vehicle increases ROI and lowers cost per mile
• Reduced under-utilized fleet
Drive High Utilization
Rates
• Lower fleet asset investment; economies of scale
• Shared use among Departments
Use of Central Rental Pool
• Fleet Electrification 330 by 2020• Biodiesel, CNG, Propane, E85• Renewable diesel
Alternative Fuels
Fleet Optimization
Program
• Improve ROI during useful life• Tailored optimization strategy
for each department
Sharing Programs
• VW Settlement – TCEQ Grant• CNG Expansion – TCEQ Grant• Biodiesel Expansion – TCEQ Grant
Grant Opportunities
Fleet Services Mobility strategy is to lead, design and incorporate "Sharing, Electric vehicles, Telematics, and Autonomous Mobility Services" for City employees by providing cost effective, accessible forms of modality to transport City employees, tools and equipment to conduct the business of the City. The primary goals are to reduce transportation costs, traffic congestion and under-utilized fleet assets while improving the health, environment, safety and livability of Austin
Connected Vehicle
Program
• Employee shuttle program• Employee ride sharing public,
private partnerships
CONNECTED, SUSTAINABLE, DATA-DRIVEN FLEET FLEET

FLEET ELECTRIFICATION
Fleet Services: Electrification Initial Plan
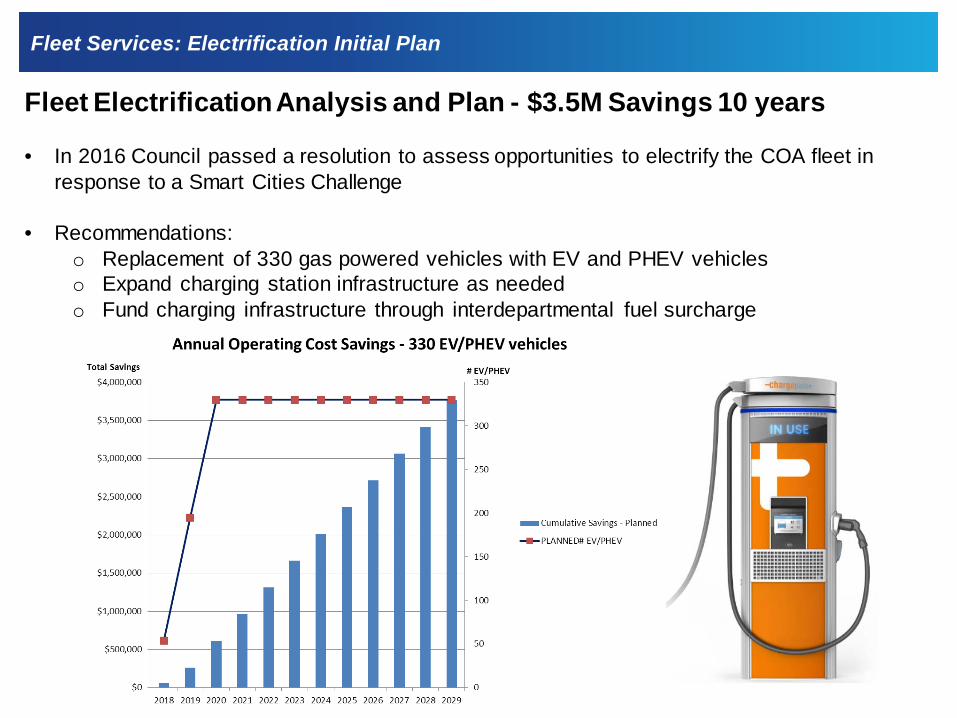
Fleet Electrification Analysis and Plan - $3.5M Savings 10 years
• In 2016 Council passed a resolution to assess opportunities to electrify the COA fleet in response to a Smart Cities Challenge
• Recommendations: o Replacement of 330 gas powered vehicles with EV and PHEV vehicleso Expand charging station infrastructure as neededo Fund charging infrastructure through interdepartmental fuel surcharge
Fleet Services: Electrification and Charging Infrastructure
STATUS / METRICS
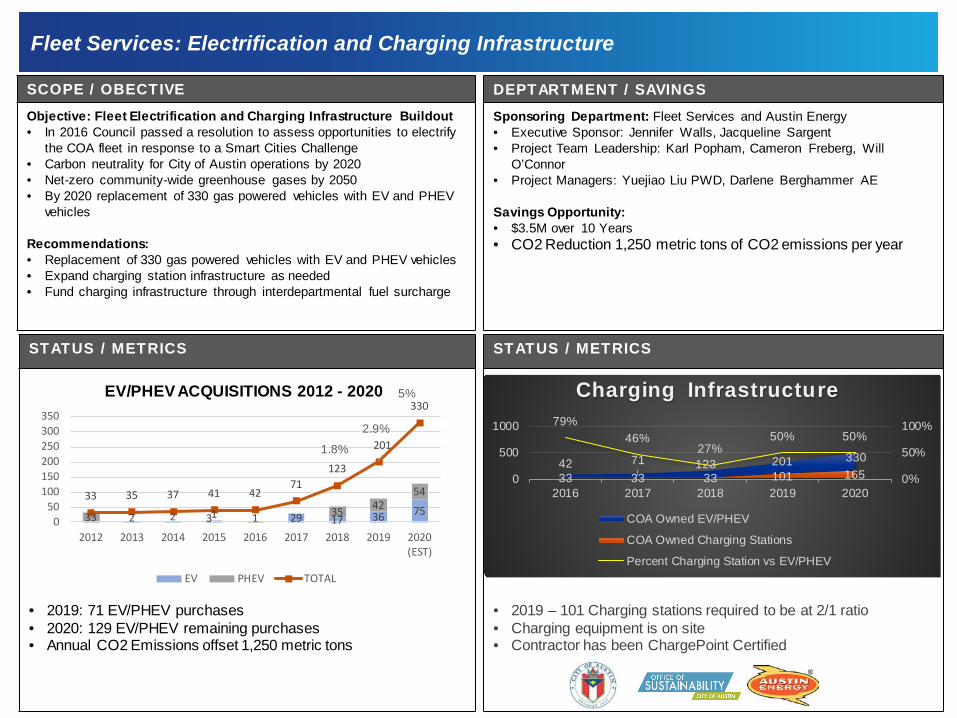
• 2019: 71 EV/PHEV purchases• 2020: 129 EV/PHEV remaining purchases• Annual CO2 Emissions offset 1,250 metric tons
SCOPE / OBECTIVEObjective: Fleet Electrification and Charging Infrastructure Buildout• In 2016 Council passed a resolution to assess opportunities to electrify
the COA fleet in response to a Smart Cities Challenge • Carbon neutrality for City of Austin operations by 2020• Net-zero community-wide greenhouse gases by 2050• By 2020 replacement of 330 gas powered vehicles with EV and PHEV
vehicles
Recommendations: • Replacement of 330 gas powered vehicles with EV and PHEV vehicles• Expand charging station infrastructure as needed• Fund charging infrastructure through interdepartmental fuel surcharge
2 2 3 29 17 36 7533 1 1 35 425433 35 37 41 42
71123
201
330
050
100150200250300350
2012 2013 2014 2015 2016 2017 2018 2019 2020(EST)
EV/PHEV ACQUISITIONS 2012 - 2020
EV PHEV TOTAL
5%
1.8%
2.9%
DEPTARTMENT / SAVINGSSponsoring Department: Fleet Services and Austin Energy• Executive Sponsor: Jennifer Walls, Jacqueline Sargent• Project Team Leadership: Karl Popham, Cameron Freberg, Will
O’Connor • Project Managers: Yuejiao Liu PWD, Darlene Berghammer AE
Savings Opportunity:• $3.5M over 10 Years• CO2 Reduction 1,250 metric tons of CO2 emissions per year
33 33 33 101 16542 71 123 201 330
79%46%
27%50% 50%
0%
50%
100%
0
500
1000
2016 2017 2018 2019 2020
Charging Infrastructure
COA Owned EV/PHEV
COA Owned Charging Stations
Percent Charging Station vs EV/PHEV
STATUS / METRICS
• 2019 – 101 Charging stations required to be at 2/1 ratio• Charging equipment is on site• Contractor has been ChargePoint Certified
Fleet Services: Electrification Next Steps
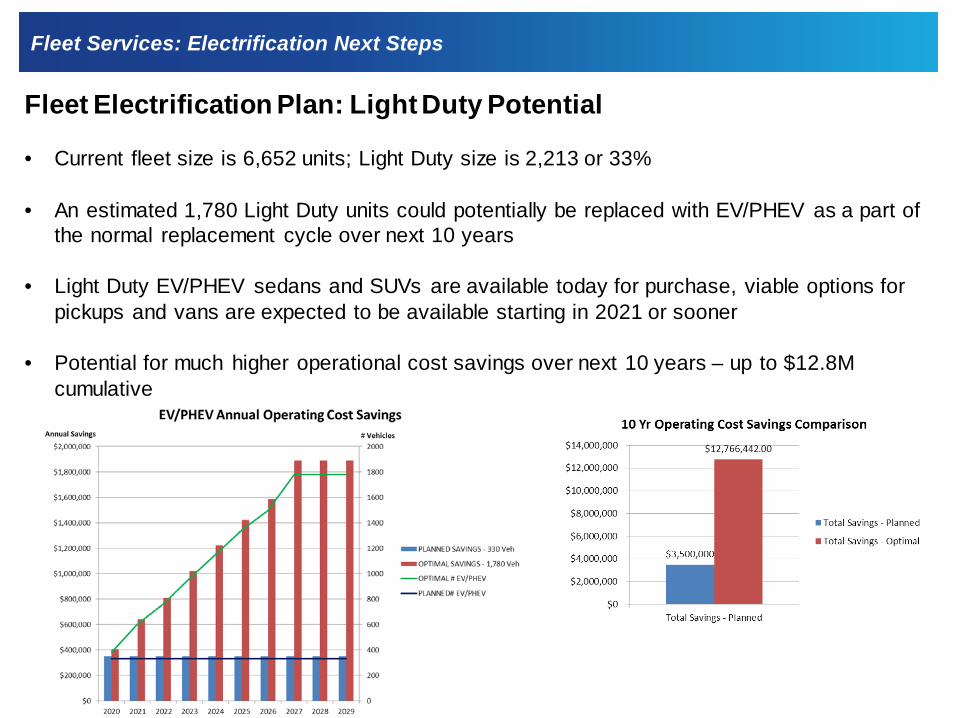
Fleet Electrification Plan: Light Duty Potential
• Current fleet size is 6,652 units; Light Duty size is 2,213 or 33%
• An estimated 1,780 Light Duty units could potentially be replaced with EV/PHEV as a part of the normal replacement cycle over next 10 years
• Light Duty EV/PHEV sedans and SUVs are available today for purchase, viable options for pickups and vans are expected to be available starting in 2021 or sooner
• Potential for much higher operational cost savings over next 10 years – up to $12.8M cumulative
Austin Energy: City Charging Infrastructure
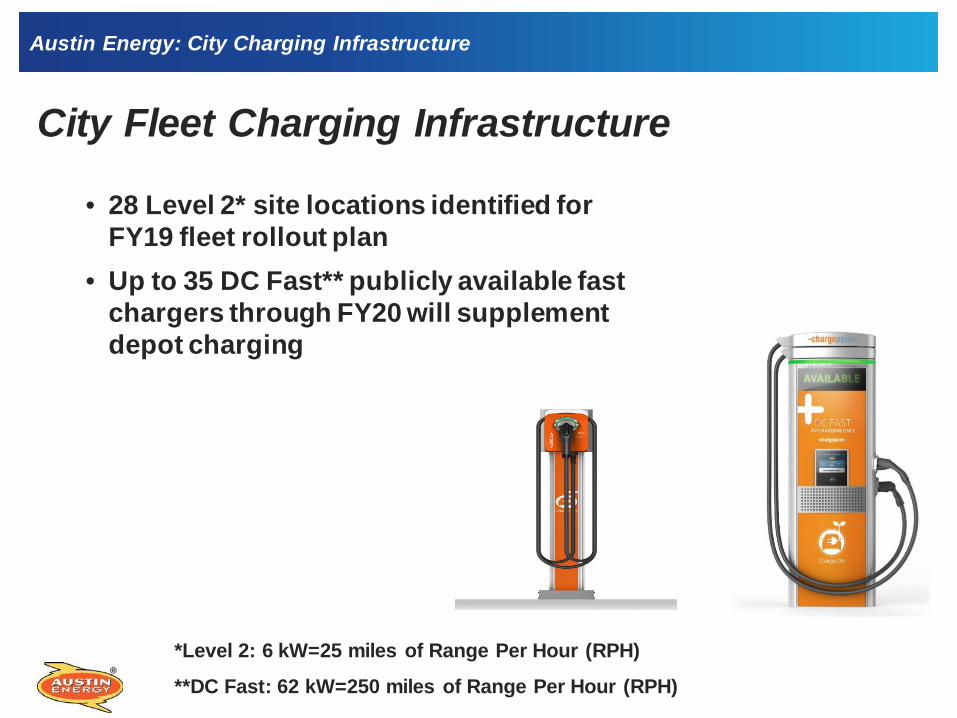
City Fleet Charging Infrastructure
• 28 Level 2* site locations identified for FY19 fleet rollout plan
• Up to 35 DC Fast** publicly available fast chargers through FY20 will supplement depot charging
*Level 2: 6 kW=25 miles of Range Per Hour (RPH)
**DC Fast: 62 kW=250 miles of Range Per Hour (RPH)
Capital Metro: Charging Infrastructure
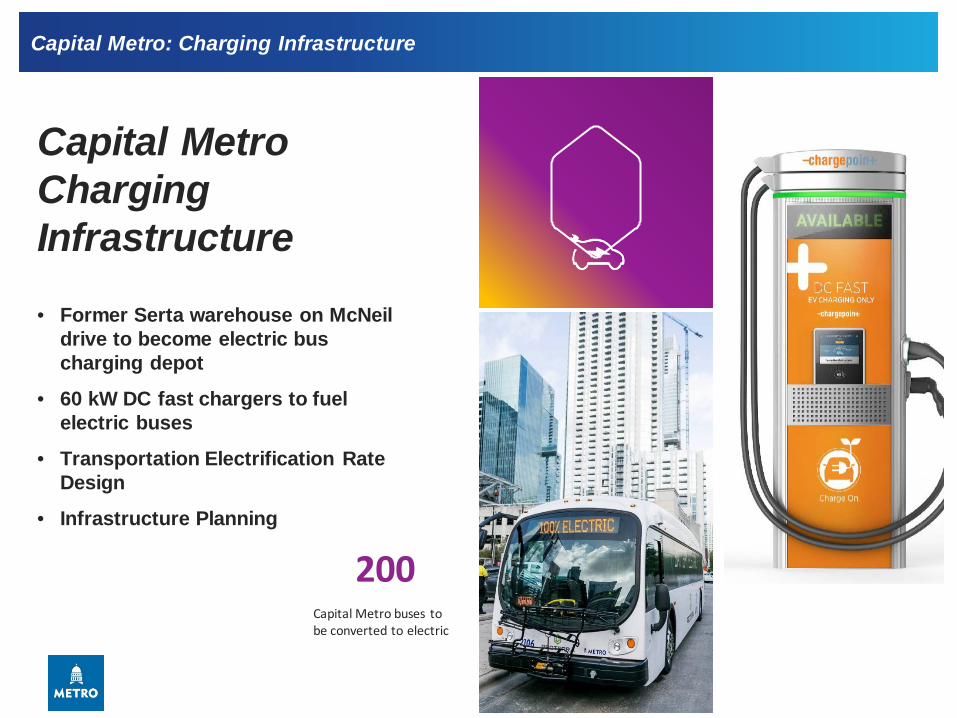
Capital MetroChargingInfrastructure
• Former Serta warehouse on McNeil drive to become electric bus charging depot
• 60 kW DC fast chargers to fuel electric buses
• Transportation Electrification Rate Design
• Infrastructure Planning
Capital Metro buses to be converted to electric
200
Fleet Services: National Procurement Collaboration
Climate Mayors Council• City of Austin is working with the Climate Mayors Council and the Electrification Coalition
which are a national organization of cities and private enterprise that are leading the EV transition to improve equitable access toEVs for allcities and influence vehicle market to meetcities' needs
Status:• The City of Austin led by Mayor Adler, Fleet Services and the Office of Sustainability
has joined 19 cities and 2 counties as a founding member of the Climate Mayors Electric Vehicle Purchasing Cooperative to reduce acquisition costs, lower green house gas emissions and promote the use of EV/PHEV vehicles
• The City of Austin has committed to purchasing 71 (18%) out of a total 376 EV/PHEV’s in FY19 and another 129 in FY20 for an average savings of over $1,300 per EV/PHEV
Building Strong Relationships:• OEMs• Charging station manufacturers/installers• Fleet service providers• Regional Councils of Government• City, State, Federal Government Fleet organizations
Fleet Services: Electric Vehicle Market Status
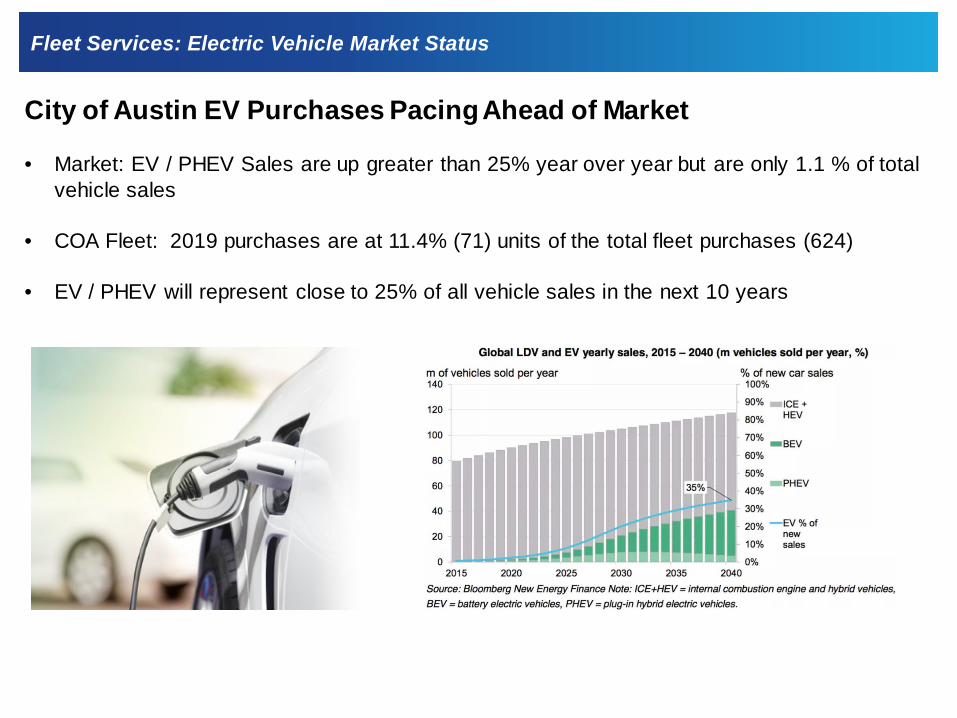
City of Austin EV Purchases Pacing Ahead of Market
• Market: EV / PHEV Sales are up greater than 25% year over year but are only 1.1 % of total vehicle sales
• COA Fleet: 2019 purchases are at 11.4% (71) units of the total fleet purchases (624)
• EV / PHEV will represent close to 25% of all vehicle sales in the next 10 years
Fleet Services: Electric Vehicle Test Drive
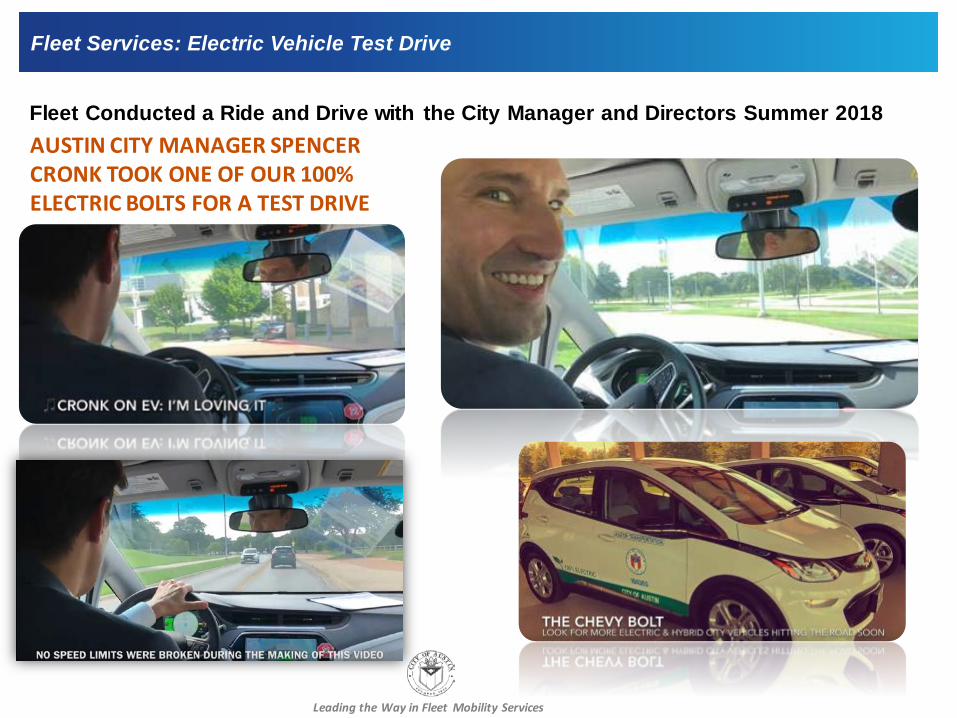
Fleet Conducted a Ride and Drive with the City Manager and Directors Summer 2018
Leading the Way in Fleet Mobility Services
AUSTIN CITY MANAGER SPENCER CRONK TOOK ONE OF OUR 100% ELECTRIC BOLTS FOR A TEST DRIVE
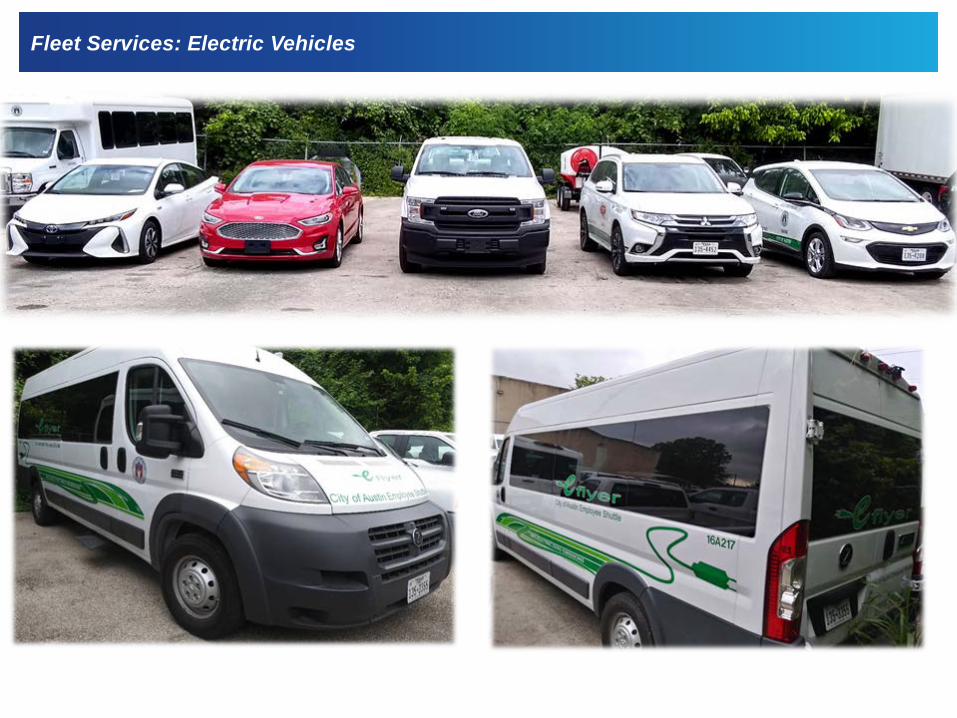
Fleet Services: Electric Vehicles
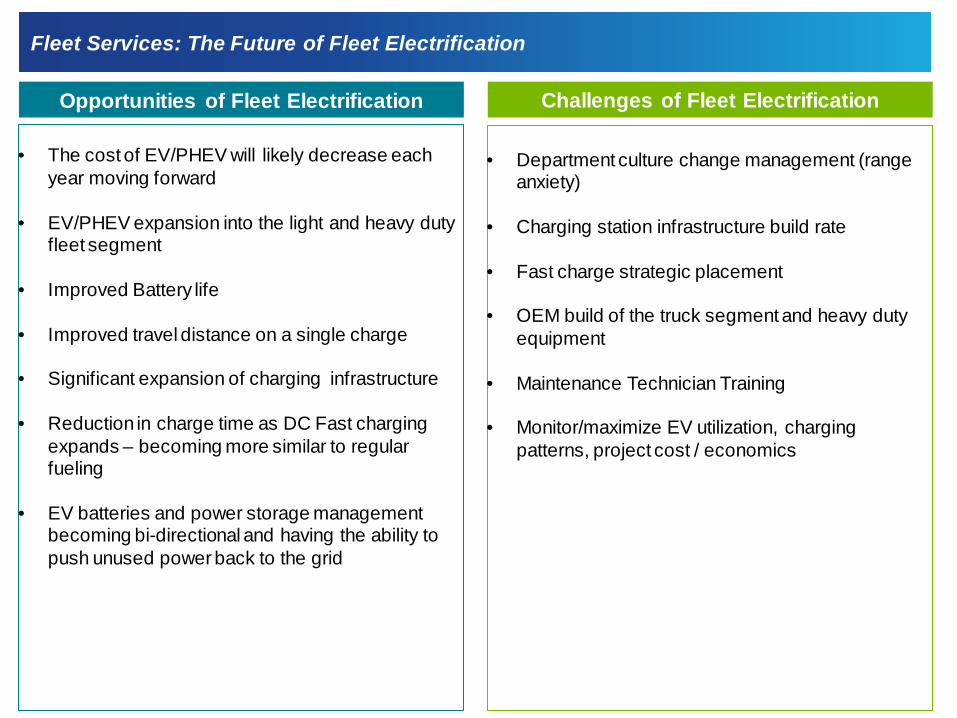
Fleet Services: The Future of Fleet Electrification
• The cost of EV/PHEV will likely decrease each year moving forward
• EV/PHEV expansion into the light and heavy duty fleet segment
• Improved Battery life
• Improved travel distance on a single charge
• Significant expansion of charging infrastructure
• Reduction in charge time as DC Fast charging expands – becoming more similar to regular fueling
• EV batteries and power storage management becoming bi-directional and having the ability to push unused power back to the grid
• Department culture change management (range anxiety)
• Charging station infrastructure build rate
• Fast charge strategic placement
• OEM build of the truck segment and heavy duty equipment
• Maintenance Technician Training
• Monitor/maximize EV utilization, charging patterns, project cost / economics
Opportunities of Fleet Electrification Challenges of Fleet Electrification

Questions?
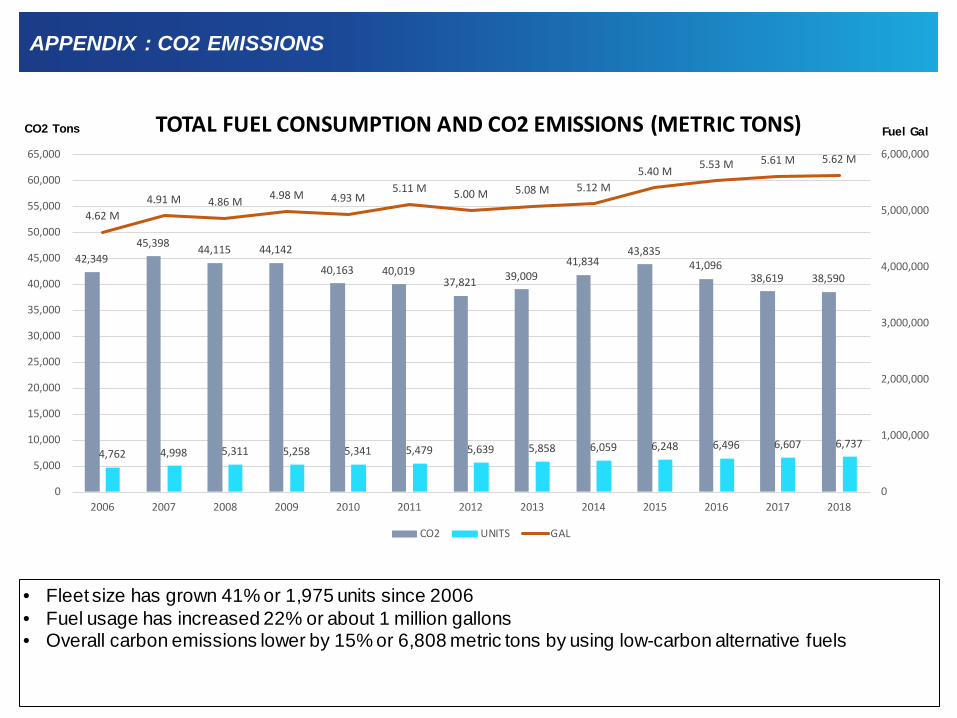
APPENDIX : CO2 EMISSIONS
• Fleet size has grown 41% or 1,975 units since 2006• Fuel usage has increased 22% or about 1 million gallons• Overall carbon emissions lower by 15% or 6,808 metric tons by using low-carbon alternative fuels
42,34945,398 44,115 44,142
40,163 40,01937,821 39,009
41,83443,835
41,09638,619 38,590
4,762 4,998 5,311 5,258 5,341 5,479 5,639 5,858 6,059 6,248 6,496 6,607 6,737
4.62 M4.91 M 4.86 M 4.98 M 4.93 M
5.11 M 5.00 M 5.08 M 5.12 M5.40 M 5.53 M 5.61 M 5.62 M
0
1,000,000
2,000,000
3,000,000
4,000,000
5,000,000
6,000,000
0
5,000
10,000
15,000
20,000
25,000
30,000
35,000
40,000
45,000
50,000
55,000
60,000
65,000
2006 2007 2008 2009 2010 2011 2012 2013 2014 2015 2016 2017 2018
TOTAL FUEL CONSUMPTION AND CO2 EMISSIONS (METRIC TONS)
CO2 UNITS GAL
CO2 Tons Fuel Gal