WORLD WAR 2 Evacuation. WHAT HAVE WE ALREADY LEARNT ABOUT EVACUATION ? Evacuation.
Fleeing the Storm(s): An Examination of Evacuation Behavior during Florida’s 2004 Hurricane Season*
Stanley K. Smith and Chris McCarty Bureau of Economic and Business Research
University of Florida
Corresponding author: Stanley K. Smith, Bureau of Economic and Business Research, 221 Matherly Hall, University of Florida, Gainesville, FL 32611-7145. Email: [email protected]. Telephone: 352-392-0171, Ext. 210. Fax: 352-392-4739.
*Forthcoming Demography, February 2009. A previous version of this paper was presented at the annual meeting of the Population Association of America, New York, March 29-31, 2007.
2
ABSTRACT
The 2004 hurricane season was the worst in Florida’s history, with four hurricanes causing at least 47 deaths and some $45 billion in damages. In order to collect information on the demographic impact of those hurricanes, we surveyed households throughout the state and in the local areas sustaining the greatest damage. We estimate that one-quarter of Florida’s population evacuated prior to at least one hurricane; in some areas, well over half the residents evacuated at least once and many evacuated several times. Most evacuees stayed with family or friends and were away from home for only a few days. Using logistic regression analysis, we found the strength of the hurricane and the vulnerability of the housing unit had the greatest impact on evacuation behavior; several demographic variables had significant effects on the probability of evacuating and the choice of evacuation lodging (family/friends, public shelters, or hotels/motels). With continued population growth in coastal areas and the apparent increase in hurricane activity caused by global warming, the threats posed by hurricanes are rising in the United States and throughout the world. We believe the present study will help government officials plan more effectively for future hurricanes evacuations.
3
INTRODUCTION
The years 2004 and 2005 produced two of the most destructive hurricane seasons
in the history of the United States. Six hurricanes made landfall each year, compared to
an average of 1.8 per year during the preceding century and a half (Blake, Jarrell, and
Rappaport 2006). More than half were category 3 or stronger, classifying them as major
hurricanes. Three of the 2004 hurricanes were among the ten costliest since 1900, in
terms of the real dollar value of damages (Ibid). Three of the 2005 hurricanes were
among the ten most intense ever recorded, based on central pressure (National Weather
Service 2006). Hurricane Katrina, which devastated Louisiana and Mississippi in 2005,
was by far the most costly hurricane in U.S. history and one of the five deadliest (Ibid).
The number and intensity of these hurricanes have elevated the importance of
dealing effectively with hurricane-related safety issues. One of the most critical issues is
the evacuation of residents from vulnerable areas prior to the arrival of a hurricane.
Graphic television images and gripping news stories in the aftermath of Hurricane
Katrina heightened public awareness of the deadly effects of failing to implement sound
evacuation procedures.
The development of such procedures requires a clear understanding of the likely
evacuation behavior of people living in hurricane-prone areas and how that behavior
varies according to their personal and household characteristics and their perceptions of
the hurricane threat. A substantial literature on this topic has emerged over the last
several decades (e.g., Baker 1979, 1991; Dash and Gladwin 2007; Drabek 1986; Zhang,
Prater, and Lindell 2004). In this study, we analyze evacuation behavior in Florida
during the 2004 hurricane season using survey data collected at the state and local levels.
4
We start by describing our data set and discussing the selection of survey areas,
the survey procedures followed, and the aggregation of local areas into five geographic
regions. For the state and each region, we develop estimates of the proportion
evacuating, the type of lodging used, and the length of time away from home. Using a
sample of those who did not evacuate, we investigate the reasons why. We review the
determinants of evacuation behavior, summarize the empirical evidence reported in
previous studies, and use logistic regression analysis to estimate the impact of several risk
factors and demographic variables on evacuation behavior. We close by drawing several
conclusions regarding the determinants of evacuation behavior.
We have four primary objectives. First is to document evacuation behavior in
Florida in 2004. Second is to examine the impact of several determinants of that
behavior. Third is to investigate factors affecting the choice of evacuation lodging
(family or friends, hotel or motel, public shelter). Fourth is to compare evacuation
characteristics across regions. We believe this study documents several important aspects
of evacuation behavior during one of the worst hurricane seasons in history and provides
information that will help federal, state, and local officials plan more effectively for
future hurricane evacuations.
DATA
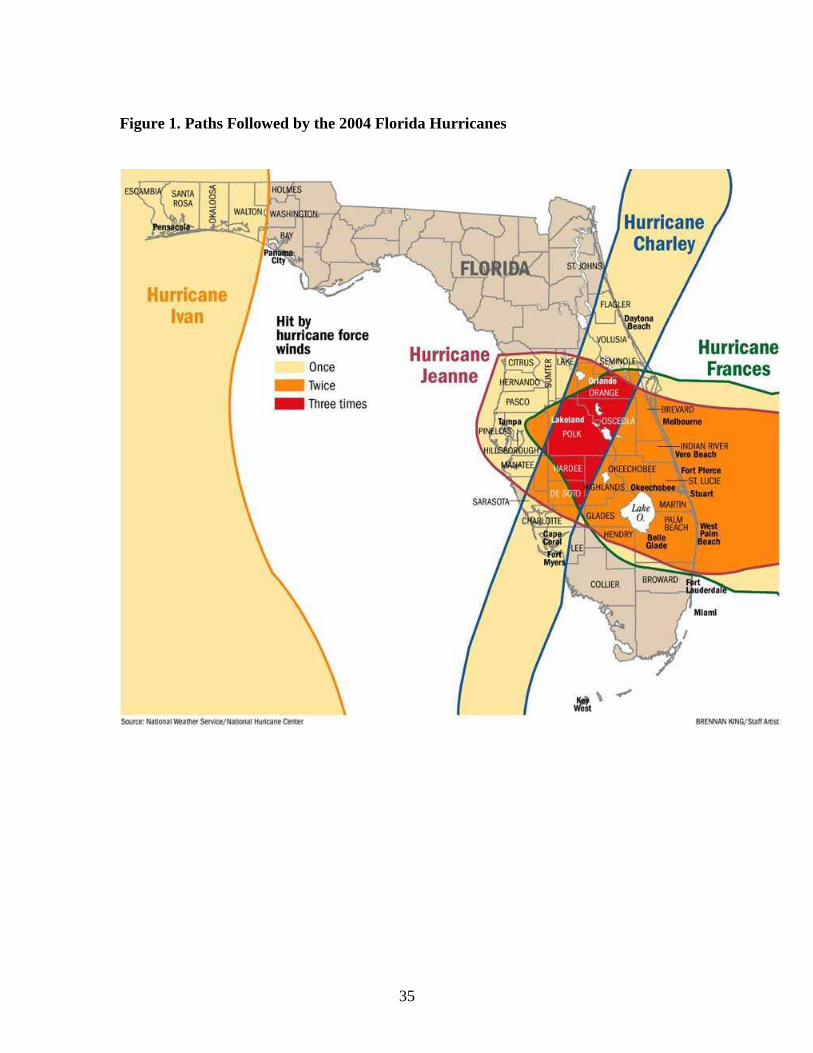
Four hurricanes blasted through Florida between August 13 and September 25,
2004, with Charley making landfall on the southwest coast, Frances on the southeast
coast, Ivan in the panhandle, and Jeanne nearly retracing the route followed by Frances
(see Figure 1). This was the first time in recorded history that four hurricanes had struck
Florida in a single year. Many counties were hit by at least one hurricane and some were

5
hit by two or even three. Overall, the storms were directly responsible for at least 47
deaths (National Hurricane Center 2005) and caused some $45 billion in damages (Blake
et al. 2006).
(Figure 1 about here)
Unfortunately, there are no data sources capable of providing comprehensive,
reliable information on the demographic and socioeconomic effects of hurricanes and
other natural disasters (e.g., Friesema et al. 1979; Rossi et al. 1981; Smith and McCarty
1996). To remedy this problem, we conducted a series of household surveys at the state
and local levels. These surveys were funded by the Florida Legislature and were
designed primarily to collect data related to changes in occupancy rates and average
household size in the cities and counties sustaining the greatest hurricane damage; these
data form a crucial part of the population estimation methods used in Florida. Although
they were not designed specifically for studying evacuation behavior—and have several
shortcomings in that regard—these surveys reached a large number of households and
collected a substantial amount of data on the impact of the hurricanes, making them very
useful for analytical purposes.
At the state level, we used list-assisted random-digit dialing to contact
approximately 500 households each month between February and May, 2005. These
surveys covered the entire state, including some areas with heavy hurricane damage and
others with little or no damage. Using a database maintained by the Marketing Systems
Group/GENESYS of Ft. Washington, Pennsylvania, we identified working telephone
banks with at least one residential number (a bank consists of the area code, prefix, and
first digit of the suffix). The database excluded banks that had not been assigned or that
6
had been assigned exclusively to commercial or government entities. It also excluded
banks associated with cell phone numbers because cell phones typically represent
individuals rather than households. We do not believe excluding cell phone numbers had
much impact on the representativeness of the sample because most households (including
those with cell phone users) have a landline phone. A recent survey found that
households with a cell phone but no landline phone accounted for less than 4% of all
households in the United States (Blumberg, Luke, and Cynamon 2005).
Random digits were added to the partial numbers in the banks and the resulting
numbers were called. The household member age 18 or older who most recently had a
birthday was selected as the survey respondent. Only those who reported that they were
permanent residents of Florida in August, 2004 were included in the sample. Each
number was called up to ten times before it was dropped from the sample. This process
led to 1,881 completed interviews. The response rate—calculated as the number of
completed interviews as a percentage of eligible numbers called—was 24.5%. This
calculation was based on the most conservative formula (RR1) sanctioned by the
American Association of Public Opinion Research. Response rates can be calculated in a
variety of ways, leading to widely varying estimates (e.g., Bourque, Shoaf, and Nguyen,
1997; Dow and Cutter 1998; Zhang et al. 2004).
We also conducted surveys in the local areas sustaining the greatest hurricane
damage. Using data from the Federal Emergency Management Agency (FEMA), we
identified the 13 counties with the highest proportion of housing units sustaining major
damage. In the ten counties with the greatest damage, samples were drawn for 16 cities
and the balance of each county. In the other three counties, samples were drawn for the
7
county as a whole. For the 16 cities, we used a combination of listed numbers and
random-digit dialing; for the three full counties and ten county balances, we relied solely
on random-digit dialing. These surveys were conducted between March and June, 2005
and produced 11,559 completed interviews. Again, each number was called up to ten
times before being dropped from the sample. The aggregate response rate for these
surveys was 33.3% using the RR1 formula.
Although data for each city and county were essential for the production of local
population estimates, our focus in this study is on larger geographic areas. We therefore
combined the 29 local areas into five regions based on their proximity to the paths
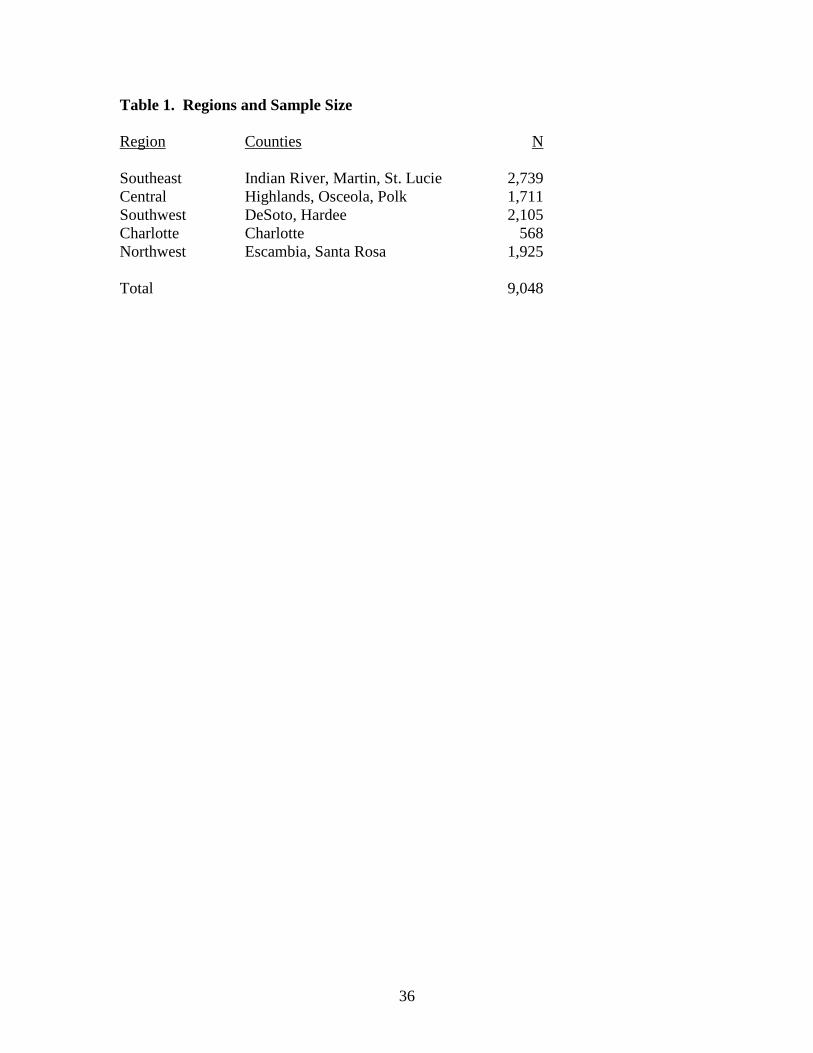
followed by the hurricanes (see Table 1). In order to make the sample representative of
each region’s population, data for each city, balance of county, and county were weighted
according to their share of the region’s households in 2004. We excluded respondents
who were not permanent residents in August, 2004 or who lived in two counties that did
not fit into any of the five regions; this reduced the sample to 9,048 completed
interviews. All the results reported in this study have a margin of error of less than 3% at
the state level and less than 5% at the regional level.
(Table 1 about here)
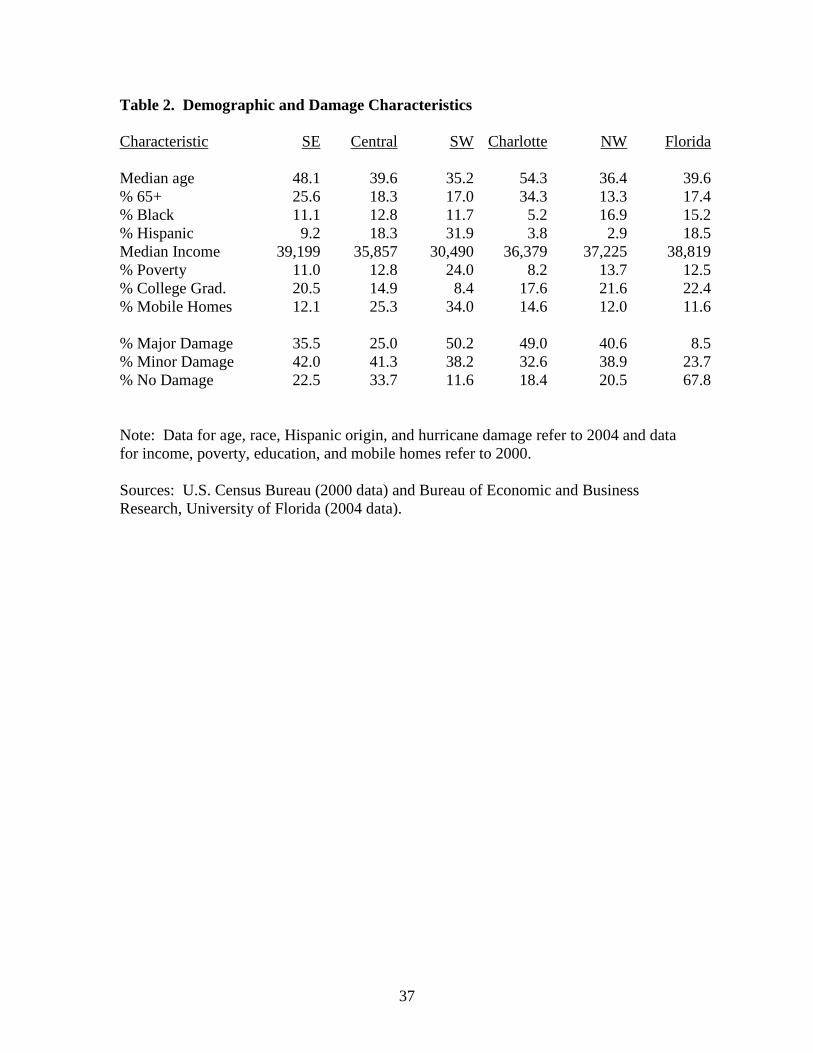
Table 2 summarizes the demographic and damage characteristics for each region.
The Southeast (SE) region has an older population than the state as a whole and has lower
proportions black and Hispanic. Its median income is slightly above the state average but
its educational level is slightly lower. The Central region is similar to the state in terms
of age, race, and ethnicity, but has lower income and educational levels. The Southwest
(SW) region is slightly younger than the state as a whole and has a relatively small
8
proportion black, but has a high proportion Hispanic and very low income and
educational levels. Charlotte County has a large elderly population and low proportions
black and Hispanic. Its income and educational levels are a bit below the state average
but its poverty rate is substantially lower. The Northwest (NW) region is slightly
younger and has a lower proportion Hispanic than the state as a whole, but is similar to
the state on other characteristics. Mobile homes account for a very large proportion of
the housing stock in the Central and SW regions.
(Table 2 about here)
The SE region was affected primarily by Hurricanes Frances and Jeanne. The
Central region was affected by Charley, Frances, and Jeanne, but was somewhat
protected by its inland location. Charlotte County and the SW region were affected
primarily by Charley, but Frances and Jeanne had an impact as well. The NW region was
affected only by Ivan. Charley was a category 4 hurricane when it made landfall, Ivan
and Jeanne were category 3, and Frances was category 2 (Blake, et al. 2006). Of the five
regions surveyed, Charlotte County and the SW region sustained the heaviest damages,
with about half the housing units suffering major damage and only 12-18% avoiding
damage completely. The Central region had the lightest damages, with 25% of the units
suffering major damage and 34% sustaining no damage at all.
EVACUATION CHARACTERISTICS IN FLORIDA
With the advent of the Internet, talk radio, and 24/7 television news channels,
hurricanes can no longer sneak up on an unwary public. Although the future path of a
hurricane cannot be perfectly predicted, people generally receive several days advance
warning when a hurricane threatens their area, giving them ample opportunity to leave
9
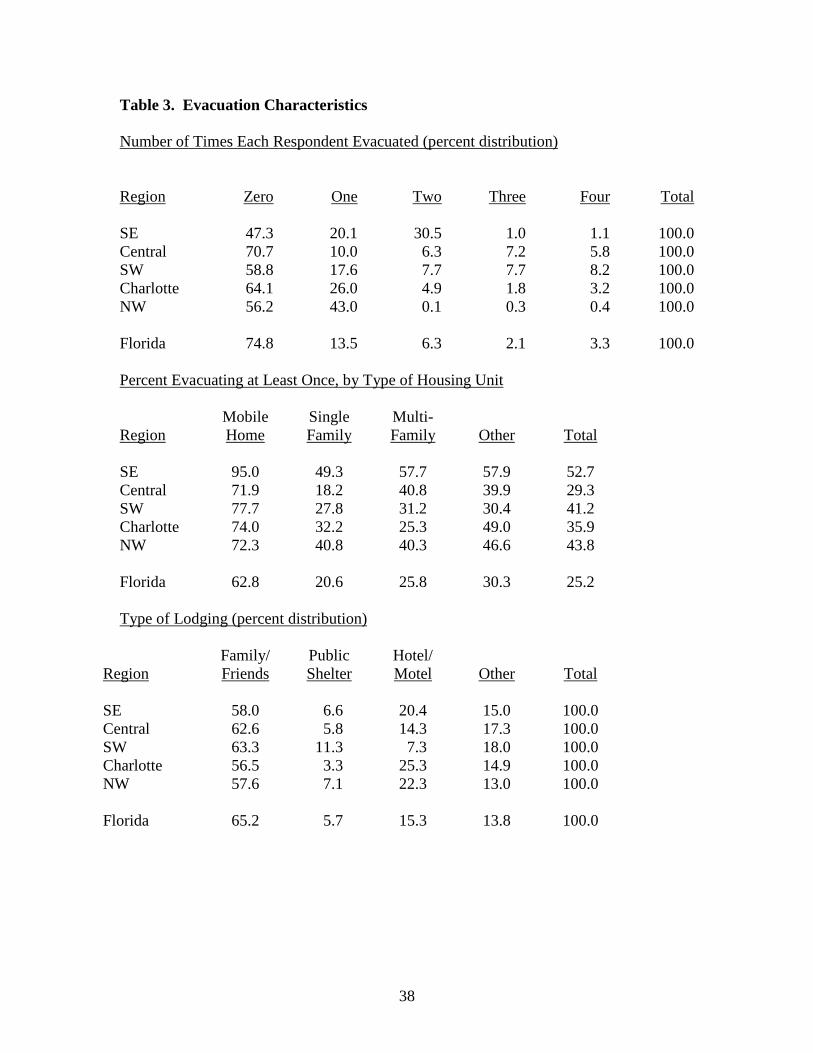
potentially unsafe locations. Not all do so, of course. Just over one in four survey
respondents in Florida evacuated prior to at least one hurricane in 2004 (Table 3).
Almost 14% evacuated once; 6%, twice; 2%, three times; and 3% reported that they
evacuated for all four hurricanes. Given Florida’s estimated population of 17.6 million in
August, 2004, this implies that almost 4.5 million Floridians evacuated at least once.
(Table 3 about here)
There were substantial differences among the five regions. The SE region had the
highest proportion evacuating at least once (53%) and by far the highest proportion
evacuating twice (31%). This most likely occurred because the SE region lay directly in
the paths of two hurricanes. Although it was struck by three hurricanes, the Central
region had the lowest proportion evacuating at least once (29%). This most likely
occurred because this region is comprised of inland counties that are less vulnerable to
hurricane damage than coastal counties. The NW region had 44% evacuating at least
once, with very few evacuating more than once. This occurred because only one
hurricane directly threatened the region.
The SW region had the highest proportion evacuating three or four times. This
region was hit by three hurricanes and sustained especially heavy damages from Charley,
the first hurricane striking the state. These heavy damages—combined with the large
number of hurricanes passing through the region—may have caused residents to be
particularly sensitive to hurricane threats. The results for Charlotte are noteworthy
because this region had a relatively low proportion evacuating at least once (36%) even
though it is a coastal county that lay directly in the path of Charley, the strongest of the
four hurricanes. We offer an explanation for this finding later in the article.
10
The second panel of Table 3 shows the proportions evacuating at least once by
type of housing unit. In every region, proportions were substantially higher for residents
of mobile homes than for residents of other types of housing. This is consistent with the
results of many previous studies (e.g., Baker 1979, 1991; Bateman and Edwards 2002;
Drabek 1986; Wilmot and Mei 2004). Single family units generally had lower
proportions evacuating than multi-family units, but the differences were relatively small.
The third panel of Table 3 shows the type of lodging used by evacuees (for
respondents who evacuated more than once, we treated each evacuation as an
independent event). The majority stayed with family or friends, with regional
proportions ranging from 57% to 63%. A high proportion staying with family or friends
is a common finding in the literature (e.g., Blendon et al. 2006; Drabek 1986; Whitehead
et al. 2000).
At the state level, the proportions staying in hotels/motels and public shelters
were similar to those reported elsewhere (Blendon et al., 2006; Whitehead et al., 2000).
For regions, however, these proportions varied substantially. The SW region had the
highest proportion staying in public shelters (11%) and the lowest proportion staying in
hotels or motels (7%). This may have been caused by the lack of hotel and motel rooms
in this sparsely populated rural area, but a more likely explanation is the low incomes of
many residents; per capita incomes in this region are among the lowest in the state and
poverty rates are among the highest. Conversely, Charlotte had the lowest proportion
staying in public shelters (3%) and the highest proportion staying in hotels or motels
(25%). Although Charlotte’s median income is below the state average, its poverty rate
is very low. We analyze evacuation lodging at the household level later in the article.
11
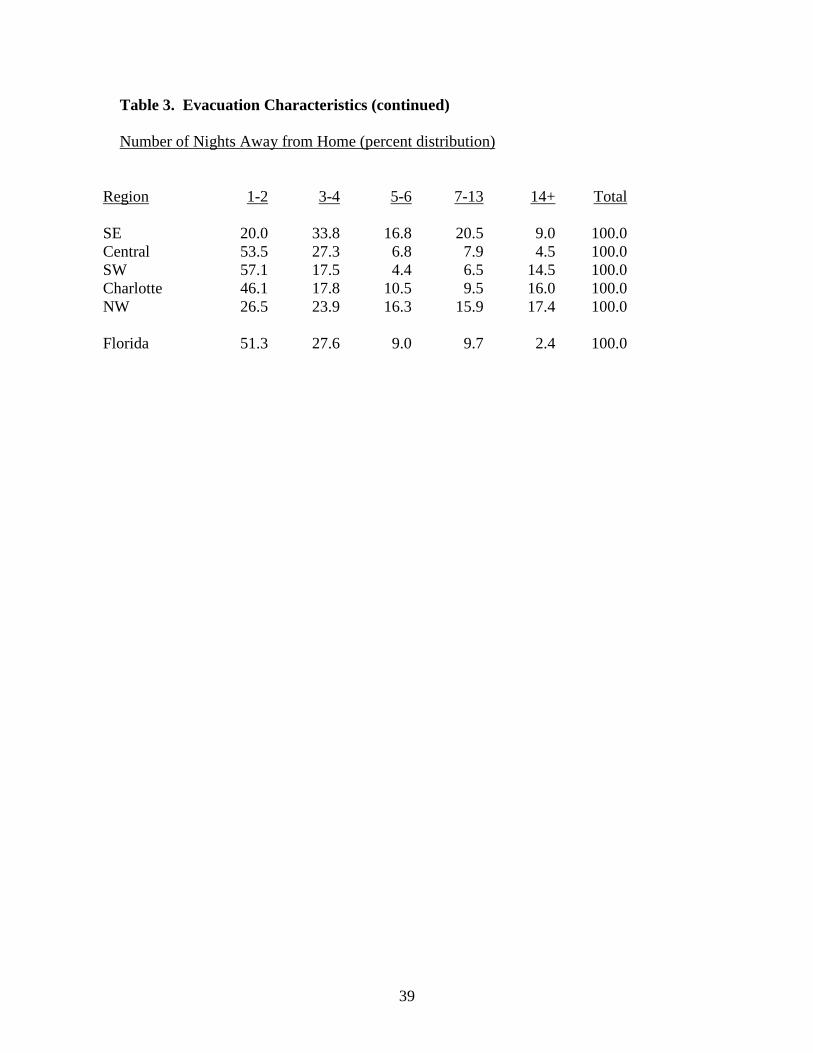
More than half the evacuations at the state level lasted only one or two nights,
88% lasted less than a week, 10% lasted for one to two weeks, and 2% lasted for two
weeks or more (bottom panel of Table 3). The long stays for some evacuees were due to
storm damages that made it impossible to return home immediately. When respondents
reporting housing damage were omitted from the sample, 92% of evacuees were away for
less than a week and less than 1% were away for two weeks or more (not shown here).
Length of evacuation varied considerably among the regions. The SE region had
the highest proportion away for three or more nights, probably because so many
respondents evacuated at least twice. Due its relatively low damage levels, it also had a
relatively low proportion away for two weeks or more. The Central region had the
highest proportion with stays of four nights or less and the lowest proportion with stays
of two weeks or more. This region had the lowest level of hurricane damage. The SW,
Charlotte, and NW regions had the highest proportions away for two weeks or more,
most likely because high levels of hurricane damage prevented many residents from
returning home until repairs could be completed.
To deepen our understanding of why some people chose not to evacuate, we
conducted follow-up surveys in Charlotte and Escambia, two counties with heavy
damages that were affected primarily (or solely) by a single hurricane. We called all
respondents who reported in the original survey that they did not evacuate before any of
the hurricanes. In the follow-up survey, we asked respondents the main reason they did
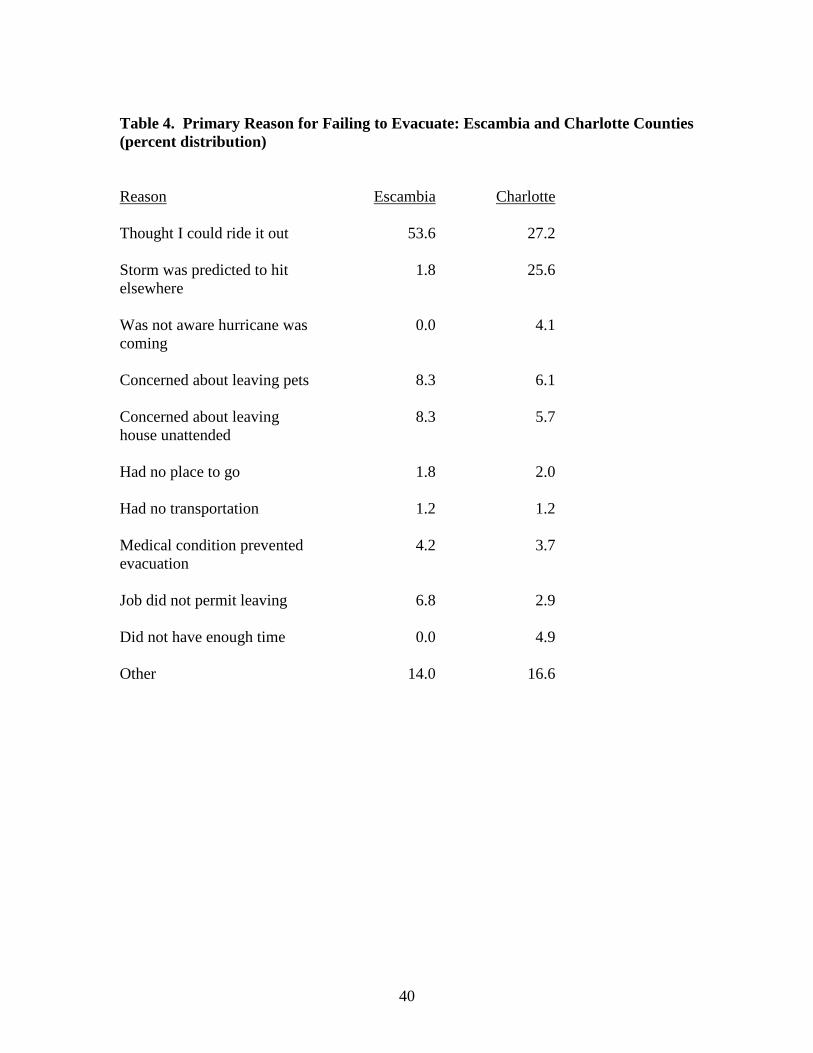
not evacuate. The results are shown in Table 4.
(Table 4 about here)
12
Over half the non-evacuees in Escambia reported they thought they could ride out
the hurricane without compromising their safety. This is consistent with the results of
numerous studies finding the main reason for not evacuating is the belief that a hurricane
is not a serious threat or the current location is safe (e.g., Perry and Lindell 1991; Riad et
al. 1999; Whitehead, et al. 2000). Others did not evacuate because they were concerned
about leaving pets behind (8%) and houses unattended (8%). Almost 7% cited job
responsibilities and 4% cited medical conditions. The relatively low proportions citing
the last four reasons is consistent with previous studies (e.g., Riad, et al. 1999). Only 3%
cited lack of transportation or a place to go; this too is consistent with previous research
(e.g., Baker 1991)
In Charlotte, 27% of the respondents did not evacuate because they thought they
could ride out the hurricane. Almost as many (26%) believed the storm would hit
elsewhere. The high proportion believing the storm would hit elsewhere is unusual and
was most likely due to the fact that the storm had initially been predicted to make landfall
near Tampa, well to the north of Charlotte County. A sudden shift in the path of the
storm apparently caught many residents by surprise, as 4% of the respondents reported
they did not know the hurricane was coming and 5% reported they did not have enough
time to evacuate. These results explain the relatively low evacuation rates for Charlotte
shown in Table 3.
About 6% of the respondents in Charlotte cited concerns about leaving pets and
houses unattended, 4% cited medical conditions, 3% cited lack of transportation or a
place to go, and 3% cited job responsibilities. These results are similar to those reported
13
in Escambia, but the proportion citing job responsibilities was a bit lower in Charlotte
because of its high proportion of retirees.
FACTORS AFFECTING EVACUATION BEHAVIOR
Evacuation behavior in the face of natural and man-made disasters is determined
by the physical risks posed by disasters and by how people perceive and respond to those
risks. Based on our review of the literature, we have identified a number of factors we
believe help explain evacuation behavior in Florida in 2004. Given the limitations of our
data set, we do not consider potentially important factors such as transportation issues
(e.g., Dow and Cutter 2002), communication of relevant information (e.g., Lindell,
Prater, and Peacock 2007), how evacuation decisions are made (e.g., Gladwin, Gladwin,
and Peacock 2001), and whether or not official evacuation orders were given (e.g.,
Wilmot and Mei 2004). Rather, we focus on factors reflecting physical risks and
demographic characteristics.
Physical Risks
The severity of the storm and its location relative to one’s place of residence are
two of the most important physical risks posed by hurricanes. Not surprisingly, a number
of studies have found these factors to be among the most important determinants of
evacuation behavior: the stronger the storm and the closer its proximity, the greater the
probability of evacuating (e.g., Baker 1991; Bateman and Edwards 2002; Dow and Cutter
2002; Lindell, Lu, and Prater 2005).
The degree of protection provided by a housing unit is also important. Due to the
nature of their construction, mobile homes are more likely to suffer storm damage than
other types of housing units (e.g., Gillespie 1991; Smith and McCarty 2006). It is not
14
surprising that many studies have found residents of mobile homes to be more likely to
evacuate than residents of other types of housing (e.g., Baker 1979, 1991; Bateman and
Edwards 2002; Drabek 1986; Wilmot and Mei 2004).
Demographic Characteristics
Families tend to evacuate as a unit; typically, all members evacuate or none do
(e.g., Drabek 1986; Perry 1979; Perry and Lindell 1991). Since they face fewer logistical
constraints, it might be expected that small households would be more likely to evacuate
than large households. Several empirical studies have found evacuation rates to decline
as household size increases (e.g., Gladwin and Peacock 1997) or as the number of adults
in the household increases (e.g., Bateman and Edwards 2002).
Households with children may be more likely to evacuate than other households
due to concerns about child safety and perhaps because women—who are often found to
have higher evacuation rates than men—generally play the predominant role in making
decisions affecting children. Several studies have found the presence of children to raise
evacuation rates (e.g., Gladwin and Peacock 1997; Lindell et al. 2005) but others have
not (e.g., Bateman and Edwards 2002).
A number of studies have found older adults to have lower evacuation rates than
younger adults (e.g., Drabek 1986; Gladwin and Peacock 1997; Wilmot and Mei 2004).
The most common explanation for this finding is that physical impairments and medical
conditions limit the mobility of older persons and social isolation makes them less
knowledgeable about storm threats. Some studies, however, have found no significant
differences in evacuation rates by age (e.g., Zhang et al. 2004).
15
Homeowners may be less likely to evacuate than renters because homeownership
makes them more concerned about protecting their property against storm damage and
looters. Some studies have found empirical evidence supporting this hypothesis (e.g.,
Riad, Norris, and Ruback 1999) but others have not (e.g., Zhang et al. 2004).
A number of studies have found evacuation rates to be higher for women than for
men (e.g., Bateman and Edwards 2002; Drabek 1986; Riad et al. 1999; Whitehead et al.
2000). Possible explanations include the greater vulnerability of women due to social
inequality and lack of mobility, a greater awareness of warnings because of wider social
networks, and a greater tendency to perceive disaster events as serious and risky
(Fothergill 1996). Again, not all studies have found significant differences between men
and women (e.g., Zhang et al. 2004).
It has been hypothesized that evacuation rates for racial and ethnic minorities will
be lower than for other groups because of differences in feelings of fatalism and risk
perception, preparedness behavior, language difficulties, social and family networks, the
confidence placed in various sources of information, and the economic resources needed
to evacuate (Fothergill, Maestas, and Darlington 1999). The empirical evidence,
however, is mixed. Some studies have found lower evacuation rates for racial and ethnic
minorities (e.g., Gladwin and Peacock 1997), some have found lower rates for some
minorities but not for others (e.g., Riad et al. 1999), and some have found no significant
differences (e.g., Bateman and Edwards 2004).
Higher income and educational levels might be expected to raise evacuation rates
by providing the resources needed to evacuate and by improving the ability to gather
relevant information and formulate effective evacuation plans. The empirical evidence,
16
however, is weak. Most studies have found income and education to have small and/or
statistically insignificant effects on evacuation rates (e.g., Bateman and Edwards 2002;
Gladwin and Peacock 1997; Whitehead et al. 2000).
A final demographic characteristic that might affect evacuation behavior is
previous hurricane experience. Some analysts believe previous experience makes people
more likely to evacuate by raising their understanding of hurricane risks and the
evacuation process; others believe it makes them less likely to evacuate by imparting a
sense of security from having made it safely through previous hurricanes. Again, the
empirical evidence is mixed: some studies have found a significant positive effect (e.g.,
Riad et al. 2000), some have found a significant negative effect (e.g., Gladwin and
Peacock 1997), and some have found no significant effect (e.g., Lindell et al. 2005).
LOGISTIC REGRESSION ANALYSIS
We used logistic regression analysis to examine the determinants of evacuation
behavior in Florida (see DeMaris 2004 for a description of logistic regression models).
This technique is well-suited for our purposes because we are concerned with a
dichotomous final outcome (evacuating or not evacuating) rather than with the various
stages of the decision-making process. Logistic regression models have been used to
analyze hurricane evacuation behavior by Bateman and Edwards (2002), Gladwin and
Peacock (1997), Whitehead et al. (2000), Wilmot and Mei (2004), and others.
State Level Analyses
Choice of Variables. We began by analyzing evacuation behavior at the state
level. The dependent variable in our initial set of regressions was coded 1 if the
respondent evacuated at least once during the 2004 hurricane season and 0 otherwise.

17
The choice of independent variables was based on our review of the literature and the
availability of relevant data. Some variables measured physical risks and others
measured demographic characteristics. Our expectations regarding the effect of each
variable on evacuation behavior were based on theoretical considerations and the
empirical evidence discussed previously.
The severity and location of the storm are two of the most important measures of
hurricane risk. We constructed an independent variable combining these two measures
using information on the intensity and location of each hurricane. This variable (“storm
strength”) was coded 0-4 based on the severity of the strongest storm hitting each county
and the distance of each county from the point of landfall. If the county was on the coast,
it was assigned a score equal to the Saffir-Simpson category at the point of landfall; for
the hurricanes striking Florida in 2004, these categories ranged from 2 to 4. If the county
was inside the hurricane area shown in Figure 1 but was not on the coast, its Saffir-
Simpson score was reduced according to the county’s distance from the coast. If the
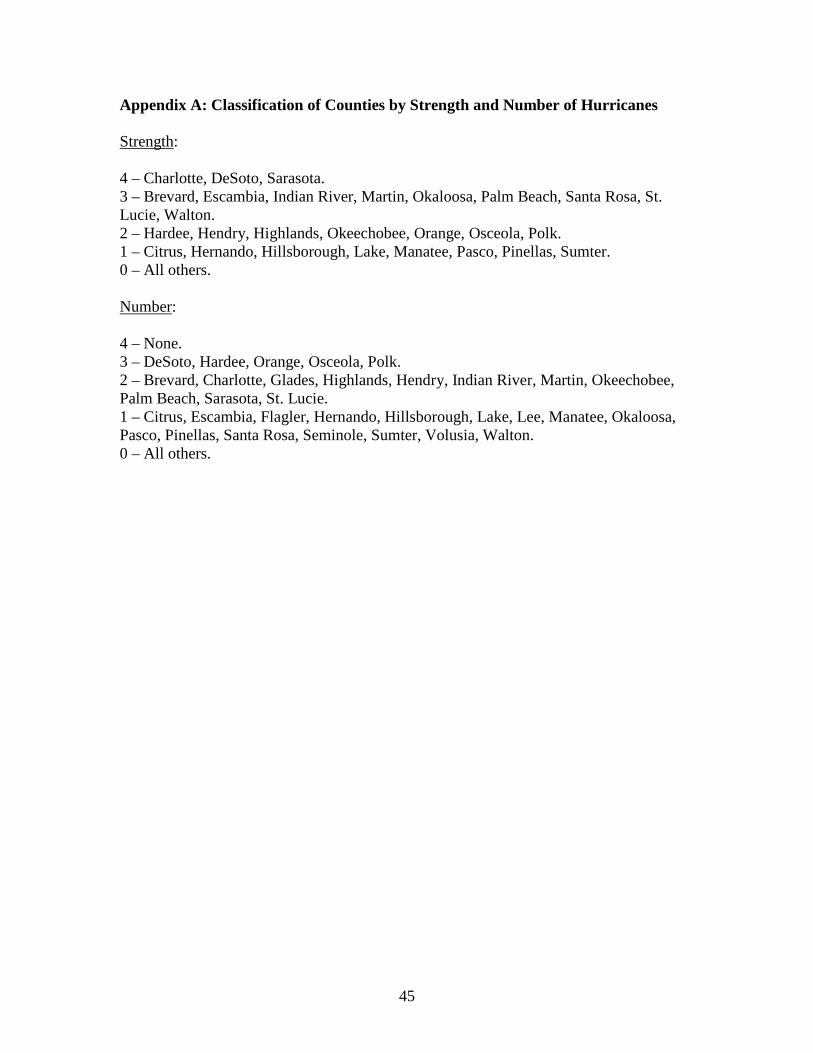
county was not inside the area shown in Figure 1, it was assigned a score of 0. The
classification of counties regarding storm strength is shown in Appendix A. Although
this measure is somewhat subjective, we believe it provides a reasonable approximation
of the strength of the strongest storm hitting each county. We expect storm strength to
have a positive effect on the probability of evacuating.
Some places were unaffected by any of the hurricanes striking Florida while
others were affected by two or even three. Using the information shown in Figure 1, we
constructed a variable measuring the number of hurricanes passing through each county
(Appendix A). Because an increase in the number of hurricanes raised the number of
18
opportunities to evacuate, we expect this variable to have a positive effect on the
probability of evacuating at least once.
Living in a mobile home poses a substantial physical risk when a hurricane strikes
an area. We coded a variable 1 if the respondent lived in a mobile home and 0 otherwise.
We expect this variable to have a positive effect on the probability of evacuating.
Several independent variables were based on household characteristics. Owning a
home, having a household member younger than age 18, and having a household member
age 65 or older were coded 1 if the household had that characteristic and 0 otherwise.
Household size was measured by the number of persons living in the household at the
time the hurricanes struck. We expect the presence of a household member younger than
age 18 to have a positive effect on the probability of evacuating and the other three
variables to have negative effects.
Several independent variables were based on personal characteristics. Three were
coded 1 if the respondent was female, black, or Hispanic, respectively, and 0 otherwise.
Income (measured in thousands of dollars) and education (measured in years of school
completed) were coded according to numerical responses. We expect race (black) and
ethnicity (Hispanic) to have negative effects on the probability of evacuating and gender
(female), income, and education to have positive effects. Given the results reported in
previous studies, however, there is a good chance that—except for gender—all these
effects will be statistically insignificant.
Finally, we used years lived in Florida as a proxy for previous hurricane
experience: the larger the number of years lived in Florida, the greater the likelihood of
having experienced a hurricane prior to 2004. We hypothesize that this variable will
19
have a negative effect on the probability of evacuating. Again, given the empirical
evidence reported in previous studies, it is unlikely that this effect will be significant.
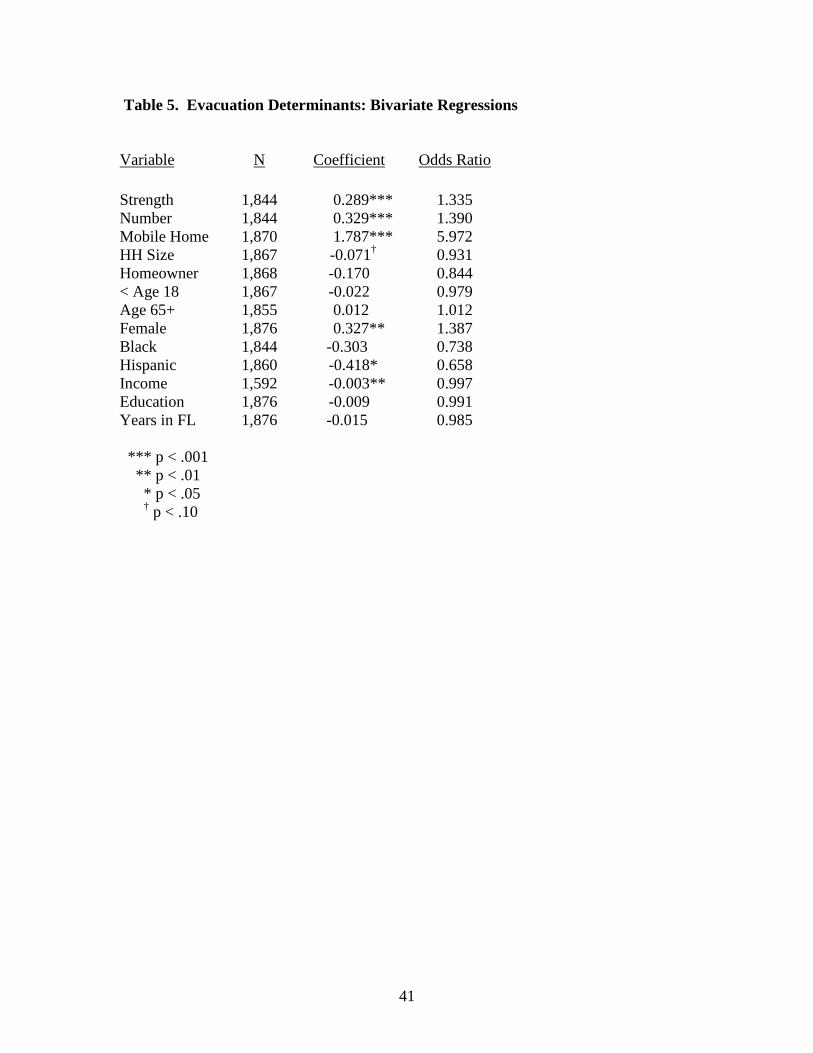
Bivariate Regressions. We ran a series of bivariate logistic regressions to
investigate the uncontrolled relationship between each independent variable and the
probability of evacuating at least once. The results are shown in Table 5. The odds ratios
show the proportion by which the probability of evacuating increases (or declines) with a
one unit increase in the value of each independent variable. Ratios above one reflect
increases and ratios below one reflect declines.
(Table 5 about here)
As expected, storm strength, number of hurricanes, and living in a mobile home
had significant positive effects on the probability of evacuating. Household size had the
expected negative effect but was significant only at the 10% level. Neither
homeownership nor the two age variables were significant, but women were significantly
more likely to evacuate than men. Blacks and Hispanics were less likely to evacuate than
non-Hispanic whites, but the effect was significant only for Hispanics. Contrary to
expectations, income and education had negative effects on the probability of evacuating,
but the effects were small and were significant only for income. Years lived in Florida
had a small insignificant negative effect.
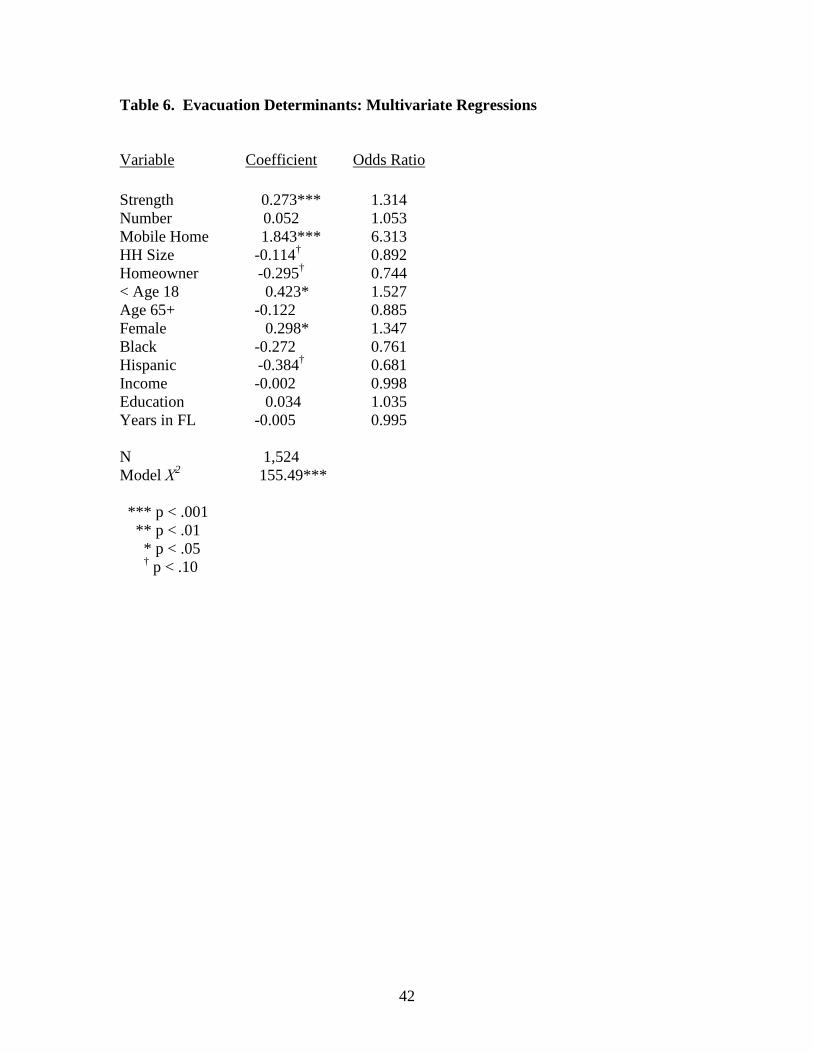
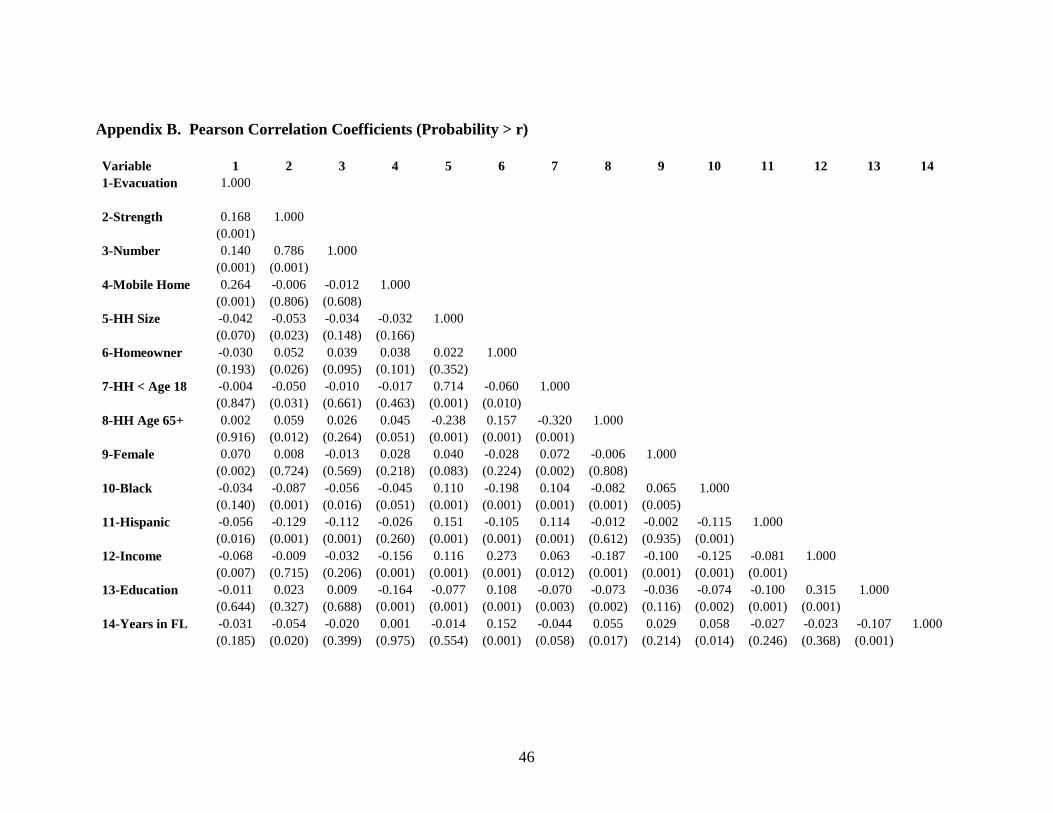
Multivariate Regressions. Bivariate regressions do not account for interactions
among the independent variables. Consequently, some of the statistical relationships
shown in Table 5 may be spurious, leading to false inferences regarding the factors
affecting evacuation behavior. To deal with this problem, we constructed a multivariate

20
regression model using the same set of independent variables. The results are shown in
Table 6 and a matrix of correlation coefficients is shown in Appendix B.
(Table 6 about here)
Many results were about the same in the multivariate regression as they were in
the bivariate regressions. Hurricane strength, living in a mobile home, and gender had
the same signs and were statistically significant in both sets of regressions; in fact, the
coefficients themselves did not vary substantially from one set to the other. Household
size, homeownership, and ethnicity had the same signs in both sets of regressions but
were significant only at the 10% level in the multivariate regression. Having a household
member age 65 or older, race, education, and years lived in Florida were insignificant in
both sets of regressions.
Several results changed. Perhaps the most dramatic was the change for the
number of hurricanes, which had a large significant effect in the bivariate regression but a
small insignificant effect in the multivariate regression. It appears that the bivariate
results for this variable were spurious, having been caused by a strong correlation
between the number and strength of hurricanes.
We believe the number of hurricanes had a large significant effect in the bivariate
regression because that variable reflected the occurrence of at least one hurricane. The
multivariate results, however, suggest that increases in the number of hurricanes beyond
one have no further impact of the probability of evacuating. We tested for this possibility
by rerunning the regressions using a data set that included only respondents who lived in
counties hit by at least one hurricane (not shown here). In the bivariate regression, the
coefficient for number of hurricanes was small and statistically insignificant; it was
21
actually negative (albeit insignificant) in the multivariate regression. In contrast, the
coefficient for hurricane strength was positive and highly significant in both the bivariate
and multivariate regressions. We conclude that hurricane strength had a significant
positive effect on the probability of evacuating at least once during the 2004 hurricane
season, but the number of hurricanes (beyond one) did not.
Several other results changed as well. Income had a small but significant effect
on the probability of evacuating in the bivariate regression, but lost its significance when
the effects of the other independent variables were accounted for. Having a household
member less than age 18 had a small insignificant effect in the bivariate regression but
the effect was much larger and statistically significant in the multivariate regression. We
believe this variable was insignificant in the bivariate regression because it is strongly
correlated with race and ethnicity. Having a household member younger than age 18 is
much more common for blacks and Hispanics than for non-Hispanic whites; both of these
groups are associated with relatively low evacuation rates. This variable became
significant in the multivariate regression because the effects of blacks and Hispanics were
accounted for.
The multivariate analysis thus supported some but not all of our hypotheses.
Hypotheses regarding storm strength, living in a mobile home, having a household
member younger than age 18, and gender were strongly supported. Hypotheses regarding
household size, homeownership, and ethnicity were marginally supported (i.e., at the
10% level). Hypotheses regarding number of hurricanes, household members age 65 or
older, race, income, education, and years lived in Florida were not supported.
22
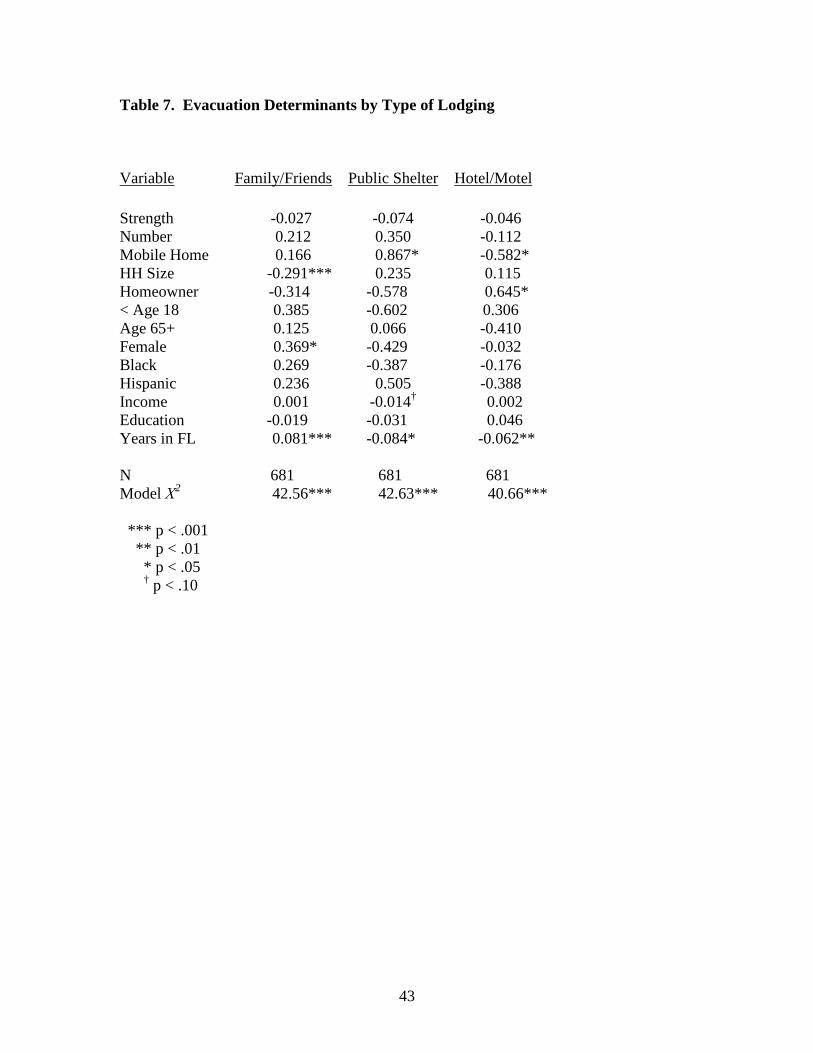
Type of Lodging. It is likely that differences in demographic characteristics
affect the type of lodging people choose when evacuating. Specifically, we hypothesize
that: 1) Greater access to economic resources will raise the probability of going to a hotel
or motel and lower the probability of going to a public shelter, and 2) The more extensive
the family and social network within a feasible evacuation distance, the greater the
probability of staying with family and friends and the lower the probability of going to a
public shelter or a hotel or motel.
To test these hypotheses, we constructed models with dependent variables
measuring three types of lodging: family or friends, public shelters, and hotels or motels.
All were coded 1 for evacuations to that type of lodging and 0 otherwise. The sample
covered all respondents who evacuated at least once; each evacuation was treated as an
independent observation. The independent variables were those used previously. The
results are shown in Table 7.
(Table 7 about here)
We consider income, homeownership, and living in a mobile home to be
measures of economic resources, with the first two variables positively associated with
the availability of resources and the third, negatively associated. Income had the
expected negative effect on the probability of going to a public shelter and the expected
positive effect on the probability of going to a hotel or motel, but the effects were only
marginally significant for the former and insignificant for the latter. Residents of mobile
homes were significantly more likely to go to a public shelter and less likely to go to a
hotel or motel, however, and homeowners were significantly more likely to go to a hotel
or motel. These results provide support for our first hypothesis and are consistent with
23
previous studies finding socioeconomic status to be negatively associated with the
likelihood of going to a public shelter (e.g., Drabek 1986; Mileti, Sorensen, and O’Brien
1992).
We do not have a direct measure of family and social networks within a feasible
evacuation distance, but length of residence in Florida may provide a reasonable proxy
measure. This measure will not be valid, however, if most evacuees go to locations
outside the state. To investigate this possibility, we conducted a follow-up survey of
respondents who reported they evacuated prior to at least one hurricane. We found that
49% of evacuees went to a location within the same county, 30% went to another county
in Florida, and only 21% left the state. We believe the high proportions remaining in the
state validate the use of length of residence in Florida as a proxy measure for family and
social networks within a feasible evacuation distance.
Table 7 shows length of residence in Florida to have a significant positive effect
on the probability of staying with family or friends and significant negative effects on the
probabilities of going to a public shelter and a hotel or motel. These results strongly
support our second hypothesis.
We also found household size to have a significant negative effect on the
probability of moving in with family or friends and positive but insignificant effects on
the probabilities of going to other types of lodging. We believe these results imply that
families and friends find it difficult to accommodate large numbers of visitors, forcing
large households to find other accommodations. Most of the other variables had
insignificant effects. The only exception was that women were more likely than men to
stay with family or friends.
24
Personal and household characteristics thus have several significant effects on the
type of lodging people choose when evacuating. These effects have received little
attention in the literature but have potentially important implications for public policy.
Regional Analyses
State-level analyses show several significant effects of risk factors and
demographic variables on the probability of evacuating. Do these effects hold when
looking at each region individually? To answer this question, we ran multivariate
regressions for each of the five regions.
Choice of Variables. The dependent variable was the same as that used in the
initial set of regressions (coded 1 if the respondent evacuated at least once and 0
otherwise) but two changes were made to the independent variables. First, variables
measuring the presence of a household member younger than age 18 or older than age 65
were not included because those data were not collected in the local surveys. Instead, we
added the age of the respondent as an independent variable. Given results cited in
previous studies, we expect age to have a negative effect on the probability of evacuating.
Second, since all respondents within a given region had similar (or identical)
scores on variables measuring the strength and number of hurricanes as defined in
Appendix A, we omitted those variables from the model. In their place, we added a
variable measuring housing damage sustained by each respondent as a result of the
hurricanes. This variable was coded 0-4 based on the severity of damages, with 0
indicating no damage and 4 indicating the complete destruction of the unit. We used the
severity of damage as an indicator of storm strength. Damage estimates have been used
in other studies to reflect physical risks posed by hurricanes (e.g., Riad et al. 1999). As

25
before, we expect storm strength to have a positive effect on the probability of
evacuating. All the other independent variables were the same as those used in the state-
level analysis.
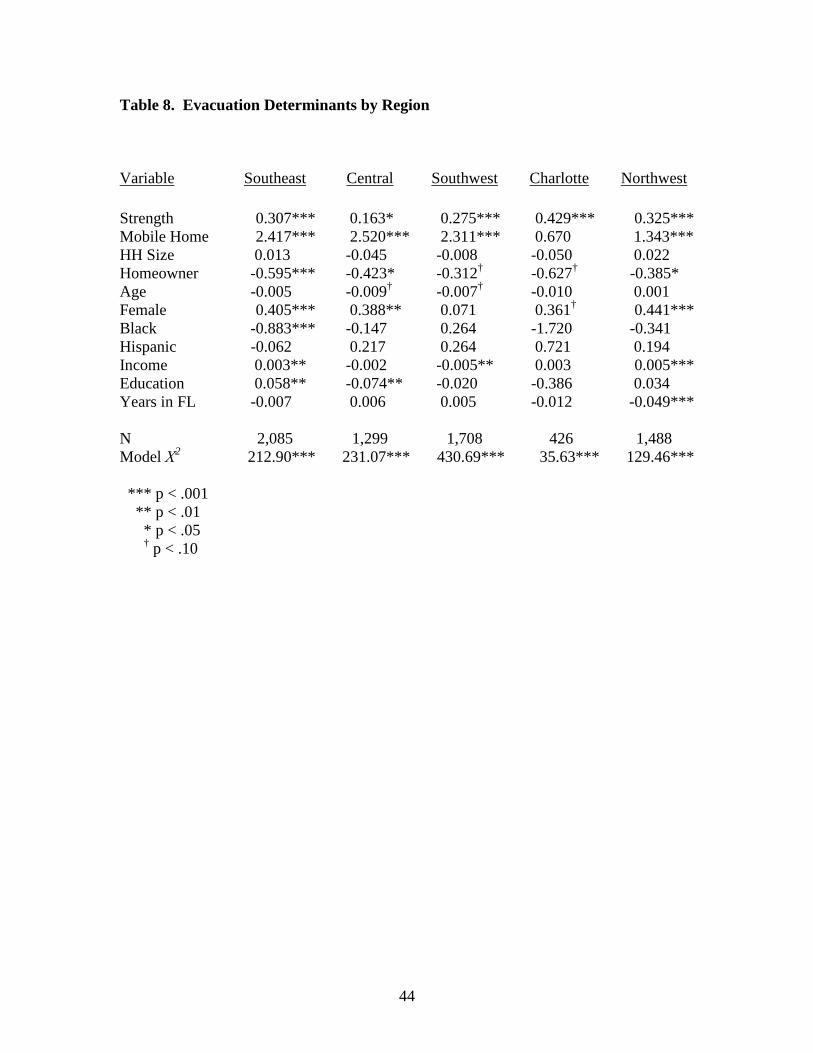
Regression Results. Four of the major findings in the state-level analysis were
replicated at the regional level (Table 8). Storm strength, living in a mobile home, and
gender had positive effects on the probability of evacuating in all five regions. These
effects were statistically significant at least at the 10% level in all five regions for storm
strength and in four of the five for living in a mobile home and gender. Homeownership
had a negative effect that was significant at least at the 10% level in all five regions. The
consistency of these results across regions strengthens their reliability.
(Table 8 about here)
Most of the results for the other demographic variables were inconsistent and/or
statistically insignificant. Household size and ethnicity had no significant effects on the
probability of evacuating in any of the five regions. Race and years lived in Florida were
insignificant in all regions but one. Age had the expected negative effect in four of the
five regions, but those effects were insignificant in two regions and only marginally
significant in the other two. Income and education had effects that were sometimes
significant and positive, sometimes significant and negative, and sometimes insignificant.
We do not have a ready explanation for results that differed from one region to
another. They may represent true regional differences or may have been caused by
sampling variability. Also, they may have been affected by regional differences in the
geographic distribution of households with particular characteristics relative to the paths
26
followed by the hurricanes. Given the inconsistent empirical results reported in previous
studies, finding regional differences in the present analysis is not surprising.
CONCLUSIONS
Many studies have concluded that the physical risks posed by hurricanes are a
major determinant—perhaps the major determinant—of evacuation behavior (e.g., Baker
1991; Bateman and Edwards 2002; Dow and Cutter 2002; Lindell et al. 2005). This
study supports that conclusion. Storm strength had a significant positive effect on the
probability of evacuating at the state level and in all five regions. The vulnerability of the
housing unit, as measured by living in a mobile home, had a significant positive effect at
the state level and in four of the five regions. In most instances, these two variables had a
greater impact on evacuation behavior than any other variable.
Several demographic variables were important as well. Women were found to be
significantly more likely to evacuate than men at the state level and in four of the five
regions. Households with children less than age 18 size were significantly more likely to
evacuate than other households in the state-level multivariate analysis, but lack of data
prevented us from evaluating this variable at the regional level. Homeownership had at
least a marginally significant negative effect on the probability of evacuating in all five
regions and at the state level. The other demographic variables had inconsistent or
mostly insignificant effects in both the state and regional analyses. These results are
consistent with those reported in most previous studies (e.g., Bateman and Edwards 2002;
Drabek 1986; Gladwin and Peacock 1997; Lindell et al. 2005; Perry 1979).
This study found that many people did not evacuate even when faced with an
imminent hurricane threat. Some doubted the severity of the threat or believed their
27
current locations were safe. Others were concerned about pets or leaving homes
unattended. Some had job responsibilities or medical conditions that impeded their
ability to evacuate and others had no transportation or no place to go. These findings
illustrate the difficulties emergency management officials face as they attempt to develop
effective hurricane evacuation plans.
Although hypothetical choices of evacuation lodging have been modeled before
(Whitehead et al. 2000), to our knowledge this is the first study to model a variety of
actual lodging choices. Several interesting results were found. The availability of
economic resources—as reflected by income and homeownership—lowered the
probability of going to a public shelter and raised the probability of going to a hotel or
motel, respectively. Living in a mobile home—associated with a lack of resources—
lowered the probability of going to a hotel or motel and raised the probability of going to
a public shelter. Clearly, hotels and motels are preferred over public shelters by those
who can afford them.
The number of years lived in Florida had a significant positive effect on the
probability of staying with family and friends and a significant negative effect on the
probability of going to a public shelter, hotel, or motel. We believe this variable reflects
the prevalence of in-state family and social networks. These lodging results suggest that
when government officials make decisions regarding the location and size of public
shelters, they should consider not only the number of persons residing in an area but their
socioeconomic and demographic characteristics as well.
This study has several limitations. The survey instrument did not ask questions
about several potentially important topics, limiting the number of research issues that
28
could be addressed. The measure of hurricane strength used for the state-level analysis
was somewhat subjective and the measure used for the regional analyses was a proxy
rather than a direct measure. The data set contained no explicit information on family
and social networks, requiring the use of a proxy for this variable as well. Post-hurricane
surveys themselves are subject to imperfect recall on the part of respondents and miss
people who leave the area following a hurricane and do not return.
If designed properly, however, post-hurricane surveys are capable of providing
accurate and useful information (Bourque et al. 1997). The present study provides
extensive documentation of evacuation patterns during one of the most active hurricane
seasons in history, confirms a number of findings reported in previous studies, and
presents several new findings. We believe it adds to our understanding of evacuation
behavior.
Many aspects of evacuation behavior require further research, such as how
hurricane warnings can best be communicated to the public, how people assess the
validity of the warnings they receive, how they balance the costs and benefits of
evacuating, how they formulate and implement evacuation plans, how traffic and lodging
issues affect evacuation decisions, and how the most vulnerable residents can best be
assisted. Clearly, much remains to be done. Gladwin et al. 2007; Lindell, Prater, and
Peacock 2007; and Phillips and Morrow 2007 provide excellent discussions of future
research needs.
Why does this matter? There is evidence that the intensity and perhaps the
frequency of hurricanes has increased in recent years as a result of rising sea surface
temperatures (e.g., Hoyos et al. 2006; Saunders and Lea 2008); these rising temperatures

29
are often attributed to global warming caused by the production of greenhouse gases
(e.g., Santer et al. 2006; Trenberth 2005). Combined with rapid population growth in
coastal areas, greater hurricane activity represents a growing threat to larger and larger
numbers of people in the United States and throughout the world. We believe further
research on the determinants of evacuation behavior will deepen our understanding of
this increasingly important topic and help officials at all levels of government develop
and implement safer, more efficient, and less stressful evacuation plans.
30
REFERENCES
Baker, E. J. 1979. “Predicting Response to Hurricane Warnings: A Reanalysis of Data
from Four Studies.” Mass Emergencies 4: 9-24.
_____. 1991. “Hurricane Evacuation Behavior.” International Journal of Mass
Emergencies and Disasters 9: 287-310.
Bateman, J. M. and B. Edwards. 2002. “Gender and Evacuation: A Closer Look at Why
Women Are More Likely to Evacuate for Hurricanes.” Natural Hazards Review
3: 107-117.
Blake, E. S., J. D. Jarrell, and E. N. Rappaport. 2006. The Deadliest, Costliest, and Most
Intense United States Tropical Cyclones from 1851 to 2005 (and Other
Frequently Requested Hurricane Facts). National Hurricane Center, NOAA
Technical Memorandum NWS TPC-4.
Bourque, L. B., K. I. Shoaf, and L. H. Nguyen. 1997. “Survey Research,” International
Journal of Mass Emergencies and Disasters 15: 71-101.
Blendon, R. J., J. M. Benson, T. Buhr, K. J. Weldon, and M. J. Herrmann. 2006. “High-
Risk Area Hurricane Survey.” Cambridge: Harvard School of Public Health.
Blumberg, S., J. Luke, and M. Cynamon. 2005. “NHIS Estimates of Wireless-Only
Population Size and Characteristics.” Paper presented at the Cell Phone Sampling
Summit II, New York, February 3-4.
Dash, N. and H. Gladwin. 2007. “Evacuation Decision Making and Behavioral
Responses: Individual and Household,” Natural Hazards Review 8: 69-77.
DeMaris, A. 2004. Regression with Social Data: Modeling Continuous and Limited
Response Variables. Hoboken, NJ: Wiley.
31
Dow, K. and S. L. Cutter. 1998. “Crying Wolf: Repeat Responses to Hurricane
Evacuation Orders,” Coastal Management 26: 237-252.
_____. 2002. “Emerging Hurricane Evacuation Issues: Hurricane Floyd and South
Carolina.” Natural Hazards Review 3:12-18.
Drabek, T. E. 1986. Human System Responses to Disaster. New York: Springer-Verlag.
Fothergill, A. 1996. “Gender, Risk, and Disaster.” International Journal of Mass
Emergencies and Disasters 14: 33-56.
Fothergill, A., E. G. M. Maestas, and J. D. Darlington. 1999. “Race, Ethnicity and
Disasters in the United States: A Review of the Literature.” Disasters 23: 156-
173.
Friesema, H. P., J. Caporaso, G. Goldstein, R. Lineberry, and R. McCleary. Aftermath:
Communities after Natural Disasters. Beverly Hills: Sage.
Gillespie, W. 1991. “Economic Impact of Hurricane Hugo.” Division of Research and
Statistical Services, Office of Economic Research. Columbia: South Carolina
Budget and Control Board.
Gladwin, H. and W. G. Peacock. 1997. “Warning and Evacuation: A Night of Hard
Choices.” Chapter 4 in Walter Gillis Peacock, Betty H. Morrow, and Hugh
Gladwin (eds.), Hurricane Andrew: Ethnicity, Gender and the Sociology of
Disasters. New York: Routledge.
Gladwin, C. H., H. Gladwin, and W. G. Peacock. 2001. “Modeling Hurricane
Evacuation Decisions with Ethnographic Methods,” International Journal of
Mass Emergencies and Disasters 19: 117-143.
32
Gladwin, H., J. K. Lazo, B. H. Morrow, W. G. Peacock, and H. E. Willoughby. 2007.
“Social Science Research Needs for the Hurricane Forecast and Warning
System,” Natural Hazards Review 8: 87-95.
Hoyos, C. D., P. A. Agudelo, P. J. Webster, and J. A. Curry. 2005. “Deconvolution of
the Factors Contributing to the Increase in Global Hurricane Intensity.” Science
312: 94-97.
Lindell, M. K., J. C. Lu, and C. S. Prater. 2005. “Household Decision Making and
Evacuation in Response to Hurricane Lili.” Natural Hazards Review 6: 171-179.
Lindell, M. K., C. S. Prater, and W. G. Peacock. 2007. “Organizational Communication
and Decision Making for Hurricane Emergencies,” Natural Hazards Review 8:
50-60.
Mileti, D. S., J. H. Sorensen, and P. W. O’Brien. 1992. “Toward an Explanation of Mass
Care Shelter Use in Evacuations,” International Journal of Mass Emergencies
and Disasters 10: 25-42.
National Hurricane Center. 2005. “Hurricane History.”
(http://www.nhc.noaa.gov/HAW2/English/history). Retrieved 10/17/2005.
National Weather Service. 2006. Service Assessment: Hurricane Katrina, August 23-31,
2005. Silver Spring, MD: National Oceanic and Atmospheric Administration.
Perry, R. W. 1979. “Evacuation Decision-Making in Natural Disasters.” Mass
Emergencies 4: 25-38.
Perry, R. W. and M. K. Lindell. 1991. “The Effects of Ethnicity on Evacuation
Decision-Making.” International Journal of Mass Emergencies and Disasters 9:
47-68.
33
Phillips, B. D. and B. H. Morrow. 2007. “Social Science Research Needs: Focus on
Vulnerable Populations, Forecasting, and Warnings,” Natural Hazards Review 8:
61-68.
Riad, J. K., F. H. Norris, and R. B. Ruback. 1999. “Predicting Evacuation in Two Major
Disasters: Risk Perception, Social Influence, and Access to Resources.” Journal
of Applied Social Psychology 29: 918-934.
Rossi, P. H., J. D. Wright, S. R. Wright, and E. Webber-Burdin. 1981. “Are There
Long-Term Effects of American Natural Disasters?” pp. 3-23 in James D. Wright
and Peter H. Rossi, eds. Social Science and Natural Hazards. Cambridge, MA:
Abt Books.
Santer, B. D., T. M. L. Wigley, P. J. Gleckler, C. Bonfils, M. F. Wehner, K. AchutaRao,
T. P. Barnett, J. S. Boyle, W. Gruggemann, M. Fiorino, N. Gillett, J. E. Hansen,
P. D. Jones, S. A. Klein, G. A. Meehl, S. C. B. Raper, R. W. Reynolds, K. E.
Taylor, and W. M. Washington. 2006. “Forced and Unforced Ocean
Temperature Changes in Atlantic and Pacific Tropical Cyclogenesis Regions.”
Proceedings of the National Academy of Sciences 1103: 13905-13910.
Saunders, M. A. and A. S. Lea. 2008. “Large Contribution of Sea Surface Warming to
Recent Increase in Atlantic Hurricane Activity.” Nature 451: 557-561.
Smith, S. K. and C. McCarty. 1996. “Demographic Effects of Natural Disasters: A Case
Study of Hurricane Andrew.” Demography 33: 265-275.
_____. 2006. “Florida’s 2004 Hurricane Season: Demographic Response and
Recovery.” Paper presented at the annual meeting of the Southern Demographic
Association, Durham.
34
Treberth, K. 2005. “Uncertainty in Hurricanes and Global Warming.” Science 308:
1753-1754.
Whitehead, J. C., B. Edwards, M. Van Willigen, J. R. Amiolo, K. Wilson, and K. T.
Smith. 2000. “Heading for Higher Ground: Factors Affecting Real and
Hypothetical Hurricane Evacuation Behavior.” Environmental Hazards 2: 133-
142.
Wilmot, C. G. and B. Mei. 2004. “Comparison of Alternatiave Trip Generation Models
for Hurricane Evacuation.” Natural Hazards Review 5: 170-178.
Zhang, Y., C. S. Prater, and M. K. Lingell. 2004. “Risk Area Accuracy and Evacuation
from Hurricane Bret.” Natural Hazards Review 5: 115-120.
35
Figure 1. Paths Followed by the 2004 Florida Hurricanes
36
Table 1. Regions and Sample Size Region Counties N Southeast Indian River, Martin, St. Lucie 2,739 Central Highlands, Osceola, Polk 1,711 Southwest DeSoto, Hardee 2,105 Charlotte Charlotte 568 Northwest Escambia, Santa Rosa 1,925 Total 9,048
37
Table 2. Demographic and Damage Characteristics Characteristic SE Central SW Charlotte NW Florida Median age 48.1 39.6 35.2 54.3 36.4 39.6 % 65+ 25.6 18.3 17.0 34.3 13.3 17.4 % Black 11.1 12.8 11.7 5.2 16.9 15.2 % Hispanic 9.2 18.3 31.9 3.8 2.9 18.5 Median Income 39,199 35,857 30,490 36,379 37,225 38,819 % Poverty 11.0 12.8 24.0 8.2 13.7 12.5 % College Grad. 20.5 14.9 8.4 17.6 21.6 22.4 % Mobile Homes 12.1 25.3 34.0 14.6 12.0 11.6 % Major Damage 35.5 25.0 50.2 49.0 40.6 8.5 % Minor Damage 42.0 41.3 38.2 32.6 38.9 23.7 % No Damage 22.5 33.7 11.6 18.4 20.5 67.8 Note: Data for age, race, Hispanic origin, and hurricane damage refer to 2004 and data for income, poverty, education, and mobile homes refer to 2000. Sources: U.S. Census Bureau (2000 data) and Bureau of Economic and Business Research, University of Florida (2004 data).
38
Table 3. Evacuation Characteristics
Number of Times Each Respondent Evacuated (percent distribution)
Region
Zero
One
Two
Three
Four
Total
SE 47.3 20.1 30.5 1.0 1.1 100.0 Central 70.7 10.0 6.3 7.2 5.8 100.0 SW 58.8 17.6 7.7 7.7 8.2 100.0 Charlotte 64.1 26.0 4.9 1.8 3.2 100.0 NW 56.2 43.0 0.1 0.3 0.4 100.0 Florida 74.8 13.5 6.3 2.1 3.3 100.0 Percent Evacuating at Least Once, by Type of Housing Unit Region
Mobile Home
Single Family
Multi-Family
Other
Total
SE 95.0 49.3 57.7 57.9 52.7 Central 71.9 18.2 40.8 39.9 29.3 SW 77.7 27.8 31.2 30.4 41.2 Charlotte 74.0 32.2 25.3 49.0 35.9 NW 72.3 40.8 40.3 46.6 43.8 Florida 62.8 20.6 25.8 30.3 25.2 Type of Lodging (percent distribution)
Region
Family/ Friends
Public Shelter
Hotel/ Motel
Other
Total
SE 58.0 6.6 20.4 15.0 100.0 Central 62.6 5.8 14.3 17.3 100.0 SW 63.3 11.3 7.3 18.0 100.0 Charlotte 56.5 3.3 25.3 14.9 100.0 NW 57.6 7.1 22.3 13.0 100.0 Florida 65.2 5.7 15.3 13.8 100.0
39
Table 3. Evacuation Characteristics (continued)
Number of Nights Away from Home (percent distribution)
Region
1-2
3-4
5-6
7-13
14+
Total
SE 20.0 33.8 16.8 20.5 9.0 100.0 Central 53.5 27.3 6.8 7.9 4.5 100.0 SW 57.1 17.5 4.4 6.5 14.5 100.0 Charlotte 46.1 17.8 10.5 9.5 16.0 100.0 NW 26.5 23.9 16.3 15.9 17.4 100.0 Florida 51.3 27.6 9.0 9.7 2.4 100.0
40
Table 4. Primary Reason for Failing to Evacuate: Escambia and Charlotte Counties (percent distribution) Reason Escambia Charlotte Thought I could ride it out
53.6
27.2
Storm was predicted to hit elsewhere
1.8 25.6
Was not aware hurricane was coming
0.0 4.1
Concerned about leaving pets
8.3 6.1
Concerned about leaving house unattended
8.3 5.7
Had no place to go
1.8 2.0
Had no transportation
1.2 1.2
Medical condition prevented evacuation
4.2 3.7
Job did not permit leaving
6.8 2.9
Did not have enough time
0.0 4.9
Other
14.0 16.6
41
Table 5. Evacuation Determinants: Bivariate Regressions Variable
N
Coefficient
Odds Ratio
Strength 1,844 0.289*** 1.335 Number 1,844 0.329*** 1.390 Mobile Home 1,870 1.787*** 5.972 HH Size 1,867 -0.071† 0.931 Homeowner 1,868 -0.170 0.844 < Age 18 1,867 -0.022 0.979 Age 65+ 1,855 0.012 1.012 Female 1,876 0.327** 1.387 Black 1,844 -0.303 0.738 Hispanic 1,860 -0.418* 0.658 Income 1,592 -0.003** 0.997 Education 1,876 -0.009 0.991 Years in FL 1,876 -0.015 0.985 *** p < .001 ** p < .01 * p < .05 † p < .10
42
Table 6. Evacuation Determinants: Multivariate Regressions Variable
Coefficient
Odds Ratio
Strength 0.273*** 1.314 Number 0.052 1.053 Mobile Home 1.843*** 6.313 HH Size -0.114† 0.892 Homeowner -0.295† 0.744 < Age 18 0.423* 1.527 Age 65+ -0.122 0.885 Female 0.298* 1.347 Black -0.272 0.761 Hispanic -0.384† 0.681 Income -0.002 0.998 Education 0.034 1.035 Years in FL -0.005 0.995 N 1,524 Model Χ2 155.49*** *** p < .001 ** p < .01 * p < .05 † p < .10
43
Table 7. Evacuation Determinants by Type of Lodging Variable
Family/Friends
Public Shelter
Hotel/Motel
Strength -0.027 -0.074 -0.046 Number 0.212 0.350 -0.112 Mobile Home 0.166 0.867* -0.582* HH Size -0.291*** 0.235 0.115 Homeowner -0.314 -0.578 0.645* < Age 18 0.385 -0.602 0.306 Age 65+ 0.125 0.066 -0.410 Female 0.369* -0.429 -0.032 Black 0.269 -0.387 -0.176 Hispanic 0.236 0.505 -0.388 Income 0.001 -0.014† 0.002 Education -0.019 -0.031 0.046 Years in FL 0.081*** -0.084* -0.062** N 681 681 681 Model Χ2 42.56*** 42.63*** 40.66*** *** p < .001 ** p < .01 * p < .05 † p < .10
44
Table 8. Evacuation Determinants by Region Variable
Southeast
Central
Southwest
Charlotte
Northwest
Strength 0.307*** 0.163* 0.275*** 0.429*** 0.325*** Mobile Home 2.417*** 2.520*** 2.311*** 0.670 1.343*** HH Size 0.013 -0.045 -0.008 -0.050 0.022 Homeowner -0.595*** -0.423* -0.312† -0.627† -0.385* Age -0.005 -0.009† -0.007† -0.010 0.001 Female 0.405*** 0.388** 0.071 0.361† 0.441*** Black -0.883*** -0.147 0.264 -1.720 -0.341 Hispanic -0.062 0.217 0.264 0.721 0.194 Income 0.003** -0.002 -0.005** 0.003 0.005*** Education 0.058** -0.074** -0.020 -0.386 0.034 Years in FL -0.007 0.006 0.005 -0.012 -0.049*** N 2,085 1,299 1,708 426 1,488 Model Χ2 212.90*** 231.07*** 430.69*** 35.63*** 129.46*** *** p < .001 ** p < .01 * p < .05 † p < .10
45
Appendix A: Classification of Counties by Strength and Number of Hurricanes Strength: 4 – Charlotte, DeSoto, Sarasota. 3 – Brevard, Escambia, Indian River, Martin, Okaloosa, Palm Beach, Santa Rosa, St. Lucie, Walton. 2 – Hardee, Hendry, Highlands, Okeechobee, Orange, Osceola, Polk. 1 – Citrus, Hernando, Hillsborough, Lake, Manatee, Pasco, Pinellas, Sumter. 0 – All others. Number: 4 – None. 3 – DeSoto, Hardee, Orange, Osceola, Polk. 2 – Brevard, Charlotte, Glades, Highlands, Hendry, Indian River, Martin, Okeechobee, Palm Beach, Sarasota, St. Lucie. 1 – Citrus, Escambia, Flagler, Hernando, Hillsborough, Lake, Lee, Manatee, Okaloosa, Pasco, Pinellas, Santa Rosa, Seminole, Sumter, Volusia, Walton. 0 – All others.
46
Appendix B. Pearson Correlation Coefficients (Probability > r) Variable 1 2 3 4 5 6 7 8 9 10 11 12 13 14 1-Evacuation 1.000 2-Strength 0.168 1.000 (0.001) 3-Number 0.140 0.786 1.000 (0.001) (0.001) 4-Mobile Home 0.264 -0.006 -0.012 1.000 (0.001) (0.806) (0.608) 5-HH Size -0.042 -0.053 -0.034 -0.032 1.000 (0.070) (0.023) (0.148) (0.166) 6-Homeowner -0.030 0.052 0.039 0.038 0.022 1.000 (0.193) (0.026) (0.095) (0.101) (0.352) 7-HH < Age 18 -0.004 -0.050 -0.010 -0.017 0.714 -0.060 1.000 (0.847) (0.031) (0.661) (0.463) (0.001) (0.010) 8-HH Age 65+ 0.002 0.059 0.026 0.045 -0.238 0.157 -0.320 1.000 (0.916) (0.012) (0.264) (0.051) (0.001) (0.001) (0.001) 9-Female 0.070 0.008 -0.013 0.028 0.040 -0.028 0.072 -0.006 1.000 (0.002) (0.724) (0.569) (0.218) (0.083) (0.224) (0.002) (0.808) 10-Black -0.034 -0.087 -0.056 -0.045 0.110 -0.198 0.104 -0.082 0.065 1.000 (0.140) (0.001) (0.016) (0.051) (0.001) (0.001) (0.001) (0.001) (0.005) 11-Hispanic -0.056 -0.129 -0.112 -0.026 0.151 -0.105 0.114 -0.012 -0.002 -0.115 1.000 (0.016) (0.001) (0.001) (0.260) (0.001) (0.001) (0.001) (0.612) (0.935) (0.001) 12-Income -0.068 -0.009 -0.032 -0.156 0.116 0.273 0.063 -0.187 -0.100 -0.125 -0.081 1.000 (0.007) (0.715) (0.206) (0.001) (0.001) (0.001) (0.012) (0.001) (0.001) (0.001) (0.001) 13-Education -0.011 0.023 0.009 -0.164 -0.077 0.108 -0.070 -0.073 -0.036 -0.074 -0.100 0.315 1.000 (0.644) (0.327) (0.688) (0.001) (0.001) (0.001) (0.003) (0.002) (0.116) (0.002) (0.001) (0.001) 14-Years in FL -0.031 -0.054 -0.020 0.001 -0.014 0.152 -0.044 0.055 0.029 0.058 -0.027 -0.023 -0.107 1.000 (0.185) (0.020) (0.399) (0.975) (0.554) (0.001) (0.058) (0.017) (0.214) (0.014) (0.246) (0.368) (0.001)