FY2017 Performance Accountability Report Mission Summary ...
Flash Report
FY2016 Financial Performance &
FY2017 Outlook
Teijin Limited May 9, 2017
Outline of FY2016 Results
FY2015 FY2016 FY2015 FY2016FY2015 FY2016
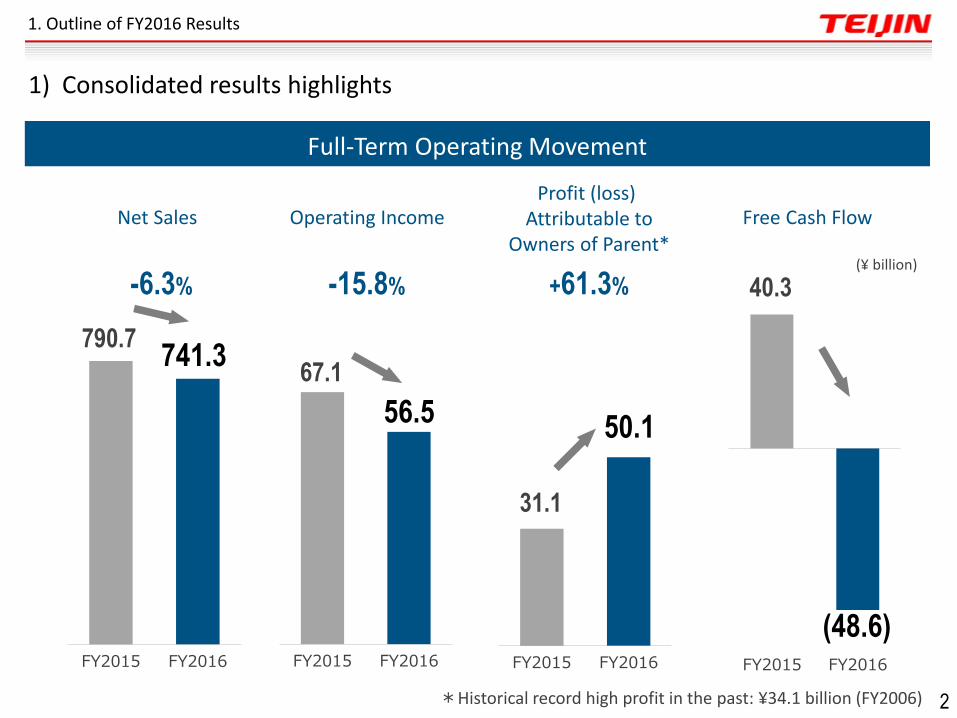
Full-Term Operating Movement
FY2015 FY2016
(¥ billion)
790.7
31.1
67.1 741.3
56.5
40.3
50.1
(48.6)
Net Sales Operating Income
-6.3% -15.8% +61.3%
Free Cash Flow Profit (loss)
Attributable to Owners of Parent*
1) Consolidated results highlights
1. Outline of FY2016 Results
*Historical record high profit in the past: ¥34.1 billion (FY2006) 2
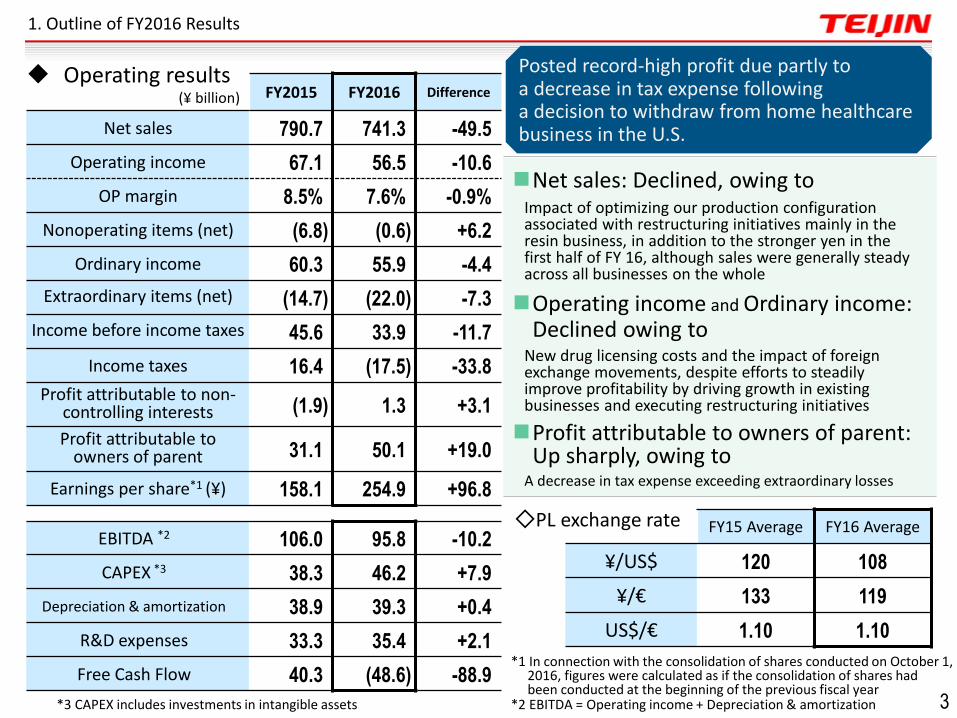
(¥ billion) FY2015 FY2016 Difference
Net sales 790.7 741.3 -49.5
Operating income 67.1 56.5 -10.6
OP margin 8.5% 7.6% -0.9%
Nonoperating items (net) (6.8) (0.6) +6.2
Ordinary income 60.3 55.9 -4.4
Extraordinary items (net) (14.7) (22.0) -7.3
Income before income taxes 45.6 33.9 -11.7
Income taxes 16.4 (17.5) -33.8
Profit attributable to non-controlling interests (1.9) 1.3 +3.1
Profit attributable to owners of parent 31.1 50.1 +19.0
Earnings per share*1 (¥) 158.1 254.9 +96.8
EBITDA *2 106.0 95.8 -10.2
CAPEX *3 38.3 46.2 +7.9
Depreciation & amortization 38.9 39.3 +0.4
R&D expenses 33.3 35.4 +2.1
Free Cash Flow 40.3 (48.6) -88.9
Operating results
*1 In connection with the consolidation of shares conducted on October 1, 2016, figures were calculated as if the consolidation of shares had been conducted at the beginning of the previous fiscal year
◇PL exchange rate FY15 Average FY16 Average
¥/US$ 120 108
¥/€ 133 119
US$/€ 1.10 1.10
Net sales: Declined, owing to Impact of optimizing our production configuration associated with restructuring initiatives mainly in the resin business, in addition to the stronger yen in the first half of FY 16, although sales were generally steady across all businesses on the whole
Operating income and Ordinary income: Declined owing to
New drug licensing costs and the impact of foreign exchange movements, despite efforts to steadily improve profitability by driving growth in existing businesses and executing restructuring initiatives
Profit attributable to owners of parent: Up sharply, owing to
A decrease in tax expense exceeding extraordinary losses
*3 CAPEX includes investments in intangible assets *2 EBITDA = Operating income + Depreciation & amortization
Posted record-high profit due partly to a decrease in tax expense following a decision to withdraw from home healthcare business in the U.S.
1. Outline of FY2016 Results
3
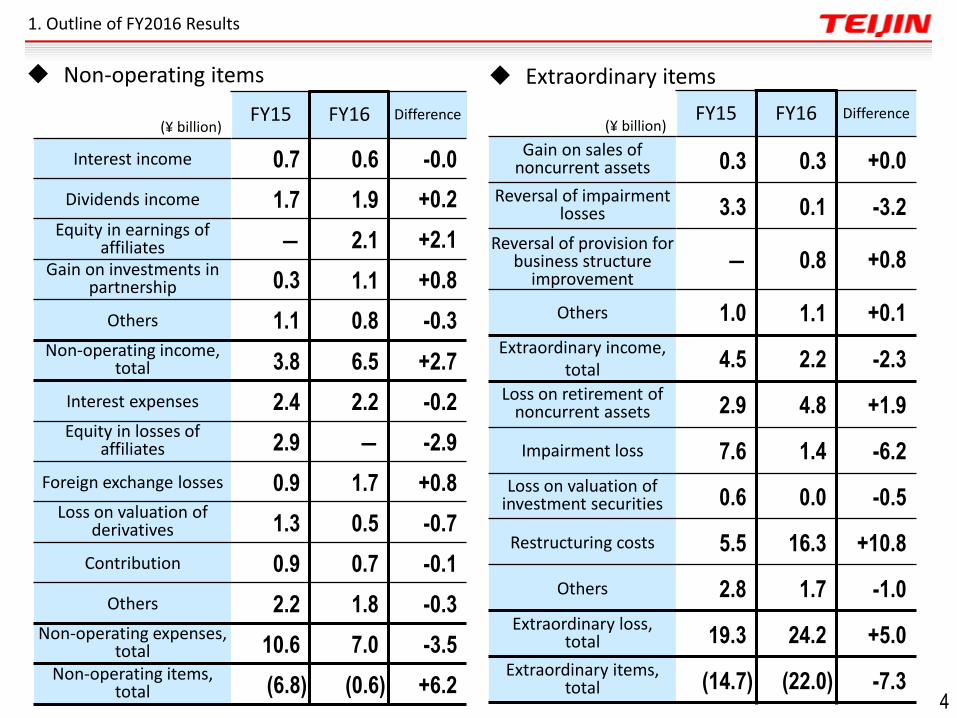
Extraordinary items
FY15 FY16 Difference (¥ billion)
Interest income 0.7 0.6 -0.0
Dividends income 1.7 1.9 +0.2
Equity in earnings of affiliates ― 2.1 +2.1
Gain on investments in partnership 0.3 1.1 +0.8
Others 1.1 0.8 -0.3 Non-operating income,
total 3.8 6.5 +2.7
Interest expenses 2.4 2.2 -0.2 Equity in losses of
affiliates 2.9 ― -2.9
Foreign exchange losses 0.9 1.7 +0.8 Loss on valuation of
derivatives 1.3 0.5 -0.7
Contribution 0.9 0.7 -0.1
Others 2.2 1.8 -0.3 Non-operating expenses,
total 10.6 7.0 -3.5 Non-operating items,
total (6.8) (0.6) +6.2
FY15 FY16 Difference (¥ billion)
Gain on sales of noncurrent assets 0.3 0.3 +0.0
Reversal of impairment losses 3.3 0.1 -3.2
Reversal of provision for business structure
improvement ― 0.8 +0.8
Others 1.0 1.1 +0.1
Extraordinary income, total 4.5 2.2 -2.3
Loss on retirement of noncurrent assets 2.9 4.8 +1.9
Impairment loss 7.6 1.4 -6.2
Loss on valuation of investment securities 0.6 0.0 -0.5
Restructuring costs 5.5 16.3 +10.8
Others 2.8 1.7 -1.0
Extraordinary loss, total 19.3 24.2 +5.0
Extraordinary items, total (14.7) (22.0) -7.3
1. Outline of FY2016 Results
Non-operating items
4
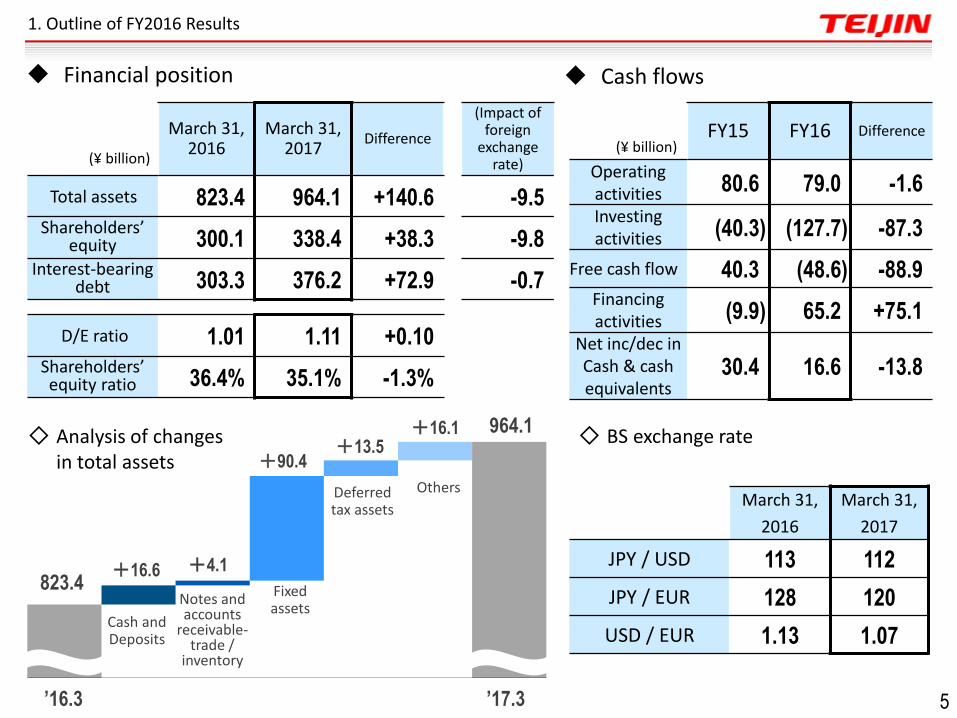
964.1
Cash and Deposits
Fixed assets
823.4
’16.3 ’17.3
Notes and accounts
receivable-trade /
inventory
Deferred tax assets
+16.1
+90.4 +13.5
Others
+4.1
March 31, 2016
March 31, 2017
Difference
(Impact of foreign
exchange rate) (¥ billion)
Total assets 823.4 964.1 +140.6 -9.5 Shareholders’
equity 300.1 338.4 +38.3 -9.8 Interest-bearing
debt 303.3 376.2 +72.9 -0.7
D/E ratio 1.01 1.11 +0.10 Shareholders’ equity ratio 36.4% 35.1% -1.3%
March 31,
2016
March 31,
2017
JPY / USD 113 112
JPY / EUR 128 120
USD / EUR 1.13 1.07
FY15 FY16 Difference (¥ billion)
Operating activities 80.6 79.0 -1.6
Investing activities (40.3) (127.7) -87.3
Free cash flow 40.3 (48.6) -88.9 Financing activities (9.9) 65.2 +75.1
Net inc/dec in Cash & cash equivalents
30.4 16.6 -13.8
◇ Analysis of changes in total assets
Cash flows
◇ BS exchange rate
+16.6
1. Outline of FY2016 Results
Financial position
5
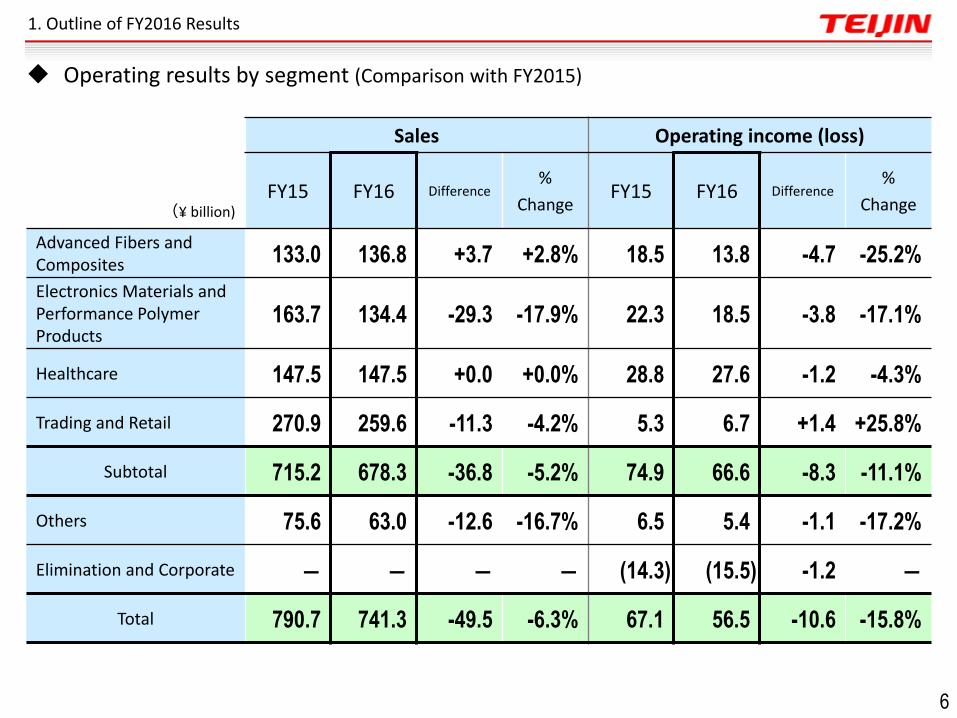
(¥ billion)
Sales Operating income (loss)
FY15 FY16 Difference %
Change FY15 FY16 Difference
%
Change
Advanced Fibers and Composites 133.0 136.8 +3.7 +2.8% 18.5 13.8 -4.7 -25.2%
Electronics Materials and Performance Polymer Products
163.7 134.4 -29.3 -17.9% 22.3 18.5 -3.8 -17.1%
Healthcare 147.5 147.5 +0.0 +0.0% 28.8 27.6 -1.2 -4.3%
Trading and Retail 270.9 259.6 -11.3 -4.2% 5.3 6.7 +1.4 +25.8%
Subtotal 715.2 678.3 -36.8 -5.2% 74.9 66.6 -8.3 -11.1%
Others 75.6 63.0 -12.6 -16.7% 6.5 5.4 -1.1 -17.2%
Elimination and Corporate ― ― ― ― (14.3) (15.5) -1.2 ―
Total 790.7 741.3 -49.5 -6.3% 67.1 56.5 -10.6 -15.8%
1. Outline of FY2016 Results
Operating results by segment (Comparison with FY2015)
6
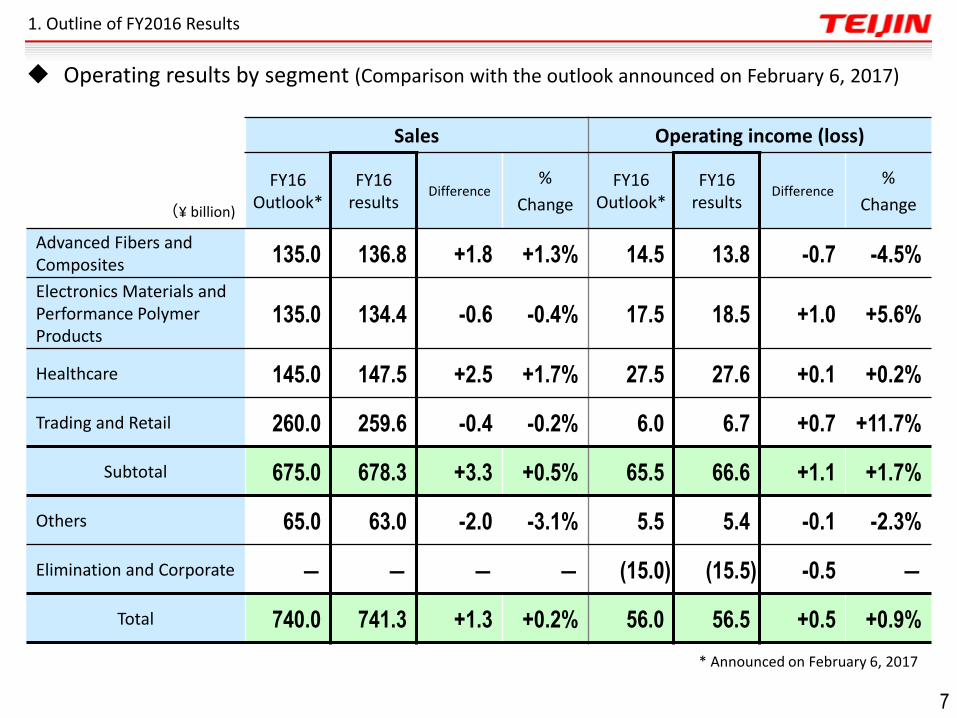
1. Outline of FY2016 Results
(¥ billion)
Sales Operating income (loss)
FY16 Outlook*
FY16 results
Difference %
Change
FY16 Outlook*
FY16 results
Difference %
Change
Advanced Fibers and Composites 135.0 136.8 +1.8 +1.3% 14.5 13.8 -0.7 -4.5%
Electronics Materials and Performance Polymer Products
135.0 134.4 -0.6 -0.4% 17.5 18.5 +1.0 +5.6%
Healthcare 145.0 147.5 +2.5 +1.7% 27.5 27.6 +0.1 +0.2%
Trading and Retail 260.0 259.6 -0.4 -0.2% 6.0 6.7 +0.7 +11.7%
Subtotal 675.0 678.3 +3.3 +0.5% 65.5 66.6 +1.1 +1.7%
Others 65.0 63.0 -2.0 -3.1% 5.5 5.4 -0.1 -2.3%
Elimination and Corporate ― ― ― ― (15.0) (15.5) -0.5 ―
Total 740.0 741.3 +1.3 +0.2% 56.0 56.5 +0.5 +0.9%
* Announced on February 6, 2017
Operating results by segment (Comparison with the outlook announced on February 6, 2017)
7
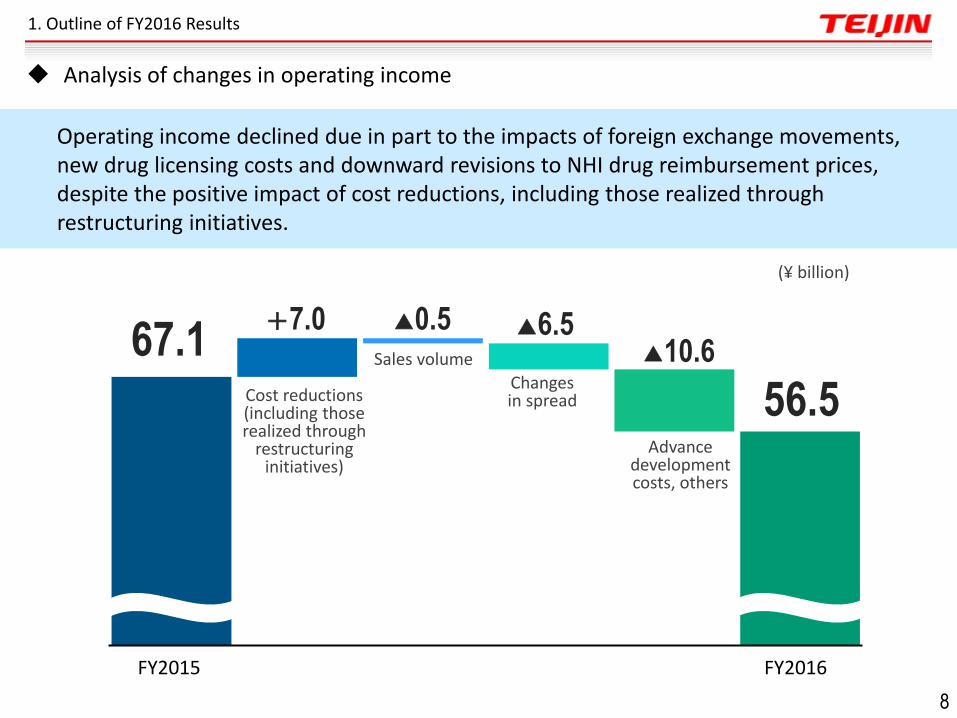
FY2015 FY2016
Sales volume
Cost reductions (including those realized through
restructuring initiatives)
Changes in spread
(¥ billion)
67.1
56.5
+7.0 ▲10.6
▲0.5 ▲6.5
Advance development costs, others
Operating income declined due in part to the impacts of foreign exchange movements, new drug licensing costs and downward revisions to NHI drug reimbursement prices, despite the positive impact of cost reductions, including those realized through restructuring initiatives.
Analysis of changes in operating income
8
1. Outline of FY2016 Results
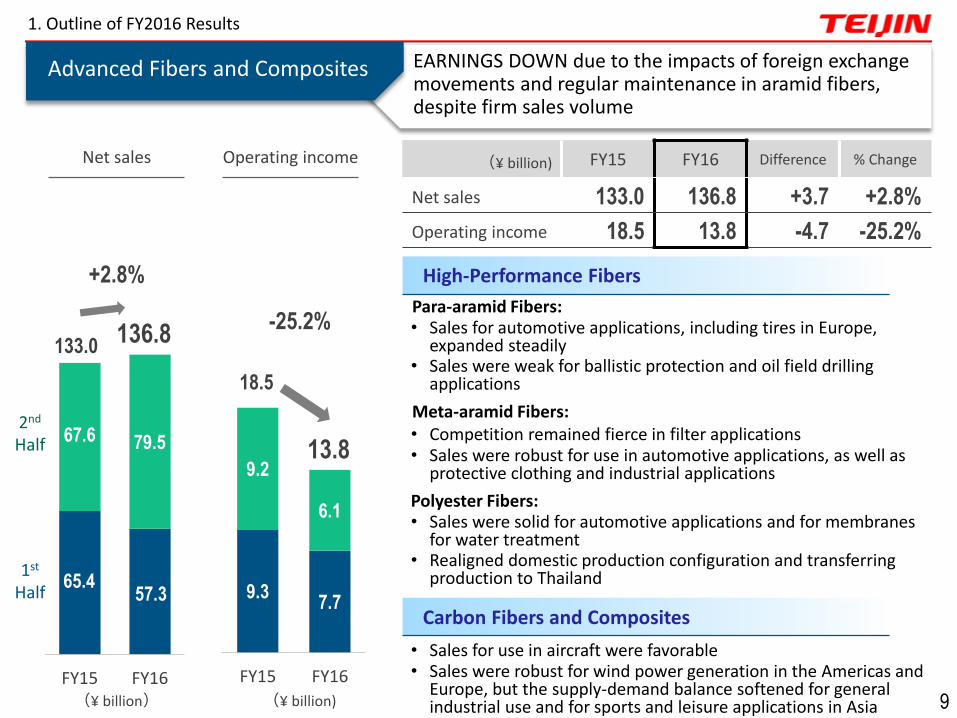
Para-aramid Fibers: • Sales for automotive applications, including tires in Europe,
expanded steadily • Sales were weak for ballistic protection and oil field drilling
applications
Meta-aramid Fibers: • Competition remained fierce in filter applications • Sales were robust for use in automotive applications, as well as
protective clothing and industrial applications
Polyester Fibers: • Sales were solid for automotive applications and for membranes
for water treatment • Realigned domestic production configuration and transferring
production to Thailand
• Sales for use in aircraft were favorable • Sales were robust for wind power generation in the Americas and
Europe, but the supply-demand balance softened for general industrial use and for sports and leisure applications in Asia
65.4 57.3
67.6 79.5
FY15 FY16
136.8 133.0
+2.8%
9.3 7.7
9.2
6.1
FY15 FY16
Advanced Fibers and Composites EARNINGS DOWN due to the impacts of foreign exchange movements and regular maintenance in aramid fibers, despite firm sales volume
-25.2%
Net sales Operating income
(¥ billion) (¥ billion)
1st Half
2nd
Half
18.5
13.8
Carbon Fibers and Composites
High-Performance Fibers
(¥ billion) FY15 FY16 Difference % Change
Net sales 133.0 136.8 +3.7 +2.8%
Operating income 18.5 13.8 -4.7 -25.2%
1. Outline of FY2016 Results
9
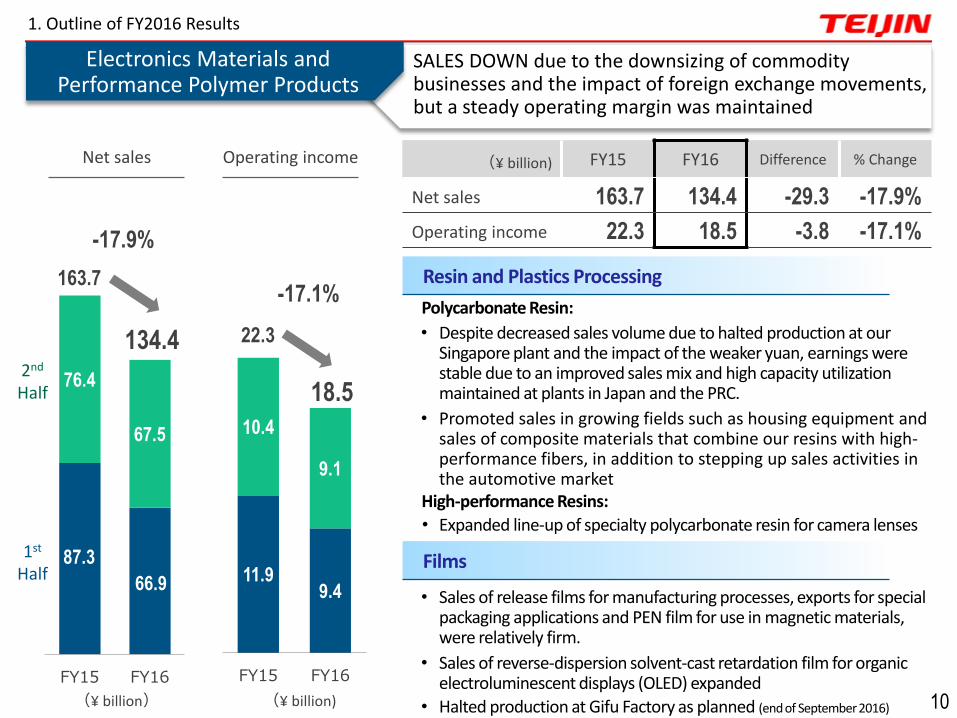
Polycarbonate Resin:
• Despite decreased sales volume due to halted production at our Singapore plant and the impact of the weaker yuan, earnings were stable due to an improved sales mix and high capacity utilization maintained at plants in Japan and the PRC.
• Promoted sales in growing fields such as housing equipment and sales of composite materials that combine our resins with high-performance fibers, in addition to stepping up sales activities in the automotive market
High-performance Resins:
• Expanded line-up of specialty polycarbonate resin for camera lenses
• Sales of release films for manufacturing processes, exports for special packaging applications and PEN film for use in magnetic materials, were relatively firm.
• Sales of reverse-dispersion solvent-cast retardation film for organic electroluminescent displays (OLED) expanded
• Halted production at Gifu Factory as planned (end of September 2016)
87.3
66.9
76.4
67.5
FY15 FY16
-17.9%
11.9 9.4
10.4
9.1
FY15 FY16
-17.1%
1st Half
2nd Half
134.4
163.7
18.5
22.3
Resin and Plastics Processing
Films
1. Outline of FY2016 Results
Electronics Materials and Performance Polymer Products
SALES DOWN due to the downsizing of commodity businesses and the impact of foreign exchange movements, but a steady operating margin was maintained
Net sales Operating income
(¥ billion) (¥ billion)
(¥ billion) FY15 FY16 Difference % Change
Net sales 163.7 134.4 -29.3 -17.9%
Operating income 22.3 18.5 -3.8 -17.1%
10
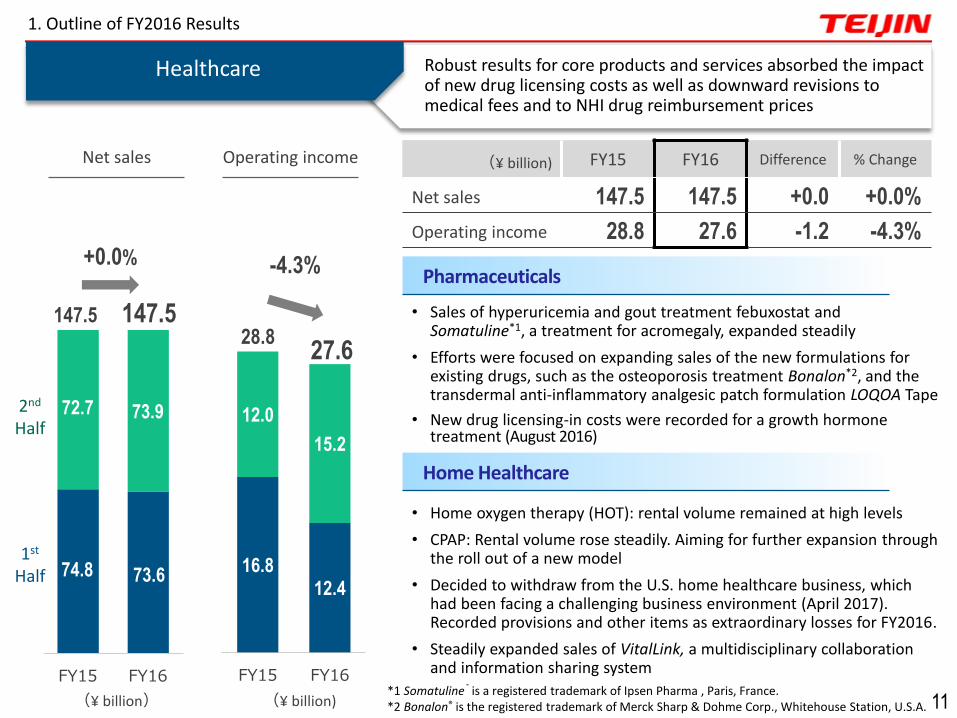
74.8 73.6
72.7 73.9
FY15 FY16
147.5 • Sales of hyperuricemia and gout treatment febuxostat and Somatuline*1, a treatment for acromegaly, expanded steadily
• Efforts were focused on expanding sales of the new formulations for existing drugs, such as the osteoporosis treatment Bonalon*2, and the transdermal anti-inflammatory analgesic patch formulation LOQOA Tape
• New drug licensing-in costs were recorded for a growth hormone treatment (August 2016)
• Home oxygen therapy (HOT): rental volume remained at high levels
• CPAP: Rental volume rose steadily. Aiming for further expansion through the roll out of a new model
• Decided to withdraw from the U.S. home healthcare business, which had been facing a challenging business environment (April 2017). Recorded provisions and other items as extraordinary losses for FY2016.
• Steadily expanded sales of VitalLink, a multidisciplinary collaboration and information sharing system
+0.0%
16.8 12.4
12.0
15.2
FY15 FY16
-4.3%
28.8 27.6
147.5
1. Outline of FY2016 Results
Robust results for core products and services absorbed the impact of new drug licensing costs as well as downward revisions to medical fees and to NHI drug reimbursement prices
*1 Somatuline® is a registered trademark of Ipsen Pharma , Paris, France. *2 Bonalon® is the registered trademark of Merck Sharp & Dohme Corp., Whitehouse Station, U.S.A. (¥ billion) (¥ billion)
1st Half
2nd
Half
Healthcare
Net sales Operating income
Pharmaceuticals
Home Healthcare
11
(¥ billion) FY15 FY16 Difference % Change
Net sales 147.5 147.5 +0.0 +0.0%
Operating income 28.8 27.6 -1.2 -4.3%
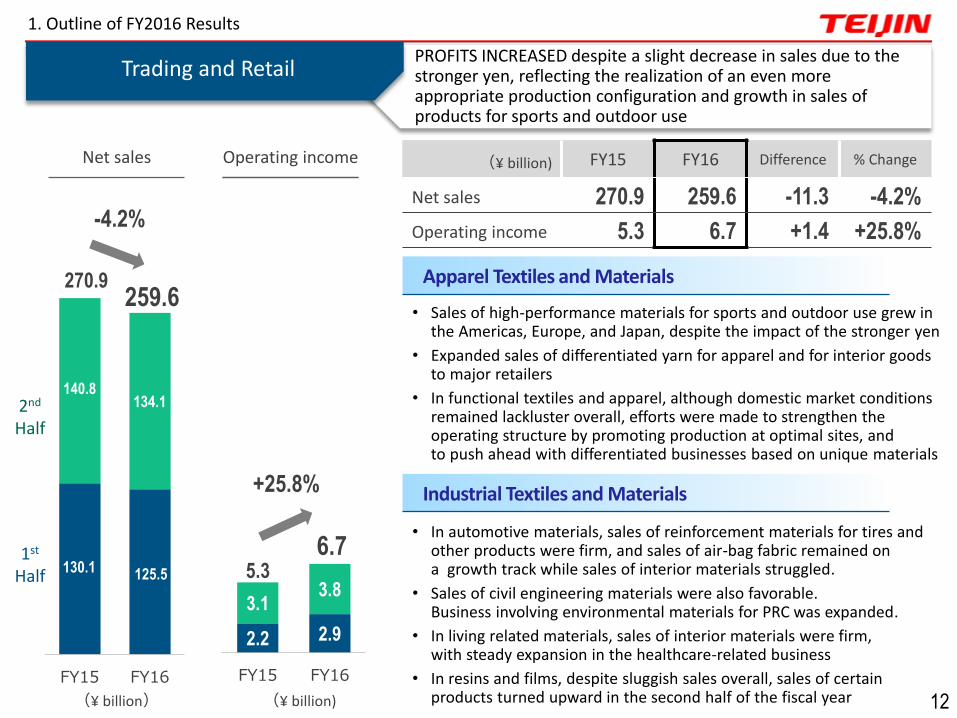
• Sales of high-performance materials for sports and outdoor use grew in the Americas, Europe, and Japan, despite the impact of the stronger yen
• Expanded sales of differentiated yarn for apparel and for interior goods to major retailers
• In functional textiles and apparel, although domestic market conditions remained lackluster overall, efforts were made to strengthen the operating structure by promoting production at optimal sites, and to push ahead with differentiated businesses based on unique materials
• In automotive materials, sales of reinforcement materials for tires and other products were firm, and sales of air-bag fabric remained on a growth track while sales of interior materials struggled.
• Sales of civil engineering materials were also favorable. Business involving environmental materials for PRC was expanded.
• In living related materials, sales of interior materials were firm, with steady expansion in the healthcare-related business
• In resins and films, despite sluggish sales overall, sales of certain products turned upward in the second half of the fiscal year
130.1 125.5
140.8 134.1
FY15 FY16
259.6 270.9
-4.2%
2.2 2.9
3.1 3.8
FY15 FY16
+25.8%
5.3 6.7
PROFITS INCREASED despite a slight decrease in sales due to the stronger yen, reflecting the realization of an even more appropriate production configuration and growth in sales of products for sports and outdoor use
(¥ billion) (¥ billion)
1st Half
2nd
Half
Trading and Retail
Net sales Operating income
Apparel Textiles and Materials
Industrial Textiles and Materials
12
(¥ billion) FY15 FY16 Difference % Change
Net sales 270.9 259.6 -11.3 -4.2%
Operating income 5.3 6.7 +1.4 +25.8%
1. Outline of FY2016 Results
・Group-wide policy ・Consolidated operating results forecasts ・Business strategies ・Invested resources and other matters
Outlook for FY2017
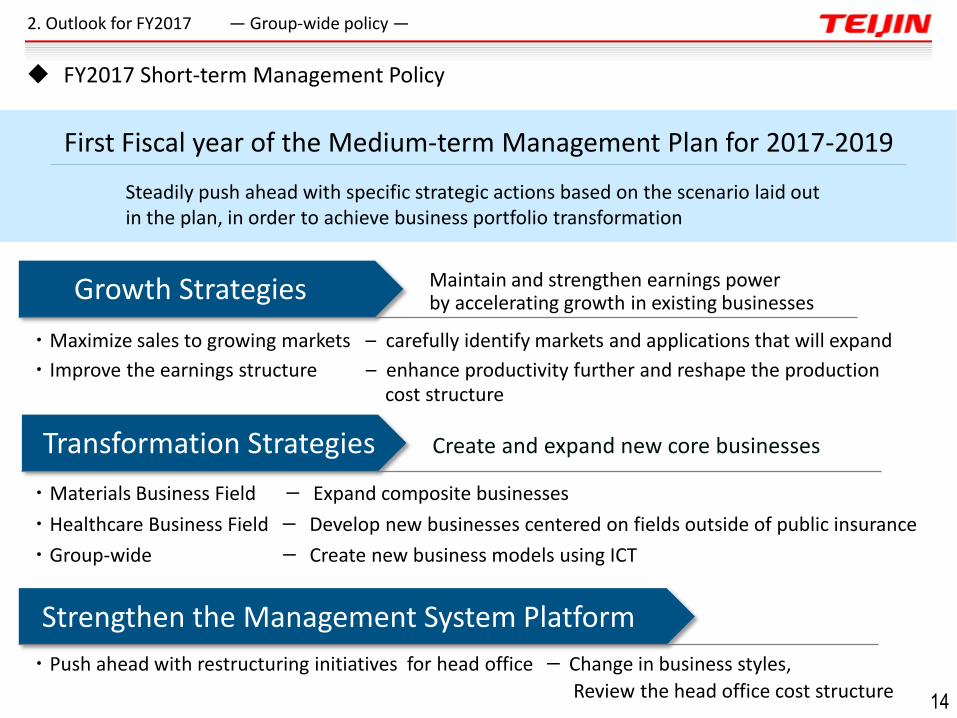
First Fiscal year of the Medium-term Management Plan for 2017-2019
Steadily push ahead with specific strategic actions based on the scenario laid out in the plan, in order to achieve business portfolio transformation
・Maximize sales to growing markets – carefully identify markets and applications that will expand
・Improve the earnings structure – enhance productivity further and reshape the production cost structure
・Push ahead with restructuring initiatives for head office - Change in business styles,
Review the head office cost structure
・Materials Business Field - Expand composite businesses
・Healthcare Business Field - Develop new businesses centered on fields outside of public insurance
・Group-wide - Create new business models using ICT
Growth Strategies
Strengthen the Management System Platform
Transformation Strategies Create and expand new core businesses
Maintain and strengthen earnings power by accelerating growth in existing businesses
2. Outlook for FY2017 ― Group-wide policy ―
FY2017 Short-term Management Policy
14
・Group-wide policy ・Consolidated operating results forecasts ・Business strategies ・Invested resources and other matters
Outlook for FY2017
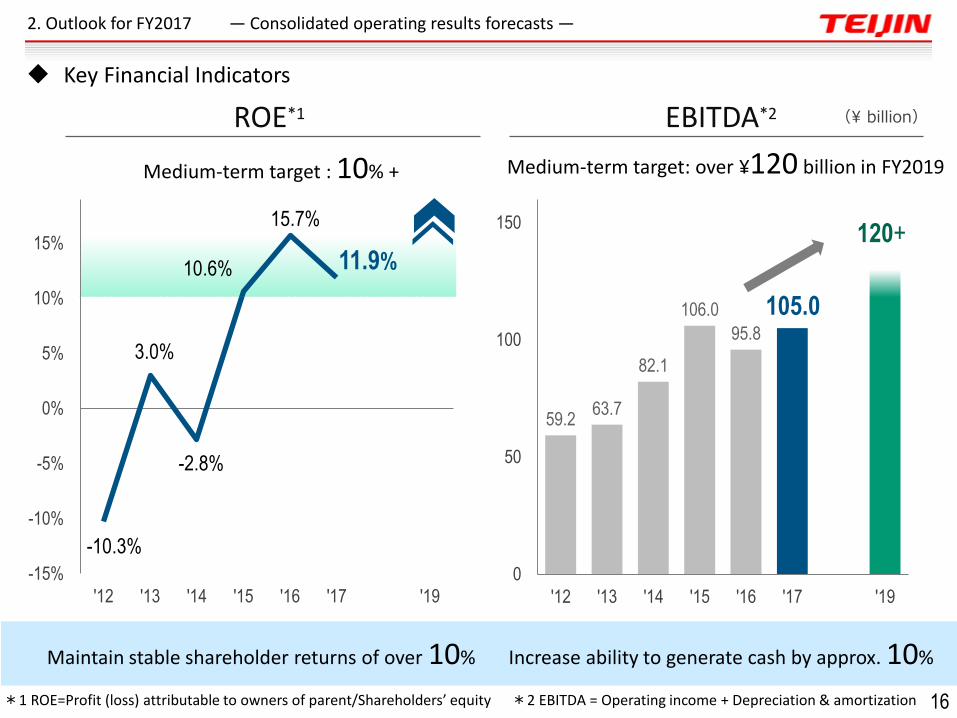
-10.3%
3.0%
-2.8%
10.6%
15.7%
11.9%
-15%
-10%
-5%
0%
5%
10%
15%
'12 '13 '14 '15 '16 '17 . '19
59.2 63.7
82.1
106.0
95.8
105.0
0
50
100
150
'12 '13 '14 '15 '16 '17 . '19
Medium-term target : 10% + Medium-term target: over ¥120 billion in FY2019
Maintain stable shareholder returns of over 10% Increase ability to generate cash by approx. 10%
120+
*2 EBITDA = Operating income + Depreciation & amortization *1 ROE=Profit (loss) attributable to owners of parent/Shareholders’ equity
2. Outlook for FY2017 ― Consolidated operating results forecasts ―
ROE*1 EBITDA*2 (¥ billion)
16
Key Financial Indicators
17
FY16 FY17
Outlook
Average exchange rate
JPY per USD 108 110
JPY per EUR 119 116
Dubai crude oil price
USD per barrel 47 55
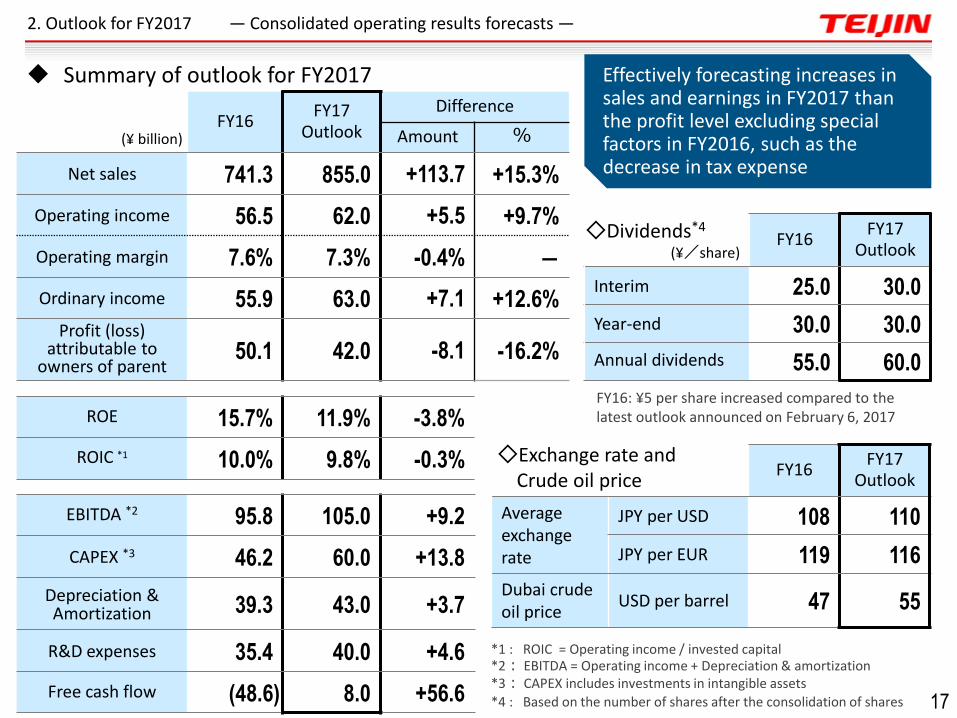
(¥ billion) FY16
FY17 Outlook
Difference
Amount %
Net sales 741.3 855.0 +113.7 +15.3%
Operating income 56.5 62.0 +5.5 +9.7%
Operating margin 7.6% 7.3% -0.4% ―
Ordinary income 55.9 63.0 +7.1 +12.6%
Profit (loss) attributable to
owners of parent 50.1 42.0 -8.1 -16.2%
ROE 15.7% 11.9% -3.8%
ROIC *1 10.0% 9.8% -0.3%
EBITDA *2 95.8 105.0 +9.2
CAPEX *3 46.2 60.0 +13.8
Depreciation & Amortization 39.3 43.0 +3.7
R&D expenses 35.4 40.0 +4.6
Free cash flow (48.6) 8.0 +56.6
*1 : ROIC = Operating income / invested capital *2: EBITDA = Operating income + Depreciation & amortization *3: CAPEX includes investments in intangible assets
*4 : Based on the number of shares after the consolidation of shares
◇Exchange rate and Crude oil price
Effectively forecasting increases in sales and earnings in FY2017 than the profit level excluding special factors in FY2016, such as the decrease in tax expense
(¥/share) FY16
FY17 Outlook
Interim 25.0 30.0
Year-end 30.0 30.0
Annual dividends 55.0 60.0
◇Dividends*4
2. Outlook for FY2017 ― Consolidated operating results forecasts ―
FY16: ¥5 per share increased compared to the latest outlook announced on February 6, 2017
Summary of outlook for FY2017
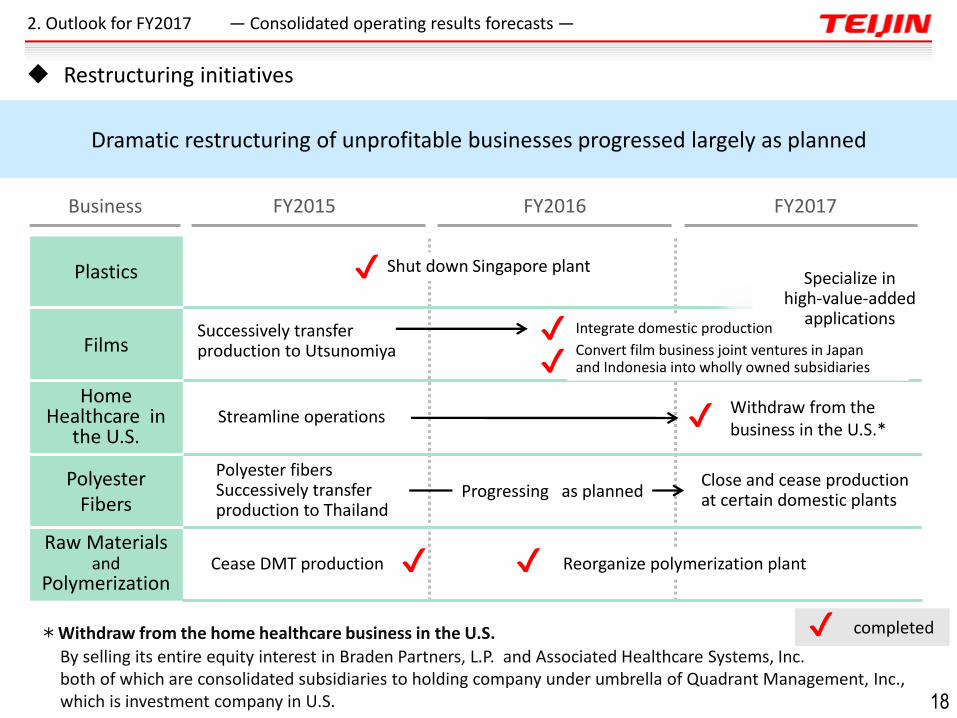
*Withdraw from the home healthcare business in the U.S.
By selling its entire equity interest in Braden Partners, L.P. and Associated Healthcare Systems, Inc. both of which are consolidated subsidiaries to holding company under umbrella of Quadrant Management, Inc., which is investment company in U.S.
2015 2016
Plastics
Films
Home Healthcare in
the U.S.
Polyester Fibers
Raw Materials and
Polymerization
Shut down Singapore plant
Streamline operations
Cease DMT production
Close and cease production at certain domestic plants
Reorganize polymerization plant
Convert film business joint ventures in Japan and Indonesia into wholly owned subsidiaries
✔
Polyester fibers Successively transfer production to Thailand
Withdraw from the business in the U.S.*
Successively transfer production to Utsunomiya
completed
Progressing as planned
Dramatic restructuring of unprofitable businesses progressed largely as planned
FY2015 FY2016 FY2017
✔
✔
✔
✔
✔
2. Outlook for FY2017 ― Consolidated operating results forecasts ―
Business
✔
18
Restructuring initiatives
Specialize in high-value-added
applications Integrate domestic production
( )
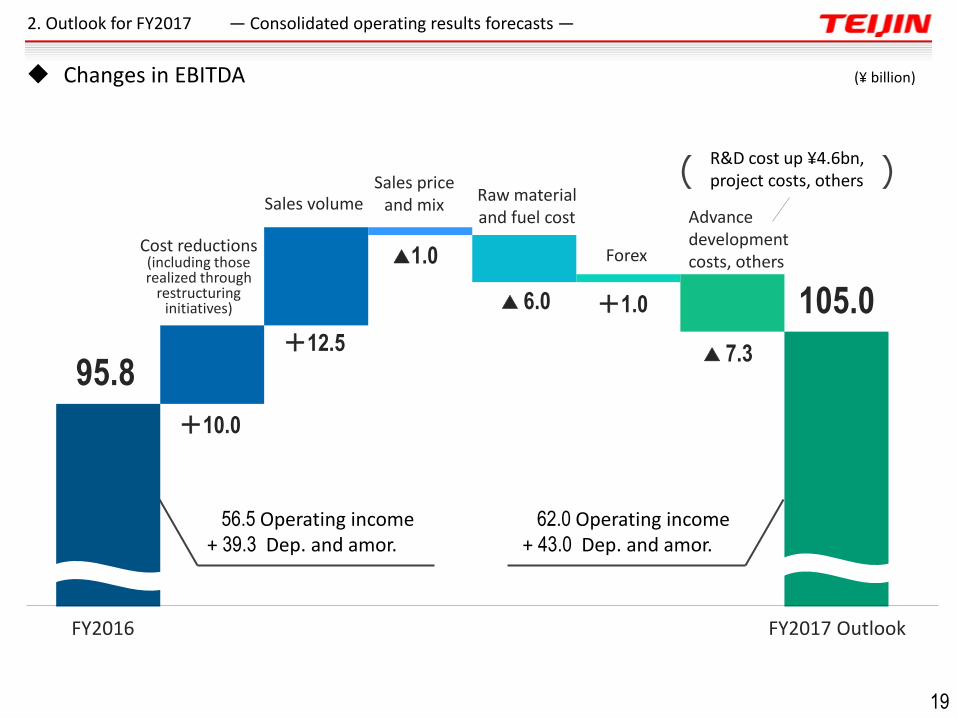
FY2016 FY2017 Outlook
95.8
+10.0
Sales volume
R&D cost up ¥4.6bn, project costs, others
Cost reductions (including those realized through
restructuring initiatives)
Forex
Sales price and mix
Raw material and fuel cost
+12.5
▲1.0
▲ 6.0
▲ 7.3
+1.0 105.0
56.5 Operating income + 39.3 Dep. and amor.
Advance development costs, others
2. Outlook for FY2017 ― Consolidated operating results forecasts ―
19
Changes in EBITDA (¥ billion)
62.0 Operating income + 43.0 Dep. and amor.
・Group-wide policy ・Consolidated operating results forecasts ・Business strategies ・Invested resources and other matters
Outlook for FY2017
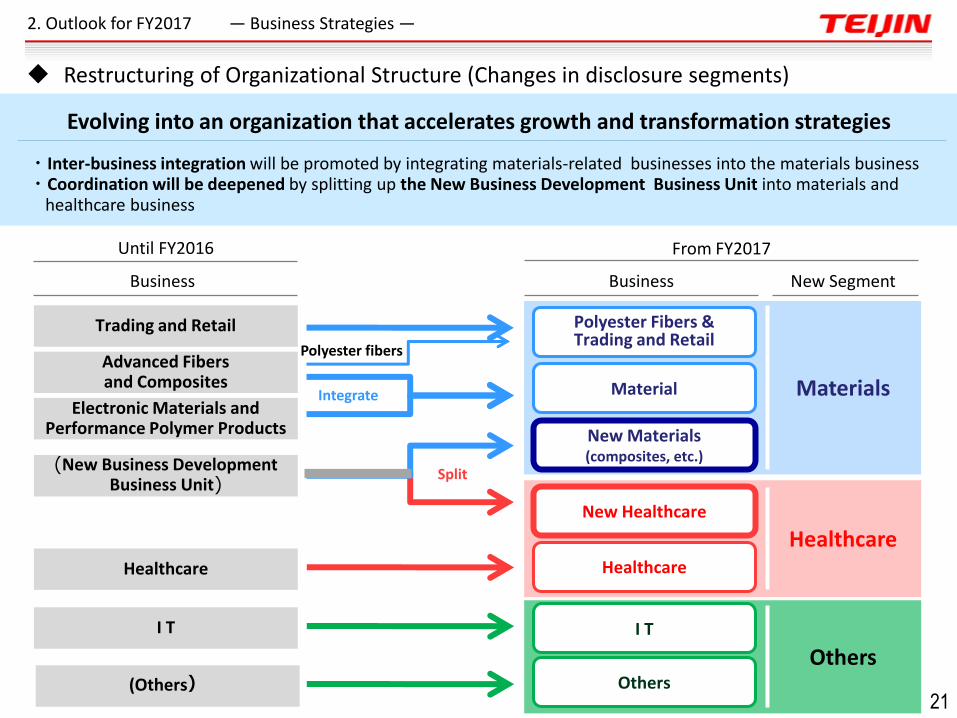
・Inter-business integration will be promoted by integrating materials-related businesses into the materials business ・Coordination will be deepened by splitting up the New Business Development Business Unit into materials and healthcare business
New Segment
Advanced Fibers and Composites
Electronic Materials and Performance Polymer Products
Healthcare
Trading and Retail
Material
Polyester Fibers & Trading and Retail
New Materials (composites, etc.)
Healthcare
New Healthcare
(New Business Development Business Unit)
I T I T
Others
Until FY2016 From FY2017
Split
Integrate
Polyester fibers
Materials
Healthcare
Evolving into an organization that accelerates growth and transformation strategies
(Others) Others
Business
2. Outlook for FY2017 ― Business Strategies ―
Restructuring of Organizational Structure (Changes in disclosure segments)
21
Business
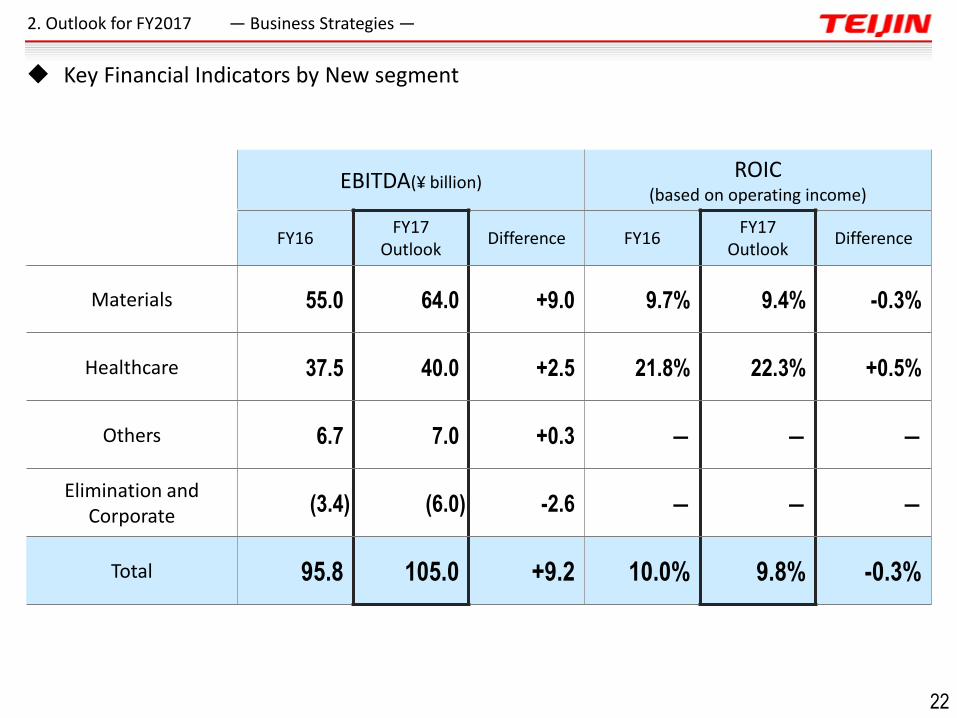
EBITDA(¥ billion) ROIC
(based on operating income)
FY16 FY17
Outlook Difference FY16
FY17 Outlook
Difference
Materials 55.0 64.0 +9.0 9.7% 9.4% -0.3%
Healthcare 37.5 40.0 +2.5 21.8% 22.3% +0.5%
Others 6.7 7.0 +0.3 ― ― ―
Elimination and Corporate
(3.4) (6.0) -2.6 ― ― ―
Total 95.8 105.0 +9.2 10.0% 9.8% -0.3%
2. Outlook for FY2017 ― Business Strategies ―
Key Financial Indicators by New segment
22
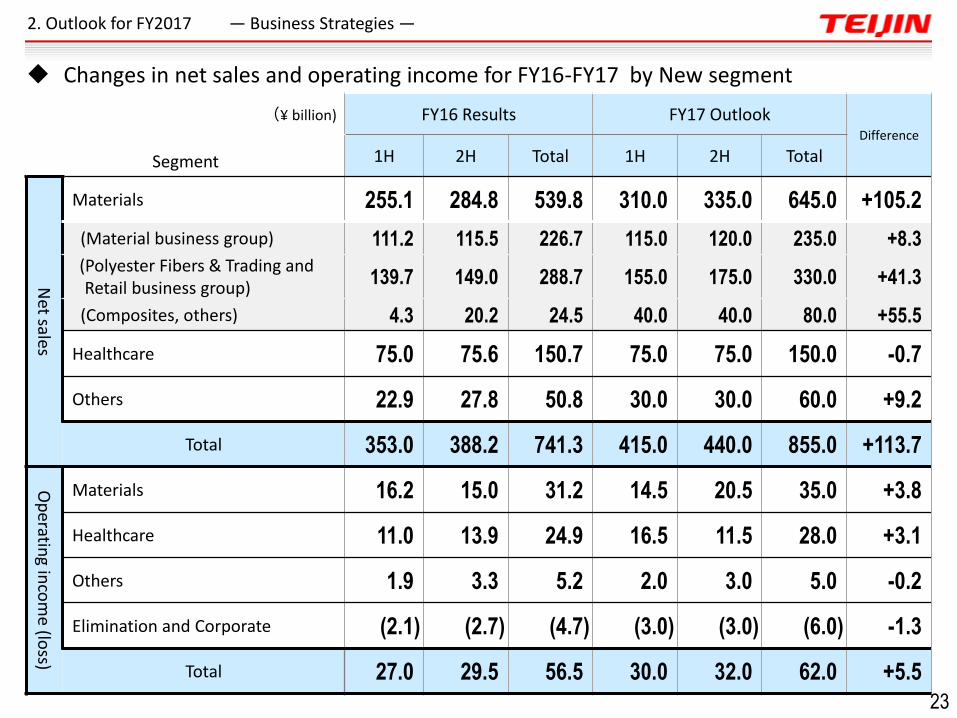
FY16 Results FY17 Outlook Difference
Segment 1H 2H Total 1H 2H Total
Net sales
Materials 255.1 284.8 539.8 310.0 335.0 645.0 +105.2
(Material business group) 111.2 115.5 226.7 115.0 120.0 235.0 +8.3
(Polyester Fibers & Trading and Retail business group)
139.7 149.0 288.7 155.0 175.0 330.0 +41.3
(Composites, others) 4.3 20.2 24.5 40.0 40.0 80.0 +55.5
Healthcare 75.0 75.6 150.7 75.0 75.0 150.0 -0.7
Others 22.9 27.8 50.8 30.0 30.0 60.0 +9.2
Total 353.0 388.2 741.3 415.0 440.0 855.0 +113.7
Op
erating in
com
e (loss)
Materials 16.2 15.0 31.2 14.5 20.5 35.0 +3.8
Healthcare 11.0 13.9 24.9 16.5 11.5 28.0 +3.1
Others 1.9 3.3 5.2 2.0 3.0 5.0 -0.2
Elimination and Corporate (2.1) (2.7) (4.7) (3.0) (3.0) (6.0) -1.3
Total 27.0 29.5 56.5 30.0 32.0 62.0 +5.5
(¥ billion)
2. Outlook for FY2017 ― Business Strategies ―
Changes in net sales and operating income for FY16-FY17 by New segment
23
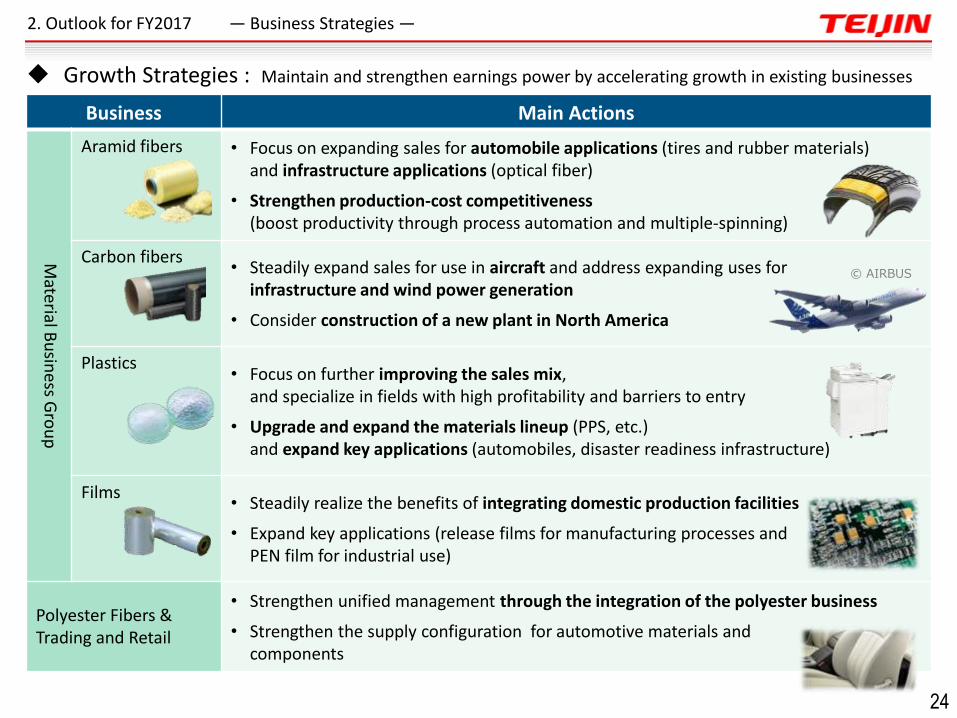
Business Main Actions
Material B
usin
ess Gro
up
Aramid fibers • Focus on expanding sales for automobile applications (tires and rubber materials) and infrastructure applications (optical fiber)
• Strengthen production-cost competitiveness (boost productivity through process automation and multiple-spinning)
Carbon fibers • Steadily expand sales for use in aircraft and address expanding uses for
infrastructure and wind power generation
• Consider construction of a new plant in North America
Plastics • Focus on further improving the sales mix,
and specialize in fields with high profitability and barriers to entry
• Upgrade and expand the materials lineup (PPS, etc.) and expand key applications (automobiles, disaster readiness infrastructure)
Films • Steadily realize the benefits of integrating domestic production facilities
• Expand key applications (release films for manufacturing processes and PEN film for industrial use)
Polyester Fibers & Trading and Retail
• Strengthen unified management through the integration of the polyester business
• Strengthen the supply configuration for automotive materials and components
2. Outlook for FY2017 ― Business Strategies ―
© AIRBUS
Growth Strategies : Maintain and strengthen earnings power by accelerating growth in existing businesses
24
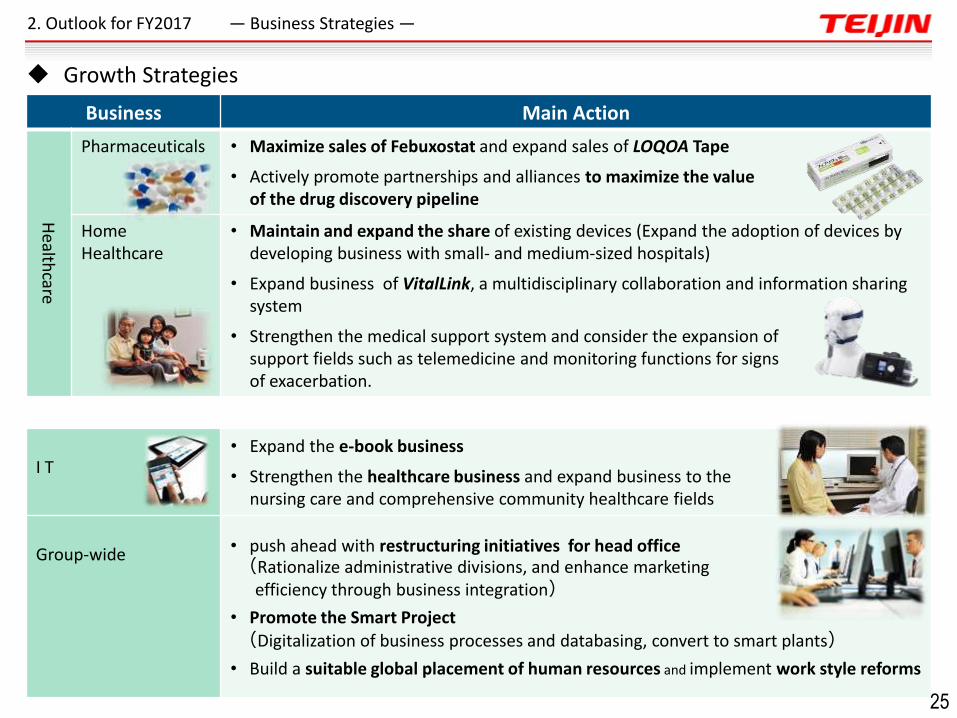
Business Main Action
Health
care
Pharmaceuticals • Maximize sales of Febuxostat and expand sales of LOQOA Tape
• Actively promote partnerships and alliances to maximize the value of the drug discovery pipeline
Home Healthcare
• Maintain and expand the share of existing devices (Expand the adoption of devices by developing business with small- and medium-sized hospitals)
• Expand business of VitalLink, a multidisciplinary collaboration and information sharing system
• Strengthen the medical support system and consider the expansion of support fields such as telemedicine and monitoring functions for signs of exacerbation.
I T
• Expand the e-book business
• Strengthen the healthcare business and expand business to the nursing care and comprehensive community healthcare fields
Group-wide • push ahead with restructuring initiatives for head office
(Rationalize administrative divisions, and enhance marketing efficiency through business integration)
• Promote the Smart Project (Digitalization of business processes and databasing, convert to smart plants)
• Build a suitable global placement of human resources and implement work style reforms
2. Outlook for FY2017 ― Business Strategies ―
Growth Strategies
25
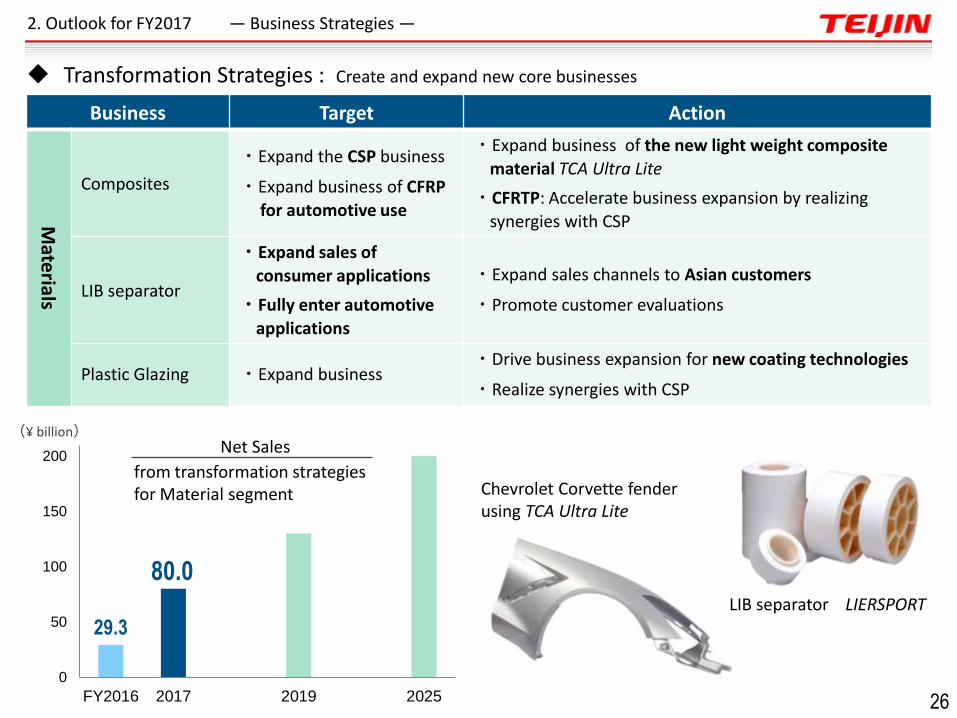
Business Target Action
Mate
rials
Composites
・Expand the CSP business
・Expand business of CFRP
for automotive use
・Expand business of the new light weight composite
material TCA Ultra Lite
・CFRTP: Accelerate business expansion by realizing
synergies with CSP
LIB separator
・Expand sales of
consumer applications
・Fully enter automotive
applications
・Expand sales channels to Asian customers
・Promote customer evaluations
Plastic Glazing ・Expand business ・Drive business expansion for new coating technologies
・Realize synergies with CSP
29.3
80.0
0
50
100
150
200
FY2016 2017 2019 2025
Chevrolet Corvette fender using TCA Ultra Lite
LIB separator LIERSPORT
(¥ billion)
2. Outlook for FY2017 ― Business Strategies ―
Net Sales
from transformation strategies for Material segment
Transformation Strategies : Create and expand new core businesses
26
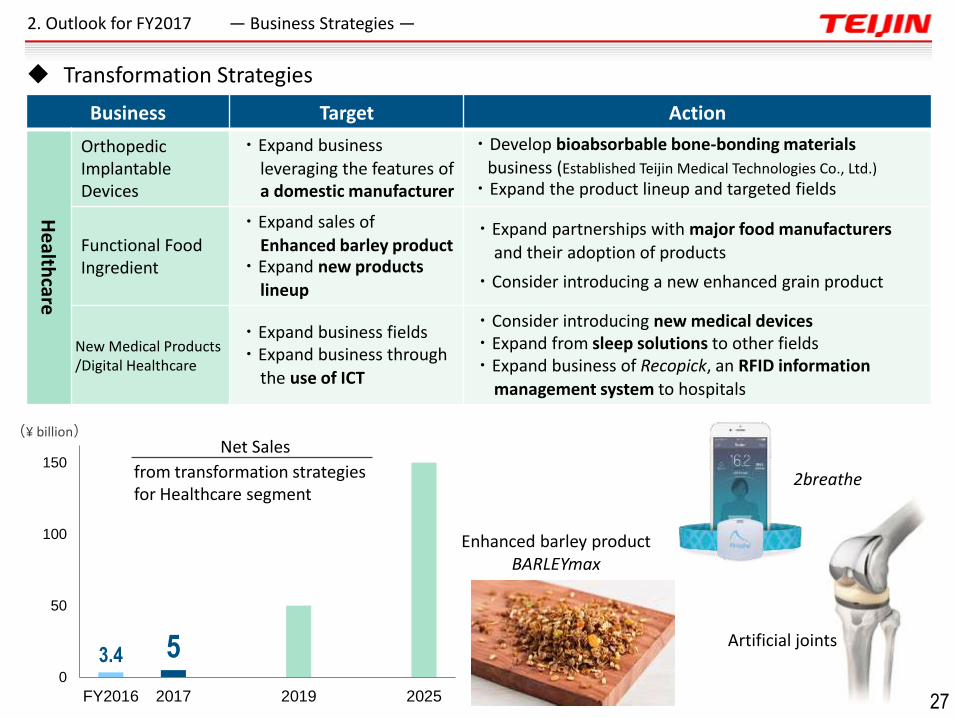
3.4 5 0
50
100
150
FY2016 2017 2019 2025
Enhanced barley product BARLEYmax
Artificial joints
Business Target Action
He
althcare
Orthopedic Implantable Devices
・Expand business
leveraging the features of a domestic manufacturer
・Develop bioabsorbable bone-bonding materials
business (Established Teijin Medical Technologies Co., Ltd.)
・Expand the product lineup and targeted fields
Functional Food Ingredient
・Expand sales of
Enhanced barley product ・Expand new products
lineup
・Expand partnerships with major food manufacturers
and their adoption of products
・Consider introducing a new enhanced grain product
New Medical Products /Digital Healthcare
・Expand business fields ・Expand business through
the use of ICT
・Consider introducing new medical devices ・Expand from sleep solutions to other fields ・Expand business of Recopick, an RFID information
management system to hospitals
2breathe
2. Outlook for FY2017 ― Business Strategies ―
(¥ billion)
Transformation Strategies
27
Net Sales
from transformation strategies for Healthcare segment
・Group-wide policy ・Consolidated operating results forecasts ・Business strategies ・Invested resources and other matters
Outlook for FY2017
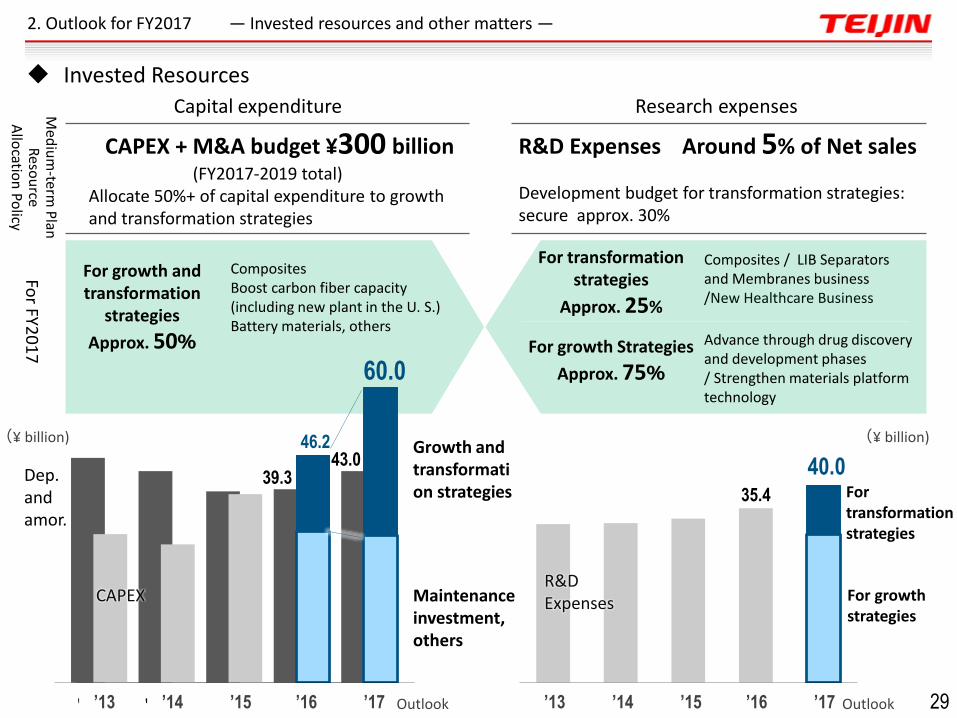
39.3 43.0
'13 '14 '15 '16 '17
R&D Expenses Around 5% of Net sales
Development budget for transformation strategies: secure approx. 30%
'13 '14 '15 '16 '17
35.4
'13 '14 '15 '16 '17
Capital expenditure Research expenses
(¥ billion)
For growth and transformation
strategies
Approx. 50%
Maintenance investment, others
Composites Boost carbon fiber capacity (including new plant in the U. S.) Battery materials, others
46.2
60.0
Growth and transformation strategies
40.0
For transformation strategies
Approx. 25%
For growth Strategies
Approx. 75%
Composites / LIB Separators and Membranes business /New Healthcare Business
Advance through drug discovery and development phases / Strengthen materials platform technology
For growth strategies
For transformation strategies
CAPEX + M&A budget ¥300 billion (FY2017-2019 total)
Allocate 50%+ of capital expenditure to growth and transformation strategies
CAPEX
Dep. and amor.
R&D Expenses
’13 ’14 ’15 ’16 ’17 ’13 ’14 ’15 ’16 ’17 Outlook Outlook
For FY2
01
7
(¥ billion)
Med
ium
-term P
lan
Reso
urce
Allo
cation
Policy
2. Outlook for FY2017 ― Invested resources and other matters ―
Invested Resources
29
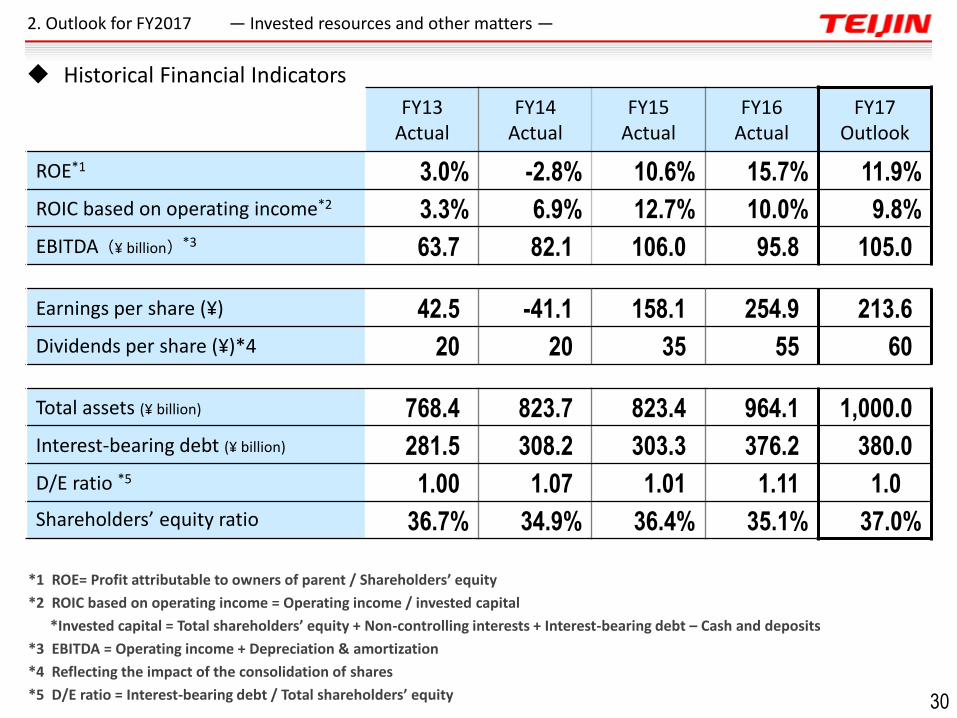
FY13 Actual
FY14 Actual
FY15 Actual
FY16 Actual
FY17 Outlook
ROE*1 3.0% -2.8% 10.6% 15.7% 11.9%
ROIC based on operating income*2 3.3% 6.9% 12.7% 10.0% 9.8%
EBITDA(¥ billion)*3 63.7 82.1 106.0 95.8 105.0
Earnings per share (¥) 42.5 -41.1 158.1 254.9 213.6
Dividends per share (¥)*4 20 20 35 55 60
Total assets (¥ billion) 768.4 823.7 823.4 964.1 1,000.0
Interest-bearing debt (¥ billion) 281.5 308.2 303.3 376.2 380.0
D/E ratio *5 1.00 1.07 1.01 1.11 1.0
Shareholders’ equity ratio 36.7% 34.9% 36.4% 35.1% 37.0%
*1 ROE= Profit attributable to owners of parent / Shareholders’ equity
*2 ROIC based on operating income = Operating income / invested capital
*Invested capital = Total shareholders’ equity + Non-controlling interests + Interest-bearing debt – Cash and deposits
*3 EBITDA = Operating income + Depreciation & amortization
*4 Reflecting the impact of the consolidation of shares
*5 D/E ratio = Interest-bearing debt / Total shareholders’ equity
2. Outlook for FY2017 ― Invested resources and other matters ―
Historical Financial Indicators
30
Disclaimer
Any statements in this document, other than those of historical fact, are forward-looking statements about the future performance of Teijin and its Group companies, which are based on management’s assumptions and beliefs in light of information currently available, and involve risks and uncertainties. Actual results may differ materially from these forecasts.
Business Risks
The Teijin Group recognizes certain risks as having the potential to affect its operating results and/or financial position. As of the date of this document, these risks included, but were not limited to, the risks listed below.
(1) Market-related risk The Teijin Group manufactures and sells products, the sales of which may be affected by market conditions, competition with other companies and price fluctuations arising thereof, as well as fluctuations in raw materials prices and fuel costs, and such market factors as fluctuations in foreign exchange and interest rates.
(2) Product quality risk The Teijin Group has established a dedicated division that is charged with product quality and reliability assurance for all Group businesses. However, product and service defects arising from quality issues have the potential to negatively affect, among others, the Group’s operating results, financial position and public reputation.
(3) R&D-related risk The Teijin Group actively allocates management resources to R&D efforts. R&D in the pharmaceuticals business, in particular, is characterized by significant investments of funds and time. Pharmaceuticals discovery research has a high incidence of failure to discover promising drugs. There are also risks that plans to apply for regulatory approval may be abandoned or that approval may be rescinded.
(4) Risks related to overseas operations The Teijin Group has operations overseas. These operations are vulnerable to the impact of fluctuations in foreign exchange rates, as well as enforcement of new or unexpected changes to existing laws, regulations or tax systems that exert an adverse impact on the Group; economic fluctuations; or social unrest triggered by acts of terror or war.
(5) Risks related to accidents and disasters In the event of a major natural disaster or unforeseen accident that results in damage to the Teijin Group’s production facilities or significantly impedes the Group’s supply chain, such developments may have a negative impact on the Group’s operating results and/or financial position.
Disclaimer Regarding Forward-Looking Statements and Business Risks
Italicized product and service names are trademarks or registered trademarks of the Teijin Group in Japan and/or other countries. Where noted, other italicized product and service names used in this document are protected as the trademarks and/or trade names of other companies.
This material is based on the consolidated results for FY2016 announced at 11:30 A.M. on May 9, 2017 (local time in Japan).
31
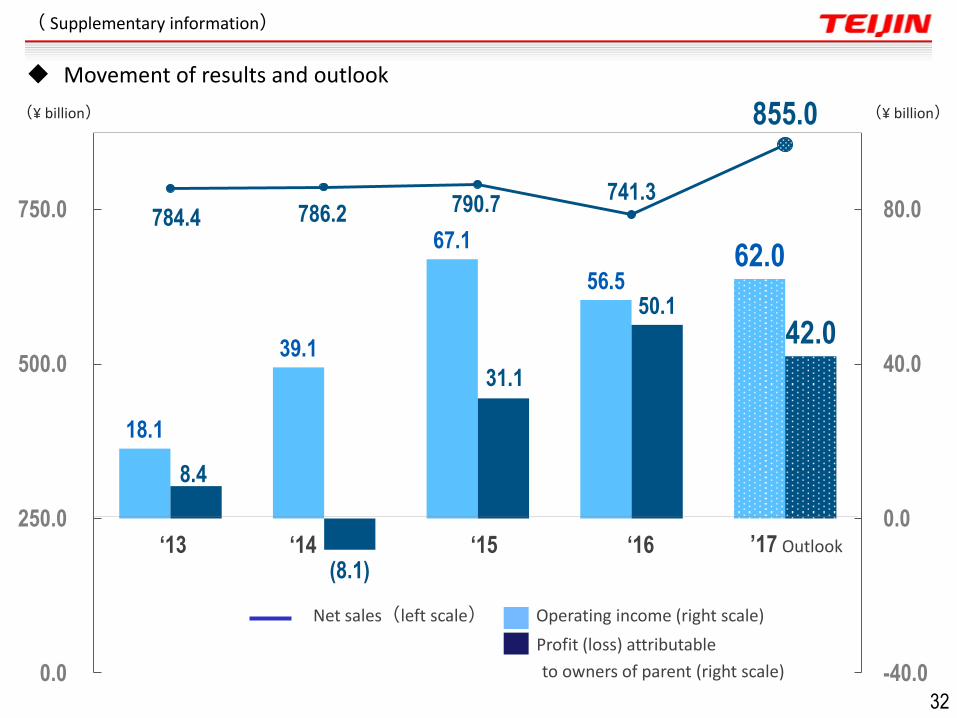
18.1
39.1
67.1
56.5 62.0
8.4
(8.1)
31.1
50.1
42.0
784.4 786.2 790.7 741.3
855.0
-40.0
0.0
40.0
80.0
0.0
250.0
500.0
750.0
(¥ billion)
‘13 ‘14 ‘15
Net sales(left scale) Operating income (right scale)
Profit (loss) attributable
to owners of parent (right scale)
(¥ billion)
’17 Outlook ‘16
Movement of results and outlook
( Supplementary information)
32
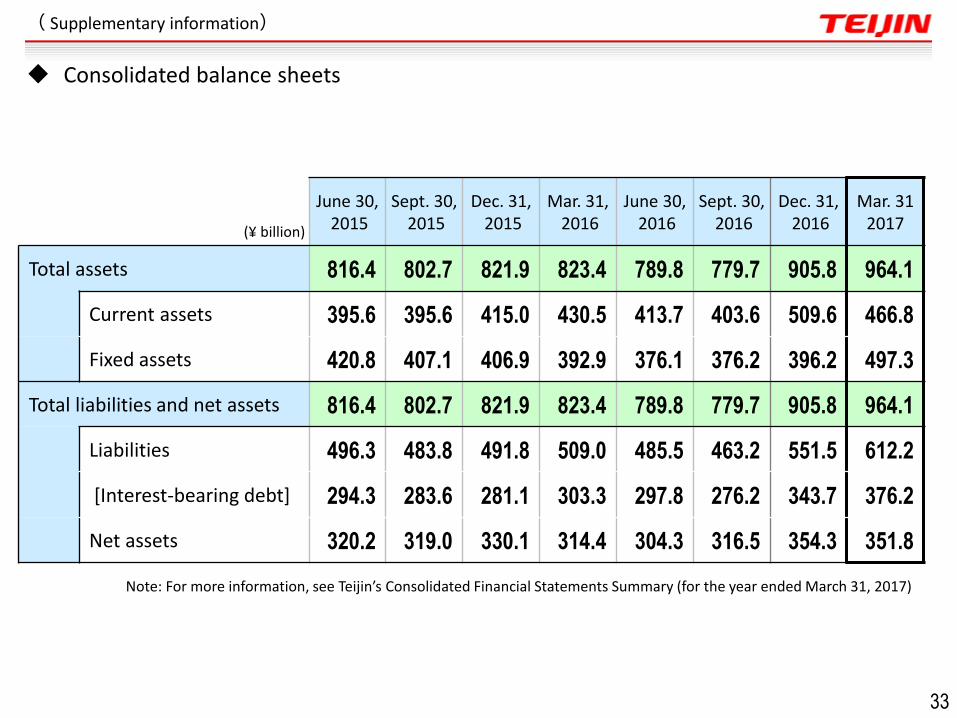
June 30, 2015
Sept. 30, 2015
Dec. 31, 2015
Mar. 31, 2016
June 30, 2016
Sept. 30, 2016
Dec. 31, 2016
Mar. 31 2017 (¥ billion)
Total assets 816.4 802.7 821.9 823.4 789.8 779.7 905.8 964.1
Current assets 395.6 395.6 415.0 430.5 413.7 403.6 509.6 466.8
Fixed assets 420.8 407.1 406.9 392.9 376.1 376.2 396.2 497.3
Total liabilities and net assets 816.4 802.7 821.9 823.4 789.8 779.7 905.8 964.1
Liabilities 496.3 483.8 491.8 509.0 485.5 463.2 551.5 612.2
[Interest-bearing debt] 294.3 283.6 281.1 303.3 297.8 276.2 343.7 376.2
Net assets 320.2 319.0 330.1 314.4 304.3 316.5 354.3 351.8
Note: For more information, see Teijin’s Consolidated Financial Statements Summary (for the year ended March 31, 2017)
Consolidated balance sheets
( Supplementary information)
33
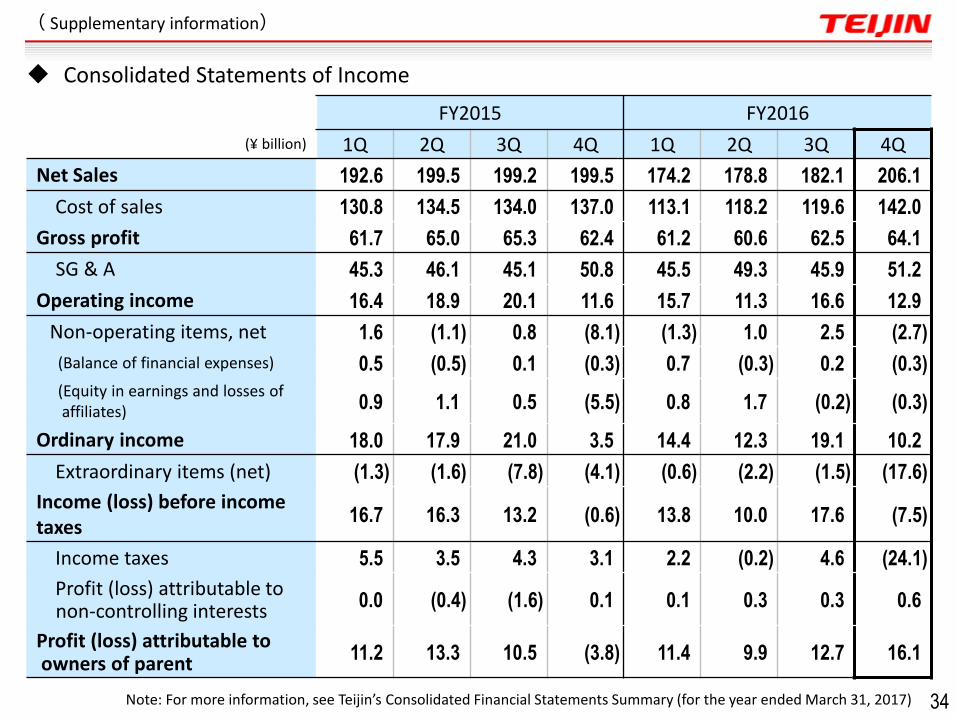
FY2015 FY2016
(¥ billion) 1Q 2Q 3Q 4Q 1Q 2Q 3Q 4Q
Net Sales 192.6 199.5 199.2 199.5 174.2 178.8 182.1 206.1
Cost of sales 130.8 134.5 134.0 137.0 113.1 118.2 119.6 142.0
Gross profit 61.7 65.0 65.3 62.4 61.2 60.6 62.5 64.1
SG & A 45.3 46.1 45.1 50.8 45.5 49.3 45.9 51.2
Operating income 16.4 18.9 20.1 11.6 15.7 11.3 16.6 12.9
Non-operating items, net 1.6 (1.1) 0.8 (8.1) (1.3) 1.0 2.5 (2.7)
(Balance of financial expenses) 0.5 (0.5) 0.1 (0.3) 0.7 (0.3) 0.2 (0.3)
(Equity in earnings and losses of affiliates) 0.9 1.1 0.5 (5.5) 0.8 1.7 (0.2) (0.3)
Ordinary income 18.0 17.9 21.0 3.5 14.4 12.3 19.1 10.2
Extraordinary items (net) (1.3) (1.6) (7.8) (4.1) (0.6) (2.2) (1.5) (17.6)
Income (loss) before income taxes
16.7 16.3 13.2 (0.6) 13.8 10.0 17.6 (7.5)
Income taxes 5.5 3.5 4.3 3.1 2.2 (0.2) 4.6 (24.1)
Profit (loss) attributable to non-controlling interests 0.0 (0.4) (1.6) 0.1 0.1 0.3 0.3 0.6
Profit (loss) attributable to owners of parent 11.2 13.3 10.5 (3.8) 11.4 9.9 12.7 16.1
Note: For more information, see Teijin’s Consolidated Financial Statements Summary (for the year ended March 31, 2017)
Consolidated Statements of Income
( Supplementary information)
34
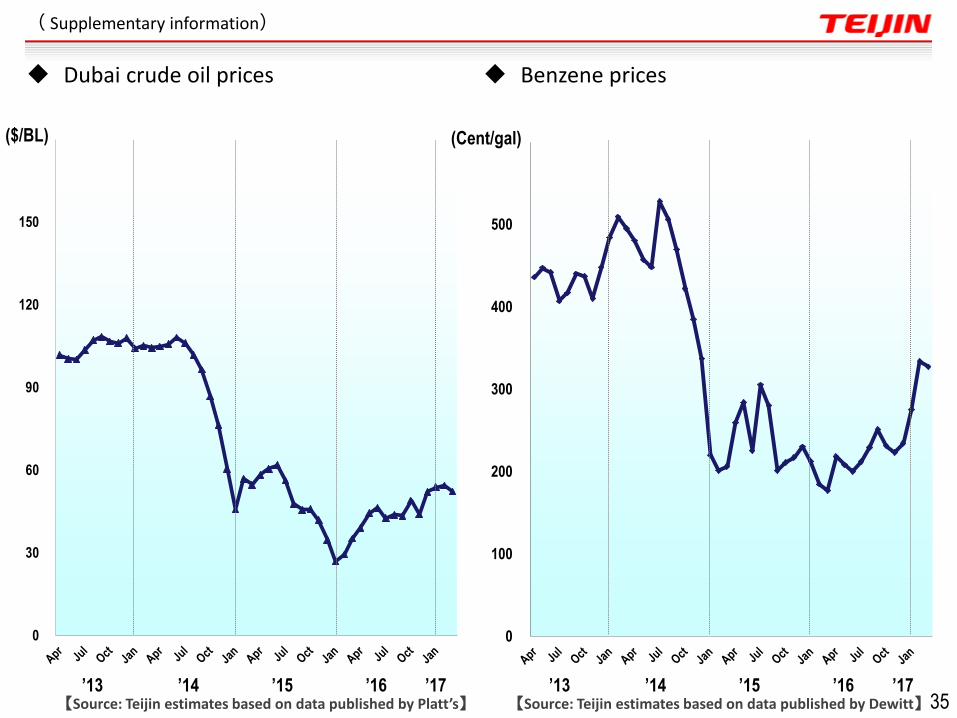
0
100
200
300
400
500
600
0
30
60
90
120
150
180
’13 ’14 ’15 ’16 ’17 ’13 ’14 ’15 ’16 ’17
(Cent/gal) ($/BL)
【Source: Teijin estimates based on data published by Platt’s】 【Source: Teijin estimates based on data published by Dewitt】
Dubai crude oil prices
( Supplementary information)
Benzene prices
35
1
1.05
1.1
1.15
1.2
1.25
1.3
1.35
1.4
1.45
50
60
70
80
90
100
110
120
130
140
150
160
170
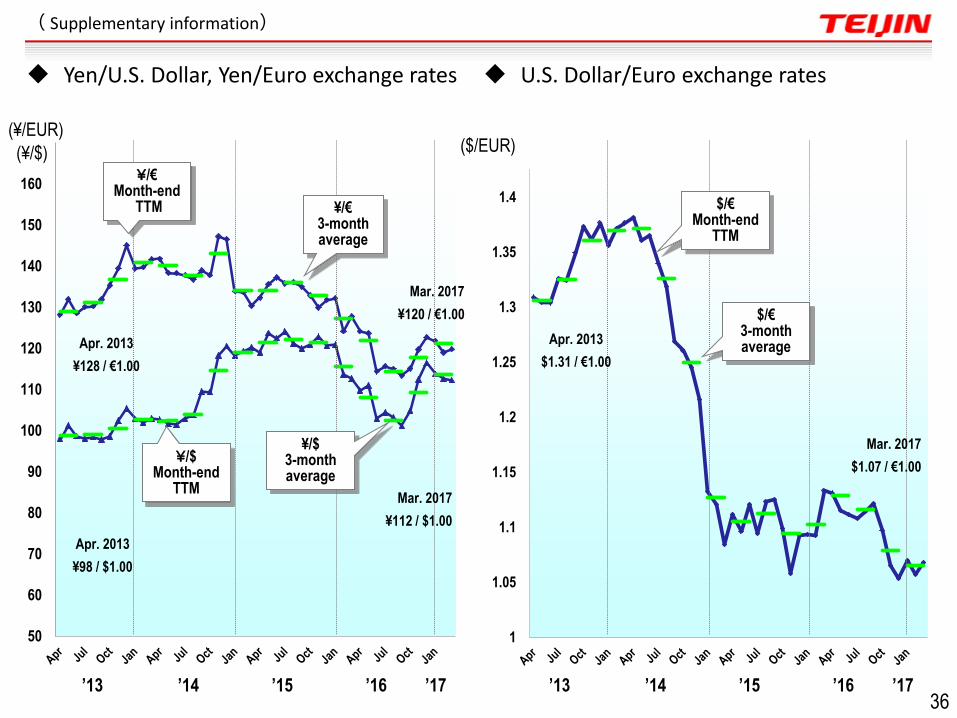
’13 ’14 ’15 ’16 ’17 ’13 ’14 ’15 ’16 ’17
(¥/$)
(¥/EUR) ($/EUR)
Apr. 2013
¥98 / $1.00
Apr. 2013
¥128 / €1.00
Mar. 2017
¥112 / $1.00
Mar. 2017
¥120 / €1.00
¥/€ 3-month average
¥/€ Month-end
TTM
¥/$ Month-end
TTM
¥/$ 3-month average
$/€ Month-end
TTM
$/€ 3-month average
Apr. 2013
$1.31 / €1.00
Mar. 2017
$1.07 / €1.00
Yen/U.S. Dollar, Yen/Euro exchange rates
( Supplementary information)
U.S. Dollar/Euro exchange rates
36
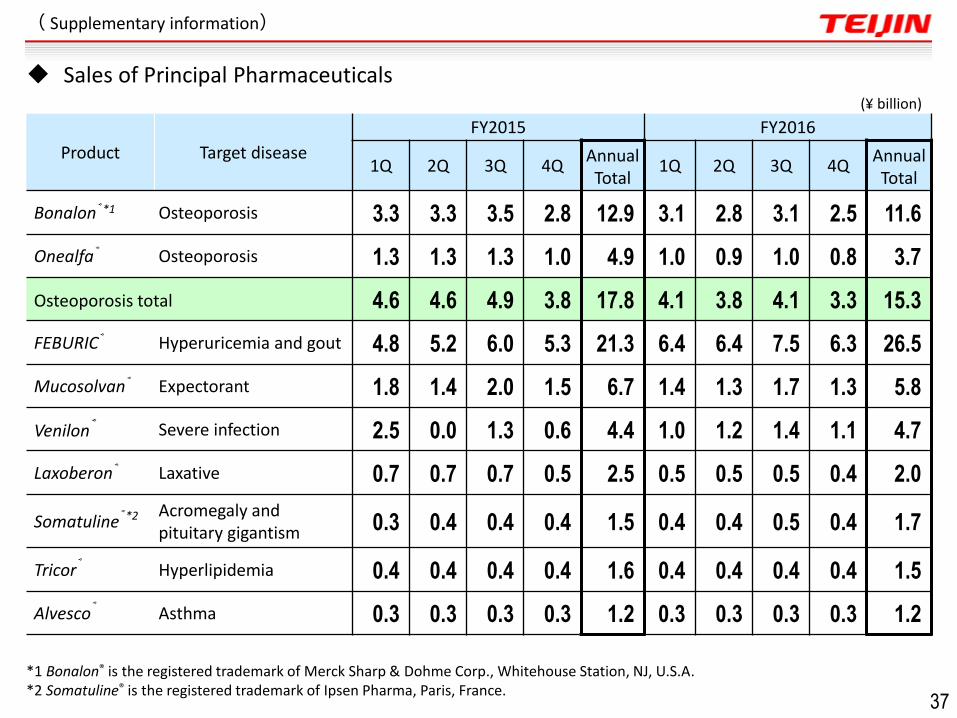
Product Target disease
FY2015 FY2016
1Q 2Q 3Q 4Q Annual Total
1Q 2Q 3Q 4Q Annual Total
Bonalon®*1 Osteoporosis 3.3 3.3 3.5 2.8 12.9 3.1 2.8 3.1 2.5 11.6
Onealfa® Osteoporosis 1.3 1.3 1.3 1.0 4.9 1.0 0.9 1.0 0.8 3.7
Osteoporosis total 4.6 4.6 4.9 3.8 17.8 4.1 3.8 4.1 3.3 15.3
FEBURIC® Hyperuricemia and gout 4.8 5.2 6.0 5.3 21.3 6.4 6.4 7.5 6.3 26.5
Mucosolvan® Expectorant 1.8 1.4 2.0 1.5 6.7 1.4 1.3 1.7 1.3 5.8
Venilon® Severe infection 2.5 0.0 1.3 0.6 4.4 1.0 1.2 1.4 1.1 4.7
Laxoberon® Laxative 0.7 0.7 0.7 0.5 2.5 0.5 0.5 0.5 0.4 2.0
Somatuline®*2 Acromegaly and pituitary gigantism 0.3 0.4 0.4 0.4 1.5 0.4 0.4 0.5 0.4 1.7
Tricor® Hyperlipidemia 0.4 0.4 0.4 0.4 1.6 0.4 0.4 0.4 0.4 1.5
Alvesco® Asthma 0.3 0.3 0.3 0.3 1.2 0.3 0.3 0.3 0.3 1.2
*1 Bonalon® is the registered trademark of Merck Sharp & Dohme Corp., Whitehouse Station, NJ, U.S.A. *2 Somatuline® is the registered trademark of Ipsen Pharma, Paris, France.
(¥ billion)
Sales of Principal Pharmaceuticals
( Supplementary information)
37
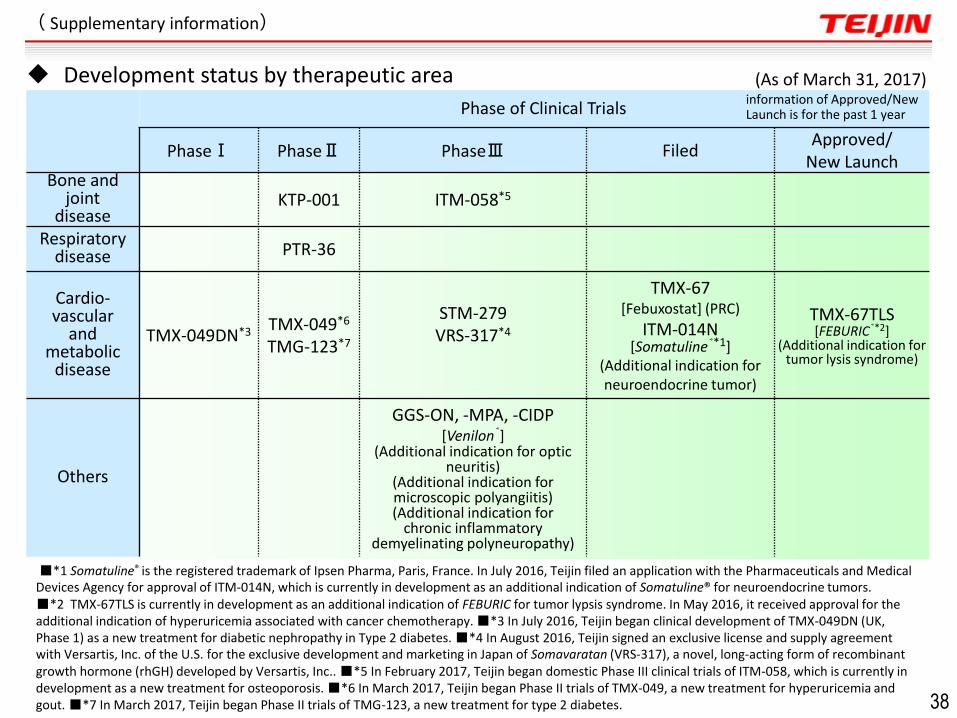
Phase of Clinical Trials
PhaseⅠ PhaseⅡ PhaseⅢ Filed Approved/
New Launch Bone and
joint disease
KTP-001 ITM-058*5
Respiratory disease PTR-36
Cardio-vascular
and metabolic
disease
TMX-049DN*3 TMX-049*6 TMG-123*7
STM-279 VRS-317*4
TMX-67 [Febuxostat] (PRC)
ITM-014N [Somatuline®*1]
(Additional indication for neuroendocrine tumor)
TMX-67TLS [FEBURIC®*2]
(Additional indication for tumor lysis syndrome)
Others
GGS-ON, -MPA, -CIDP [Venilon®]
(Additional indication for optic neuritis)
(Additional indication for microscopic polyangiitis) (Additional indication for
chronic inflammatory demyelinating polyneuropathy)
■*1 Somatuline® is the registered trademark of Ipsen Pharma, Paris, France. In July 2016, Teijin filed an application with the Pharmaceuticals and Medical Devices Agency for approval of ITM-014N, which is currently in development as an additional indication of Somatuline® for neuroendocrine tumors. ■*2 TMX-67TLS is currently in development as an additional indication of FEBURIC for tumor lypsis syndrome. In May 2016, it received approval for the additional indication of hyperuricemia associated with cancer chemotherapy. ■*3 In July 2016, Teijin began clinical development of TMX-049DN (UK, Phase 1) as a new treatment for diabetic nephropathy in Type 2 diabetes. ■*4 In August 2016, Teijin signed an exclusive license and supply agreement with Versartis, Inc. of the U.S. for the exclusive development and marketing in Japan of Somavaratan (VRS-317), a novel, long-acting form of recombinant growth hormone (rhGH) developed by Versartis, Inc.. ■*5 In February 2017, Teijin began domestic Phase III clinical trials of ITM-058, which is currently in development as a new treatment for osteoporosis. ■*6 In March 2017, Teijin began Phase II trials of TMX-049, a new treatment for hyperuricemia and gout. ■*7 In March 2017, Teijin began Phase II trials of TMG-123, a new treatment for type 2 diabetes.
(As of March 31, 2017) information of Approved/New Launch is for the past 1 year
Development status by therapeutic area
( Supplementary information)
38
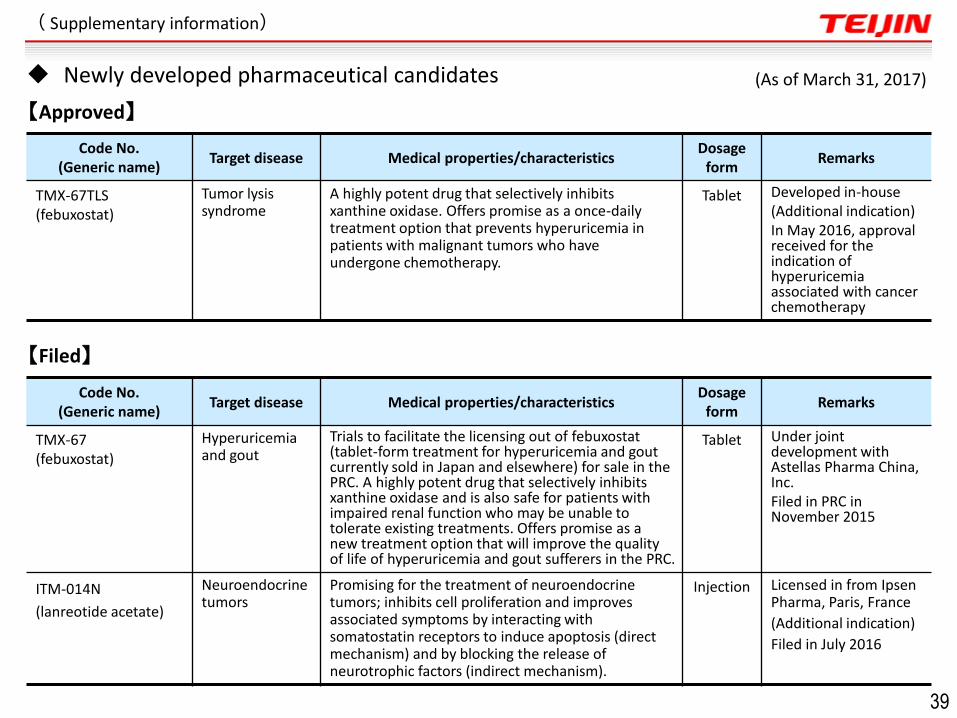
【Approved】
【Filed】
Code No. (Generic name)
Target disease Medical properties/characteristics Dosage
form Remarks
TMX-67TLS (febuxostat)
Tumor lysis syndrome
A highly potent drug that selectively inhibits xanthine oxidase. Offers promise as a once-daily treatment option that prevents hyperuricemia in patients with malignant tumors who have undergone chemotherapy.
Tablet Developed in-house (Additional indication) In May 2016, approval received for the indication of hyperuricemia associated with cancer chemotherapy
Code No. (Generic name)
Target disease Medical properties/characteristics Dosage
form Remarks
TMX-67 (febuxostat)
Hyperuricemia and gout
Trials to facilitate the licensing out of febuxostat (tablet-form treatment for hyperuricemia and gout currently sold in Japan and elsewhere) for sale in the PRC. A highly potent drug that selectively inhibits xanthine oxidase and is also safe for patients with impaired renal function who may be unable to tolerate existing treatments. Offers promise as a new treatment option that will improve the quality of life of hyperuricemia and gout sufferers in the PRC.
Tablet Under joint development with Astellas Pharma China, Inc. Filed in PRC in November 2015
ITM-014N
(lanreotide acetate)
Neuroendocrine tumors
Promising for the treatment of neuroendocrine tumors; inhibits cell proliferation and improves associated symptoms by interacting with somatostatin receptors to induce apoptosis (direct mechanism) and by blocking the release of neurotrophic factors (indirect mechanism).
Injection Licensed in from Ipsen Pharma, Paris, France
(Additional indication)
Filed in July 2016
( Supplementary information)
(As of March 31, 2017)
39
Newly developed pharmaceutical candidates
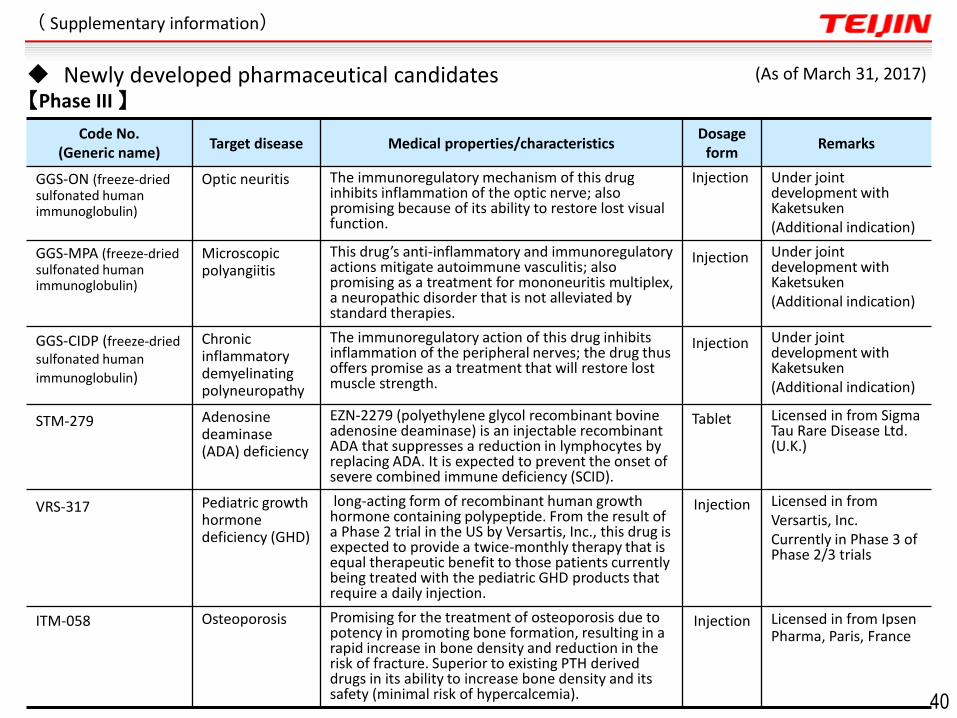
Code No. (Generic name)
Target disease Medical properties/characteristics Dosage
form Remarks
GGS-ON (freeze-dried sulfonated human immunoglobulin)
Optic neuritis The immunoregulatory mechanism of this drug inhibits inflammation of the optic nerve; also promising because of its ability to restore lost visual function.
Injection Under joint development with Kaketsuken (Additional indication)
GGS-MPA (freeze-dried sulfonated human immunoglobulin)
Microscopic polyangiitis
This drug’s anti-inflammatory and immunoregulatory actions mitigate autoimmune vasculitis; also promising as a treatment for mononeuritis multiplex, a neuropathic disorder that is not alleviated by standard therapies.
Injection Under joint development with Kaketsuken (Additional indication)
GGS-CIDP (freeze-dried sulfonated human
immunoglobulin)
Chronic inflammatory demyelinating polyneuropathy
The immunoregulatory action of this drug inhibits inflammation of the peripheral nerves; the drug thus offers promise as a treatment that will restore lost muscle strength.
Injection Under joint development with Kaketsuken (Additional indication)
STM-279 Adenosine deaminase (ADA) deficiency
EZN-2279 (polyethylene glycol recombinant bovine adenosine deaminase) is an injectable recombinant ADA that suppresses a reduction in lymphocytes by replacing ADA. It is expected to prevent the onset of severe combined immune deficiency (SCID).
Tablet Licensed in from Sigma Tau Rare Disease Ltd. (U.K.)
VRS-317 Pediatric growth hormone deficiency (GHD)
long-acting form of recombinant human growth hormone containing polypeptide. From the result of a Phase 2 trial in the US by Versartis, Inc., this drug is expected to provide a twice-monthly therapy that is equal therapeutic benefit to those patients currently being treated with the pediatric GHD products that require a daily injection.
Injection Licensed in from Versartis, Inc. Currently in Phase 3 of Phase 2/3 trials
ITM-058 Osteoporosis Promising for the treatment of osteoporosis due to potency in promoting bone formation, resulting in a rapid increase in bone density and reduction in the risk of fracture. Superior to existing PTH derived drugs in its ability to increase bone density and its safety (minimal risk of hypercalcemia).
Injection Licensed in from Ipsen Pharma, Paris, France
( Supplementary information)
(As of March 31, 2017)
【Phase III 】
40
Newly developed pharmaceutical candidates
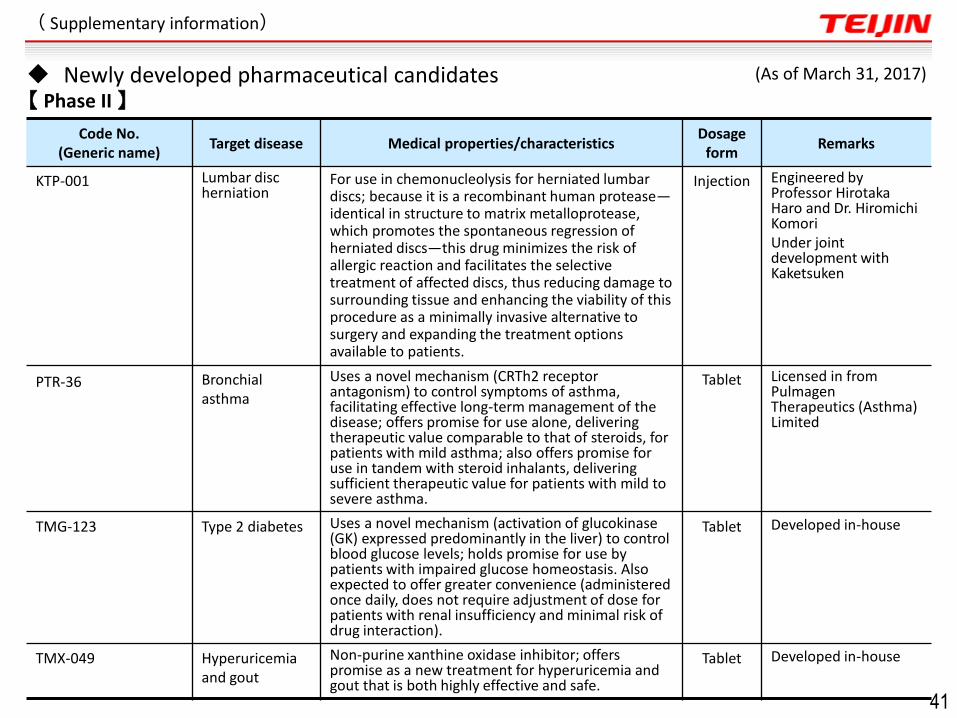
【 Phase II 】
( Supplementary information)
(As of March 31, 2017)
Code No. (Generic name)
Target disease Medical properties/characteristics Dosage
form Remarks
KTP-001 Lumbar disc herniation
For use in chemonucleolysis for herniated lumbar discs; because it is a recombinant human protease—identical in structure to matrix metalloprotease, which promotes the spontaneous regression of herniated discs—this drug minimizes the risk of allergic reaction and facilitates the selective treatment of affected discs, thus reducing damage to surrounding tissue and enhancing the viability of this procedure as a minimally invasive alternative to surgery and expanding the treatment options available to patients.
Injection Engineered by Professor Hirotaka Haro and Dr. Hiromichi Komori Under joint development with Kaketsuken
PTR-36 Bronchial asthma
Uses a novel mechanism (CRTh2 receptor antagonism) to control symptoms of asthma, facilitating effective long-term management of the disease; offers promise for use alone, delivering therapeutic value comparable to that of steroids, for patients with mild asthma; also offers promise for use in tandem with steroid inhalants, delivering sufficient therapeutic value for patients with mild to severe asthma.
Tablet Licensed in from Pulmagen Therapeutics (Asthma) Limited
TMG-123 Type 2 diabetes Uses a novel mechanism (activation of glucokinase (GK) expressed predominantly in the liver) to control blood glucose levels; holds promise for use by patients with impaired glucose homeostasis. Also expected to offer greater convenience (administered once daily, does not require adjustment of dose for patients with renal insufficiency and minimal risk of drug interaction).
Tablet Developed in-house
TMX-049 Hyperuricemia and gout
Non-purine xanthine oxidase inhibitor; offers promise as a new treatment for hyperuricemia and gout that is both highly effective and safe.
Tablet Developed in-house
41
Newly developed pharmaceutical candidates
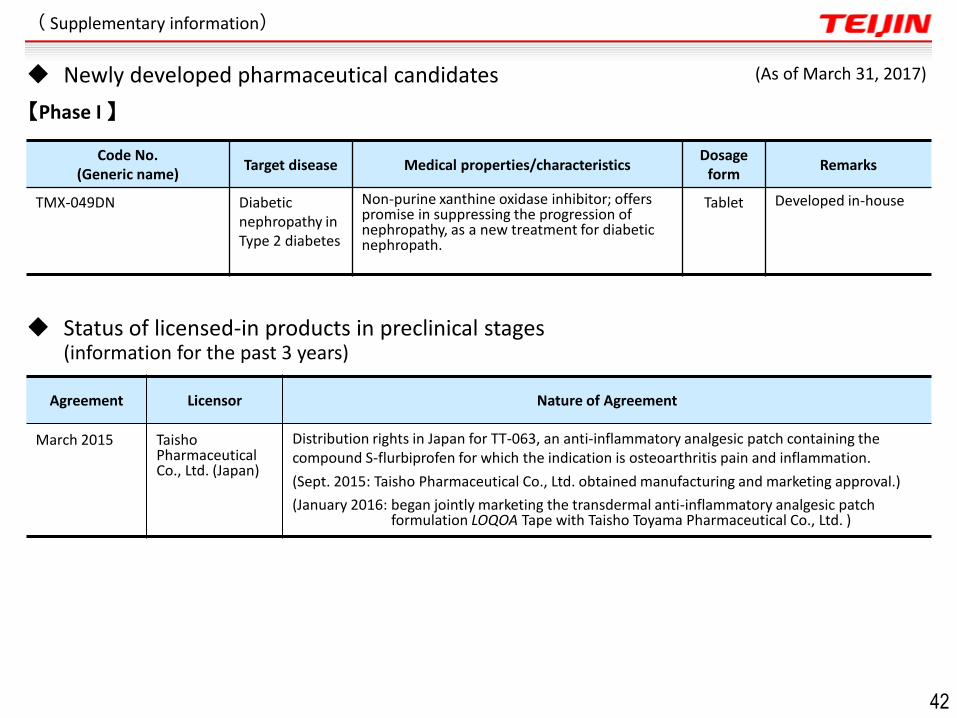
Code No. (Generic name)
Target disease Medical properties/characteristics Dosage
form Remarks
TMX-049DN Diabetic nephropathy in Type 2 diabetes
Non-purine xanthine oxidase inhibitor; offers promise in suppressing the progression of nephropathy, as a new treatment for diabetic nephropath.
Tablet Developed in-house
Agreement Licensor Nature of Agreement
March 2015 Taisho Pharmaceutical Co., Ltd. (Japan)
Distribution rights in Japan for TT-063, an anti-inflammatory analgesic patch containing the compound S-flurbiprofen for which the indication is osteoarthritis pain and inflammation.
(Sept. 2015: Taisho Pharmaceutical Co., Ltd. obtained manufacturing and marketing approval.)
(January 2016: began jointly marketing the transdermal anti-inflammatory analgesic patch formulation LOQOA Tape with Taisho Toyama Pharmaceutical Co., Ltd. )
( Supplementary information)
(As of March 31, 2017)
【Phase I 】
Status of licensed-in products in preclinical stages (information for the past 3 years)
42
Newly developed pharmaceutical candidates

![FY2017 Financial Results · 2018-05-21 · ©2018 Topcon Corporation 5 FY2017 Financial Results by Business [Consolidated] FY2016 FY2017](https://static.fdocuments.in/doc/165x107/5f7157b8a702f55df61cd566/fy2017-financial-results-2018-05-21-2018-topcon-corporation-5-fy2017-financial.jpg)