Flange Strain Measurement in Shear Critical RC T-Beams · PDF fileIn general, the above...
15
1. INTRODUCTION The effect of the flange on the shear strength of an RC T-beam has been noted in several investigations to be an important consideration in the assessment of existing structures that is not well understood in the current state of research. These include a comment by Klein and Popovic (1985) in the discussion of the shear evaluation procedures in the then current concrete codes of practice, and most recently by Darwish et al. (2000) in a discussion of an article by ASCE-ACI Committee 445 (1998) on the then current state of the art for the shear evaluation procedures. It was a study by Placas and Regan (1971) that first explicitly identified an increase in the shear capacity with an increase in the flange width of RC T-beams with web reinforcing. Fok (1972) undertook a study that included T-beams with and without shear reinforcing. The specimens in this investigation were subjected to a line load across the width of the flange. The author concluded that only flange depth, and not flange width affected the shear strength. Chong (1980) tested a series of RC T-beams without web reinforcing subjected to a line load along the length of the span and made a similar conclusion to that of Fok, i.e. that increases in the flange depth, not the width produced increases in shear strength. Taplin and Al-Mahaidi (2000) tested a series of RC T-beams with web reinforcing subjected to a line load across the width of the flange (similar to that of Placas Advances in Structural Engineering Vol. 9 No. 4 2006 491 Flange Strain Measurement in Shear Critical RC T-Beams Craig Giaccio 1 , Riadh Al-Mahaidi 2,* and Geoff Taplin 3 1 Ove Arup Consulting Engineers, 10 Wellington Road, Ballsbridge, Dublin 4, Co. Dublin, Republic of Ireland 2 Department of Civil Engineering, Building 60, Monash University, Vic 3800, Australia 3 Maunsell Australia, Level 9, 161 Collins Street, Melbourne,Vic 3000, Australia (Received: 3 May 2005; Received revised form: 6 February 2006; Accepted: 14 February 2006) Abstract: This paper provides an analysis of the strain measurements and distributions obtained from testing two reinforced concrete T-beam specimens for the purpose of assessing the contribution of the flange to the shear strength. The specimens were instrumented throughout the flange and the compressive zone of the web region in order to obtain comprehensive data required for the understanding of shear resistance mechanisms and quantification of the flange contribution to the shear resistance of reinforced concrete T-beams. It was found that the formation of shear cracking results in significant redistributions of strain through the measured region. Redistributions of compressive strains transversely away from the web region and vertically away from the top surface of the flange were observed. The resulting distributions throughout the specimen were highly nonlinear. In light of the results of this investigation, the assumptions made in the application of existing methods available for prediction of the shear resistance of reinforced concrete T-beams are discussed, and proposed improvements to these methods are also discussed. Key words: shear, flange flexure, failure mechanisms, reinforced concrete, T-beams, strain redistribution, flange contribution. * Corresponding author. Email address: [email protected]; Fax: +61-3-9905-4944; Tel: +61-3-9905-4952
Transcript of Flange Strain Measurement in Shear Critical RC T-Beams · PDF fileIn general, the above...
1. INTRODUCTION The effect of the flange on the shear strength of an RCT-beam has been noted in several investigations to be animportant consideration in the assessment of existingstructures that is not well understood in the current stateof research. These include a comment by Klein andPopovic (1985) in the discussion of the shear evaluationprocedures in the then current concrete codes ofpractice, and most recently by Darwish et al. (2000) ina discussion of an article by ASCE-ACI Committee 445(1998) on the then current state of the art for the shearevaluation procedures.
It was a study by Placas and Regan (1971) that firstexplicitly identified an increase in the shear capacity with
an increase in the flange width of RC T-beams with webreinforcing. Fok (1972) undertook a study that includedT-beams with and without shear reinforcing. Thespecimens in this investigation were subjected to a lineload across the width of the flange. The author concludedthat only flange depth, and not flange width affectedthe shear strength. Chong (1980) tested a series of RCT-beams without web reinforcing subjected to a line loadalong the length of the span and made a similarconclusion to that of Fok, i.e. that increases in the flangedepth, not the width produced increases in shear strength.Taplin and Al-Mahaidi (2000) tested a series of RCT-beams with web reinforcing subjected to a line loadacross the width of the flange (similar to that of Placas
Advances in Structural Engineering Vol. 9 No. 4 2006 491
Flange Strain Measurement in Shear
Critical RC T-Beams
Craig Giaccio1, Riadh Al-Mahaidi2,* and Geoff Taplin3
1Ove Arup Consulting Engineers, 10 Wellington Road, Ballsbridge, Dublin 4, Co. Dublin,Republic of Ireland
2Department of Civil Engineering, Building 60, Monash University, Vic 3800, Australia3Maunsell Australia, Level 9, 161 Collins Street, Melbourne,Vic 3000, Australia
(Received: 3 May 2005; Received revised form: 6 February 2006; Accepted: 14 February 2006)
Abstract: This paper provides an analysis of the strain measurements anddistributions obtained from testing two reinforced concrete T-beam specimens for thepurpose of assessing the contribution of the flange to the shear strength. The specimenswere instrumented throughout the flange and the compressive zone of the web regionin order to obtain comprehensive data required for the understanding of shearresistance mechanisms and quantification of the flange contribution to the shearresistance of reinforced concrete T-beams. It was found that the formation ofshear cracking results in significant redistributions of strain through the measuredregion. Redistributions of compressive strains transversely away from the web regionand vertically away from the top surface of the flange were observed. The resultingdistributions throughout the specimen were highly nonlinear. In light of the results ofthis investigation, the assumptions made in the application of existing methodsavailable for prediction of the shear resistance of reinforced concrete T-beams arediscussed, and proposed improvements to these methods are also discussed.
Key words: shear, flange flexure, failure mechanisms, reinforced concrete, T-beams, strain redistribution, flangecontribution.
* Corresponding author. Email address: [email protected]; Fax: +61-3-9905-4944; Tel: +61-3-9905-4952
ASE_04_05_353-Al-Mahaidi 1/8/06 10:13 am Page 491
and Regan (1971)), and reported a trend of increasingshear strength with increasing flange width. Giaccio et al.(2002) examined a series of web reinforced RC T-beamssubjected to a concentrated point load (circular point loadwith diameter approximately equal to the web width ofthe specimens), and found that both flange width andflange depth influenced the shear strength; the resultsindicated that the flange width has the most pronouncedinfluence on the shear strength of this type of specimen.In general, the above indicates that the flange proportionsof an RC T-beam with web reinforcing have an effect onthe shear strength of this type of specimen.
Other investigations into the shear strength of RCT-beams have been undertaken in the past. These includestudies by Ferguson (1953), Al-Alusi (1957), Swamy(1969), Sway and Qureshi (1971). The common threadof all these investigations is the study of the effect ofvariables common with rectangular beams on the shearstrength of the specimens. These variables are thosesuch as shear span to depth ratio, percentage of webreinforcing, web geometry, material properties, andpercentage of longitudinal reinforcing. The effect of theflange on the shear strength was not isolated in any ofthese investigations.
Giaccio et al. (2002) suggested that when compared toa rectangular beam of identical web proportions,reinforcing percentages, and material properties(subsequently termed the identical rectangular beam),the most significant additional contribution to shearresistance offered by an RC T-beam will result from theenlarged compression region. The affect that the flangemay potentially have on the aggregate interlockcontribution, the stirrup contribution, and the dowelaction contribution is not discounted. The potentialincreases in these contributions may arise owing to affectthat the increased stiffness will have on the curvature ofT-beam in comparison to an identical rectangular beam.The increased stiffness will result in a decreasedcurvature at the same load for a T-beam in comparison toan identical rectangular beam potentially resulting in adecreased demand on the other mechanisms of shearresistance owing to the lower strains on a given crosssection. This is not further discussed in this paper.
The calculation of the effective flange width forflexure that is used in many concrete codes is based onwork by Levi (1961) and Brendel (1964). The work ofthese authors was a collation of studies that used linearelastic theory to calculate the effective flange width ofT-shaped solids under a variety of different loadingconfigurations that was compiled in the 1920’s. Thisformulation of the effective flange width does notconsider the strain redistributions that occur followingcracking of an RC T-beam and may not be suitable for
calculation of the effective flange width in the shearresistance of an RC T-beam.
There are some analytical methods that have beendeveloped with the capability of predicting the shearstrength of an RC T-beam. Placas and Regan (1971)developed a method that has the capability ofcalculating of the shear capacity of an RC T-beam. Theimplementation of this method requires the input of theeffective width of the flange in shear resistance in orderto predict the shear capacity. There is no such analyticalmethod available for this calculation specifically forshear resistance of RC T-beams, therefore the methodsprescribed Levi (1961) and Brendel (1964) are the onlymethods available for making such a prediction. Theserely on the linear elastic methods.
The Modified Compression Field Theory (MCFT)(Vecchio and Colins 1986), and the further developmentof this theory, the Disturbed Stress Field Model(Vecchio 2002), as well as the Softened Truss Model(Hsu 1988 ; Pang and Hsu 1995) are analyticalprocedures that require the discretisation of a concretecross section into a series of layers throughout the depthto calculate the section capacity. Vecchio and Collins(1988) developed a simplified method to calculate theshear strength of RC T-beams. The method applies adual section analysis of an RC beam and requires anassumed strain gradient throughout the depth at eachcross section used in the analysis to predict the shearcapacity. The assumed strain gradient presented in thestudy was linear throughout the depth.
Hoang (1997) presented an idealised failuremechanism of an RC T-beam and implemented theplasticity formulation to explicitly include the flangeproportions in the resulting shear strength predictionequations. The mechanism is shown in Figure 1. Thismechanism is representative of the beam shearmechanism of shear failure of web reinforced RCT-beams reported in Giaccio et al. (2002) and Giaccio(2003). This formulation assumed that compressivestresses are distributed in a 1:2 ratio across the width ofthe flange to calculate the effective width of the flangefor shear resistance, and allowed the implementation ofthe plasticity method.
This paper discusses the detailed instrumentationof two web reinforced RC T-beam specimens toinvestigate the strain redistribution in the flange and thecompression region of the web of an RC T-beam thatarises from the formation of shear cracking. The strainsare analysed to determine the validity of assumptionsused in state of the art methods of calculating shearresistance of RC T-beams and to understand the sourcesof nonlinearity that prevail in RC T-beams following theformation of the shear failure mechanism.
Flange Strain Measurement in Shear Critical RC T-Beams
492 Advances in Structural Engineering Vol. 9 No. 4 2006
ASE_04_05_353-Al-Mahaidi 1/8/06 10:13 am Page 492

2. RESEARCH SIGNIFICANCEThis paper forms part of a research program that is aimedat examining the role of the flange in the resistance of aweb reinforced RC T-beam subjected to shear, as well asquantifying the contribution that the flange makes to theoverall shear resistance of this type of structural element.
3. EXPERIMENTAL PROCEDURE3.1. Specimen Details
Two specimens were selected for detailed examination ofthe distribution of flange strain in the flange andcompression region in the web. As the primary focus ofthe research programme was on web reinforced shearcritical RC T-beams, the specimen proportions wereselected using the results of an investigation by Giaccio etal. (2002) into the effect of the geometry of the flange onthe shear capacity of RC T-beams. This investigation was
based on 30 experimental results. This study detailed theexistence of an upper bound to the effectiveness ofincreases in flange width on the shear resistance.Specimens in this study were intended to be identical totwo specimens tested by Giaccio et al. (2002) representingthis upper bound. The decision to select two specimenswith differing flange depths was intended to allowcomparison of the flange contribution to shear resistanceof specimens with varying flange depths.
These specimens had an overall depth of 305 mm,flange width of 465 mm, web width of 140 mm. The twodifferent flange depths studied in this investigation were75 mm and 100 mm. A cross section of these specimensis shown in Figure 2. The span of the specimens was 3.0m. The yield strength of the flexural bars was 340 MPa,the yield strength of the stirrups was 300 MPa, and theconcrete cylinder strength was 50 MPa.
Craig Giaccio, Riadh Al-Mahaidi and Geoff Taplin
Advances in Structural Engineering Vol. 9 No. 4 2006 493
Tension cracking on top of flange
Crushing under load point on top of flange
Applied Load
Point load across width of web
Intersection of flange crack and web crack
Plan of Idealised Mechanism for a Point Loaded T-beam
bf.ef
1:2 1:2
Line load across width of flange
Intersection of flange crack and web crack
Plan of Idealised Mechanism for a Line Loaded Flange
bf.ef
Elevation of Idealised Mechanism
1:2 1:2 1:2
1:2
Figure 1. Failure mechanism assumed in Hoang (1997)
465
100
140
205
45
6.5 mm Diameter Stirrups @225 mm crs.
5 × 20 mm Diamter Longitudinal Bars
6.5 mm Diameter longitudinal flange
bars at 75 mm centres
140
465
75
5 × 20 mm Diamter Longitudinal Bars
6.5 mm Diameter longitudinal flange
bars at 75 mm centres 230
40
6.5 mm Diameter Stirrups @ 225 mm crs.
Beam 1 Beam 2
Figure 2. Cross sections of specimens used in experimental investigation
ASE_04_05_353-Al-Mahaidi 1/8/06 10:13 am Page 493

3.2. Instrumentation
The layout of the gauging to measure concrete strains isshown in Figure 3. Figure 3(a) shows each of thelocations of the longitudinal gauges that were appliedacross the width of the flange and throughout the depth.The gauges throughout the depth of the flange alignedvertically. In each of the two specimens, a gauge wasprovided in the web below the underside of the flange togain further insight into the distribution throughout theweb. This was located approximately 40 mm below theunderside of the flange on Beam B1, and 50 mm belowthe underside of the flange on Beam B2. Strain gaugeswere not placed on the reinforcing bars.
Figure 3 also shows the notation used for the twosections of instrumentation, Section A and Section B thatare used in this paper. The discussions that ensue in thispaper refer to the left and right hand flange overhang.This refers to overhangs as they are seen on the crosssection in Figures 2 and 3.
The decision to locate strain gauges at three pointsacross the width and depth of the flange was based on thephysical limitation of the internal gauges. The use of anymore rows of embedded strain gauges could havesignificantly impacted on the results of strain because ofthe large area of protective coating around the embeddedconcrete gauges.
Instrumentation was also provided to determine themagnitude of the transverse strains thus allowing theirinfluence on the compressive response of the concrete tobe determined using available analytical models. Theseare shown in Giaccio et al. (2004) to produce nosignificant affect on the principal compressive strains onthese specimens and are not further discussed.
The gauges were offset from the edge of the load pointto avoid localised effects of the load. The distance used
in these experiments was determined from the results ofa finite element analysis to be 150 mm. This is close to avalue of D/2 (where D is the total depth of the specimen).
3.3. Testing Procedure
The specimens were subjected to a single point load. Thetotal span of the specimens was 3000 mm. The shear spanwas 800 mm, corresponding to a shear span to effectivedepth ratio (av/d) of 3.0. This was selected to ensure thatthe shear failure mechanism had developed to a significantextent at the failure of the specimen. The 145 mm diametercircular loading imprint was applied to the specimen via a controlled displacement of 0.009 mm/s. Theexperimental set up is illustrated in Figure 4.
3.4. Method of Analysis
To examine the affect of the formation of crackingassociated with the development of the shear failuremechanism, the following aspects of the experimentalwork are discussed in this paper.
1. The results of ultimate strength and failuremechanisms
2. The distribution of strains with applied load3. The variation of strains throughout the depth at
an indicative location in the flange overhangs,and at the centre of the width of the web. Thesevariations were shown at loads after significantredistributions of strains associated withcracking were observed.
4. RESULTS OF ULTIMATE STRENGTHAND FAILURE MECHANISMS
4.1. Beam B1
The failure mechanism displayed by specimen B1 wasone where the specimen exhausted its load carrying
Flange Strain Measurement in Shear Critical RC T-Beams
494 Advances in Structural Engineering Vol. 9 No. 4 2006
Line of support
Surface gauges
110 mm to surface gauges, 80 mm to embeddable gaugesLongitudinal surface gauges
Load Embedded concretegauges
Line of stirrup beyond
Support bars for embedded gauges
Section ASection B
1 2 3 4 5 6 7
1 - Denotes gauging row number
Figure 3. Strain gauging used in the experimental work
ASE_04_05_353-Al-Mahaidi 1/8/06 10:13 am Page 494

capacity as the concentrated point load punched throughthe web and flange of the T-beam. This failuremechanism was described in Giaccio et al. (2002) as thebeam punching shear mechanism. Figure 5 shows aphoto of the failure mechanism. It shows the locationwhere the load point punched through the top surface ofthe flange. It also shows that in addition to the usualdiagonal web cracks associated with the shear failuremechanism, a large crack traversed the width of theflange intersecting the row of gauging farthest from theload point (Section B).
Figure 6 shows the load deflection response. Onreaching peak load, the specimen exhibited a non-ductile response. The formation of the punching shearmechanism was sudden, as was the resulting loss in loadcarrying capacity associated with the development ofthis mechanism. Failure occurred at a peak load of Pu = 212 kN which corresponded to a peak appliedshear of Vu = 155 kN.
The critical diagonal web crack that was present atfailure formed at an applied load of 85 kN. Anotherdiagonal web crack was observed to occur at 91 kN. Inaddition to these cracks, a crack on the top surface of theflange was observed. This crack intersected Section Bof the strain gauges. Analysis of the strain gauge resultsat Section B indicated that the strains were significantenough to cause cracking at a load of approximately 175 kN. This is assumed to be the load at whichthe transverse crack formed in the discussions thatfollow.
4.2. Beam B2
Beam B2 exhibited a ductile flexural failure. Figure 7shows a photo of the failure mechanism. When the peakload of 238 kN was reached, the specimen began toundergo large plastic deformations without any increasein the reaction forces. Diagonal web cracks associatedwith the formation of the shear failure mechanism were
Craig Giaccio, Riadh Al-Mahaidi and Geoff Taplin
Advances in Structural Engineering Vol. 9 No. 4 2006 495
800
3000
4000
1773
3385
1267
2235A
A
Support
Test Specimen
Reaction Frame
Loading Jack
Loading plate
Section A-A
Figure 4. Schematic of experimental set up
Punching of load point
Lateral crack across
Critical diagonal web cracks
Figure 5. Photo of failure mechanism of Beam 1
50
100
150
200
App
lied
Load
(kN
)
0
250
2 4 6 8
Deflection (mm)
0 10
Figure 6. Load deflection curve for Beam 1
ASE_04_05_353-Al-Mahaidi 1/8/06 10:13 am Page 495

observed at 78 kN, 86 kN, and the most significant ofthese cracks formed at a load of 212 kN. Four significant
flexural/flexural shear cracks formed at failure on thisspecimen. The load at which these initiated during theexperiment was not monitored.
Figure 8 shows the load deflection response. Thepeak load was Pu = 238 kN as indicated, whichcorresponded to a sectional shear of Vu = 174 kN.
5. RESULTS AND DISCUSSION OF FLANGESTRAIN MEASUREMENT
Not all gauges could be located exactly at the positionsshown in Figure 3 because of interferences byreinforcing bars. To allow simple analysis and discussionof the strains that were measured, results were linearlyinterpolated to locations that were equidistant throughoutthe width and depth of the flange. Results presented inthis paper are these linearly interpolated results.
5.1. Beam B1
5.1.1. Strains in the flange of the beam
Figures 9–10 show the variation of strain with load thatwas recorded in the flange overhangs for Beam B1. Forclarity of presentation, the strains in each flangeoverhang are presented separately. Strain gauges atSection B began to fail at an applied load of 200 kN asa result of the crack on the top surface of the flangeintersecting this row of gauges. For consistency ofpresentation, the results of measured strains vs. appliedload are not shown beyond an applied load of 200 kN.
Figure 9 shows the results for the gauges at Section A.These plots show that the trend of the change in strainwith the increasing applied load was similar for allgauges located at similar distances from the top surfaceof the flange. This was generally true for the magnitudes,
Flange Strain Measurement in Shear Critical RC T-Beams
496 Advances in Structural Engineering Vol. 9 No. 4 2006
Well developeddiagonal web cracks
Crushing of compressionconcrete
Figure 7. Photo of failure mechanism for Beam 2
App
lied
Load
(kN
)
0
50
100
150
200
250
300
5 10 15 20 25 300 35Deflection (mm)
Figure 8. Load deflection curve for Beam 2
–600
–500
–400
–300
–200
–100
0
100
200
0 40 80 120 160 200
Load (kN)
Str
ain
(µε)
Row 1 Top Row 1 Mid Depth Row 1 U/Side
Row 2 Top Row 2 Mid Depth Row 2 U/Side
Row 3 Top Row 3 Mid Depth Row 3 U/Side
–600
–500
–400
–300
–200
–100
0
100
200
0 40 80 120 160 200
Str
ain
(µε)
Row 1 Top Row 1 Mid Depth Row 1 U/Side
Row 2 Top Row 2 Mid Depth Row 2 U/Side
Row 3 Top Row 3 Mid Depth Row 3 U/Side
(a) Left Hand Flange Overhang (b) Right Hand Flange Overhang
Load (kN)
Gauges on undersideof flange
Gauges on top of flange
Figure 9. Strains measured in the flange at section A on Beam B1
ASE_04_05_353-Al-Mahaidi 1/8/06 10:13 am Page 496

although in some instances there were differences inmagnitudes of gauges located at the same distance fromthe top surface of the flange.
From the start of the test until 40 kN, the strains at alllevels of depth from the top surface of the flange wereincreasing and compressive. At 40 kN, the influence of aflexural crack became evident with strains on theunderside of the flange beginning to reverse in trend. Ata load of 85 kN (corresponding to the appearance of thefirst diagonal web crack), the trend of change in strainwith applied load changed on all surfaces. The strains onthe underside of the flange began to reverse and becameincreasing and tensile. This was accompanied by thestrains on the top surface increasing in the rate of changeof strain with applied load. The gauges at the centre ofdepth of the flange were largely unaffected by theformation of this crack. Although the load at whichthis occurred corresponded to the formation of thediagonal web crack, the change in trend is most consistentwith the influence of the growth of a flexural crack.
At a load of approximately 140 kN, the trend of thechange in strain with load on the top and bottom surfacesof the flange can be observed to have reversed. Thestrains on the underside of the flange decreased in tensilemagnitude, further becoming compressive strains, whilstthose on the top surface of the flange began to decreasein compressive magnitude. At a load of 175 kN, a suddensharp magnification in these trends was observed. Thisindicates that a vertical redistribution of strain occurredat this section to accommodate the crack on the topsurface of the flange. Compressive stresses were forced
down throughout the depth of the flange.It can be observed from Figure 9 that the reversal in
trend of change in strain with applied load occurred at aload of approximately 190 kN on some gauges. All ofthese gauges are located in the column of gaugesadjacent to the flange. This change in trend appears tobe consistent with a flexurally dominant behaviour ingauges adjacent to the web.
Figure 10 shows the results of the gauges at SectionB on Beam B1. The trend of change in strain withapplied load is generally similar to that observed atSection A until a load of 140 kN. The reversal of strainson the top and bottom surface of the flange at thisSection resulting from the formation of the crack on thetop surface of the flange is more pronounced than wasobserved at Section A. At this Section, the crackintersected the gauges on the top surface as is reflectedby the high tensile strains present as the last set of resultspresented at 200 kN. The gauges on the underside of theflange also underwent a significant reversal such thatthey displayed the highest magnitude of compressivegauges throughout the experiment.
The reversals of strain on the top and bottom surfaceof the flange are a result of a redistribution of strain thatis caused by the formation of the transverse crack on thetop of the flange. This redistribution arises to allow theflange to accommodate the crack that forms the shearfailure mechanism corresponding to Figure 1. Thevertical redistribution associated with the formation ofthe crack on the top surface forced compressive strainsaway from the top surface of the flange.
Craig Giaccio, Riadh Al-Mahaidi and Geoff Taplin
Advances in Structural Engineering Vol. 9 No. 4 2006 497
0 40 80 120 160 200
Load (kN)
Row 1 Top Row 1 Mid Depth Row 1 U/Side
Row 2 Top Row 2 Mid Depth Row 2 U/Side
Row 3 Top Row 3 Mid Depth Row 3 U/Side
0 40 80 120 160 200
Load (kN)
Row 1 Top Row 1 Mid Depth Row 1 U/Side
Row 2 Top Row 2 Mid Depth Row 2 U/Side
Row 3 Top Row 3 Mid Depth Row 3 U/Side
–600
–400
–200
0
200
400
600
–600
–400
–200
0
200
400
600
800
(a) Left Hand Flange Overhang (b) Right Hand Flange Overhang
Str
ain
(µε)
Str
ain
(µε)
Gauges on undersideof flange
Gauges on top of flange
Figure 10. Strains measured in the flange at section A on Beam B1
ASE_04_05_353-Al-Mahaidi 1/8/06 10:13 am Page 497
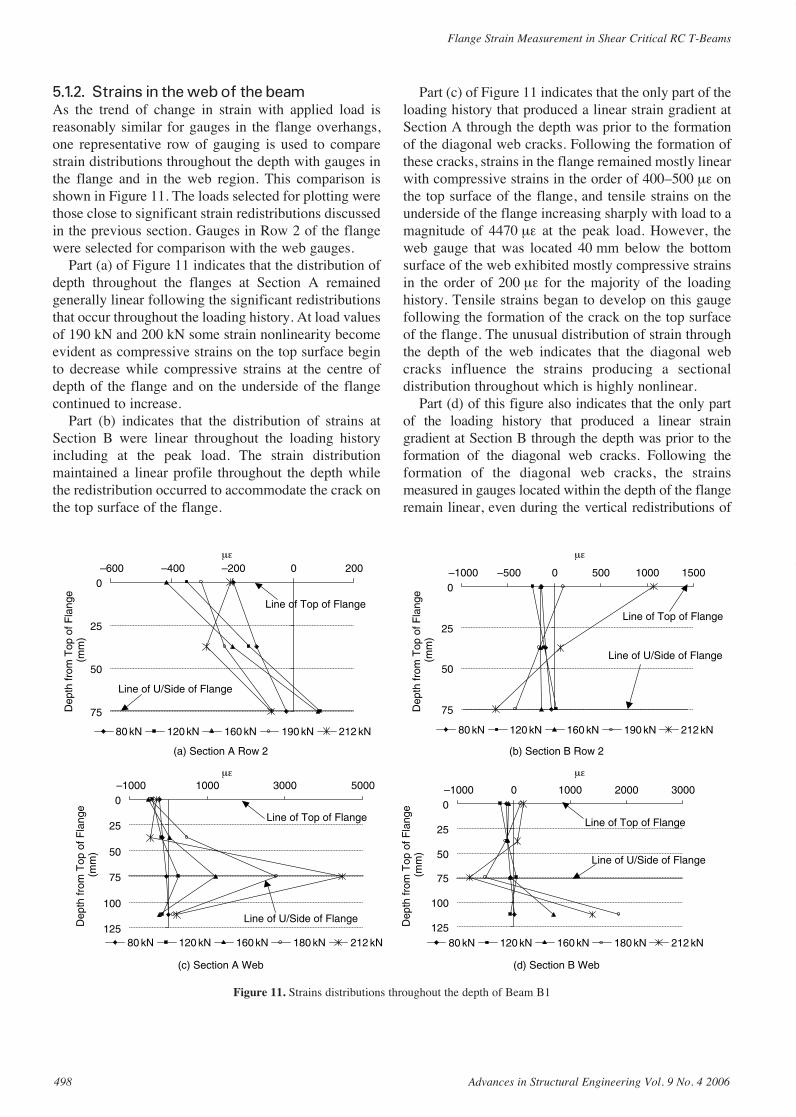
5.1.2. Strains in the web of the beam
As the trend of change in strain with applied load isreasonably similar for gauges in the flange overhangs,one representative row of gauging is used to comparestrain distributions throughout the depth with gauges inthe flange and in the web region. This comparison isshown in Figure 11. The loads selected for plotting werethose close to significant strain redistributions discussedin the previous section. Gauges in Row 2 of the flangewere selected for comparison with the web gauges.
Part (a) of Figure 11 indicates that the distribution ofdepth throughout the flanges at Section A remainedgenerally linear following the significant redistributionsthat occur throughout the loading history. At load valuesof 190 kN and 200 kN some strain nonlinearity becomeevident as compressive strains on the top surface beginto decrease while compressive strains at the centre ofdepth of the flange and on the underside of the flangecontinued to increase.
Part (b) indicates that the distribution of strains atSection B were linear throughout the loading historyincluding at the peak load. The strain distributionmaintained a linear profile throughout the depth whilethe redistribution occurred to accommodate the crack onthe top surface of the flange.
Part (c) of Figure 11 indicates that the only part of theloading history that produced a linear strain gradient atSection A through the depth was prior to the formationof the diagonal web cracks. Following the formation ofthese cracks, strains in the flange remained mostly linearwith compressive strains in the order of 400–500 µε onthe top surface of the flange, and tensile strains on theunderside of the flange increasing sharply with load to amagnitude of 4470 µε at the peak load. However, theweb gauge that was located 40 mm below the bottomsurface of the web exhibited mostly compressive strainsin the order of 200 µε for the majority of the loadinghistory. Tensile strains began to develop on this gaugefollowing the formation of the crack on the top surfaceof the flange. The unusual distribution of strain throughthe depth of the web indicates that the diagonal webcracks influence the strains producing a sectionaldistribution throughout which is highly nonlinear.
Part (d) of this figure also indicates that the only partof the loading history that produced a linear straingradient at Section B through the depth was prior to theformation of the diagonal web cracks. Following theformation of the diagonal web cracks, the strainsmeasured in gauges located within the depth of the flangeremain linear, even during the vertical redistributions of
Flange Strain Measurement in Shear Critical RC T-Beams
498 Advances in Structural Engineering Vol. 9 No. 4 2006
(c) Section A Web (d) Section B Web
0
25
50
75
100
125
–1000 1000 3000 5000
80 kN 120 kN 160 kN 180 kN 212 kN
Line of Top of Flange
Line of U/Side of Flange
0
25
50
75
100
125
–1000 0 1000 2000 3000
80 kN 120 kN 160 kN 180 kN 212 kN
Line of Top of Flange
Line of U/Side of Flange
0
25
50
75
–1000 –500 0 500 1000 1500
80 kN 120 kN 160 kN 190 kN 212 kN
Line of Top of Flange
Line of U/Side of Flange
0
25
50
75
–600 –400 –200µε µε
µε µε
0 200
80 kN 120 kN 160 kN 190 kN 212 kN
Line of Top of Flange
Line of U/Side of Flange
(a) Section A Row 2 (b) Section B Row 2
Dep
th fr
om T
op o
f Fla
nge
(mm
)
Dep
th fr
om T
op o
f Fla
nge
(mm
)D
epth
from
Top
of F
lang
e (m
m)
Dep
th fr
om T
op o
f Fla
nge
(mm
)
Figure 11. Strains distributions throughout the depth of Beam B1
ASE_04_05_353-Al-Mahaidi 1/8/06 10:13 am Page 498

strains to accommodate the crack on the top surface of theflange. However, large tensile strains were recorded onthe gauge located 40 mm below the underside of theflange for most of the loading history.
Comparison of parts (a) and (c), i.e. the distributionof strain between the flanges and web at Section A,illustrates that as the tensile strains increased at thejunction of the flange to web interface the compressivestrains on the underside of the flange and at the centre ofdepth of the flange also increased, indicating atransverse redistribution of strain across the width of theflange. It is suggested that this was in part a result ofdecreasing compressive strains on the top surface of theflange.
Figure 12 shows the crack pattern on the specimenwith the location of Section A and B of gauges alongwith lines to indicate the locations of the centre lines of
the embedded gauges. With this superposition of thelocation of these gauges in relation to the cracks thatwere present at failure, it is very clear that the interactionof two separate diagonal web cracks influenced the straindistribution. The distribution of strain through the depthat Section A at the peak load in Figure 11 (shown in athicker line) indicates that the diagonal web crack thatformed and intersected with the flange to web interfacewas much more developed at failure than the crack thatintersected the gauge 40 mm below the underside of theflange. The distribution of strain through the depth atSection B in Figure 11 indicates compression at the levelof the soffit of the flange from the vertical redistributionof strain accompanying the formation of the crack on thetop surface of the flange as well as tension at the gauge 40 mm below the soffit of the flange. This tension onthe latter gauge is a result of the gauge intersectinga diagonal web crack. The resulting strain distributionowing to these complex interactions of cracks is highlynonlinear and is not that which corresponds to a planesection.
5.2. Beam B2
5.2.1. Strains in the flange of the beam
Figures 13–14 show the variation of strain with loadrecorded in the flange overhangs for Beam B2. Forclarity of presentation, the strains in each flangeoverhang are presented separately. Gauges performedwell until the peak load was reached. Once the specimenstarted exhibiting ductility, the gauges began to fail. Thestrain gauge results presented in the discussion that
Craig Giaccio, Riadh Al-Mahaidi and Geoff Taplin
Advances in Structural Engineering Vol. 9 No. 4 2006 499
Centreline of embedded gauges
Section ASection B
Load
Location of transversecrack on flange
Figure 12. Illustration of crack pattern with location of embedded
gauges for Beam B1
(a) Left Hand Flange Overhang (b) Right Hand Flange Overhang
0 50 100 150 200 250
Load (kN)
Row 1 Top Row 1 Mid Depth Row 1 U/Side
Row 2 Top Row 2 Mid Depth Row 2 U/Side
Row 3 Top Row 3 Mid Depth Row 3 U/Side
0
0 50 100 150 200 250
Load (kN)
Row 1 Top Row 1 Mid Depth Row 1 U/Side
Row 2 Top Row 2 Mid Depth Row 2 U/Side
Row 3 Top Row 3 Mid Depth Row 3 U/Side
–400
–300
–200
–100
0
100
–500
200
–600
–500
–400
–300
–200
–100
100
200
Str
ain
(µε)
Str
ain
(µε)
Gauges on undersideof flange
Gauges on top of flange
Figure 13. Strains measured in the flange at section B on Beam B2
ASE_04_05_353-Al-Mahaidi 1/8/06 10:13 am Page 499

follows are those up until the peak load of 238 kN wasreached. Strains recorded during the ductile response arenot presented.
Figure 13 shows the results for the gauges at SectionA on Beams B2. These plots show that the trend of thechange in strain with the increasing applied load wasvery similar for all gauges located at similar distancesfrom the top surface of the flange. In general, themagnitudes of the gauges were also very similar. As thediagonal web cracks formed and propagated, magnitudesof the strains on the top and bottom surfaces began tovary across the width of the flange overhangs.
At a load of approximately 40 kN, influence of flexuralcracking became evident with the reversal of strains onthe underside of the flange from increasing compressive,to increasing tensile. This was accompanied with anincreasing gradient of increasing compressive strains onthe top surface of the flange with applied load.
At a load of approximately 120 kN, the trend of changein strain with increasing load on the top and bottom flangesuddenly reversed. As the load subsequently increased, thetrend in change in strain on the top surface of the flange withapplied load immediately reversed to become increasingcompressive with a lower gradient than that which wasobserved prior to this change in trend. The tensile strains onthe underside of flange continued to decrease. No physicalchange in the specimen was observed at this load.
The formation of a significant diagonal web crack ata load of 212 kN caused sharp variations in the trends ofthe change in strain with applied load on the top andbottom surface of the flanges. On the top surface, themagnitude of the compressive strains quickly decreased,
and then continued to remain reasonably constant untilthe failure load. The strains on the underside of theflange rapidly decreased at this load and subsequentlycontinued on their decreasing trend becoming small andcompressive at the peak load.
Although some small discontinuities were observedin gauges located at the centre of the depth of the flangeat loads associated with those causing significantchanges in trends of strain on the top and bottom surfaceof the flange, no significant change in trend arose duringthe loading history.
Figure 14 shows the results of the gauges at SectionB on Beam B2. Similar redistributions to thosediscussed at Section A were also observed at Section B.The most pronounced difference in the trends betweenSections A and B is the magnitude of the change instress that occurred on the top and bottom surface of theflange on the formation of the large diagonal web crackat a load of 212 kN. The decrease in compressive strainon the top surface of the flange and the increase incompressive strain on the bottom surface were such thatthe magnitude of strain at these levels of the flange wasvery similar at the peak load.
The gauges at the centre of the depth of the flangewere largely unaffected by the development of thefailure mechanism throughout this experiment.Although some small discontinuities were observed atloads associated with those causing significant changesin trends of strain on the top and bottom surface of theflange, no significant change arose. It can be observedthat the gauge at the centre of depth in row 2 at SectionB did exhibit larger magnitudes than other gauges.
Flange Strain Measurement in Shear Critical RC T-Beams
500 Advances in Structural Engineering Vol. 9 No. 4 2006
(a) Left Hand Flange Overhang (b) Right Hand Flange Overhang
0 50 100 150 200 250
Load (kN)
Row 1 Top Row 1 Mid Depth Row 1 U/Side
Row 2 Top Row 2 Mid Depth Row 2 U/Side
Row 3 Top Row 3 Mid Depth Row 3 U/Side
0 50 100 150 200 250
Load (kN)
Row 1 Top Row 1 Mid Depth Row 1 U/Side
Row 2 Top Row 2 Mid Depth Row 2 U/Side
Row 3 Top Row 3 Mid Depth Row 3 U/Side
–300
–250
–200
–150
–100
–50
0
50
100
–350
–300
–250
–200
–150
–100
–50
0
50
100
Str
ain
(µε)
Str
ain
(µε)
Gauges on undersideof flange
Gauges on top of flange
Figure 14. Strains measured in the flange at section B on Beam B2
ASE_04_05_353-Al-Mahaidi 1/8/06 10:13 am Page 500

5.2.2. Strains in the web of the beam
As the trend of change in strain with applied load isreasonably similar for gauges in the flange overhangs,one representative row of gauging is used to comparestrain distributions throughout the depth with gauges inthe flange and in the web region. This comparison isshown in Figure 15. The loads that the distributionscorrespond to are those just prior to the onset of diagonalweb cracking (75 kN), prior to the redistribution at 120 kN (110 kN), after the redistribution at 110 kN (180 kN), after the third diagonal crack formed (215 kN),and at the peak load (238 kN). Gauges in Row 1 of theflange were selected for comparison with the web gauges.
Part (a) of this figure shows that the distribution ofstrains throughout the depth of the flange at Section Aremained mostly linear throughout the loading history.At Section B however, the distribution through the depthshown in part (b) of Figure 15 did become nonlinear inthe flanges following the formation of the significantdiagonal web crack at 212 kN. The distributions at 215 kN and 238 kN show a reduction in strain on the topsurface of the flange whilst the strains at the centre ofdepth and on the underside of the flange continued toincrease. This is similar to that observed in Beam 1 prior
to the formation of the crack on the top surface of theflange. However, in this specimen, the flexural failureoccurred before this shear crack could develop.
Part (c) of Figure 15 indicates that the straindistribution displayed for the loads selected was notlinear throughout the depth. In the early stages ofloading, the gauge located 50 mm from the underside ofthe flange exhibited strains that did not fit the lineartrend. As the loading progressed, the strain measuredfrom this gauge became high in tensile magnitudefollowing the formation of the significant diagonal webcrack at 215 kN. The strains on the top surface of theflange also began to decrease following the formation ofthis web crack accompanied by a reversal of strains onthe bottom surface of the flange. It appears that theredistribution to accommodate the formation of thecrack on the top surface (similar to that of Beam B1)was underway when flexural failure occurred.
Part (d) of Figure 15 indicates that the straindistribution displayed for the loads selected was not linearthrough the depth. At this section, linear distributions areobserved through the depth of the flanges for all loadsconsidered, however, the gauge located 50 mm from theunderside of the flange did not fit a linear trend for the
Craig Giaccio, Riadh Al-Mahaidi and Geoff Taplin
Advances in Structural Engineering Vol. 9 No. 4 2006 501
0
25
50
75
100
125
150
–500 0 500 1000 1500 2000µε
Dep
th fr
om T
op o
f Fla
nge
(mm
)
75kN 110kN 180kN 215kN 238kN
Line of Top of Flange
Line of U/Side of Flange
=4430 at peak load
0
25
50
75
100
125
150
–400 –200 0 200 400 600µε
Dep
th fr
om T
op o
f Fla
nge
(mm
)
75kN 110kN 180kN 215kN 238kN
Line of Top of Flange
Line of U/Side of Flange
0
25
50
75
100
–600 –400 –200 0 200µε
Dep
th fr
om T
op o
f Fla
nge
(mm
)
75kN 110kN 180kN 215kN 238kN
Line of Top of Flange
Line of U/Side of Flange
0
25
50
75
100
–300 –200 –100 0 100µε
Dep
th fr
om T
op o
f Fla
nge
(mm
)
75kN 110kN 180kN 215kN 238kN
Line of Top of Flange
Line of U/Side of Flange
(a) Section A Row 2 (b) Section B Row 2
(c) Section A Web (d) Section B Web
Figure 15. Strains distributions throughout the depth of Beam B2
ASE_04_05_353-Al-Mahaidi 1/8/06 10:13 am Page 501

loads selected. Following the redistribution at 140 kN, thestrains on top surface of the web began to decrease whilethose measured at gauges at the centre of the depth of theflange and at the underside of the flange continued toincrease in magnitude with applied load. The highesttensile strains at the level of the soffit of the flange wererecorded prior to the formation of the significant diagonalweb crack at 212 kN. Following the formation of thisdiagonal web crack, the strains at this location decreasedsignificantly, becoming compressive at the peak load.The gauge embedded in the web below the soffit of theflange displayed high and increasing tensile strainsfollowing the formation of this diagonal web crack.
Comparison of part (b) and part (d), i.e. thedistribution of strain between the flanges and web atSection B, illustrates that as the tensile strains increasedat the junction of the flange to web interface, thecompressive strains on the underside of the flange and atthe centre of depth of the flange increased, indicating atransverse redistribution of strain across the width of theflange. This will in part be a result of decreasingcompressive strains on the top surface of the flange.
Figure 16 shows an illustration of the crack pattern onthe specimen with the location of Sections A and B ofgauges along with lines to indicate the locations of thecentre lines of the embedded gauges. With thissuperposition of the location of these gauges in relationto the cracks that were present at failure, it is very clearthat the interaction of two separate diagonal web cracksinfluenced the strain distribution. The distribution ofstrain throughout the depth at Section A at the peak loadin Figure 15 (shown in a thicker line) indicatescompressive strains throughout the flange, and hightensile strains at the gauge 50 mm below the undersideof the flange. The high tensile strains are a result of theintersection with a diagonal web crack as illustrated inthis Figure. The distribution of strain through the depthat Section B in Figure 15 indicates that tensile strainswere present at the flange to web interface for themajority of the loading history while the gauge 50 mmbelow the underside of the flange was displaying
compressive strains. At the peak load, a diagonal webcrack intersected the gauge 50 mm below the soffit ofthe flange resulting in significant tensile strainsprevailing. The magnitude of the tensile strainsdecreased at the level of the soffit of the flange at thepeak load. The resulting strain distribution owing tothese complex interactions of cracks is highly nonlinearand is not that which corresponds to a plane section.
6. DISCUSSION OF THE RESULTSThe results of the instrumentation programmedemonstrate that the formation of the cracks associatedwith the shear failure mechanism produce significantredistributions of strain in the flange and compressiveregion of the web. These redistributions prevail boththroughout the depth and transversely across the width ofthe flange. The most pronounced redistributions observedin the tests presented in this work were throughout thedepth of the flange and compressive region of the web.
The redistribution of strain throughout the depth isassociated with the formation of the transverse crack onthe top surface of the flange. It is suggested that thedevelopment of this crack forces compressive strains onthe top surface of the flange that result from bending atthe cross section downward through the flange toaccommodate the development of this crack. Thisdownward movement of compressive strains is requiredin a cross section in order to maintain equilibrium at thecross section.
The redistribution of the strains throughout the widthof the flange is associated with the propagation of thediagonal web crack to the flange-web interface. It issuggested that as a diagonal web crack propagates toand begins to penetrate the flange, compressive strainsat the flange-web interface that result from bending areforced transversely into the flange overhang toaccommodate the propagation of this crack. Thistransverse redistribution of compressive strains isrequired in a cross section in order to maintainequilibrium at the cross section.
Analytical methods such as those developed byPlacas and Regan (1971) that require estimation of theeffective width in shear resistance require considerationof a complex series of redistributions of strain toaccommodate the shear failure mechanism that is notonly cross sectional in nature, but interacts with theshear span. Linear elastic methods that form the basisfor calculation of the effective width of the flange inflexure cannot be adopted due to these redistributions.
The simplified method developed for implementationof the MCFT relies on the assumption of a strain gradient.The strain gradient suggested in the formulation is one oflinear variation throughout the depth. The results of this
Flange Strain Measurement in Shear Critical RC T-Beams
502 Advances in Structural Engineering Vol. 9 No. 4 2006
Centreline of embedded gauges
Section ASection B
Load
Region ofcrushed concrete
Figure 16. Illustration of crack pattern with location of embedded
gauges specimen B2
ASE_04_05_353-Al-Mahaidi 1/8/06 10:13 am Page 502

investigation show that the strain distribution at shearfailure within the shear span is highly non linearthroughout the depth of the flange and into the web,therefore indicating that the assumption that is made inthis implementation may be a source of error in itsapplication to RC T-beams. Implementation of thismethod to calculate the shear capacity of RC T-beamsrequires the input of a strain gradient representative ofthat which arises from the shear failure mechanism.
The crack pattern that prevailed at failure inSpecimen B1 was similar to that hypothesised by Hoang(1997) in the development of a plasticity based methodto calculate the shear capacity of RC T-beams. Thestrain distribution in Specimen B2 at failure indicatedthat the magnitude of the compressive strains on the topsurface of the flange decreased, and compressive strainsdeveloped on the bottom surface of the flange at bothsections of instrumentation when the formation of theshear failure mechanism was interrupted by the failureof the specimen in flexure. This indicates that the crackon the top surface of the flange was developing whenthe specimen failed in flexure. These results, along withthose presented in Giaccio et al. (2002), indicate thatthis failure mechanism is an adequate representation ofthe shear failure mechanism in RC T-beams. Thisfailure mechanism could be used as a basis to derivea strain gradient to implement into strain based methodsof calculating the shear resistance of RC T-beams
7. CONCLUSIONSThis paper presented the results of an investigation intothe distribution of longitudinal strains through the widthand depth of two web reinforced RC T-beams. Theinfluence of the formation of shear cracks was discussed,as were the redistributions of strain that accompaniedthese cracks. Assumptions made in the application ofstate of the art methods available for prediction of theshear resistance of RC T-beams were discussed in lightof the results of this investigation, and improvements tothe prediction of shear strength using these methods werealso discussed.
The following conclusions are drawn from this work:1) Formation of the shear failure mechanism
resulted in strain redistributions throughout thewidth and depth of the flange as well as thecompressive region of the web.
2) Transverse redistributions of strain from the webto the flange at a cross section occurred in orderto accommodate the propagation of diagonalweb cracks into the flange.
3) Vertical redistributions of strain at a crosssection occurred as the formation of thetransverse crack on the top surface of the flange
forced compressive strains downward in theflange.
4) Linear strain distributions throughout the depthof a section, and distributions of straincalculated throughout the width of the flange ofan RC T-beam using linear elastic analysis arenot valid for the implementation of analyticalmethods that are reliant on assumed straindistributions.
5) The mechanism in Hoang (1997) adequatelyrepresents the shear failure mechanism of RCT-beams as validated in these tests and thosepresented in Giaccio et al. (2002). This mechanismcould be used as a basis for developing a straindistribution throughout the width and depth of anRC T-beam that would eliminate a source of errorin the implementation of methods of predictingshear resistance of RC T-beams that are reliant onassumed strain distributions.
REFERENCESAl-Alusi, A. F. (1957). “Diagonal tension strength of reinforced
concrete T-beams with varying shear span”, ACI Journal, Vol.
53, pp. 1067–1077.
ASCE-ACI Committee 445 (1998). “Recent approaches to shear
design of structural concrete”, Journal of Structural Engineering,
ASCE, Vol. 124, No. 12, pp. 1375–1417.
AS3600 (2001). Concrete Structures, Standards Australia, Sydney.
Brendel, G. (1964). “Strength of the compression slab of T-beams
subject to simple bending”, Journal of the American Concrete
Institute, Vol. 61, No. 1, pp. 57–75.
CEB-FIP (1993). CEB-FIP Model Code 1990, Comite Euro-
International du Beton.
Chong, O. Y. (1980). Ultimate Shear Strength of Uniformly Loaded
Reinforced Concrete Tee Beams, Masters Thesis, Department of
Civil Engineering, University of Glasgow.
Darwish, M. N., Gesund, H. and Lee, D. D. (2000). “A discussion of
“recent approaches to shear Design of Structural Concrete””,
Journal of Structural Engineering, ASCE, Vol. 126, No.7,
pp. 853–854.
Fok, W. K. (1972). The Shear Strength of Reinforced Concrete T
Beams with Unreinforced and Shear-reinforced Webs, PhD
Thesis, Department of Civil Engineering, University of Glasgow.
Ferguson, P. M. and Thomson, J. N. (1953). “Diagonal Tension in
T-Beams without Stirrups”, ACI Journal, Vol. 50, pp. 665–675.
Giaccio, C., Al-Mahaidi, R. S. and Taplin, G. (2004). “Flange
contribution of the flange to the resistance of shear of an RC
T-beam. Part II: flange contribution”, Submitted to ACI
Structural Journal for possible publication.
Giaccio, C., Al-Mahaidi, R. S. and Taplin, G. (2004). “Flange
effectiveness in the shear strength of RC T-beams”, Accepted for
publication in the Proceedings of the 18th ACMSM Conference,
Perth, Australia.
Craig Giaccio, Riadh Al-Mahaidi and Geoff Taplin
Advances in Structural Engineering Vol. 9 No. 4 2006 503
ASE_04_05_353-Al-Mahaidi 1/8/06 10:13 am Page 503

Giaccio, C. (2003). Flange Effectiveness in the Resistance of
Sectional Shearing Forces in Web Reinforced RC T-Beams
Subjected to a Concentrated Point Load, PhD Thesis, Department
of Civil Engineering, Monash University, Victoria, Australia.
Giaccio, C., Al-Mahaidi, R. S. and Taplin, G. (2002). “Experimental
study on the effect of flange geometry on the shear strength of
point loaded RC T-beams”, Canadian Journal of Civil
Engineering, Vol. 29, No. 6, pp. 911–918.
Giaccio, C., Al-Mahaidi, R. S. and Taplin, G. (2000). “Flange
effectiveness in the shear strength of RC T-beams”, APSEC 2000,
K.L., pp. 462–472.
Hoang, L. C. (1997). Shear Strength of Non-Shear Reinforced
Concrete Elements Part 2. T-Beams, Technical University of
Denmark, pp. 32.
Hsu, T. T. C. (1988). “Softened truss model theory for shear and
torsion”, ACI Structural Journal, Vol. 85, No. 6, pp. 624–635.
Klein, G. J. and Popovic, P. L. (1985). Strength Evaluation of
Existing Bridges, Publication SP ACI 88, pp. 199–224.
Levi, F. (1961). “Work of the European concrete committee”,
Journal of the American Concrete Institute, Vol. 32, No. 9,
pp. 1041–1069.
Pang, X. B. and Hsu, T. T. O. (1996). “Fixed angle softened truss
model for reinforced concrete”, ACI Structural Journal, Vol. 93,
No. 2, pp. 197–207.
Placas, A. and Regan, P. E. (1971). “Shear failure of reinforced
concrete beams”, ACI Journal, Vol. 68, pp. 763–773.
Swamy, N. and Qureshi, S. A. (1971). “Strength, cracking and
deformation similitude of reinforced T-beams under bending and
shear”, ACI Journal, Vol. 68, No. 187–195.
Swamy, R. N. (1969). “Shear failure in reinforced concrete beams
without web reinforcement”, Civil Engineering and Public Works
Review, pp. 237–243.
Taplin, G. and Al-Mahaidi, R. (2000). “Experimental investigation
of shear critical T-beams”, 3rd Structural Specialty Conference,
Canada, pp. 486–492.
Vecchio, F. J. (2001). “Disturbed stress field model for reinforced
concrete: implementation”, Journal of Structural Engineering,
ASCE, Vol. 127, No. 1, pp. 12–20.
Vecchio, F. J. (2000). “Disturbed stress field model for reinforced
concrete: formulation”, Journal of Structural Engineering,
ASCE, Vol. 126, No. 9, pp. 1070–1077.
Vecchio, F. J. (1990). “Reinforced concrete membrane element
formulations”, Journal of Structural Engineering, ASCE, Vol.
116, No. 3, pp. 730–751.
Vecchio, F. J. (1999). “Predicting the response of concrete beams
subjected to shear using modified compression theory”, ACI
Journal, Vol. 85, No. 3, pp. 258–268.
Vecchio, F. J. and Collins, M. (1986). “The modified compression-
field theory for reinforced concrete elements subjected to shear”,
ACI Journal, Vol. 83, No. 2, pp. 219–231.
Flange Strain Measurement in Shear Critical RC T-Beams
504 Advances in Structural Engineering Vol. 9 No. 4 2006
Craig Giaccio is a Senior Bridge Engineer with Ove Arup Consulting Engineers,
based in Dublin in the Republic of Ireland. He received his BE(Hons) from the
University of Adelaide, and his PhD from Monash University. His professional
interests include the economic design of bridge structures, analysis and design of
reinforced and prestressed concrete structures, finite element analysis of concrete
structures, and the fatigue life prediction of steel structures. He is a member of
IABSE, IEAust, and IEI and undertakes external reviewing duties for the Structural
Engineering International Journal.
Riadh Al-Mahaidi is Head of the Structures Group in the Department of Civil
Engineering at Monash University in Melbourne, Australia. Be received his BSc
degree from the University of Baghdad and his MSc and PhD from Cornell University.
He is a member of ACI-ASCE Committee 447, Finite Element Analysis of Concrete
Structures. His research interests include analysis and design of reinforced and
prestressed concrete elements and structures, finite element modelling of concrete
structures, strength assessment of concrete bridges and rehabilitation of structures
using FRP composites. He is a member of IEAust, ASCE, ACI, IABSE and IIFC.
ASE_04_05_353-Al-Mahaidi 1/8/06 10:13 am Page 504

Craig Giaccio, Riadh Al-Mahaidi and Geoff Taplin
Advances in Structural Engineering Vol. 9 No. 4 2006 505
Geoff Taplin is a Principal Engineer-Structures with Maunsell Australia Pty. Ltd.
Based in Melbourne, Australia. His career has spanned both consulting engineering
and academia in the field of structural engineering. Prior to joining Maunsell
Australia, he was a Senior Lecturer in Structural Engineering at Monash University in
Melbourne, Australia. He has experience in building and bridge structures, and
strength assessment of bridges, he is a member of the Technical Committee of the
International Association of Bridge and Structural Engineering, and is Chairman of
their Structural Engineering Documents Board. He has a PhD and MEngSc, both from
Monash University.
ASE_04_05_353-Al-Mahaidi 1/8/06 10:13 am Page 505