Flagellum Density Regulates Proteus mirabilis Swarmer … · 2013-04-29 · using Novagen BugBuster...
11
Published Ahead of Print 9 November 2012. 2013, 195(2):368. DOI: 10.1128/JB.01537-12. J. Bacteriol. Sacotte and Douglas B. Weibel Hannah H. Tuson, Matthew F. Copeland, Sonia Carey, Ryan Environments mirabilis Swarmer Cell Motility in Viscous Flagellum Density Regulates Proteus http://jb.asm.org/content/195/2/368 Updated information and services can be found at: These include: SUPPLEMENTAL MATERIAL Supplemental material REFERENCES http://jb.asm.org/content/195/2/368#ref-list-1 at: This article cites 64 articles, 33 of which can be accessed free CONTENT ALERTS more» articles cite this article), Receive: RSS Feeds, eTOCs, free email alerts (when new http://journals.asm.org/site/misc/reprints.xhtml Information about commercial reprint orders: http://journals.asm.org/site/subscriptions/ To subscribe to to another ASM Journal go to: on April 27, 2013 by Univ of Wisconsin - Mad http://jb.asm.org/ Downloaded from
Transcript of Flagellum Density Regulates Proteus mirabilis Swarmer … · 2013-04-29 · using Novagen BugBuster...
Published Ahead of Print 9 November 2012. 2013, 195(2):368. DOI: 10.1128/JB.01537-12. J. Bacteriol.
Sacotte and Douglas B. WeibelHannah H. Tuson, Matthew F. Copeland, Sonia Carey, Ryan Environmentsmirabilis Swarmer Cell Motility in Viscous Flagellum Density Regulates Proteus
http://jb.asm.org/content/195/2/368Updated information and services can be found at:
These include:
SUPPLEMENTAL MATERIAL Supplemental material
REFERENCEShttp://jb.asm.org/content/195/2/368#ref-list-1at:
This article cites 64 articles, 33 of which can be accessed free
CONTENT ALERTS more»articles cite this article),
Receive: RSS Feeds, eTOCs, free email alerts (when new
http://journals.asm.org/site/misc/reprints.xhtmlInformation about commercial reprint orders: http://journals.asm.org/site/subscriptions/To subscribe to to another ASM Journal go to:
on April 27, 2013 by U
niv of Wisconsin - M
adhttp://jb.asm
.org/D
ownloaded from

Flagellum Density Regulates Proteus mirabilis Swarmer Cell Motilityin Viscous Environments
Hannah H. Tuson,a Matthew F. Copeland,b Sonia Carey,a Ryan Sacotte,a Douglas B. Weibela,c
Department of Biochemistry, University of Wisconsin—Madison, Madison, Wisconsin, USAa; Department of Chemical and Biological Engineering, University ofWisconsin—Madison, Madison, Wisconsin, USAb; Department of Biomedical Engineering, University of Wisconsin—Madison, Madison, Wisconsin, USAc
Proteus mirabilis is an opportunistic pathogen that is frequently associated with urinary tract infections. In the lab, P. mirabiliscells become long and multinucleate and increase their number of flagella as they colonize agar surfaces during swarming.Swarming has been implicated in pathogenesis; however, it is unclear how energetically costly changes in P. mirabilis cell mor-phology translate into an advantage for adapting to environmental changes. We investigated two morphological changes thatoccur during swarming—increases in cell length and flagellum density—and discovered that an increase in the surface density offlagella enabled cells to translate rapidly through fluids of increasing viscosity; in contrast, cell length had a small effect on motil-ity. We found that swarm cells had a surface density of flagella that was �5 times larger than that of vegetative cells and weremotile in fluids with a viscosity that inhibits vegetative cell motility. To test the relationship between flagellum density and veloc-ity, we overexpressed FlhD4C2, the master regulator of the flagellar operon, in vegetative cells of P. mirabilis and found that in-creased flagellum density produced an increase in cell velocity. Our results establish a relationship between P. mirabilis flagel-lum density and cell motility in viscous environments that may be relevant to its adaptation during the infection of mammalianurinary tracts and movement in contact with indwelling catheters.
Proteus mirabilis is a Gram-negative rod-shaped gammaproteo-bacterium that is commonly associated with urinary tract in-
fections (1) and the biofouling of catheters (2–4). P. mirabilis mayalso be present in the human gut microflora (5) and is correlatedwith the incidence of colitis (6, 7). Broth-grown vegetative cells ofP. mirabilis are characteristically �2 �m long and have aperitrichous distribution of �4 to 10 flagella. The flagella form abundle that performs work on the surrounding fluid and propelscells forward via a mechanism that is similar to the motility systemof Escherichia coli (8, 9).
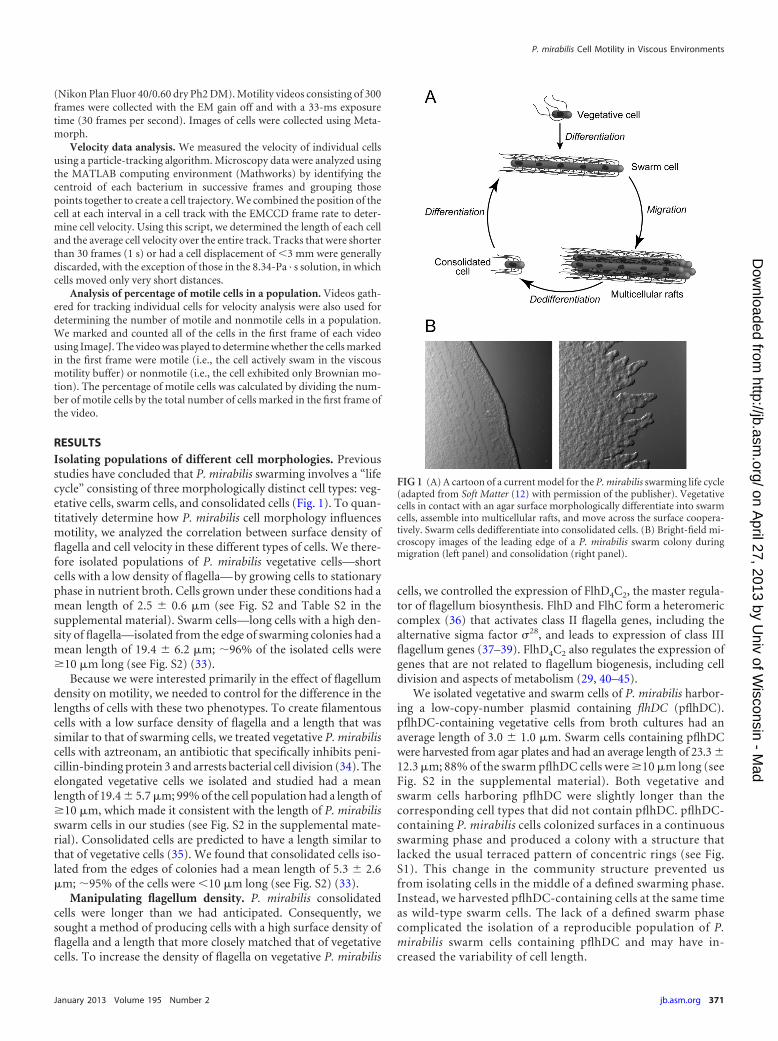
Broth-grown vegetative cells of P. mirabilis in contact with thesurface of agar gels infused with nutrients change their morphol-ogy, become “swarmers,” and colonize the surface by coordinat-ing the movement of large groups of cells (i.e., “swarming”) (seeFig. 1A). P. mirabilis swarm colonies exhibit a terraced pattern ofconcentric rings (see Fig. S1 in the supplemental material) (10).These rings are produced by alternating phases of consolidation,during which the colony does not expand and cells are dediffer-entiated into a vegetative cell-like morphology, and swarming,during which cells are motile and differentiated (11). Motility oc-curs predominantly at the swarm front and decreases with in-creasing distance from the front; cells near the center of the swarmare nonmotile. Swarming has several characteristics, including thefollowing: (i) the inhibition of cell division to produce long (10- to70-�m) multinucleate cells, (ii) an increase in the surface densityof flagella, (iii) the secretion of biomolecules that alter the surfacetension of water and extract a thin layer of fluid from the gel, and(iv) the movement of cells in close physical proximity within thethin layer of fluid (11–14). In this work, we investigated whethercell length and flagellum density confer an advantage for swarmcell motility.
Bacteria live at a low Reynold’s number, where viscous forcesplay a central role in motility (15), and flagella enable P. mirabiliscells to move through fluids at a relatively high energetic cost tothe cell (�2% of the total energy of the cell) (16). The motility of
vegetative bacterial cells increases as the dynamic viscosity of thesurrounding fluid increases; above a threshold that varies for dif-ferent species of bacteria, cell velocity decreases rapidly (17–23).The viscosity required for complete inhibition of motility varieswidely, with values ranging from 0.06 to �1 Pa · s (17). The rela-tionship between velocity and viscosity can be explained in part bytreating the liquid as a loose, quasirigid network that increases theresistance to cell movement in the direction normal to the cellbody (24). P. mirabilis vegetative cell motility in viscous liquidshas been investigated (25); however, little is known about the ef-fect of increasing viscosity on the motility of swarm cells of bacte-ria, including P. mirabilis.
In this work, we quantified the connection between motility,cell length, and the surface density of flagella on P. mirabilis cells.We tested the hypothesis that these phenotypes convey an advan-tage for the movement of P. mirabilis swarm cells through viscousfluids, including the extracellular environment found in swarms(26, 27). We isolated and characterized populations of P. mirabiliscells with the following combinations of cell length and flagellumdensity: (i) short cells with a normal density of flagella (vegetativecells), (ii) long cells with a normal density of flagella (elongatedvegetative cells), (iii) long cells with a high density of flagella(swarm cells), and (iv) short cells with a high density of flagella(consolidated cells). We quantitatively measured the motility of
Received 23 August 2012 Accepted 6 November 2012
Published ahead of print 9 November 2012
Address correspondence to Douglas B. Weibel, [email protected].
H.H.T. and M.F.C. contributed equally to this work.
Supplemental material for this article may be found at http://dx.doi.org/10.1128/JB.01537-12.
Copyright © 2013, American Society for Microbiology. All Rights Reserved.
doi:10.1128/JB.01537-12
368 jb.asm.org Journal of Bacteriology p. 368–377 January 2013 Volume 195 Number 2
on April 27, 2013 by U
niv of Wisconsin - M
adhttp://jb.asm
.org/D
ownloaded from
individual cells of each of these categories in liquids that had arange of viscosities. These experiments enabled us to determinethe roles of cell length and flagellum density in bacterial cell mo-tility in viscous environments.
Additionally, we examined the effect of overexpressing flhDC,a well-established regulator of swarming, on cell motility. Tran-sient upregulation of the flhDC genes during swarming contrib-utes to the high density of flagella on P. mirabilis cells and may beinvolved in regulation of cell division (28, 29). We hypothesizedthat the additional expression of flhDC may increase the density offlagella compared to that of wild-type (WT) cells and convey anadvantage in cell motility relative to wild-type swarm or vegetativecells.
In this work, we demonstrated that the motility of P. mirabiliscells in viscous fluids is correlated with the surface density of fla-gella. Not only are swarm cells (long and hyperflagellated) fasterthan vegetative cells; importantly, FlhDC-overexpressing vegeta-tive cells (short and hyperflagellated) are also faster than wild-typevegetative cells with a normal flagellum density. These results sug-gest that an increase in flagellum density is important for P. mira-bilis motility in viscous fluids and provide insight into the move-ment of P. mirabilis cell types in the viscous environment ofswarming colonies.
MATERIALS AND METHODSBacterial strains and cell culture. P. mirabilis strain HI4320, a clinicalstrain isolated from a patient with urinary catheter-associated bacteriuria,was used for all of the cell motility studies in this work (30). The plasmidpflhDC contains the flhDC genes from P. mirabilis inserted intopACYC184 (a plasmid with a p15A origin and 10 to 12 copies per cell) andencodes the expression of FlhD and FlhC, which are affinity tagged withFLAG and His-6, respectively. We transformed plasmid pflhDC into wild-type strain HI4320 via electroporation and selected transformants on LBagar plates (3% [wt/vol]) containing chloramphenicol (34 �g/ml). Wegrew bacteria in nutrient medium consisting of 1% (wt/vol) peptone(Becton, Dickinson, Sparks, MD), 0.5% (wt/vol) yeast extract (Becton,Dickinson), and 1% (wt/vol) NaCl (Fisher Scientific, Fairlawn, NJ) at30°C in a shaking incubator. We used liquid nutrient medium containing1.5% (wt/vol) Difco agar (Becton, Dickinson) for swarming assays.
Harvesting samples with different morphologies. We prepared cul-ture medium for isolating swarm and consolidated P. mirabilis cells byinoculating cells onto the surface of a 1.5% (wt/vol) Bacto Difco agar gelinfused with nutrient broth. Specifically, we pipetted 50 ml of hot swarmagar into 150- by 15-mm petri dishes (Becton, Dickinson), solidified theagar at 25°C for 30 min, and removed excess liquid from the surface bystoring the plates in a laminar flow hood for 20 min with the covers of thedishes ajar. We inoculated each plate with 4 �l of a suspension of �4 �105 P. mirabilis cells/ml. Following the absorption of the inoculum liquidinto the swarm agar (�20 min), plates were incubated at 30°C at 90%relative humidity in a static incubator.
After 15 h of incubation, we harvested swarm cells from the smoothleading edge of a migrating colony on an agar plate (see Fig. 1B) by re-moving them carefully using a 1-�l calibrated inoculation loop (220215;Becton, Dickinson). We harvested consolidated cells from the leadingedge of a colony that had a “fingered” appearance after 19 h of incubation.Cells were rinsed from the inoculation loop into 500 �l of motility buffer(0.01 M KPO4, 0.067 M NaCl, 10�4 M EDTA, pH 7.0, containing 0.1 Mglucose and 0.001% Brij-35) and centrifuged for 10 min at 1,500 � g. Thecell pellet was then resuspended as required for the various assays de-scribed below.
Vegetative cells were prepared by growing P. mirabilis overnight at30°C in a shaking incubator. Saturated overnight cultures were diluted100-fold in 11 ml of fresh nutrient medium and grown in 150-ml Erlen-
meyer flasks at 30°C in a shaking incubator at 200 rpm. We observed thatthe highest swimming velocity of vegetative cells occurred during station-ary phase, so vegetative cells were harvested at an absorbance (� � 600nm) of �3.2 and centrifuged. We harvested elongated vegetative cells bydiluting saturated overnight cultures 100-fold in 5 ml of fresh nutrientmedium and growing them at 30°C in a shaking incubator at 200 rpm toan absorbance (� � 600 nm) of �1.1. Cells were diluted 5-fold with freshnutrient medium, aztreonam was added to a final concentration of 10�g/ml, and cells were grown at 30°C in a shaking incubator at 200 rpm for70 min. Cells were harvested and centrifuged.
Quantitative Western blotting. Samples of the eight different cellmorphologies of interest were harvested as described above. Samples werethen diluted in fresh medium to an absorbance of 0.75. Cells were lysedusing Novagen BugBuster master mix (Darmstadt, Germany) accordingto the manufacturer’s instructions, and cell lysate was aliquoted andstored at �80°C until use. One aliquot was used to determine the totalprotein concentration using the Pierce bicinchoninic acid (BCA) proteinassay kit (Rockford, IL). Immediately prior to use, all samples werethawed and diluted to a concentration of 500 �g/ml. To ensure that sam-ples were within the range of the calibration curve, WT, pACYC, andpflhDC swarm samples were further diluted by a factor of 20. WT consol-idated and pflhDC vegetative samples were further diluted by a factor of 5.To account for a nonlinear response of the detector, a range of dilutions(from 1:5 to 1:200) of the 500-�g/ml WT swarm sample were also run oneach gel as a calibration curve. All samples were mixed 1:1 with Laemmlisample buffer (Bio-Rad, Hercules, CA) and subjected to electrophoresis intriplicate on three 12% polyacrylamide gels. Proteins were transferred tonitrocellulose for 1.5 h at 100 V. The nitrocellulose was rinsed severaltimes with distilled water (dH2O) and blocked overnight at 4°C in 5%nonfat dry milk in TBST (20 mM Tris, 137 mM NaCl, 1% [vol/vol] Tween20, pH 7.6). Blots were washed 3 times, 5 min each, in TBST. Primaryantibody against FliC was diluted 1:20,000 in 5% bovine serum albumin(BSA) in TBST, and blots were incubated in this solution for 1 h. Blotswere washed three times, 5 min each, in TBST. Goat anti-rabbit IgG sec-ondary antibody conjugated to horseradish peroxidase (HRP) was diluted1:75,000 in 2.5% nonfat dry milk in TBST, and blots were incubated in thissolution for 1 h. Blots were washed 3 times, 5 min each, in TBST. Thesurface of each blot was then incubated in ECL Plus reagent (GE Health-care) for 2 min, and blots were imaged using the ECL Plus setting on aTyphoon FLA 900 scanner (GE Healthcare). Band volumes were quanti-fied using ImageQuant (GE Healthcare). The data from each gel was cor-rected using the calibration curve specific to that gel. Two identical gelswere run in parallel for each of three biological replicates.
Immunofluorescence microscopy of P. mirabilis flagella. We iso-lated flagella from HI4320 cells to generate a polyclonal antibody to theFliC1 protein. Flagella were removed and purified, following the method-ology of Ibrahim et al. (31). The flagellin prep was lyophilized, and thepresence of FliC1 was confirmed via mass spectrometry (MSBioworks,LLC, Ann Arbor, MI). Flagellin was sent to Rockland Immunochemicals,Inc. (Gilbertsville, PA), for the immunization of rabbits and the produc-tion of polyclonal antibody. The antibody was purified from serum by firstperforming a buffer exchange using Zeba desalt spin columns (PierceBiotechnology, Rockford, IL) and then purifying IgG using a Melon gelIgG purification kit (Pierce Biotechnology) according to the manufactur-er’s instructions.
We performed immunostaining using a procedure modified from thatdescribed by Wozniak et al. (32). Slides and coverslips were cleaned usingRCA solution, dried under a stream of nitrogen, and assembled intochambers as described. Twenty microliters of poly-L-lysine was added toeach chamber, and the slide chambers were inverted for 3 min. Fifteenmicroliters of culture, harvested as described above, was added twice toeach chamber, and the slide chambers were inverted for 3 min. Twentymicroliters of 1% formaldehyde in 1� phosphate-buffered saline (PBS)was added to one side of the chamber (“side 1”), and the slide chamberswere inverted for 10 min. Twenty microliters of 1% formaldehyde in 1�
P. mirabilis Cell Motility in Viscous Environments
January 2013 Volume 195 Number 2 jb.asm.org 369
on April 27, 2013 by U
niv of Wisconsin - M
adhttp://jb.asm
.org/D
ownloaded from
PBS was added to the other side of the chamber (“side 2”), and the slidechambers were inverted for 10 min. Twenty microliters of blocking buffer(3% BSA and 0.2% Triton X-100 in 1� PBS) was added to side 1 of thechamber. The slide chambers were inverted onto wooden dowels placedin 150-mm petri dishes. The inner edges of the petri dishes were sur-rounded with damp Kimwipes, and the petri dishes were covered, para-filmed, and stored at 4°C overnight. The following day, primary antibodywas diluted 1:100 in blocking buffer. Twenty microliters of antibody so-lution was added to side 1 of the chamber, and the slide chambers wereinverted for 1 h. Twenty microliters of antibody solution was added to side2 of the chamber, and the slide chambers were inverted for 1 h. Twentymicroliters of washing buffer (0.2% BSA plus 0.05% Triton X-100 in 1�PBS) was added to side 1 of the chamber. Secondary antibody (Alexa Fluor488 goat anti-rabbit IgG; Invitrogen, Grand Island, NY) was diluted 1:50in blocking buffer. Twenty microliters of antibody solution was added toside 1 of the chamber, and the slide chambers were inverted for 30 min.Twenty microliters of antibody solution was added to side 2 of the cham-ber, and the slide chambers were inverted for 30 min. Twenty microlitersof washing buffer was added to side 1 of the chamber, followed by 20 �l of1� PBS. Slides were sealed with VALAP (equal parts Vaseline, lanolin,and paraffin wax) and imaged.
Following background subtraction, images were thresholded andmasks were created to block out the fluorescence from the cell bodies. Theflagellum-associated fluorescence (i.e., the total fluorescence within a cer-tain distance from the cell) was then determined. Finally, the dimensionsof the cell were used to normalize the resulting data for surface area. Tovalidate our method, the flagella on each cell in the wild-type vegetativesamples were counted. Plotting fluorescence intensity per surface area as afunction of the number of flagella per surface area produced a linearrelationship with an r-squared value of 0.66.
Quantitative PCR. Samples of the eight different cell morphologies ofinterest were harvested as described above. Two biological replicates ofeach sample were collected and analyzed in triplicate technical replicates.Cells were diluted in an ice-cold ethyl alcohol (EtOH)-phenol stop solu-tion (5% water-saturated phenol) and immediately spun at 8,000 � g for5 min at 4°C. After aspiration of the medium, the cell pellets were resus-pended in Tris-EDTA (TE) buffer (pH 8.0) containing lysozyme and so-dium dodecyl sulfate and heated at 64°C for 2 min. Following cell lysis,total RNA was isolated using a hot phenol extraction followed by a chlo-roform extraction step and finally an ethanol precipitation step. Sampleswere then treated with DNase I to remove contaminating DNA before thereverse transcriptase reaction. Isolation of total RNA was completed bysequentially performing the following steps: one phenol extraction, onephenol-chloroform (50:50) extraction, two chloroform extractions, andfinally an EtOH precipitation. Total RNA from each sample was quanti-fied using a Nanodrop spectrophotometer (Thermo Scientific, Wilming-ton, DE). An aliquot of each sample was subsequently diluted to 100�g/ml in diethyl pyrocarbonate (DEPC)-treated water. RNA was con-verted to cDNA using the Bio-Rad Laboratories iScript cDNA synthesiskit (catalog number 170-8890). Quantitative PCR was performed usingthe Bio-Rad iQ SYBR green supermix kit (catalog number 170-8880) andthe primers M316 (5=-TTTGCTTTTGGCGCAGAG-3=) and M317 (5=-GTGCATCAGCCATAGAATCG-3=) for detection of flhD mRNA andM319 (5=-GCGAAAGATATTCGCCTAGC-3=) and M320 (5=-AACGCCCTCGACTTAATTGC-3=) for flhC mRNA. PCR and sample analysis wereperformed using a Bio-Rad CFX96 Touch real-time PCR detection systemand the CFX Manager software program, respectively.
Preparation of PVP K90 solutions and rheology measurements. Weprepared a stock solution (�20% [wt/vol]) of polyvinylpyrrolidone(PVP) K90 (average molecular mass � 360 kDa; Wako Pure ChemicalIndustries, Ltd., Osaka, Japan) by dissolving 200 g of PVP K90 in glucose-free motility buffer while heating and stirring vigorously. The solution wasfiltered to remove colloidal material. We prepared solutions with lowerconcentrations of PVP K90 (�10, 5, 2, 1, 0.5, 0.25, and 0.125% [wt/vol])by diluting the stock solution in glucose-free motility buffer. PVP K90
solutions were autoclaved and cooled to room temperature, after whichglucose was added to a concentration of 0.1 M. Due to the difficulty ofaccurately measuring large volumes of high-viscosity solutions, we per-formed loss-on-drying experiments to determine the actual weight per-centage of PVP K90 in each solution. The results of these measurementsare presented in Table S1 in the supplemental material.
We measured the viscosity of PVP samples at 25°C using a small sam-ple adapter on a Brookfield DVIII rheometer. The polymer solutions wereapproximately Newtonian and had a flow index coefficient of 0.9, as de-termined by fitting the data with a power law model. We used a spindle/chamber set that produced a torque above variance. The results of theviscosity measurements are tabulated in Table S1 in the supplementalmaterial.
Measuring viscosity of PVP solutions by fluorescent bead diffusion.Fluoro-Max-dyed red aqueous fluorescent particles (Thermo Fisher Sci-entific Inc., Waltham, MA) with a diameter of 100 nm were diluted1:1,000 from the stock into motility buffer. We then added 1 �l of theparticle solution to 50 �l of PVP solution. Samples were pipetted onto aglass slide in the center of a grease ring, covered with a no. 1.5 glasscoverslip, and imaged at 25°C on a Nikon Eclipse 80i upright microscopeequipped with a black-and-white Andor LucaS electron-multiplyingcharge-coupled-device (EMCCD) camera (Andor Technology, SouthWindsor, CT). Images were acquired using an X60 ELWD oil objective(Nikon plan fluor 60/1.40 oil Ph3 DM). Motility videos consisting of 150to 500 frames were collected with a 33-ms exposure time (30 frames persecond). Images were collected using the Metamorph software program(version 7.5.6.0; MDS Analytical Technologies, Downington, PA). Wedetermined the distance traveled by particles between two consecutiveframes using the Mosaic plugin (http://www.mosaic.ethz.ch/Downloads/ParticleTracker) for the ImageJ software program (http://rsbweb.nih.gov/ij/) and calculated the viscosity of each solution via the Stokes-Einsteinequation.
Measuring viscosity of swarming fluid. We prepared and inoculatedswarm plates as described above. After 16 and 18 h of incubation, weexamined the plates by microscopy to find a region of the swarm wherecells were no longer moving. Fluoro-Max-dyed red aqueous fluorescentparticles with a diameter of 100 nm were diluted 1:1,000 from the stockinto motility buffer, and �0.1 �l of this solution was pipetted onto anonmotile region of the swarm. The spot was covered with a no. 1.5 glasscoverslip and imaged at 25°C on a Nikon Eclipse 80i upright microscopeequipped with a black-and-white Andor LucaS EMCCD camera. Imageswere acquired using an X60 ELWD oil objective. Videos consisting of 150to 500 frames were collected with a 33-msec exposure time (30 frames persecond). Images were collected using the Metamorph software program,version 7.5.6.0. We determined the distance traveled by particles betweentwo consecutive frames and calculated the viscosity of each solution asdescribed above.
Sample preparation for motility studies. Samples of the different cellmorphologies of interest were harvested as described above. Followingcentrifugation, we removed the supernatant and suspended the cell pelletin solutions of PVP K90 in motility buffer for cell velocity measurements.We used positive-displacement pipettes (Rainin Instruments LLC, Oak-land, CA) to dispense PVP solutions. Approximately 10 �l of a suspensionof cells was placed within a thin ring of Apiezon M grease (Apiezon Prod-ucts M&I Materials Ltd., Manchester, United Kingdom) on a precleanedglass slide and sealed with a no. 1.5 glass coverslip. We measured thevelocity of these cells as described in the section below. We found nodifference in cell velocity with precleaned glass slides and coverslips com-pared to that with slides and coverslips treated with a 0.1% (wt/vol) solu-tion of BSA. Therefore, all experiments were performed using untreatedglass.
Imaging P. mirabilis cells in viscous solutions. We imaged cells at25°C on a Nikon Eclipse 80i upright microscope equipped with a black-and-white Andor LucaS EMCCD camera (Andor Technology, SouthWindsor, CT). Images were acquired using an X40 ELWD dry objective
Tuson et al.
370 jb.asm.org Journal of Bacteriology
on April 27, 2013 by U
niv of Wisconsin - M
adhttp://jb.asm
.org/D
ownloaded from
(Nikon Plan Fluor 40/0.60 dry Ph2 DM). Motility videos consisting of 300frames were collected with the EM gain off and with a 33-ms exposuretime (30 frames per second). Images of cells were collected using Meta-morph.
Velocity data analysis. We measured the velocity of individual cellsusing a particle-tracking algorithm. Microscopy data were analyzed usingthe MATLAB computing environment (Mathworks) by identifying thecentroid of each bacterium in successive frames and grouping thosepoints together to create a cell trajectory. We combined the position of thecell at each interval in a cell track with the EMCCD frame rate to deter-mine cell velocity. Using this script, we determined the length of each celland the average cell velocity over the entire track. Tracks that were shorterthan 30 frames (1 s) or had a cell displacement of �3 mm were generallydiscarded, with the exception of those in the 8.34-Pa · s solution, in whichcells moved only very short distances.
Analysis of percentage of motile cells in a population. Videos gath-ered for tracking individual cells for velocity analysis were also used fordetermining the number of motile and nonmotile cells in a population.We marked and counted all of the cells in the first frame of each videousing ImageJ. The video was played to determine whether the cells markedin the first frame were motile (i.e., the cell actively swam in the viscousmotility buffer) or nonmotile (i.e., the cell exhibited only Brownian mo-tion). The percentage of motile cells was calculated by dividing the num-ber of motile cells by the total number of cells marked in the first frame ofthe video.
RESULTSIsolating populations of different cell morphologies. Previousstudies have concluded that P. mirabilis swarming involves a “lifecycle” consisting of three morphologically distinct cell types: veg-etative cells, swarm cells, and consolidated cells (Fig. 1). To quan-titatively determine how P. mirabilis cell morphology influencesmotility, we analyzed the correlation between surface density offlagella and cell velocity in these different types of cells. We there-fore isolated populations of P. mirabilis vegetative cells—shortcells with a low density of flagella— by growing cells to stationaryphase in nutrient broth. Cells grown under these conditions had amean length of 2.5 � 0.6 �m (see Fig. S2 and Table S2 in thesupplemental material). Swarm cells—long cells with a high den-sity of flagella—isolated from the edge of swarming colonies had amean length of 19.4 � 6.2 �m; �96% of the isolated cells were�10 �m long (see Fig. S2) (33).
Because we were interested primarily in the effect of flagellumdensity on motility, we needed to control for the difference in thelengths of cells with these two phenotypes. To create filamentouscells with a low surface density of flagella and a length that wassimilar to that of swarming cells, we treated vegetative P. mirabiliscells with aztreonam, an antibiotic that specifically inhibits peni-cillin-binding protein 3 and arrests bacterial cell division (34). Theelongated vegetative cells we isolated and studied had a meanlength of 19.4 � 5.7 �m; 99% of the cell population had a length of�10 �m, which made it consistent with the length of P. mirabilisswarm cells in our studies (see Fig. S2 in the supplemental mate-rial). Consolidated cells are predicted to have a length similar tothat of vegetative cells (35). We found that consolidated cells iso-lated from the edges of colonies had a mean length of 5.3 � 2.6�m; �95% of the cells were �10 �m long (see Fig. S2) (33).
Manipulating flagellum density. P. mirabilis consolidatedcells were longer than we had anticipated. Consequently, wesought a method of producing cells with a high surface density offlagella and a length that more closely matched that of vegetativecells. To increase the density of flagella on vegetative P. mirabilis
cells, we controlled the expression of FlhD4C2, the master regula-tor of flagellum biosynthesis. FlhD and FlhC form a heteromericcomplex (36) that activates class II flagella genes, including thealternative sigma factor 28, and leads to expression of class IIIflagellum genes (37–39). FlhD4C2 also regulates the expression ofgenes that are not related to flagellum biogenesis, including celldivision and aspects of metabolism (29, 40–45).
We isolated vegetative and swarm cells of P. mirabilis harbor-ing a low-copy-number plasmid containing flhDC (pflhDC).pflhDC-containing vegetative cells from broth cultures had anaverage length of 3.0 � 1.0 �m. Swarm cells containing pflhDCwere harvested from agar plates and had an average length of 23.3 �12.3 �m; 88% of the swarm pflhDC cells were �10 �m long (seeFig. S2 in the supplemental material). Both vegetative andswarm cells harboring pflhDC were slightly longer than thecorresponding cell types that did not contain pflhDC. pflhDC-containing P. mirabilis cells colonized surfaces in a continuousswarming phase and produced a colony with a structure thatlacked the usual terraced pattern of concentric rings (see Fig.S1). This change in the community structure prevented usfrom isolating cells in the middle of a defined swarming phase.Instead, we harvested pflhDC-containing cells at the same timeas wild-type swarm cells. The lack of a defined swarm phasecomplicated the isolation of a reproducible population of P.mirabilis swarm cells containing pflhDC and may have in-creased the variability of cell length.
FIG 1 (A) A cartoon of a current model for the P. mirabilis swarming life cycle(adapted from Soft Matter (12) with permission of the publisher). Vegetativecells in contact with an agar surface morphologically differentiate into swarmcells, assemble into multicellular rafts, and move across the surface coopera-tively. Swarm cells dedifferentiate into consolidated cells. (B) Bright-field mi-croscopy images of the leading edge of a P. mirabilis swarm colony duringmigration (left panel) and consolidation (right panel).
P. mirabilis Cell Motility in Viscous Environments
January 2013 Volume 195 Number 2 jb.asm.org 371
on April 27, 2013 by U
niv of Wisconsin - M
adhttp://jb.asm
.org/D
ownloaded from
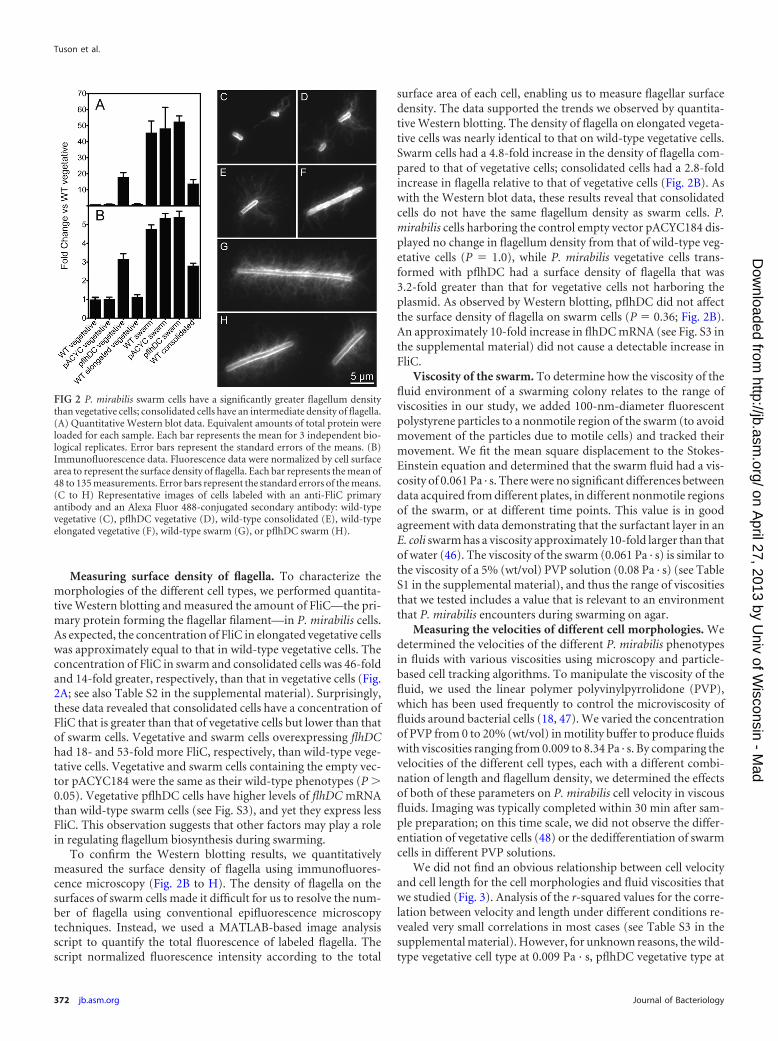
Measuring surface density of flagella. To characterize themorphologies of the different cell types, we performed quantita-tive Western blotting and measured the amount of FliC—the pri-mary protein forming the flagellar filament—in P. mirabilis cells.As expected, the concentration of FliC in elongated vegetative cellswas approximately equal to that in wild-type vegetative cells. Theconcentration of FliC in swarm and consolidated cells was 46-foldand 14-fold greater, respectively, than that in vegetative cells (Fig.2A; see also Table S2 in the supplemental material). Surprisingly,these data revealed that consolidated cells have a concentration ofFliC that is greater than that of vegetative cells but lower than thatof swarm cells. Vegetative and swarm cells overexpressing flhDChad 18- and 53-fold more FliC, respectively, than wild-type vege-tative cells. Vegetative and swarm cells containing the empty vec-tor pACYC184 were the same as their wild-type phenotypes (P 0.05). Vegetative pflhDC cells have higher levels of flhDC mRNAthan wild-type swarm cells (see Fig. S3), and yet they express lessFliC. This observation suggests that other factors may play a rolein regulating flagellum biosynthesis during swarming.
To confirm the Western blotting results, we quantitativelymeasured the surface density of flagella using immunofluores-cence microscopy (Fig. 2B to H). The density of flagella on thesurfaces of swarm cells made it difficult for us to resolve the num-ber of flagella using conventional epifluorescence microscopytechniques. Instead, we used a MATLAB-based image analysisscript to quantify the total fluorescence of labeled flagella. Thescript normalized fluorescence intensity according to the total
surface area of each cell, enabling us to measure flagellar surfacedensity. The data supported the trends we observed by quantita-tive Western blotting. The density of flagella on elongated vegeta-tive cells was nearly identical to that on wild-type vegetative cells.Swarm cells had a 4.8-fold increase in the density of flagella com-pared to that of vegetative cells; consolidated cells had a 2.8-foldincrease in flagella relative to that of vegetative cells (Fig. 2B). Aswith the Western blot data, these results reveal that consolidatedcells do not have the same flagellum density as swarm cells. P.mirabilis cells harboring the control empty vector pACYC184 dis-played no change in flagellum density from that of wild-type veg-etative cells (P � 1.0), while P. mirabilis vegetative cells trans-formed with pflhDC had a surface density of flagella that was3.2-fold greater than that for vegetative cells not harboring theplasmid. As observed by Western blotting, pflhDC did not affectthe surface density of flagella on swarm cells (P � 0.36; Fig. 2B).An approximately 10-fold increase in flhDC mRNA (see Fig. S3 inthe supplemental material) did not cause a detectable increase inFliC.
Viscosity of the swarm. To determine how the viscosity of thefluid environment of a swarming colony relates to the range ofviscosities in our study, we added 100-nm-diameter fluorescentpolystyrene particles to a nonmotile region of the swarm (to avoidmovement of the particles due to motile cells) and tracked theirmovement. We fit the mean square displacement to the Stokes-Einstein equation and determined that the swarm fluid had a vis-cosity of 0.061 Pa · s. There were no significant differences betweendata acquired from different plates, in different nonmotile regionsof the swarm, or at different time points. This value is in goodagreement with data demonstrating that the surfactant layer in anE. coli swarm has a viscosity approximately 10-fold larger than thatof water (46). The viscosity of the swarm (0.061 Pa · s) is similar tothe viscosity of a 5% (wt/vol) PVP solution (0.08 Pa · s) (see TableS1 in the supplemental material), and thus the range of viscositiesthat we tested includes a value that is relevant to an environmentthat P. mirabilis encounters during swarming on agar.
Measuring the velocities of different cell morphologies. Wedetermined the velocities of the different P. mirabilis phenotypesin fluids with various viscosities using microscopy and particle-based cell tracking algorithms. To manipulate the viscosity of thefluid, we used the linear polymer polyvinylpyrrolidone (PVP),which has been used frequently to control the microviscosity offluids around bacterial cells (18, 47). We varied the concentrationof PVP from 0 to 20% (wt/vol) in motility buffer to produce fluidswith viscosities ranging from 0.009 to 8.34 Pa · s. By comparing thevelocities of the different cell types, each with a different combi-nation of length and flagellum density, we determined the effectsof both of these parameters on P. mirabilis cell velocity in viscousfluids. Imaging was typically completed within 30 min after sam-ple preparation; on this time scale, we did not observe the differ-entiation of vegetative cells (48) or the dedifferentiation of swarmcells in different PVP solutions.
We did not find an obvious relationship between cell velocityand cell length for the cell morphologies and fluid viscosities thatwe studied (Fig. 3). Analysis of the r-squared values for the corre-lation between velocity and length under different conditions re-vealed very small correlations in most cases (see Table S3 in thesupplemental material). However, for unknown reasons, the wild-type vegetative cell type at 0.009 Pa · s, pflhDC vegetative type at
FIG 2 P. mirabilis swarm cells have a significantly greater flagellum densitythan vegetative cells; consolidated cells have an intermediate density of flagella.(A) Quantitative Western blot data. Equivalent amounts of total protein wereloaded for each sample. Each bar represents the mean for 3 independent bio-logical replicates. Error bars represent the standard errors of the means. (B)Immunofluorescence data. Fluorescence data were normalized by cell surfacearea to represent the surface density of flagella. Each bar represents the mean of48 to 135 measurements. Error bars represent the standard errors of the means.(C to H) Representative images of cells labeled with an anti-FliC primaryantibody and an Alexa Fluor 488-conjugated secondary antibody: wild-typevegetative (C), pflhDC vegetative (D), wild-type consolidated (E), wild-typeelongated vegetative (F), wild-type swarm (G), or pflhDC swarm (H).
Tuson et al.
372 jb.asm.org Journal of Bacteriology
on April 27, 2013 by U
niv of Wisconsin - M
adhttp://jb.asm
.org/D
ownloaded from
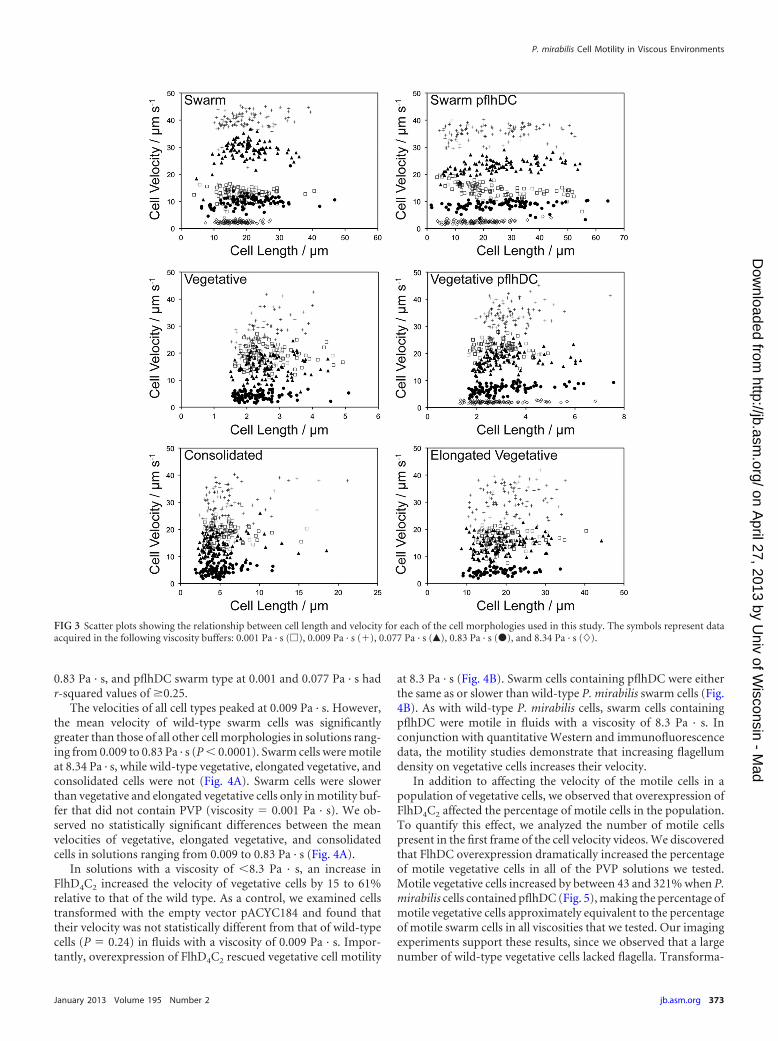
0.83 Pa · s, and pflhDC swarm type at 0.001 and 0.077 Pa · s hadr-squared values of �0.25.
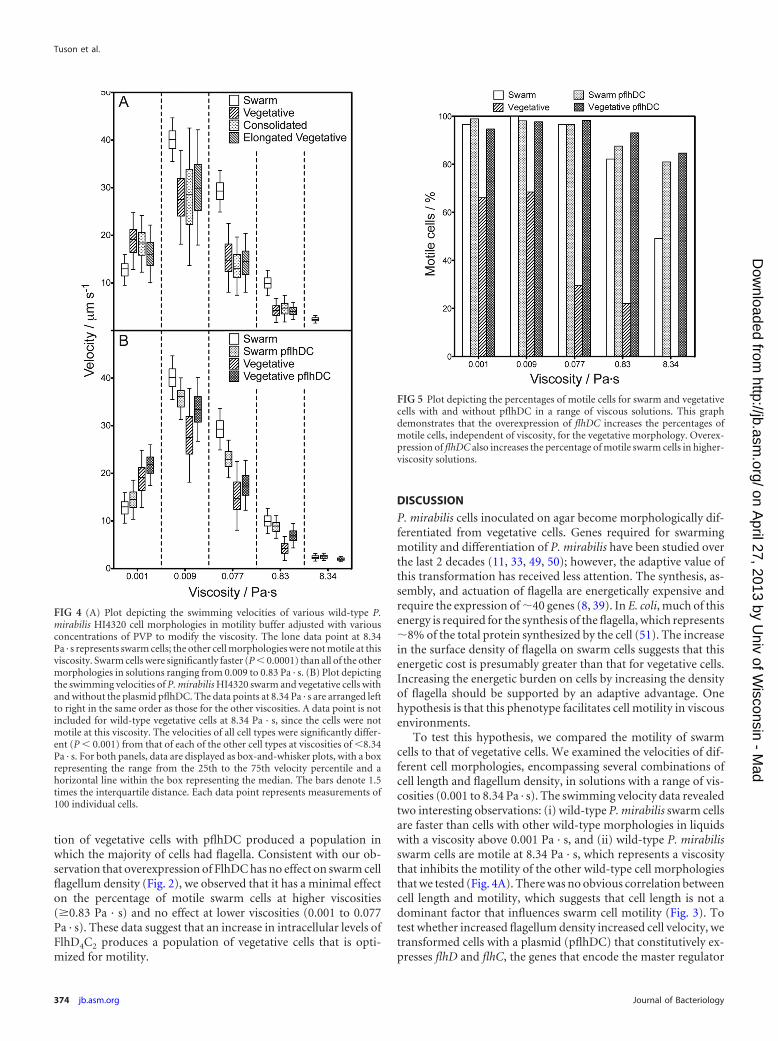
The velocities of all cell types peaked at 0.009 Pa · s. However,the mean velocity of wild-type swarm cells was significantlygreater than those of all other cell morphologies in solutions rang-ing from 0.009 to 0.83 Pa · s (P � 0.0001). Swarm cells were motileat 8.34 Pa · s, while wild-type vegetative, elongated vegetative, andconsolidated cells were not (Fig. 4A). Swarm cells were slowerthan vegetative and elongated vegetative cells only in motility buf-fer that did not contain PVP (viscosity � 0.001 Pa · s). We ob-served no statistically significant differences between the meanvelocities of vegetative, elongated vegetative, and consolidatedcells in solutions ranging from 0.009 to 0.83 Pa · s (Fig. 4A).
In solutions with a viscosity of �8.3 Pa · s, an increase inFlhD4C2 increased the velocity of vegetative cells by 15 to 61%relative to that of the wild type. As a control, we examined cellstransformed with the empty vector pACYC184 and found thattheir velocity was not statistically different from that of wild-typecells (P � 0.24) in fluids with a viscosity of 0.009 Pa · s. Impor-tantly, overexpression of FlhD4C2 rescued vegetative cell motility
at 8.3 Pa · s (Fig. 4B). Swarm cells containing pflhDC were eitherthe same as or slower than wild-type P. mirabilis swarm cells (Fig.4B). As with wild-type P. mirabilis cells, swarm cells containingpflhDC were motile in fluids with a viscosity of 8.3 Pa · s. Inconjunction with quantitative Western and immunofluorescencedata, the motility studies demonstrate that increasing flagellumdensity on vegetative cells increases their velocity.
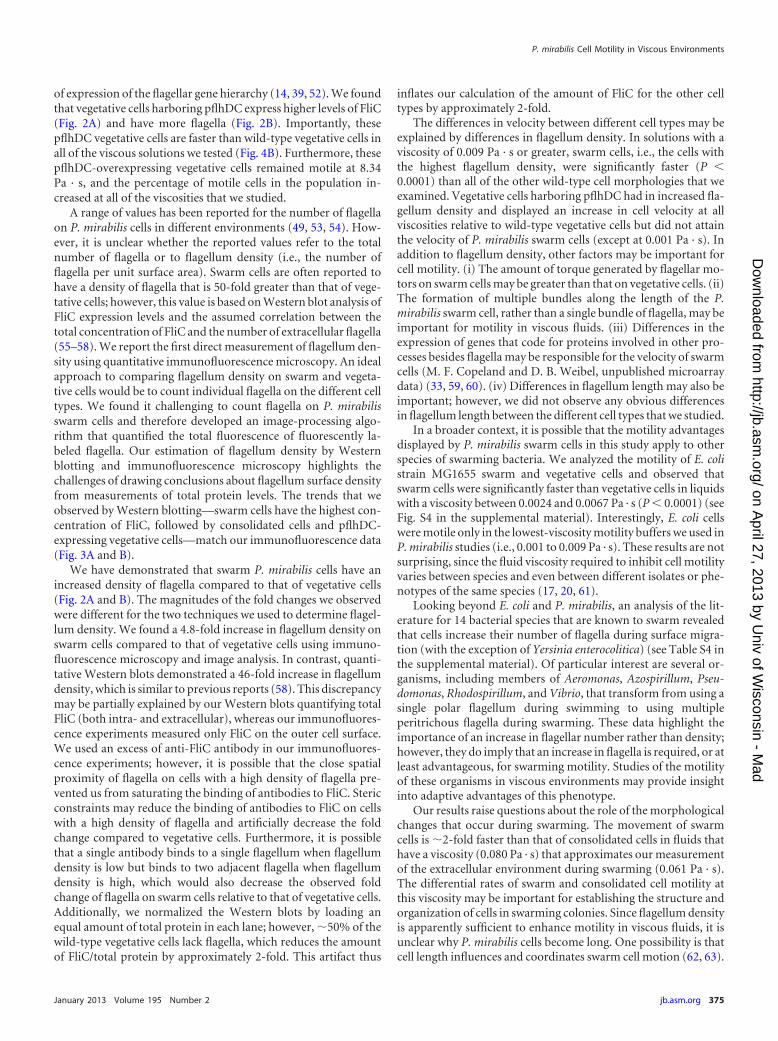
In addition to affecting the velocity of the motile cells in apopulation of vegetative cells, we observed that overexpression ofFlhD4C2 affected the percentage of motile cells in the population.To quantify this effect, we analyzed the number of motile cellspresent in the first frame of the cell velocity videos. We discoveredthat FlhDC overexpression dramatically increased the percentageof motile vegetative cells in all of the PVP solutions we tested.Motile vegetative cells increased by between 43 and 321% when P.mirabilis cells contained pflhDC (Fig. 5), making the percentage ofmotile vegetative cells approximately equivalent to the percentageof motile swarm cells in all viscosities that we tested. Our imagingexperiments support these results, since we observed that a largenumber of wild-type vegetative cells lacked flagella. Transforma-
FIG 3 Scatter plots showing the relationship between cell length and velocity for each of the cell morphologies used in this study. The symbols represent dataacquired in the following viscosity buffers: 0.001 Pa · s (�), 0.009 Pa · s (�), 0.077 Pa · s (Œ), 0.83 Pa · s (�), and 8.34 Pa · s (�).
P. mirabilis Cell Motility in Viscous Environments
January 2013 Volume 195 Number 2 jb.asm.org 373
on April 27, 2013 by U
niv of Wisconsin - M
adhttp://jb.asm
.org/D
ownloaded from
tion of vegetative cells with pflhDC produced a population inwhich the majority of cells had flagella. Consistent with our ob-servation that overexpression of FlhDC has no effect on swarm cellflagellum density (Fig. 2), we observed that it has a minimal effecton the percentage of motile swarm cells at higher viscosities(�0.83 Pa · s) and no effect at lower viscosities (0.001 to 0.077Pa · s). These data suggest that an increase in intracellular levels ofFlhD4C2 produces a population of vegetative cells that is opti-mized for motility.
DISCUSSION
P. mirabilis cells inoculated on agar become morphologically dif-ferentiated from vegetative cells. Genes required for swarmingmotility and differentiation of P. mirabilis have been studied overthe last 2 decades (11, 33, 49, 50); however, the adaptive value ofthis transformation has received less attention. The synthesis, as-sembly, and actuation of flagella are energetically expensive andrequire the expression of �40 genes (8, 39). In E. coli, much of thisenergy is required for the synthesis of the flagella, which represents�8% of the total protein synthesized by the cell (51). The increasein the surface density of flagella on swarm cells suggests that thisenergetic cost is presumably greater than that for vegetative cells.Increasing the energetic burden on cells by increasing the densityof flagella should be supported by an adaptive advantage. Onehypothesis is that this phenotype facilitates cell motility in viscousenvironments.
To test this hypothesis, we compared the motility of swarmcells to that of vegetative cells. We examined the velocities of dif-ferent cell morphologies, encompassing several combinations ofcell length and flagellum density, in solutions with a range of vis-cosities (0.001 to 8.34 Pa · s). The swimming velocity data revealedtwo interesting observations: (i) wild-type P. mirabilis swarm cellsare faster than cells with other wild-type morphologies in liquidswith a viscosity above 0.001 Pa · s, and (ii) wild-type P. mirabilisswarm cells are motile at 8.34 Pa · s, which represents a viscositythat inhibits the motility of the other wild-type cell morphologiesthat we tested (Fig. 4A). There was no obvious correlation betweencell length and motility, which suggests that cell length is not adominant factor that influences swarm cell motility (Fig. 3). Totest whether increased flagellum density increased cell velocity, wetransformed cells with a plasmid (pflhDC) that constitutively ex-presses flhD and flhC, the genes that encode the master regulator
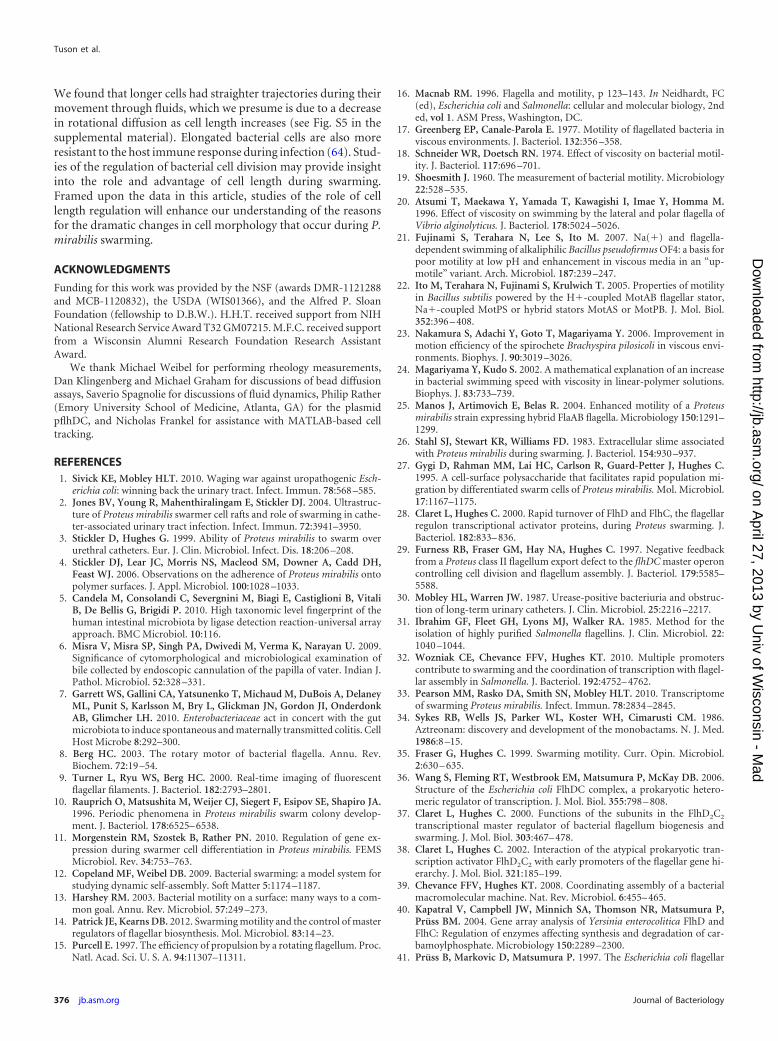
FIG 4 (A) Plot depicting the swimming velocities of various wild-type P.mirabilis HI4320 cell morphologies in motility buffer adjusted with variousconcentrations of PVP to modify the viscosity. The lone data point at 8.34Pa · s represents swarm cells; the other cell morphologies were not motile at thisviscosity. Swarm cells were significantly faster (P � 0.0001) than all of the othermorphologies in solutions ranging from 0.009 to 0.83 Pa · s. (B) Plot depictingthe swimming velocities of P. mirabilis HI4320 swarm and vegetative cells withand without the plasmid pflhDC. The data points at 8.34 Pa · s are arranged leftto right in the same order as those for the other viscosities. A data point is notincluded for wild-type vegetative cells at 8.34 Pa · s, since the cells were notmotile at this viscosity. The velocities of all cell types were significantly differ-ent (P � 0.001) from that of each of the other cell types at viscosities of �8.34Pa · s. For both panels, data are displayed as box-and-whisker plots, with a boxrepresenting the range from the 25th to the 75th velocity percentile and ahorizontal line within the box representing the median. The bars denote 1.5times the interquartile distance. Each data point represents measurements of100 individual cells.
FIG 5 Plot depicting the percentages of motile cells for swarm and vegetativecells with and without pflhDC in a range of viscous solutions. This graphdemonstrates that the overexpression of flhDC increases the percentages ofmotile cells, independent of viscosity, for the vegetative morphology. Overex-pression of flhDC also increases the percentage of motile swarm cells in higher-viscosity solutions.
Tuson et al.
374 jb.asm.org Journal of Bacteriology
on April 27, 2013 by U
niv of Wisconsin - M
adhttp://jb.asm
.org/D
ownloaded from
of expression of the flagellar gene hierarchy (14, 39, 52). We foundthat vegetative cells harboring pflhDC express higher levels of FliC(Fig. 2A) and have more flagella (Fig. 2B). Importantly, thesepflhDC vegetative cells are faster than wild-type vegetative cells inall of the viscous solutions we tested (Fig. 4B). Furthermore, thesepflhDC-overexpressing vegetative cells remained motile at 8.34Pa · s, and the percentage of motile cells in the population in-creased at all of the viscosities that we studied.
A range of values has been reported for the number of flagellaon P. mirabilis cells in different environments (49, 53, 54). How-ever, it is unclear whether the reported values refer to the totalnumber of flagella or to flagellum density (i.e., the number offlagella per unit surface area). Swarm cells are often reported tohave a density of flagella that is 50-fold greater than that of vege-tative cells; however, this value is based on Western blot analysis ofFliC expression levels and the assumed correlation between thetotal concentration of FliC and the number of extracellular flagella(55–58). We report the first direct measurement of flagellum den-sity using quantitative immunofluorescence microscopy. An idealapproach to comparing flagellum density on swarm and vegeta-tive cells would be to count individual flagella on the different celltypes. We found it challenging to count flagella on P. mirabilisswarm cells and therefore developed an image-processing algo-rithm that quantified the total fluorescence of fluorescently la-beled flagella. Our estimation of flagellum density by Westernblotting and immunofluorescence microscopy highlights thechallenges of drawing conclusions about flagellum surface densityfrom measurements of total protein levels. The trends that weobserved by Western blotting—swarm cells have the highest con-centration of FliC, followed by consolidated cells and pflhDC-expressing vegetative cells—match our immunofluorescence data(Fig. 3A and B).
We have demonstrated that swarm P. mirabilis cells have anincreased density of flagella compared to that of vegetative cells(Fig. 2A and B). The magnitudes of the fold changes we observedwere different for the two techniques we used to determine flagel-lum density. We found a 4.8-fold increase in flagellum density onswarm cells compared to that of vegetative cells using immuno-fluorescence microscopy and image analysis. In contrast, quanti-tative Western blots demonstrated a 46-fold increase in flagellumdensity, which is similar to previous reports (58). This discrepancymay be partially explained by our Western blots quantifying totalFliC (both intra- and extracellular), whereas our immunofluores-cence experiments measured only FliC on the outer cell surface.We used an excess of anti-FliC antibody in our immunofluores-cence experiments; however, it is possible that the close spatialproximity of flagella on cells with a high density of flagella pre-vented us from saturating the binding of antibodies to FliC. Stericconstraints may reduce the binding of antibodies to FliC on cellswith a high density of flagella and artificially decrease the foldchange compared to vegetative cells. Furthermore, it is possiblethat a single antibody binds to a single flagellum when flagellumdensity is low but binds to two adjacent flagella when flagellumdensity is high, which would also decrease the observed foldchange of flagella on swarm cells relative to that of vegetative cells.Additionally, we normalized the Western blots by loading anequal amount of total protein in each lane; however, �50% of thewild-type vegetative cells lack flagella, which reduces the amountof FliC/total protein by approximately 2-fold. This artifact thus
inflates our calculation of the amount of FliC for the other celltypes by approximately 2-fold.
The differences in velocity between different cell types may beexplained by differences in flagellum density. In solutions with aviscosity of 0.009 Pa · s or greater, swarm cells, i.e., the cells withthe highest flagellum density, were significantly faster (P �0.0001) than all of the other wild-type cell morphologies that weexamined. Vegetative cells harboring pflhDC had in increased fla-gellum density and displayed an increase in cell velocity at allviscosities relative to wild-type vegetative cells but did not attainthe velocity of P. mirabilis swarm cells (except at 0.001 Pa · s). Inaddition to flagellum density, other factors may be important forcell motility. (i) The amount of torque generated by flagellar mo-tors on swarm cells may be greater than that on vegetative cells. (ii)The formation of multiple bundles along the length of the P.mirabilis swarm cell, rather than a single bundle of flagella, may beimportant for motility in viscous fluids. (iii) Differences in theexpression of genes that code for proteins involved in other pro-cesses besides flagella may be responsible for the velocity of swarmcells (M. F. Copeland and D. B. Weibel, unpublished microarraydata) (33, 59, 60). (iv) Differences in flagellum length may also beimportant; however, we did not observe any obvious differencesin flagellum length between the different cell types that we studied.
In a broader context, it is possible that the motility advantagesdisplayed by P. mirabilis swarm cells in this study apply to otherspecies of swarming bacteria. We analyzed the motility of E. colistrain MG1655 swarm and vegetative cells and observed thatswarm cells were significantly faster than vegetative cells in liquidswith a viscosity between 0.0024 and 0.0067 Pa · s (P � 0.0001) (seeFig. S4 in the supplemental material). Interestingly, E. coli cellswere motile only in the lowest-viscosity motility buffers we used inP. mirabilis studies (i.e., 0.001 to 0.009 Pa · s). These results are notsurprising, since the fluid viscosity required to inhibit cell motilityvaries between species and even between different isolates or phe-notypes of the same species (17, 20, 61).
Looking beyond E. coli and P. mirabilis, an analysis of the lit-erature for 14 bacterial species that are known to swarm revealedthat cells increase their number of flagella during surface migra-tion (with the exception of Yersinia enterocolitica) (see Table S4 inthe supplemental material). Of particular interest are several or-ganisms, including members of Aeromonas, Azospirillum, Pseu-domonas, Rhodospirillum, and Vibrio, that transform from using asingle polar flagellum during swimming to using multipleperitrichous flagella during swarming. These data highlight theimportance of an increase in flagellar number rather than density;however, they do imply that an increase in flagella is required, or atleast advantageous, for swarming motility. Studies of the motilityof these organisms in viscous environments may provide insightinto adaptive advantages of this phenotype.
Our results raise questions about the role of the morphologicalchanges that occur during swarming. The movement of swarmcells is �2-fold faster than that of consolidated cells in fluids thathave a viscosity (0.080 Pa · s) that approximates our measurementof the extracellular environment during swarming (0.061 Pa · s).The differential rates of swarm and consolidated cell motility atthis viscosity may be important for establishing the structure andorganization of cells in swarming colonies. Since flagellum densityis apparently sufficient to enhance motility in viscous fluids, it isunclear why P. mirabilis cells become long. One possibility is thatcell length influences and coordinates swarm cell motion (62, 63).
P. mirabilis Cell Motility in Viscous Environments
January 2013 Volume 195 Number 2 jb.asm.org 375
on April 27, 2013 by U
niv of Wisconsin - M
adhttp://jb.asm
.org/D
ownloaded from
We found that longer cells had straighter trajectories during theirmovement through fluids, which we presume is due to a decreasein rotational diffusion as cell length increases (see Fig. S5 in thesupplemental material). Elongated bacterial cells are also moreresistant to the host immune response during infection (64). Stud-ies of the regulation of bacterial cell division may provide insightinto the role and advantage of cell length during swarming.Framed upon the data in this article, studies of the role of celllength regulation will enhance our understanding of the reasonsfor the dramatic changes in cell morphology that occur during P.mirabilis swarming.
ACKNOWLEDGMENTS
Funding for this work was provided by the NSF (awards DMR-1121288and MCB-1120832), the USDA (WIS01366), and the Alfred P. SloanFoundation (fellowship to D.B.W.). H.H.T. received support from NIHNational Research Service Award T32 GM07215. M.F.C. received supportfrom a Wisconsin Alumni Research Foundation Research AssistantAward.
We thank Michael Weibel for performing rheology measurements,Dan Klingenberg and Michael Graham for discussions of bead diffusionassays, Saverio Spagnolie for discussions of fluid dynamics, Philip Rather(Emory University School of Medicine, Atlanta, GA) for the plasmidpflhDC, and Nicholas Frankel for assistance with MATLAB-based celltracking.
REFERENCES1. Sivick KE, Mobley HLT. 2010. Waging war against uropathogenic Esch-
erichia coli: winning back the urinary tract. Infect. Immun. 78:568 –585.2. Jones BV, Young R, Mahenthiralingam E, Stickler DJ. 2004. Ultrastruc-
ture of Proteus mirabilis swarmer cell rafts and role of swarming in cathe-ter-associated urinary tract infection. Infect. Immun. 72:3941–3950.
3. Stickler D, Hughes G. 1999. Ability of Proteus mirabilis to swarm overurethral catheters. Eur. J. Clin. Microbiol. Infect. Dis. 18:206 –208.
4. Stickler DJ, Lear JC, Morris NS, Macleod SM, Downer A, Cadd DH,Feast WJ. 2006. Observations on the adherence of Proteus mirabilis ontopolymer surfaces. J. Appl. Microbiol. 100:1028 –1033.
5. Candela M, Consolandi C, Severgnini M, Biagi E, Castiglioni B, VitaliB, De Bellis G, Brigidi P. 2010. High taxonomic level fingerprint of thehuman intestinal microbiota by ligase detection reaction-universal arrayapproach. BMC Microbiol. 10:116.
6. Misra V, Misra SP, Singh PA, Dwivedi M, Verma K, Narayan U. 2009.Significance of cytomorphological and microbiological examination ofbile collected by endoscopic cannulation of the papilla of vater. Indian J.Pathol. Microbiol. 52:328 –331.
7. Garrett WS, Gallini CA, Yatsunenko T, Michaud M, DuBois A, DelaneyML, Punit S, Karlsson M, Bry L, Glickman JN, Gordon JI, OnderdonkAB, Glimcher LH. 2010. Enterobacteriaceae act in concert with the gutmicrobiota to induce spontaneous and maternally transmitted colitis. CellHost Microbe 8:292–300.
8. Berg HC. 2003. The rotary motor of bacterial flagella. Annu. Rev.Biochem. 72:19 –54.
9. Turner L, Ryu WS, Berg HC. 2000. Real-time imaging of fluorescentflagellar filaments. J. Bacteriol. 182:2793–2801.
10. Rauprich O, Matsushita M, Weijer CJ, Siegert F, Esipov SE, Shapiro JA.1996. Periodic phenomena in Proteus mirabilis swarm colony develop-ment. J. Bacteriol. 178:6525– 6538.
11. Morgenstein RM, Szostek B, Rather PN. 2010. Regulation of gene ex-pression during swarmer cell differentiation in Proteus mirabilis. FEMSMicrobiol. Rev. 34:753–763.
12. Copeland MF, Weibel DB. 2009. Bacterial swarming: a model system forstudying dynamic self-assembly. Soft Matter 5:1174 –1187.
13. Harshey RM. 2003. Bacterial motility on a surface: many ways to a com-mon goal. Annu. Rev. Microbiol. 57:249 –273.
14. Patrick JE, Kearns DB. 2012. Swarming motility and the control of masterregulators of flagellar biosynthesis. Mol. Microbiol. 83:14 –23.
15. Purcell E. 1997. The efficiency of propulsion by a rotating flagellum. Proc.Natl. Acad. Sci. U. S. A. 94:11307–11311.
16. Macnab RM. 1996. Flagella and motility, p 123–143. In Neidhardt, FC(ed), Escherichia coli and Salmonella: cellular and molecular biology, 2nded, vol 1. ASM Press, Washington, DC.
17. Greenberg EP, Canale-Parola E. 1977. Motility of flagellated bacteria inviscous environments. J. Bacteriol. 132:356 –358.
18. Schneider WR, Doetsch RN. 1974. Effect of viscosity on bacterial motil-ity. J. Bacteriol. 117:696 –701.
19. Shoesmith J. 1960. The measurement of bacterial motility. Microbiology22:528 –535.
20. Atsumi T, Maekawa Y, Yamada T, Kawagishi I, Imae Y, Homma M.1996. Effect of viscosity on swimming by the lateral and polar flagella ofVibrio alginolyticus. J. Bacteriol. 178:5024 –5026.
21. Fujinami S, Terahara N, Lee S, Ito M. 2007. Na(�) and flagella-dependent swimming of alkaliphilic Bacillus pseudofirmus OF4: a basis forpoor motility at low pH and enhancement in viscous media in an “up-motile” variant. Arch. Microbiol. 187:239 –247.
22. Ito M, Terahara N, Fujinami S, Krulwich T. 2005. Properties of motilityin Bacillus subtilis powered by the H�-coupled MotAB flagellar stator,Na�-coupled MotPS or hybrid stators MotAS or MotPB. J. Mol. Biol.352:396 – 408.
23. Nakamura S, Adachi Y, Goto T, Magariyama Y. 2006. Improvement inmotion efficiency of the spirochete Brachyspira pilosicoli in viscous envi-ronments. Biophys. J. 90:3019 –3026.
24. Magariyama Y, Kudo S. 2002. A mathematical explanation of an increasein bacterial swimming speed with viscosity in linear-polymer solutions.Biophys. J. 83:733–739.
25. Manos J, Artimovich E, Belas R. 2004. Enhanced motility of a Proteusmirabilis strain expressing hybrid FlaAB flagella. Microbiology 150:1291–1299.
26. Stahl SJ, Stewart KR, Williams FD. 1983. Extracellular slime associatedwith Proteus mirabilis during swarming. J. Bacteriol. 154:930 –937.
27. Gygi D, Rahman MM, Lai HC, Carlson R, Guard-Petter J, Hughes C.1995. A cell-surface polysaccharide that facilitates rapid population mi-gration by differentiated swarm cells of Proteus mirabilis. Mol. Microbiol.17:1167–1175.
28. Claret L, Hughes C. 2000. Rapid turnover of FlhD and FlhC, the flagellarregulon transcriptional activator proteins, during Proteus swarming. J.Bacteriol. 182:833– 836.
29. Furness RB, Fraser GM, Hay NA, Hughes C. 1997. Negative feedbackfrom a Proteus class II flagellum export defect to the flhDC master operoncontrolling cell division and flagellum assembly. J. Bacteriol. 179:5585–5588.
30. Mobley HL, Warren JW. 1987. Urease-positive bacteriuria and obstruc-tion of long-term urinary catheters. J. Clin. Microbiol. 25:2216 –2217.
31. Ibrahim GF, Fleet GH, Lyons MJ, Walker RA. 1985. Method for theisolation of highly purified Salmonella flagellins. J. Clin. Microbiol. 22:1040 –1044.
32. Wozniak CE, Chevance FFV, Hughes KT. 2010. Multiple promoterscontribute to swarming and the coordination of transcription with flagel-lar assembly in Salmonella. J. Bacteriol. 192:4752– 4762.
33. Pearson MM, Rasko DA, Smith SN, Mobley HLT. 2010. Transcriptomeof swarming Proteus mirabilis. Infect. Immun. 78:2834 –2845.
34. Sykes RB, Wells JS, Parker WL, Koster WH, Cimarusti CM. 1986.Aztreonam: discovery and development of the monobactams. N. J. Med.1986:8 –15.
35. Fraser G, Hughes C. 1999. Swarming motility. Curr. Opin. Microbiol.2:630 – 635.
36. Wang S, Fleming RT, Westbrook EM, Matsumura P, McKay DB. 2006.Structure of the Escherichia coli FlhDC complex, a prokaryotic hetero-meric regulator of transcription. J. Mol. Biol. 355:798 – 808.
37. Claret L, Hughes C. 2000. Functions of the subunits in the FlhD2C2
transcriptional master regulator of bacterial flagellum biogenesis andswarming. J. Mol. Biol. 303:467– 478.
38. Claret L, Hughes C. 2002. Interaction of the atypical prokaryotic tran-scription activator FlhD2C2 with early promoters of the flagellar gene hi-erarchy. J. Mol. Biol. 321:185–199.
39. Chevance FFV, Hughes KT. 2008. Coordinating assembly of a bacterialmacromolecular machine. Nat. Rev. Microbiol. 6:455– 465.
40. Kapatral V, Campbell JW, Minnich SA, Thomson NR, Matsumura P,Prüss BM. 2004. Gene array analysis of Yersinia enterocolitica FlhD andFlhC: Regulation of enzymes affecting synthesis and degradation of car-bamoylphosphate. Microbiology 150:2289 –2300.
41. Prüss B, Markovic D, Matsumura P. 1997. The Escherichia coli flagellar
Tuson et al.
376 jb.asm.org Journal of Bacteriology
on April 27, 2013 by U
niv of Wisconsin - M
adhttp://jb.asm
.org/D
ownloaded from
transcriptional activator flhD regulates cell division through induction ofthe acid response gene cadA. J. Bacteriol. 179:3818 –3821.
42. Prüss BM, Campbell JW, Van Dyk TK, Zhu C, Kogan Y, Matsumura P.2003. FlhD/FlhC is a regulator of anaerobic respiration and the Entner-Doudoroff pathway through induction of the methyl-accepting che-motaxis protein Aer. J. Bacteriol. 185:534 –543.
43. Prüss BM, Liu X, Hendrickson W, Matsumura P. 2001. FlhD/FlhC-regulated promoters analyzed by gene array and lacZ gene fusions. FEMSMicrobiol. Lett. 197:91–97.
44. Sule P, Horne SM, Logue CM, Pruss BM. 2011. Regulation of celldivision, biofilm formation, and virulence by FlhC in Escherichia coliO157:H7 grown on meat. Appl. Environ. Microbiol. 77:3653–3662.
45. Townsend MK, Carr NJ, Iyer JG, Horne SM, Gibbs PS, Prüss BM. 2008.Pleiotropic phenotypes of a Yersinia enterocolitica flhD mutant includereduced lethality in a chicken embryo model. BMC Microbiol. 8:12. doi:10.1186/1471-2180-8-12.
46. Zhang R, Turner L, Berg HC. 2010. The upper surface of an Escherichiacoli swarm is stationary. Proc. Natl. Acad. Sci. U. S. A. 107:288 –290.
47. Greenberg EP, Canale-Parola E. 1977. Relationship between cell coilingand motility of spirochetes in viscous environments. J. Bacteriol. 131:960 –969.
48. Belas R, Suvanasuthi R. 2005. The ability of Proteus mirabilis to sensesurfaces and regulate virulence gene expression involves FliL, a flagellarbasal body protein. J. Bacteriol. 187:6789 – 6803.
49. Belas R, Erskine D, Flaherty D. 1991. Proteus mirabilis mutants defectivein swarmer cell differentiation and multicellular behavior. J. Bacteriol.173:6279 – 6288.
50. Rather P. 2005. Swarmer cell differentiation in Proteus mirabilis. Environ.Microbiol. 7:1065–1073.
51. Zhao K, Liu M, Burgess RR. 2007. Adaptation in bacterial flagellar andmotility systems: from regulon members to ‘foraging’-like behavior in E.coli. Nucleic Acids Res. 35:4441– 4452.
52. Chilcott GS, Hughes KT. 2000. Coupling of flagellar gene expression toflagellar assembly in Salmonella enterica serovar Typhimurium and Esch-erichia coli. Microbiol. Mol. Biol. Rev. 64:694 –708.
53. Allison C, Hughes C. 1991. Bacterial swarming: an example of prokary-otic differentiation and multicellular behaviour. Sci. Prog. 75:403– 422.
54. Williams FD, Schwarzhoff RH. 1978. Nature of the swarming phenom-enon in Proteus. Annu. Rev. Microbiol. 32:101–122.
55. Allison C, Hughes C. 1991. Closely linked genetic loci required for swarmcell differentiation and multicellular migration by Proteus mirabilis. Mol.Microbiol. 5:1975–1982.
56. Allison C, Lai H, Hughes C. 1992. Co-ordinate expression of virulencegenes during swarm-cell differentiation and population migration of Pro-teus mirabilis. Mol. Microbiol. 6:1583–1591.
57. Gygi D, Bailey MJ, Allison C, Hughes C. 1995. Requirement for FlhA inflagella assembly and swarm-cell differentiation by Proteus mirabilis. Mol.Microbiol. 15:761–769.
58. Hay NA, Tipper DJ, Gygi D, Hughes C. 1997. A nonswarming mutant ofProteus mirabilis lacks the Lrp global transcriptional regulator. J. Bacteriol.179:4741– 4746.
59. Inoue T, Shingaki R, Hirose S, Waki K, Mori H, Fukui K. 2007.Genome-wide screening of genes required for swarming motility in Esch-erichia coli K-12. J. Bacteriol. 189:950 –957.
60. Wang Q, Frye JG, McClelland M, Harshey RM. 2004. Gene expressionpatterns during swarming in Salmonella typhimurium: genes specific tosurface growth and putative new motility and pathogenicity genes. Mol.Microbiol. 52:169 –187.
61. Strength WJ, Isani B, Linn DM, Williams FD, Vandermolen GE,Laughon BE, Krieg NR. 1976. Isolation and characterization of Aquaspi-rillum fasciculus sp. nov., a rod-shaped, nitrogen-fixing bacterium havingunusual flagella. Int. J. Syst. Bacteriol. 26:253–268.
62. Copeland MF, Flickinger ST, Tuson HH, Weibel DB. 2010. Studying thedynamics of flagella in multicellular communities of Escherichia coli byusing biarsenical dyes. Appl. Environ. Microbiol. 76:1241–1250.
63. Turner L, Zhang R, Darnton NC, Berg HC. 2010. Visualization offlagella during bacterial swarming. J. Bacteriol. 192:3259 –3267.
64. Justice SS, Hunstad DA, Seed PC, Hultgren SJ. 2006. Filamentation byEscherichia coli subverts innate defenses during urinary tract infection.Proc. Natl. Acad. Sci. U. S. A. 103:19884 –19889.
P. mirabilis Cell Motility in Viscous Environments
January 2013 Volume 195 Number 2 jb.asm.org 377
on April 27, 2013 by U
niv of Wisconsin - M
adhttp://jb.asm
.org/D
ownloaded from