
FIXED INCOME INVESTOR UPDATE - molgroupcareers.info · MOL GROUP: A MID-CAP INTEGRATED...
57
1 FIXED INCOME INVESTOR UPDATE September 2015
Transcript of FIXED INCOME INVESTOR UPDATE - molgroupcareers.info · MOL GROUP: A MID-CAP INTEGRATED...
1
FIXED INCOME INVESTOR UPDATE September 2015
2
CONTENT
I. Executive summary 3
II. Upstream Operation 6
III. Downstream Operation 15
VI. Financial Overview 25
V. Appendix 37
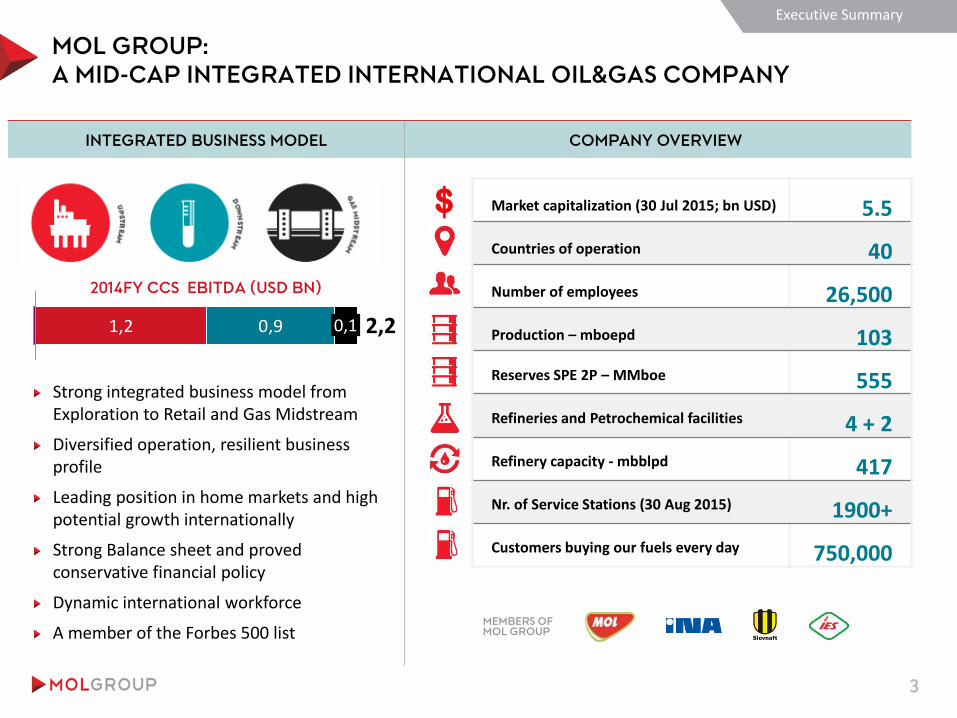
MOL GROUP:
A MID-CAP INTEGRATED INTERNATIONAL OIL&GAS COMPANY
3
Market capitalization (30 Jul 2015; bn USD) 5.5
Countries of operation 40
Number of employees 26,500
Production – mboepd 103
Reserves SPE 2P – MMboe 555
Refineries and Petrochemical facilities 4 + 2
Refinery capacity - mbblpd 417
Nr. of Service Stations (30 Aug 2015) 1900+
Customers buying our fuels every day 750,000
MEMBERS OF MOL GROUP
Executive Summary
1,2 0,9 0,1 2,2
Strong integrated business model from Exploration to Retail and Gas Midstream
Diversified operation, resilient business profile
Leading position in home markets and high potential growth internationally
Strong Balance sheet and proved conservative financial policy
Dynamic international workforce
A member of the Forbes 500 list
COMPANY OVERVIEW
2014FY CCS EBITDA (USD BN)
$
INTEGRATED BUSINESS MODEL

4
Executive Summary
CLEAR VISION TO CREATE VALUE
UPSTREAM ”Growth”
FINANCIALS ”Stability”
DOWNSTREAM ”Efficiency”
0
20
40
60
80
100
120
2017
115-120
2016
mboepd
110-115
2015
~105
2014
98
WEU Croatia
Hungary
CIS
MEA & Pakistan
0,0
0,5
1,0
1,5
2,0
2,5
3,0
3,5
4,0
2008 2009 2010 2011 2012 2013 2014
Organic Inorganic Operating CF
5
KEY GOALS AND MESSAGES: G
RO
UP
/FIN
AN
CIA
LS
U
PS
TR
EA
M
DO
WN
ST
RE
AM
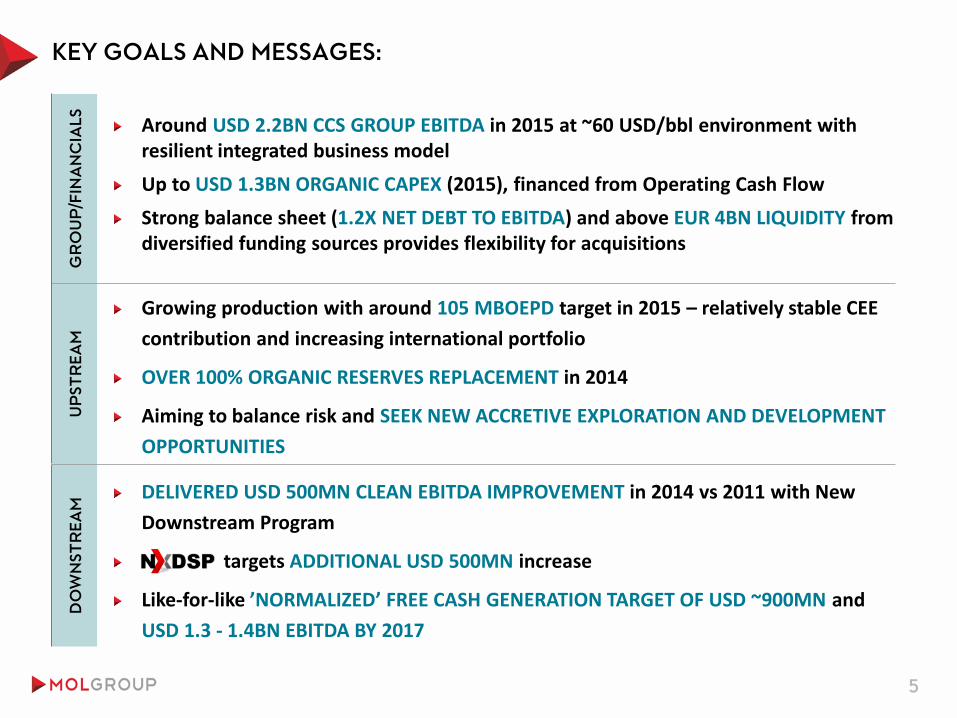
Around USD 2.2BN CCS GROUP EBITDA in 2015 at ~60 USD/bbl environment with resilient integrated business model
Up to USD 1.3BN ORGANIC CAPEX (2015), financed from Operating Cash Flow
Strong balance sheet (1.2X NET DEBT TO EBITDA) and above EUR 4BN LIQUIDITY from diversified funding sources provides flexibility for acquisitions
Growing production with around 105 MBOEPD target in 2015 – relatively stable CEE
contribution and increasing international portfolio
OVER 100% ORGANIC RESERVES REPLACEMENT in 2014
Aiming to balance risk and SEEK NEW ACCRETIVE EXPLORATION AND DEVELOPMENT
OPPORTUNITIES
DELIVERED USD 500MN CLEAN EBITDA IMPROVEMENT in 2014 vs 2011 with New
Downstream Program
targets ADDITIONAL USD 500MN increase
Like-for-like ’NORMALIZED’ FREE CASH GENERATION TARGET OF USD ~900MN and
USD 1.3 - 1.4BN EBITDA BY 2017

II. UPSTREAM OPERATION
6
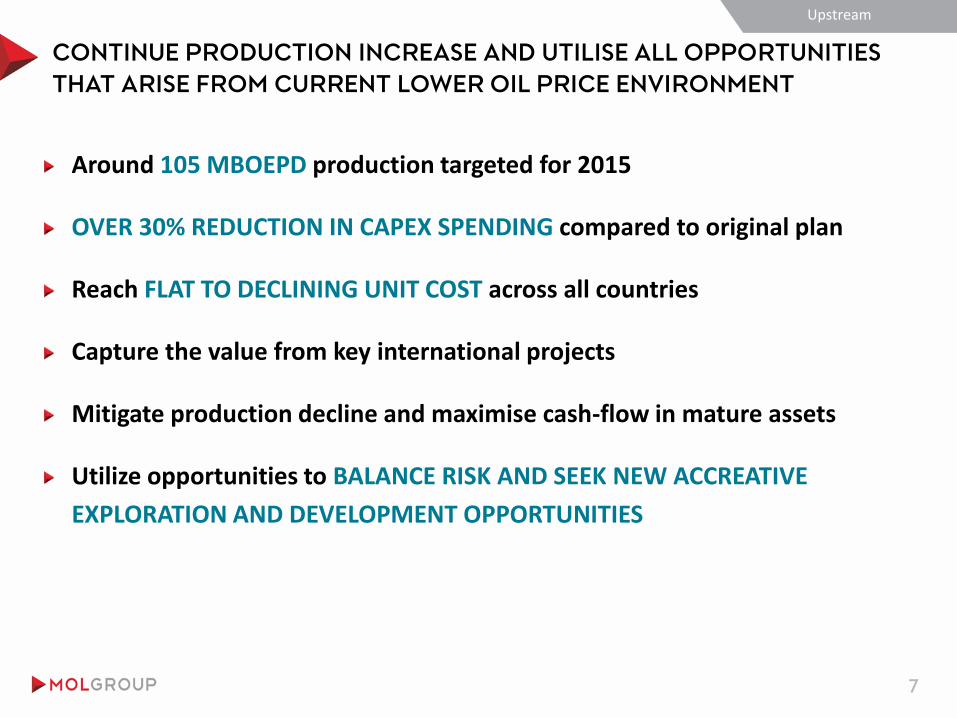
CONTINUE PRODUCTION INCREASE AND UTILISE ALL OPPORTUNITIES
THAT ARISE FROM CURRENT LOWER OIL PRICE ENVIRONMENT
7
Around 105 MBOEPD production targeted for 2015
OVER 30% REDUCTION IN CAPEX SPENDING compared to original plan
Reach FLAT TO DECLINING UNIT COST across all countries
Capture the value from key international projects
Mitigate production decline and maximise cash-flow in mature assets
Utilize opportunities to BALANCE RISK AND SEEK NEW ACCREATIVE
EXPLORATION AND DEVELOPMENT OPPORTUNITIES
Upstream

Growth in production to ~105 mboepd in 2015
Flat to declining unit costs across all countries
Keep the reserve replacement ratio above 100%
Zero HSE incidents/accidents
Executive Summary
UPSTREAM: GROWING INTERNATIONAL PORTFOLIO
WITH STRONG, STABLE CEE PRESENCE
KEY TARGETS
KEY DATA
14 Exploration and 8 Production Countries
Organic Reserve Replacement Ratio at 103% in 2014
Low cost producer: avg. unit OPEX at 8.5 USD/boe
PRODUCTION –
MBOEPD (H1 2015)
RESERVES –
(SPE 2P)
MMBOE (2014)
EXPLORATION
POTENTIAL–
(RRP*) MMBOE
8 *Recoverable resource potential (unrisked, Working Interests based w fully diluted shares)
3 10 5
7
79
103
7 65 30
135 318 555
290
685
95 90
1160
Africa MEA WE (North Sea) CIS CEE
Production
Exploration & Appraisal
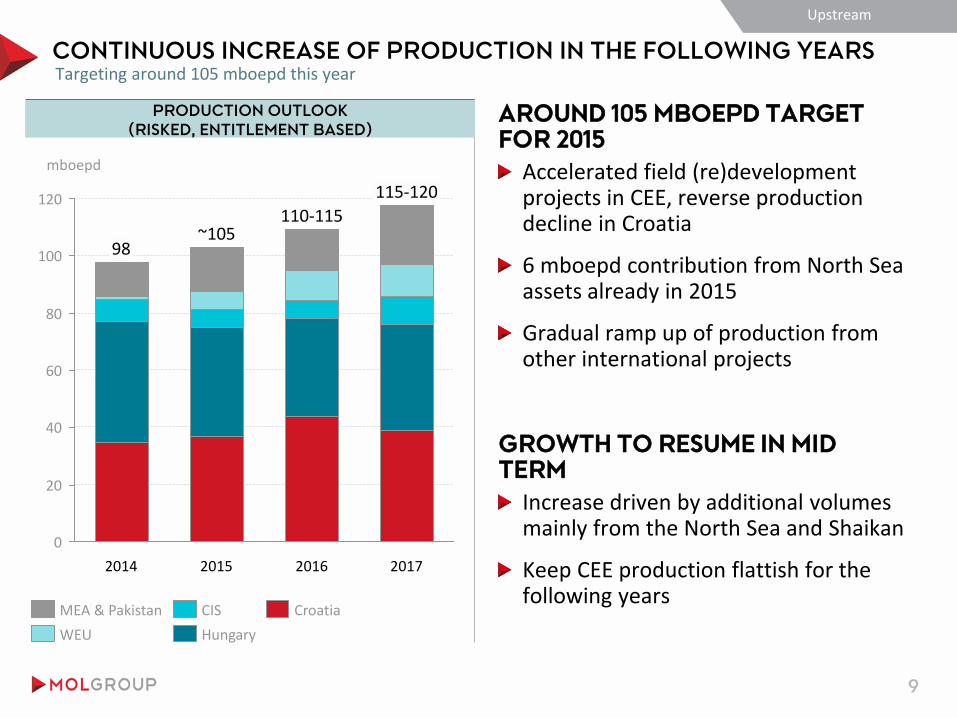
CONTINUOUS INCREASE OF PRODUCTION IN THE FOLLOWING YEARS
9
Targeting around 105 mboepd this year
AROUND 105 MBOEPD TARGET FOR 2015
Accelerated field (re)development projects in CEE, reverse production decline in Croatia
6 mboepd contribution from North Sea assets already in 2015
Gradual ramp up of production from other international projects
GROWTH TO RESUME IN MID TERM
Increase driven by additional volumes mainly from the North Sea and Shaikan
Keep CEE production flattish for the following years
PRODUCTION OUTLOOK
(RISKED, ENTITLEMENT BASED)
0
20
40
60
80
100
120
mboepd
2017
115-120
2016
110-115
2015
~105
2014
98
Croatia
Hungary
CIS
WEU
MEA & Pakistan
Upstream

CEE: MITIGATE THE PRODUCTION DECLINE
AND MAXIMISE CASH FLOW
10
HUNGARY AND CROATIA (124+194 MMBOE) - PRODUCTION OUTLOOK
Unique know-how and well developed infrastructure ensures quick cash generation
Targeting flat to declining Unit OPEX from an already competitive level of 7.5 USD/boe
Several ongoing (re)development, incl. EOR/IOR projects to keep CEE production flattish in mid-term
New exploration licence areas granted to both MOL and INA
Well optimisation and EOR projects target growing production in Croatia
Turn back production to growth path by 2015
Finalisation of the first phase of major EOR projects - Ivanic and Žutica fields will bring ~30 MMboe of incremental production
Further development in Međimurje project targeting 7 MMboe natural gas reserve
Continuing 4P well optimisation programme for increasing production and reserves on existing oil and gas fields
Offshore gas production expected to stabilise around 10-11 mboepd in the coming years
CROATIA - WORK PROGRAMME
CEE: Production H1 2015: 79 mboepd II Reserves SPE 2P: 318 Mmboe II RRP (unrisked, WI based): 90 MMboe
Upstream
0
20
40
60
80
2017 2016
mb
oep
d
2015 2014
Hungary
Croatia

KURDISTAN R.I.:
INCREASE EXPECTED IN THE COMING YEARS
11
KURDISTAN REGION OF IRAQ (15 MMBOE*)
Shaikan: producing from 9 wells through two production facilities
Exports started from Shaikan in Q1 2014
Akri-Bijell: future work program to be based on the final CPR
Close ties and strong co-operation with the MNR working towards recurring payments for oil sales
Phase I: total block production capacity of 40 mboepd (through PF-1 & PF-2)
Debottlenecking and facility upgrade ensures production to stabilize at 36-40 mboepd in H2 15 (gross)
Drilling further development wells in Phase II 0
2
4
6
8
mb
oe
pd
2017 2016 2015 2014
Shaikan Akri Bijeel
* Entitlement share based on fully diluted working interest.
Upstream
PRODUCTION OUTLOOK SHAIKAN WORK PROGRAMME
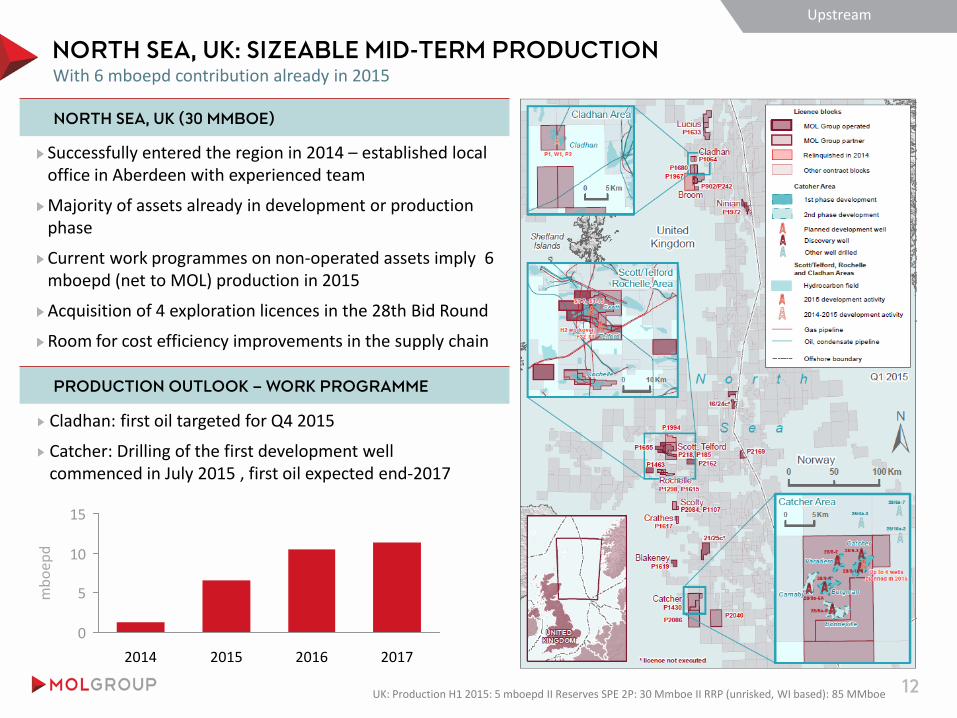
NORTH SEA, UK: SIZEABLE MID-TERM PRODUCTION
12
NORTH SEA, UK (30 MMBOE)
Successfully entered the region in 2014 – established local office in Aberdeen with experienced team
Majority of assets already in development or production phase
Current work programmes on non-operated assets imply 6 mboepd (net to MOL) production in 2015
Acquisition of 4 exploration licences in the 28th Bid Round
Room for cost efficiency improvements in the supply chain
With 6 mboepd contribution already in 2015
Cladhan: first oil targeted for Q4 2015
Catcher: Drilling of the first development well commenced in July 2015 , first oil expected end-2017
PRODUCTION OUTLOOK – WORK PROGRAMME
Upstream
0
5
10
15
mb
oep
d
2017 2016 2015 2014
UK: Production H1 2015: 5 mboepd II Reserves SPE 2P: 30 Mmboe II RRP (unrisked, WI based): 85 MMboe

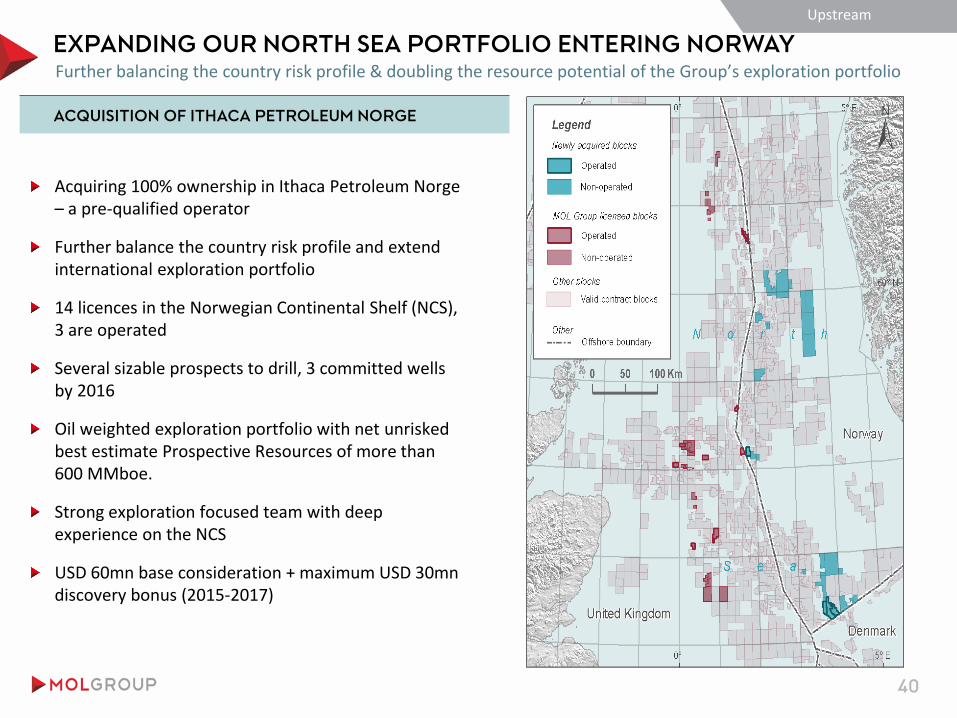
EXPANDING OUR NORTH SEA PORTFOLIO ENTERING NORWAY
13
Further balancing the country risk profile & doubling the resource potential of the Group’s exploration portfolio
Upstream
Acquiring 100% ownership in Ithaca Petroleum Norge – a pre-qualified operator
Further balance the country risk profile and extend international exploration portfolio
14 licences in the Norwegian Continental Shelf (NCS), 3 are operated
Several sizable prospects to drill, 3 committed wells by 2016
Oil weighted exploration portfolio with net unrisked best estimate Prospective Resources of more than 600 MMboe.
Strong exploration focused team with deep experience on the NCS
USD 60mn base consideration + maximum USD 30mn discovery bonus (2015-2017)
ACQUISITION OF ITHACA PETROLEUM NORGE

PURSUING OPPORTUNITIES TO FURTHER BALANCE
OUR COUNTRY RISK PROFILE ENHANCE INTERNATIONAL EXPLORATION PORTFOLIO
M&A: BALANCE RISK AS WELL AS SEEK NEW ACCRETIVE EXPLORATION
AND DEVELOPMENT OPPORTUNITIES
14
Upstream
LOWER RISK
HIGHER RISK
NORTH
SEA KRI
PAK
RUS, KAZ
HUN, CRO
MIDDLE EAST
Active in the region for 15 yrs Well established strategic partnerships Oman Oil Company has 7% in MOL & exploration in Oman
NORTHE SEA
Enhance shallow offshore experience and create a new hub Decreasing average political risk profile
PAKISTAN
15 yrs of operatorship exp. on an over 70 mboepd block (TAL,100%) Excellent relationship with local communities
CIS
Core region with notable technical know-how 12 years presence in the region
Rigorous capital discipline Focused geographical diversification Obtain know how outside CEE Establish new strategic partnerships (e.g. Wintershall, TPAO) Potential farm outs (partial) to share risks and optimize projects financing
KEY PRINCIPLES AND GOALS REGIONS IN THE FOCUS
EXPLORATION
DEVELOPMENT
OMAN,
PAK, RUS,
HUN KRI, UK,
KAZ, PAK,
RUS
HUN, CRO
III. DOWNSTREAM OPERATION
15

’CEE STRONGHOLD’: INTEGRATED OPERATION OF COMPETITIVE ASSET
BASE
16
Deep downstream integration instead of „pure refining concept” guarantees
extended margin capture on our landlocked markets
Delivered USD 500mn Clean EBITDA improvement in 2014 vs 2011 with New
Downstream Program
NEXT DOWNSTREAM PROGRAM (NXDSP) TARGETS ADDITIONAL USD 500MN
increase:
350MN ASSET & MARKET EFFICIENCY IMPROVEMENT: production, supply &
sales & existing retail network to contribute mostly through revenue increase
USD 150MN growth through STRATEGIC PROJECTS as a result of further
elevated Petchem (butadiene, LDPE) and retail (through recently acquired
stations)
Like-for-like ’NORMALIZED’ FREE CASH GENERATION TARGET OF USD ~900MN and
USD 1.3 - 1.4BN EBITDA by 2017
Downstream

58% 23%
19%
R&M Retail Petchem
DEEP DOWNSTREAM INTEGRATION GUARANTEES EXTENDED
MARGIN CAPTURE IN OUR LANDLOCKED MARKETS
17
HIGHLIGHTS & FIGURES
DOWNSTREAM INTEGRATION (FUELS)1
Bratislava
Danube Rijeka
(1) Including motor fuels, heating oil & naphtha (2) Captive market (%) is calculated as sales to own petchem, own retail, end-users and large customer’s retail over own production
Fuel & naphtha production in refineries
Petchem
Own Retail
Captive wholesale
11%
32%
45%
Other wholesale
23%
89% 79%
captive market2
18 Mtpa refined product & petchem sales
70-80% wholesale motor fuel market share in core 3 countries
Retail: 1.750+ FS with 4.3 Bn liters;
Petchem: 1.1 Mtpa external sales
KEY STRENGHTS
Deeply integrated portfolio
Complex, diesel geared refineries
Strong land-locked market presence
Retail network fully within refinery supply radius
Access to alternative crude supply
Bratislava
Danube
Sisak Rijeka
39% own
market
Downstream
USD 0.9bn
CCS EBITDA 2014

REFINING ASSET COMPLEXITY AND PROFITABILITY
ABOVE PEER GROUP AVERAGE
18
REFINERY NELSON COMPLEXITY OF THE PEER
GROUP1 CLEAN CCS-BASED DS UNIT EBITDA2(USD/BBL)
11,5 10,6
9,1
6,1
0
2
4
6
8
10
12
14
NC
I
-2
0
2
4
6
8
10
12
14
2012Q1
Q22012
2012Q3
2012Q4
Q12013
Q22013
Q32013
Q42013
Q12014
Q22014
Q32014
Q42014
Peer range
MOL-Group
MOL-Group ex. INA
REFINERY YIELD – 2015E
3%
10%
21%
50%
7%
9% LPG
Naphtha
Motor Gasoline
Middle Distillates
Black products
Other (incl. chemicalproducts)
over
80% white prod.
Resilient portfolio delivers top quartile performance
>80% white product yield, 50% gasoil yield matching market demand
(1) Peer group consists of OMV, PKN, Lotos, Neste, Tupras, Galp, Motor Oil, Hellenic Petroleum, NIS (2) Peer group consists of OMV, PKN, Lotos, Neste, Tupras, Galp, Motor Oil, Hellenic Petroleum; calculation captures total Downstream performance
6.1 Mtpa
8.1 Mtpa
4.5 Mtpa 2.2 Mtpa
Downstream
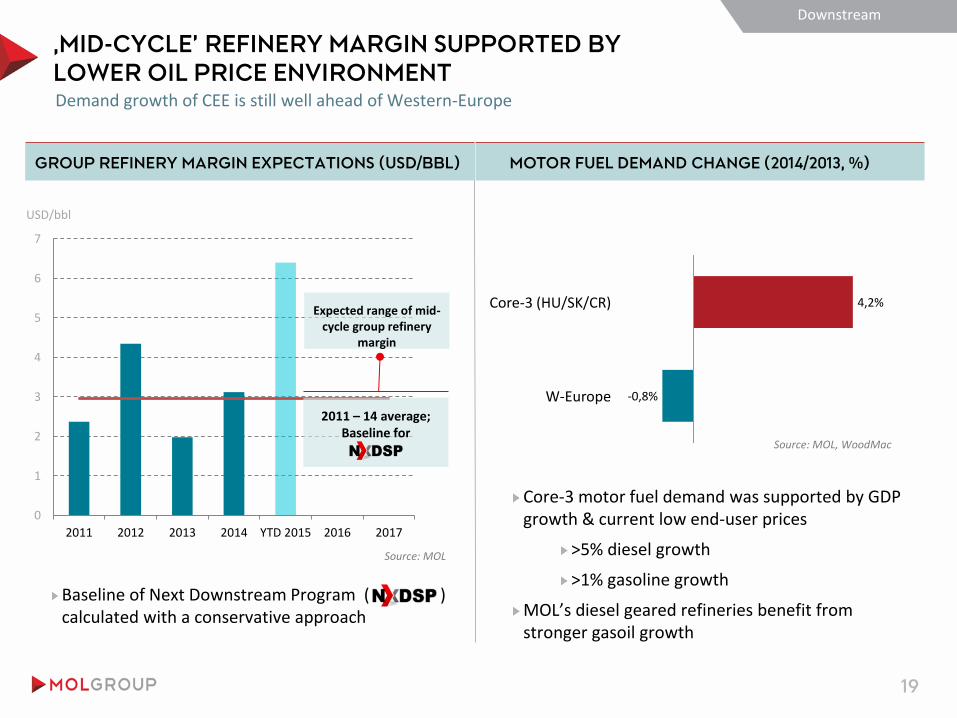
‚MID-CYCLE’ REFINERY MARGIN SUPPORTED BY
LOWER OIL PRICE ENVIRONMENT
19
Demand growth of CEE is still well ahead of Western-Europe
GROUP REFINERY MARGIN EXPECTATIONS (USD/BBL) MOTOR FUEL DEMAND CHANGE (2014/2013, %)
Core-3 motor fuel demand was supported by GDP growth & current low end-user prices
>5% diesel growth
>1% gasoline growth
MOL’s diesel geared refineries benefit from stronger gasoil growth
W-Europe
4,2%
-0,8%
Core-3 (HU/SK/CR)
Baseline of Next Downstream Program ( ) calculated with a conservative approach
0
1
2
3
4
5
6
7
2011 2012 2013 2014 YTD 2015 2016 2017
2011 – 14 average; Baseline for
Source: MOL
Source: MOL, WoodMac
Expected range of mid-cycle group refinery
margin
Downstream
USD/bbl
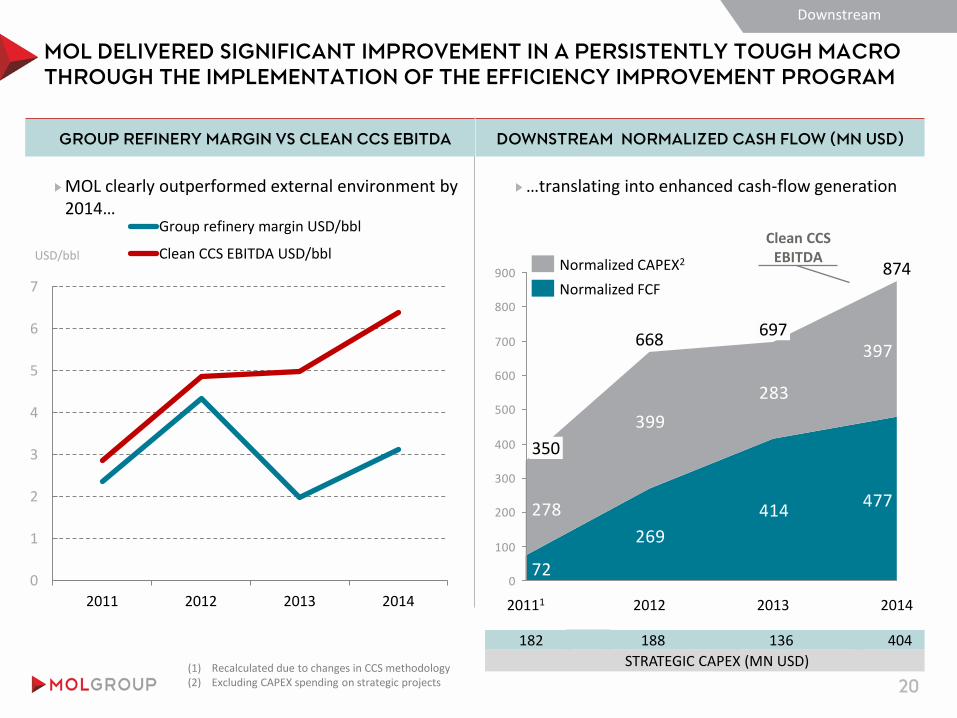
MOL DELIVERED SIGNIFICANT IMPROVEMENT IN A PERSISTENTLY TOUGH MACRO
THROUGH THE IMPLEMENTATION OF THE EFFICIENCY IMPROVEMENT PROGRAM
GROUP REFINERY MARGIN VS CLEAN CCS EBITDA DOWNSTREAM NORMALIZED CASH FLOW (MN USD)
0
1
2
3
4
5
6
7
2011 2012 2013 2014
Group refinery margin USD/bbl
Clean CCS EBITDA USD/bbl
477414
269
72
397
283
399
278
0
100
200
300
400
500
600
700
800
900
2014
874
2013
697
2012
668
20111
350
Normalized FCF
Normalized CAPEX2
MOL clearly outperformed external environment by 2014…
Clean CCS EBITDA
(1) Recalculated due to changes in CCS methodology (2) Excluding CAPEX spending on strategic projects
STRATEGIC CAPEX (MN USD)
182 188 136 404
…translating into enhanced cash-flow generation
20
Downstream
USD/bbl
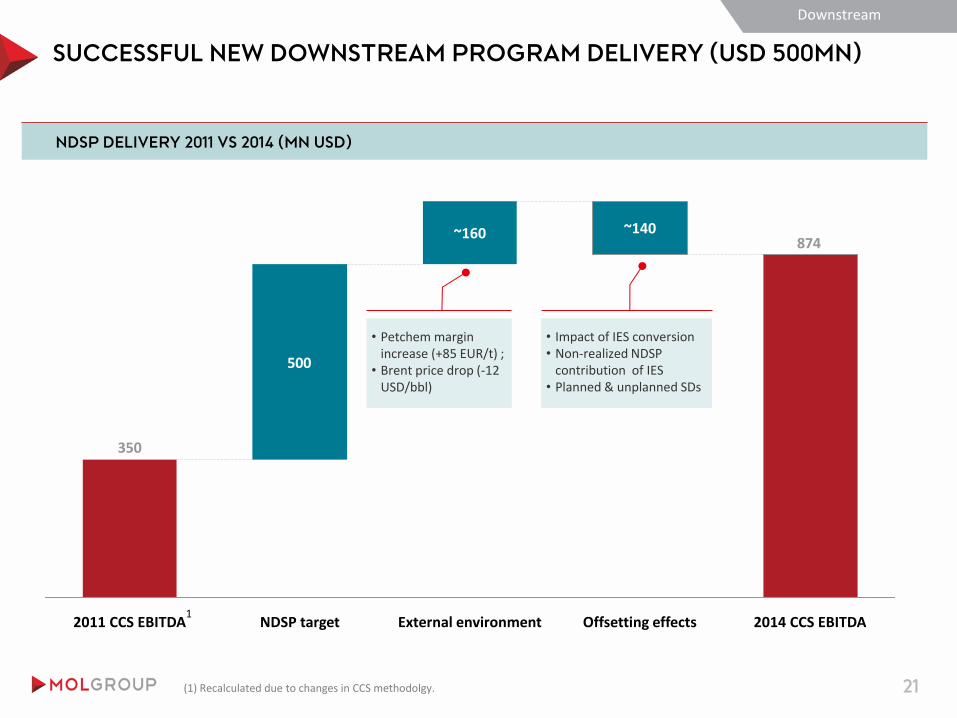
SUCCESSFUL NEW DOWNSTREAM PROGRAM DELIVERY (USD 500MN)
21
NDSP DELIVERY 2011 VS 2014 (MN USD)
874
350
500
Offsetting effects
~140
External environment
~160
NDSP target 2011 CCS EBITDA 2014 CCS EBITDA
• Petchem margin increase (+85 EUR/t) ;
• Brent price drop (-12 USD/bbl)
• Impact of IES conversion • Non-realized NDSP
contribution of IES • Planned & unplanned SDs
(1) Recalculated due to changes in CCS methodolgy.
1
Downstream

TARGETS USD 500MN ADDITIONAL IMPROVEMENT BY 2017
22
DOWNSTREAM FREE CASH FLOW GENERATION BY 2017 (MN USD)1
150
350
874
2014 CCS EBITDA
Strategic growth projects
Asset & market efficiency
870-970
Normalized’ free cash flow (3)
400-500
Normalized’ CAPEX(2)
2017 CCS EBITDA
1300 - 1400
(1) Assuming 2014 external environment (2) Excluding CAPEX spending on strategic projects (3) Excluding working capital and tax adjustments
100 - 120
+1 $/bbl
-1 $/bbl
Any potential future add-on projects (e.g. Rijeka DC, SSBR, petchem projects,
retail M&A) is evaluated on standalone basis with strict
return requirement
Potential future growth projects
Simplified cash-flow
Sensitivity to refinery margin
change
1 2
Downstream
~50%
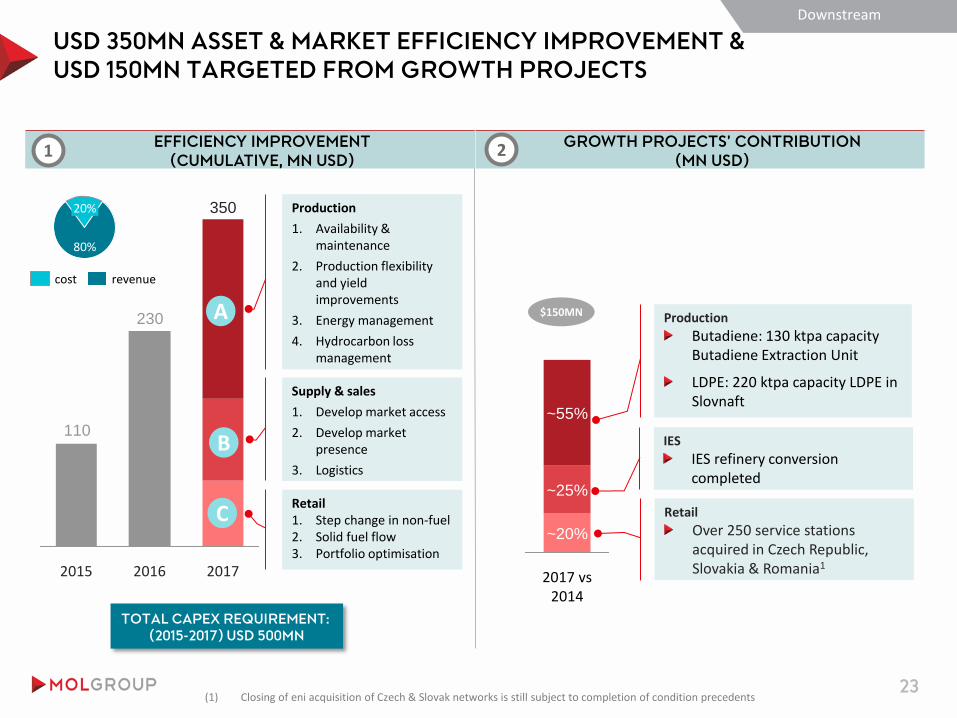
USD 350MN ASSET & MARKET EFFICIENCY IMPROVEMENT &
USD 150MN TARGETED FROM GROWTH PROJECTS
EFFICIENCY IMPROVEMENT
(CUMULATIVE, MN USD)
GROWTH PROJECTS’ CONTRIBUTION
(MN USD)
230
110
2017
350
2016 2015
TOTAL CAPEX REQUIREMENT:
(2015-2017) USD 500MN
80%
20%
revenue cost
~20%
2017 vs 2014
~25%
~55%
$150MN
(1) Closing of eni acquisition of Czech & Slovak networks is still subject to completion of condition precedents
A
B
Production
1. Availability & maintenance
2. Production flexibility and yield improvements
3. Energy management
4. Hydrocarbon loss management
Supply & sales
1. Develop market access
2. Develop market presence
3. Logistics
Retail 1. Step change in non-fuel 2. Solid fuel flow 3. Portfolio optimisation
Production
Butadiene: 130 ktpa capacity Butadiene Extraction Unit
LDPE: 220 ktpa capacity LDPE in Slovnaft
IES
IES refinery conversion completed
Retail
Over 250 service stations acquired in Czech Republic, Slovakia & Romania1
1
C
Downstream
23
2
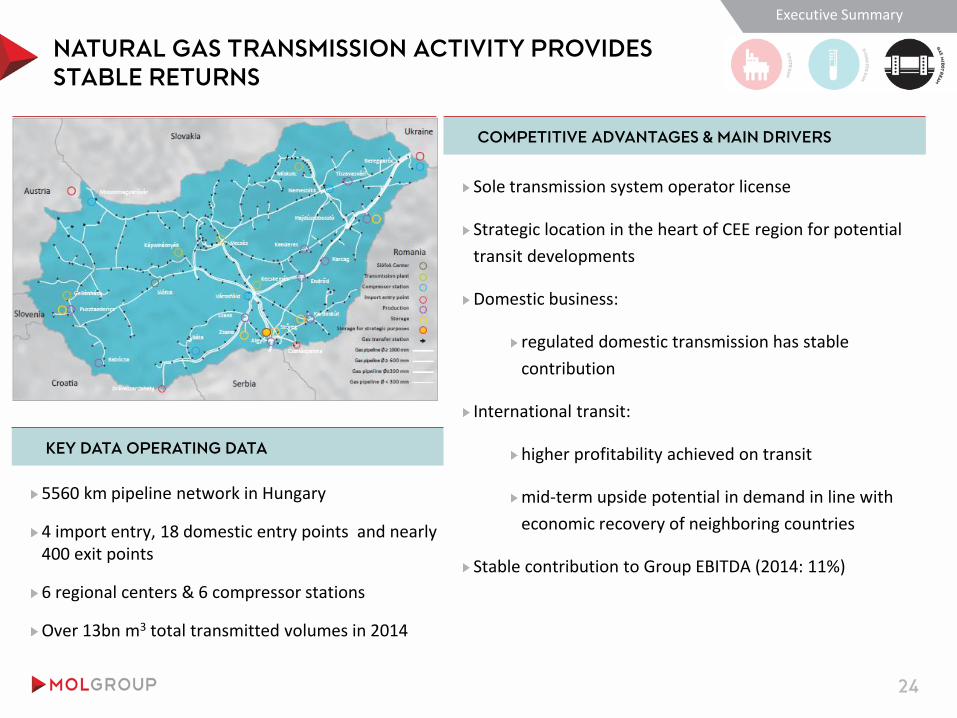
NATURAL GAS TRANSMISSION ACTIVITY PROVIDES
STABLE RETURNS
24
COMPETITIVE ADVANTAGES & MAIN DRIVERS
KEY DATA OPERATING DATA
5560 km pipeline network in Hungary
4 import entry, 18 domestic entry points and nearly 400 exit points
6 regional centers & 6 compressor stations
Over 13bn m3 total transmitted volumes in 2014
Sole transmission system operator license
Strategic location in the heart of CEE region for potential
transit developments
Domestic business:
regulated domestic transmission has stable
contribution
International transit:
higher profitability achieved on transit
mid-term upside potential in demand in line with
economic recovery of neighboring countries
Stable contribution to Group EBITDA (2014: 11%)
Executive Summary

IV. FINANCIAL OVERVIEW
25

FINANCIALS:
STRONG BALANCE SHEET HAS TOP PRIORITY
CONSERVATIVE FINANCIAL POLICY: organic CAPEX financed from operating
cash flow
1.2X NET DEBT TO EBITDA & AROUND 20% NET GEARING (2015Q2)
Around USD 2.2BN CCS GROUP EBITDA IN 2015 at ~60 USD/bbl
environment
Up to USD 1.3 BN ORGANIC CAPEX (2015)
ABOVE EUR 4BN LIQUIDITY from diversified funding sources provides
flexibility for acquisitions
PREDICTABLE DIVIDEND pay-out
Maintain current INVESTMENT GRADE AT FITCH (BBB-) and aim for an
upgrade at S&P (BB)
Executive Summary
26

CONSERVATIVE FINANCIAL POLICY
27
Organic CAPEX financed from operating cash flow
Financials
OPERATING CASH FLOW VS. CAPEX (USD BN)
0,0
0,5
1,0
1,5
2,0
2,5
3,0
3,5
4,0
2008 2009 2010 2011 2012 2013 2014
Organic Inorganic Operating CF

CONTINUOUSLY STRENGTHENING FINANCIAL POSITION
28
Indebtedness indicators still at historical lows despite increase in FY14
Financials
KEEP COVENANTS IN THE SAFETY ZONE
WELL BELOW INTERNAL TARGETS OF NET DEBT TO EBITDA ~ 2.0X, NET GEARING ~ 30%
36 33
31 28
25
16 20
0
5
10
15
20
25
30
35
40
45
2008 2009 2010 2011 2012 2013 2014
1,96 1,66 1,72
1,44 1,38
0,79
1,31
0
0,5
1
1,5
2
2,5
3
3,5
2008 2009 2010 2011 2012 2013 2014
NET DEBT TO EBITDA (X) GEARING (%)
3.5 Limit of Net Debt to EBITDA
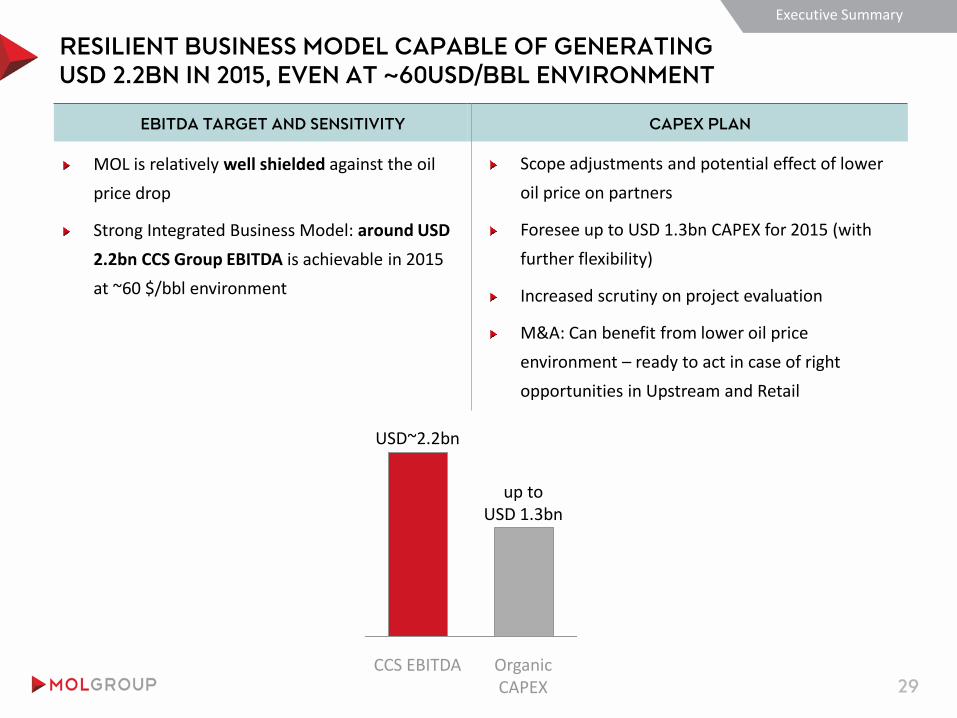
RESILIENT BUSINESS MODEL CAPABLE OF GENERATING
USD 2.2BN IN 2015, EVEN AT ~60USD/BBL ENVIRONMENT
MOL is relatively well shielded against the oil
price drop
Strong Integrated Business Model: around USD
2.2bn CCS Group EBITDA is achievable in 2015
at ~60 $/bbl environment
Executive Summary
29
EBITDA TARGET AND SENSITIVITY CAPEX PLAN
Scope adjustments and potential effect of lower
oil price on partners
Foresee up to USD 1.3bn CAPEX for 2015 (with
further flexibility)
Increased scrutiny on project evaluation
M&A: Can benefit from lower oil price
environment – ready to act in case of right
opportunities in Upstream and Retail
CCS EBITDA
USD~2.2bn
up to USD 1.3bn
Organic CAPEX

MOL HAS SUFFICIENT LIQUIDITY FOR ACQUISITIONS…
30
EUR 4.1bn total available liquidity as of Q2 2015
DRAWN VERSUS UNDRAWN FACILITIES
(EUR MILLION)
TOTAL AVAILABLE LIQUIDITY
(EUR MILLION)
Financials
3674
2941
3111
215
1947
610
732
0
1 000
2 000
3 000
4 000
5 000
6 000
7 000
Existing debt as of 30June 2015
Undrawn mid-termcredit facilities
Total credit facilitiesand bonds
mE
UR
Outstanding short term loans Hybrid
Senior Unsecured Bonds Long term loan
Medium term loan Undrawn mid-term credit facilities
Existing debt as of 30 June 2015
2941
714
434
0
500
1 000
1 500
2 000
2 500
3 000
3 500
4 000
4 500
Undrawnfacilities
Marketable sec Cash Total availableliquidity
mEU
R
EUR 4 089m

…FROM DIVERSIFIED FUNDING SOURCES
31
Cost rationalization keeping diversification in mind
RECENT EVENTS MID- AND LONG-TERM COMMITTED FUNDING
PORTFOLIO
Financials
OUTSTANDING SENIOR AND HYBRID BONDS FIXED VS FLOATING INTEREST RATE PAYMENT OF TOTAL
DEBT AS OF 30TH JUNE 2014
Total USD EUR HUF & Other
Floating Fix
USD 1.5bn Revolving Credit Facility has been
signed (more expensive USD 545m cancelled,
maturity of EUR 500m has been refinanced)
Margin: 1.15% lowest level achieved since 2008
Maturity: 5+1+1 year, available only for top borrowers
Syndicated / club loans
drawn 2%
Syndicated/ club loans undrawn
50%
Senior unsecured
bonds 33%
Perpetual exchangeable
bond 10%
Multilateral loans
3%
Other bilateral loans
2%
Issuer CurrencyVolume
(m)
Volume
(In EUR m)Issue date
Maturity
dateCoupon
MOL Plc EUR 750 750 05-Oct-2005 05-Oct-2015 3.875%
MOL Plc EUR 750 750 20-Apr-2010 20-Apr-2017 5.875%
MOL Group Finance S.A.
guaranteed by MOL Plc.USD 500 447 26-Sep-2012 26-Sep-2019 6.25%
Magnolia Finance Ltd EUR 610 610 20-Mar-2006 Perpetual4% till Mar-2016 then
3m EURIBOR + 550bps
72%50%
64%
100%
28%50%
36%

AVERAGE MATURITY OF 2.4 YEARS
32
Diversified and balanced maturity structure
Financials
1 148
39 39 39 39
750 750
447 37
6
54
57
1050
110
452
1330
0
500
1 000
1 500
2 000
2 500
Reportedcash&cashequivalents
2015 2016 2017 2018 2019 2020 2021
EU
R M
Reported cash&cash equivalents Long term loan (multilaterals) Senior Unsecured Bonds
Medium term loan Undrawn facilities
MOL, S&P Hungary, S&P MOL, Fitch Hungary, Fitch
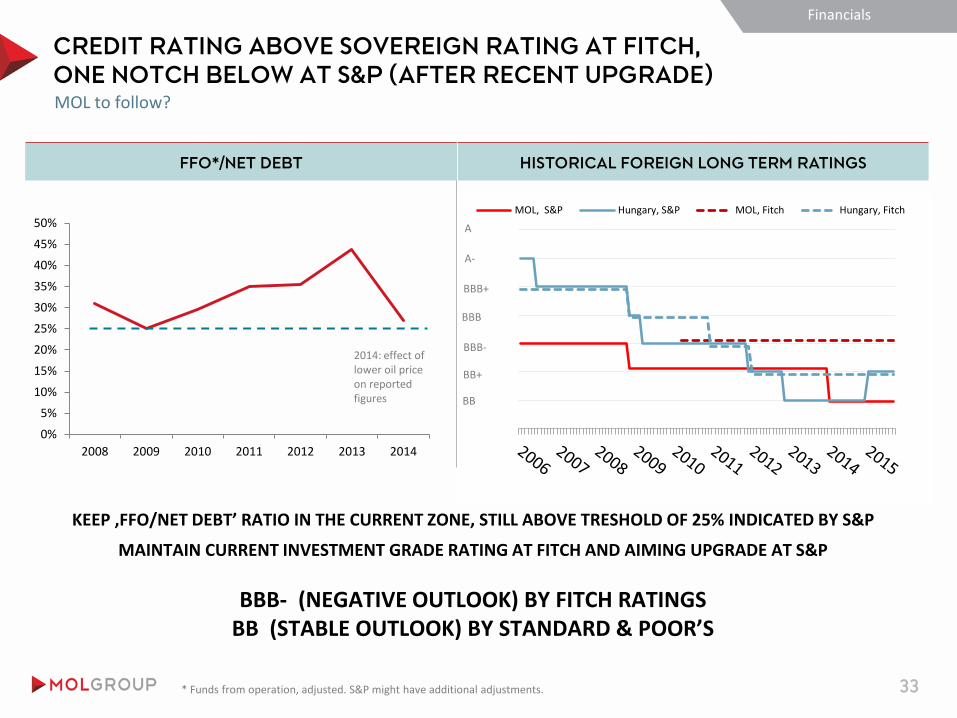
CREDIT RATING ABOVE SOVEREIGN RATING AT FITCH,
ONE NOTCH BELOW AT S&P (AFTER RECENT UPGRADE)
33
FFO*/NET DEBT HISTORICAL FOREIGN LONG TERM RATINGS
Financials
KEEP ‚FFO/NET DEBT’ RATIO IN THE CURRENT ZONE, STILL ABOVE TRESHOLD OF 25% INDICATED BY S&P
MAINTAIN CURRENT INVESTMENT GRADE RATING AT FITCH AND AIMING UPGRADE AT S&P
BBB- (NEGATIVE OUTLOOK) BY FITCH RATINGS BB (STABLE OUTLOOK) BY STANDARD & POOR’S
0%
5%
10%
15%
20%
25%
30%
35%
40%
45%
50%
2008 2009 2010 2011 2012 2013 2014
* Funds from operation, adjusted. S&P might have additional adjustments.
2014: effect of lower oil price on reported figures BB
BB+
BBB-
BBB
BBB+
A-
A
MOL to follow?
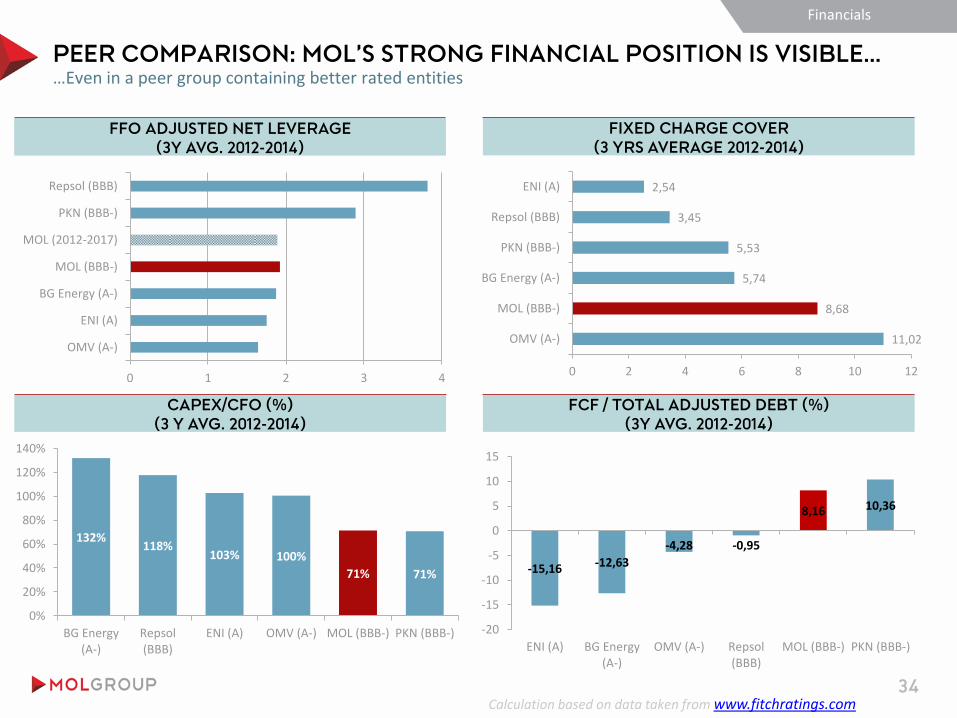
34
Financials
PEER COMPARISON: MOL’S STRONG FINANCIAL POSITION IS VISIBLE… …Even in a peer group containing better rated entities
Calculation based on data taken from www.fitchratings.com
FFO ADJUSTED NET LEVERAGE
(3Y AVG. 2012-2014)
FIXED CHARGE COVER
(3 YRS AVERAGE 2012-2014)
CAPEX/CFO (%)
(3 Y AVG. 2012-2014)
FCF / TOTAL ADJUSTED DEBT (%)
(3Y AVG. 2012-2014)
11,02
8,68
5,74
5,53
3,45
2,54
0 2 4 6 8 10 12
OMV (A-)
MOL (BBB-)
BG Energy (A-)
PKN (BBB-)
Repsol (BBB)
ENI (A)
0 1 2 3 4
OMV (A-)
ENI (A)
BG Energy (A-)
MOL (BBB-)
MOL (2012-2017)
PKN (BBB-)
Repsol (BBB)
-15,16 -12,63
-4,28 -0,95
8,16 10,36
-20
-15
-10
-5
0
5
10
15
ENI (A) BG Energy(A-)
OMV (A-) Repsol(BBB)
MOL (BBB-) PKN (BBB-)
132% 118%
103% 100%
71% 71%
0%
20%
40%
60%
80%
100%
120%
140%
BG Energy(A-)
Repsol(BBB)
ENI (A) OMV (A-) MOL (BBB-) PKN (BBB-)

WELL DIVERSIFIED BUSINESS PORTFOLIO
Business Profile Assessment
Financials
35
Revenues (FY 2014) $mm 20,975 33,921 60,365 47,716 10,178
1P Reserves mmboe 555.0 n/a 1,538.8 1,058.9 n/a
Total Production mboepd 97.5 n/a 341.6 299.8 n/a
E&P Production Costs $/boe 8.5 n/a 12.9 20.9 n/a
F&D Costs $/boe [TBU] n/a 31.6 69.6 n/a
# of Refineries # 4.0 3.0 6.0 1.0 n/a
Refining Capacity mboepd 423.4 625.5 998.0 360.0 n/a
EBITDA
Revenues
1P
Geographic
Breakdown
Segment
Breakdown
Reserve Breakdwon
MOL PKN REPSOL OMV PGNIG
Hungary20%
RUS, PAK, KAZ,
Kurdistan29%
Croatia47%
UK4%
LatAm85%
Africa8%
Other7%
Canada100%
POL42%
DEU18%
CZE12%
LTU8%
Other20%Hungary
27%
Croatia13%
Italy11%
Austria10%
Other CEE10%
RoW29%
Upstream68%
Downtstream32%
Upstream54%
Downstream 41%
MidStream5%
Downstream73%
Retail24%
Upstream3%
Upstream92%
Mid / Downstream
8% E&P38%
Trade & Storage
27%
Distribution
22%
H&P Generatio
n13%
Domestic (Poland)
85%
Germany8%
Norway+Switzerland
7%
ESP54%
E.U.17%
OECD11%
Other18%
AUT25%
TUR23%DEU
17%
ROU11%
Other Europe
16%
RoW8%
ROU62%
NW EU, Africa &
AUS26%
AUT8%
ME & Caspian
4%

IMPROVING SPREAD PERFORMANCE VERSUS PEER’S BONDS
MOL/REPSOL (EUR) SECONDARY PERFORMANCE
MOL/OMV (EUR) SECONDARY PERFORMANCE
Financials
36

37
V. APPENDIX

OVERVIEW OF MOL’S ASSETS IN KURDISTAN REGION OF IRAQ
38
Entry in 2007 amongst the first ones
Appendix
BLOCK W.I. FULLY DILUTED
W.I.
OPERATOR
Akri-Bijeel 80% 51.2% MOL
Shaikan 20% 13.6% GKP
(75%)
Khor Mor 10% 10% Pearl Petrole
um Chemchemal 10% 10%
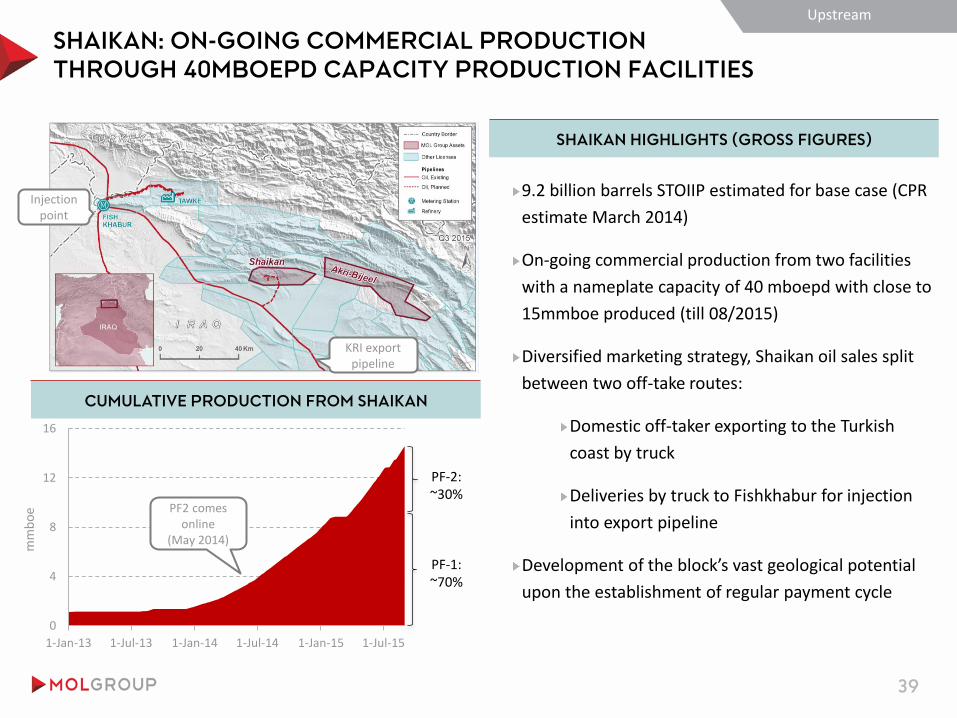
SHAIKAN: ON-GOING COMMERCIAL PRODUCTION
THROUGH 40MBOEPD CAPACITY PRODUCTION FACILITIES
39
SHAIKAN HIGHLIGHTS (GROSS FIGURES)
Upstream
9.2 billion barrels STOIIP estimated for base case (CPR
estimate March 2014)
On-going commercial production from two facilities
with a nameplate capacity of 40 mboepd with close to
15mmboe produced (till 08/2015)
Diversified marketing strategy, Shaikan oil sales split
between two off-take routes:
Domestic off-taker exporting to the Turkish
coast by truck
Deliveries by truck to Fishkhabur for injection
into export pipeline
Development of the block’s vast geological potential
upon the establishment of regular payment cycle
Injection point
KRI export pipeline
0
4
8
12
16
1-Jan-13 1-Jul-13 1-Jan-14 1-Jul-14 1-Jan-15 1-Jul-15
CUMULATIVE PRODUCTION FROM SHAIKAN
PF2 comes online
(May 2014)
mm
bo
e
PF-1: ~70%
PF-2: ~30%
EXPANDING OUR NORTH SEA PORTFOLIO ENTERING NORWAY
40
Further balancing the country risk profile & doubling the resource potential of the Group’s exploration portfolio
Upstream
Acquiring 100% ownership in Ithaca Petroleum Norge – a pre-qualified operator
Further balance the country risk profile and extend international exploration portfolio
14 licences in the Norwegian Continental Shelf (NCS), 3 are operated
Several sizable prospects to drill, 3 committed wells by 2016
Oil weighted exploration portfolio with net unrisked best estimate Prospective Resources of more than 600 MMboe.
Strong exploration focused team with deep experience on the NCS
USD 60mn base consideration + maximum USD 30mn discovery bonus (2015-2017)
ACQUISITION OF ITHACA PETROLEUM NORGE
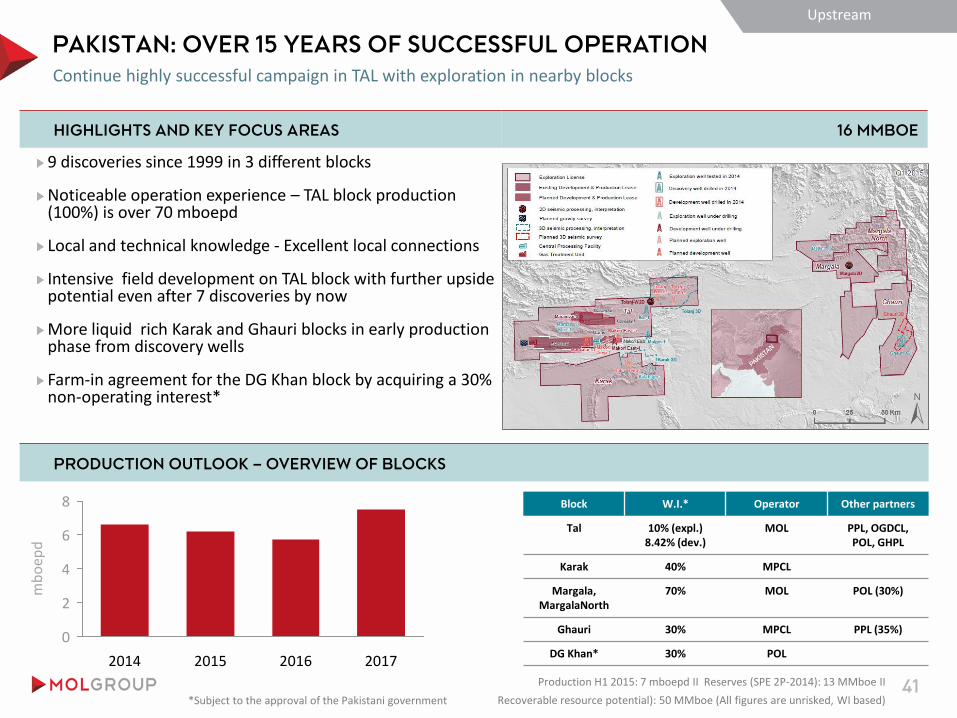
PAKISTAN: OVER 15 YEARS OF SUCCESSFUL OPERATION
41
HIGHLIGHTS AND KEY FOCUS AREAS
9 discoveries since 1999 in 3 different blocks
Noticeable operation experience – TAL block production (100%) is over 70 mboepd
Local and technical knowledge - Excellent local connections
Intensive field development on TAL block with further upside potential even after 7 discoveries by now
More liquid rich Karak and Ghauri blocks in early production phase from discovery wells
Farm-in agreement for the DG Khan block by acquiring a 30% non-operating interest*
Continue highly successful campaign in TAL with exploration in nearby blocks
PRODUCTION OUTLOOK – OVERVIEW OF BLOCKS
Upstream
Block W.I.* Operator Other partners
Tal 10% (expl.) 8.42% (dev.)
MOL PPL, OGDCL, POL, GHPL
Karak 40% MPCL
Margala, MargalaNorth
70% MOL POL (30%)
Ghauri 30% MPCL PPL (35%)
DG Khan* 30% POL
0
2
4
6
8
mb
oep
d
2017 2016 2015 2014 Production H1 2015: 7 mboepd II Reserves (SPE 2P-2014): 13 MMboe II
Recoverable resource potential): 50 MMboe (All figures are unrisked, WI based)
16 MMBOE
*Subject to the approval of the Pakistani government

CIS: MOVING FORWARD TOWARDS VALUE MONETISATION
42
KAZAKHSTAN (60 MMBOE) – MONETISATION OF NOTEWORTHY RESERVES
FED: Significant discoveries on a ~220 MMboe* reserves field
Successful appraisal programme closed in 2014, additional 24 MMboe of reserves booked (net to MOL)
Preparations ongoing for spud in 1st development well in Q3 2015
A new commercial discovery in the Bashkirian reservoir in 2014 – exploration licence extended
Further exploration upside targeted by the JV partners (KMG EP, FIOC) with the acquisition of new 3D seismic.
Successful appraisal programme closed on FED with additional 24 MMboe reserve booking
RUS: Production H1 2015: 7 mboepd II Reserves (SPE 2P-2014): 75 MMboe II RRP(unrisked, WI based): 65 MMboe
KAZ: Reserves (SPE 2P-2014): 60 MMboe II RRP(unrisked, WI based): 30 MMboe; *Gross field size, MOL’s share is 27.5%
Upstream
Portfolio restructured after monetising ZMB field and 49% in Baitugan and Yerilkinsky
Intensive development program on Baitugan block to increase production - ~50 wells p.a.
Exploration upside confirmed in Yerilkinsky block - first spud in 2015
RUSSIA (75 MMBOE) – STILL A CORE COUNTRY WITH GROWTH POTENTIAL
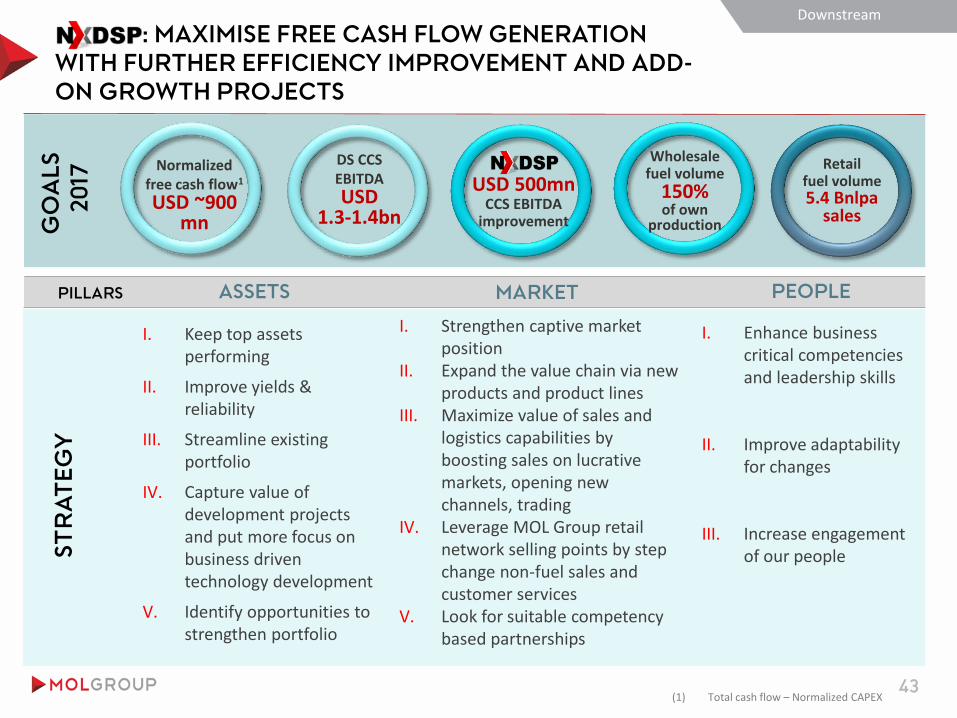
: MAXIMISE FREE CASH FLOW GENERATION
WITH FURTHER EFFICIENCY IMPROVEMENT AND ADD-
ON GROWTH PROJECTS
PILLARS
43
ASSETS MARKET PEOPLE
Normalized free cash flow1
USD ~900 mn
DS CCS EBITDA USD
1.3-1.4bn
USD 500mn CCS EBITDA
improvement
I. Strengthen captive market position
II. Expand the value chain via new products and product lines
III. Maximize value of sales and logistics capabilities by boosting sales on lucrative markets, opening new channels, trading
IV. Leverage MOL Group retail network selling points by step change non-fuel sales and customer services
V. Look for suitable competency based partnerships
I. Keep top assets performing
II. Improve yields & reliability
III. Streamline existing portfolio
IV. Capture value of development projects and put more focus on business driven technology development
V. Identify opportunities to strengthen portfolio
I. Enhance business critical competencies and leadership skills
II. Improve adaptability for changes
III. Increase engagement of our people
Wholesale fuel volume
150% of own
production
Retail fuel volume 5.4 Bnlpa
sales
ST
RA
TE
GY
G
OA
LS
20
17
Downstream
(1) Total cash flow – Normalized CAPEX
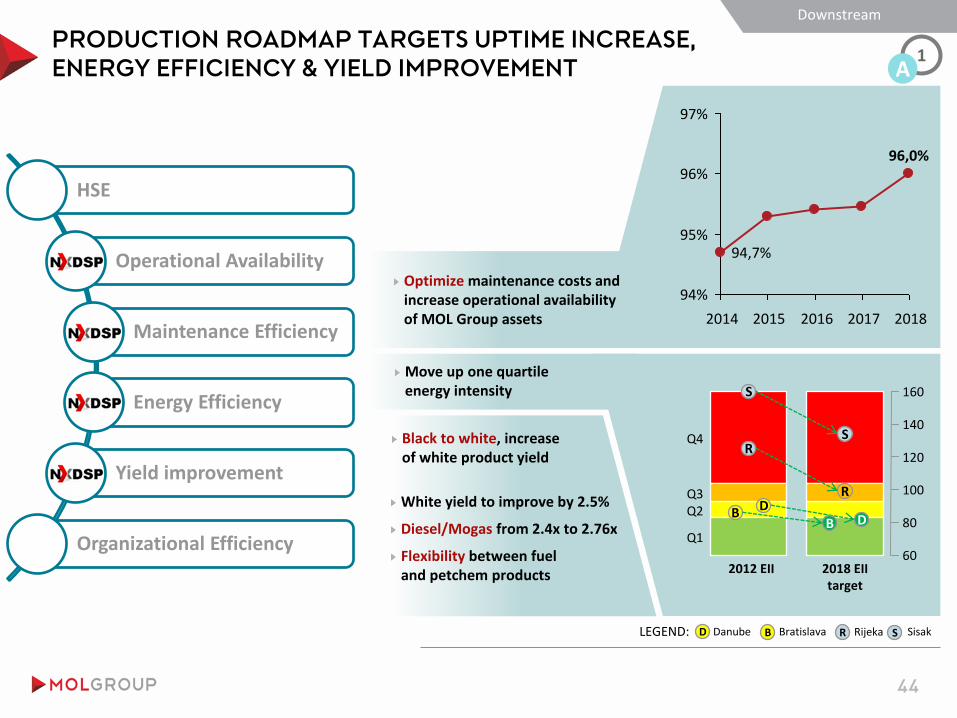
PRODUCTION ROADMAP TARGETS UPTIME INCREASE,
ENERGY EFFICIENCY & YIELD IMPROVEMENT
HSE
Operational Availability
Maintenance Efficiency
Energy Efficiency
Yield improvement
Organizational Efficiency
2018 2017 2016 2015 2014
94%
95%
96%
97%
96,0%
94,7%
Optimize maintenance costs and increase operational availability of MOL Group assets
Move up one quartile energy intensity
D
R
S
D
R
S
B B
2012 EII 2018 EII target
Q4
Q2 Q3
Q1
160
60
80
100
120
140
S R D B LEGEND: Danube Bratislava Rijeka
Black to white, increase of white product yield
White yield to improve by 2.5%
Diesel/Mogas from 2.4x to 2.76x
Flexibility between fuel and petchem products
1 A
Downstream
44
Sisak
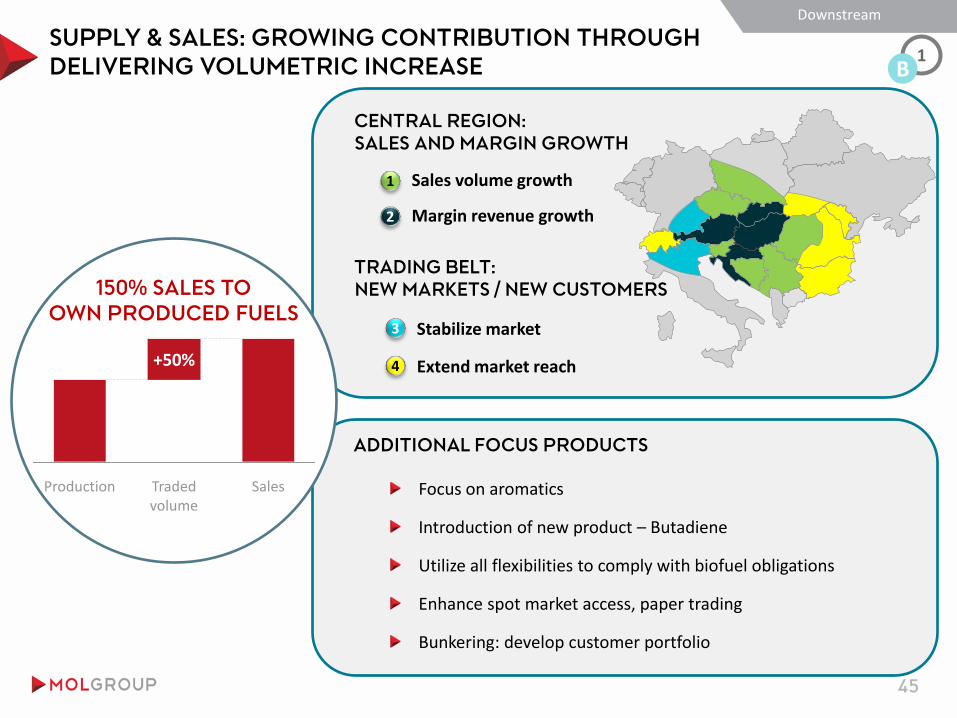
SUPPLY & SALES: GROWING CONTRIBUTION THROUGH
DELIVERING VOLUMETRIC INCREASE
ADDITIONAL FOCUS PRODUCTS
1
2
Sales volume growth
Margin revenue growth
3 Stabilize market
Extend market reach 4
Focus on aromatics
Introduction of new product – Butadiene
Utilize all flexibilities to comply with biofuel obligations
Enhance spot market access, paper trading
Bunkering: develop customer portfolio
CENTRAL REGION:
SALES AND MARGIN GROWTH
TRADING BELT:
NEW MARKETS / NEW CUSTOMERS
Production Traded volume
Sales
+50%
150% SALES TO
OWN PRODUCED FUELS
1 B
Downstream
45
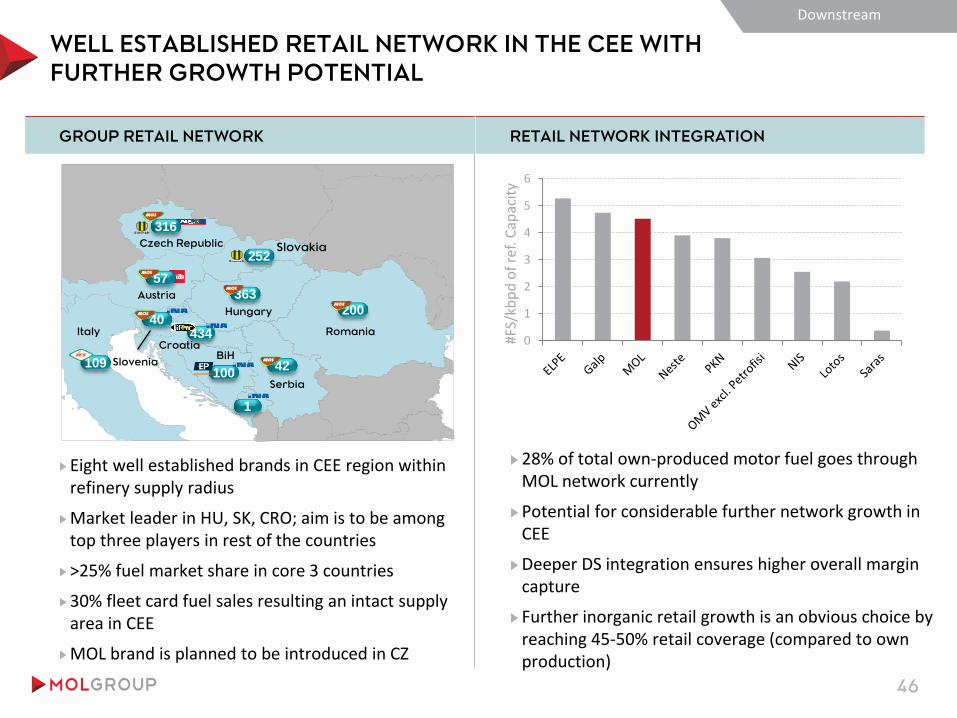
WELL ESTABLISHED RETAIL NETWORK IN THE CEE WITH
FURTHER GROWTH POTENTIAL
GROUP RETAIL NETWORK RETAIL NETWORK INTEGRATION
Eight well established brands in CEE region within refinery supply radius
Market leader in HU, SK, CRO; aim is to be among top three players in rest of the countries
>25% fuel market share in core 3 countries
30% fleet card fuel sales resulting an intact supply area in CEE
MOL brand is planned to be introduced in CZ
28% of total own-produced motor fuel goes through MOL network currently
Potential for considerable further network growth in CEE
Deeper DS integration ensures higher overall margin capture
Further inorganic retail growth is an obvious choice by reaching 45-50% retail coverage (compared to own production)
0
1
2
3
4
5
6
#FS/
kbp
d o
f re
f. C
apac
ity
Downstream
46
109
316
42 100
434
Slovnaft
ENERGOPETROL
200
363
Slovnaft252
40
57
1
Romania
Hungary
Slovakia Czech Republic
Austria
Italy
Serbia
BiH Croatia
Slovenia
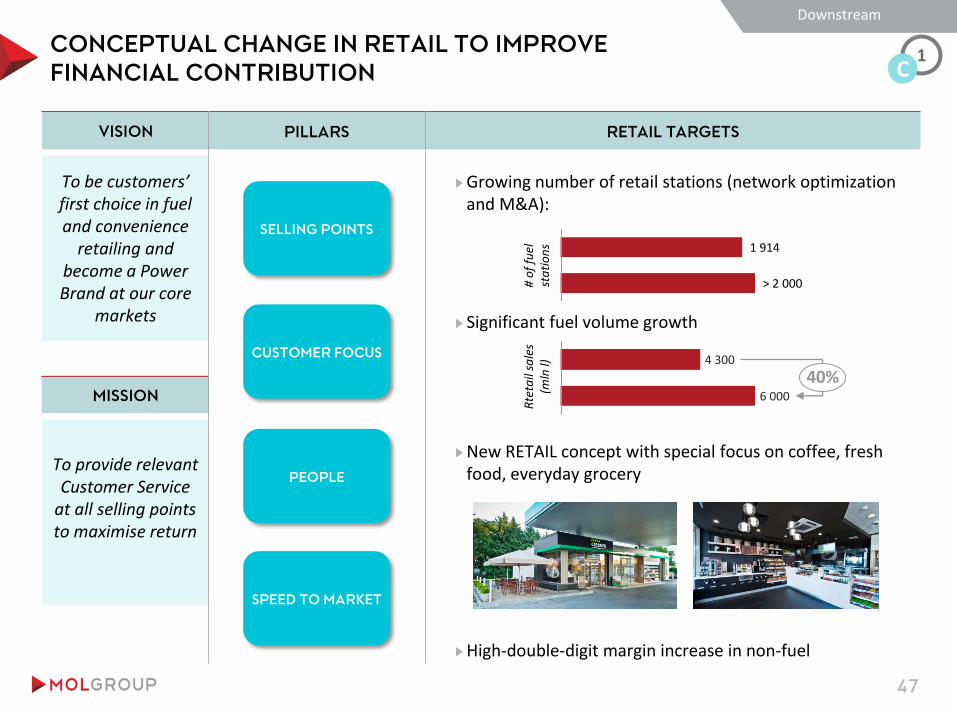
CONCEPTUAL CHANGE IN RETAIL TO IMPROVE
FINANCIAL CONTRIBUTION
PILLARS VISION
To be customers’ first choice in fuel and convenience
retailing and become a Power Brand at our core
markets
MISSION
To provide relevant Customer Service
at all selling points to maximise return
RETAIL TARGETS
Growing number of retail stations (network optimization and M&A):
Significant fuel volume growth
# o
f fu
el
sta
tio
ns
Rte
tail
sale
s (m
ln l)
New RETAIL concept with special focus on coffee, fresh food, everyday grocery
> 2 000
1 914
6 000
4 300
40%
High-double-digit margin increase in non-fuel
SELLING POINTS
CUSTOMER FOCUS
SPEED TO MARKET
PEOPLE
1 C
Downstream
47
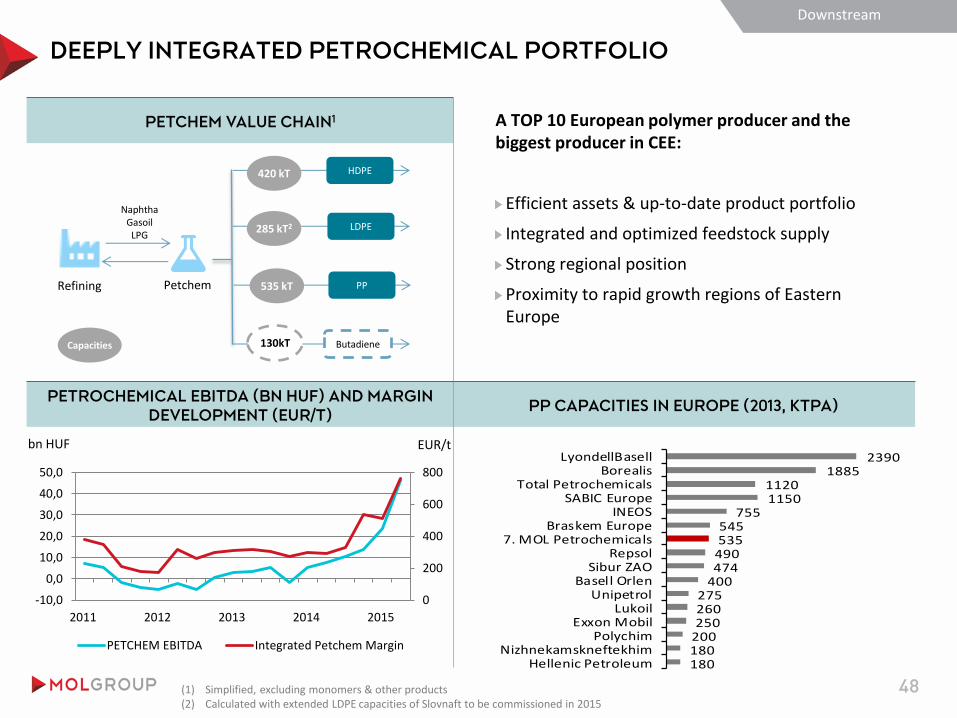
DEEPLY INTEGRATED PETROCHEMICAL PORTFOLIO
PETCHEM VALUE CHAIN1
PETROCHEMICAL EBITDA (BN HUF) AND MARGIN
DEVELOPMENT (EUR/T) PP CAPACITIES IN EUROPE (2013, KTPA)
180180200250260275
400474490535545
75511501120
18852390
Hellenic PetroleumNizhnekamskneftekhim
PolychimExxon Mobil
LukoilUnipetrol
Basell OrlenSibur ZAO
Repsol7. MOL Petrochemicals
Braskem EuropeINEOS
SABIC EuropeTotal Petrochemicals
BorealisLyondellBasell
A TOP 10 European polymer producer and the biggest producer in CEE:
Efficient assets & up-to-date product portfolio
Integrated and optimized feedstock supply
Strong regional position
Proximity to rapid growth regions of Eastern Europe
Refining Petchem 535 kT
285 kT2
420 kT HDPE
LDPE
PP
130kT Butadiene
Naphtha Gasoil LPG
(1) Simplified, excluding monomers & other products (2) Calculated with extended LDPE capacities of Slovnaft to be commissioned in 2015
Capacities
Downstream
48
bn HUF EUR/t
0
200
400
600
800
-10,0
0,0
10,0
20,0
30,0
40,0
50,0
2011 2012 2013 2014 2015
PETCHEM EBITDA Integrated Petchem Margin

EXTENDING THE PETROCHEMICALS VALUE CHAIN TO
INCREASE PROFITABILITY
49
New 220 ktpa capacity LDPE unit replaces 3 old ones at Slovnaft
Revamp of existing steam cracker
Higher naphtha off-take; Reduced production cost; better quality new products
CAPEX: USD ~350mn
Construction is on track (overall above 70%)
Planned start date: end of 2015
PILLARS
LDPE4
DOWNSTREAM
New 130 ktpa capacity Butadiene Extraction Unit (BDEU) at the site of TVK.
CAPEX: USD ~150mn
Completion level: >90%
Commissioning phase in Q2 2015
Start of Commercial production: Q3 2015
Sizable contribution to Petrochemicals profitability
PILLARS
BUTADIENE
Entering into the synthetic rubber business with a joint venture partner, Japanese JSR
New 60 ktpa SSBR plant - lucrative option of butadiene utilization.
Planned start date: end of 2017
FID and start of construction in 2015
PILLARS
SYNTHETIC RUBBER
Downstream
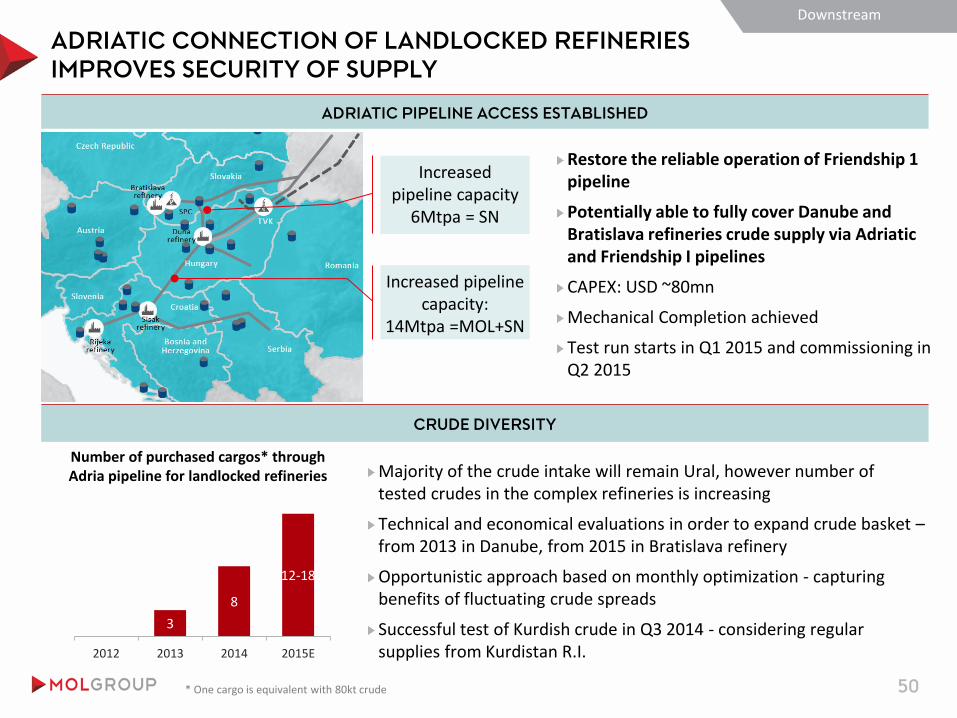
ADRIATIC CONNECTION OF LANDLOCKED REFINERIES
IMPROVES SECURITY OF SUPPLY
50
ADRIATIC PIPELINE ACCESS ESTABLISHED
CRUDE DIVERSITY
Restore the reliable operation of Friendship 1 pipeline
Potentially able to fully cover Danube and Bratislava refineries crude supply via Adriatic and Friendship I pipelines
CAPEX: USD ~80mn
Mechanical Completion achieved
Test run starts in Q1 2015 and commissioning in Q2 2015
Increased pipeline capacity
6Mtpa = SN
Increased pipeline capacity:
14Mtpa =MOL+SN
3
8
12-18
2012 2013 2014 2015E
Number of purchased cargos* through Adria pipeline for landlocked refineries Majority of the crude intake will remain Ural, however number of
tested crudes in the complex refineries is increasing
Technical and economical evaluations in order to expand crude basket – from 2013 in Danube, from 2015 in Bratislava refinery
Opportunistic approach based on monthly optimization - capturing benefits of fluctuating crude spreads
Successful test of Kurdish crude in Q3 2014 - considering regular supplies from Kurdistan R.I.
* One cargo is equivalent with 80kt crude
Downstream

DIVIDEND: PREDICTABLE PAY-OUT WITH BALANCE
SHEET STABILITY IN THE FOCUS
Pay out dividend to shareholders whilst maintaining adequate financial stability
Balance sheet has top priority
Net gearing and net debt to EBITDA ratio targets are considered along with future M&A plans
51
DIVIDEND HISTORY OF LAST 4 YEARS (HUF BN) AND KEY PRINCIPLES
45 46 4750
13
2014
60
2013 2012 2015
Regular dividend
Special dividend
Appendix

KEY ITEMS OF TAXATION
52
HUNGARY
CROATIA & SLOVAKIA
Revenue based ’Crisis tax’ abolished from 2013 – ~HUF 30bn negative effect p.a. in 2010-12
Profit based ’Robin Hood’ nominal tax rate is 31%
only energy related part of the profit affected (~70%), thus implied RH tax rate is cca. 22%
only the Hungarian operation of certain companies are affected (i.e: MOL Plc., while gas transmission (FGSZ) or
petrochemicals (TVK) are not subject of the tax)
CIT tax rate is 19%
Local Trade Tax and Innovation Fee
Financials
HUF bn 2011 2012 2013 2014
Local Trade Tax and Innovation Fee 13 15 14 13
Special „ Crisis” Tax – CANCELLED end 2012 (HUN) 29 30 - -
Robin Hood – (HUN) 3 1 0 0
Corporate Income Tax 44 17 20 17
Sum 89 63 34 30
20% CRO & 22% SVK CIT rates applicable in 2015
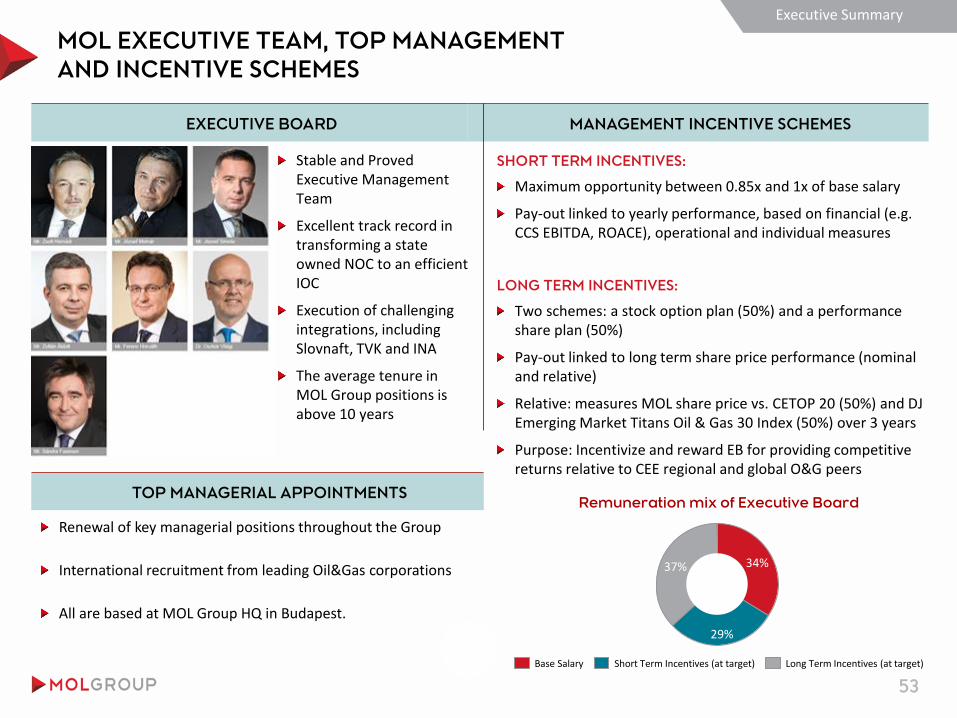
TOP MANAGERIAL APPOINTMENTS
SHORT TERM INCENTIVES:
Maximum opportunity between 0.85x and 1x of base salary
Pay-out linked to yearly performance, based on financial (e.g. CCS EBITDA, ROACE), operational and individual measures
LONG TERM INCENTIVES:
Two schemes: a stock option plan (50%) and a performance share plan (50%)
Pay-out linked to long term share price performance (nominal and relative)
Relative: measures MOL share price vs. CETOP 20 (50%) and DJ Emerging Market Titans Oil & Gas 30 Index (50%) over 3 years
Purpose: Incentivize and reward EB for providing competitive returns relative to CEE regional and global O&G peers
MOL EXECUTIVE TEAM, TOP MANAGEMENT
AND INCENTIVE SCHEMES
53
Stable and Proved Executive Management Team
Excellent track record in transforming a state owned NOC to an efficient IOC
Execution of challenging integrations, including Slovnaft, TVK and INA
The average tenure in MOL Group positions is above 10 years
Renewal of key managerial positions throughout the Group
International recruitment from leading Oil&Gas corporations
All are based at MOL Group HQ in Budapest.
Executive Summary
EXECUTIVE BOARD MANAGEMENT INCENTIVE SCHEMES
Remuneration mix of Executive Board
37%
29%
34%
Base Salary Short Term Incentives (at target) Long Term Incentives (at target)
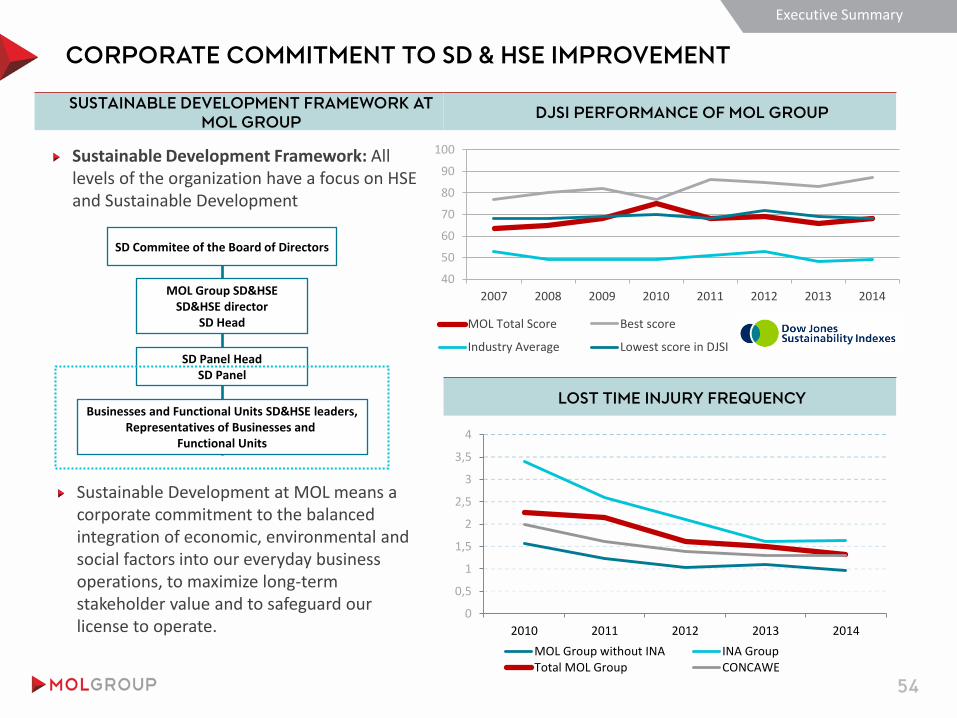
CORPORATE COMMITMENT TO SD & HSE IMPROVEMENT
0
0,5
1
1,5
2
2,5
3
3,5
4
2010 2011 2012 2013 2014
MOL Group without INA INA GroupTotal MOL Group CONCAWE
Sustainable Development Framework: All levels of the organization have a focus on HSE and Sustainable Development
Sustainable Development at MOL means a corporate commitment to the balanced integration of economic, environmental and social factors into our everyday business operations, to maximize long-term stakeholder value and to safeguard our license to operate.
Executive Summary
LOST TIME INJURY FREQUENCY
54
DJSI PERFORMANCE OF MOL GROUP SUSTAINABLE DEVELOPMENT FRAMEWORK AT
MOL GROUP
Businesses and Functional Units SD&HSE leaders, Representatives of Businesses and
Functional Units
SD Commitee of the Board of Directors
MOL Group SD&HSE SD&HSE director
SD Head
SD Panel Head SD Panel
40
50
60
70
80
90
100
2007 2008 2009 2010 2011 2012 2013 2014
MOL Total Score Best score
Industry Average Lowest score in DJSI

MOL shares are listed on the Budapest, Luxembourg and Warsaw Stock Exchanges. Our depository receipts are traded on London’s International Order Book and OTC in the USA.
SHAREHOLDER STRUCTURE
Executive Summary
SHAREHOLDER STRUCTURE AS OF 30 JUNE 2015
UniCredit Bank AG Credit Agricole
2,0% 5,2%
Dana Gas PJSC
1,1%
Crescent Petroleum 3,0%
ING Bank N.V. 5,0%
Magnolia Finance Limited 5,8%
OTP Fund Management 1,0%
OTP Bank Plc. 4,8%
OmanOil Limited 7,0%
CEZ MH B.V.
7,4%
Hungarian State
24,7%
Domestic private investors 4,6%
Domestic institutional investors 5,4%
Foreign investors
21,6%
Treasury shares
1,5%
55
DISCLAIMER
56
"This presentation and the associated slides and discussion contain forward-looking
statements. These statements are naturally subject to uncertainty and changes in
circumstances. Those forward-looking statements may include, but are not limited to, those
regarding capital employed, capital expenditure, cash flows, costs, savings, debt, demand,
depreciation, disposals, dividends, earnings, efficiency, gearing, growth, improvements,
investments, margins, performance, prices, production, productivity, profits, reserves, returns,
sales, share buy backs, special and exceptional items, strategy, synergies, tax rates, trends, value,
volumes, and the effects of MOL merger and acquisition activities. These forward-looking
statements are subject to risks, uncertainties and other factors, which could cause actual results
to differ materially from those expressed or implied by these forward-looking statements. These
risks, uncertainties and other factors include, but are not limited to developments in government
regulations, foreign exchange rates, crude oil and gas prices, crack spreads, political stability,
economic growth and the completion of ongoing transactions. Many of these factors are beyond
the Company's ability to control or predict. Given these and other uncertainties, you are
cautioned not to place undue reliance on any of the forward-looking statements contained
herein or otherwise. The Company does not undertake any obligation to release publicly any
revisions to these forward-looking statements (which speak only as of the date hereof) to reflect
events or circumstances after the date hereof or to reflect the occurrence of unanticipated
events, except as maybe required under applicable securities laws.
Statements and data contained in this presentation and the associated slides and discussions,
which relate to the performance of MOL in this and future years, represent plans, targets or
projections."