FIXED INCOME INVESTOR PRESENTATION...8 Group OverviewClassification: LimitedResults Capital, Funding...
26
FIXED INCOME INVESTOR PRESENTATION FY 2019
Transcript of FIXED INCOME INVESTOR PRESENTATION...8 Group OverviewClassification: LimitedResults Capital, Funding...
FIXED INCOME INVESTOR
PRESENTATION
FY 2019

2
Classification: Limited
Group Overview & Strategy
Classification: Limited
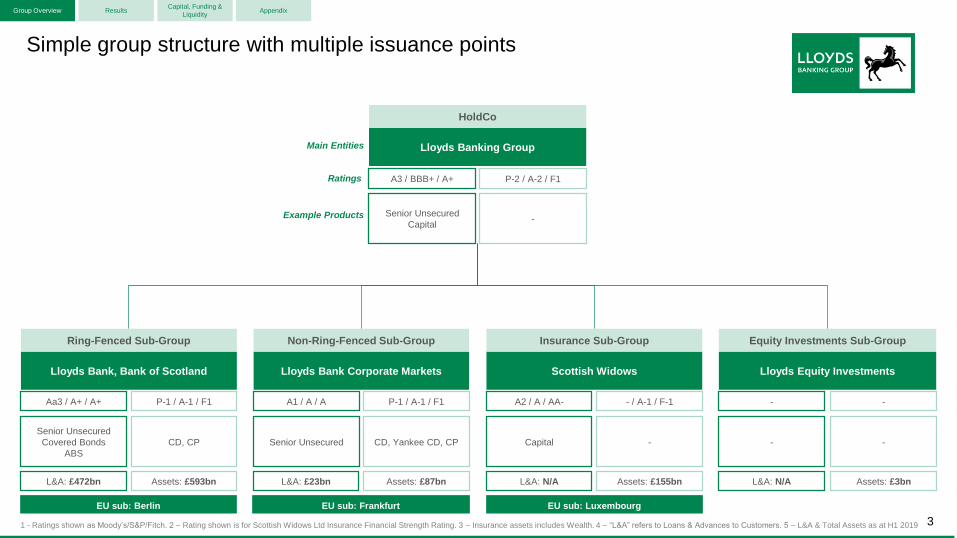
Simple group structure with multiple issuance points
Group Overview ResultsCapital, Funding &
LiquidityAppendix
Lloyds Banking Group
HoldCo
Senior Unsecured
Capital
A3 / BBB+ / A+
Lloyds Bank, Bank of Scotland
Ring-Fenced Sub-Group
Senior Unsecured
Covered Bonds
ABS
Aa3 / A+ / A+
CD, CP
P-1 / A-1 / F1
Lloyds Bank Corporate Markets
Non-Ring-Fenced Sub-Group
Senior Unsecured
A1 / A / A
CD, Yankee CD, CP
P-1 / A-1 / F1
Scottish Widows
Insurance Sub-Group
Capital
A2 / A / AA-
-
- / A-1 / F-1
Lloyds Equity Investments
Equity Investments Sub-Group
-
-
-
-
-
P-2 / A-2 / F1
Main Entities
Ratings
Example Products
3
EU sub: Berlin EU sub: Frankfurt EU sub: Luxembourg
L&A: £472bn Assets: £593bn L&A: £23bn Assets: £87bn L&A: N/A Assets: £155bn L&A: N/A Assets: £3bn
1 - Ratings shown as Moody’s/S&P/Fitch. 2 – Rating shown is for Scottish Widows Ltd Insurance Financial Strength Rating. 3 – Insurance assets includes Wealth. 4 – “L&A” refers to Loans & Advances to Customers. 5 – L&A & Total Assets as at H1 2019

4
Classification: LimitedGroup OverviewCapital, Funding &
LiquidityAppendixResults
Market shares - opportunities for growth in targeted key segments
Commercial Banking
Product market share
RetailChannels Insurance & Wealth
24%
22%
19%
19%
18%
16%
15%
15%
12%
7%
3%
Consumer credit card balances
Corporate pensions (flow)3
SME and small business lending balances
Mortgage balances (open book)
PCA deposit balances
Mid corporate main bank relationships
Savings balances
Consumer loan balances2
Black Horse car finance balances
Home insurance GWP
Commercial payments volumes (flow)
Individual pensions & drawdown (flow)3
Wealth management AuA4Average market
share5: 18%
18%
22%
Digital new business volumes1
Branch new business volumes1
Channels market share
2%
14%
1 – Average volume share across whole of market basis. 4 – Excludes execution-only stockbrokers. 5 – Average market share calculated for core financial services products.
Market PCAs, loans, savings, cards and home insurance. 2 – Comprises unsecured personal loans, overdrafts and Black Horse retail lending balances. 3 – Annualised Premium Equivalent new business on an estimated
data sources: ABI, BoE, CACI, Compeer, eBenchmarkers, Experian pH, FLA, Ipsos MORI FRS, PayUK, Spence Johnson and internal estimates. Note: Market shares as of FY 2019 with exception of PCA and Savings
balances (Nov 2019), Home insurance GWP and Individual Pensions and Drawdown (Sep 2019) and Wealth management AuA (Dec 2018).
.
5
Classification: Limited
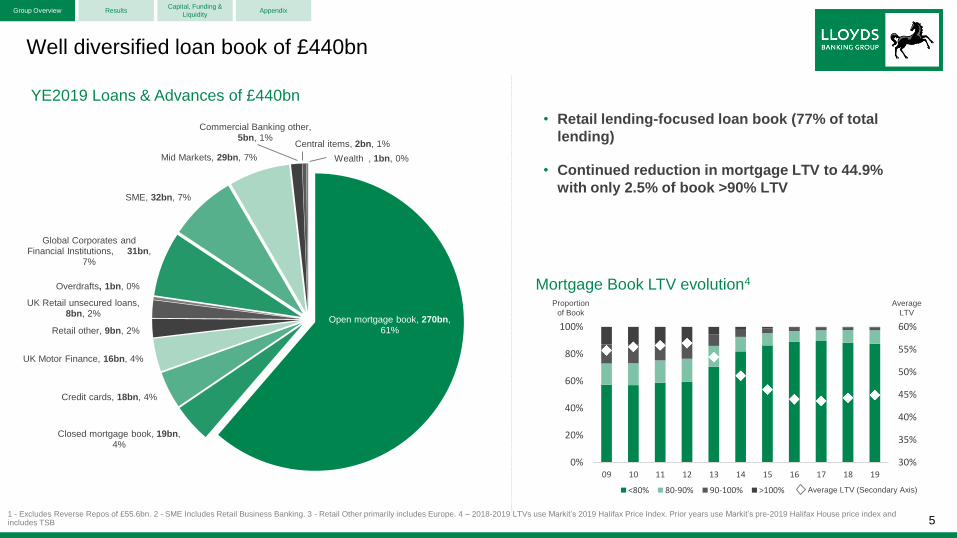
Open mortgage book, 270bn, 61%
Closed mortgage book, 19bn, 4%
Credit cards, 18bn, 4%
UK Motor Finance, 16bn, 4%
Retail other, 9bn, 2%
UK Retail unsecured loans, 8bn, 2%
Overdrafts, 1bn, 0%
Global Corporates and Financial Institutions, 31bn,
7%
SME, 32bn, 7%
Mid Markets, 29bn, 7%
Commercial Banking other, 5bn, 1%
Central items, 2bn, 1%
Wealth , 1bn, 0%
YE2019 Loans & Advances of £440bn
Well diversified loan book of £440bn
1 - Excludes Reverse Repos of £55.6bn. 2 - SME Includes Retail Business Banking. 3 - Retail Other primarily includes Europe. 4 – 2018-2019 LTVs use Markit’s 2019 Halifax Price Index. Prior years use Markit’s pre-2019 Halifax House price index and includes TSB
Group Overview ResultsCapital, Funding &
LiquidityAppendix
• Retail lending-focused loan book (77% of total
lending)
• Continued reduction in mortgage LTV to 44.9%
with only 2.5% of book >90% LTV
30%
35%
40%
45%
50%
55%
60%
0%
20%
40%
60%
80%
100%
09 10 11 12 13 14 15 16 17 18 19
<80% 80-90% 90-100% >100%
Mortgage Book LTV evolution4
Average LTV (Secondary Axis)
Average
LTV
Proportion
of Book

6
Classification: LimitedGroup Overview ResultsCapital, Funding &
LiquidityAppendix
UK economy resilient in 2019 with some signs of improving outlook
1 – 2-quarter rolling average. 2 – Source: ONS. 3 – Lloyds Business Barometer. 4 – Source: European Commission.
CPI inflation and pay growth2
(%)
0
1
2
3
4
+c.2%
GDP growth1,2
(% growth vs. previous quarter)
Business and consumer confidence3,4
(# standard deviations from average since 2002)
• Economy resilient to slowing global growth and elevated political
uncertainty during 2019
• Some signs of gradually improving outlook
- Business and consumer confidence beginning to recover
- Households’ spending power continuing to rise
- Early signs of upturn in housing market activity and prices
• Outlook not yet reflected in interest rate yield curves
• Uncertainty remains given ongoing trade deal negotiations
2017 20182016
CPI inflation Regular pay growth
2019
-2
-1
0
1
2
3
(0.4)
(0.2)
0.0
0.2
0.4
0.6
Business (right axis)Consumer (left axis)
2017 2018 2019
0.0
0.2
0.4
0.6
20172014 20192015 2016 2018
7
Classification: Limited
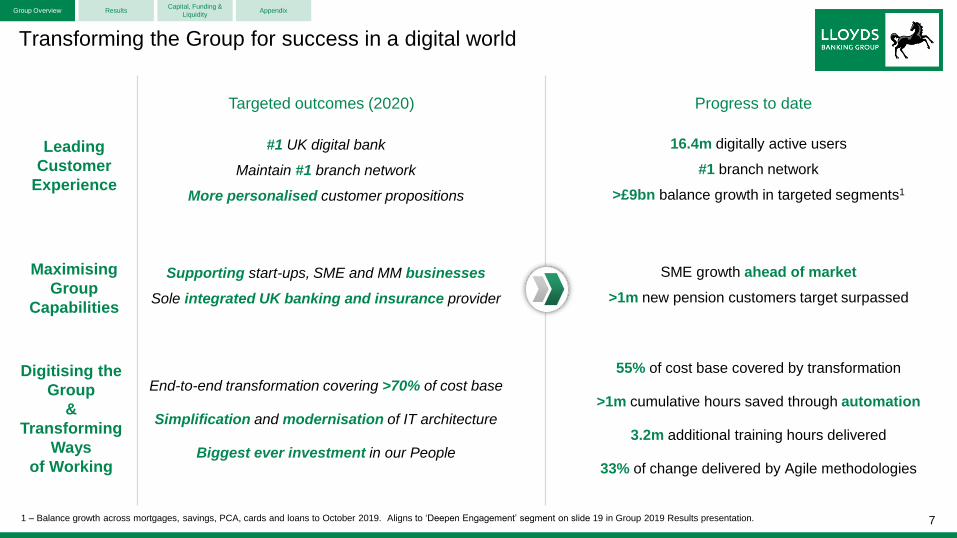
Transforming the Group for success in a digital world
Group Overview ResultsCapital, Funding &
LiquidityAppendix
Leading
Customer
Experience
Maximising
Group
Capabilities
Digitising the
Group
&
Transforming
Ways
of Working
Progress to date
#1 UK digital bank
Maintain #1 branch network
More personalised customer propositions
End-to-end transformation covering >70% of cost base
Simplification and modernisation of IT architecture
Biggest ever investment in our People
Supporting start-ups, SME and MM businesses
Sole integrated UK banking and insurance provider
16.4m digitally active users
#1 branch network
>£9bn balance growth in targeted segments1
55% of cost base covered by transformation
>1m cumulative hours saved through automation
3.2m additional training hours delivered
33% of change delivered by Agile methodologies
SME growth ahead of market
>1m new pension customers target surpassed
Targeted outcomes (2020)
1 – Balance growth across mortgages, savings, PCA, cards and loans to October 2019. Aligns to ‘Deepen Engagement’ segment on slide 19 in Group 2019 Results presentation.

8
Classification: LimitedGroup Overview ResultsCapital, Funding &
LiquidityAppendix
Significant ESG delivery, supported by Helping Britain Prosper plan
1 – As reported in the PWC Total Tax Contribution survey of the 100 Group. 2 – SME lending balances include Retail Business Banking and commercial cards. Market data source: BoE (Dec 2019).
A proven track record
• Raised >£2.8bn in green bonds for UK corporate issuers, more than any other UK bank
• One of the UK’s leading low emission fleet through Lex Autolease
• Group carbon emissions down 63% since 2009, achieving 2030 target 11 years early
• One of the first businesses to sign up to all three of The Climate Group’s campaigns
• The first FTSE100 company to set public diversity goals on gender and ethnicity
• 37% of senior roles held by women, up 8pp from 2014; 7% by BAME colleagues
• Donated >£100m since 2014 to our four independent charitable Foundations
• Highest corporate payer1 of UK taxes over the last four years
• Leading SME lender, increasing market share by c.6pp to 19% since 20102
• Dedicated Board-level Responsible Business Committee established in 2015
• Robust governance structures to protect customers and their data
• Comprehensive stakeholder consultation across a variety of topics, including remuneration
We aim to help reduce the
emissions we finance by
>50% by 2030
‘Our approach to
ESG topics’
Governance
Social
Environmental
Investor presentation launched today
New ambitious goal

9
Classification: Limited
2019 Results

10
Classification: LimitedGroup Overview ResultsCapital, Funding &
LiquidityAppendix
Resilient underlying performance in a challenging environment
• Net income down 4% at £17.1bn
- NII 3% lower; stable AIEAs, resilient NIM
- Other income of £5.7bn; Insurance growth offset by
lower Commercial Banking revenues and gilt gains
• Total costs reduced by 5%
- Operating costs <£7.9bn, down 4%
- Continued significant investment in business
- Remediation down 26%
- Cost:income ratio of 48.5%, below prior year
• Solid trading surplus of £8.8bn
• Credit quality strong with net AQR of 29bps
• Underlying profit of £7.5bn, down 7%
• Statutory PBT of £4.4bn, down 26%, impacted by PPI
(£m) 2019 2018 Change
Net interest income 12,377 12,714 (3)%
Other income (incl. Vocalink) 5,732 6,010 (5)%
Operating lease depreciation (967) (956) (1)%
Net income 17,142 17,768 (4)%
Operating costs (7,875) (8,165) 4%
Remediation (445) (600) 26%
Total costs (8,320) (8,765) 5%
Trading surplus 8,822 9,003 (2)%
Impairment (1,291) (937) (38)%
Underlying profit 7,531 8,066 (7)%
PPI (2,450) (750)
Other below the line items (688) (1,356) (49)%
Statutory profit before tax 4,393 5,960 (26)%
Earnings per share 3.5p 5.5p (36)%
Net interest margin 2.88% 2.93% (5)bp
Cost:income (incl. remediation) 48.5% 49.3% (0.8)pp
Asset quality ratio 0.29% 0.21% 8bp

11
Classification: Limited
Resilient NIM; challenging other income; continued delivery on costs
Group OverviewCapital, Funding &
LiquidityAppendixResults
1 – Other includes non-banking net interest income. 2 – 2018 adjusted to reflect impact of IFRS16.
• NII down slightly, resilient NIM and stable AIEAs
‐ Asset pricing pressure partly offset by lower deposit
costs
‐ Targeted asset growth vs. closed book run off and Irish
mortgage book sale
• Other income challenging in prevailing environment
• Continued delivery on operating costs while
maintaining strategic investment
Net interest income and banking net interest margin(£m)
Liability
spread & mix
Asset spread
& mix
2018 Wholesale
funding & other(1)
12,714
2.93% +3bps +1bps(9)bps
2019
12,377
2.88%
(3)%
137
(419) (55)
Other Income (including Vocalink)(£bn)
1.31.31.61.61.4
Q4 18 Q3 19Q1 19 Q2 19 Q4 19
Total costs(2)
(£m)
Pay &
inflation
Cost
savings
2018 Investment &
depreciation
Other 2019
8,765
1098,320
(362)
68
(105)
-5%
Remediation
(155)

12
Classification: LimitedGroup OverviewCapital, Funding &
LiquidityAppendixResults
Asset quality remains strong reflecting prudent approach to risk
1.9%
1 – Shown on an underlying basis. 2 – Stage 2/3 expected credit loss allowance as a proportion of Stage 2/3 drawn balances.
21 2128 29
Asset quality ratio(bps)
IFRS 9 Stage 2 and 3 as
proportion of total customer
loans and advances1
Stage 2/3 coverage1,2
x%
Net AQRGross AQR
2018 2019
Large single name charges
8
8 29
37 • Gross AQR of 37bps, net AQR of 29bps
- Asset quality remains stable excluding two material
corporate cases
- Benefit from continued debt sales, write backs
• Stage 2 and 3 balances as % of Group lending broadly
stable, coverage slightly lower
- Stage 2 coverage at 3.7% due to IFRS 9 methodology
refinements across Commercial portfolios
- Stage 3 coverage at 22.5% due to change in asset mix
in Stage 3 in Commercial Banking
• Underlying credit portfolio remains strong
• Expect net AQR to be less than 30bps in 2020
Stage 2 Stage 3
2018 2019 2018 2019
7.8% 7.7% 1.8%
Stage 2 Stage 3
2018 2019 2018 2019
4.1% 3.7%
24.3% 22.5%
(%)
(%)
13
Classification: LimitedGroup OverviewCapital, Funding &
LiquidityAppendixResults
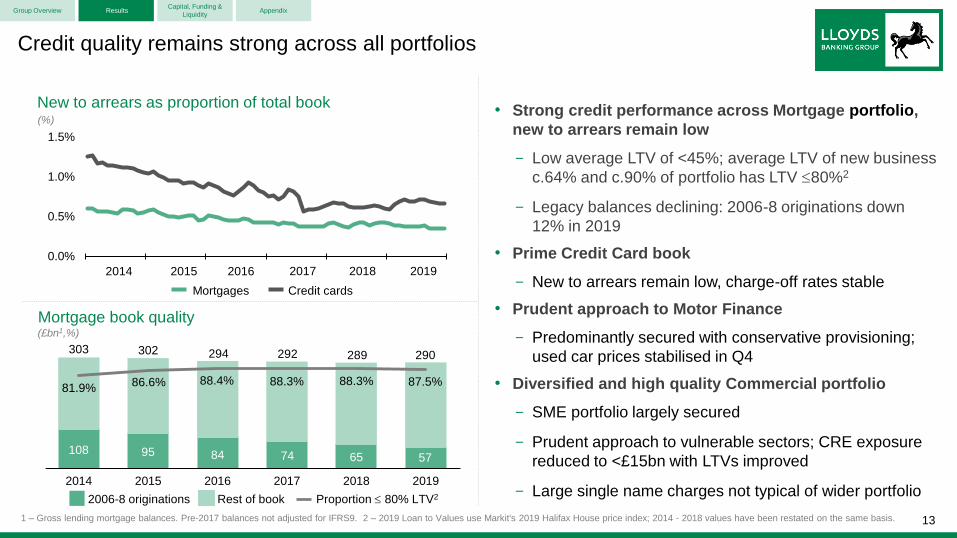
• Strong credit performance across Mortgage portfolio,
new to arrears remain low
- Low average LTV of <45%; average LTV of new business
c.64% and c.90% of portfolio has LTV 80%2
- Legacy balances declining: 2006-8 originations down
12% in 2019
• Prime Credit Card book
- New to arrears remain low, charge-off rates stable
• Prudent approach to Motor Finance
- Predominantly secured with conservative provisioning;
used car prices stabilised in Q4
• Diversified and high quality Commercial portfolio
- SME portfolio largely secured
- Prudent approach to vulnerable sectors; CRE exposure
reduced to <£15bn with LTVs improved
- Large single name charges not typical of wider portfolio
0.0%
0.5%
1.0%
1.5%
Credit quality remains strong across all portfolios
Mortgage book quality
2014 2015 2016 2017 2018 2019
2006-8 originations Proportion 80% LTV2
(£bn1,%)
New to arrears as proportion of total book
2014 2015 2016 2017 2018 2019
(%)
Mortgages Credit cards
1 – Gross lending mortgage balances. Pre-2017 balances not adjusted for IFRS9. 2 – 2019 Loan to Values use Markit's 2019 Halifax House price index; 2014 - 2018 values have been restated on the same basis.
302 294 292 289 290303
Rest of book
86.6% 88.4% 88.3% 88.3% 87.5%81.9%
95 84 74 65 57108

14
Classification: Limited
Strategic progress alongside solid financial performance
• NIM of 2.75 – 2.80%
• Operating costs less than £7.7bn with cost:income
ratio lower than in 2019
• Net AQR ratio less than 30bps
• Capital build expected within the Group’s ongoing
guidance of 170 – 200bps p.a.
• RWAs to be broadly in line with 2019
• Statutory RoTE of 12 – 13%, driven by resilient
underlying profit and lower below the line charges
Guidance for 2020 • Group continues to Help Britain Prosper, whilst building
strategic advantage and delivering strong and
sustainable returns
• Significant progress against strategic priorities with
£2bn investment since launch of GSR3
• Solid financial returns in challenging environment with
resilient underlying performance offset by PPI charges
• Progressive and sustainable total ordinary dividend of
3.37p, up 5%; quarterly dividends commence at Q1 2020
• Guidance for 2020 reflects confidence in business model
and future performance
Group OverviewCapital, Funding &
LiquidityAppendixResults
15
Classification: Limited
Capital, Funding & Liquidity

Classification: Limited
4.5% 4.5% 4.5%
2.6% 2.6% c.2.3%
1.875%2.5%
2.5%
0.9%
0.9% 1.8%
1.7%
1.7%
FY 18 FY 19 FY 20e
CET1 Ratio
Pillar 1 Pillar 2A CCB CCyB SRB Headroom incl. Management Buffer
Robust capital position supported by strong capital generation
Group OverviewCapital, Funding &
LiquidityAppendixResults
• Ongoing CET1 target unchanged at around 12.5% plus a management
buffer of around 1%
• Some movement in capital requirements over 2019:
• Pillar 2A reduced 10bps to 2.6% in 2019
• CCyB to increase to 1.8% at end-2020, partially offset by expected
c.25bps decrease in P2A
• Free capital build of 207bps pre-PPI ; 86bps after PPI
• Total PPI charge of £2.45bn (-121 bps)
MDAc.11.1%
1 - Systemic Risk Buffer of 2% is applicable to the RFB sub-group, equating to 1.7% at Group level. 2 –CET1 ratios shown are pro-forma, reflecting the Insurance dividend received, ordinary dividends and the 2019 share buyback for FY18 figure. 3 –FY20e chart shows expected capital requirements assuming CCyB and P2A changes are in-line with BOE Financial Stability Report. Pillar 2A reviewed annually by the PRA
13.8%13.9%
MDA10.5%
C
Common equity tier 1 ratio(%)
13.9
1.80 0.18
(0.11)
0.20 16.0
(1.21)
0.34
(0.09)
(1.23)
13.8
FY
2018
Under-
lying
Insur.
dividend
IFRS
16
RWA
and other
movements
PPI Cancel
buyback
Tesco
book
Dividend FY
2019
+207bps
+86bps
CC
Classification: Limited
Dec 2019 Jan 2020 Interim Requirement
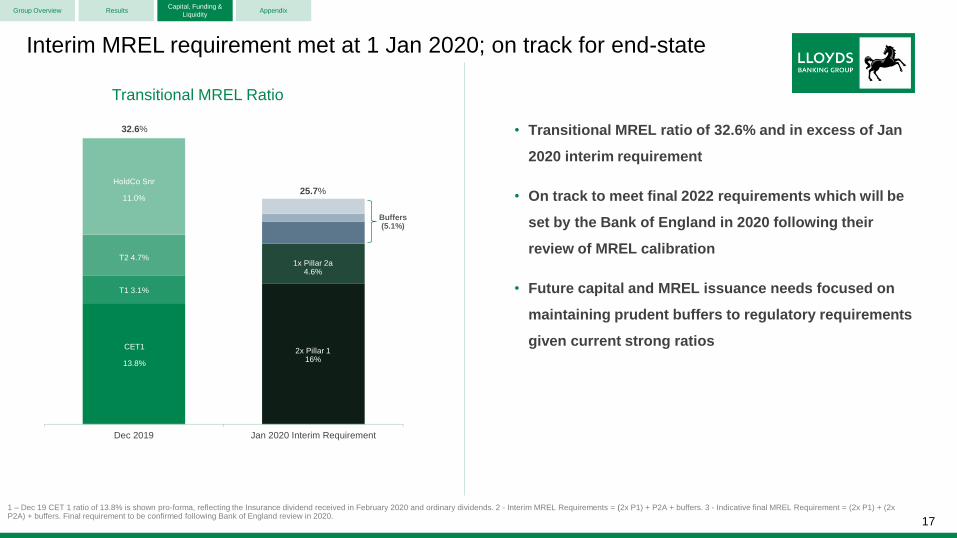
Transitional MREL Ratio
1x Pillar 2a 4.6%
• Transitional MREL ratio of 32.6% and in excess of Jan
2020 interim requirement
• On track to meet final 2022 requirements which will be
set by the Bank of England in 2020 following their
review of MREL calibration
• Future capital and MREL issuance needs focused on
maintaining prudent buffers to regulatory requirements
given current strong ratios
Interim MREL requirement met at 1 Jan 2020; on track for end-state
1 – Dec 19 CET 1 ratio of 13.8% is shown pro-forma, reflecting the Insurance dividend received in February 2020 and ordinary dividends. 2 - Interim MREL Requirements = (2x P1) + P2A + buffers. 3 - Indicative final MREL Requirement = (2x P1) + (2x P2A) + buffers. Final requirement to be confirmed following Bank of England review in 2020.
17
Group OverviewCapital, Funding &
LiquidityAppendix
32.6%
25.7%
Results
Buffers(5.1%)
2x Pillar 1 16%
CET1
13.8%
T1 3.1%
T2 4.7%
HoldCo Snr
11.0%
Classification: Limited
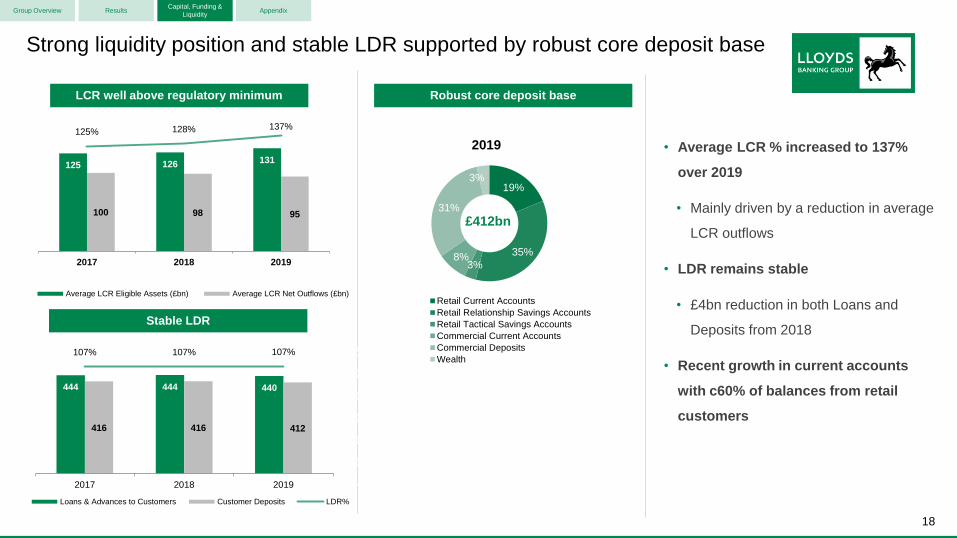
Strong liquidity position and stable LDR supported by robust core deposit base
18
Group OverviewCapital, Funding &
LiquidityAppendixResults
125 126 131
100 98 95
125% 128% 137%
0%
50%
100%
0
50
100
150
2017 2018 2019
Average LCR Eligible Assets (£bn) Average LCR Net Outflows (£bn)
Robust core deposit base
• Average LCR % increased to 137%
over 2019
• Mainly driven by a reduction in average
LCR outflows
• LDR remains stable
• £4bn reduction in both Loans and
Deposits from 2018
• Recent growth in current accounts
with c60% of balances from retail
customers
Stable LDR
LCR well above regulatory minimum
£412bn
2019
444 444 440
416 416 412
107% 107% 107%
0%
20%
40%
60%
80%
100%
120%
-50
50
150
250
350
450
550
2017 2018 2019
Loans & Advances to Customers Customer Deposits LDR%
19%
35%
3%8%
31%
3%
Retail Current Accounts
Retail Relationship Savings Accounts
Retail Tactical Savings Accounts
Commercial Current Accounts
Commercial Deposits
Wealth

Classification: Limited
Funding Portfolio by Product
Funding Portfolio by Maturity
• Successful execution of plan over
2019
• Steady-state requirements remain
c.£15-20bn p.a.
• Currently expect 2020 to be in the £10-
15bn range
• Continue to implement a diversified
funding plan across:
‐ Core markets - USD, EUR and GBP
‐ Strategic markets - AUD, JPY, CAD and CHF
22%
5%
23%19%
18%
13% Covered Bond
Securitisation
MM Funding
OpCo Senior
HoldCo Senior
Sub Debt
Successful execution of 2019 funding plan with continued diversification
0
1
2
3
4
5
6
7
CoveredBonds
Securitisation LBCMSenior
LBSenior
HoldCoSenior
Sub Debt
£bn
GBP EUR USD Other
30%
31%
32%
7%
GBP
EUR
USD
Other
22%
12%
12%28%
26%
< 1 Year (MM)
< 1 Year
12mth < 2 yrs
2yrs - 5yrs
5yrs +
1 – Includes AT1. 2 - Excludes private placements; total 2019 wholesale funding = £16.4bn. 3 – Includes margins & settlements. 4 – Excludes AT1 19
£128bn
£128bn
3
2019 Public Funding by Currency
2019 Public Funding by Product
2
Group OverviewCapital, Funding &
LiquidityAppendix
£15bn
1
Results
2
4
Classification: Limited
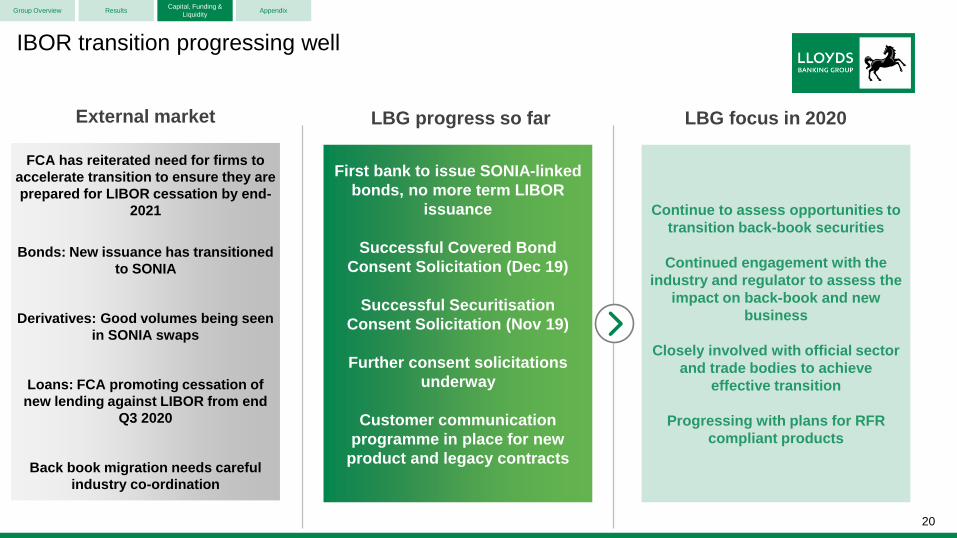
IBOR transition progressing well
20
First bank to issue SONIA-linked
bonds, no more term LIBOR
issuance
Successful Covered Bond
Consent Solicitation (Dec 19)
Successful Securitisation
Consent Solicitation (Nov 19)
Further consent solicitations
underway
Customer communication
programme in place for new
product and legacy contracts
LBG progress so far
Continue to assess opportunities to
transition back-book securities
Continued engagement with the
industry and regulator to assess the
impact on back-book and new
business
Closely involved with official sector
and trade bodies to achieve
effective transition
Progressing with plans for RFR
compliant products
LBG focus in 2020
FCA has reiterated need for firms to
accelerate transition to ensure they are
prepared for LIBOR cessation by end-
2021
Bonds: New issuance has transitioned
to SONIA
Derivatives: Good volumes being seen
in SONIA swaps
Loans: FCA promoting cessation of
new lending against LIBOR from end
Q3 2020
Back book migration needs careful
industry co-ordination
External market
Group OverviewCapital, Funding &
LiquidityAppendixResults

21
Classification: Limited
Appendix

22
Classification: Limited
Strong Insurance & Wealth performance
Group OverviewCapital, Funding &
LiquidityAppendixResults
400
600
800
1,000
1,200
2015 2016 2017 2018 2019
155%
160%
165%
170%
175%
Insurance & Wealth Underlying Profit Development
Underlying Profit Solvency Ratio
• Strong 2019 performance following
significant Group investment
• Schroders Personal Wealth launched
– ambition to become Top 3 player
by 2023
• Over 5m customers now able to
access insurance products through
Single Customer View
Franchise Direct Intermediary
Net income by product (%)
Retirement &
Investment
General
InsuranceProtection
>10mCustomers
£170bnAuA
16%
24%
11%
13%
12%
12% 17%
19%
15%
26%
19%FY19
FY15 17%
Workplace planning & retirement GI & Protection
Individual and bulk annuities
Life and pensions experience and other Longstanding LP&I
Wealth
Single
Customer View
1 – Pre final dividend shareholder view Solvency II ratio. 2 – Solvency Ratio relates to Insurance business only
1, 2

Classification: Limited
43 40
82
476
424
7811
105629
Assets Liabilities
15
4
15
27
32
20
17
16
15
95
Assets Liabilities
Other
Legal entity balance sheet analysis (H1 2019)
23
Lloyds Bank Plc
(RFB)Lloyds Bank Corporate Markets Plc
(NRFB)
Total Capital Ratio 21.0%
£173.8bn
CET1 Ratio 14.4%
Tier 1 Ratio 17.5%
RWAs
CRD IV Leverage 4.5%
Total Capital Ratio 21.8%
£19.7bn
CET1 Ratio 14.6%
Tier 1 Ratio 18.4%
RWAs
£593bn £593bn £87bn £87bn
Cash & Central Bank
Balances
Loans & Advances
Financial Assets
Derivatives
Other
Equity
Debt Securities
Deposits
Financial Liabilities
Derivatives
Cash & Central Bank
Balances
Loans & Advances
Financial Assets
Derivatives
Other
Equity
Debt Securities
Deposits
Financial Liabilities
DerivativesOther
1 - Charts not to scale. 2 – Source: Lloyds Bank Plc 2019 H1 2019 Management Report & Lloyds Bank Corporate Markets Plc 2019 H1 2019 Management Report
• Over 95% of Group loans & advances remain within the
ring-fenced bank
• Majority of Lloyds Bank, Bank of Scotland and Halifax
banking activities including current accounts, savings and
deposits
• Provides products/services to Group customers which
cannot be provided by the RFB, for example lending to
financial institutions, capital markets and non-EEA activity
• Strong capital position with lower requirements than the
RFB
Group OverviewCapital, Funding &
LiquidityAppendixResults

24
Classification: Limited
Notes
25
Classification: Limited
Debt Investor Relations Contacts
Website: www.lloydsbankinggroup.com/investors/fixed-income-investors
INVESTOR RELATIONS
LONDONDouglas Radcliffe Edward Sands Nora ThodenGroup Investor Relations Director Director, Investor Relations Director, Investor Relations +44 (0)20 7356 1571 +44 (0)20 7356 1585 +44 (0)20 7356 2334 [email protected] [email protected] [email protected]
GROUP CORPORATE TREASURY
LONDONRichard Shrimpton Peter Green Gavin ParkerGroup Capital Management and Issuance Director Head of Senior Funding & Covered Bonds Head of Securitisation and Collateral+44 (0)20 7158 2843 +44 (0)20 7158 2145 +44 (0)20 7158 [email protected] [email protected] [email protected]
ASIATanya Foxe Blake Foster Peter Pellicano
Head of Capital Issuance, Ratings & Debt IR Capital Issuance, Ratings & Debt IR Regional Treasurer, Asia
+44 (0)20 7158 2492 +44 (0)20 7158 3880 +65 6416 2855

26
Classification: Limited
Forward looking statements and basis of presentation
Forward looking statements
This document contains certain forward looking statements within the meaning of Section 21E of the US Securities Exchange Act of 1934, as amended, and section 27A of the US Securities Act of 1933, as amended, with
respect to the business, strategy, plans and/or results of Lloyds Banking Group plc together with its subsidiaries (the Group) and its current goals and expectations relating to its future financial condition and performance.
Statements that are not historical facts, including statements about the Group's or its directors' and/or management's beliefs and expectations, are forward looking statements. Words such as ‘believes’, ‘anticipates’,
‘estimates’, ‘expects’, ‘intends’, ‘aims’, ‘potential’, ‘will’, ‘would’, ‘could’, ‘considered’, ‘likely’, ‘estimate’ and variations of these words and similar future or conditional expressions are intended to identify forward looking
statements but are not the exclusive means of identifying such statements. Examples of such forward looking statements include, but are not limited to: projections or expectations of the Group’s future financial position
including profit attributable to shareholders, provisions, economic profit, dividends, capital structure, portfolios, net interest margin, capital ratios, liquidity, risk-weighted assets (RWAs), expenditures or any other financial
items or ratios; litigation, regulatory and governmental investigations; the Group’s future financial performance; the level and extent of future impairments and write-downs; statements of plans, objectives or goals of the
Group or its management including in respect of statements about the future business and economic environments in the UK and elsewhere including, but not limited to, future trends in interest rates, foreign exchange
rates, credit and equity market levels and demographic developments; statements about competition, regulation, disposals and consolidation or technological developments in the financial services industry; and
statements of assumptions underlying such statements. By their nature, forward looking statements involve risk and uncertainty because they relate to events and depend upon circumstances that will or may occur in the
future. Factors that could cause actual business, strategy, plans and/or results (including but not limited to the payment of dividends) to differ materially from forward looking statements made by the Group or on its behalf
include, but are not limited to: general economic and business conditions in the UK and internationally; market related trends and developments; fluctuations in interest rates, inflation, exchange rates, stock markets and
currencies; any impact of the transition from IBORs to alternative reference rates; the ability to access sufficient sources of capital, liquidity and funding when required; changes to the Group’s credit ratings; the ability to
derive cost savings and other benefits including, but without limitation as a result of any acquisitions, disposals and other strategic transactions; the ability to achieve strategic objectives; changing customer behaviour
including consumer spending, saving and borrowing habits; changes to borrower or counterparty credit quality; concentration of financial exposure; management and monitoring of conduct risk; instability in the global
financial markets, including Eurozone instability, instability as a result of uncertainty surrounding the exit by the UK from the European Union (EU) and as a result of such exit and the potential for other countries to exit the
EU or the Eurozone and the impact of any sovereign credit rating downgrade or other sovereign financial issues; political instability including as a result of any UK general election; technological changes and risks to the
security of IT and operational infrastructure, systems, data and information resulting from increased threat of cyber and other attacks; natural, pandemic and other disasters, adverse weather and similar contingencies
outside the Group’s control; inadequate or failed internal or external processes or systems; acts of war, other acts of hostility, terrorist acts and responses to those acts, geopolitical, pandemic or other such events; risks
relating to climate change; changes in laws, regulations, practices and accounting standards or taxation, including as a result of the exit by the UK from the EU, or a further possible referendum on Scottish independence;
changes to regulatory capital or liquidity requirements and similar contingencies outside the Group’s control; the policies, decisions and actions of governmental or regulatory authorities or courts in the UK, the EU, the US
or elsewhere including the implementation and interpretation of key legislation and regulation together with any resulting impact on the future structure of the Group; the ability to attract and retain senior management and
other employees and meet its diversity objectives; actions or omissions by the Group's directors, management or employees including industrial action; changes to the Group's post-retirement defined benefit scheme
obligations; the extent of any future impairment charges or write-downs caused by, but not limited to, depressed asset valuations, market disruptions and illiquid markets; the value and effectiveness of any credit
protection purchased by the Group; the inability to hedge certain risks economically; the adequacy of loss reserves; the actions of competitors, including non-bank financial services, lending companies and digital
innovators and disruptive technologies; and exposure to regulatory or competition scrutiny, legal, regulatory or competition proceedings, investigations or complaints. Please refer to the latest Annual Report or Form 20-F
filed by Lloyds Banking Group plc with the US Securities and Exchange Commission for a discussion of certain factors and risks together with examples of forward looking statements. Lloyds Banking Group may also
make or disclose written and/or oral forward looking statements in reports filed with or furnished to the US Securities and Exchange Commission, Lloyds Banking Group annual reviews, half-year announcements, proxy
statements, offering circulars, prospectuses, press releases and other written materials and in oral statements made by the directors, officers or employees of Lloyds Banking Group to third parties, including financial
analysts. Except as required by any applicable law or regulation, the forward looking statements contained in this document are made as of today's date, and the Group expressly disclaims any obligation or undertaking to
release publicly any updates or revisions to any forward looking statements contained in this document to reflect any change in the Group’s expectations with regard thereto or any change in events, conditions or
circumstances on which any such statement is based. The information, statements and opinions contained in this document do not constitute a public offer under any applicable law or an offer to sell any securities or
financial instruments or any advice or recommendation with respect to such securities or financial instruments.
Basis of presentation
The results of the Group and its business are presented in this presentation on an underlying basis. The principles adopted in the preparation of the underlying basis of reporting are set out within the 2019 Results News
Release (2019 News Release). This presentation is derived from the 2019 News Release and readers of this presentation should refer to the 2019 News Release for the underlying information.