
Fixed Income and FX Weekly - Swedbanki/@sbg/@ib/documents/... · Fixed Income and FX Weekly 20...
27
Fixed Income and FX Weekly 20 June, 2011 Norges Bank to signal two more hikes in 2011, but Greece and soft patch dominates markets Bjørn Roger Wilhelmsen Chief Strategist, FX & Fixed Income +47 23 11 62 63 [email protected]
Transcript of Fixed Income and FX Weekly - Swedbanki/@sbg/@ib/documents/... · Fixed Income and FX Weekly 20...
Fixed Income and FX Weekly
20 June, 2011
Norges Bank to signal two more hikes in 2011, but Greece and soft patch dominates markets
Bjørn Roger WilhelmsenChief Strategist, FX & Fixed Income+47 23 11 62 [email protected]
Good morning,
The Norges Bank will almost certainly leave rates on hold on Wednesday this week, but should signal that 25 bpmove in Q3 with a 50-50 split on August and September (instead of September and October in the previous report). A third hike of the year should be penciled in for December, taking the key policy rate to 2.75%. As this is somewhat more hawkish than expectations currently prevailing in the market, front FRAs may increase a little on Wednesday. However, market ‘s developments this week will be dominated by the developments in the Greek debt crisis. Eurozone finance ministers agree to “Vienna plan” – adding funding also from private sources on a voluntary basis. Moreover, indicators of business confidence in the euro zone should provide more information about the extent to which euro area growth is slowing or not. On the other side of the Atlantic, the Federal Reserve will repeat the “extended period” phrase and should acknowledge a weaker US growth momentum, while ignoring higher inflation. Evidence of weaker US growth momentum has lead us to revise our “fair value” estimate on 10 yr US treasury yield to 3.6%, down 40 bp since April. In currency space, we made a substantial change to our forecast for CHFNOK. The CHF strength has been explained as a “safe haven” trade amid the escalation of the euro area sovereign debt crisis. In absent of the old “Deutsche Mark”, investors have preferred to buy CHF as a play on the growth differentials between north and south Europe. The strong correlation between the business cycles in Germany and Switzerland has reinforced the “Deutsche Mark”, investors have preferred to buy CHF as a play on the growth differentials between north and south Europe. The strong correlation between the business cycles in Germany and Switzerland has reinforced the appetite for the Swiss franc. The strong Swiss franc was never expected to be maintained for ever, as business confidence and the exports industry would suffer. However, business confidence and the exports sector have been resilient. This suggests that the CHF overvaluation can be maintained for longer. Another question is to what degree the CHF is overvalued? Looking at the real exchange rate, the CHF has appreciated far less than suggested by developments in the nominal exchange rate. When comparing with Norway, Swiss wage and price inflation has been much lower for decades. This suggests that the “fair value” of CHFNOK should be time varying and at the moment much higher than it was, say, 10 years ago. A rough estimate of the long-term fair value of CHFNOK, based on inflation differentials, is between 5.50 and 6.00. Consequently, a return to 5.00 or below seems unlikely.On balance, we continue to believe that the Swiss franc is somewhat overvalued against the NOK, although not to the same degree as previously though. Looking ahead, the developments in CHFNOK will in particular depend on 1) Developments in the euro area debt crisis; 2) Developments in Swiss business confidence and exports industry. Neither suggests that the CHF is set to depreciate sharply in the near-term.
2

• Key economic events of the week: Norges Bank Board meeting
3
• Fixed Income Strategy: Sep-11 and Dec-11 FRAs may increase after Norges Bank
• FX Strategy: CHFNOK may stay elevated for longer
3m NIBOR projections, estimated path in MPR 2Contribution to changes in rate view since March
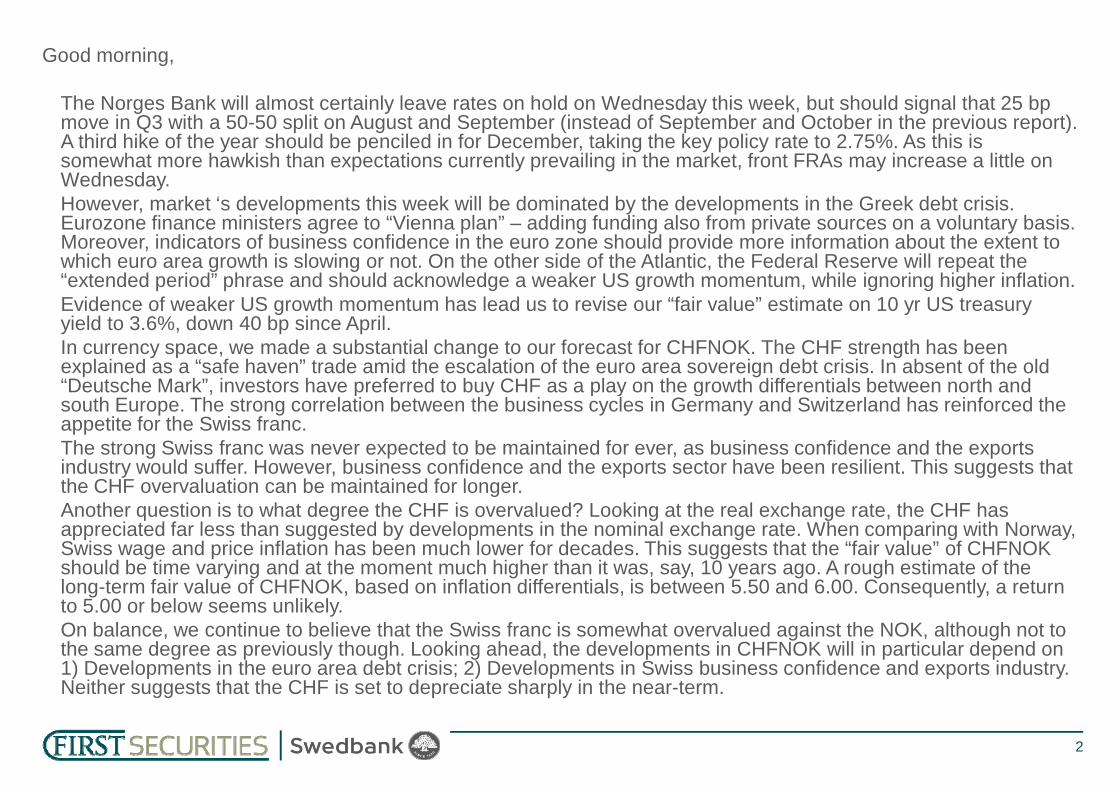
On track for two more hikes in 2011, but rate trajectory in 2012 will be adjusted down
Key events of the week in Norway: Interest rate meeting
-0 1
0.0
0.1
0.2
0.3
Demand (global) Rates abroad
Inflation (wages) NIBOR premiums
NOK Net effect, new rate path
Percentage points
3.5
4.0
4.5
5.0
5.5
3.5
4.0
4.5
5.0
5.5
MPR 2/2011, estimate
3m NIBOR
Market (FRAs)
Norges Bank MPR 1/2011
4
-0.6
-0.5
-0.4
-0.3
-0.2
0.1
Q2 2011
Q3 2011
Q4 2011
Q1 2012
Q2 2012
Q3 2012
Q4 2012
Q1 2013
Q2 2013
Q3 2013
Q4 2013
Q1 2014
Source: EcoWin, First Securities
09 10 11 12 13 14 151.5
2.0
2.5
3.0
1.5
2.0
2.5
3.0
Signals of possible rate hike in August (or Sep). Rate prospects for 2012 will be cut, we predict 30 bp in Q4 2012Investment implications: We see upside potential in NOK 3m FRA in Sep-2011 and Dec-2011
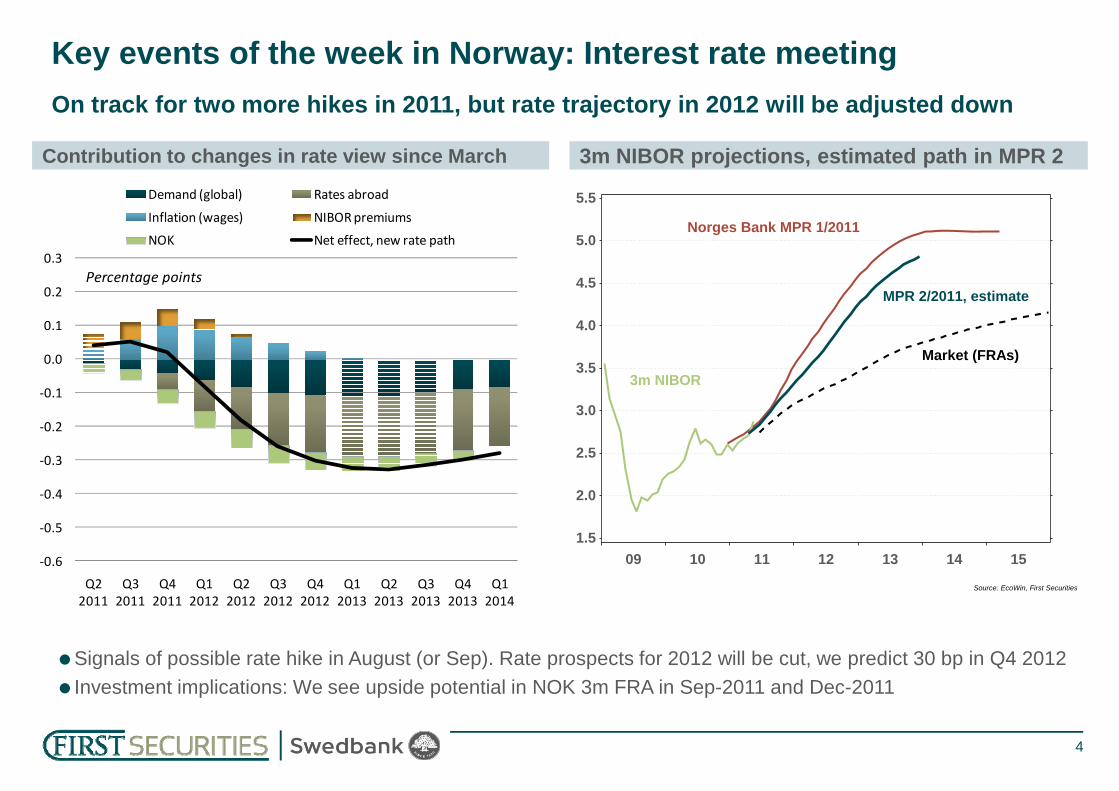
German Ifo and euro zone PMIs still elevatedNo signals of any near-term rate hikes
FOMC to keep “extended period” rhetoric, but will there be signals of more easing?
Key event of the week abroad: FOMC, Ifo, EMU PMIs
2.5
5.0
7.5
10.0
2.5
5.0
7.5
10.0
Fed Funds
95
100
105
110
115
45
50
55
60
65
EMU PMI (manufacturing)
5
Source: EcoWin, First Securities
86 88 90 92 94 96 98 00 02 04 06 08 10 12 14-5.0
-2.5
0.0
-5.0
-2.5
0.0
Taylor rule = 5 - Unempl. + 1.8 * Inflation
Source: EcoWin, First Securities
98 00 02 04 06 08 1075
80
85
90
30
35
40
FIRST
German Ifo, expectations
FOMC likely to acknowledge weaker US growth momentum, ignoring higher inflation
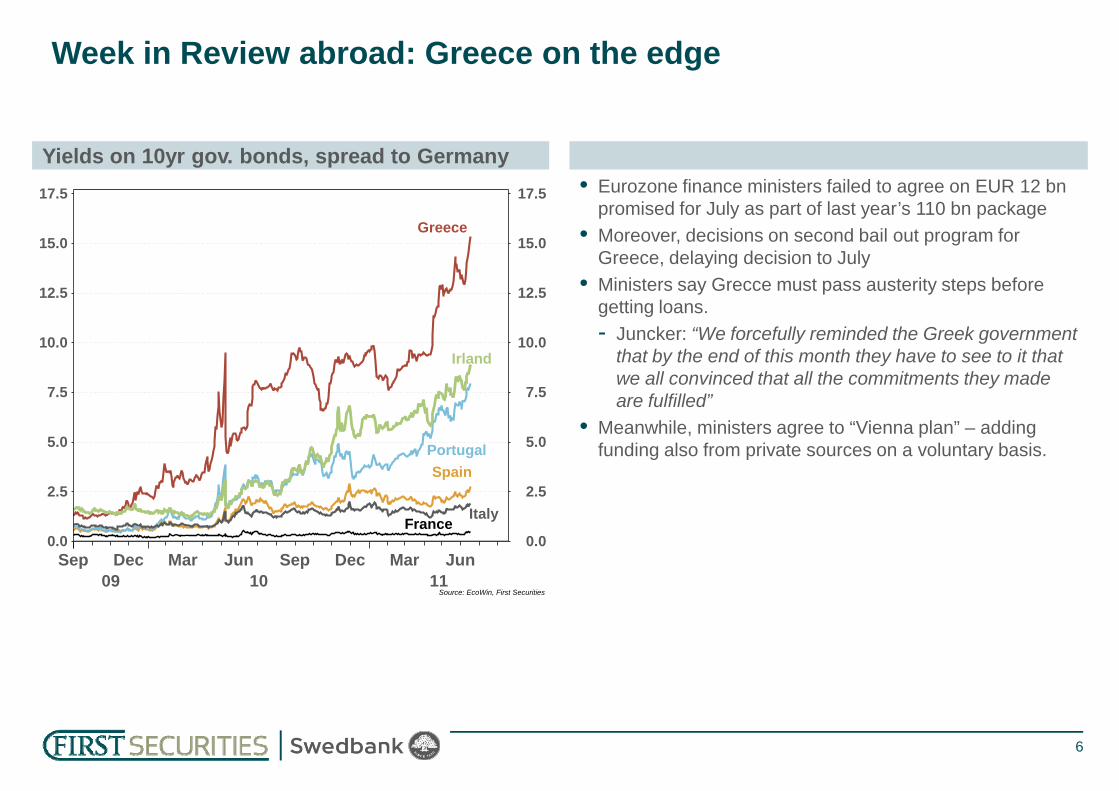
Yields on 10yr gov. bonds, spread to Germany
Week in Review abroad: Greece on the edge
• Eurozone finance ministers failed to agree on EUR 12 bnpromised for July as part of last year’s 110 bn package
• Moreover, decisions on second bail out program for Greece, delaying decision to July
• Ministers say Grecce must pass austerity steps before getting loans.- Juncker: “We forcefully reminded the Greek government
that by the end of this month they have to see to it that we all convinced that all the commitments they made are fulfilled”7.5
10.0
12.5
15.0
17.5
7.5
10.0
12.5
15.0
17.5
Greece
Irland
6
are fulfilled”• Meanwhile, ministers agree to “Vienna plan” – adding
funding also from private sources on a voluntary basis.
Source: EcoWin, First Securities
Sep09
Dec10
Mar Jun Sep Dec11
Mar Jun0.0
2.5
5.0
7.5
0.0
2.5
5.0
7.5
PortugalSpain
ItalyFrance

Will the ISM manufacturing survey drop below 50 in June? Possibly
Week in Review abroad: US economic slowdown continues
US business surveys
-100
10203040
-100
10203040 NY Empire State
ISM model
50
55
60
65
50
55
60
65
Estimate
US business confidence (ISM)
7
Source: EcoWin, First Securities
00 01 02 03 04 05 06 07 08 09 10 11-60-50-40-30-20
-60-50-40-30-20
FIRSTPhil. Fed
Source: EcoWin, First Securities
01 02 03 04 05 06 07 08 09 10 11 12 1330
35
40
45
30
35
40
45 Model
Weaker US growth momentum is a key factor behind the sharp decline in interest rates since April
• Key economic events of the week: Norges Bank Board meeting
8
• Fixed Income Strategy: Sep-11 and Dec-11 FRAs may increase after Norges Bank
• FX Strategy: CHFNOK may stay elevated for longer
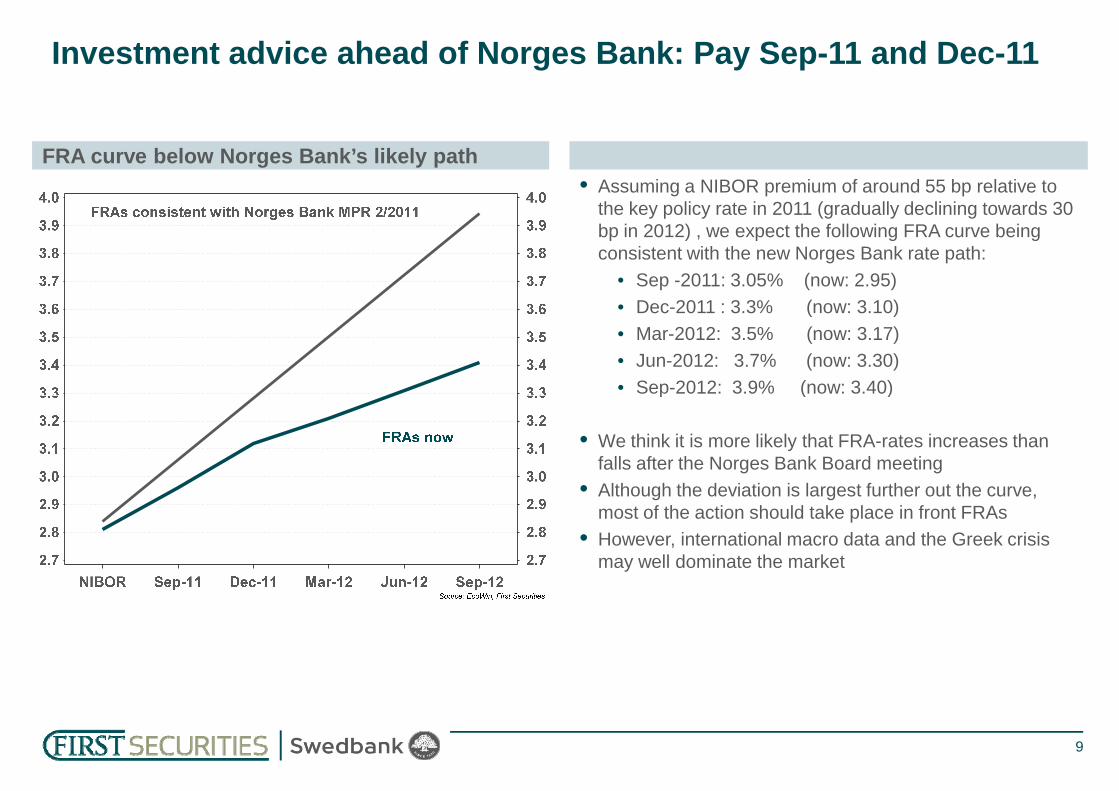
FRA curve below Norges Bank’s likely path
Investment advice ahead of Norges Bank: Pay Sep-11 and Dec-11
• Assuming a NIBOR premium of around 55 bp relative to the key policy rate in 2011 (gradually declining towards 30 bp in 2012) , we expect the following FRA curve being consistent with the new Norges Bank rate path:
• Sep -2011: 3.05% (now: 2.95)• Dec-2011 : 3.3% (now: 3.10)• Mar-2012: 3.5% (now: 3.17)• Jun-2012: 3.7% (now: 3.30)• Sep-2012: 3.9% (now: 3.40)
9
• Sep-2012: 3.9% (now: 3.40)
• We think it is more likely that FRA-rates increases than falls after the Norges Bank Board meeting
• Although the deviation is largest further out the curve, most of the action should take place in front FRAs
• However, international macro data and the Greek crisis may well dominate the market
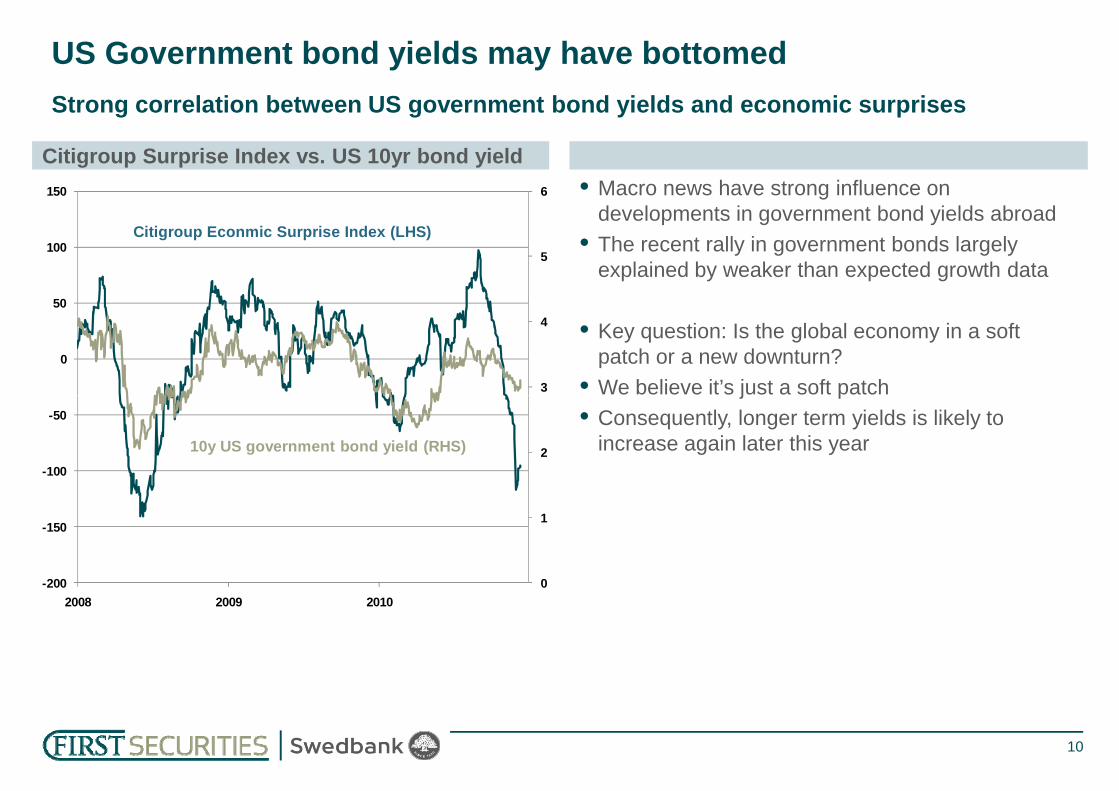
Citigroup Surprise Index vs. US 10yr bond yield
Strong correlation between US government bond yields and economic surprises
US Government bond yields may have bottomed
• Macro news have strong influence on developments in government bond yields abroad
• The recent rally in government bonds largely explained by weaker than expected growth data
• Key question: Is the global economy in a soft patch or a new downturn?
• We believe it’s just a soft patch3
4
5
6
0
50
100
150
Citigroup Econmic Surprise Index (LHS)
10
• We believe it’s just a soft patch• Consequently, longer term yields is likely to
increase again later this year
0
1
2
-200
-150
-100
-50
2008 2009 2010
10y US government bond yield (RHS)
Gap closingPlease mind the gap
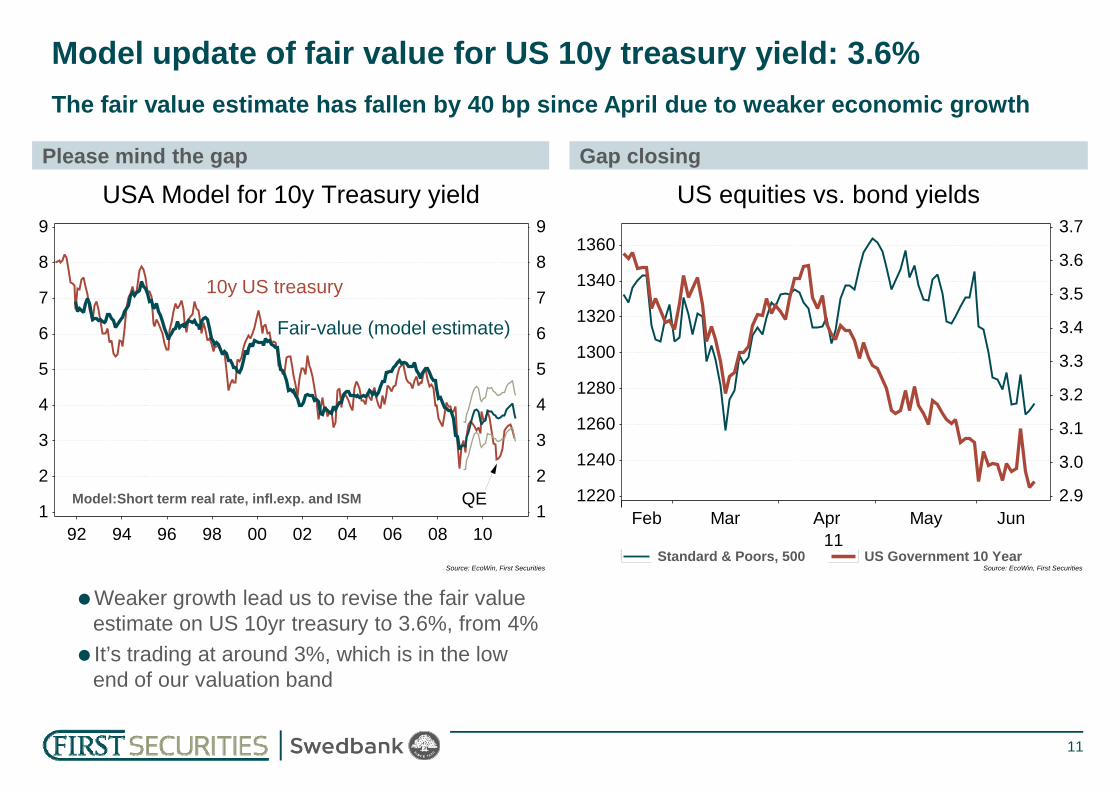
The fair value estimate has fallen by 40 bp since April due to weaker economic growth
Model update of fair value for US 10y treasury yield: 3.6%
USA Model for 10y Treasury yield
5
6
7
8
9
5
6
7
8
9
10y US treasury
Fair-value (model estimate)
US equities vs. bond yields
3 2
3.3
3.4
3.5
3.6
3.7
1280
1300
1320
1340
1360
11
Source: EcoWin, First Securities
92 94 96 98 00 02 04 06 08 101
2
3
4
1
2
3
4
QEModel:Short term real rate, infl.exp. and ISM
Standard & Poors, 500 US Government 10 YearSource: EcoWin, First Securities
Feb11
Mar Apr May Jun2.9
3.0
3.1
3.2
1220
1240
1260
Weaker growth lead us to revise the fair value estimate on US 10yr treasury to 3.6%, from 4%It’s trading at around 3%, which is in the low end of our valuation band

Interest rate yield curves, swapsNOKSEK box 2-10 yr, interest rate swaps
p/l + 15 bp since inception
Trade update: NOKSEK box in 2-10 performing well
2.5
3.0
3.5
4.0
4.5
2.5
3.0
3.5
4.0
4.5 NOK
SEK
EURUK-50
-25
0
25
50
75
-50
-25
0
25
50
75
12
Trade details: Pay NOK 2y and SEK 10y, receive SEK 2y and NOK 10yCase: The slope of the yield curve in Norway is too steep vs. the Swedish curveTrade opened at +40 on 29.March for a target of -10. Now trading at +25
Source: EcoWin, First Securities1y 2y 3y 4y 5y 6y 7y 8y 9y 10y
0.5
1.0
1.5
2.0
0.5
1.0
1.5
2.0
Source: EcoWin, First Securities
00 01 02 03 04 05 06 07 08 09 10 11-175
-150
-125
-100
-75
-175
-150
-125
-100
-75

10 yr Norway asset swap spread and crisis
p/l + 5 bp since inception
Trade update (II): Swap spread contraction performing well too
75
100
125
150
75
100
125
150Mexico crisis
Russian crisis
Global Fianancial Crisis
EZ debt crisis
10 yr Norway asset swap spread
85
90
95
100
105
85
90
95
100
105Basis points
13
Source: EcoWin, First Securities
94 96 98 00 02 04 06 08 10 12 140
25
50
0
25
50
Source: EcoWin, First Securities
Jan11
Feb Mar Apr May Jun65
70
75
80
65
70
75
80
Trade opened at +98 for a target of +65 bpNow trading at +93
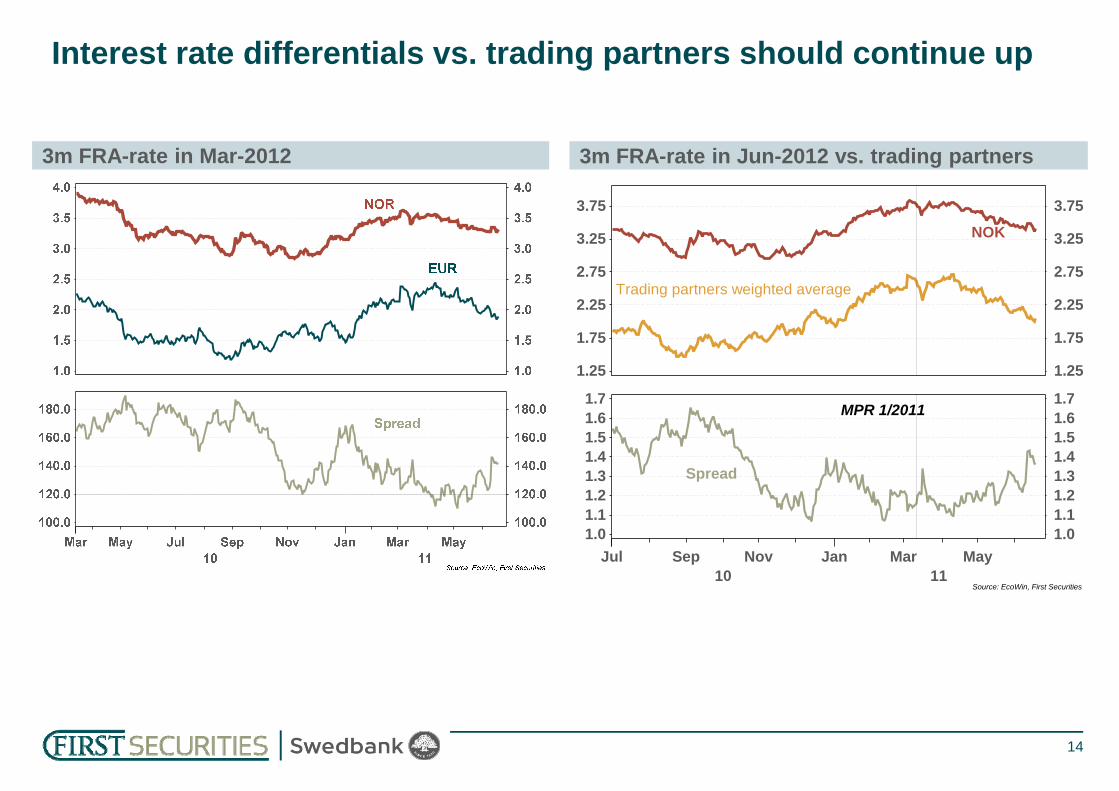
3m FRA-rate in Jun-2012 vs. trading partners3m FRA-rate in Mar-2012
Interest rate differentials vs. trading partners should continue up
1 71 7
1.25
1.75
2.25
2.75
3.25
3.75
1.25
1.75
2.25
2.75
3.25
3.75
NOK
Trading partners weighted average
14
Source: EcoWin, First Securities
Jul10
Sep Nov Jan11
Mar May1.01.11.21.31.41.51.61.7
1.01.11.21.31.41.51.61.7
Spread
MPR 1/2011
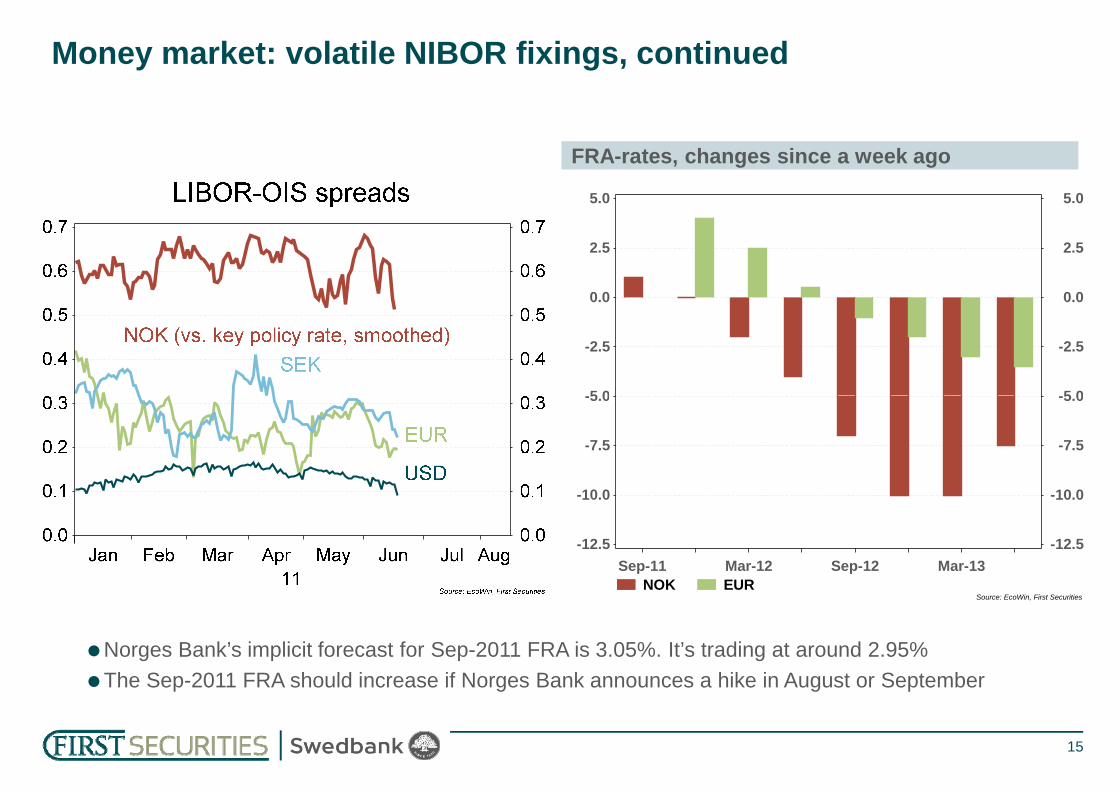
Money market: volatile NIBOR fixings, continued
FRA-rates, changes since a week ago
5 0
-2.5
0.0
2.5
5.0
5 0
-2.5
0.0
2.5
5.0
15
Norges Bank’s implicit forecast for Sep-2011 FRA is 3.05%. It’s trading at around 2.95%The Sep-2011 FRA should increase if Norges Bank announces a hike in August or September
NOK EURSource: EcoWin, First Securities
Sep-11 Mar-12 Sep-12 Mar-13-12.5
-10.0
-7.5
-5.0
-12.5
-10.0
-7.5
-5.0

NOK interest rate swap, yield curve2-5-10 fly vs. 1y interest rate swap
5 yr segment has outperformed 2yr and 10 yr
Trade on watch list: Pay 5 yr segment vs. wings
16
The 2-5-10 fly should trade at 25-30 bp when short-term rates are low and when Norges Bank has embarked on an hiking cycle. The 2-5-10 fly is currently detached from the 1y IRSTrade idea to watch: Pay 5 yr vs 2y and 10yEntry target: -5 bp
• Key economic events of the week: Norges Bank Board meeting
17
• Fixed Income Strategy: Sep-11 and Dec-11 FRAs may increase after Norges Bank
• FX Strategy: CHFNOK may stay elevated for longer
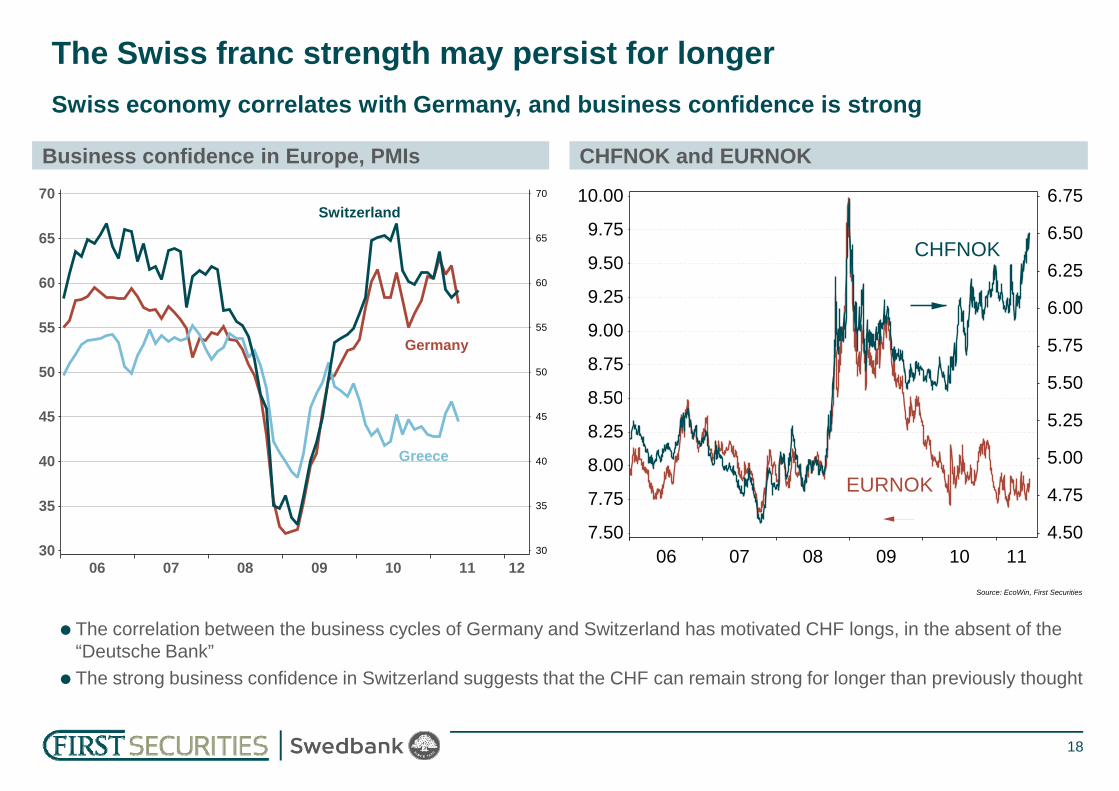
CHFNOK and EURNOKBusiness confidence in Europe, PMIs
Swiss economy correlates with Germany, and business confidence is strong
The Swiss franc strength may persist for longer
50
55
60
65
70
50
55
60
65
70Switzerland
Germany
5.50
5.75
6.00
6.25
6.50
6.75
8 50
8.75
9.00
9.25
9.50
9.75
10.00
CHFNOK
18
06 07 08 09 10 11 1230
35
40
45
30
35
40
45
Greece
Source: EcoWin, First Securities
06 07 08 09 10 114.50
4.75
5.00
5.25
7.50
7.75
8.00
8.25
8.50
EURNOK
The correlation between the business cycles of Germany and Switzerland has motivated CHF longs, in the absent of the “Deutsche Bank”The strong business confidence in Switzerland suggests that the CHF can remain strong for longer than previously thought

Current account balance, % of GDPExports of goods, constant prices (2002 = 100)
Is the strong CHF a problem for the exports industry? Apparently not
120
130
140
150
160
120
130
140
150
160Germany
Switzerland
Norway
Per
cent
19
Source: EcoWin, First Securities
02 03 04 05 06 07 08 09 10 11 1290
100
110
120
90
100
110
120Greece
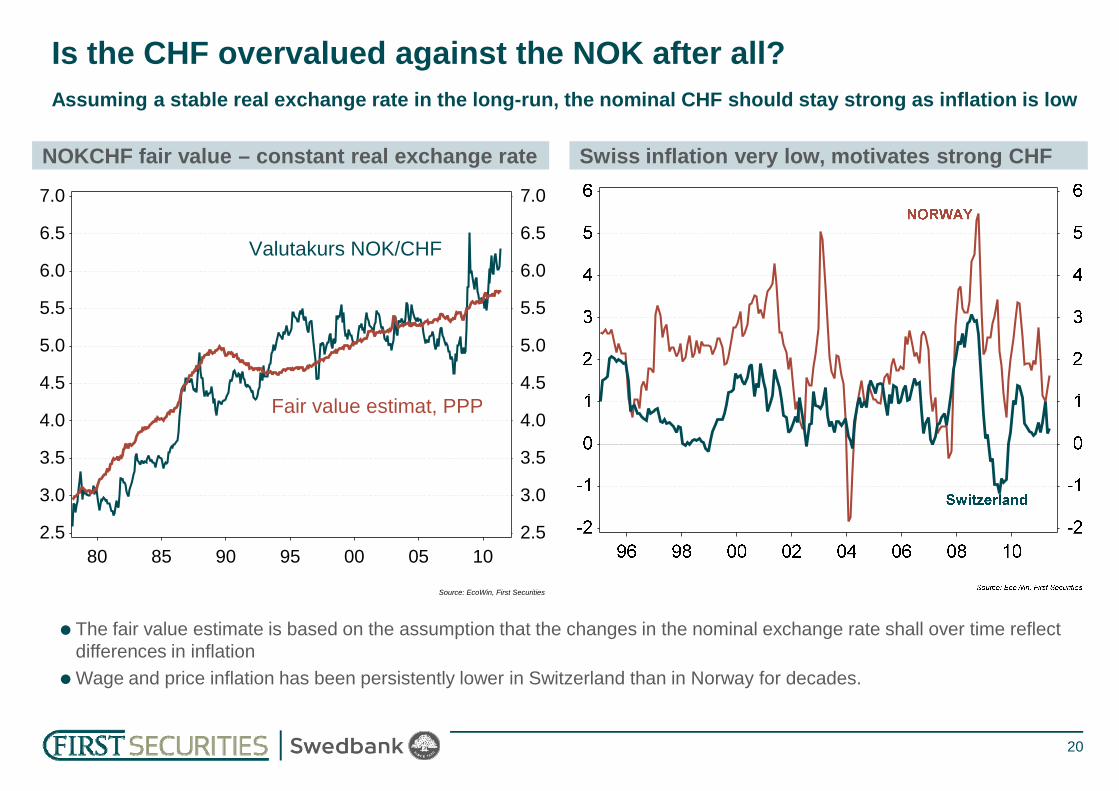
Swiss inflation very low, motivates strong CHFNOKCHF fair value – constant real exchange rate
Assuming a stable real exchange rate in the long-run, the nominal CHF should stay strong as inflation is low
Is the CHF overvalued against the NOK after all?
4.5
5.0
5.5
6.0
6.5
7.0
4.5
5.0
5.5
6.0
6.5
7.0
Valutakurs NOK/CHF
20
Source: EcoWin, First Securities
80 85 90 95 00 05 102.5
3.0
3.5
4.0
2.5
3.0
3.5
4.0Fair value estimat, PPP
The fair value estimate is based on the assumption that the changes in the nominal exchange rate shall over time reflect differences in inflationWage and price inflation has been persistently lower in Switzerland than in Norway for decades.

EURNOK now trading at 200 day moving average
EURNOK should continue to range trade 7.70/75 – 7.95
EURNOK, important levels7.67.77.87.98.08.18 2
7.67.77.87.98.08.18 2
7.70
7.95
21
Source: EcoWin, First Securities
Jan10
Apr Jul Oct Jan11Apr
8.28.38.48.58.68.7
8.28.38.48.58.68.7
200 day moving average (now 7.91)
8.20
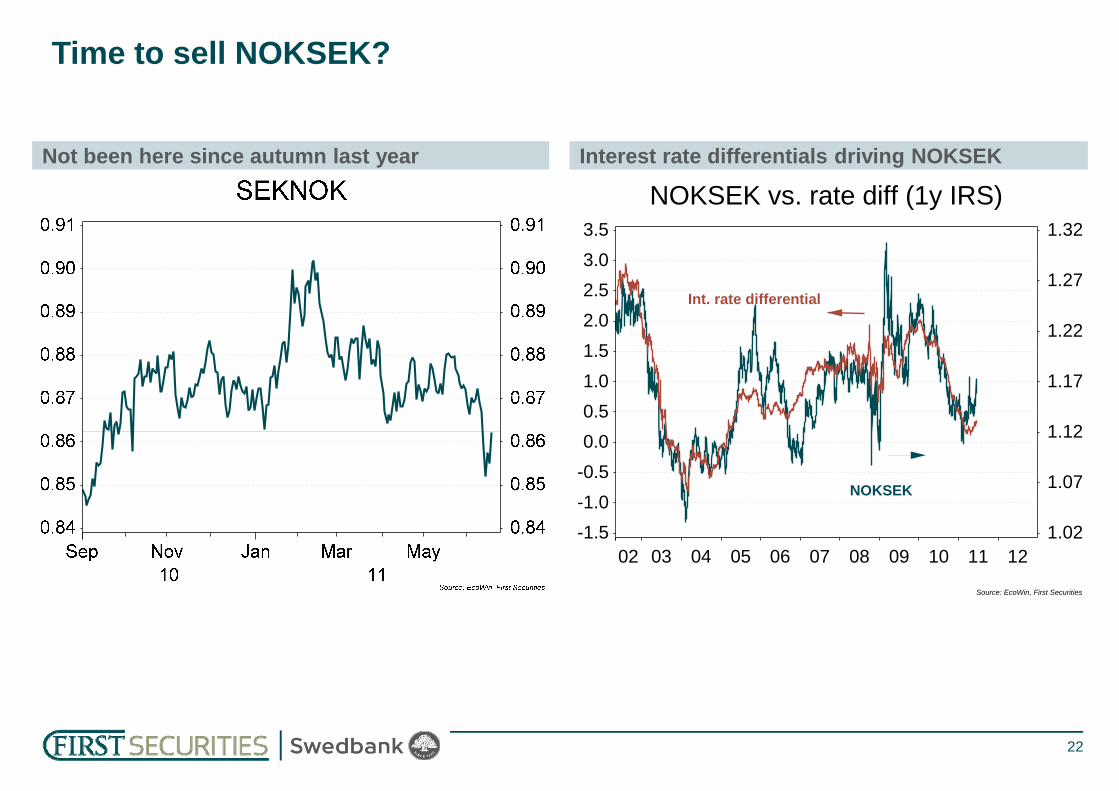
Interest rate differentials driving NOKSEKNot been here since autumn last year
Time to sell NOKSEK?
NOKSEK vs. rate diff (1y IRS)
1.17
1.22
1.27
1.32
1.01.52.02.53.03.5
Int. rate differential
22
Source: EcoWin, First Securities
02 03 04 05 06 07 08 09 10 11 121.02
1.07
1.12
-1.5-1.0-0.50.00.5
NOKSEK

Oil price and NOK TWINOK TWI and interest rate differentials
Interest rate differentials signals weaker NOK, but commodity prices signals stronger
Short-term NOK drivers: Mixed signals
90.0
92.5
95.0
97.5
100.0
102.51.25
1.50
1.75
2.00
2.25NOK TWI i-44 (inverted)
23
Source: EcoWin, First Securities
08 09 10 11
105.0
107.5
110.0
112.50.25
0.50
0.75
1.00
2 y rate spread to trading partners
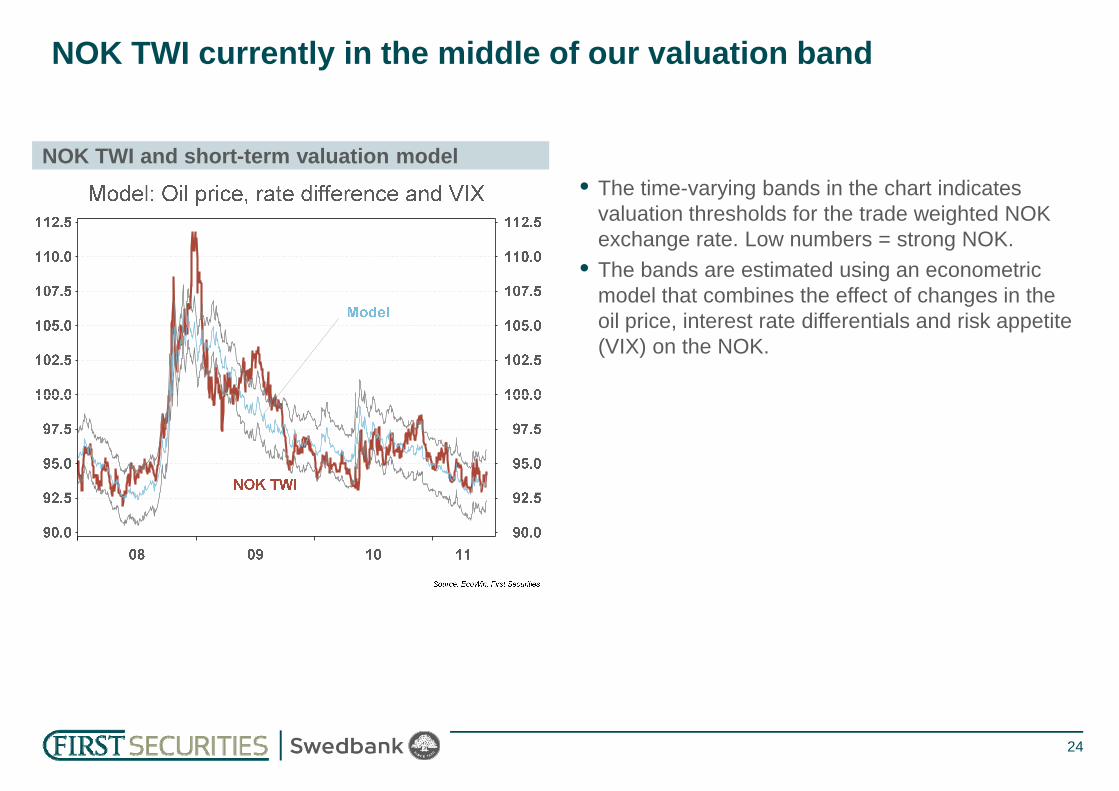
NOK TWI and short-term valuation model
NOK TWI currently in the middle of our valuation band
• The time-varying bands in the chart indicates valuation thresholds for the trade weighted NOK exchange rate. Low numbers = strong NOK.
• The bands are estimated using an econometric model that combines the effect of changes in the oil price, interest rate differentials and risk appetite (VIX) on the NOK.
24

FX forecast table
3m forecast 12m forecast14/6/11 Change Change Change Spot Change Spot Change Trade
last week last month in 2011 forecast in % forecast in % WeightsEURNOK 7.816 -0.3% -0.9% 0.3% 7.75 -0.8% 7.70 -1.5% 0.39SEKNOK 0.859 -1.1% -2.0% -0.9% 0.88 2.5% 0.85 -1.5% 0.21GBPNOK 8.880 1.0% -1.6% -5.6% 8.7 -1.5% 9.5 6.8% 0.09
25
GBPNOK 8.880 1.0% -1.6% -5.6% 8.7 -1.5% 9.5 6.8% 0.09DKKNOK 1.048 -0.3% -1.0% -5.9% 1.04 -0.7% 1.03 -1.4% 0.08USDNOK 5.403 0.5% -3.1% -7.2% 5.24 -3.1% 5.58 3.3% 0.06JPYNOK 6.720 0.1% -2.4% -5.3% 6.31 -6.1% 6.20 -7.7% 0.03CHFNOK 6.465 0.3% 3.7% 3.6% 6.20 -4.1% 5.70 -11.8% 0.01
TWI 94.0 -0.3% -1.4% -1.7% 93.8 -0.2% 93.7 -0.3%

Forecast table, Norway
Norway - forecast tableChange y/y, average 2010 2011 2012 2013GDP Mainland (ex. oil & ship) 2.1 2.8 3.7 3.0Private consumption 3.7 3.3 4.1 4.0Mainland investments -3.1 5.5 7.9 7.4
26Source:
Oil sector investments -12.4 10.0 8.0 4.0Exports, goods, mainland 4.9 5.6 4.9 4.0Imports 9.0 5.6 6.1 5.3

This document was prepared exclusively for the benefit and internal use of selected parties in order to evaluate the feasibility of a possible transaction or transactions and does not carry any right of publication or disclosure to any other party. This document is incomplete without reference to, and should be viewed solely in conjunction with, the oral briefing provided by First Securities AS. This presentation may not be used for any other purposes without the prior written consent of First Securities AS. This presentation is not prepared in accordance with the requirements applying to investment researches.This document does not constitute or form part of an offer or invitation or recommendation to subscribe for or purchase any securities. The distribution of this document may be restricted by law in certain jurisdictions and person into whose possession this document comes should inform themselves about, and observe, any such restriction. Any failure to comply with these restrictions may constitute a violation of the laws of any such jurisdiction. First Securities AS shall not have any responsibility for any such violations. Any decision to purchase or subscribe for securities in
27
any responsibility for any such violations. Any decision to purchase or subscribe for securities in any offering must be made solely on the basis of the information contained in the prospectus or other offering circular issued in connection with such offering. In preparing this document we have relied upon and assumed, without independent verification, the accuracy and completeness of all information available from public sources or which was provided to us or otherwise reviewed by us. The information contained in this document has been taken from sources deemed to be reliable. We do not represent that such information is accurate or complete and it should not be relied on as such. Any opinions expressed herein reflect our judgement at this date, all of which are accordingly subject to change. First Securities AS accept no liability whatsoever for any direct, indirect or consequential loss rising from the use of this document or its contentsFirst Securities AS and/or their employees may hold shares, options or other securities of any issuer referred to in this document and may, as principal or agent, buy or sell such securities. First Securities AS may have other financial interests in transactions involving these securities.


![Online Change of Address Form - College Savings Bank · FX]M: Messages FX]M: View Cust... Snapshot Online Banking - Fixed Rate CD A Pane Window First time Welcome Cherie Smith Last](https://static.fdocuments.in/doc/165x107/6003639720ab206ac9632407/online-change-of-address-form-college-savings-bank-fxm-messages-fxm-view-cust.jpg)