Five-Year Master Plan University of Michigan-Ann Arbor
84
Five-Year Master Plan University of Michigan-Ann Arbor Prepared by: University of Michigan-Ann Arbor Facilities and Operations November 2, 2012
Transcript of Five-Year Master Plan University of Michigan-Ann Arbor

Five-Year Master Plan University of Michigan-Ann Arbor
Prepared by: University of Michigan-Ann Arbor
Facilities and Operations
November 2, 2012
Table of Contents 1
FIVE-YEAR MASTER PLAN UNIVERSITY OF MICHIGAN-ANN ARBOR
TABLE OF CONTENTS I. Mission Statement
II. Instructional Programming
III. Staffing and Enrollment
IV. Facility Assessment
V. Implementation Plan
VI. Current and Planned Major Projects
VII. Physical Property Inventory and Specific Building Information
VIII. Facility Condition Assessment Program

Section I
Mission Statement
Section I Mission Statement 1
MISSION STATEMENT The mission of the University of Michigan is to serve the people of Michigan and the world through preeminence in creating, communicating, preserving and applying knowledge, art, and academic values, and in developing leaders and citizens who will challenge the present and enrich the future. VISION STATEMENT As the University of Michigan prepares to embark on its third century, we fully embrace the legacy bestowed upon us by President James B. Angell in our first century. We are proud to offer “an uncommon education for the common man.” We are a community of learners. We serve our multiple constituents by providing access to and participation in scholarly and creative endeavors on a vast scale. Our academic research enterprise affects the world. The university is defined by a culture of interdisciplinary teaching and research, coupled with academic rigor. We encourage our students, faculty, and staff to transcend disciplinary boundaries by tackling complex and vexing problems facing modern societies at local, national, and global levels. We endorse and promote creativity in its many facets. We recognize the arts as a human essential and a foundation that helps to define our future. We create new knowledge and share the joy of discovery, and we see information technology as a powerful means for broadening access to knowledge and exchanging ideas. We draw from study and experience to prepare our students for leadership in a wide range of social endeavors, including government, law, education, medicine and business, reflecting the university’s many roles in contributing to good design and decision making within major domestic and international institutions. We celebrate and promote diversity in all its forms, seeking the understanding and perspective that distinct life experiences bring. We proclaim ourselves a scholarly community in which ideas may be freely expressed and challenged, and all people are welcomed, respected, and nurtured in their academic and social development. We are committed to providing for our students and faculty international learning and teaching experiences that will prepare them for a rapidly changing global community. The university encourages intellectual and cultural exchange in other countries, and programs that deeply engage scholars from disparate areas of the globe. We support and promote student, faculty, and staff immersion in local and national communities via service, learning, and leadership endeavors. We nurture lifelong relationships with alumni who span the globe. We advance health care through discovery and practice. We deliver clinical services to people within our state and the world, educate future generations of health care professionals, conduct basic research in fundamental processes of life, and vigorously

Section I Mission Statement 2
advance research on the mechanisms, detection and treatment of a spectrum of human diseases. The university champions fitness, disease prevention, and policy research to advance health, quality of life, and longevity of our own community, the nation, and the globe. We stimulate economic growth and development in Michigan and beyond. The university engages in productive partnerships among academe, industry, and government to sustain and grow a vigorous and dynamic economy. University students, faculty, and staff embody and advance innovative attitudes and entrepreneurial spirit. We strive to be an exemplary employer and a positive influence in our community. We provide an environment where all employees have opportunities to develop their potential, and where there is a shared passion for excellence and a commitment to respect for one another. We dedicate ourselves to ethical and responsible stewardship of financial, physical and environmental resources. We look for tools and strategies to create and enhance sustainable practices in all facets of operations and seek to lead in the global quest for a sustainable future. We gladly accept the challenges and opportunities confronting us and understand that the University of Michigan must change, adapt and grow to meet the needs of a rapidly evolving society. We will always focus on the horizon.

Section II
Instructional Programming
Section II Instructional Programming 1
INSTRUCTIONAL PROGRAMMING The following are descriptions of the academic programs within the University of Michigan’s various schools and colleges as well as descriptions of activities that will lead to facility impacts in the next five years: A. Alfred Taubman College of Architecture and Urban Planning Michigan offered its first courses in architecture in 1876. The program became a department in 1913, and by 1931, the College of Architecture was established as a separate entity. During the 1940s, the college was one of the few schools in the country to consider research a necessary part of architectural education, and in 1946 it became the first to introduce a graduate program in urban planning. The college offers master’s, bachelor’s and doctoral degrees in various fields, including architecture, urban planning, and urban design. In 1999, the college was named in honor of A. Alfred Taubman, a longtime donor and adviser to the college. In response to the increase in enrollment and faculty growth, the college is exploring ways to accommodate the need for additional instructional, faculty and support spaces. Penny W. Stamps School of Art and Design Education in the visual arts has been provided since the nineteenth century; the professional Master of Fine Arts degree was first awarded in 1960, and the School of Art was established as a separate unit in 1974. In 2012, Penny and E. Roe Stamps made a significant donation to the school, and it was renamed the Penny W. Stamps School of Art and Design in their honor. The school provides a comprehensive range of baccalaureate and graduate degree programs in art and design and interarts performance. A project to repurpose an existing university building (warehouse) for use by the school was recently completed. This renovation enables the school to consolidate the graduate student and faculty studios into one location and vacate off-campus leased space. The consolidation encourages collaboration, increases operating efficiencies, reduces operating expenses and improves the ability of the school to attract prospective graduate students and faculty. Stephen M. Ross School of Business Building on faculty and course offerings that began in the latter part of the nineteenth century, the School was formally established in 1924. Today, at all levels of instruction — bachelor’s, master’s, doctoral, and executive education — its programs rank in the top five among American institutions. Each year nearly 1,000 new Business School graduates enter careers as business professionals and teacher-scholars, joining the approximately 30,000 that already serve in leadership positions in business, government, and academic institutions throughout the world. Spurred by growth in numbers of students, programs, and research, an academic program master plan was completed to address the long-term facility needs of the Business School. In 2004, the school was renamed the Stephen M. Ross School of Business, and January 2009 marked the long anticipated opening of the new Ross School of Business learning facility, made possible by a significant gift from Stephen M. Ross. This building creates
Section II Instructional Programming 2
opportunities for new and improved spaces that meet requirements to support the school’s needs for state-of-the-art research and instructional activities. School of Dentistry Established in 1875, the School of Dentistry first granted the professional degree, Doctor of Dental Surgery, the following year. A national leader in the training of professional dentists and long active in oral and craniofacial research, the school offers the Doctor of Dental Surgery, master’s degrees and graduate clinical programs in the dental specialties and general dentistry. A Ph.D. is offered in oral health sciences and in an interdepartmental program in biomaterials. The School of Dentistry also offers baccalaureate and master’s programs in dental hygiene. A conceptual facilities master plan for the school has been completed and will guide plans for future renovations and expansions that are needed to support the school’s academic and research missions. School of Education The School of Education was founded in 1921; forty-two years after the university established the first chair in any United States collegiate institution devoted to the “Science and Art of Teaching.” The school prepares students for professional careers in teaching and administration, and offers advanced training for researchers and practitioners at all levels of education. Teacher diplomas were first offered in 1874; the first master’s degree in education was conferred in 1891, the first Ph.D. in 1902, and the first Ed.D. in 1938. The school has made modest renovations in its building including remodeling a large auditorium, and construction of the Brandon Professional Resource Center and Archive, completed in 2011. Made possible by a generous gift from Jan and David Brandon, this space houses digital records of professional practice and other important resources for professional study and use and offers areas for study and collaboration space. A comprehensive conceptual facilities master plan for the school is underway and will guide plans for future renovations and expansions that are needed to support the school’s academic and research missions. College of Engineering Instruction in engineering began with a class in civil engineering in 1854. The College of Engineering was established four decades later, in 1895, and has been a historical leader in establishing new departments in emerging fields, including metallurgy, naval architecture, chemical engineering, aeronautical engineering, nuclear engineering, electrical engineering, computer science and engineering, and biomedical engineering. Today the College of Engineering is a national and international institution with more than 70,000 alumni practicing in every corner of the globe. A 62,500 square foot addition to the G. G. Brown Memorial Laboratories to house the Center for Excellence in Nano Mechanical Science and Engineering is under construction. The existing G. G. Brown Memorial Laboratories will also receive a complete renovation to accommodate the growing needs of the Department of Mechanical Engineering. Design for this renovation is underway as a result of the State Legislature’s action in response to the Capital Outlay request for FY11 (HB-5858). The project will renovate the entire building, creating state-of-the-art academic and instructional spaces and upgrade much of the building’s mechanical systems and the building’s life safety systems. An addition and
Section II Instructional Programming 3
renovation of the Michigan Memorial Phoenix Laboratory is currently underway and is expected to be completed in 2013. The project will replace building systems that have reached the end of their useful life and create state-of-the-art laboratory spaces for energy-related research. School of Information A formal program began in 1926, when the Department of Library Science was created within the College of Literature, Science, and the Arts. In 1948, offerings became entirely graduate level and a doctoral program was inaugurated. Establishment of an independent school, committed to the interdisciplinary study of information and library principles, came in 1969. In response to the rapid change brought on by present technology, the school broadened significantly in the 1990s. It now pursues a highly interdisciplinary approach to educate professionals who will serve as leaders in the information professions. Recognizing this broader mission, the school was renamed the School of Information in 1996. In 2010, the school relocated most of its functions to part of the new North Quadrangle Residential and Academic Complex. A new undergraduate degree program leading to a Bachelor of Arts or a Bachelor of Science in information will be offered by the school, with applications starting in 2013. With an expected growth in faculty and enrollment, the School of Information is exploring their long-term facility needs. School of Kinesiology Kinesiology has been part of the University of Michigan curriculum since the turn of the twentieth century. In 1984, the program joined the ranks of the schools and colleges as a division and was formally designated the School of Kinesiology in 2008. Programs in movement science, sports management and communication, physical education, and athletic training prepare students for careers ranging from physical therapy and cardiac rehabilitation to athletic administration and sports’ law. Master’s and doctoral students often continue their careers in higher education or research. In 2008, a State Capital Outlay project for the renovation and upgrade of Observatory Lodge (now called Kinesiology Building) was completed which provided classrooms, office and research space. The project also addressed deferred maintenance items and existing code and accessibility requirements. The school is exploring its long-term facility needs in response to significant growth in enrollment, faculty hires, and research. Law School Founded in 1859, the Law School awarded its first Bachelor of Law degrees in 1860. In 1870, Michigan became our nation’s second university to confer a law degree on an African American candidate, and in 1871, the first university in the United States to award a law degree to a woman. A nationally ranked law school from its earliest years, the school’s graduates work in every state of the Union and in more than seventy-five countries, in business, as practitioners and professors, as legislators and members of Congress, and as distinguished civil servants and members of the judiciary. The Law School recently completed the new Aikens Commons addition to Hutchins Hall, as well as a new academic building, named South Hall, which was the first expansion of the school’s buildings since 1933. The Aikens Commons provides needed student study,
Section II Instructional Programming 4
interaction, and support spaces. South Hall, which opened in early 2012, houses classrooms, multi-purpose spaces, clinic work spaces, and offices for Law School faculty and administrators. College of Literature, Science, and the Arts The College of Literature, Science, and the Arts (LS&A), founded in 1841, was the first duly constituted college of the University of Michigan. Today, with more than 17,000 undergraduate and 2,000 graduate students, LS&A is the largest of the university’s schools and colleges, and it is still the heart of the campus. Distinguished in the humanities since its earliest years, the college became preeminent in the natural sciences during the early twentieth century and went on to become a world leader in social science research. The college has always been dedicated to providing a richly diverse liberal arts education that prepares students to lead fulfilling lives as responsible citizens within a wide range of professional careers. The college is currently evaluating its long-term facility needs for programs located within Central Campus facilities through a comprehensive Central Campus academic master plan. This study will impact most of the major facilities that serve the college. As part of the university’s Residential Life Initiative, the university is in the process of renovating the East Quadrangle residence hall, which is a living- learning community that houses the LS&A Residential College and Michigan Community Scholars Program. The project will renovate the administrative and instructional spaces of the Residential College to current academic standards. The Residential College will move back into East Quadrangle in July 2013. LS&A is also exploring ways to provide a modern workplace environment that supports collaboration on both the academic and administrative fronts. The college is closely studying ways to co-locate multiple small academic units with thematic linkages to improve operational efficiencies and promote program synergies. LS&A’s most urgent needs are developing laboratory research and teaching space for collaborative partnerships between the Department of Ecological and Evolutionary Biology, the Department of Molecular, Cellular and Developmental Biology and other university-wide research activities in biodiversity sciences, in cellular and molecular biology, and in neurosciences, and providing updated collections and research spaces for their world-class collections in zoology, paleontology and anthropology. Medical School Since opening its doors in 1850, the Medical School has been a leader in medical education, patient care, and biomedical research. In addition to its professional Doctor of Medicine program, the Medical School offers master’s and doctoral degrees in the basic medical sciences. The school established the nation’s first university-owned and operated teaching hospital and created the first departments of pharmacology and human genetics in the United States. The Medical School was among the first major American medical schools to graduate women and African Americans; today there are more practicing M.D.s from the University of Michigan than from any other medical school in the United States. The Medical School continues to renovate and modernize instructional and research facilities as priorities dictate and funds allow. The North Campus Research Complex provides the Medical School as well as the Health System opportunities to expand translational research programs such as Emergency Medicine,
Section II Instructional Programming 5
and provides space for future development that would be based on university and Health System strategic facilities master planning efforts. A renovation to the Taubman Health Sciences Library is currently in design, with construction expected to begin in late 2013. The renovation will allow the space to be more effectively used for health sciences education. School of Music, Theatre and Dance The first professor of music was appointed in 1879. One of the oldest and largest schools of music in the United States, the School of Music, Theatre and Dance ranks among the top conservatories and schools of music in the country. Degrees are offered at the bachelor’s, master’s, and doctoral levels in nearly all fields of music, dance, and theater. The school’s mission is to keep an exuberant and undiluted love of the arts as a vivid motivation among all who are associated with it while striving to prepare specialists who are knowledgeable and well-rounded musicians, dancers, and theater artists. Currently, School of Music, Theatre and Dance programs are divided between North and Central Campuses. A conceptual facilities master plan for the school’s music programs is underway and will guide plans for future renovations and expansions that are needed to support the school’s academic mission. School of Natural Resources and Environment The School of Natural Resources and Environment has been a pioneer in developing a scientific understanding of ecosystems, including their conservation, management, and restoration. The school trains leaders, assists in policy-making, and teaches the skills necessary to manage and conserve the earth’s resources on a sustainable basis. Faculty and students are committed to five critical areas of study and action: conservation of biological diversity and ecosystem management and restoration; risk perception, assessment, management, and communication; environmental equity and urban environments; corporate environmental management; and global environmental change. The first program of its kind in the nation, founded in the late 1880s, the School of Natural Resources and Environment awards Master of Science, Master of Landscape Architecture, and Doctor of Philosophy degrees. The school’s home is in the Samuel Trask Dana Building, which underwent a series of renovations and remains one of the greenest academic buildings not only on U-M’s campus, but in the State of Michigan. School of Nursing The School of Nursing has held an unsurpassed reputation of excellence for more than one hundred years. It has been a national leader in the advancement of nursing knowledge and the promotion of new trends in health care. The school’s baccalaureate programs include a four-year B.S.N. Program, a Second Career B.S.N. Program, and an R.N.-B.S.N. Completion Program. At the master’s level, the School of Nursing, through the university’s Rackham School of Graduate Studies, offers advanced study in clinical specialist, nurse practitioner, and management roles. The school’s Ph.D. and Postdoctoral Programs prepare nurse scientists to develop the knowledge necessary to support and advance nursing practice, and to teach the next generations of B.S.N.s. The School of Nursing is currently one of the university’s highest capital project priorities. A new state-of-the-art building is currently in design with an expected
Section II Instructional Programming 6
completion date in 2015. The new building will allow the school to fulfill its commitment to delivering exceptional education to students, preparing a skilled workforce of nursing scientists, educators and advanced practice nursing professionals that can help meet the public health needs of the world. College of Pharmacy Established as a department in 1868, Pharmacy became a college in 1876, the first at any university in the United States. Today, the College of Pharmacy has an average annual enrollment of 300 Doctor of Pharmacy and seventy graduate students, and is consistently ranked among the top pharmacy schools in the nation. The college offers a Baccalaureate degree in Pharmaceutical Sciences; a Master of Engineering – Pharmaceutical Engineering; Ph.D. programs in Medicinal Chemistry, Pharmaceutical Sciences, and Social and Administrative Sciences; and a Doctor of Pharmacy degree in Pharmaceutical Sciences. Major areas of research include the biological, chemical, clinical, and social aspects of drugs and therapeutic agents. The college has indicated a need for additional space to meet anticipated growth in faculty and research and to improve the student experience. School of Public Health The university’s first professor of hygiene was appointed in 1887, the first degree in hygiene was granted in 1897, and the School of Public Health became an independent unit in 1941. The school offers a master’s and doctoral degrees in fields such as biostatistics, environmental health sciences, epidemiology, health behavior and health education, and health management and policy. Major facility improvement projects have been completed in response to the rapid growth in research activity in public health over the past ten years with a major addition to the School’s original building in 2006. A major renovation of the existing Henry F. Vaughan Building was completed in 2007 to expand the facilities to meet the current programmatic needs of the school. The final phase of the renovation included infrastructure updates. Gerald R. Ford School of Public Policy The School of Public Policy prepares graduates for distinguished careers in policy analysis and management and promotes improved public policy through research. Its curriculum combines rigorous grounding in contemporary social science, opportunities to develop expertise in a variety of policy domains, and practical experience. Graduates work in government and the private and nonprofit sectors, using their knowledge, judgment, and new ideas to solve social problems, both domestic and international. Traditionally a graduate and professional school, the Ford School of Public Policy launched a highly successful undergraduate degree program in the fall of 2007. The school traces its history to the founding of the Institute of Public Administration in 1914, the first university program in the United States to provide a systematic course of study in municipal administration. The regents approved the naming of the school in honor of Gerald R. Ford, the 38th President of the United States and an alumnus of the University of Michigan, in November 1999, and the official dedication and naming took place September 12, 2000. The Joan and Sanford Weill Hall, dedicated to the Ford School,
Section II Instructional Programming 7
was completed in 2006 and consolidated most of the school’s programs to a single location. Horace H. Rackham School of Graduate Studies The Horace H. Rackham School of Graduate Studies oversees and coordinates graduate education, bringing together graduate students and faculty from across the institution to experience and take full advantage of the university as a scholarly community. The university awarded its first Master of Arts degree in 1849, first Master of Science degree in 1859, and first Doctor of Philosophy degree in 1876. Organized as a department in 1892, the Graduate School became an autonomous unit in 1913. In 1935, a generous gift from the Horace H. and Mary A. Rackham Fund included the site and construction of the Rackham Building for graduate studies and a substantial endowment for carrying on graduate work and research. In 2003, a major renovation of the Rackham Building was completed. School of Social Work The program in Social Work began in 1921, and was granted the status of a school in 1951. At the master’s level, the School of Social Work prepares professional practitioners to work with individuals, children and their families, organizations, and communities in such fields as substance abuse, aging, mental health, education, child and public welfare, and public policy. The Joint Doctoral Program in Social Work and Social Science is one-of-a-kind and prepares students for academic careers. Graduates of both programs are found in leadership positions around the world. The School of Social Work consistently ranks as one of the best in the nation. The school has recently completed a renovation of the lower level of the School of Social Work Building, which repurposed space previously housing a small library into areas that enable students to practice and observe clinical approaches, accommodate expanded continuing education programs, and provide higher quality space for student interaction.
Section II Instructional Programming 8
THE ROLE OF THE UNIVERSITY OF MICHIGAN (ANN ARBOR) AMONG INSTITUTIONS IN THE STATE The University of Michigan is one of a small number of public universities consistently ranked among the top universities in the nation by various measures of quality, both in general academic terms and in terms of strength of offerings in specific professional subjects and other academic disciplines. In common with these peers, the University of Michigan is a large complex university, offering a wide range of degree programs at the undergraduate and graduate levels and contributing to the State and the Nation through related research and service programs. Historical Development Distinguished universities become so only over a long period of time. The University of Michigan, organized in Detroit by the Territory of Michigan in 1817 and moved to Ann Arbor in 1837 when Michigan became a state, is the prototype of the constitutionally autonomous state university and the first of all state institutions to achieve national distinction. Present Programs and Degree Production The University of Michigan today offers instruction in a wide range of academic disciplines at the baccalaureate, master’s, and doctoral level. In 2011-2012, the university awarded 6,490 bachelor’s degrees, 4,951 master’s, intermediate professional, and doctorate degrees, and 709 graduate-professional degrees. From 1845 through the present, the university has conferred almost 750,000 degrees. The cumulative economic, cultural and intellectual contribution of these graduates to the State is beyond calculation. The various degree programs, undergraduate, graduate, and professional, are offered within the framework of over 120 departmental units in 19 schools, colleges, and divisions, along with U-M-Flint and U-M-Dearborn. The scope of the university today makes feasible many activities that are possible only given the critical mass of a large scholarly community. In addition, specialized professional schools in Ann Arbor constitute a critical mass in their own right, offering their students and faculty advantages of access to the entire scholarly community. All faculty and students benefit from the availability of major university resources, such as networked computing facilities and a nationally recognized library. Broad-scale scholarly research is possible, because of the continuing support of scholarship provided both from within and from outside of the university. Interdisciplinary studies are encouraged within such broad areas as the social sciences, the natural sciences, the humanities, and the biological and health sciences. New fields of study often cross the boundaries of many of these traditional divisions of learning. Regroupings of existing courses and faculty often occur as new areas of study emerge. For example, teaching and research programs have developed in such new combinations of existing strengths as macromolecular science and engineering, applied and interdisciplinary mathematics, the program in biomedical sciences, and the program in manufacturing. The ability of
Section II Instructional Programming 9
the university to respond to changing areas of scholarship is further aided by the presence of various research institutes that coordinate multidisciplinary efforts. Such institutes, staffed by faculty with joint teaching appointments, help to ensure that the results of current research are quickly assimilated into the body of knowledge taught at the university. In this connection, let it be noted that this document is largely concerned with the Ann Arbor campus of the university. The campuses at Dearborn and Flint, while integral parts of the University of Michigan, are developing their own unique roles and missions. The size and location give them a role that is different from the Ann Arbor campus in many particulars, although they share many of the traditions, resources, values, and principles of the Ann Arbor campus. These emerging roles are described in separate statements. For the remainder of this statement, the Flint and Dearborn campuses will be subsumed under the general description of the University of Michigan. The Major Missions of the University Any discussion of the role of a modern complex university must recognize that such an institution has at least three vital missions. The first of these is to educate students in the light of certain general educational goals. The second is the preservation and refinement of knowledge already acquired, along with the production, dissemination, and utilization of new knowledge. The third role of the modern university is that of helping to define and assist in the solution of the problems of society. The familiar rubrics “teaching, research, and service” are shorthand for denoting these three major activities that the university performs. A general statement of aims of a university, prepared by the Faculty Senate subcommittee on the Proper Role of the University of Michigan in 1962, is still relevant:
This university - almost any university worthy of the name - is dedicated to scholars and scholarship. The university nurtures both. To some degree, of course, future scholars come to us with capacities to function as students that they have already acquired (or perhaps are born with) and at least latent motivations for scholarly tasks. Yet to a considerable extent, scholars are made in the university environment. Thus, one of our major aims is the inspiration and preparation of scholars, of men and women who will respond to our teaching in the wide variety of ways that knowledge enriches the lives of individuals and societies. In relation to knowledge itself, the university strives for its preservation, transmission and extension, and to initiate patterns of its application to individual and social needs.
The university also has a goal of contributing to the growth of citizens, especially of future leaders. This responsibility is often overlooked at the university level because it is such a significant part of the aims of primary and secondary education. This aim of fostering citizen education is one stimulus toward keeping higher education broad so that the scholar, no matter how specialized, may still keep perspective on his relation to man and society. A public institution cannot draw sharp boundaries between its
Section II Instructional Programming 10
students and the rest of the citizens. The university has obligations to make available to the citizens of the state and nation that portion of its specialized knowledge that provides the necessary background for social decision, since it receives funds from both state and federal sources. Some of the university’s functions parallel those of other institutions within the State. For example, a degree in liberal arts can be earned at any of the baccalaureate-level institutions, as well as at all of the major universities of the State. On the other hand, a large number of the university’s activities are so specialized in nature that they are carried by few or no other institutions in the State, nation or the world. Often these are the activities associated with the University of Michigan’s special national or international prominence, even though they form only a small part of the total university mission. Even where university programs do appear to duplicate those at other State institutions, there are often substantial differences. Many of the other programs of the university have mutual relationships and dependencies so that the distinctive functions of those programs within the university are difficult to compare with those at other institutions. Moreover, the presence of a great library, of art and science museums, of the many distinguished visitors to campus, of important musical and theatrical opportunities and many other features of the intellectual life of the university add qualitative dimensions to most of its programs. Such added dimensions make the comparability of our programs to programs offered elsewhere difficult to assess. In order to fulfill its total educational, research, and service responsibilities to the State, the University of Michigan should continue to offer a full range of programs from the baccalaureate through the post-doctoral levels. As in the past, students from Michigan should continue to be the principal beneficiaries of these programs, although a student body of heterogeneous background should also be maintained. The university has long maintained high standards of admission to its programs, and students of the highest academic qualifications will continue to make up the student body of the university. In addition, the university has recognized its responsibility to the able but educationally disadvantaged student and will continue to make every effort to assist such students in realizing their potential. The relative sizes of the various programs at the different levels will be carefully monitored and managed in order to maintain the highest quality of operation consistent with available faculty, physical facilities, and the total level of financial support available. The Teaching Mission The university faculty hold a number of general goals for the education of their students. Most of these goals apply at both the undergraduate and graduate level, in the liberal arts and in specialized professional training. At some levels of training, certain of these goals are emphasized, while at other educational levels still other goals are paramount. A faculty report on educational goals suggests that among its responsibilities the university has the obligation to prepare students who:
Section II Instructional Programming 11
• have a mastery of a particular discipline • have an acquaintance with their society’s past • have the training required to assume productive roles in society • have an awareness of the need for self-criticism • feel a responsibility toward the knowledge they have acquired • are prepared to question the uses to which their skills are being put • recognize their responsibilities to society and their fellow man • will preserve and enhance the legacy of the past • will continue to develop intellectually • respect and value intellectual rigor and intellectual freedom.
Each instructional program at the university plays a part in meeting these goals, and the achievement of these goals for its students is thus a major role of the university. In the fall of 2012, 43,426 students were enrolled in credit bearing courses at the University of Michigan – Ann Arbor. This total was composed of 27,979 undergraduates, and 15,447 graduate and professional students. Undergraduate Programs The undergraduate enrollment at the university is divided among a number of schools, colleges and divisions. Some, like the College of Literature, Science, and Arts, the College of Engineering, and the School of Music, Theatre and Dance, offer full four-year undergraduate programs. Others, like the Taubman College of Architecture and Urban Planning, conduct undergraduate major programs for junior and senior students whose first two years were spent in liberal arts preparation. Even in those undergraduate schools such as Engineering that conduct four-year programs distinct from the College of Literature, Science, and the Arts, a substantial proportion of undergraduate instruction consists of liberal arts subjects. At the undergraduate level, the first responsibility of the university is to continue to serve a large number of highly qualified students. These students will be predominantly Michigan residents, whose high academic potential make possible a first-quality undergraduate program with minimal attrition. In addition, the university will continue to work toward its goal of extending educational opportunities to a significant number of promising, though disadvantaged, students. The largest proportion of undergraduate instruction will continue to be offered by the College of Literature, Science and the Arts. The College of LS&A will also continue to offer a considerable portion of its instruction in pre-professional areas, such as law, dentistry, and medicine, as well as in the large numbers of courses required of students in other undergraduate units such as Education, Business, Engineering, Nursing, and Music. As a state institution, the University of Michigan can perform an important service to the citizens of this State by continuing to offer a full range of undergraduate programs of high quality, both on campus and off-campus. Finally, in practical terms, the most efficient university operation is one that maintains a carefully constructed balance, suited to its own financial structure, among students at all levels.
Section II Instructional Programming 12
Graduate and Professional Programs The University of Michigan prepares highly qualified students for leadership positions in governments, hospitals, courts, colleges, laboratories -- literally, for almost all work endeavors. Such advanced and professional instruction differs from undergraduate instruction in its concentrated nature and in the close faculty-student relationship and individualization of program that is required. Such activity, of which advanced research is an integral part, has state, national, and international importance. In the graduate and professional schools, the University of Michigan should continue its traditional roles not only of supplying physicians, dentists, lawyers, teachers, and other professionals needed within the State, but also providing training for national and international leadership by keeping these units among the very best of their kind in the United States. Numerous studies show that, although the entire nation benefits economically from the graduate and professional training offered by the nation’s leading universities, the most immediate beneficiaries are residents of the state in which the university is located. The presence within this state of leading universities insures Michigan residents exceptional education opportunities at all levels and in a wide spectrum of academic fields. The Acquisition and Dissemination of Knowledge A true university is characterized by its constant attention to the production, dissemination, systemization, and preservation of knowledge. This concern with knowledge goes on in all areas and at all levels. It ranges from studies of the virus to the motions of galaxies and from the most immediate practical applications to highly abstract theories. In its concern with knowledge, the university follows certain general principles. Some of these are summarized in the faculty committee report cited below: The university, in its commitment to knowledge, must be: • society’s ‘organ of memory’ • a source of new knowledge and new techniques for its application • constantly re-interpreting the lessons and the facts of the past • responsible for transmitting knowledge to all its constituents • prepared to develop principles concerning the use of knowledge • vigorous in its defense of all those who seek knowledge under its auspices • alert to its own biases and limitations • supportive of individuals and institutions that share its commitments.
As a community of scholars, the university holds that knowledge is important in its own right and that the production of knowledge needs no further justification. Equally, from the point of view of society at large, there must be a place where new ideas are being tested and new experiments tried, while prior knowledge is sifted and its meanings explored. If the university did not exist to play this role, it would very likely have to be invented anew.

Section II Instructional Programming 13
In addition, if education is to be a living thing, it must be based on a lively body of knowledge. The university views its role not as a dispenser of facts to an audience of students, but rather as a force which leads students to ask new questions and search for their own answers. This attitude can be communicated to the students only by a faculty who are themselves asking new questions and trying to discover new answers. This is especially true at the graduate and professional level where the connection between the search for new knowledge and advanced training is very close. The intimate connection between research activity and advanced training is one of the reasons that the university’s goal is to be the outstanding state university in terms of national prestige and the formal ranking of its graduate programs. Only by so doing can Michigan retain comparable rankings in its research productivity and the research support that it attracts to the university. Such support affects both research and business oriented industries that the university attracts to the State, and the rate of flow of new and beneficial knowledge and techniques. The benefits to the people of Michigan of the national and international role of the university take several forms. The most tangible are the economic benefits that accrue as the university’s research and educational activities continue to enhance the State’s industrial and commercial position in the nation. These benefits to the State are very substantial. The proper role for the University of Michigan is to continue to serve this function, and indeed, to enhance this role vis-a-vis the State. The Service Functions Historically, the American university has long been concerned with the problems of the society it serves and has acted as a positive force in the attempted solution of those problems. This has been true from the concern with better medical treatment and improved industrial technology in the very early days of the university, and extends to the present deep concerns with overpopulation, urban blight, and environmental pollution. Here, too, the faculty of the university subscribes to certain general principles. The faculty report cited lists some of those principles: In its efforts to serve society, the university will:
• prepare persons who will fill society’s need for trained professionals • extend educational opportunities beyond the campus • provide service through its professional schools, especially medicine, dentistry,
etc. • work for constant improvement in the whole educational system of the State • provide (for) a broad range of service functions, from law to public health • cooperate with other institutions of higher learning in the State to insure the
maximum utilization of resources • work unremittingly to insure the relevance of the information it imparts and its
most beneficial application • respond to the needs of a dynamic society.
Section II Instructional Programming 14
As a multipurpose state institution, the University of Michigan has an important obligation to provide programs of public service for the citizens of Michigan. For example, hundreds of practicing physicians and lawyers in the state participate in continuing educational programs of the University of Michigan. So do literally thousands of practicing engineers, business leaders, public administrators, teachers, and other professionals of diverse specialties. Our ability to sustain and improve life in this turbulent, changing society requires that newly discovered knowledge and improved technologies must be evaluated and used at the earliest opportunity. The University of Michigan proposes to sustain and expand these continuing educational programs, with particular emphasis on those related to its programs of advanced, graduate-professional studies. As a multipurpose state institution, the University of Michigan also has an important role in supporting the State’s economy. The university is focusing significant efforts on growing its portfolio of work in the economic development and technology transfer arena. The university’s North Campus Research Complex (NCRC) is one example of the university’s commitment to contributing to the regional economy by bringing together researchers and partners from different disciplines and industries. The NCRC houses the university’s Office of Technology Transfer and the Business Engagement Center, which act as a front door to the university’s vast resources in technology, research, faculty expertise, and student talent—all tools that can support both new and established businesses. In January 2011, the university officially opened the Venture Accelerator at NCRC to provide space and resources to start-up companies emerging from new ventures at the Office of Technology Transfer. As of September 2012, the NCRC houses 22 external organizations with a total of 173 workers. The university’s commitment to the State’s economy continues with the efforts of the University Research Corridor (URC), the university’s collaboration with Michigan State University and Wayne State University that is focused on stimulating economic development in the State and region by leveraging the collective research assets of the institutions. Conclusion In their wisdom, the people of Michigan in each successive generation have gathered to themselves persons of every sex, race, nationality, and religious faith to prepare adults, young and old, for leadership in the central tasks of society. Through teaching, research, and service, members of the scholarly community discover and communicate the knowledge and skills that will nurture the lives and well-being of this and future generations. To these ends, the role of the University of Michigan is to continue to function as a large complex university of high quality, offering a wide and flexible range of degree programs at both undergraduate and graduate levels. Original, April 1968. Abridged and Revised, October 2003. Updated, October 2004; October 2005; October 2006; October 2008; October 2009; September 2010; October 2011; October 2012.
Section II Instructional Programming 15
Other Initiatives and U-M’s Role in Leadership and Economic Development The University of Michigan’s academic and research missions do not limit activities to just the classroom or research lab. The university is committed to supporting students and faculty well beyond the traditional walls of studies and research by creating an environment and providing resources to the university community to find real world applications for their research and ideas. Several endeavors are underway that not only impact current and future facilities usage, but also have the potential to spur economic development in Michigan and beyond. Third Century Initiative As the university is approaching the 200 year anniversary of its founding, the university is launching its Third Century Initiative. This goal of this Initiative is to use $50 million in existing funds during the next five years to develop innovative, multidisciplinary teaching and scholarship approaches to such topics as climate change, poverty and malnutrition, energy storage, affordable health care and social justice challenges. The initiative will encompass teaching, research and service efforts with the goal of engaging students and faculty in developing programs that will intensify students' immersive experiences in and beyond the classroom. Emphasis will be on international experiences, undergraduate research, service learning, entrepreneurial activities and innovative courses that encourage the role of creativity in critical thinking. MCubed Research Funding Model Part of the Third Century Initiative is the M-Cubed project, a first-of-its-kind, real-time research funding initiative at the university that puts $15 million into the hands of professors to jumpstart new projects they believe in. To qualify, three researchers from different disciplines must come up with an idea and agree to work together. A modern alternative to the traditional government grant review process, the new MCubed program puts university professors in charge of divvying research dollars in a pure form of peer review. MCubed is designed to encourage bold research at the interfaces of academic fields, where big breakthroughs tend to happen, according to the designers of the grassroots program. Michigan Investment in New Technology Startups (MINTS) The Michigan Investment in New Technology Startups (MINTS) initiative is a program that allows the university to invest up to $25 million during the next decade in select venture-funded university startups -- new companies built around inventions born in faculty members' labs. Eligible startups primarily are those that have licensed technologies that originated in faculty labs. Under MINTS, the university reaps the benefits of its initial investment when a company either is acquired or goes public. This investment is not a new expense for the university. The university is diversifying its assets — money that is continually invested — and investing directly in technologies and ideas developed by U-M researchers.

Section II Instructional Programming 16
U-M Tech Transfer Office The U-M Tech Transfer Office is the organization responsible for the transfer of university technology to the marketplace and oversees such programs as MINTS, described above; the Michigan Venture Center, a "front door" into the university for entrepreneurs and venture partners interested in start-up venture opportunities with U-M technology; and the Venture Accelerator, a program that provides space and resources for new businesses based on U-M technology. Business Engagement Center Co-located with U-M Tech Transfer is the Business Engagement Center (BEC), an office whose mission is to strengthen the university's ties to business and community partners and to help revitalize and diversify Michigan's economy. Acting as a gateway to the university, the BEC assists business and community partners in maximizing their growth potential by identifying and accessing the university’s vast resources, including research discoveries, new technology, high-tech facilities, student and alumni talent, continuing education programs, and strategic giving opportunities. Academic and Practical Training Programs in Entrepreneurship The university is committed to fostering and nurturing the entrepreneurial spirit across campus, not only with faculty through research programs like those described above, but also with our students through academic programs and incubator-like centers across campus. The Zell Lurie Institute, part of Ross School of Business, is globally recognized academic program in entrepreneurial studies. The program provides curriculum, program initiatives, community involvement, and alumni outreach activities that deliver exclusive resources for future entrepreneurs at the university. The Institute's innovative real-world approach and the Ross School of Business’ traditional management excellence encourages and nurtures students in preparing for entrepreneurial careers to succeed, autonomously or in a corporate setting, as leaders for new venture creation and growth. The U-M Center for Entrepreneurship (CFE), part of the College of Engineering, connects current students with Michigan alumni in the start-up community; provides grants for students to pursue their own ideas for companies and products; supports, simplifies and clarifies intellectual property transfer processes for students and the broader community; and develops entrepreneurship-focused academic programming so students can take entrepreneurship courses from U-M faculty and members of the broader entrepreneurial community. The CFE is responsible for launching brand new courses and formal academic programs focused on entrepreneurship and co-managing the TechArb student startup accelerator, described below. TechArb, supported by the CFE, the Zell Lurie Institute, and the Office of Vice President Research is a student venture accelerator program at the university. TechArb provides a community space for students to learn from one another and from TechArb mentors.
Section II Instructional Programming 17
TechArb staff and local entrepreneurs/funders hold regular office hours to help student entrepreneurs learn and succeed and connects students to U-M alumni and other experienced entrepreneurs, investors, venture capitalists, accountants, and lawyers. This network is keen on helping TechArb teams build and grow actual companies. TechArb also provides students with summer grants so students can work full time on their venture. The Summer 2012 session involved over 20 companies.

Section III
Staffing and Enrollment

Section III Staffing and Enrollment 1
STAFFING AND ENROLLMENT Enrollment at the University of Michigan – Ann Arbor has been slowly increasing from 36,000 in 1969 to more than 43,000 today. In general, it is our intent to maintain our enrollments at this level over the next five years. We believe that it represents the stable level appropriate for the size of our faculty, our facilities, and our funding. While we expect no major overall growth in enrollment, we expect increased enrollment in key programs. For example, the University of Michigan is called upon to meet an increasing demand for instruction in fields such as nursing, a variety of engineering disciplines, public policy, information sciences, and biological, biomedical and life sciences. Education in these fields is an important part of our mission, and it meets a very real need in our state and our nation, both of which face a shortage of qualified graduates in these areas. Average class size varies by discipline. In the fall of 2011, 45% of the sections taught to undergraduate students contained less than 20 students. Some sections are taught to large groups where appropriate; sections with 50 or more students represented about 10% of the undergraduate sections taught in the fall of 2011. Total headcount enrollment has grown by over 15% since the fall of 2002, and the volume of research has increased 71%. At the same time, the number of General Fund FTEs has grown by about 6.3%, as we strive to contain costs and do more with less. We have deliberately grown the faculty ranks and in the past several years launched initiatives to hire 150 new faculty members in what has been a concerted effort to improve our student-faculty ratio. Health System staffing levels have grown an average of 5.4% annually from FY2003 due to growth in patient care and research activity. At this time we anticipate the growth rate in health system staffing levels for the administrative positions to slow down, while patient care/research positions will continue to grow relative to their respective activities. Impact of Distance Learning At the University of Michigan, distance learning has been primarily used to combine technological advances with our current methods of instruction for our on-campus students. Some academic units such as the College of Engineering, the College of Literature, Science and the Arts, the School of Nursing, the School of Public Health and the Stephen M. Ross School of Business use distance learning to supplement their Ann Arbor offerings. This approach enhances the quality of the education provided to our students by ensuring that we maintain our competitive edge. Although we expect this area to grow, we do not anticipate replacing our on-campus programs with distance education, nor do we expect the number of off-campus students to affect our overall enrollment.

University of Michigan-Ann Arbor
Fall Term Headcount Enrollment by Level
2007 2008 2009 2010 2011 2012
Undergraduate 26,083 25,994 26,208 27,027 27,407 27,979Graduate 10,865 10,897 11,299 12,188 12,556 12,714Professional 2,616 2,643 2,659 2,709 2,753 2,733
Total 39,564 39,534 40,166 41,924 42,716 43,426Source: Registrar Report 102 (excludes Extension, Visiting Scholars and Postgraduate Medicine).
Fiscal Year Equated Students
2006-07 2007-08 2008-09 2009-10 2010-11 2011-12
Undergraduate 25,308 25,858 25,790 26,062 26,923 27,264Graduate 11,401 11,562 11,830 12,227 13,153 13,413Professional 2,732 2,777 2,793 2,798 2,872 2,948
Total 39,441 40,197 40,413 41,087 42,948 43,625Source: Enrollment and Degree Tables, Table 5 (excludes Officer Education Program).
FTE Faculty and Staff Counts (Includes Hospital)
2006-07 2007-08 2008-09 2009-10 2010-11 2011-12
Instructional Faculty 4,061.69 4,151.70 4,258.04 4,376.17 4,440.26 4,565.21Primary Faculty 849.88 863.17 853.86 891.87 916.67 928.32GSI/Post Docs/Res. Fellows 3,372.23 3,440.11 3,618.09 3,806.90 3,913.57 3,975.45Non-Academic Staff 23,454.17 24,097.78 24,801.15 25,139.31 25,665.74 26,318.99
Total 31,737.97 32,552.76 33,531.14 34,214.25 34,936.24 35,787.97Source: Summary Profile.
Research Grants and Contracts( $000 )
2006-07 2007-08 2008-09 2009-10 2010-11 2011-12
821,951 847,771 910,116 997,475 1,082,543 1,055,163
Source: Financial Activities Tables, Table 2.2. Total is for Ann Arbor Campus.
Fall Term Student to Faculty Ratio2007 2008 2009 2010 2011
15:1 15:1 15:1 15:1 16:1
Source: Common Data Set.
Section IIIStaffing and EnrollmentPage 1
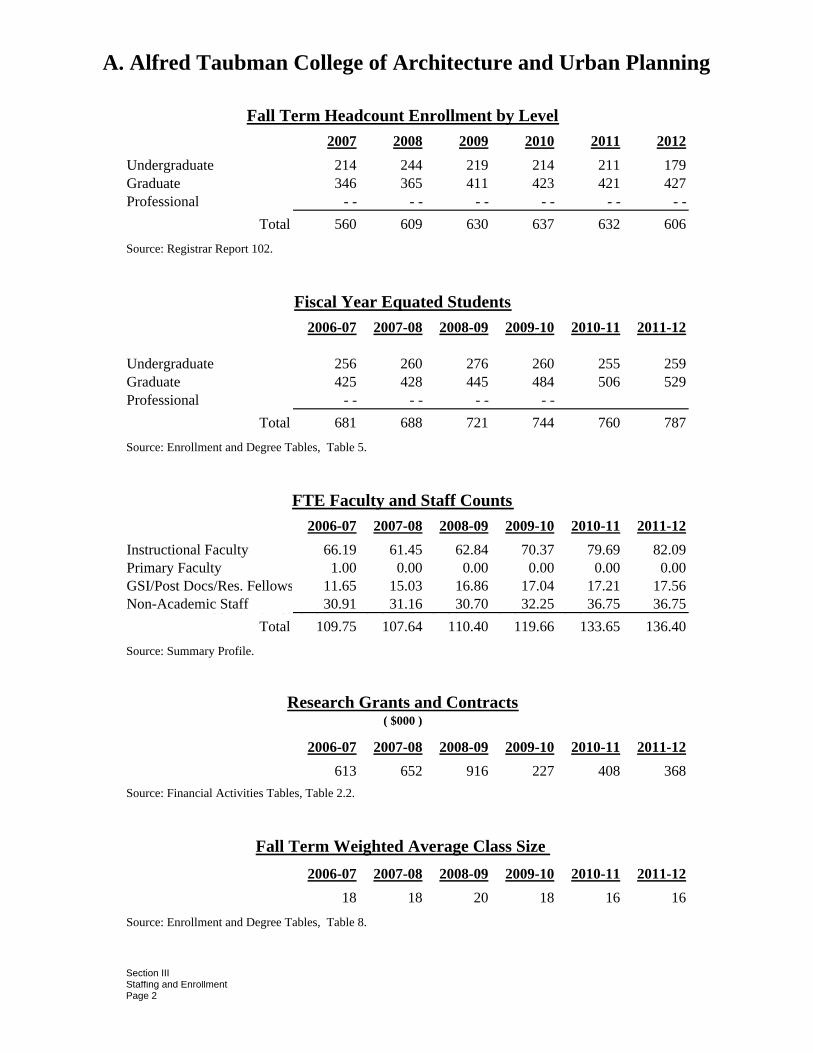
A. Alfred Taubman College of Architecture and Urban Planning
Fall Term Headcount Enrollment by Level
2007 2008 2009 2010 2011 2012
Undergraduate 214 244 219 214 211 179Graduate 346 365 411 423 421 427Professional - - - - - - - - - - - -
Total 560 609 630 637 632 606Source: Registrar Report 102.
Fiscal Year Equated Students
2006-07 2007-08 2008-09 2009-10 2010-11 2011-12
Undergraduate 256 260 276 260 255 259Graduate 425 428 445 484 506 529Professional - - - - - - - -
Total 681 688 721 744 760 787Source: Enrollment and Degree Tables, Table 5.
FTE Faculty and Staff Counts
2006-07 2007-08 2008-09 2009-10 2010-11 2011-12
Instructional Faculty 66.19 61.45 62.84 70.37 79.69 82.09Primary Faculty 1.00 0.00 0.00 0.00 0.00 0.00GSI/Post Docs/Res. Fellows 11.65 15.03 16.86 17.04 17.21 17.56Non-Academic Staff 30.91 31.16 30.70 32.25 36.75 36.7583 .0 .7 5. 3 3 . 3 3 . 3 3 . 3 3 . 3 3 .
Total 109.75 107.64 110.40 119.66 133.65 136.40Source: Summary Profile.
Research Grants and Contracts( $000 )
2006-07 2007-08 2008-09 2009-10 2010-11 2011-12
613 652 916 227 408 368Source: Financial Activities Tables, Table 2.2.
Fall Term Weighted Average Class Size
2006-07 2007-08 2008-09 2009-10 2010-11 2011-12
18 18 20 18 16 16Source: Enrollment and Degree Tables, Table 8.
Section IIIStaffing and Enrollment Page 2
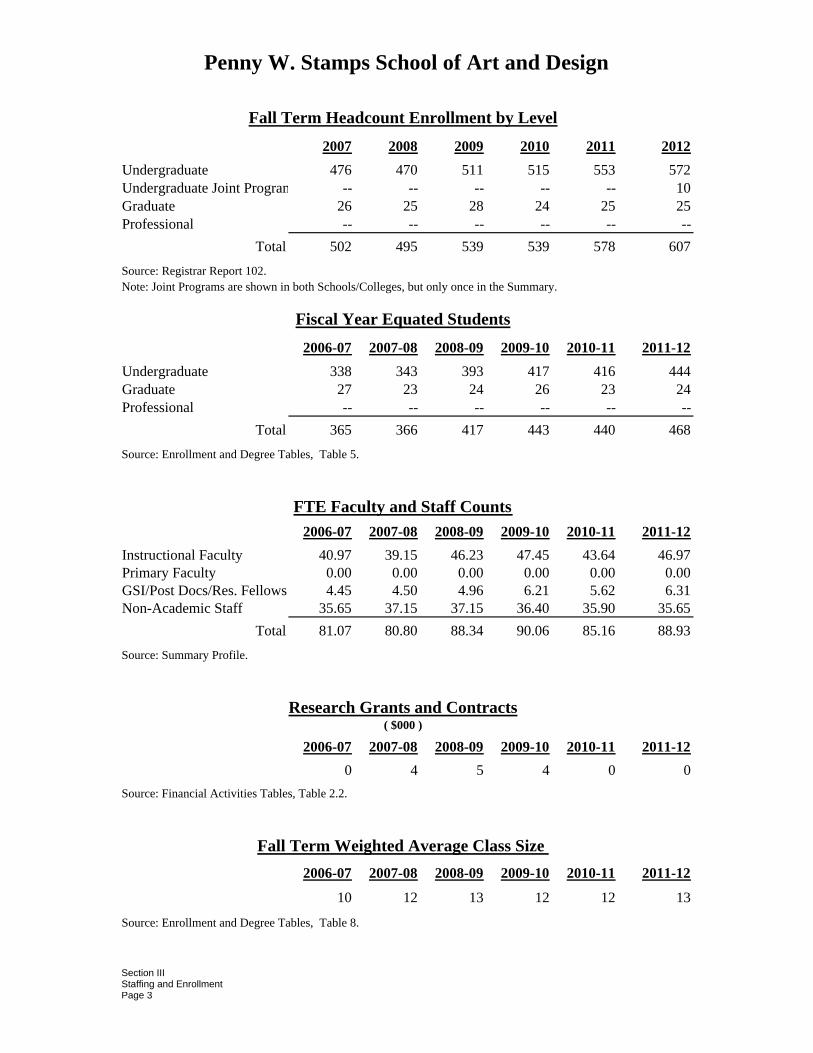
Penny W. Stamps School of Art and Design
Fall Term Headcount Enrollment by Level
2007 2008 2009 2010 2011 2012
Undergraduate 476 470 511 515 553 572Undergraduate Joint Program -- -- -- -- -- 10Graduate 26 25 28 24 25 25Professional -- -- -- -- -- --
Total 502 495 539 539 578 607Source: Registrar Report 102.Note: Joint Programs are shown in both Schools/Colleges, but only once in the Summary.
Fiscal Year Equated Students
2006-07 2007-08 2008-09 2009-10 2010-11 2011-12
Undergraduate 338 343 393 417 416 444Graduate 27 23 24 26 23 24Professional -- -- -- -- -- --
Total 365 366 417 443 440 468Source: Enrollment and Degree Tables, Table 5.
FTE Faculty and Staff Counts
2006-07 2007-08 2008-09 2009-10 2010-11 2011-12
Instructional Faculty 40.97 39.15 46.23 47.45 43.64 46.97Primary Faculty 0.00 0.00 0.00 0.00 0.00 0.00GSI/Post Docs/Res. Fellows 4.45 4.50 4.96 6.21 5.62 6.31Non-Academic Staff 35.65 37.15 37.15 36.40 35.90 35.65
Total 81.07 80.80 88.34 90.06 85.16 88.93Source: Summary Profile.
Research Grants and Contracts( $000 )
2006-07 2007-08 2008-09 2009-10 2010-11 2011-12
0 4 5 4 0 0Source: Financial Activities Tables, Table 2.2.
Fall Term Weighted Average Class Size
2006-07 2007-08 2008-09 2009-10 2010-11 2011-12
10 12 13 12 12 13
Source: Enrollment and Degree Tables, Table 8.
Section IIIStaffing and Enrollment Page 3
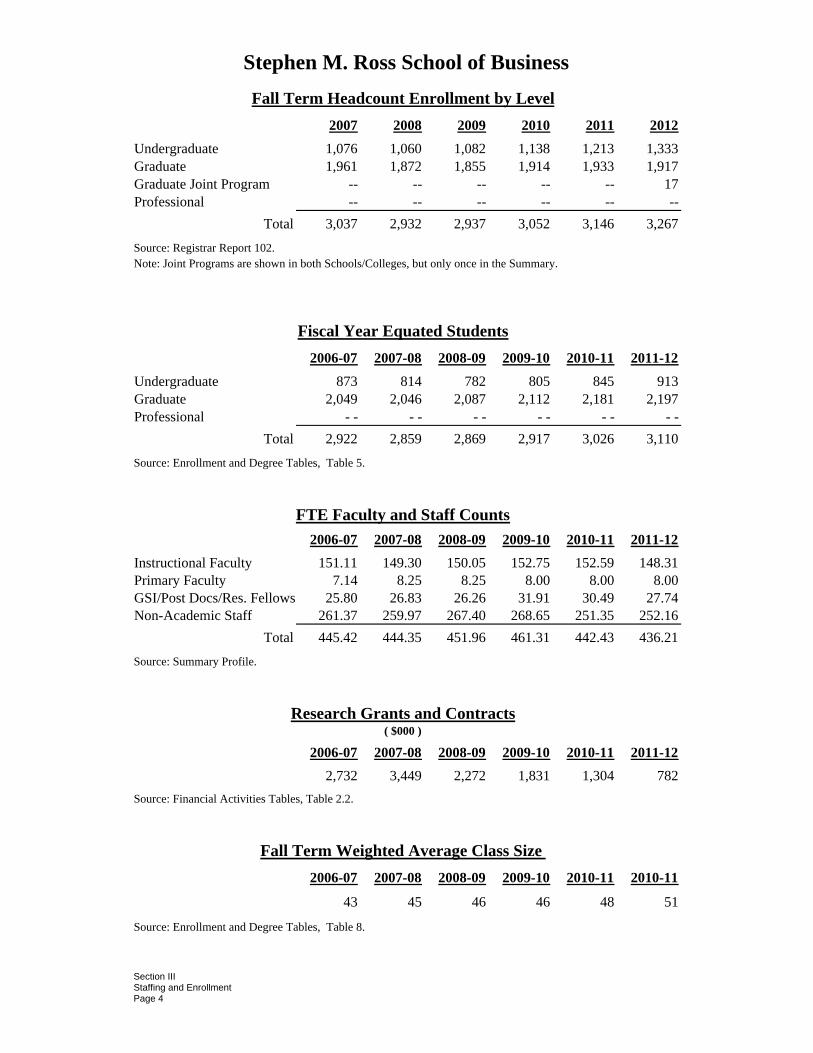
Stephen M. Ross School of Business
Fall Term Headcount Enrollment by Level
2007 2008 2009 2010 2011 2012
Undergraduate 1,076 1,060 1,082 1,138 1,213 1,333Graduate 1,961 1,872 1,855 1,914 1,933 1,917Graduate Joint Program -- -- -- -- -- 17Professional -- -- -- -- -- --
Total 3,037 2,932 2,937 3,052 3,146 3,267Source: Registrar Report 102. Note: Joint Programs are shown in both Schools/Colleges, but only once in the Summary.
Fiscal Year Equated Students
2006-07 2007-08 2008-09 2009-10 2010-11 2011-12
Undergraduate 873 814 782 805 845 913Graduate 2,049 2,046 2,087 2,112 2,181 2,197Professional - - - - - - - - - - - -
Total 2,922 2,859 2,869 2,917 3,026 3,110Source: Enrollment and Degree Tables, Table 5.
FTE Faculty and Staff Counts
2006-07 2007-08 2008-09 2009-10 2010-11 2011-12
Instructional Faculty 151.11 149.30 150.05 152.75 152.59 148.31Primary Faculty 7.14 8.25 8.25 8.00 8.00 8.00GSI/Post Docs/Res. Fellows 25.80 26.83 26.26 31.91 30.49 27.74Non-Academic Staff 261.37 259.97 267.40 268.65 251.35 252.16
Total 445.42 444.35 451.96 461.31 442.43 436.21Source: Summary Profile.
Research Grants and Contracts( $000 )
2006-07 2007-08 2008-09 2009-10 2010-11 2011-12
2,732 3,449 2,272 1,831 1,304 782Source: Financial Activities Tables, Table 2.2.
Fall Term Weighted Average Class Size
2006-07 2007-08 2008-09 2009-10 2010-11 2010-11
43 45 46 46 48 51
Source: Enrollment and Degree Tables, Table 8.
Section IIIStaffing and Enrollment Page 4

School of Dentistry
Fall Term Headcount Enrollment by Level
2007 2008 2009 2010 2011 2012
Undergraduate 84 101 112 109 109 96Graduate 97 97 96 90 89 103Professional 440 442 436 439 440 427
Total 621 640 644 638 638 626
Source: Registrar Report 102.
Fiscal Year Equated Students
2006-07 2007-08 2008-09 2009-10 2010-11 2011-12
Undergraduate 63 66 75 79 78 77Graduate 69 72 69 72 72 74Professional 579 583 586 578 607 631
Total 711 720 730 728 756 781
Source: Enrollment and Degree Tables, Table 5.
FTE Faculty and Staff Counts
2006-07 2007-08 2008-09 2009-10 2010-11 2011-12
Instructional Faculty 132.08 133.91 131.11 134.69 130.94 140.48Primary Faculty 14.84 11.55 12.00 14.29 16.95 18.03GSI/Post Docs/Res. Fellows 34.31 38.38 49.00 46.59 39.83 36.48Non-Academic Staff 315.85 316.62 325.88 329.67 320.45 330.23
Total 497.08 500.46 517.99 525.24 508.17 525.22
Source: Summary Profile.
Research Grants and Contracts( $000 )
2006-07 2007-08 2008-09 2009-10 2010-11 2011-12
14,679 15,109 16,915 18,567 18,880 18,352Source: Financial Activities Tables, Table 2.2.
Fall Term Weighted Average Class Size
2006-07 2007-08 2008-09 2009-10 2010-11 2011-12
Not Available
Section IIIStaffing and Enrollment Page 5

School of Education
Fall Term Headcount Enrollment by Level
2007 2008 2009 2010 2011 2012
Undergraduate 235 206 214 211 177 182Graduate 343 329 343 388 322 385Professional -- -- -- -- -- --
Total 578 535 557 599 499 567Source: Registrar Report 102.
Fiscal Year Equated Students
2006-07 2007-08 2008-09 2009-10 2010-11 2011-12
Undergraduate 256 259 251 256 280 269Graduate 383 372 373 396 476 403Professional -- -- -- -- -- --
Total 639 631 624 652 756 672Source: Enrollment and Degree Tables, Table 5.
FTE Faculty and Staff Counts
2006-07 2007-08 2008-09 2009-10 2010-11 2011-12
Instructional Faculty 60.21 62.48 64.17 65.07 69.43 62.99Primary Faculty 7.54 8.30 7.16 10.22 8.57 7.07GSI/Post Docs/Res. Fellow 75.00 58.98 69.29 60.60 61.41 62.88Non-Academic Staff 108.76 114.24 113.02 112.42 117.46 131.83
Total 251.51 244.00 253.64 248.31 256.87 264.77Source: Summary Profile.
Research Grants and Contracts( $000 )
2006-07 2007-08 2008-09 2009-10 2010-11 2011-12
14,483 12,968 13,973 14,081 12,658 12,579Source: Financial Activities Tables, Table 2.2.
Fall Term Weighted Average Class Size
2006-07 2007-08 2008-09 2009-10 2010-11 2011-12
14 15 13 16 17 16Source: Enrollment and Degree Tables, Table 8.
Section IIIStaffing and EnrollmentPage 6

College of Engineering
Fall Term Headcount Enrollment by Level
2007 2008 2009 2010 2011 2012
Undergraduate 5,064 5,217 5,459 5,570 5,603 5,757Graduate 2,532 2,479 2,646 2,952 3,220 3,157Graduate Joint Program -- -- -- -- -- 17Professional -- -- -- -- -- --
Total 7,596 7,696 8,105 8,522 8,823 8,931Source: Registrar Report 102. Note: Joint Programs are shown in both Schools/Colleges, but only once in the Summary.
Fiscal Year Equated Students
2006-07 2007-08 2008-09 2009-10 2010-11 2011-12
Undergraduate 2,892 3,026 3,173 3,339 3,557 3,686Graduate 2,111 2,067 2,090 2,222 2,486 2,643Professional -- -- -- -- -- --
Total 5,003 5,093 5,263 5,561 6,044 6,329Source: Enrollment and Degree Tables, Table 5.
FTE Faculty and Staff Counts
2006-07 2007-08 2008-09 2009-10 2010-11 2011-12
Instructional Faculty 318.63 330.76 345.50 358.93 371.26 379.89Primary Faculty 77.11 76.28 82.68 90.23 100.02 110.6GSI/Post Docs/Res. Fellows 560.59 579.63 614.97 678.19 720.9 750.87Non-Academic Staff 505.15 493.19 505.13 538.07 549.58 556.67
Total 1,461.48 1,479.86 1,548.28 1,665.42 1,741.76 1,798.03Source: Summary Profile.
Research Grants and Contracts( $000 )
2006-07 2007-08 2008-09 2009-10 2010-11 2011-12
123,922 125,755 131,989 152,781 159,553 165,596
Source: Financial Activities Tables, Table 2.2.
Fall Term Weighted Average Class Size
2006-07 2007-08 2008-09 2009-10 2010-11 2011-12
33 33 34 35 35 35Source: Enrollment and Degree Tables, Table 8.
Section IIIStaffing and EnrollmentPage 7
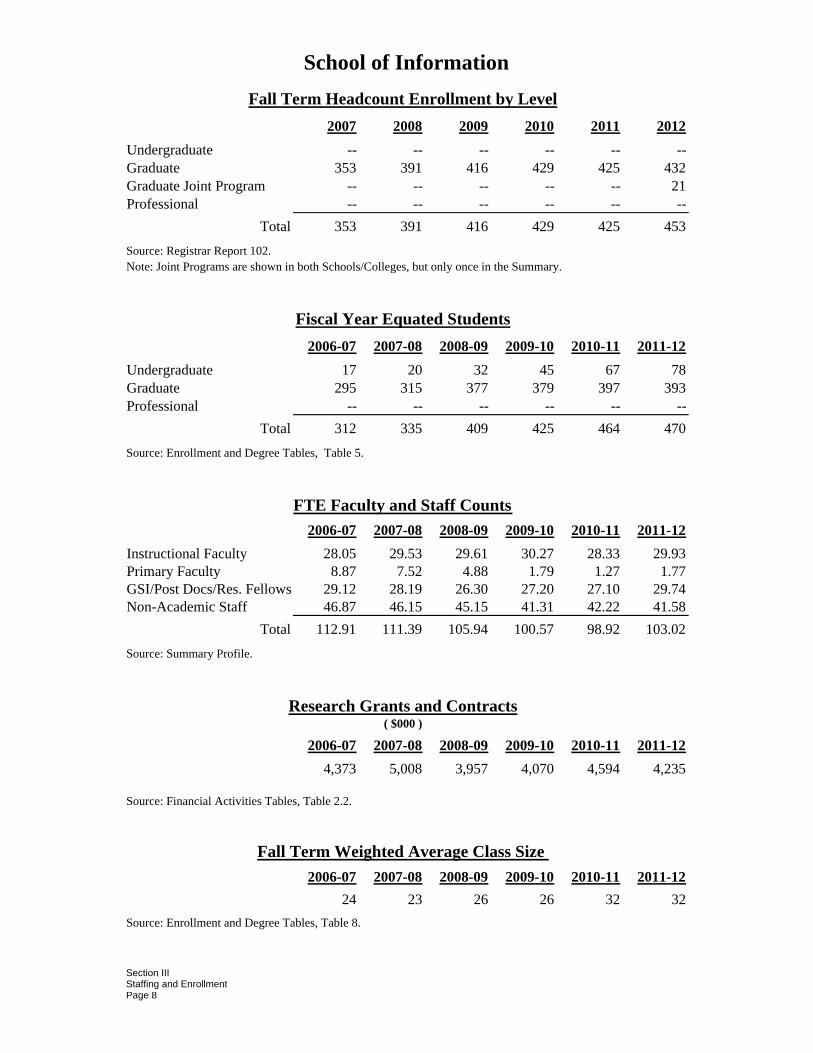
School of Information
Fall Term Headcount Enrollment by Level
2007 2008 2009 2010 2011 2012
Undergraduate -- -- -- -- -- --Graduate 353 391 416 429 425 432Graduate Joint Program -- -- -- -- -- 21Professional -- -- -- -- -- --
Total 353 391 416 429 425 453Source: Registrar Report 102.Note: Joint Programs are shown in both Schools/Colleges, but only once in the Summary.
Fiscal Year Equated Students
2006-07 2007-08 2008-09 2009-10 2010-11 2011-12
Undergraduate 17 20 32 45 67 78Graduate 295 315 377 379 397 393Professional -- -- -- -- -- --
Total 312 335 409 425 464 470Source: Enrollment and Degree Tables, Table 5.
FTE Faculty and Staff Counts
2006-07 2007-08 2008-09 2009-10 2010-11 2011-12
Instructional Faculty 28.05 29.53 29.61 30.27 28.33 29.93Primary Faculty 8.87 7.52 4.88 1.79 1.27 1.77GSI/Post Docs/Res. Fellows 29.12 28.19 26.30 27.20 27.10 29.74Non-Academic Staff 46.87 46.15 45.15 41.31 42.22 41.58
Total 112.91 111.39 105.94 100.57 98.92 103.02Source: Summary Profile.
Research Grants and Contracts( $000 )
2006-07 2007-08 2008-09 2009-10 2010-11 2011-12
4,373 5,008 3,957 4,070 4,594 4,235
Source: Financial Activities Tables, Table 2.2.
Fall Term Weighted Average Class Size
2006-07 2007-08 2008-09 2009-10 2010-11 2011-12
24 23 26 26 32 32Source: Enrollment and Degree Tables, Table 8.
Section IIIStaffing and EnrollmentPage 8

School of Kinesiology
Fall Term Headcount Enrollment by Level
2007 2008 2009 2010 2011 2012
Undergraduate 810 808 811 852 877 883Graduate 50 49 55 61 66 69Professional -- -- -- -- -- --
Total 860 857 866 913 943 952Source: Registrar Report 102.
Fiscal Year Equated Students
2006-07 2007-08 2008-09 2009-10 2010-11 2011-12
Undergraduate 437 445 421 458 474 512Graduate 38 37 40 41 56 55Professional -- -- -- -- -- --
Total 475 482 461 498 530 567Source: Enrollment and Degree Tables, Table 5.
FTE Faculty and Staff Counts
2006-07 2007-08 2008-09 2009-10 2010-11 2011-12
Instructional Faculty 30.31 29.57 32.44 31.58 33.87 39.02Primary Faculty 2.00 3.00 1.00 2.25 3.34 2.25GSI/Post Docs/Res. Fellows 14.85 17.23 18.94 12.60 12.69 12.46Non-Academic Staff 54.40 56.78 65.76 63.07 66.41 68.03
Total 101.56 106.58 118.14 109.50 116.31 121.76Source: Summary Profile.
Research Grants and Contracts( $000 )
2006-07 2007-08 2008-09 2009-10 2010-11 2011-12
6,706 8,563 6,413 6,478 6,848 7,900
Source: Financial Activities Tables, Table 2.2.
Fall Term Weighted Average Class Size
2006-07 2007-08 2008-09 2009-10 2010-11 2011-12
21 22 20 19 20 21Source: Enrollment and Degree Tables, Table 8.
Section IIIStaffing and EnrollmentPage 9

Law School
Fall Term Headcount Enrollment by Level
2007 2008 2009 2010 2011 2012
Undergraduate -- -- -- -- -- --Graduate -- -- -- -- -- --Professional 1,206 1,206 1,165 1,182 1,195 1,165
Total 1,206 1,206 1,165 1,182 1,195 1,165
Source: Registrar Report 102.
Fiscal Year Equated Students
2006-07 2007-08 2008-09 2009-10 2010-11 2011-12
Undergraduate 0 0 0 0 0 0Graduate 5 3 7 5 3 6Professional 1,186 1,188 1,185 1,161 1,182 1,195
Total 1,191 1,191 1,192 1,166 1,185 1,200
Source: Enrollment and Degree Tables, Table 5.
FTE Faculty and Staff Counts
2006-07 2007-08 2008-09 2009-10 2010-11 2011-12
Instructional Faculty 78.04 80.13 77.96 81.27 82.00 84.87Primary Faculty 11.05 9.00 10.60 10.60 8.35 9.35GSI/Post Docs/Res. Fellows 0.00 0.00 0.52 0.87 2.50 3.50Non-Academic Staff 166.87 166.22 165.13 177.11 172.23 176.61
Total 255.96 255.35 254.21 269.85 265.08 274.33
Source: Summary Profile.
Research Grants and Contracts( $000 )
2006-07 2007-08 2008-09 2009-10 2010-11 2011-12
(43) 506 493 1,508 1,584 1,472
Source: Financial Activities Tables, Table 2.2.
Weighted Average Class Size
2006-07 2007-08 2008-09 2009-10 2010-11 2011-12
30 29 32 30 28 29Source: Enrollment and Degree Tables, Table 8.
Section IIIStaffing and EnrollmentPage 10

College of Literature, Science, and the Arts
Fall Term Headcount Enrollment by Level
2007 2008 2009 2010 2011 2012
Undergraduate 16,591 16,309 16,223 16,873 17,082 17,399Graduate 1,918 1,977 2,021 2,331 2,323 2,356Professional -- -- -- -- -- --
Total 18,509 18,286 18,244 19,204 19,405 19,755
Source: Registrar Report 102.
Fiscal Year Equated Students
2006-07 2007-08 2008-09 2009-10 2010-11 2011-12
Undergraduate 18,682 19,024 18,732 18,629 19,105 19,148Graduate 2,830 2,793 2,845 2,902 3,162 3,110Professional -- -- -- -- -- --
Total 21,512 21,817 21,577 21,531 22,267 22,258
Source: Enrollment and Degree Tables, Table 5.
FTE Faculty and Staff Counts
2006-07 2007-08 2008-09 2009-10 2010-11 2011-12
Instructional Faculty 1,185.67 1,187.73 1,198.34 1,221.06 1,210.46 1,222.54 Primary Faculty 78.95 77.15 84.21 71.04 62.52 57.03 GSI/Post Docs/Res. Fellows 856.39 866.43 880.60 926.25 917.28 921.13 Non-Academic Staff 869.42 895.83 897.66 958.69 929.15 898.82
Total 2,990.43 3,027.14 3,060.81 3,177.04 3,119.41 3,099.52
Source: Summary Profile.
Research Grants and Contracts( $000 )
2006-07 2007-08 2008-09 2009-10 2010-11 2011-12
60,640 65,601 71,177 74,531 82,160 80,028
Source: Financial Activities Tables, Table 2.2.
Fall Term Weighted Average Class Size
2006-07 2007-08 2008-09 2009-10 2010-11 2011-12
27 28 28 27 29 29Source: Enrollment and Degree Tables, Table 8.
Section IIIStaffing and EnrollmentPage 11
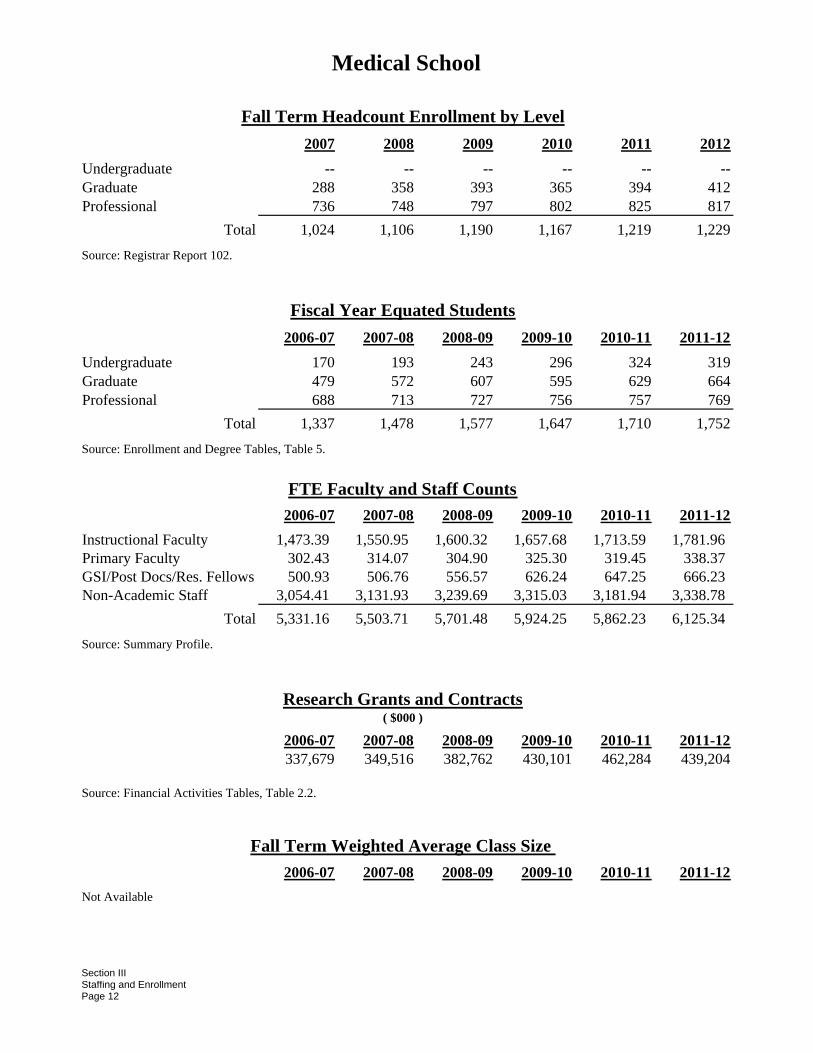
Medical School
Fall Term Headcount Enrollment by Level
2007 2008 2009 2010 2011 2012
Undergraduate -- -- -- -- -- --Graduate 288 358 393 365 394 412Professional 736 748 797 802 825 817
Total 1,024 1,106 1,190 1,167 1,219 1,229Source: Registrar Report 102.
Fiscal Year Equated Students
2006-07 2007-08 2008-09 2009-10 2010-11 2011-12
Undergraduate 170 193 243 296 324 319Graduate 479 572 607 595 629 664Professional 688 713 727 756 757 769
Total 1,337 1,478 1,577 1,647 1,710 1,752Source: Enrollment and Degree Tables, Table 5.
FTE Faculty and Staff Counts
2006-07 2007-08 2008-09 2009-10 2010-11 2011-12
Instructional Faculty 1,473.39 1,550.95 1,600.32 1,657.68 1,713.59 1,781.96 Primary Faculty 302.43 314.07 304.90 325.30 319.45 338.37 GSI/Post Docs/Res. Fellows 500.93 506.76 556.57 626.24 647.25 666.23 Non-Academic Staff 3,054.41 3,131.93 3,239.69 3,315.03 3,181.94 3,338.78
Total 5,331.16 5,503.71 5,701.48 5,924.25 5,862.23 6,125.34 Source: Summary Profile.
Research Grants and Contracts( $000 )
2006-07 2007-08 2008-09 2009-10 2010-11 2011-12337,679 349,516 382,762 430,101 462,284 439,204
Source: Financial Activities Tables, Table 2.2.
Fall Term Weighted Average Class Size
2006-07 2007-08 2008-09 2009-10 2010-11 2011-12
Not Available
Section IIIStaffing and EnrollmentPage 12

School of Music, Theatre and Dance
Fall Term Headcount Enrollment by Level 2007 2008 2009 2010 2011 2012
Undergraduate 772 777 781 763 787 782Undergraduate Joint Program -- -- -- -- -- 10Graduate 264 258 260 286 305 309Professional -- -- -- -- -- --
Total 1,036 1,035 1,041 1,049 1,092 1,101Source: Registrar Report 102. Note: Joint Programs are shown in both Schools/Colleges, but only once in the Summary.
Fiscal Year Equated Students 2006-07 2007-08 2008-09 2009-10 2010-11 2011-12
Undergraduate 794 797 811 813 807 844Graduate 361 331 319 329 350 368Professional -- -- -- -- -- --
Total 1,155 1,128 1,130 1,142 1,156 1,212Source: Enrollment and Degree Tables, Table 5.
FTE Faculty and Staff Counts
2006-07 2007-08 2008-09 2009-10 2010-11 2011-12
Instructional Faculty 135.24 138.10 138.66 143.31 144.71 147.76 Primary Faculty 0.45 0.45 0.45 0.45 0.45 - GSI/Post Docs/Res. Fellows 21.69 21.53 22.40 22.26 24.63 24.76 Non-Academic Staff 82.23 82.35 84.73 86.26 86.12 86.14
Total 239.61 242.43 246.24 252.28 255.91 258.66 Source: Summary Profile.
Research Grants and Contracts( $000 )
2006-07 2007-08 2008-09 2009-10 2010-11 2011-12
86 107 76 73 53 59
Source: Financial Activities Tables, Table 2.2.
Fall Term Weighted Average Class Size
2006-07 2007-08 2008-09 2009-10 2010-11 2011-12
17 16 16 16 16 17Source: Enrollment and Degree Tables, Table 8.
Section IIIStaffing and EnrollmentPage 13
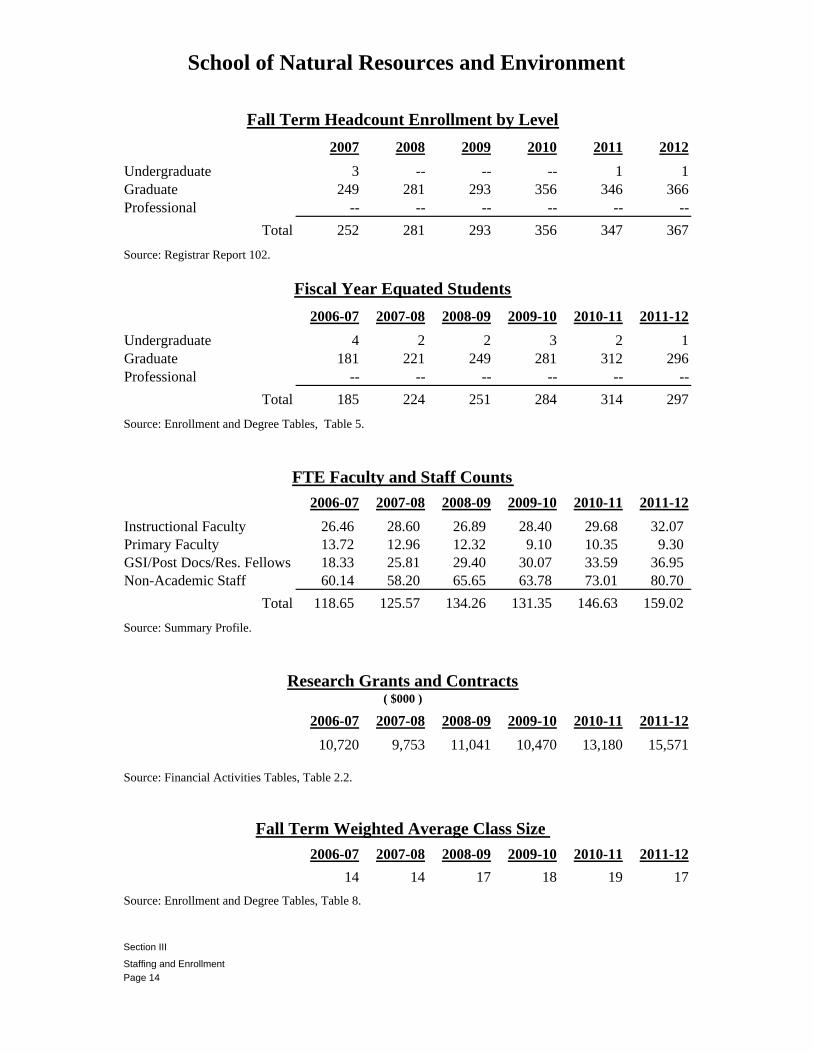
School of Natural Resources and Environment
Fall Term Headcount Enrollment by Level
2007 2008 2009 2010 2011 2012
Undergraduate 3 -- -- -- 1 1Graduate 249 281 293 356 346 366Professional -- -- -- -- -- --
Total 252 281 293 356 347 367Source: Registrar Report 102.
Fiscal Year Equated Students
2006-07 2007-08 2008-09 2009-10 2010-11 2011-12
Undergraduate 4 2 2 3 2 1Graduate 181 221 249 281 312 296Professional -- -- -- -- -- --
Total 185 224 251 284 314 297Source: Enrollment and Degree Tables, Table 5.
FTE Faculty and Staff Counts
2006-07 2007-08 2008-09 2009-10 2010-11 2011-12
Instructional Faculty 26.46 28.60 26.89 28.40 29.68 32.07 Primary Faculty 13.72 12.96 12.32 9.10 10.35 9.30 GSI/Post Docs/Res. Fellows 18.33 25.81 29.40 30.07 33.59 36.95 Non-Academic Staff 60.14 58.20 65.65 63.78 73.01 80.70
Total 118.65 125.57 134.26 131.35 146.63 159.02 Source: Summary Profile.
Research Grants and Contracts( $000 )
2006-07 2007-08 2008-09 2009-10 2010-11 2011-12
10,720 9,753 11,041 10,470 13,180 15,571
Source: Financial Activities Tables, Table 2.2.
Fall Term Weighted Average Class Size
2006-07 2007-08 2008-09 2009-10 2010-11 2011-12
14 14 17 18 19 17Source: Enrollment and Degree Tables, Table 8.
Section III
Staffing and EnrollmentPage 14
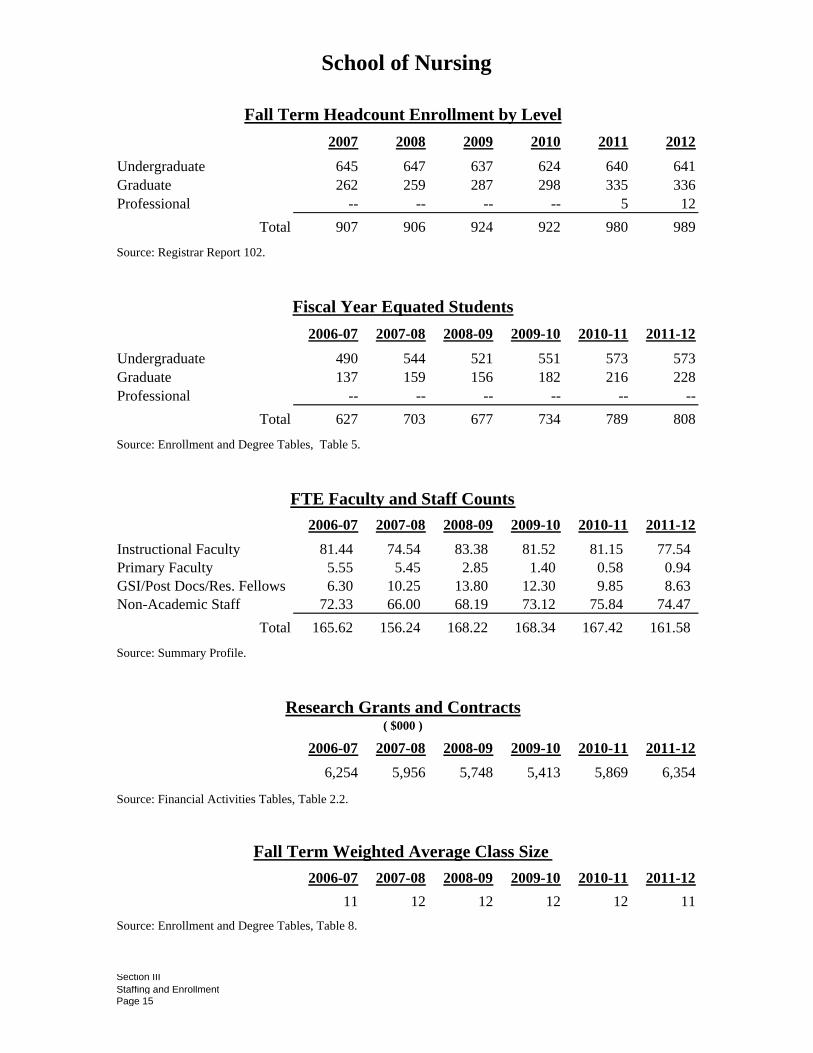
School of Nursing
Fall Term Headcount Enrollment by Level
2007 2008 2009 2010 2011 2012
Undergraduate 645 647 637 624 640 641Graduate 262 259 287 298 335 336Professional -- -- -- -- 5 12
Total 907 906 924 922 980 989
Source: Registrar Report 102.
Fiscal Year Equated Students
2006-07 2007-08 2008-09 2009-10 2010-11 2011-12
Undergraduate 490 544 521 551 573 573Graduate 137 159 156 182 216 228Professional -- -- -- -- -- --
Total 627 703 677 734 789 808
Source: Enrollment and Degree Tables, Table 5.
FTE Faculty and Staff Counts
2006-07 2007-08 2008-09 2009-10 2010-11 2011-12
Instructional Faculty 81.44 74.54 83.38 81.52 81.15 77.54 Primary Faculty 5.55 5.45 2.85 1.40 0.58 0.94 GSI/Post Docs/Res. Fellows 6.30 10.25 13.80 12.30 9.85 8.63 Non-Academic Staff 72.33 66.00 68.19 73.12 75.84 74.47
Total 165.62 156.24 168.22 168.34 167.42 161.58
Source: Summary Profile.
Research Grants and Contracts( $000 )
2006-07 2007-08 2008-09 2009-10 2010-11 2011-12
6,254 5,956 5,748 5,413 5,869 6,354
Source: Financial Activities Tables, Table 2.2.
Fall Term Weighted Average Class Size
2006-07 2007-08 2008-09 2009-10 2010-11 2011-12
11 12 12 12 12 11Source: Enrollment and Degree Tables, Table 8.
Section IIIStaffing and EnrollmentPage 15
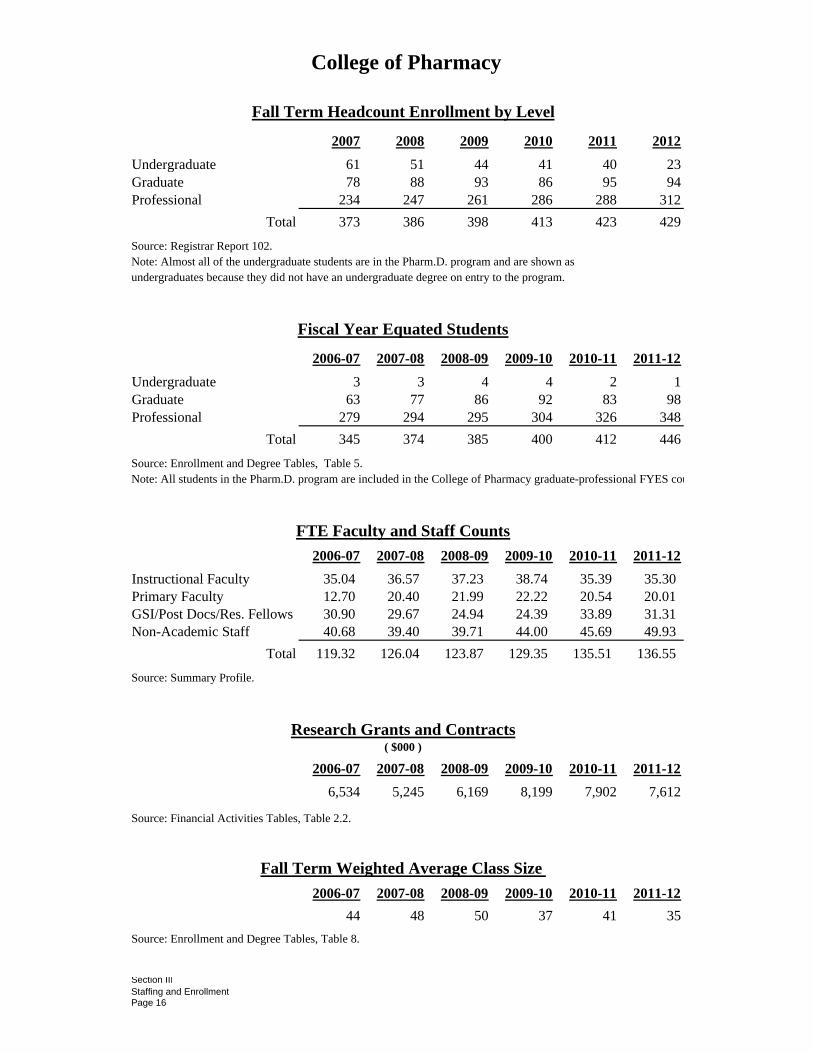
College of Pharmacy
Fall Term Headcount Enrollment by Level
2007 2008 2009 2010 2011 2012
Undergraduate 61 51 44 41 40 23Graduate 78 88 93 86 95 94Professional 234 247 261 286 288 312
Total 373 386 398 413 423 429Source: Registrar Report 102. Note: Almost all of the undergraduate students are in the Pharm.D. program and are shown as undergraduates because they did not have an undergraduate degree on entry to the program.
Fiscal Year Equated Students
2006-07 2007-08 2008-09 2009-10 2010-11 2011-12
Undergraduate 3 3 4 4 2 1Graduate 63 77 86 92 83 98Professional 279 294 295 304 326 348
Total 345 374 385 400 412 446Source: Enrollment and Degree Tables, Table 5. Note: All students in the Pharm.D. program are included in the College of Pharmacy graduate-professional FYES cou
FTE Faculty and Staff Counts
2006-07 2007-08 2008-09 2009-10 2010-11 2011-12
Instructional Faculty 35.04 36.57 37.23 38.74 35.39 35.30 Primary Faculty 12.70 20.40 21.99 22.22 20.54 20.01 GSI/Post Docs/Res. Fellows 30.90 29.67 24.94 24.39 33.89 31.31 Non-Academic Staff 40.68 39.40 39.71 44.00 45.69 49.93
Total 119.32 126.04 123.87 129.35 135.51 136.55 Source: Summary Profile.
Research Grants and Contracts( $000 )
2006-07 2007-08 2008-09 2009-10 2010-11 2011-12
6,534 5,245 6,169 8,199 7,902 7,612
Source: Financial Activities Tables, Table 2.2.
Fall Term Weighted Average Class Size
2006-07 2007-08 2008-09 2009-10 2010-11 2011-12
44 48 50 37 41 35Source: Enrollment and Degree Tables, Table 8.
Section IIIStaffing and EnrollmentPage 16

School of Public Health
Fall Term Headcount Enrollment by Level
2007 2008 2009 2010 2011 2012
Undergraduate -- -- -- -- -- --Graduate 858 864 904 944 975 991Graduate Joint Program -- -- -- -- -- 21Professional -- -- -- -- -- --
Total 858 864 904 944 975 1,012Source: Registrar Report 102. Note: Joint Programs are shown in both Schools/Colleges, but only once in the Summary.
Fiscal Year Equated Students
2006-07 2007-08 2008-09 2009-10 2010-11 2011-12
Undergraduate 10 10 8 28 50 50Graduate 947 1,010 1,018 1,030 1,077 1,137Professional -- -- -- -- -- --
Total 957 1,020 1,026 1,058 1,128 1,187Source: Enrollment and Degree Tables, Table 5.
FTE Faculty and Staff Counts
2006-07 2007-08 2008-09 2009-10 2010-11 2011-12
Instructional Faculty 99.50 95.42 103.01 101.45 103.70 112.31 Primary Faculty 25.82 27.69 24.93 30.21 31.33 30.81 GSI/Post Docs/Res. Fellows 91.46 87.09 92.84 95.14 111.23 111.77 Non-Academic Staff 249.57 259.12 272.95 289.21 294.21 306.59
Total 466.35 469.32 493.73 516.01 540.47 561.48 Source: Summary Profile.
Research Grants and Contracts( $000 )
2006-07 2007-08 2008-09 2009-10 2010-11 2011-12
53,774 56,795 69,825 64,609 90,036 82,195
Source: Financial Activities Tables, Table 2.2.
Fall Term Weighted Average Class Size
2006-07 2007-08 2008-09 2009-10 2010-11 2011-12
31 32 31 31 33 30Source: Enrollment and Degree Tables, Table 8.
Section IIIStaffing and EnrollmentPage 17
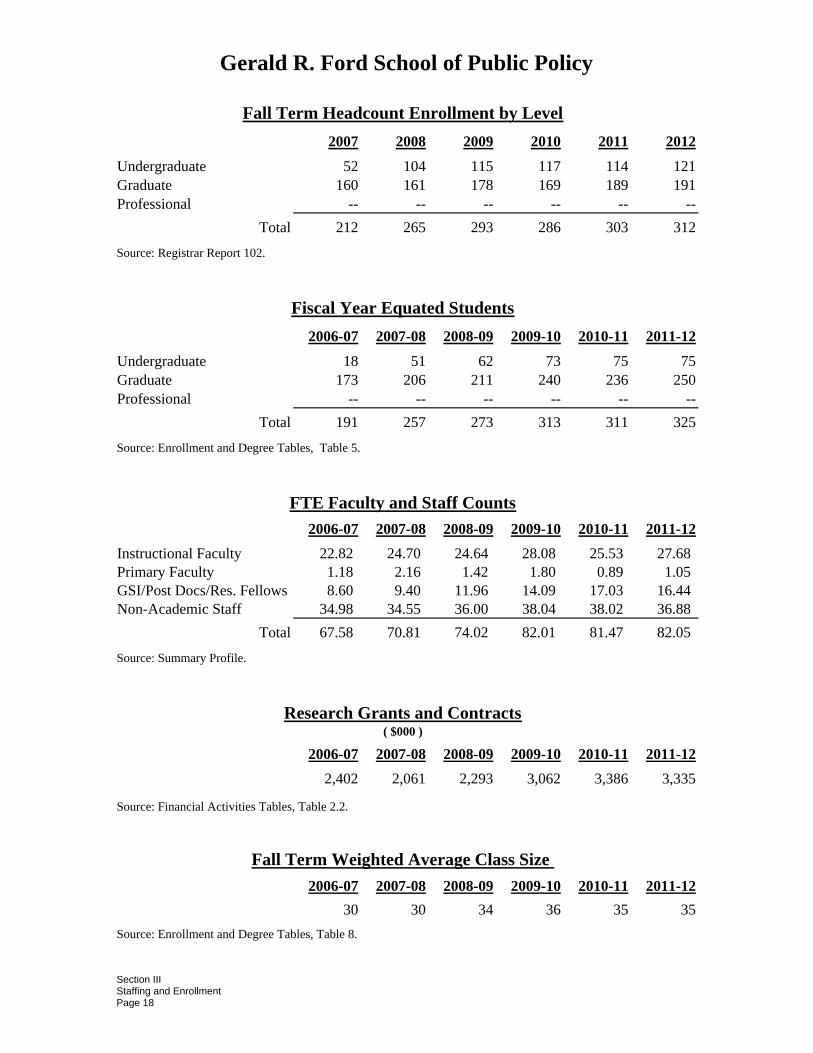
Gerald R. Ford School of Public Policy
Fall Term Headcount Enrollment by Level
2007 2008 2009 2010 2011 2012
Undergraduate 52 104 115 117 114 121Graduate 160 161 178 169 189 191Professional -- -- -- -- -- --
Total 212 265 293 286 303 312
Source: Registrar Report 102.
Fiscal Year Equated Students
2006-07 2007-08 2008-09 2009-10 2010-11 2011-12
Undergraduate 18 51 62 73 75 75Graduate 173 206 211 240 236 250Professional -- -- -- -- -- --
Total 191 257 273 313 311 325
Source: Enrollment and Degree Tables, Table 5.
FTE Faculty and Staff Counts
2006-07 2007-08 2008-09 2009-10 2010-11 2011-12
Instructional Faculty 22.82 24.70 24.64 28.08 25.53 27.68 Primary Faculty 1.18 2.16 1.42 1.80 0.89 1.05 GSI/Post Docs/Res. Fellows 8.60 9.40 11.96 14.09 17.03 16.44 Non-Academic Staff 34.98 34.55 36.00 38.04 38.02 36.88
Total 67.58 70.81 74.02 82.01 81.47 82.05
Source: Summary Profile.
Research Grants and Contracts( $000 )
2006-07 2007-08 2008-09 2009-10 2010-11 2011-12
2,402 2,061 2,293 3,062 3,386 3,335
Source: Financial Activities Tables, Table 2.2.
Fall Term Weighted Average Class Size
2006-07 2007-08 2008-09 2009-10 2010-11 2011-12
30 30 34 36 35 35Source: Enrollment and Degree Tables, Table 8.
Section IIIStaffing and EnrollmentPage 18
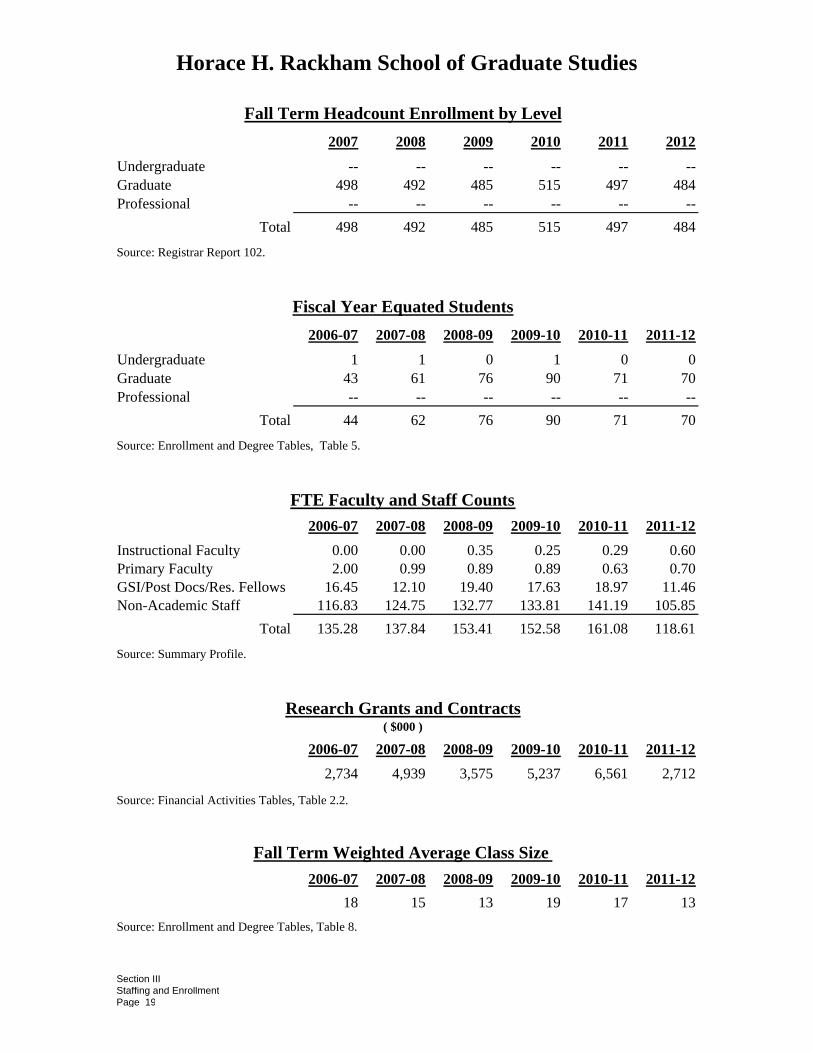
Horace H. Rackham School of Graduate Studies
Fall Term Headcount Enrollment by Level
2007 2008 2009 2010 2011 2012
Undergraduate -- -- -- -- -- --Graduate 498 492 485 515 497 484Professional -- -- -- -- -- --
Total 498 492 485 515 497 484
Source: Registrar Report 102.
Fiscal Year Equated Students
2006-07 2007-08 2008-09 2009-10 2010-11 2011-12
Undergraduate 1 1 0 1 0 0Graduate 43 61 76 90 71 70Professional -- -- -- -- -- --
Total 44 62 76 90 71 70
Source: Enrollment and Degree Tables, Table 5.
FTE Faculty and Staff Counts
2006-07 2007-08 2008-09 2009-10 2010-11 2011-12
Instructional Faculty 0.00 0.00 0.35 0.25 0.29 0.60Primary Faculty 2.00 0.99 0.89 0.89 0.63 0.70GSI/Post Docs/Res. Fellows 16.45 12.10 19.40 17.63 18.97 11.46Non-Academic Staff 116.83 124.75 132.77 133.81 141.19 105.85
Total 135.28 137.84 153.41 152.58 161.08 118.61
Source: Summary Profile.
Research Grants and Contracts( $000 )
2006-07 2007-08 2008-09 2009-10 2010-11 2011-12
2,734 4,939 3,575 5,237 6,561 2,712
Source: Financial Activities Tables, Table 2.2.
Fall Term Weighted Average Class Size
2006-07 2007-08 2008-09 2009-10 2010-11 2011-12
18 15 13 19 17 13Source: Enrollment and Degree Tables, Table 8.
Section IIIStaffing and EnrollmentPage 19

School of Social Work
Fall Term Headcount Enrollment by Level
2007 2008 2009 2010 2011 2012
Undergraduate -- -- -- -- -- --Graduate 582 552 535 557 596 622Professional -- -- -- -- -- --
Total 582 552 535 557 596 622Source: Registrar Report 102.
Fiscal Year Equated Students
2006-07 2007-08 2008-09 2009-10 2010-11 2011-12
Undergraduate 5 2 3 5 13 16Graduate 786 768 751 750 817 869Professional -- -- -- -- -- --
Total 791 771 754 755 830 884Source: Enrollment and Degree Tables, Table 5.
FTE Faculty and Staff Counts
2006-07 2007-08 2008-09 2009-10 2010-11 2011-12
Instructional Faculty 53.51 52.44 57.74 56.92 57.70 59.72 Primary Faculty 6.57 7.32 3.10 3.01 3.95 2.16 GSI/Post Docs/Res. Fellows 7.15 4.65 7.15 10.58 11.80 12.74 Non-Academic Staff 69.49 58.82 54.07 56.98 63.87 61.81
Total 136.72 123.23 122.06 127.49 137.32 136.43 Source: Summary Profile.
Research Grants and Contracts( $000 )
2006-07 2007-08 2008-09 2009-10 2010-11 2011-12
4,695 3,591 3,802 4,239 3,708 3,811
Source: Financial Activities Tables, Table 2.2.
Fall Term Weighted Average Class Size
2006-07 2007-08 2008-09 2009-10 2010-11 2011-12
24 24 21 20 21 21Source: Enrollment and Degree Tables, Table 8.
Section IIIStaffing and EnrollmentPage 20

Section IV
Facility Assessment

Section IV Facility Assessment 1
FACILITY ASSESSMENT University of Michigan Space Management In February 2007, the University of Michigan began a multi-year, campus wide Space Utilization Initiative to explore how Ann Arbor campus building space was used, lead the campus toward better utilization of existing General Fund space, and limit the need for building expansion. The initiative explored effective use of all types of space, including instructional, research, office, and food venue space in existing and planned facilities and put in place a foundation of space policies, business processes, resources and tools that are now used across the Ann Arbor campus. Some of the key accomplishments for the space initiative included:
• Implementing disciplined processes that helped slow the growth of new General Fund space to an average compound annual growth rate of 0.35 percent per year, down from an average compound annual growth rate of 2.02 percent from the previous decade.
• Shifting the campus culture to one where space is considered more of an institutional resource that must be shared and managed effectively for the good of the institution.
• Repurposing underutilized or low-quality space for higher priority uses. Examples include renovating a number of low-quality, basement classrooms into a test-taking center for students with special test-taking needs and repurposing a vacant university-owned warehouse into a building for various collections.
• Establishing institutional policies that communicate how classrooms, research space, offices, and food service venues should be assigned or used.
• Implementing target goals for classroom time utilization (70 percent) and seat utilization (65 percent) to enable the campus to monitor and manage classrooms more efficiently.
• Implementing a policy that requires all general purpose classrooms to be shared campus-wide between the hours of 8 a.m. and 5 p.m.
With this foundation now in place, the formal Space Utilization Initiative was ended in September 2011. The work, however, has been absorbed into everyday campus operations and remains an important element to monitor and consider in the university’s effort to contain operating costs. The university owns approximately 3,245 acres of property within the Ann Arbor area and approximately 17,870 acres in out-state areas (most within the State of Michigan). An inventory of the university’s physical properties, as well as a detailed listing of each owned facility within and proximate to the Ann Arbor campus, can be found in Section VII, Physical Property Inventory and Specific Building Information. The specific building information is a report generated by utilizing the following attribute data contained in our Space Management System: Building Number, Building Name, Building Type, Gross Square Feet, Net Assignable Square Feet, Acquired Date and/or Construction Date,
Section IV Facility Assessment 2
Original Cost (the initial acquisition or construction cost of a building), and Replacement Cost. Facility Condition Assessment (FCA) Program The University of Michigan’s Facility Condition Assessment Program fully evaluates buildings on campus in an effort to identify infrastructure deficiencies and establish a priority for funding renovations and repairs. The objective of the program is to develop and maintain a 5-year model for buildings showing facility related needs (projects) and tracking the status of each project through completion. The model only considers the highest of priority needs and spreads such needs over a 5-year period. Needs addressed in the database include building components and systems: architectural, structural, civil, mechanical, electrical, life safety and fire protection, environmental health, and building accessibility. The database provides a good baseline of the overall condition of General Fund buildings as well as the facilities for Housing, Athletics, Student Affairs, and the Hospitals and Health Centers. Overall, the FCA program provides a platform to implement an ongoing system of identification and prioritization of capital repair projects at the University of Michigan. A description of the Facility Condition Assessment Program Report is included in Section VIII, FCA Program. Campus Parking Structure Assessment To complement the information in the FCA Program, the University of Michigan every five years engages a parking restoration consultant to assess the condition of the existing parking structures within the system to develop a system-wide maintenance program that serves as a guide for future repairs and cost estimates (adjusted for inflation). While the university continually plans for parking on campus, we also develop strategies for alternative transportation modes. Some examples include expanded bicycle access, ride share programs, and potential for high-capacity transit systems partnered with the City of Ann Arbor. The existing parking system provides more than 27,000 parking spaces to academic, hospital, and operating staff as well as students, visitors, and other university community members. The university has 13 parking structures, and jointly participated with the City of Ann Arbor in the construction of the city’s Forest Street Parking Structure (the university owns one-third), that provide approximately 11,000 parking spaces. In February 2012 the university and City of Ann Arbor mutually agreed to suspend work on the Fuller Road Station, an intermodal facility. The city is working to obtain federal funding to pursue building a train station at the same site and calling it the Ann Arbor Station. This decision prompted the university to move forward with the Wall Street East Parking Structure project that had been put on hold when the Fuller Road Station project began. The Wall Street East Parking Structure, which will provide a net 530 additional parking spaces on the northwest side of the Medical Center Campus, is anticipated to begin construction in early 2013 and open in 2014. Opportunities for

Section IV Facility Assessment 3
additional parking development near the Medical Center Campus are also being studied. The parking structures on campus vary in both type of construction, level of previous repairs and current condition. In the past few decades the university has conducted major renovation projects in most of the older facilities. Major repairs to the North Entrance Parking Structure are scheduled for 2013, as well as waterproofing and stair repairs at the NCRC structure. Other planned improvements include guardrail replacement at the Church Street structure and interior painting and relighting of the original Thompson Street structure. Based on the parking facility condition report of 2006 and a follow-up study in 2010, planning has begun on a program to replace the two elevators in the Glen Avenue structure, one each in 2013 and 2014. Other planned improvements at the Glen Avenue structure include interior painting and lighting replacement. Projects completed during 2012 included concrete repairs begun in 2011 at the Thompson Street original structure, concrete beam and column repairs at the Catherine Street and Church Street structures, waterproofing repairs at the East Medical Center Drive and Cardiovascular Center structures, and interior painting at the East Medical Center Drive structure. Repairs and upgrades to the fire suppression systems and drain pipes at several decks were also initiated and are underway. Improving on the sustainability of the university’s parking facilities continues to be a key goal. In 2010 and 2011, new programmable fluorescent lighting systems were installed in the Hill Street and Thayer Street structures that reduced energy consumption by an average of 52 percent. Similar systems are planned for the Thompson Street and Glen Avenue structures. Energy improvements will be made at the Palmer Drive parking structure with the replacement of expensive to operate metal halide lighting with lower-wattage, long-lasting induction fixtures. This project will take advantage of DTE rebates available in 2013 for installation of energy efficient fixtures. The university is considering an exploration of the potential benefit of a public-private partnership to the university and its employees through a lease of the parking assets to a private parking operator. University Sustainability Initiatives Just as the University of Michigan is committed to a breadth and depth of research, teaching, and health care, we are also committed to institutionalize campus sustainability. The university’s Ann Arbor campus includes 3,244 acres, more than 700 buildings encompassing 34.5 million gsf of infrastructure, 43,000 students, and 35,800 employees. A significant amount of resources are required to support this system resulting in a large environmental impact, justifying the development of a comprehensive strategy to minimize our environmental footprint.
Section IV Facility Assessment 4
As important as it is for U-M physical operations to reduce its own impact on the environment, the most fundamental contribution that the university will make to world sustainability will come from the research of our faculty and education of our students that creates a future path for environmental progress. What links both together is the opportunity for the campus to serve as both a model for advanced sustainability practices, and a laboratory for students and faculty to test new ideas and approaches. The living-learning laboratory theme leads us to focus on strategies that decrease the university’s environmental footprint in measurable ways while creating hands-on experiences for our students. For more than 100 years, U-M faculty, staff and students have worked hard to preserve our natural environment by implementing innovative programs, many of which have received significant national recognition. In October 2009, President Mary Sue Coleman continued the commitment toward sustainability by creating the Office of Campus Sustainability and endorsing an effort to set university-wide goals that were developed using an Integrated Assessment (IA) framework. The IA process involved teams of faculty, staff, and students focused on an intense two year effort that produced a set of guiding principles and campus-wide goals which were presented and endorsed by an Executive Council chaired by President Coleman. To further U-M excellence in the field of environmental sustainability, the President and Executive Officers have implemented an organizational framework to accomplish the following:
• Inspire students, faculty, and staff to become involved in helping to solve the environmental sustainability issues facing the campus and the world we live in.
• Coordinate, facilitate and advance sustainability efforts in campus operations. • Coordinate, facilitate and advance sustainability efforts in university academics. • Connect academic and operations activities to foster collaborative sustainability
learning. At the heart of this organizational structure is collaboration between the Office of Campus Sustainability and the Graham Environmental Sustainability Institute. Together, these units work to advance sustainability at the university by connecting operational efforts to research and learning opportunities whenever possible and practical. Utilities Assessment Utilities master planning assessments are routinely completed to determine if the necessary production and distribution systems for steam, natural gas, water, sanitary and storm sewers, electricity, and chilled water are in place to support the facilities needed to accomplish our academic and research missions. Projects are identified and implemented annually from these assessments. A study is currently under way to perform a feasibility and risk assessment on the concept of expanding the exiting Central Power Plant to add additional combined cycle power generation. The study will provide the information necessary for the university to
Section IV Facility Assessment 5
determine if the addition is economically and environmentally in the best interest of the university. The addition would provide approximately 40 percent of the 2025 sustainability CO2 reduction goal. The study is due to be completed the summer of 2013. The University of Michigan and the Ann Arbor Fire Department have been working together to identify and coordinate fire lane routes that optimize access to buildings while minimizing the instances where a fire truck will need to drive over an underground structure such as a steam tunnel. Currently four projects are being programmed and included in the utility capital plan to increase the load rating of select tunnel sections that could be used for fire truck access: water mains under Ingalls Mall, near Stone Road, Cram Circle, and Bonisteel Boulevard. Water, sewer, and storm water master planning efforts have routinely been conducted over the years. Projects that come out of these planning activities are prioritized into a capital plan. Over the next five years the following projects are anticipated to take place: water main on Ingalls Mall, loop service near Stone Road, water main on Cram Circle, and water main on Bonisteel Boulevard. The university is also working with the city to model the storm and sanitary systems on Central Campus in the hope of developing a long term plan for addressing a number of legacy issues that have existed for years, including a storm water line in the Coliseum Building parking lot.

Section V
Implementation Plan

Section V Implementation Plan 1
IMPLEMENTATION PLAN Campus Planning Over the last several years, the University of Michigan (U-M) has experienced tremendous growth in new academic, research and clinical initiatives. We have maintained a strategic focus on an exemplary student experience, resulting in a rigorous building renewal program for our residential halls. We have also executed a significant renovation and expansion program for athletic facilities to address the aging condition of heritage structures, and to provide new amenities needed to remain competitive with our peers. Thus, the trend in recent years has been on new growth, expansion of existing programs and facilities, and reinvestment in our existing physical plant to meet the robust needs of our campus community. Growth in the research enterprise is anticipated to continue. There will likely be steady limited growth in the College of Engineering and the College of Literature, Science and the Arts, with more significant growth anticipated in Medical School research. Some growth is also being experienced by the Schools of Dentistry, Public Health and Kinesiology. The North Campus Research Complex (NCRC), containing 28 buildings enclosing 2 million gross square feet of high quality research facilities and administrative space, continues to provide unprecedented opportunity for the university to fulfill current and future needs for its research activities in health, biomedical sciences and other disciplines, and facilitate interactions, without the enormous expense of building similar facilities. Now part of North Campus, the complex sits contiguous to the sub-campus area partially occupied by the College of Engineering (CoE) and its associated research facilities. The co-location of the CoE, and the close proximity of the Medical Center Campus, with the NCRC creates a rich and dynamic hub for future interdisciplinary opportunities. As of September 2012, nearly 1,700 occupants are located ay NCRC, which approximates 50 percent of the total capacity of the site. At least 17 U-M schools and colleges are represented at NCRC, including the Medical School, College of Engineering, School of Public Health, College of Pharmacy and School of Dentistry. Initiatives located at NCRC include the Cardiovascular Research Program, the Translational Oncology Program, the Institute for Healthcare Policy and Innovation, and BioInterfaces. While research activities are anticipated to remain ongoing, growth pressures on academic space are anticipated to slow significantly. The university’s Space Utilization Initiative (described in Section IV), focuses on converting underutilized classrooms into more productive campus spaces. These efforts will likely result in higher utilization of existing classrooms, and greater use of current campus facilities as a whole. With the addition of the North Campus Research Complex and significant growth pressures for additional clinical space, the University Planner’s Office brought major campus units into a comprehensive Integrated Planning effort. Integrated Planning
Section V Implementation Plan 2
ensures efficient resource allocation and identifies immediate, short-term and longer-term needs and planning opportunities. The comprehensive master plan, expected to be completed late in 2012 or early 2013, will guide future land use planning and capacity targets, functional use requirements, transportation and pedestrian circulation, open space and recreational resources, and utility support. The comprehensive nature of this process ensures alignment between all units, and enables a vigorous vetting of all types of planning issues. The effort to enhance transportation between campuses continues. The university responded to this need by conducting a Transportation Technology Forum in March 2010. This forum brought together transportation operators, researchers and vendors along with local, state and federal agencies and explored technology modes that might best meet U-M and community needs. The forum was a collaborative effort with faculty, staff, student and public participation. Studies of potential technologies continues. A second transportation initiative recently completed is the Ann Arbor North-South Connector Study, which is a joint effort between the City of Ann Arbor, the Downtown Development Authority (DDA), the Ann Arbor Transportation Authority (AATA), and the University of Michigan. The goal of this study was to evaluate the feasibility of different types of transportation systems that could best meet the future needs of our community. The high capacity corridor as studied generally extends from Central Campus to the Medical Center Campus, North Campus and East Medical Campus. This “signature corridor” study was completed in 2011 and concluded that enough trips exist today between campuses to support a new transit technology. A second phase of study for this corridor to determine the best alignment and type of technology will continue in partnership with the city, DDA and AATA. A third important mobility project, currently on hold, is the Fuller Road Station, a joint project between the City of Ann Arbor and the university. Plans called for the facility to be located on a parcel of land owned by the city just north of the Medical Center Campus on Fuller Road. The proposed project was to include a parking structure that would provide parking for U-M employees and the community, bike parking, and a transit center for U-M and AATA bus service. It might also include the relocation of the existing Ann Arbor Amtrak train station to the site, train platforms, and potential elevated connections to the University Hospital and a stop on the high capacity connector line. Because this project has been put on hold by the City of Ann Arbor, the U-M has proceeded with the design of a parking structure on Wall Street. Construction is anticipated to begin in early 2013, and the structure will open in late 2014. These transportation enhancements will complement ongoing strategic planning occurring within the University of Michigan Health System (UMHS). The UMHS has identified needs for additional patient beds, and for converting existing double rooms into single rooms, thereby compounding the additional need for more beds. With the opening of the new Mott Children’s Hospital and Von Voigtlander Women’s Hospital, planning is in progress for renovating the former Children’s and Women’s Hospitals facilities into an adult Neuroscience Hospital.
Section V Implementation Plan 3
The university continues to focus on ways to improve the quality of campus life and the overall student experience, with emphasis on locations and adjacencies, as well as the selection and organization of programs, services, offices, housing facilities, retail and amenities. In addition, strategies continue to be developed to address facility needs for Recreational Sports and the University Unions. Renovation and renewal of priority heritage buildings is in early planning to determine cost, funding and potential sequencing. An additional focus has been the next phase of the Residential Life Initiative (RLI). The university has the sixth largest campus housing system in the United States, with eighteen residence halls that house more than 9,500 students (one-third of the undergraduate student body) in 2.9 million square feet of space. In response to the aging condition of many of the residence halls, the university implemented its Residential Life Initiative (RLI), a comprehensive capital plan to address significant immediate building renewal of existing residence halls as well as new facilities for housing and dining. This included renovation of several heritage facilities as well as the construction of the first residence hall in more than forty years, North Quadrangle. The second phase of this renewal program (RLI II) is currently being implemented. An extensive renovation of Alice Lloyd Hall was completed this year and it reopened in August 2012. Renovation of East Quadrangle is underway and will be completed late summer 2013. Renovation of the Lawyers’ Club and John Cook Building residential facilities are also in process. Future renovations are being planned for West Quadrangle and South Quadrangle as part of our continued commitment to the reinvestment in our heritage residence halls. The Athletic Department continues efforts to address facility needs. Renovation of the Crisler Center was recently completed, and an addition to the same building is under construction. Also recently completed was a project that upgraded spectator seating and other improvements of fan amenities in Yost Ice Arena. In addition, renovation of the entrance and museum areas of Schembechler Hall is in design. And programming is underway for a new team facility and stadium for field hockey, as well as a new team facility for softball, among others as further described below. Infrastructure planning continues as a critical component of our master plan. As the university continues to refine short-term and long-term facility needs, requirements for additional power, chilled water, domestic water, storm water, etc., will evolve. We also anticipate a continued transformation to a more technology rich campus environment, which will certainly influence ongoing infrastructure requirements. Several new projects are anticipated over the next five years across the Ann Arbor campus. These projects are in various stages of planning, design or construction. Coordination of these projects is of highest priority to university planning. Storm water management, parking and transit requirements, and safe/efficient pedestrian circulation remain high priority design components with each upcoming project.
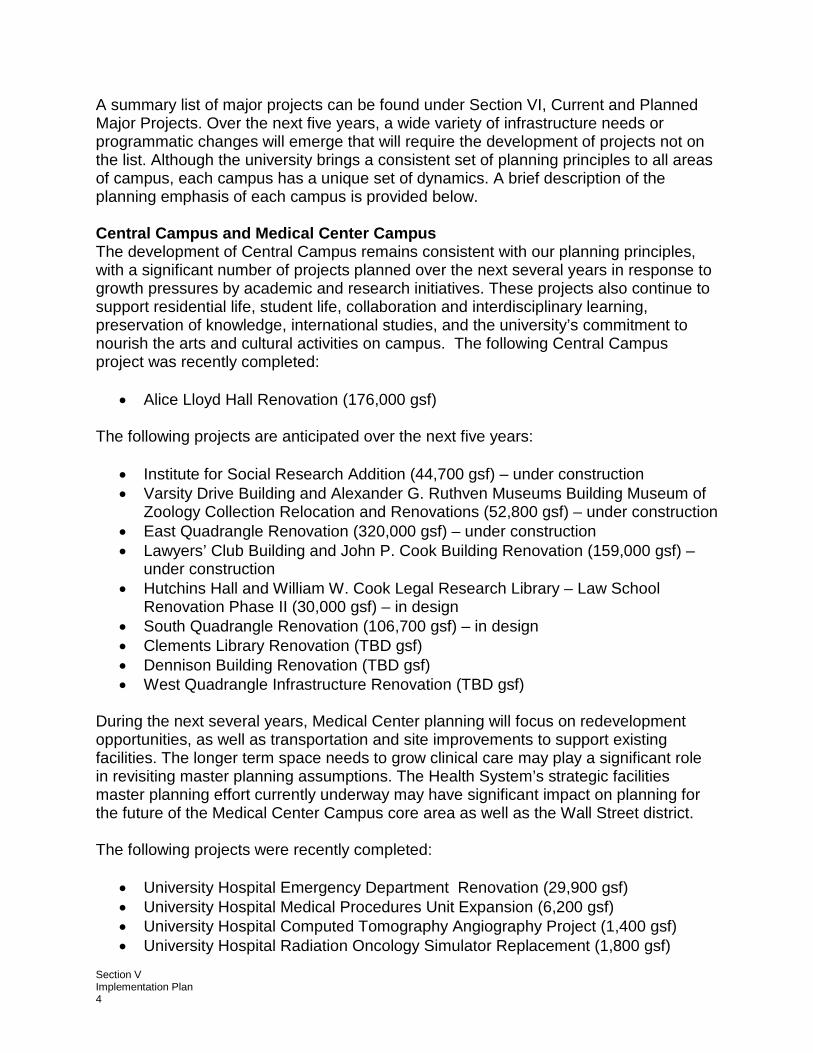
Section V Implementation Plan 4
A summary list of major projects can be found under Section VI, Current and Planned Major Projects. Over the next five years, a wide variety of infrastructure needs or programmatic changes will emerge that will require the development of projects not on the list. Although the university brings a consistent set of planning principles to all areas of campus, each campus has a unique set of dynamics. A brief description of the planning emphasis of each campus is provided below. Central Campus and Medical Center Campus The development of Central Campus remains consistent with our planning principles, with a significant number of projects planned over the next several years in response to growth pressures by academic and research initiatives. These projects also continue to support residential life, student life, collaboration and interdisciplinary learning, preservation of knowledge, international studies, and the university’s commitment to nourish the arts and cultural activities on campus. The following Central Campus project was recently completed:
• Alice Lloyd Hall Renovation (176,000 gsf) The following projects are anticipated over the next five years:
• Institute for Social Research Addition (44,700 gsf) – under construction • Varsity Drive Building and Alexander G. Ruthven Museums Building Museum of
Zoology Collection Relocation and Renovations (52,800 gsf) – under construction • East Quadrangle Renovation (320,000 gsf) – under construction • Lawyers’ Club Building and John P. Cook Building Renovation (159,000 gsf) –
under construction • Hutchins Hall and William W. Cook Legal Research Library – Law School
Renovation Phase II (30,000 gsf) – in design • South Quadrangle Renovation (106,700 gsf) – in design • Clements Library Renovation (TBD gsf) • Dennison Building Renovation (TBD gsf) • West Quadrangle Infrastructure Renovation (TBD gsf)
During the next several years, Medical Center planning will focus on redevelopment opportunities, as well as transportation and site improvements to support existing facilities. The longer term space needs to grow clinical care may play a significant role in revisiting master planning assumptions. The Health System’s strategic facilities master planning effort currently underway may have significant impact on planning for the future of the Medical Center Campus core area as well as the Wall Street district. The following projects were recently completed:
• University Hospital Emergency Department Renovation (29,900 gsf) • University Hospital Medical Procedures Unit Expansion (6,200 gsf) • University Hospital Computed Tomography Angiography Project (1,400 gsf) • University Hospital Radiation Oncology Simulator Replacement (1,800 gsf)
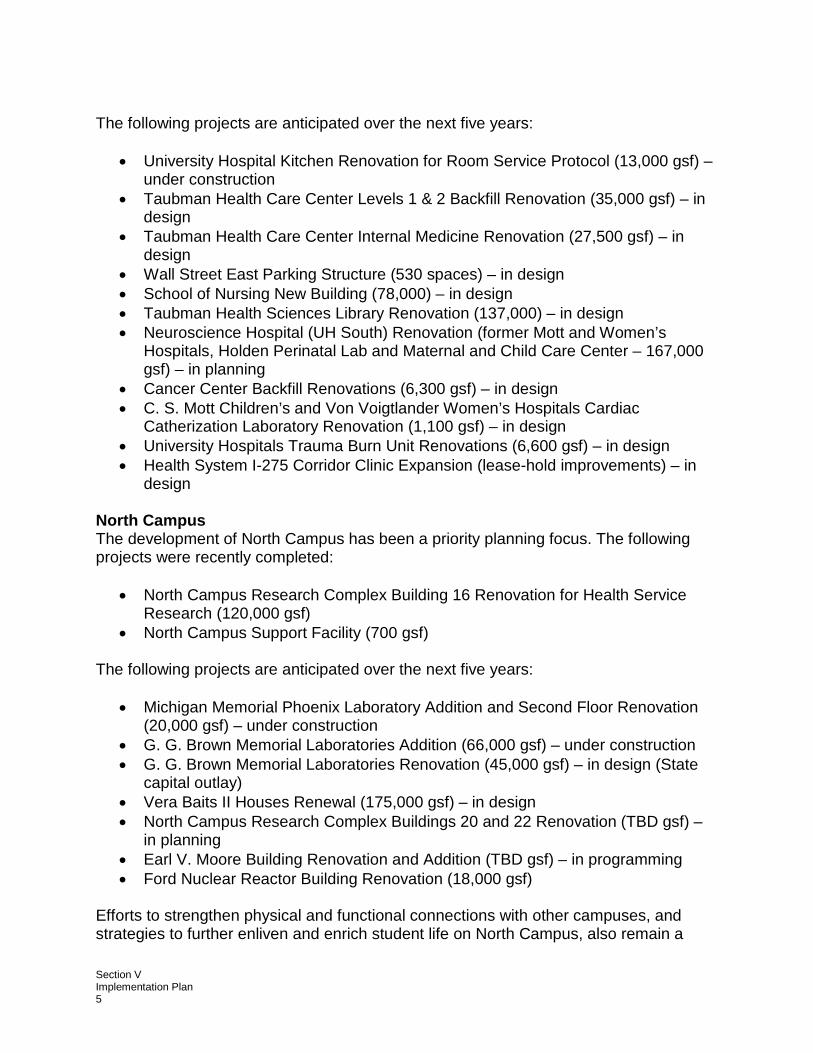
Section V Implementation Plan 5
The following projects are anticipated over the next five years:
• University Hospital Kitchen Renovation for Room Service Protocol (13,000 gsf) –
under construction • Taubman Health Care Center Levels 1 & 2 Backfill Renovation (35,000 gsf) – in
design • Taubman Health Care Center Internal Medicine Renovation (27,500 gsf) – in
design • Wall Street East Parking Structure (530 spaces) – in design • School of Nursing New Building (78,000) – in design • Taubman Health Sciences Library Renovation (137,000) – in design • Neuroscience Hospital (UH South) Renovation (former Mott and Women’s
Hospitals, Holden Perinatal Lab and Maternal and Child Care Center – 167,000 gsf) – in planning
• Cancer Center Backfill Renovations (6,300 gsf) – in design • C. S. Mott Children’s and Von Voigtlander Women’s Hospitals Cardiac
Catherization Laboratory Renovation (1,100 gsf) – in design • University Hospitals Trauma Burn Unit Renovations (6,600 gsf) – in design • Health System I-275 Corridor Clinic Expansion (lease-hold improvements) – in
design North Campus The development of North Campus has been a priority planning focus. The following projects were recently completed:
• North Campus Research Complex Building 16 Renovation for Health Service Research (120,000 gsf)
• North Campus Support Facility (700 gsf) The following projects are anticipated over the next five years:
• Michigan Memorial Phoenix Laboratory Addition and Second Floor Renovation (20,000 gsf) – under construction
• G. G. Brown Memorial Laboratories Addition (66,000 gsf) – under construction • G. G. Brown Memorial Laboratories Renovation (45,000 gsf) – in design (State
capital outlay) • Vera Baits II Houses Renewal (175,000 gsf) – in design • North Campus Research Complex Buildings 20 and 22 Renovation (TBD gsf) –
in planning • Earl V. Moore Building Renovation and Addition (TBD gsf) – in programming • Ford Nuclear Reactor Building Renovation (18,000 gsf)
Efforts to strengthen physical and functional connections with other campuses, and strategies to further enliven and enrich student life on North Campus, also remain a
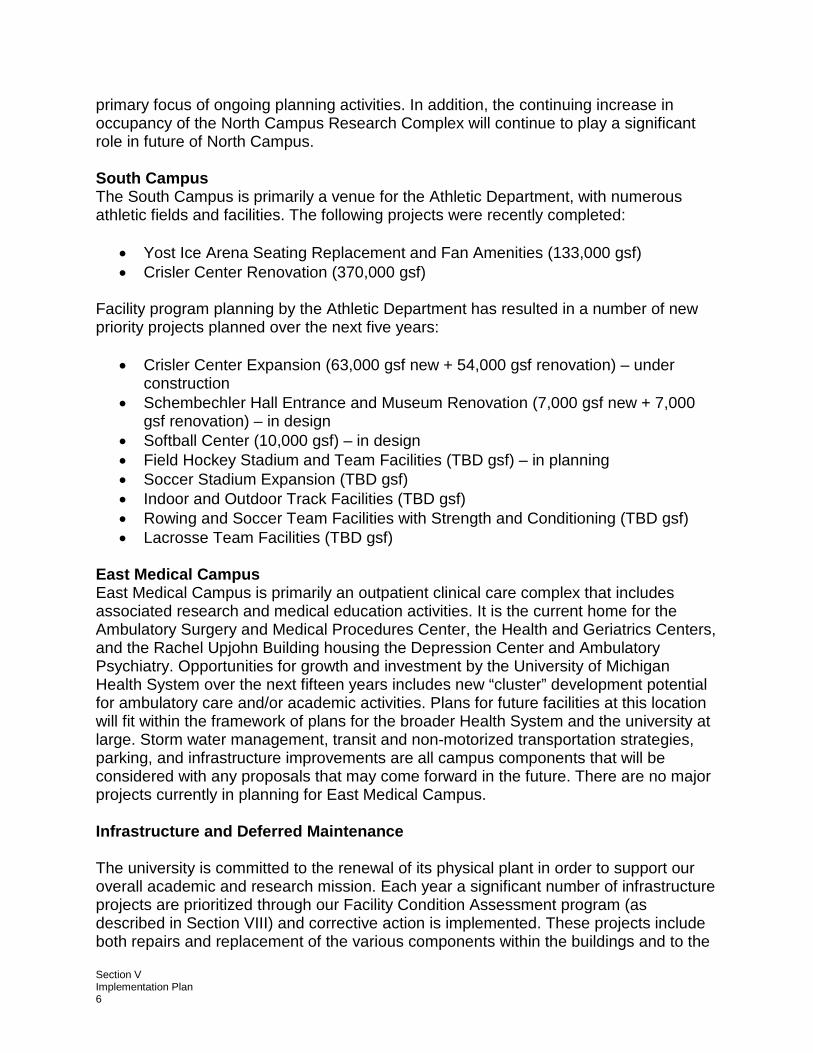
Section V Implementation Plan 6
primary focus of ongoing planning activities. In addition, the continuing increase in occupancy of the North Campus Research Complex will continue to play a significant role in future of North Campus. South Campus The South Campus is primarily a venue for the Athletic Department, with numerous athletic fields and facilities. The following projects were recently completed:
• Yost Ice Arena Seating Replacement and Fan Amenities (133,000 gsf) • Crisler Center Renovation (370,000 gsf)
Facility program planning by the Athletic Department has resulted in a number of new priority projects planned over the next five years:
• Crisler Center Expansion (63,000 gsf new + 54,000 gsf renovation) – under construction
• Schembechler Hall Entrance and Museum Renovation (7,000 gsf new + 7,000 gsf renovation) – in design
• Softball Center (10,000 gsf) – in design • Field Hockey Stadium and Team Facilities (TBD gsf) – in planning • Soccer Stadium Expansion (TBD gsf) • Indoor and Outdoor Track Facilities (TBD gsf) • Rowing and Soccer Team Facilities with Strength and Conditioning (TBD gsf) • Lacrosse Team Facilities (TBD gsf)
East Medical Campus East Medical Campus is primarily an outpatient clinical care complex that includes associated research and medical education activities. It is the current home for the Ambulatory Surgery and Medical Procedures Center, the Health and Geriatrics Centers, and the Rachel Upjohn Building housing the Depression Center and Ambulatory Psychiatry. Opportunities for growth and investment by the University of Michigan Health System over the next fifteen years includes new “cluster” development potential for ambulatory care and/or academic activities. Plans for future facilities at this location will fit within the framework of plans for the broader Health System and the university at large. Storm water management, transit and non-motorized transportation strategies, parking, and infrastructure improvements are all campus components that will be considered with any proposals that may come forward in the future. There are no major projects currently in planning for East Medical Campus. Infrastructure and Deferred Maintenance The university is committed to the renewal of its physical plant in order to support our overall academic and research mission. Each year a significant number of infrastructure projects are prioritized through our Facility Condition Assessment program (as described in Section VIII) and corrective action is implemented. These projects include both repairs and replacement of the various components within the buildings and to the
Section V Implementation Plan 7
infrastructure supporting the facilities. Projects have addressed a wide variety of needs including mechanical and electrical systems, life safety systems, building control systems, structural concerns, and building enclosure items like windows, masonry, and roof structures. Many of the above projects involve major renovations to existing buildings. A planning priority is to adapt existing facilities to meet current and future program needs for the campus by updating building infrastructure and re-programming/reconfiguring existing buildings. Re-programming/reconfiguring addresses building density, program and organization adjacencies, open site use, building addition or replacement options, and redistribution of the density to other campus areas. The Capital Renewal Fund, established by the Office of the Provost, enables General Fund academic and administrative units to apply to have an aging building considered for renovation and reprogramming to address major infrastructure needs and to renew and extend the useful life of the building. The fund is used specifically for major renovations to an existing building and focuses on retaining the existing building footprint and square footage as much as possible. A key consideration during the review and selection process is how the building fits into the overall strategic vision and master plan for the physical campus. In order to guarantee a healthy and strong campus infrastructure for future generations, the university has established a standard policy on fundraising related to facilities endowments. Specifically, the university’s total fundraising goal for any new facility includes an additional amount for endowment, beyond the construction cost. The university will match, dollar for dollar, the portion of any contribution applied to the facility endowment. All endowed funds are managed by the Executive Vice President and Chief Financial Officer (CFO). The CFO’s office works closely with the users of the building to prioritize the facility needs and the uses of the endowment distributions to support capital maintenance and upkeep of the facility. Status of State Building Authority Projects (Ann Arbor) The following projects are components of our previously approved Program Statement for renewal of four buildings on the Central Campus:
• Perry Building Renovation Construction has been completed and the building is occupied.
• West Hall Renovation Construction has been completed and the building is occupied.
• Mason Hall and Haven Hall Renovation and Addition Construction has been completed and the buildings are occupied.
• Literature, Science and the Arts Building Renovation Construction has been completed and the building is occupied.
Section V Implementation Plan 8
The following projects were components of the Supplemental Capital Outlay Request approved for FY 2005:
• Observatory Lodge Renovation Construction has been completed and the building is occupied.
• Student Activities Building Renovation Construction has been completed and the building is occupied.
• Michigan Memorial Phoenix Laboratory Renovation Construction has been completed and the building is occupied.
The following project is part of the Capital Outlay Request approved for FY 2011:
• George Granger Brown Memorial Laboratories Renovation Design is in process.
Status of State Building Authority Projects (Ann Arbor) Completed Projects Lease Start Date Lease Termination Date C. C. Little Science Building Renovation
February 1997 February 2032
S. T. Dana Building Renovation November 2003 November 2038 Perry Building Renovation November 2003 November 2038 West Hall Renovation January 2005 January 2040 Mason Hall and Haven Hall Renovations and Addition
November 2005 November 2040
Literature, Science and the Arts Building Renovation
August 2007 August 2042
Observatory Lodge Renovation November 2008 November 2043 Student Activities Renovation December 2009 December 2044 Michigan Memorial Phoenix Laboratory Renovation
December 2009 December 2044
2025 Sustainability Goals and Strategies The 2025 goals are based on a 2006 baseline adopted by the Integrated Assessment process for all goals with exception of the Sustainable Food Goal as no baseline data was available. All goals will be re-evaluated in 2016 and may be adjusted to become more stringent or less stringent. Goal evaluation and adjustment will be based on many variables including but not limited to changes in technology, the State of Michigan energy platform, economics, and competing university priorities. Goal 1: Decrease campus scope 1 and 2 carbon dioxide emissions by 25 percent. This goals focuses on U-M’s very efficient Central Power Plant and the buildings which it heats, cools, and electrifies; purchased power and increasing the percentage of renewable energy in our energy portfolio; increasing efficiency of new construction and

Section V Implementation Plan 9
renovated facilities; and behavior change in the campus population directly impacting how our facilities are used. Goal 1 successes to date: • Planet Blue Operations Teams – One way the university is addressing the growth in
building energy demands is through the Plant Blue Operations Teams program, which actively engages the university community to conserve utilities thereby saving money and benefiting the environment. At the conclusion of FY2012, 130 general fund buildings had been put through the program resulting in an overall average energy savings of 8.1 percent and an annual utility cost avoidance of almost $4.1M.
• DTE Solar Partnership – the university has entered into an agreement with DTE in a partnership arrangement to install approximately 600kW of ground based solar arrays on North Campus. The arrays will be in two primary locations and provide an opportunity for educational interaction and display public support for sustainable energy projects for the state.
Our design guidelines and standard practices challenge architects to exceed the minimum baseline energy performance mandated by codes. Typical standard energy savings measures employed include additional insulation in foundation walls, exterior walls, and roof assemblies; energy efficient windows/glazing; occupancy sensors to reduce lighting levels; variable water flow controls; resetting of space temperatures based on occupancy sensors; and exhaust heat recovery. The U-M Design Guidelines for Design and Construction outline the institution’s detailed requirements related to energy efficiency as well as sustainable design and environmental stewardship. Goal 2: Decrease carbon intensity of passenger trips on U-M transportation options by 30 percent. The university aims to reduce emissions associated with transportation by modeling and promoting sustainable transportation alternatives, such as public mass transit, car pools and van pools, and bike programs. Goal 2 successes to date: • GreenRide is a web-based ride-matching system that helps university commuters
find carpool/vanpool partners by searching for other employees who live nearby and have similar schedules. Over 3,000 employees have registered since the program launched in May 2008. The GreenRide program reduces the load on campus parking infrastructure, vehicle maintenance, and vehicle depreciation expenses. It reduces parking and campus traffic congestion and vehicle emissions, and contributes to the improvement of air quality.
• U-M Sponsored Vanpool system has entered its tenth decade of operation, with 600 employees participating in 95 vanpools.
• The university operates the largest alternative fuel fleet in the state with 1,078 total vehicles that includes 15 all electrical, 56 gas-electric hybrid, 526 fueled with E-85 ethanol, 89 B-20 bio-diesel fueled trucks and buses, and 7 diesel-electric hybrid buses.

Section V Implementation Plan 10
Goal 3: Reduce waste tonnage diverted to disposal facilities by 40 percent. Strategies include:
• Reduce the use of disposable paper products. • Install multi-function recycling receptacles in all dormitories, classrooms,
conference rooms, labs, appropriate common spaces, and athletic venues. • Continue to expand the Sustainable Laboratory Program reducing chemical
waste disposal. • Work with university vendors to reduce packaging materials and minimum
volume orders to reduce waste. Goal 4: Protect Huron River water quality by reducing runoff from impervious surfaces and reducing the volume of land management chemicals used on campus by 40 percent The campus landscape is a critical part of the university’s commitment to responsible environmental stewardship. The U-M has a legacy of landscape planning that is sensitive to water-use and inputs to the regional Huron River Watershed. Strategies include:
• Apply an integrated landscaping approach that recognizes vegetation, soils, pavement systems, and storm water management as interlinked, and helps to restore the quality and capacity of the regional Huron River watershed.
• Minimize use of potable water for irrigation, increase water retained for beneficial purposes on campus, and improve the quality of water outflow.
• Reduce water use for infrastructure to the maximum extent possible. • Reduce storm water runoff through on-site mitigation techniques such as rain
gardens, storm water retention basins, or green roofs, when appropriate. • Minimize irrigation through the use of drought resistant plantings and properly
selected soils. Goal 5: Purchase 20 percent of U-M food in accordance with the U-M Sustainable Food Purchasing Guidelines. The U-M purchases food for dozens of licensed food operations on campus, including athletic event related food operations, campus eateries, Residential Dining Services, University Unions, and the U-M Health System. University food service operations purchase approximately 80 percent of all food items from a prime vendor managed through Purchasing Services. While not always the case, the sustainability of food generally increases as the distance it travels from the point of harvest to consumption decreases. Minimizing transportation and refrigeration generally reduces fossil fuel consumption and carbon dioxide emissions. Local food also requires fewer preservatives and less packaging. In addition, local production often employs a more diverse crop strategy, which reduces pest
Section V Implementation Plan 11
susceptibility and the need for pesticide and chemical fertilizer use. Finally, supporting local farmers and growers keeps money circulating within the community longer and directly profits local producers. Action Item: Community Awareness – We will pursue stakeholder engagement, education, and evaluation strategies toward a campus-wide ethic of sustainability. The success of achieving the goals in the plan will require the active contribution of every member of the university community. We cannot delegate responsibilities to a handful of departments. Rather, we must change behaviors as well as policies and practices.

Section VI
Current and Planned Projects
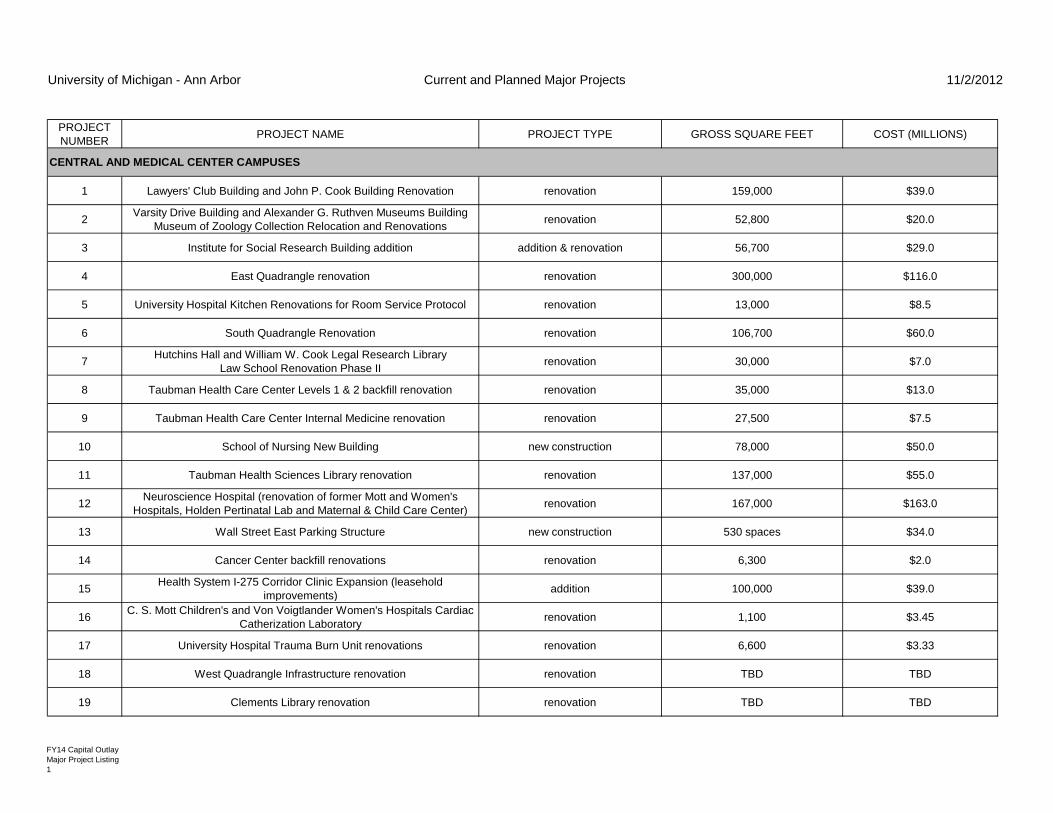
University of Michigan - Ann Arbor Current and Planned Major Projects 11/2/2012
FY14 Capital OutlayMajor Project Listing1
PROJECT NUMBER PROJECT NAME PROJECT TYPE GROSS SQUARE FEET COST (MILLIONS)
1 Lawyers' Club Building and John P. Cook Building Renovation renovation 159,000 $39.0
2 Varsity Drive Building and Alexander G. Ruthven Museums Building Museum of Zoology Collection Relocation and Renovations renovation 52,800 $20.0
3 Institute for Social Research Building addition addition & renovation 56,700 $29.0
4 East Quadrangle renovation renovation 300,000 $116.0
5 University Hospital Kitchen Renovations for Room Service Protocol renovation 13,000 $8.5
6 South Quadrangle Renovation renovation 106,700 $60.0
7 Hutchins Hall and William W. Cook Legal Research LibraryLaw School Renovation Phase II renovation 30,000 $7.0
8 Taubman Health Care Center Levels 1 & 2 backfill renovation renovation 35,000 $13.0
9 Taubman Health Care Center Internal Medicine renovation renovation 27,500 $7.5
10 School of Nursing New Building new construction 78,000 $50.0
11 Taubman Health Sciences Library renovation renovation 137,000 $55.0
12 Neuroscience Hospital (renovation of former Mott and Women's Hospitals, Holden Pertinatal Lab and Maternal & Child Care Center) renovation 167,000 $163.0
13 Wall Street East Parking Structure new construction 530 spaces $34.0
14 Cancer Center backfill renovations renovation 6,300 $2.0
15 Health System I-275 Corridor Clinic Expansion (leasehold improvements) addition 100,000 $39.0
16 C. S. Mott Children's and Von Voigtlander Women's Hospitals Cardiac Catherization Laboratory renovation 1,100 $3.45
17 University Hospital Trauma Burn Unit renovations renovation 6,600 $3.33
18 West Quadrangle Infrastructure renovation renovation TBD TBD
19 Clements Library renovation renovation TBD TBD
CENTRAL AND MEDICAL CENTER CAMPUSES

University of Michigan - Ann Arbor Current and Planned Major Projects 11/2/2012
FY14 Capital OutlayMajor Project Listing2
PROJECT NUMBER PROJECT NAME PROJECT TYPE GROSS SQUARE FEET COST (MILLIONS)
20 Dennison Building renovation renovation TBD TBD
1 G. G. Brown Memorial Laboratories addition addition 62,500 $46.0
2 Michigan Memorial Phoenix Project Laboratory addition and Second Floor renovation addition & renovation 20,000 $11.1
3 Vera Baits II Houses Renewal renovation 175,000 $11.95
4 G. G. Brown Memorial Laboratories renovation renovation 220,000 $47.00
5 North Campus Research Complex Buildings 20 and 22 renovations renovation TBD TBD
6 Earl V. Moore Building addition addition TBD TBD
7 Ford Nuclear Reactor Building Renovation renovation 18,000 TBD
1 Crisler Center expansion addition & renovation 117,000 $52.0
2 Schembechler Hall Entrance and Museum renovation addition & renovation 7,000 $9.0
3 Softball Center new construction 10,000 $4.0
4 Field Hockey Stadium and Team Facilities new construction TBD TBD
5 Soccer Stadium expansion addition TBD TBD
6 Indoor and Outdoor Track Facilities new construction TBD TBD
7 Rowing and Soccer Team Facilities with Strength and Conditioning new construction TBD TBD
8 Lacrosse Team Facilities new construction TBD TBD
[no major projects currently in planning]
NORTH CAMPUS
SOUTH CAMPUS
EAST MEDICAL CAMPUS AND EAST ANN ARBOR PROPERTIES

Section VII
Physical Property Inventory and
Specific Building Information

UNIVERSITY OF MICHIGAN - PHYSICAL PROPERTIESYear Ended June 30,2012
Balance Balance Acreage June 30, 2011 Additions Disposals June 30, 2012LAND:
Ann Arbor Area:General:
Original Campus...................................………….. 40.30 160,000.00$ 160,000.00$ North Campus......................................……….…. 676.75 1,388,550.51 1,388,550.51 Ann Street deck ……………….. 0.40 2,524,448.75 2,524,448.75 Arboretum........................…….…….…................... 94.50 11,044.13 11,044.13 Botanical Gardens............…............................ 341.76 487,836.70 487,836.70 Burton Memorial Tower......….......................... 0.20 9,706.22 9,706.22 BSRB Building............................... 0.49 62,305.47 62,305.47 Broadway 910........................................ 0.15 91,600.00 91,600.00 Cornwell Place, 1009 & 1013............................... 0.77 492,829.00 492,829.00 Davidson, William Hall.......…….……..…….......... 2.13 237,210.11 237,210.11 Dennison, David M............……........................ 1.09 61,865.00 61,865.00 Dental Building and W.K. Kellogg Institute........... 3.40 54,147.86 54,147.86 East Hall.................................................... 1.91 141,301.00 141,301.00 Education, School of................................. 3.86 307,083.01 307,083.01 Felch Park........................................... 2.30 35,000.00 35,000.00 Fleming Administration Building...................... 0.30 104,571.99 104,571.99 Glen Street 206……………………… 0.06 425,255.22 425,255.22 Glen Street 202…………………… 0.07 474,639.36 474,639.36 Glen Street 210……………………… 0.07 112,600.00 112,600.00 Hill Auditorium...................................... 1.30 30,250.00 30,250.00 1007 E. Huron St. & 1027 E. Huron St....................... 0.81 15,691.78 15,691.78 Inglis Property, Highland Road....................... 9.17 26,666.98 26,666.98 Kresge site...................................... 2.38 115,858.51 115,858.51 Lane Hall............................................ 0.48 50,000.00 50,000.00 Law Quadrangle........................................ 7.20 881,607.47 881,607.47 Literature, Science and the Arts Building............ 2.24 264,919.41 264,919.41 Little, Clarence Cook, Science Building.............. 3.13 292,237.75 292,237.75 Maiden Lane 1024..................... 0.15 70,200.00 70,200.00 Main St./Keech Property..................... 3.15 2,518,864.44 2,518,864.44 Mental Health Research Institute..................... 0.53 46,920.05 46,920.05 Mitchell Field....................................... 62.50 36,000.00 36,000.00 Modern Languages Building............................ 1.60 415,479.92 415,479.92 Museums Building..................................... 3.06 223,829.84 223,829.84 NCRC Property Parcel A………… 60.27 1,587,916.00 1,587,916.00 NCRC Property Parcel B………… 30.00 780,015.00 780,015.00 NCRC Property Parcel C………… 54.23 1,468,987.00 1,468,987.00 NCRC Property Parcel D………… 29.02 818,291.00 818,291.00 Newberry Hall........................................ 0.20 26,400.00 26,400.00 News Service Building.................................… 0.30 35,111.24 35,111.24 North Hall........................................... 4.50 17,500.00 17,500.00 North Ingalls Street Property........................ 5.13 869,634.05 869,634.05 North Quad ……............................ 2.11 244,000.00 244,000.00 Palmer Drive Buildings............................ 1.62 39,927.30 39,927.30 Oakland Property 726………………………….. 0.20 155,000.00 155,000.00 Oakland Property 712………………………. 0.20 96,200.00 96,200.00 Oakland Property 716………………………….. 0.14 138,000.00 Observatory, Campus.................................. 1.99 6,430.00 6,430.00 Perry Building....................................... 1.25 150,430.00 150,430.00 Pound, Madelon, House................................ 0.40 10,000.00 10,000.00 Power Center for the Performing Arts................. 0.79 102,281.63 102,281.63 Public Health Building, School of.................... 2.64 188,834.90 188,834.90 Rackham, Horace H., School of Graduate Studies...... 3.60 485,136.65 485,136.65 Recreational Sports.................................. 22.87 430,468.71 430,468.71 Scattered Lots....................................... 180.42 7,106,953.31 7,106,953.31 Side Track Right-of-Way.............................. 8.72 25,983.41 25,983.41 Simpson, Thomas Henry, Memorial Institute............ 2.18 1,330.38 1,330.38 Social Research, Institute for....................... 1.20 580,562.06 580,562.06 South Division St 405.............................................. 0.12 255,556.42 - 255,556.42 South Division St 417.............................................. 0.09 240,200.00 240,200.00 South Division St 439.............................................. 0 84,556.42 - 84,556.42 South Division 507 0.07 409,625.93 409,625.93 South Division 513 0.10 480,706.73 480,706.73 Student Activities Building.......................... 1.21 296,711.52 296,711.52 Vaughan, Victor, House............................... 1.03 3,440.12 3,440.12 Wall Street 953 …………………. 0.20 43,400.00 43,400.00 Wall Street 963 …………………. 0.12 66,363.05 - 66,363.05 Wall Street 1041 …………………. 0.26 254,916.44 254,916.44 Wall Street 1025………………………. 0.07 55,000.00 55,000.00 Wall Street 1059 0.19 162,600.00 162,600.00 Wolverine Tower Property............................. 13.34 2,893,537.17 2,893,537.17
Total Ann Arbor Area-General ..........................… 1,699.10 32,404,326.92 378,200.00 - 32,644,526.92
Page 1 of 2
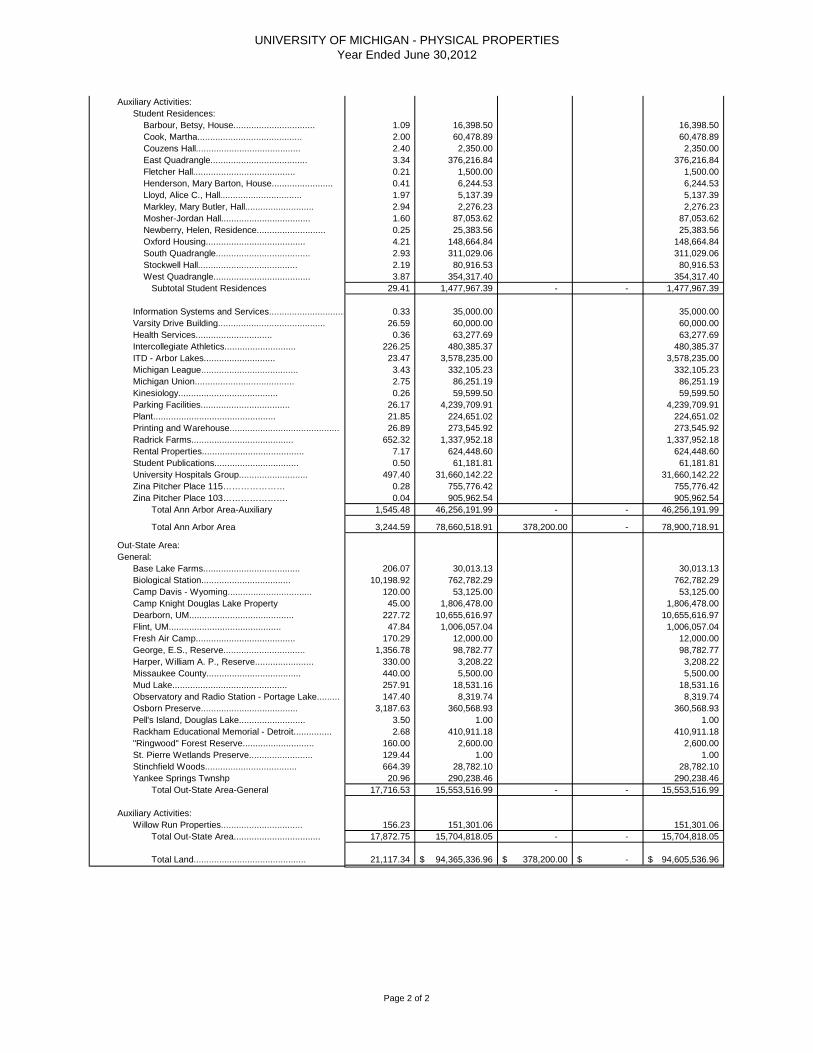
UNIVERSITY OF MICHIGAN - PHYSICAL PROPERTIESYear Ended June 30,2012
Auxiliary Activities: Student Residences:
Barbour, Betsy, House................................ 1.09 16,398.50 16,398.50 Cook, Martha......................................... 2.00 60,478.89 60,478.89 Couzens Hall......................................... 2.40 2,350.00 2,350.00 East Quadrangle...................................... 3.34 376,216.84 376,216.84 Fletcher Hall........................................ 0.21 1,500.00 1,500.00 Henderson, Mary Barton, House........................ 0.41 6,244.53 6,244.53 Lloyd, Alice C., Hall................................ 1.97 5,137.39 5,137.39 Markley, Mary Butler, Hall........................... 2.94 2,276.23 2,276.23 Mosher-Jordan Hall................................... 1.60 87,053.62 87,053.62 Newberry, Helen, Residence........................... 0.25 25,383.56 25,383.56 Oxford Housing....................................... 4.21 148,664.84 148,664.84 South Quadrangle..................................... 2.93 311,029.06 311,029.06 Stockwell Hall....................................... 2.19 80,916.53 80,916.53 West Quadrangle...................................... 3.87 354,317.40 354,317.40
Subtotal Student Residences 29.41 1,477,967.39 - - 1,477,967.39
Information Systems and Services.............................. 0.33 35,000.00 35,000.00 Varsity Drive Building.......................................... 26.59 60,000.00 60,000.00 Health Services.............................. 0.36 63,277.69 63,277.69 Intercollegiate Athletics............................ 226.25 480,385.37 480,385.37 ITD - Arbor Lakes............................ 23.47 3,578,235.00 3,578,235.00 Michigan League...................................... 3.43 332,105.23 332,105.23 Michigan Union....................................... 2.75 86,251.19 86,251.19 Kinesiology....................................... 0.26 59,599.50 59,599.50 Parking Facilities................................... 26.17 4,239,709.91 4,239,709.91 Plant................................................ 21.85 224,651.02 224,651.02 Printing and Warehouse........................................... 26.89 273,545.92 273,545.92 Radrick Farms........................................ 652.32 1,337,952.18 1,337,952.18 Rental Properties........................................ 7.17 624,448.60 624,448.60 Student Publications................................. 0.50 61,181.81 61,181.81 University Hospitals Group........................... 497.40 31,660,142.22 31,660,142.22 Zina Pitcher Place 115………………… 0.28 755,776.42 755,776.42 Zina Pitcher Place 103…………………. 0.04 905,962.54 905,962.54
Total Ann Arbor Area-Auxiliary 1,545.48 46,256,191.99 - - 46,256,191.99
Total Ann Arbor Area 3,244.59 78,660,518.91 378,200.00 - 78,900,718.91
Out-State Area:General:
Base Lake Farms...................................... 206.07 30,013.13 30,013.13 Biological Station................................... 10,198.92 762,782.29 762,782.29 Camp Davis - Wyoming................................. 120.00 53,125.00 53,125.00 Camp Knight Douglas Lake Property 45.00 1,806,478.00 1,806,478.00 Dearborn, UM......................................... 227.72 10,655,616.97 10,655,616.97 Flint, UM............................................ 47.84 1,006,057.04 1,006,057.04 Fresh Air Camp....................................... 170.29 12,000.00 12,000.00 George, E.S., Reserve................................ 1,356.78 98,782.77 98,782.77 Harper, William A. P., Reserve....................... 330.00 3,208.22 3,208.22 Missaukee County..................................... 440.00 5,500.00 5,500.00 Mud Lake............................................. 257.91 18,531.16 18,531.16 Observatory and Radio Station - Portage Lake......... 147.40 8,319.74 8,319.74 Osborn Preserve...................................... 3,187.63 360,568.93 360,568.93 Pell's Island, Douglas Lake.......................... 3.50 1.00 1.00 Rackham Educational Memorial - Detroit............... 2.68 410,911.18 410,911.18 "Ringwood" Forest Reserve............................ 160.00 2,600.00 2,600.00 St. Pierre Wetlands Preserve......................... 129.44 1.00 1.00 Stinchfield Woods.................................... 664.39 28,782.10 28,782.10 Yankee Springs Twnshp 20.96 290,238.46 290,238.46
Total Out-State Area-General 17,716.53 15,553,516.99 - - 15,553,516.99
Auxiliary Activities: Willow Run Properties................................ 156.23 151,301.06 151,301.06
Total Out-State Area.................................. 17,872.75 15,704,818.05 - - 15,704,818.05
Total Land............................................ 21,117.34 94,365,336.96$ 378,200.00$ -$ 94,605,536.96$
Page 2 of 2
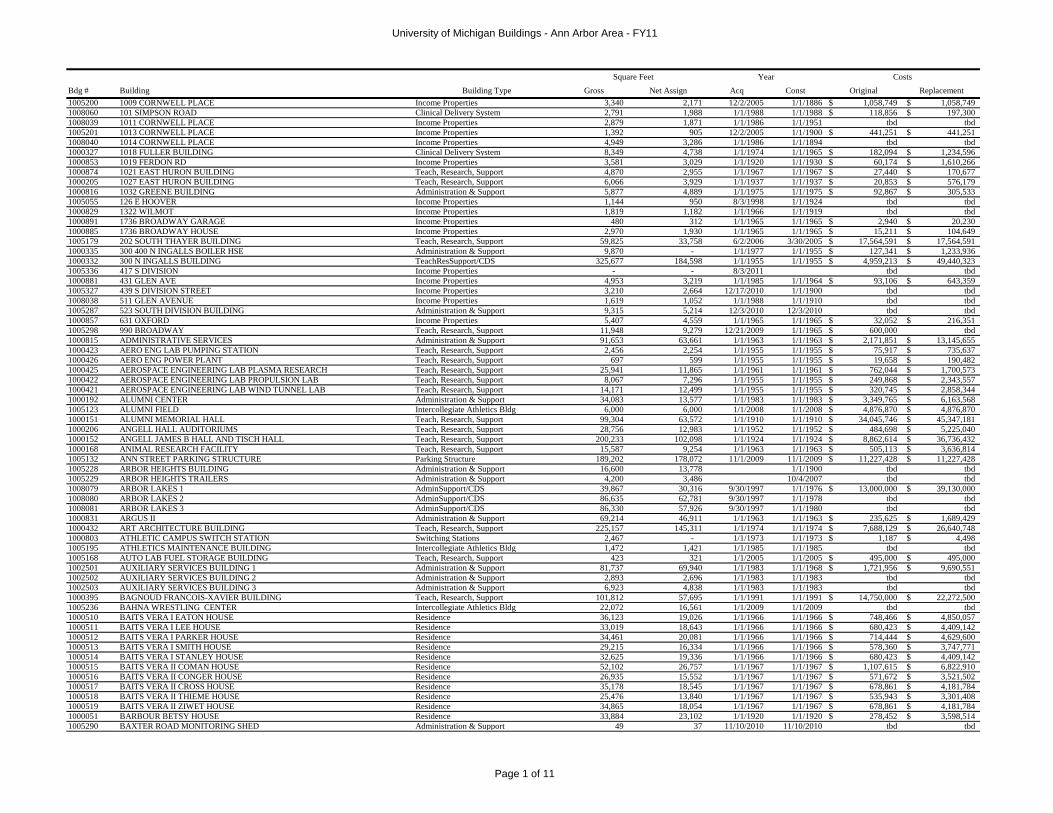
University of Michigan Buildings - Ann Arbor Area - FY11
Page 1 of 11
Bdg # Building Building Type Gross Net Assign Acq Const Original Replacement1005200 1009 CORNWELL PLACE Income Properties 3,340 2,171 12/2/2005 1/1/1886 1,058,749$ 1,058,749$ 1008060 101 SIMPSON ROAD Clinical Delivery System 2,791 1,988 1/1/1988 1/1/1988 118,856$ 197,300$ 1008039 1011 CORNWELL PLACE Income Properties 2,879 1,871 1/1/1986 1/1/1951 tbd tbd1005201 1013 CORNWELL PLACE Income Properties 1,392 905 12/2/2005 1/1/1900 441,251$ 441,251$ 1008040 1014 CORNWELL PLACE Income Properties 4,949 3,286 1/1/1986 1/1/1894 tbd tbd1000327 1018 FULLER BUILDING Clinical Delivery System 8,349 4,738 1/1/1974 1/1/1965 182,094$ 1,234,596$ 1000853 1019 FERDON RD Income Properties 3,581 3,029 1/1/1920 1/1/1930 60,174$ 1,610,266$ 1000874 1021 EAST HURON BUILDING Teach, Research, Support 4,870 2,955 1/1/1967 1/1/1967 27,440$ 170,677$ 1000205 1027 EAST HURON BUILDING Teach, Research, Support 6,066 3,929 1/1/1937 1/1/1937 20,853$ 576,179$ 1000816 1032 GREENE BUILDING Administration & Support 5,877 4,889 1/1/1975 1/1/1975 92,867$ 305,533$ 1005055 126 E HOOVER Income Properties 1,144 950 8/3/1998 1/1/1924 tbd tbd1000829 1322 WILMOT Income Properties 1,819 1,182 1/1/1966 1/1/1919 tbd tbd1000891 1736 BROADWAY GARAGE Income Properties 480 312 1/1/1965 1/1/1965 2,940$ 20,230$ 1000885 1736 BROADWAY HOUSE Income Properties 2,970 1,930 1/1/1965 1/1/1965 15,211$ 104,649$ 1005179 202 SOUTH THAYER BUILDING Teach, Research, Support 59,825 33,758 6/2/2006 3/30/2005 17,564,591$ 17,564,591$ 1000335 300 400 N INGALLS BOILER HSE Administration & Support 9,870 - 1/1/1977 1/1/1955 127,341$ 1,233,936$ 1000332 300 N INGALLS BUILDING TeachResSupport/CDS 325,677 184,598 1/1/1955 1/1/1955 4,959,213$ 49,440,323$ 1005336 417 S DIVISION Income Properties - - 8/3/2011 tbd tbd1000881 431 GLEN AVE Income Properties 4,953 3,219 1/1/1985 1/1/1964 93,106$ 643,359$ 1005327 439 S DIVISION STREET Income Properties 3,210 2,664 12/17/2010 1/1/1900 tbd tbd1008038 511 GLEN AVENUE Income Properties 1,619 1,052 1/1/1988 1/1/1910 tbd tbd1005287 523 SOUTH DIVISION BUILDING Administration & Support 9,315 5,214 12/3/2010 12/3/2010 tbd tbd1000857 631 OXFORD Income Properties 5,407 4,559 1/1/1965 1/1/1965 32,052$ 216,351$ 1005298 990 BROADWAY Teach, Research, Support 11,948 9,279 12/21/2009 1/1/1965 600,000$ tbd1000815 ADMINISTRATIVE SERVICES Administration & Support 91,653 63,661 1/1/1963 1/1/1963 2,171,851$ 13,145,655$ 1000423 AERO ENG LAB PUMPING STATION Teach, Research, Support 2,456 2,254 1/1/1955 1/1/1955 75,917$ 735,637$ 1000426 AERO ENG POWER PLANT Teach, Research, Support 697 599 1/1/1955 1/1/1955 19,658$ 190,482$ 1000425 AEROSPACE ENGINEERING LAB PLASMA RESEARCH Teach, Research, Support 25,941 11,865 1/1/1961 1/1/1961 762,044$ 1,700,573$ 1000422 AEROSPACE ENGINEERING LAB PROPULSION LAB Teach, Research, Support 8,067 7,296 1/1/1955 1/1/1955 249,868$ 2,343,557$ 1000421 AEROSPACE ENGINEERING LAB WIND TUNNEL LAB Teach, Research, Support 14,171 12,499 1/1/1955 1/1/1955 320,745$ 2,858,344$ 1000192 ALUMNI CENTER Administration & Support 34,083 13,577 1/1/1983 1/1/1983 3,349,765$ 6,163,568$ 1005123 ALUMNI FIELD Intercollegiate Athletics Bldg 6,000 6,000 1/1/2008 1/1/2008 4,876,870$ 4,876,870$ 1000151 ALUMNI MEMORIAL HALL Teach, Research, Support 99,304 63,572 1/1/1910 1/1/1910 34,045,746$ 45,347,181$ 1000206 ANGELL HALL AUDITORIUMS Teach, Research, Support 28,756 12,983 1/1/1952 1/1/1952 484,698$ 5,225,040$ 1000152 ANGELL JAMES B HALL AND TISCH HALL Teach, Research, Support 200,233 102,098 1/1/1924 1/1/1924 8,862,614$ 36,736,432$ 1000168 ANIMAL RESEARCH FACILITY Teach, Research, Support 15,587 9,254 1/1/1963 1/1/1963 505,113$ 3,636,814$ 1005132 ANN STREET PARKING STRUCTURE Parking Structure 189,202 178,072 11/1/2009 11/1/2009 11,227,428$ 11,227,428$ 1005228 ARBOR HEIGHTS BUILDING Administration & Support 16,600 13,778 1/1/1900 tbd tbd1005229 ARBOR HEIGHTS TRAILERS Administration & Support 4,200 3,486 10/4/2007 tbd tbd1008079 ARBOR LAKES 1 AdminSupport/CDS 39,867 30,316 9/30/1997 1/1/1976 13,000,000$ 39,130,000$ 1008080 ARBOR LAKES 2 AdminSupport/CDS 86,635 62,781 9/30/1997 1/1/1978 tbd tbd1008081 ARBOR LAKES 3 AdminSupport/CDS 86,330 57,926 9/30/1997 1/1/1980 tbd tbd1000831 ARGUS II Administration & Support 69,214 46,911 1/1/1963 1/1/1963 235,625$ 1,689,429$ 1000432 ART ARCHITECTURE BUILDING Teach, Research, Support 225,157 145,311 1/1/1974 1/1/1974 7,688,129$ 26,640,748$ 1000803 ATHLETIC CAMPUS SWITCH STATION Switching Stations 2,467 - 1/1/1973 1/1/1973 1,187$ 4,498$ 1005195 ATHLETICS MAINTENANCE BUILDING Intercollegiate Athletics Bldg 1,472 1,421 1/1/1985 1/1/1985 tbd tbd1005168 AUTO LAB FUEL STORAGE BUILDING Teach, Research, Support 423 321 1/1/2005 1/1/2005 495,000$ 495,000$ 1002501 AUXILIARY SERVICES BUILDING 1 Administration & Support 81,737 69,940 1/1/1983 1/1/1968 1,721,956$ 9,690,551$ 1002502 AUXILIARY SERVICES BUILDING 2 Administration & Support 2,893 2,696 1/1/1983 1/1/1983 tbd tbd1002503 AUXILIARY SERVICES BUILDING 3 Administration & Support 6,923 4,838 1/1/1983 1/1/1983 tbd tbd1000395 BAGNOUD FRANCOIS-XAVIER BUILDING Teach, Research, Support 101,812 57,695 1/1/1991 1/1/1991 14,750,000$ 22,272,500$ 1005236 BAHNA WRESTLING CENTER Intercollegiate Athletics Bldg 22,072 16,561 1/1/2009 1/1/2009 tbd tbd1000510 BAITS VERA I EATON HOUSE Residence 36,123 19,026 1/1/1966 1/1/1966 748,466$ 4,850,057$ 1000511 BAITS VERA I LEE HOUSE Residence 33,019 18,643 1/1/1966 1/1/1966 680,423$ 4,409,142$ 1000512 BAITS VERA I PARKER HOUSE Residence 34,461 20,081 1/1/1966 1/1/1966 714,444$ 4,629,600$ 1000513 BAITS VERA I SMITH HOUSE Residence 29,215 16,334 1/1/1966 1/1/1966 578,360$ 3,747,771$ 1000514 BAITS VERA I STANLEY HOUSE Residence 32,625 19,336 1/1/1966 1/1/1966 680,423$ 4,409,142$ 1000515 BAITS VERA II COMAN HOUSE Residence 52,102 26,757 1/1/1967 1/1/1967 1,107,615$ 6,822,910$ 1000516 BAITS VERA II CONGER HOUSE Residence 26,935 15,552 1/1/1967 1/1/1967 571,672$ 3,521,502$ 1000517 BAITS VERA II CROSS HOUSE Residence 35,178 18,545 1/1/1967 1/1/1967 678,861$ 4,181,784$ 1000518 BAITS VERA II THIEME HOUSE Residence 25,476 13,840 1/1/1967 1/1/1967 535,943$ 3,301,408$ 1000519 BAITS VERA II ZIWET HOUSE Residence 34,865 18,054 1/1/1967 1/1/1967 678,861$ 4,181,784$ 1000051 BARBOUR BETSY HOUSE Residence 33,884 23,102 1/1/1920 1/1/1920 278,452$ 3,598,514$ 1005290 BAXTER ROAD MONITORING SHED Administration & Support 49 37 11/10/2010 11/10/2010 tbd tbd
Square Feet Year Costs
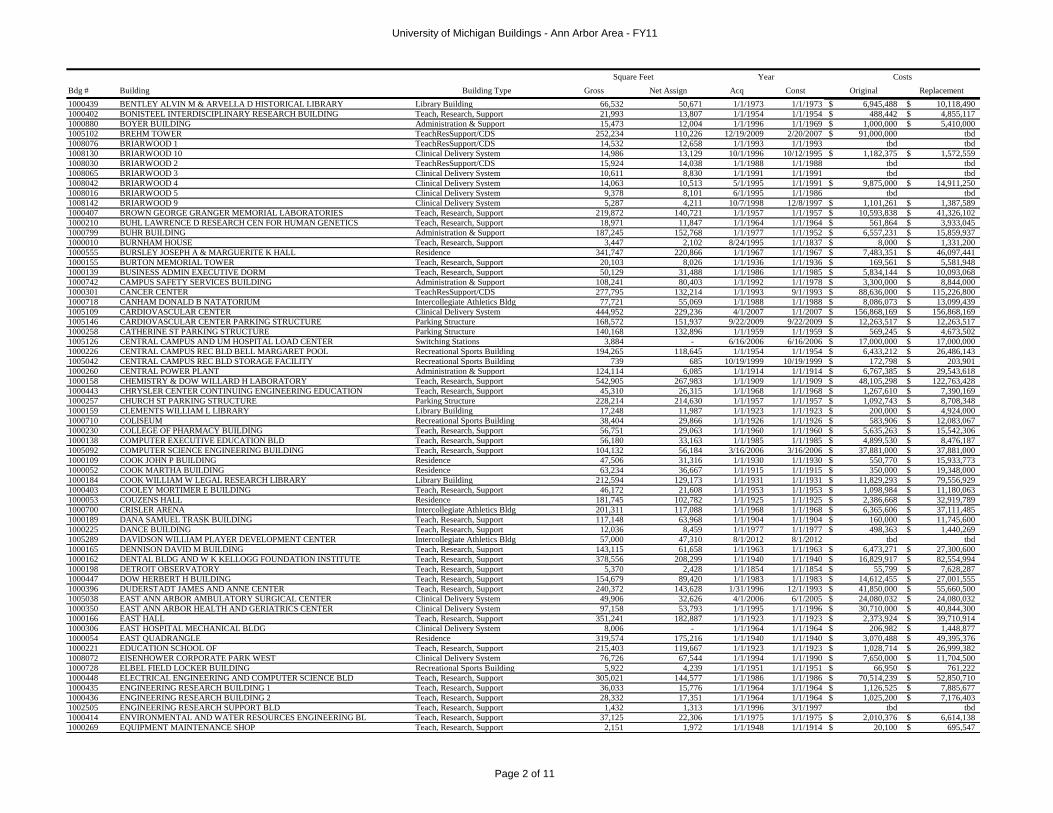
University of Michigan Buildings - Ann Arbor Area - FY11
Page 2 of 11
Bdg # Building Building Type Gross Net Assign Acq Const Original ReplacementSquare Feet Year Costs
1000439 BENTLEY ALVIN M & ARVELLA D HISTORICAL LIBRARY Library Building 66,532 50,671 1/1/1973 1/1/1973 6,945,488$ 10,118,490$ 1000402 BONISTEEL INTERDISCIPLINARY RESEARCH BUILDING Teach, Research, Support 21,993 13,807 1/1/1954 1/1/1954 488,442$ 4,855,117$ 1000880 BOYER BUILDING Administration & Support 15,473 12,004 1/1/1996 1/1/1969 1,000,000$ 5,410,000$ 1005102 BREHM TOWER TeachResSupport/CDS 252,234 110,226 12/19/2009 2/20/2007 91,000,000$ tbd1008076 BRIARWOOD 1 TeachResSupport/CDS 14,532 12,658 1/1/1993 1/1/1993 tbd tbd1008130 BRIARWOOD 10 Clinical Delivery System 14,986 13,129 10/1/1996 10/12/1995 1,182,375$ 1,572,559$ 1008030 BRIARWOOD 2 TeachResSupport/CDS 15,924 14,038 1/1/1988 1/1/1988 tbd tbd1008065 BRIARWOOD 3 Clinical Delivery System 10,611 8,830 1/1/1991 1/1/1991 tbd tbd1008042 BRIARWOOD 4 Clinical Delivery System 14,063 10,513 5/1/1995 1/1/1991 9,875,000$ 14,911,250$ 1008016 BRIARWOOD 5 Clinical Delivery System 9,378 8,101 6/1/1995 1/1/1986 tbd tbd1008142 BRIARWOOD 9 Clinical Delivery System 5,287 4,211 10/7/1998 12/8/1997 1,101,261$ 1,387,589$ 1000407 BROWN GEORGE GRANGER MEMORIAL LABORATORIES Teach, Research, Support 219,872 140,721 1/1/1957 1/1/1957 10,593,838$ 41,326,102$ 1000210 BUHL LAWRENCE D RESEARCH CEN FOR HUMAN GENETICS Teach, Research, Support 18,971 11,847 1/1/1964 1/1/1964 561,864$ 3,933,045$ 1000799 BUHR BUILDING Administration & Support 187,245 152,768 1/1/1977 1/1/1952 6,557,231$ 15,859,937$ 1000010 BURNHAM HOUSE Teach, Research, Support 3,447 2,102 8/24/1995 1/1/1837 8,000$ 1,331,200$ 1000555 BURSLEY JOSEPH A & MARGUERITE K HALL Residence 341,747 220,866 1/1/1967 1/1/1967 7,483,351$ 46,097,441$ 1000155 BURTON MEMORIAL TOWER Teach, Research, Support 20,103 8,026 1/1/1936 1/1/1936 169,561$ 5,581,948$ 1000139 BUSINESS ADMIN EXECUTIVE DORM Teach, Research, Support 50,129 31,488 1/1/1986 1/1/1985 5,834,144$ 10,093,068$ 1000742 CAMPUS SAFETY SERVICES BUILDING Administration & Support 108,241 80,403 1/1/1992 1/1/1978 3,300,000$ 8,844,000$ 1000301 CANCER CENTER TeachResSupport/CDS 277,795 132,214 1/1/1993 9/1/1993 88,636,000$ 115,226,800$ 1000718 CANHAM DONALD B NATATORIUM Intercollegiate Athletics Bldg 77,721 55,069 1/1/1988 1/1/1988 8,086,073$ 13,099,439$ 1005109 CARDIOVASCULAR CENTER Clinical Delivery System 444,952 229,236 4/1/2007 1/1/2007 156,868,169$ 156,868,169$ 1005146 CARDIOVASCULAR CENTER PARKING STRUCTURE Parking Structure 168,572 151,937 9/22/2009 9/22/2009 12,263,517$ 12,263,517$ 1000258 CATHERINE ST PARKING STRUCTURE Parking Structure 140,168 132,896 1/1/1959 1/1/1959 569,245$ 4,673,502$ 1005126 CENTRAL CAMPUS AND UM HOSPITAL LOAD CENTER Switching Stations 3,884 - 6/16/2006 6/16/2006 17,000,000$ 17,000,000$ 1000226 CENTRAL CAMPUS REC BLD BELL MARGARET POOL Recreational Sports Building 194,265 118,645 1/1/1954 1/1/1954 6,433,212$ 26,486,143$ 1005042 CENTRAL CAMPUS REC BLD STORAGE FACILITY Recreational Sports Building 739 685 10/19/1999 10/19/1999 172,798$ 203,901$ 1000260 CENTRAL POWER PLANT Administration & Support 124,114 6,085 1/1/1914 1/1/1914 6,767,385$ 29,543,618$ 1000158 CHEMISTRY & DOW WILLARD H LABORATORY Teach, Research, Support 542,905 267,983 1/1/1909 1/1/1909 48,105,298$ 122,763,428$ 1000443 CHRYSLER CENTER CONTINUING ENGINEERING EDUCATION Teach, Research, Support 45,310 26,315 1/1/1968 1/1/1968 1,267,610$ 7,390,169$ 1000257 CHURCH ST PARKING STRUCTURE Parking Structure 228,214 214,630 1/1/1957 1/1/1957 1,092,743$ 8,708,348$ 1000159 CLEMENTS WILLIAM L LIBRARY Library Building 17,248 11,987 1/1/1923 1/1/1923 200,000$ 4,924,000$ 1000710 COLISEUM Recreational Sports Building 38,404 29,866 1/1/1926 1/1/1926 583,906$ 12,083,067$ 1000230 COLLEGE OF PHARMACY BUILDING Teach, Research, Support 56,751 29,063 1/1/1960 1/1/1960 5,635,263$ 15,542,306$ 1000138 COMPUTER EXECUTIVE EDUCATION BLD Teach, Research, Support 56,180 33,163 1/1/1985 1/1/1985 4,899,530$ 8,476,187$ 1005092 COMPUTER SCIENCE ENGINEERING BUILDING Teach, Research, Support 104,132 56,184 3/16/2006 3/16/2006 37,881,000$ 37,881,000$ 1000109 COOK JOHN P BUILDING Residence 47,506 31,316 1/1/1930 1/1/1930 550,770$ 15,933,773$ 1000052 COOK MARTHA BUILDING Residence 63,234 36,667 1/1/1915 1/1/1915 350,000$ 19,348,000$ 1000184 COOK WILLIAM W LEGAL RESEARCH LIBRARY Library Building 212,594 129,173 1/1/1931 1/1/1931 11,829,293$ 79,556,929$ 1000403 COOLEY MORTIMER E BUILDING Teach, Research, Support 46,172 21,608 1/1/1953 1/1/1953 1,098,984$ 11,180,063$ 1000053 COUZENS HALL Residence 181,745 102,782 1/1/1925 1/1/1925 2,386,668$ 32,919,789$ 1000700 CRISLER ARENA Intercollegiate Athletics Bldg 201,311 117,088 1/1/1968 1/1/1968 6,365,606$ 37,111,485$ 1000189 DANA SAMUEL TRASK BUILDING Teach, Research, Support 117,148 63,968 1/1/1904 1/1/1904 160,000$ 11,745,600$ 1000225 DANCE BUILDING Teach, Research, Support 12,036 8,459 1/1/1977 1/1/1977 498,363$ 1,440,269$ 1005289 DAVIDSON WILLIAM PLAYER DEVELOPMENT CENTER Intercollegiate Athletics Bldg 57,000 47,310 8/1/2012 8/1/2012 tbd tbd1000165 DENNISON DAVID M BUILDING Teach, Research, Support 143,115 61,658 1/1/1963 1/1/1963 6,473,271$ 27,300,600$ 1000162 DENTAL BLDG AND W K KELLOGG FOUNDATION INSTITUTE Teach, Research, Support 378,556 208,299 1/1/1940 1/1/1940 16,829,917$ 82,554,994$ 1000198 DETROIT OBSERVATORY Teach, Research, Support 5,370 2,428 1/1/1854 1/1/1854 55,799$ 7,628,287$ 1000447 DOW HERBERT H BUILDING Teach, Research, Support 154,679 89,420 1/1/1983 1/1/1983 14,612,455$ 27,001,555$ 1000396 DUDERSTADT JAMES AND ANNE CENTER Teach, Research, Support 240,372 143,628 1/31/1996 12/1/1993 41,850,000$ 55,660,500$ 1005038 EAST ANN ARBOR AMBULATORY SURGICAL CENTER Clinical Delivery System 49,906 32,626 4/1/2006 6/1/2005 24,080,032$ 24,080,032$ 1000350 EAST ANN ARBOR HEALTH AND GERIATRICS CENTER Clinical Delivery System 97,158 53,793 1/1/1995 1/1/1996 30,710,000$ 40,844,300$ 1000166 EAST HALL Teach, Research, Support 351,241 182,887 1/1/1923 1/1/1923 2,373,924$ 39,710,914$ 1000306 EAST HOSPITAL MECHANICAL BLDG Clinical Delivery System 8,006 - 1/1/1964 1/1/1964 206,982$ 1,448,877$ 1000054 EAST QUADRANGLE Residence 319,574 175,216 1/1/1940 1/1/1940 3,070,488$ 49,395,376$ 1000221 EDUCATION SCHOOL OF Teach, Research, Support 215,403 119,667 1/1/1923 1/1/1923 1,028,714$ 26,999,382$ 1008072 EISENHOWER CORPORATE PARK WEST Clinical Delivery System 76,726 67,544 1/1/1994 1/1/1990 7,650,000$ 11,704,500$ 1000728 ELBEL FIELD LOCKER BUILDING Recreational Sports Building 5,922 4,239 1/1/1951 1/1/1951 66,950$ 761,222$ 1000448 ELECTRICAL ENGINEERING AND COMPUTER SCIENCE BLD Teach, Research, Support 305,021 144,577 1/1/1986 1/1/1986 70,514,239$ 52,850,710$ 1000435 ENGINEERING RESEARCH BUILDING 1 Teach, Research, Support 36,033 15,776 1/1/1964 1/1/1964 1,126,525$ 7,885,677$ 1000436 ENGINEERING RESEARCH BUILDING 2 Teach, Research, Support 28,332 17,351 1/1/1964 1/1/1964 1,025,200$ 7,176,403$ 1002505 ENGINEERING RESEARCH SUPPORT BLD Teach, Research, Support 1,432 1,313 1/1/1996 3/1/1997 tbd tbd1000414 ENVIRONMENTAL AND WATER RESOURCES ENGINEERING BL Teach, Research, Support 37,125 22,306 1/1/1975 1/1/1975 2,010,376$ 6,614,138$ 1000269 EQUIPMENT MAINTENANCE SHOP Teach, Research, Support 2,151 1,972 1/1/1948 1/1/1914 20,100$ 695,547$
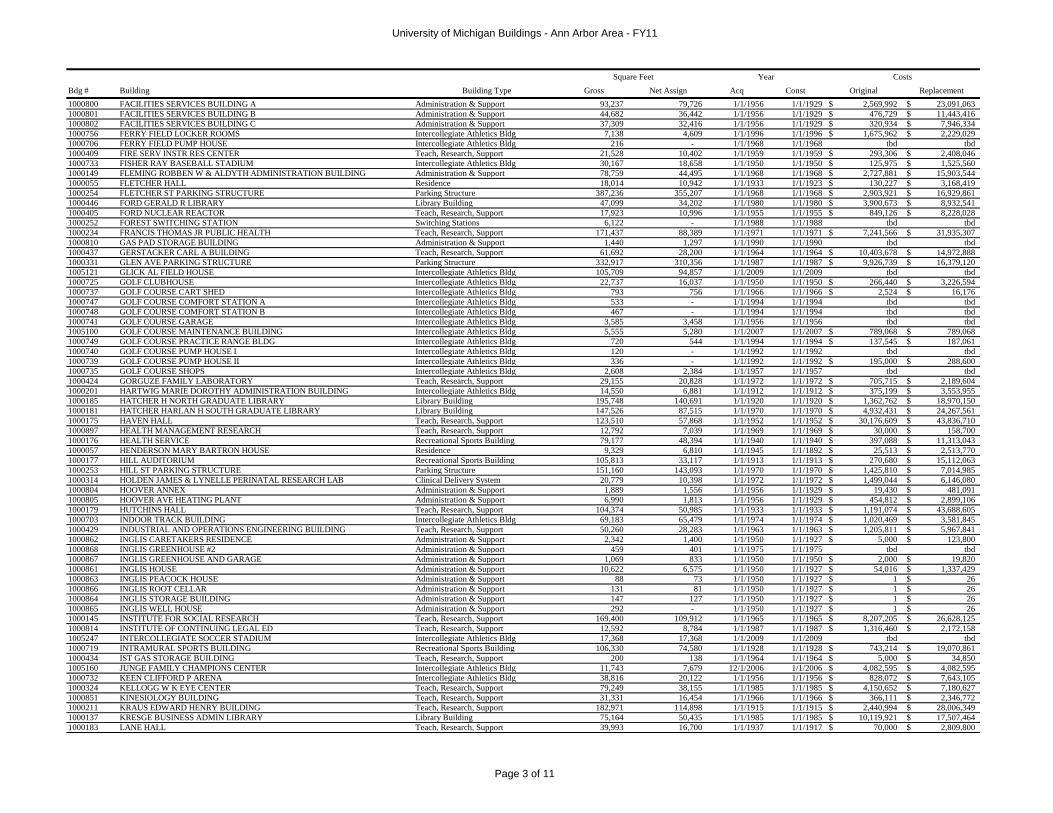
University of Michigan Buildings - Ann Arbor Area - FY11
Page 3 of 11
Bdg # Building Building Type Gross Net Assign Acq Const Original ReplacementSquare Feet Year Costs
1000800 FACILITIES SERVICES BUILDING A Administration & Support 93,237 79,726 1/1/1956 1/1/1929 2,569,992$ 23,091,063$ 1000801 FACILITIES SERVICES BUILDING B Administration & Support 44,682 36,442 1/1/1956 1/1/1929 476,729$ 11,443,416$ 1000802 FACILITIES SERVICES BUILDING C Administration & Support 37,309 32,416 1/1/1956 1/1/1929 320,934$ 7,946,334$ 1000756 FERRY FIELD LOCKER ROOMS Intercollegiate Athletics Bldg 7,138 4,609 1/1/1996 1/1/1996 1,675,962$ 2,229,029$ 1000706 FERRY FIELD PUMP HOUSE Intercollegiate Athletics Bldg 216 - 1/1/1968 1/1/1968 tbd tbd1000409 FIRE SERV INSTR RES CENTER Teach, Research, Support 21,528 10,402 1/1/1959 1/1/1959 293,306$ 2,408,046$ 1000733 FISHER RAY BASEBALL STADIUM Intercollegiate Athletics Bldg 30,167 18,658 1/1/1950 1/1/1950 125,975$ 1,525,560$ 1000149 FLEMING ROBBEN W & ALDYTH ADMINISTRATION BUILDING Administration & Support 78,759 44,495 1/1/1968 1/1/1968 2,727,881$ 15,903,544$ 1000055 FLETCHER HALL Residence 18,014 10,942 1/1/1933 1/1/1923 130,227$ 3,168,419$ 1000254 FLETCHER ST PARKING STRUCTURE Parking Structure 387,236 355,207 1/1/1968 1/1/1968 2,903,921$ 16,929,861$ 1000446 FORD GERALD R LIBRARY Library Building 47,099 34,202 1/1/1980 1/1/1980 3,900,673$ 8,932,541$ 1000405 FORD NUCLEAR REACTOR Teach, Research, Support 17,923 10,996 1/1/1955 1/1/1955 849,126$ 8,228,028$ 1000252 FOREST SWITCHING STATION Switching Stations 6,122 - 1/1/1988 1/1/1988 tbd tbd1000234 FRANCIS THOMAS JR PUBLIC HEALTH Teach, Research, Support 171,437 88,389 1/1/1971 1/1/1971 7,241,566$ 31,935,307$ 1000810 GAS PAD STORAGE BUILDING Administration & Support 1,440 1,297 1/1/1990 1/1/1990 tbd tbd1000437 GERSTACKER CARL A BUILDING Teach, Research, Support 61,692 28,200 1/1/1964 1/1/1964 10,403,678$ 14,972,888$ 1000331 GLEN AVE PARKING STRUCTURE Parking Structure 332,917 310,356 1/1/1987 1/1/1987 9,926,739$ 16,379,120$ 1005121 GLICK AL FIELD HOUSE Intercollegiate Athletics Bldg 105,709 94,857 1/1/2009 1/1/2009 tbd tbd1000725 GOLF CLUBHOUSE Intercollegiate Athletics Bldg 22,737 16,037 1/1/1950 1/1/1950 266,440$ 3,226,594$ 1000737 GOLF COURSE CART SHED Intercollegiate Athletics Bldg 793 756 1/1/1966 1/1/1966 2,524$ 16,176$ 1000747 GOLF COURSE COMFORT STATION A Intercollegiate Athletics Bldg 533 - 1/1/1994 1/1/1994 tbd tbd1000748 GOLF COURSE COMFORT STATION B Intercollegiate Athletics Bldg 467 - 1/1/1994 1/1/1994 tbd tbd1000741 GOLF COURSE GARAGE Intercollegiate Athletics Bldg 3,585 3,458 1/1/1956 1/1/1956 tbd tbd1005100 GOLF COURSE MAINTENANCE BUILDING Intercollegiate Athletics Bldg 5,555 5,280 1/1/2007 1/1/2007 789,068$ 789,068$ 1000749 GOLF COURSE PRACTICE RANGE BLDG Intercollegiate Athletics Bldg 720 544 1/1/1994 1/1/1994 137,545$ 187,061$ 1000740 GOLF COURSE PUMP HOUSE I Intercollegiate Athletics Bldg 120 - 1/1/1992 1/1/1992 tbd tbd1000739 GOLF COURSE PUMP HOUSE II Intercollegiate Athletics Bldg 336 - 1/1/1992 1/1/1992 195,000$ 288,600$ 1000735 GOLF COURSE SHOPS Intercollegiate Athletics Bldg 2,608 2,384 1/1/1957 1/1/1957 tbd tbd1000424 GORGUZE FAMILY LABORATORY Teach, Research, Support 29,155 20,828 1/1/1972 1/1/1972 705,715$ 2,189,604$ 1000201 HARTWIG MARIE DOROTHY ADMINISTRATION BUILDING Intercollegiate Athletics Bldg 14,550 6,881 1/1/1912 1/1/1912 375,199$ 3,553,955$ 1000185 HATCHER H NORTH GRADUATE LIBRARY Library Building 195,748 140,691 1/1/1920 1/1/1920 1,362,762$ 18,970,150$ 1000181 HATCHER HARLAN H SOUTH GRADUATE LIBRARY Library Building 147,526 87,515 1/1/1970 1/1/1970 4,932,431$ 24,267,561$ 1000175 HAVEN HALL Teach, Research, Support 123,510 57,868 1/1/1952 1/1/1952 30,176,609$ 43,836,710$ 1000897 HEALTH MANAGEMENT RESEARCH Teach, Research, Support 12,792 7,039 1/1/1969 1/1/1969 30,000$ 158,700$ 1000176 HEALTH SERVICE Recreational Sports Building 79,177 48,394 1/1/1940 1/1/1940 397,088$ 11,313,043$ 1000057 HENDERSON MARY BARTRON HOUSE Residence 9,329 6,810 1/1/1945 1/1/1892 25,513$ 2,513,770$ 1000177 HILL AUDITORIUM Recreational Sports Building 105,813 33,117 1/1/1913 1/1/1913 270,680$ 15,112,063$ 1000253 HILL ST PARKING STRUCTURE Parking Structure 151,160 143,093 1/1/1970 1/1/1970 1,425,810$ 7,014,985$ 1000314 HOLDEN JAMES & LYNELLE PERINATAL RESEARCH LAB Clinical Delivery System 20,779 10,398 1/1/1972 1/1/1972 1,499,044$ 6,146,080$ 1000804 HOOVER ANNEX Administration & Support 1,889 1,556 1/1/1956 1/1/1929 19,430$ 481,091$ 1000805 HOOVER AVE HEATING PLANT Administration & Support 6,990 1,813 1/1/1956 1/1/1929 454,812$ 2,899,106$ 1000179 HUTCHINS HALL Teach, Research, Support 104,374 50,985 1/1/1933 1/1/1933 1,191,074$ 43,688,605$ 1000703 INDOOR TRACK BUILDING Intercollegiate Athletics Bldg 69,183 65,479 1/1/1974 1/1/1974 1,020,469$ 3,581,845$ 1000429 INDUSTRIAL AND OPERATIONS ENGINEERING BUILDING Teach, Research, Support 50,260 28,283 1/1/1963 1/1/1963 1,205,811$ 5,967,841$ 1000862 INGLIS CARETAKERS RESIDENCE Administration & Support 2,342 1,400 1/1/1950 1/1/1927 5,000$ 123,800$ 1000868 INGLIS GREENHOUSE #2 Administration & Support 459 401 1/1/1975 1/1/1975 tbd tbd1000867 INGLIS GREENHOUSE AND GARAGE Administration & Support 1,069 833 1/1/1950 1/1/1950 2,000$ 19,820$ 1000861 INGLIS HOUSE Administration & Support 10,622 6,575 1/1/1950 1/1/1927 54,016$ 1,337,429$ 1000863 INGLIS PEACOCK HOUSE Administration & Support 88 73 1/1/1950 1/1/1927 1$ 26$ 1000866 INGLIS ROOT CELLAR Administration & Support 131 81 1/1/1950 1/1/1927 1$ 26$ 1000864 INGLIS STORAGE BUILDING Administration & Support 147 127 1/1/1950 1/1/1927 1$ 26$ 1000865 INGLIS WELL HOUSE Administration & Support 292 - 1/1/1950 1/1/1927 1$ 26$ 1000145 INSTITUTE FOR SOCIAL RESEARCH Teach, Research, Support 169,400 109,912 1/1/1965 1/1/1965 8,207,205$ 26,628,125$ 1000814 INSTITUTE OF CONTINUING LEGAL ED Teach, Research, Support 12,592 8,784 1/1/1987 1/1/1987 1,316,460$ 2,172,158$ 1005247 INTERCOLLEGIATE SOCCER STADIUM Intercollegiate Athletics Bldg 17,368 17,368 1/1/2009 1/1/2009 tbd tbd1000719 INTRAMURAL SPORTS BUILDING Recreational Sports Building 106,330 74,580 1/1/1928 1/1/1928 743,214$ 19,070,861$ 1000434 IST GAS STORAGE BUILDING Teach, Research, Support 200 138 1/1/1964 1/1/1964 5,000$ 34,850$ 1005160 JUNGE FAMILY CHAMPIONS CENTER Intercollegiate Athletics Bldg 11,743 7,679 12/1/2006 1/1/2006 4,082,595$ 4,082,595$ 1000732 KEEN CLIFFORD P ARENA Intercollegiate Athletics Bldg 38,816 20,122 1/1/1956 1/1/1956 828,072$ 7,643,105$ 1000324 KELLOGG W K EYE CENTER Teach, Research, Support 79,249 38,155 1/1/1985 1/1/1985 4,150,652$ 7,180,627$ 1000851 KINESIOLOGY BUILDING Teach, Research, Support 31,331 16,454 1/1/1966 1/1/1966 366,111$ 2,346,772$ 1000211 KRAUS EDWARD HENRY BUILDING Teach, Research, Support 182,971 114,898 1/1/1915 1/1/1915 2,440,994$ 28,006,349$ 1000137 KRESGE BUSINESS ADMIN LIBRARY Library Building 75,164 50,435 1/1/1985 1/1/1985 10,119,921$ 17,507,464$ 1000183 LANE HALL Teach, Research, Support 39,993 16,700 1/1/1937 1/1/1917 70,000$ 2,809,800$
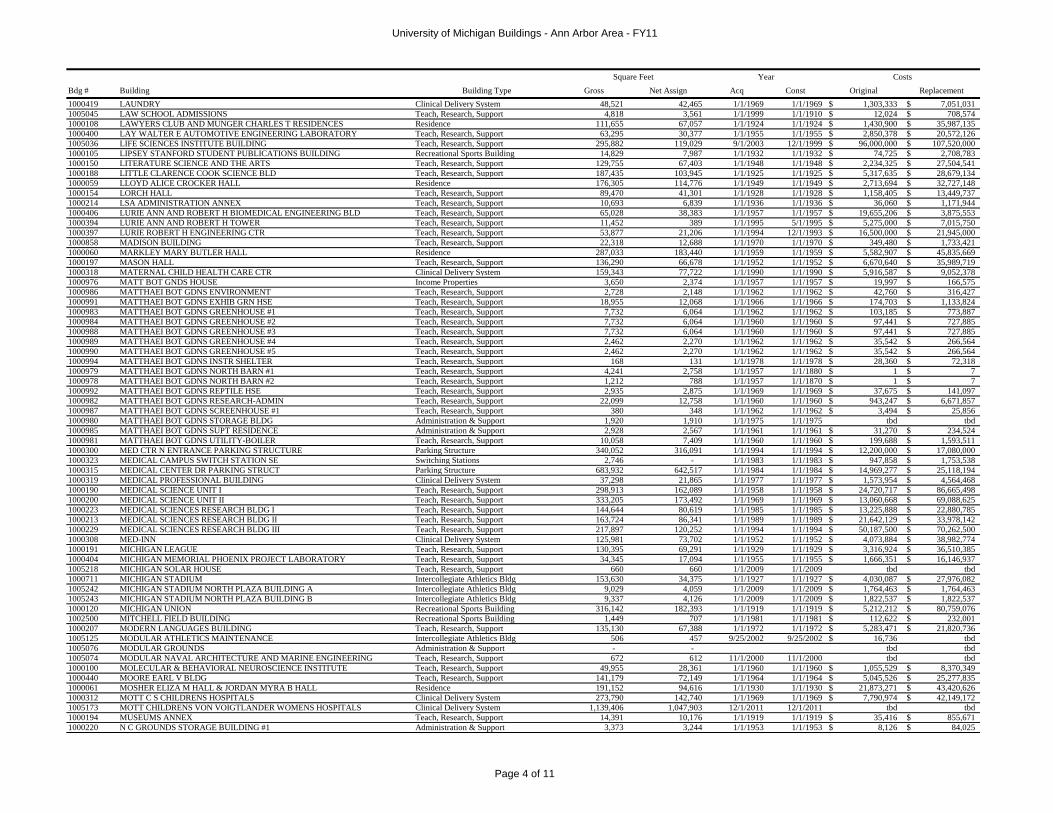
University of Michigan Buildings - Ann Arbor Area - FY11
Page 4 of 11
Bdg # Building Building Type Gross Net Assign Acq Const Original ReplacementSquare Feet Year Costs
1000419 LAUNDRY Clinical Delivery System 48,521 42,465 1/1/1969 1/1/1969 1,303,333$ 7,051,031$ 1005045 LAW SCHOOL ADMISSIONS Teach, Research, Support 4,818 3,561 1/1/1999 1/1/1910 12,024$ 708,574$ 1000108 LAWYERS CLUB AND MUNGER CHARLES T RESIDENCES Residence 111,655 67,057 1/1/1924 1/1/1924 1,430,900$ 35,987,135$ 1000400 LAY WALTER E AUTOMOTIVE ENGINEERING LABORATORY Teach, Research, Support 63,295 30,377 1/1/1955 1/1/1955 2,850,378$ 20,572,126$ 1005036 LIFE SCIENCES INSTITUTE BUILDING Teach, Research, Support 295,882 119,029 9/1/2003 12/1/1999 96,000,000$ 107,520,000$ 1000105 LIPSEY STANFORD STUDENT PUBLICATIONS BUILDING Recreational Sports Building 14,829 7,987 1/1/1932 1/1/1932 74,725$ 2,708,783$ 1000150 LITERATURE SCIENCE AND THE ARTS Teach, Research, Support 129,755 67,403 1/1/1948 1/1/1948 2,234,325$ 27,504,541$ 1000188 LITTLE CLARENCE COOK SCIENCE BLD Teach, Research, Support 187,435 103,945 1/1/1925 1/1/1925 5,317,635$ 28,679,134$ 1000059 LLOYD ALICE CROCKER HALL Residence 176,305 114,776 1/1/1949 1/1/1949 2,713,694$ 32,727,148$ 1000154 LORCH HALL Teach, Research, Support 89,470 41,301 1/1/1928 1/1/1928 1,158,405$ 13,449,737$ 1000214 LSA ADMINISTRATION ANNEX Teach, Research, Support 10,693 6,839 1/1/1936 1/1/1936 36,060$ 1,171,944$ 1000406 LURIE ANN AND ROBERT H BIOMEDICAL ENGINEERING BLD Teach, Research, Support 65,028 38,383 1/1/1957 1/1/1957 19,655,206$ 3,875,553$ 1000394 LURIE ANN AND ROBERT H TOWER Teach, Research, Support 11,452 389 1/1/1995 5/1/1995 5,275,000$ 7,015,750$ 1000397 LURIE ROBERT H ENGINEERING CTR Teach, Research, Support 53,877 21,206 1/1/1994 12/1/1993 16,500,000$ 21,945,000$ 1000858 MADISON BUILDING Teach, Research, Support 22,318 12,688 1/1/1970 1/1/1970 349,480$ 1,733,421$ 1000060 MARKLEY MARY BUTLER HALL Residence 287,033 183,440 1/1/1959 1/1/1959 5,582,907$ 45,835,669$ 1000197 MASON HALL Teach, Research, Support 136,290 66,678 1/1/1952 1/1/1952 6,670,640$ 35,989,719$ 1000318 MATERNAL CHILD HEALTH CARE CTR Clinical Delivery System 159,343 77,722 1/1/1990 1/1/1990 5,916,587$ 9,052,378$ 1000976 MATT BOT GNDS HOUSE Income Properties 3,650 2,374 1/1/1957 1/1/1957 19,997$ 166,575$ 1000986 MATTHAEI BOT GDNS ENVIRONMENT Teach, Research, Support 2,728 2,148 1/1/1962 1/1/1962 42,760$ 316,427$ 1000991 MATTHAEI BOT GDNS EXHIB GRN HSE Teach, Research, Support 18,955 12,068 1/1/1966 1/1/1966 174,703$ 1,133,824$ 1000983 MATTHAEI BOT GDNS GREENHOUSE #1 Teach, Research, Support 7,732 6,064 1/1/1962 1/1/1962 103,185$ 773,887$ 1000984 MATTHAEI BOT GDNS GREENHOUSE #2 Teach, Research, Support 7,732 6,064 1/1/1960 1/1/1960 97,441$ 727,885$ 1000988 MATTHAEI BOT GDNS GREENHOUSE #3 Teach, Research, Support 7,732 6,064 1/1/1960 1/1/1960 97,441$ 727,885$ 1000989 MATTHAEI BOT GDNS GREENHOUSE #4 Teach, Research, Support 2,462 2,270 1/1/1962 1/1/1962 35,542$ 266,564$ 1000990 MATTHAEI BOT GDNS GREENHOUSE #5 Teach, Research, Support 2,462 2,270 1/1/1962 1/1/1962 35,542$ 266,564$ 1000994 MATTHAEI BOT GDNS INSTR SHELTER Teach, Research, Support 168 131 1/1/1978 1/1/1978 28,360$ 72,318$ 1000979 MATTHAEI BOT GDNS NORTH BARN #1 Teach, Research, Support 4,241 2,758 1/1/1957 1/1/1880 1$ 7$ 1000978 MATTHAEI BOT GDNS NORTH BARN #2 Teach, Research, Support 1,212 788 1/1/1957 1/1/1870 1$ 7$ 1000992 MATTHAEI BOT GDNS REPTILE HSE Teach, Research, Support 2,935 2,875 1/1/1969 1/1/1969 37,675$ 141,097$ 1000982 MATTHAEI BOT GDNS RESEARCH-ADMIN Teach, Research, Support 22,099 12,758 1/1/1960 1/1/1960 943,247$ 6,671,857$ 1000987 MATTHAEI BOT GDNS SCREENHOUSE #1 Teach, Research, Support 380 348 1/1/1962 1/1/1962 3,494$ 25,856$ 1000980 MATTHAEI BOT GDNS STORAGE BLDG Administration & Support 1,920 1,910 1/1/1975 1/1/1975 tbd tbd1000985 MATTHAEI BOT GDNS SUPT RESIDENCE Administration & Support 2,928 2,567 1/1/1961 1/1/1961 31,270$ 234,524$ 1000981 MATTHAEI BOT GDNS UTILITY-BOILER Teach, Research, Support 10,058 7,409 1/1/1960 1/1/1960 199,688$ 1,593,511$ 1000300 MED CTR N ENTRANCE PARKING STRUCTURE Parking Structure 340,052 316,091 1/1/1994 1/1/1994 12,200,000$ 17,080,000$ 1000323 MEDICAL CAMPUS SWITCH STATION SE Switching Stations 2,746 - 1/1/1983 1/1/1983 947,858$ 1,753,538$ 1000315 MEDICAL CENTER DR PARKING STRUCT Parking Structure 683,932 642,517 1/1/1984 1/1/1984 14,969,277$ 25,118,194$ 1000319 MEDICAL PROFESSIONAL BUILDING Clinical Delivery System 37,298 21,865 1/1/1977 1/1/1977 1,573,954$ 4,564,468$ 1000190 MEDICAL SCIENCE UNIT I Teach, Research, Support 298,913 162,089 1/1/1958 1/1/1958 24,720,717$ 86,665,498$ 1000200 MEDICAL SCIENCE UNIT II Teach, Research, Support 333,205 173,492 1/1/1969 1/1/1969 13,060,668$ 69,088,625$ 1000223 MEDICAL SCIENCES RESEARCH BLDG I Teach, Research, Support 144,644 80,619 1/1/1985 1/1/1985 13,225,888$ 22,880,785$ 1000213 MEDICAL SCIENCES RESEARCH BLDG II Teach, Research, Support 163,724 86,341 1/1/1989 1/1/1989 21,642,129$ 33,978,142$ 1000229 MEDICAL SCIENCES RESEARCH BLDG III Teach, Research, Support 217,897 120,252 1/1/1994 1/1/1994 50,187,500$ 70,262,500$ 1000308 MED-INN Clinical Delivery System 125,981 73,702 1/1/1952 1/1/1952 4,073,884$ 38,982,774$ 1000191 MICHIGAN LEAGUE Teach, Research, Support 130,395 69,291 1/1/1929 1/1/1929 3,316,924$ 36,510,385$ 1000404 MICHIGAN MEMORIAL PHOENIX PROJECT LABORATORY Teach, Research, Support 34,345 17,094 1/1/1955 1/1/1955 1,666,351$ 16,146,937$ 1005218 MICHIGAN SOLAR HOUSE Teach, Research, Support 660 660 1/1/2009 1/1/2009 tbd tbd1000711 MICHIGAN STADIUM Intercollegiate Athletics Bldg 153,630 34,375 1/1/1927 1/1/1927 4,030,087$ 27,976,082$ 1005242 MICHIGAN STADIUM NORTH PLAZA BUILDING A Intercollegiate Athletics Bldg 9,029 4,059 1/1/2009 1/1/2009 1,764,463$ 1,764,463$ 1005243 MICHIGAN STADIUM NORTH PLAZA BUILDING B Intercollegiate Athletics Bldg 9,337 4,126 1/1/2009 1/1/2009 1,822,537$ 1,822,537$ 1000120 MICHIGAN UNION Recreational Sports Building 316,142 182,393 1/1/1919 1/1/1919 5,212,212$ 80,759,076$ 1002500 MITCHELL FIELD BUILDING Recreational Sports Building 1,449 707 1/1/1981 1/1/1981 112,622$ 232,001$ 1000207 MODERN LANGUAGES BUILDING Teach, Research, Support 135,130 67,388 1/1/1972 1/1/1972 5,283,471$ 21,820,736$ 1005125 MODULAR ATHLETICS MAINTENANCE Intercollegiate Athletics Bldg 506 457 9/25/2002 9/25/2002 16,736$ tbd1005076 MODULAR GROUNDS Administration & Support - - tbd tbd1005074 MODULAR NAVAL ARCHITECTURE AND MARINE ENGINEERING Teach, Research, Support 672 612 11/1/2000 11/1/2000 tbd tbd1000100 MOLECULAR & BEHAVIORAL NEUROSCIENCE INSTITUTE Teach, Research, Support 49,955 28,361 1/1/1960 1/1/1960 1,055,529$ 8,370,349$ 1000440 MOORE EARL V BLDG Teach, Research, Support 141,179 72,149 1/1/1964 1/1/1964 5,045,526$ 25,277,835$ 1000061 MOSHER ELIZA M HALL & JORDAN MYRA B HALL Residence 191,152 94,616 1/1/1930 1/1/1930 21,873,271$ 43,420,626$ 1000312 MOTT C S CHILDRENS HOSPITALS Clinical Delivery System 273,790 142,740 1/1/1969 1/1/1969 7,790,974$ 42,149,172$ 1005173 MOTT CHILDRENS VON VOIGTLANDER WOMENS HOSPITALS Clinical Delivery System 1,139,406 1,047,903 12/1/2011 12/1/2011 tbd tbd1000194 MUSEUMS ANNEX Teach, Research, Support 14,391 10,176 1/1/1919 1/1/1919 35,416$ 855,671$ 1000220 N C GROUNDS STORAGE BUILDING #1 Administration & Support 3,373 3,244 1/1/1953 1/1/1953 8,126$ 84,025$
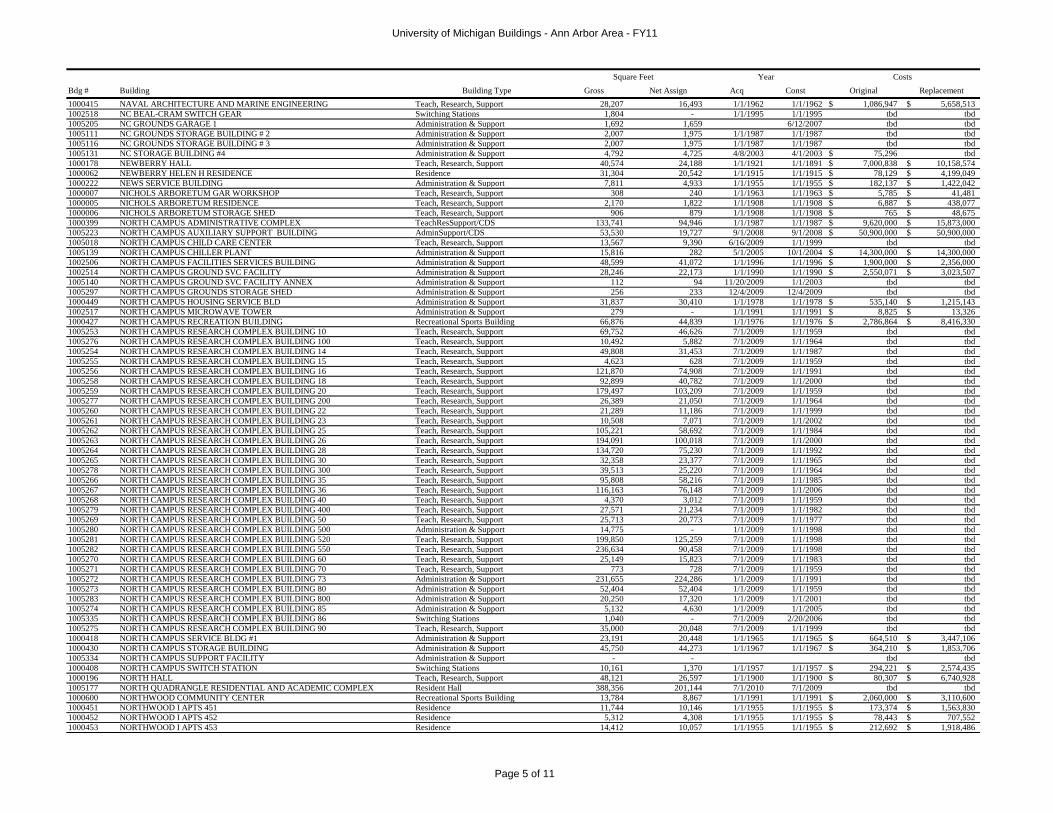
University of Michigan Buildings - Ann Arbor Area - FY11
Page 5 of 11
Bdg # Building Building Type Gross Net Assign Acq Const Original ReplacementSquare Feet Year Costs
1000415 NAVAL ARCHITECTURE AND MARINE ENGINEERING Teach, Research, Support 28,207 16,493 1/1/1962 1/1/1962 1,086,947$ 5,658,513$ 1002518 NC BEAL-CRAM SWITCH GEAR Switching Stations 1,804 - 1/1/1995 1/1/1995 tbd tbd1005205 NC GROUNDS GARAGE 1 Administration & Support 1,692 1,659 6/12/2007 tbd tbd1005111 NC GROUNDS STORAGE BUILDING # 2 Administration & Support 2,007 1,975 1/1/1987 1/1/1987 tbd tbd1005116 NC GROUNDS STORAGE BUILDING # 3 Administration & Support 2,007 1,975 1/1/1987 1/1/1987 tbd tbd1005131 NC STORAGE BUILDING #4 Administration & Support 4,792 4,725 4/8/2003 4/1/2003 75,296$ tbd1000178 NEWBERRY HALL Teach, Research, Support 40,574 24,188 1/1/1921 1/1/1891 7,000,838$ 10,158,574$ 1000062 NEWBERRY HELEN H RESIDENCE Residence 31,304 20,542 1/1/1915 1/1/1915 78,129$ 4,199,049$ 1000222 NEWS SERVICE BUILDING Administration & Support 7,811 4,933 1/1/1955 1/1/1955 182,137$ 1,422,042$ 1000007 NICHOLS ARBORETUM GAR WORKSHOP Teach, Research, Support 308 240 1/1/1963 1/1/1963 5,785$ 41,481$ 1000005 NICHOLS ARBORETUM RESIDENCE Teach, Research, Support 2,170 1,822 1/1/1908 1/1/1908 6,887$ 438,077$ 1000006 NICHOLS ARBORETUM STORAGE SHED Teach, Research, Support 906 879 1/1/1908 1/1/1908 765$ 48,675$ 1000399 NORTH CAMPUS ADMINISTRATIVE COMPLEX TeachResSupport/CDS 133,741 94,946 1/1/1987 1/1/1987 9,620,000$ 15,873,000$ 1005223 NORTH CAMPUS AUXILIARY SUPPORT BUILDING AdminSupport/CDS 53,530 19,727 9/1/2008 9/1/2008 50,900,000$ 50,900,000$ 1005018 NORTH CAMPUS CHILD CARE CENTER Teach, Research, Support 13,567 9,390 6/16/2009 1/1/1999 tbd tbd1005139 NORTH CAMPUS CHILLER PLANT Administration & Support 15,816 282 5/1/2005 10/1/2004 14,300,000$ 14,300,000$ 1002506 NORTH CAMPUS FACILITIES SERVICES BUILDING Administration & Support 48,599 41,072 1/1/1996 1/1/1996 1,900,000$ 2,356,000$ 1002514 NORTH CAMPUS GROUND SVC FACILITY Administration & Support 28,246 22,173 1/1/1990 1/1/1990 2,550,071$ 3,023,507$ 1005140 NORTH CAMPUS GROUND SVC FACILITY ANNEX Administration & Support 112 94 11/20/2009 1/1/2003 tbd tbd1005297 NORTH CAMPUS GROUNDS STORAGE SHED Administration & Support 256 233 12/4/2009 12/4/2009 tbd tbd1000449 NORTH CAMPUS HOUSING SERVICE BLD Administration & Support 31,837 30,410 1/1/1978 1/1/1978 535,140$ 1,215,143$ 1002517 NORTH CAMPUS MICROWAVE TOWER Administration & Support 279 - 1/1/1991 1/1/1991 8,825$ 13,326$ 1000427 NORTH CAMPUS RECREATION BUILDING Recreational Sports Building 66,876 44,839 1/1/1976 1/1/1976 2,786,864$ 8,416,330$ 1005253 NORTH CAMPUS RESEARCH COMPLEX BUILDING 10 Teach, Research, Support 69,752 46,626 7/1/2009 1/1/1959 tbd tbd1005276 NORTH CAMPUS RESEARCH COMPLEX BUILDING 100 Teach, Research, Support 10,492 5,882 7/1/2009 1/1/1964 tbd tbd1005254 NORTH CAMPUS RESEARCH COMPLEX BUILDING 14 Teach, Research, Support 49,808 31,453 7/1/2009 1/1/1987 tbd tbd1005255 NORTH CAMPUS RESEARCH COMPLEX BUILDING 15 Teach, Research, Support 4,623 628 7/1/2009 1/1/1959 tbd tbd1005256 NORTH CAMPUS RESEARCH COMPLEX BUILDING 16 Teach, Research, Support 121,870 74,908 7/1/2009 1/1/1991 tbd tbd1005258 NORTH CAMPUS RESEARCH COMPLEX BUILDING 18 Teach, Research, Support 92,899 40,782 7/1/2009 1/1/2000 tbd tbd1005259 NORTH CAMPUS RESEARCH COMPLEX BUILDING 20 Teach, Research, Support 179,497 103,209 7/1/2009 1/1/1959 tbd tbd1005277 NORTH CAMPUS RESEARCH COMPLEX BUILDING 200 Teach, Research, Support 26,389 21,050 7/1/2009 1/1/1964 tbd tbd1005260 NORTH CAMPUS RESEARCH COMPLEX BUILDING 22 Teach, Research, Support 21,289 11,186 7/1/2009 1/1/1999 tbd tbd1005261 NORTH CAMPUS RESEARCH COMPLEX BUILDING 23 Teach, Research, Support 10,508 7,071 7/1/2009 1/1/2002 tbd tbd1005262 NORTH CAMPUS RESEARCH COMPLEX BUILDING 25 Teach, Research, Support 105,221 58,692 7/1/2009 1/1/1984 tbd tbd1005263 NORTH CAMPUS RESEARCH COMPLEX BUILDING 26 Teach, Research, Support 194,091 100,018 7/1/2009 1/1/2000 tbd tbd1005264 NORTH CAMPUS RESEARCH COMPLEX BUILDING 28 Teach, Research, Support 134,720 75,230 7/1/2009 1/1/1992 tbd tbd1005265 NORTH CAMPUS RESEARCH COMPLEX BUILDING 30 Teach, Research, Support 32,358 23,377 7/1/2009 1/1/1965 tbd tbd1005278 NORTH CAMPUS RESEARCH COMPLEX BUILDING 300 Teach, Research, Support 39,513 25,220 7/1/2009 1/1/1964 tbd tbd1005266 NORTH CAMPUS RESEARCH COMPLEX BUILDING 35 Teach, Research, Support 95,808 58,216 7/1/2009 1/1/1985 tbd tbd1005267 NORTH CAMPUS RESEARCH COMPLEX BUILDING 36 Teach, Research, Support 116,163 76,148 7/1/2009 1/1/2006 tbd tbd1005268 NORTH CAMPUS RESEARCH COMPLEX BUILDING 40 Teach, Research, Support 4,370 3,012 7/1/2009 1/1/1959 tbd tbd1005279 NORTH CAMPUS RESEARCH COMPLEX BUILDING 400 Teach, Research, Support 27,571 21,234 7/1/2009 1/1/1982 tbd tbd1005269 NORTH CAMPUS RESEARCH COMPLEX BUILDING 50 Teach, Research, Support 25,713 20,773 7/1/2009 1/1/1977 tbd tbd1005280 NORTH CAMPUS RESEARCH COMPLEX BUILDING 500 Administration & Support 14,775 - 1/1/2009 1/1/1998 tbd tbd1005281 NORTH CAMPUS RESEARCH COMPLEX BUILDING 520 Teach, Research, Support 199,850 125,259 7/1/2009 1/1/1998 tbd tbd1005282 NORTH CAMPUS RESEARCH COMPLEX BUILDING 550 Teach, Research, Support 236,634 90,458 7/1/2009 1/1/1998 tbd tbd1005270 NORTH CAMPUS RESEARCH COMPLEX BUILDING 60 Teach, Research, Support 25,149 15,823 7/1/2009 1/1/1983 tbd tbd1005271 NORTH CAMPUS RESEARCH COMPLEX BUILDING 70 Teach, Research, Support 773 728 7/1/2009 1/1/1959 tbd tbd1005272 NORTH CAMPUS RESEARCH COMPLEX BUILDING 73 Administration & Support 231,655 224,286 1/1/2009 1/1/1991 tbd tbd1005273 NORTH CAMPUS RESEARCH COMPLEX BUILDING 80 Administration & Support 52,404 52,404 1/1/2009 1/1/1959 tbd tbd1005283 NORTH CAMPUS RESEARCH COMPLEX BUILDING 800 Administration & Support 20,250 17,320 1/1/2009 1/1/2001 tbd tbd1005274 NORTH CAMPUS RESEARCH COMPLEX BUILDING 85 Administration & Support 5,132 4,630 1/1/2009 1/1/2005 tbd tbd1005335 NORTH CAMPUS RESEARCH COMPLEX BUILDING 86 Switching Stations 1,040 - 7/1/2009 2/20/2006 tbd tbd1005275 NORTH CAMPUS RESEARCH COMPLEX BUILDING 90 Teach, Research, Support 35,000 20,048 7/1/2009 1/1/1999 tbd tbd1000418 NORTH CAMPUS SERVICE BLDG #1 Administration & Support 23,191 20,448 1/1/1965 1/1/1965 664,510$ 3,447,106$ 1000430 NORTH CAMPUS STORAGE BUILDING Administration & Support 45,750 44,273 1/1/1967 1/1/1967 364,210$ 1,853,706$ 1005334 NORTH CAMPUS SUPPORT FACILITY Administration & Support - - tbd tbd1000408 NORTH CAMPUS SWITCH STATION Switching Stations 10,161 1,370 1/1/1957 1/1/1957 294,221$ 2,574,435$ 1000196 NORTH HALL Teach, Research, Support 48,121 26,597 1/1/1900 1/1/1900 80,307$ 6,740,928$ 1005177 NORTH QUADRANGLE RESIDENTIAL AND ACADEMIC COMPLEX Resident Hall 388,356 201,144 7/1/2010 7/1/2009 tbd tbd1000600 NORTHWOOD COMMUNITY CENTER Recreational Sports Building 13,784 8,867 1/1/1991 1/1/1991 2,060,000$ 3,110,600$ 1000451 NORTHWOOD I APTS 451 Residence 11,744 10,146 1/1/1955 1/1/1955 173,374$ 1,563,830$ 1000452 NORTHWOOD I APTS 452 Residence 5,312 4,308 1/1/1955 1/1/1955 78,443$ 707,552$ 1000453 NORTHWOOD I APTS 453 Residence 14,412 10,057 1/1/1955 1/1/1955 212,692$ 1,918,486$

University of Michigan Buildings - Ann Arbor Area - FY11
Page 6 of 11
Bdg # Building Building Type Gross Net Assign Acq Const Original ReplacementSquare Feet Year Costs
1000454 NORTHWOOD I APTS 454 Residence 14,412 10,057 1/1/1955 1/1/1955 212,692$ 1,918,486$ 1000455 NORTHWOOD I APTS 455 Residence 5,312 4,308 1/1/1955 1/1/1955 78,443$ 707,552$ 1000456 NORTHWOOD I APTS 456 Residence 11,744 10,146 1/1/1955 1/1/1955 173,374$ 1,563,830$ 1000450 NORTHWOOD I SVC BUILDING 450 Residence 3,168 2,368 1/1/1955 1/1/1955 46,636$ 420,659$ 1000462 NORTHWOOD II APTS 462 Residence 4,246 3,744 1/1/1957 1/1/1957 73,435$ 611,713$ 1000464 NORTHWOOD II APTS 464 Residence 5,645 4,936 1/1/1957 1/1/1957 97,700$ 813,844$ 1000465 NORTHWOOD II APTS 465 Residence 5,645 4,936 1/1/1957 1/1/1957 97,700$ 813,844$ 1000466 NORTHWOOD II APTS 466 Residence 4,246 3,744 1/1/1957 1/1/1957 73,435$ 611,713$ 1000467 NORTHWOOD II APTS 467 Residence 4,246 3,744 1/1/1957 1/1/1957 73,435$ 611,713$ 1000468 NORTHWOOD II APTS 468 Residence 4,246 3,744 1/1/1957 1/1/1957 73,435$ 611,713$ 1000469 NORTHWOOD II APTS 469 Residence 12,405 9,205 1/1/1957 1/1/1957 214,238$ 1,784,606$ 1000470 NORTHWOOD II APTS 470 Residence 5,645 4,936 1/1/1957 1/1/1957 97,700$ 813,844$ 1000471 NORTHWOOD II APTS 471 Residence 5,645 4,936 1/1/1957 1/1/1957 97,700$ 813,844$ 1000472 NORTHWOOD II APTS 472 Residence 5,645 4,936 1/1/1957 1/1/1957 97,700$ 813,844$ 1000473 NORTHWOOD II APTS 473 Residence 12,405 9,205 1/1/1957 1/1/1957 214,238$ 1,784,606$ 1000474 NORTHWOOD II APTS 474 Residence 3,738 2,992 1/1/1957 1/1/1957 64,495$ 537,244$ 1000475 NORTHWOOD II APTS 475 Residence 3,738 2,992 1/1/1957 1/1/1957 64,495$ 537,244$ 1000476 NORTHWOOD II APTS 476 Residence 3,738 2,992 1/1/1957 1/1/1957 64,495$ 537,244$ 1000477 NORTHWOOD II APTS 477 Residence 3,738 2,992 1/1/1957 1/1/1957 64,495$ 537,244$ 1000478 NORTHWOOD II APTS 478 Residence 3,738 2,992 1/1/1957 1/1/1957 64,495$ 537,244$ 1000479 NORTHWOOD II APTS 479 Residence 5,645 4,936 1/1/1957 1/1/1957 97,700$ 813,844$ 1000480 NORTHWOOD II APTS 480 Residence 5,645 4,936 1/1/1957 1/1/1957 97,700$ 813,844$ 1000481 NORTHWOOD II APTS 481 Residence 5,645 4,936 1/1/1957 1/1/1957 97,700$ 813,844$ 1000482 NORTHWOOD II APTS 482 Residence 3,738 2,992 1/1/1957 1/1/1957 64,495$ 537,244$ 1000483 NORTHWOOD II APTS 483 Residence 3,738 2,992 1/1/1957 1/1/1957 64,495$ 537,244$ 1000484 NORTHWOOD II APTS 484 Residence 3,738 2,992 1/1/1957 1/1/1957 64,495$ 537,244$ 1000485 NORTHWOOD II APTS 485 Residence 3,738 2,992 1/1/1957 1/1/1957 64,495$ 537,244$ 1000486 NORTHWOOD II APTS 486 Residence 3,738 2,992 1/1/1957 1/1/1957 64,495$ 537,244$ 1000487 NORTHWOOD II APTS 487 Residence 3,738 2,992 1/1/1957 1/1/1957 64,495$ 537,244$ 1000488 NORTHWOOD II APTS 488 Residence 3,738 2,992 1/1/1957 1/1/1957 64,495$ 537,244$ 1000489 NORTHWOOD II APTS 489 Residence 3,738 2,992 1/1/1957 1/1/1957 64,495$ 537,244$ 1000490 NORTHWOOD II APTS 490 Residence 3,738 2,992 1/1/1957 1/1/1957 64,495$ 537,244$ 1000491 NORTHWOOD II APTS 491 Residence 3,738 2,992 1/1/1957 1/1/1957 64,495$ 537,244$ 1000492 NORTHWOOD II APTS 492 Residence 3,738 2,992 1/1/1957 1/1/1957 64,495$ 537,244$ 1000493 NORTHWOOD II APTS 493 Residence 3,738 2,992 1/1/1957 1/1/1957 64,495$ 537,244$ 1000494 NORTHWOOD II APTS 494 Residence 3,738 2,992 1/1/1957 1/1/1957 64,495$ 537,244$ 1000495 NORTHWOOD II APTS 495 Residence 3,738 2,992 1/1/1957 1/1/1957 64,495$ 537,244$ 1000496 NORTHWOOD II APTS 496 Residence 3,738 2,992 1/1/1957 1/1/1957 64,495$ 537,244$ 1000497 NORTHWOOD II APTS 497 Residence 3,738 2,992 1/1/1957 1/1/1957 64,495$ 537,244$ 1000457 NORTHWOOD II SVC BUILDING 457 Residence 5,400 1,892 1/1/1957 1/1/1957 93,230$ 776,610$ 1000458 NORTHWOOD II SVC BUILDING 458 Residence 2,760 1,470 1/1/1957 1/1/1957 50,127$ 417,561$ 1000459 NORTHWOOD II SVC BUILDING 459 Residence 2,879 1,470 1/1/1957 1/1/1957 50,127$ 417,561$ 1000460 NORTHWOOD II SVC BUILDING 460 Residence 5,270 1,548 1/1/1957 1/1/1957 90,995$ 757,992$ 1000461 NORTHWOOD II SVC BUILDING 461 Residence 2,879 1,470 1/1/1957 1/1/1957 50,127$ 417,561$ 1000501 NORTHWOOD III APTS 501 Residence 27,371 23,392 1/1/1958 1/1/1958 469,734$ 3,814,242$ 1000502 NORTHWOOD III APTS 502 Residence 17,585 14,880 1/1/1958 1/1/1958 301,785$ 2,450,491$ 1000503 NORTHWOOD III APTS 503 Residence 17,585 14,880 1/1/1958 1/1/1958 301,785$ 2,450,491$ 1000504 NORTHWOOD III APTS 504 Residence 25,068 21,248 1/1/1958 1/1/1958 430,079$ 3,492,245$ 1000505 NORTHWOOD III APTS 505 Residence 17,585 14,880 1/1/1958 1/1/1958 301,785$ 2,450,491$ 1000506 NORTHWOOD III APTS 506 Residence 17,585 14,880 1/1/1958 1/1/1958 301,785$ 2,450,491$ 1000507 NORTHWOOD III APTS 507 Residence 17,585 14,880 1/1/1958 1/1/1958 301,785$ 2,450,491$ 1000508 NORTHWOOD III APTS 508 Residence 17,585 14,880 1/1/1958 1/1/1958 301,785$ 2,450,491$ 1000498 NORTHWOOD III SVC BUILDING 498 Residence 7,009 4,992 1/1/1958 1/1/1958 120,714$ 1,022,446$ 1000499 NORTHWOOD III SVC BUILDING 499 Residence 2,471 896 1/1/1958 1/1/1958 42,279$ 358,103$ 1000500 NORTHWOOD III SVC BUILDING 500 Residence 2,471 845 1/1/1958 1/1/1958 42,279$ 358,103$ 1000601 NORTHWOOD IV APTS 601 Residence 8,029 7,141 1/1/1969 1/1/1969 80,374$ 425,180$ 1000602 NORTHWOOD IV APTS 602 Residence 4,061 3,603 1/1/1969 1/1/1969 40,716$ 215,387$ 1000603 NORTHWOOD IV APTS 603 Residence 3,066 2,727 1/1/1969 1/1/1969 30,669$ 162,240$ 1000604 NORTHWOOD IV APTS 604 Residence 4,899 4,242 1/1/1969 1/1/1969 49,176$ 260,143$ 1000605 NORTHWOOD IV APTS 605 Residence 10,708 9,470 1/1/1969 1/1/1969 107,342$ 567,840$ 1000606 NORTHWOOD IV APTS 606 Residence 3,117 2,712 1/1/1969 1/1/1969 31,198$ 165,037$ 1000607 NORTHWOOD IV APTS 607 Residence 6,763 5,978 1/1/1969 1/1/1969 67,684$ 358,047$ 1000608 NORTHWOOD IV APTS 608 Residence 5,425 4,813 1/1/1969 1/1/1969 54,464$ 288,116$ 1000609 NORTHWOOD IV APTS 609 Residence 5,425 4,813 1/1/1969 1/1/1969 54,464$ 288,116$

University of Michigan Buildings - Ann Arbor Area - FY11
Page 7 of 11
Bdg # Building Building Type Gross Net Assign Acq Const Original ReplacementSquare Feet Year Costs
1000610 NORTHWOOD IV APTS 610 Residence 4,123 3,650 1/1/1969 1/1/1969 41,245$ 218,185$ 1000611 NORTHWOOD IV APTS 611 Residence 7,181 6,283 1/1/1969 1/1/1969 71,914$ 380,424$ 1000612 NORTHWOOD IV APTS 612 Residence 6,726 5,977 1/1/1969 1/1/1969 67,155$ 355,249$ 1000613 NORTHWOOD IV APTS 613 Residence 4,442 3,937 1/1/1969 1/1/1969 44,417$ 234,968$ 1000614 NORTHWOOD IV APTS 614 Residence 5,399 4,722 1/1/1969 1/1/1969 53,935$ 285,318$ 1000615 NORTHWOOD IV APTS 615 Residence 3,159 2,712 1/1/1969 1/1/1969 31,727$ 167,834$ 1000616 NORTHWOOD IV APTS 616 Residence 10,707 9,470 1/1/1969 1/1/1969 107,342$ 567,840$ 1000617 NORTHWOOD IV APTS 617 Residence 7,967 7,095 1/1/1969 1/1/1969 79,846$ 422,383$ 1000618 NORTHWOOD IV APTS 618 Residence 7,082 6,265 1/1/1969 1/1/1969 70,856$ 374,830$ 1000619 NORTHWOOD IV APTS 619 Residence 6,727 5,977 1/1/1969 1/1/1969 67,155$ 355,249$ 1000620 NORTHWOOD IV APTS 620 Residence 6,727 5,978 1/1/1969 1/1/1969 67,155$ 355,249$ 1000621 NORTHWOOD IV APTS 621 Residence 3,117 2,712 1/1/1969 1/1/1969 31,198$ 165,037$ 1000622 NORTHWOOD IV APTS 622 Residence 5,876 5,119 1/1/1969 1/1/1969 58,694$ 310,493$ 1000623 NORTHWOOD IV APTS 623 Residence 8,065 7,141 1/1/1969 1/1/1969 80,903$ 427,978$ 1000624 NORTHWOOD IV APTS 624 Residence 6,727 5,977 1/1/1969 1/1/1969 67,155$ 355,249$ 1000625 NORTHWOOD IV APTS 625 Residence 4,061 3,603 1/1/1969 1/1/1969 40,716$ 215,387$ 1000626 NORTHWOOD IV APTS 626 Residence 5,741 5,101 1/1/1969 1/1/1969 57,637$ 304,899$ 1000627 NORTHWOOD IV APTS 627 Residence 3,117 2,712 1/1/1969 1/1/1969 31,198$ 165,037$ 1000628 NORTHWOOD IV APTS 628 Residence 5,425 4,813 1/1/1969 1/1/1969 54,464$ 288,116$ 1000629 NORTHWOOD IV APTS 629 Residence 5,425 4,813 1/1/1969 1/1/1969 54,464$ 288,116$ 1000630 NORTHWOOD IV APTS 630 Residence 11,534 10,192 1/1/1969 1/1/1969 115,274$ 609,798$ 1000631 NORTHWOOD IV APTS 631 Residence 4,442 3,890 1/1/1969 1/1/1969 44,417$ 234,968$ 1000632 NORTHWOOD IV APTS 632 Residence 2,821 2,486 1/1/1969 1/1/1969 28,025$ 148,254$ 1000633 NORTHWOOD IV APTS 633 Residence 6,727 5,977 1/1/1969 1/1/1969 67,155$ 355,249$ 1000634 NORTHWOOD IV APTS 634 Residence 4,123 3,650 1/1/1969 1/1/1969 41,245$ 218,185$ 1000635 NORTHWOOD IV APTS 635 Residence 4,123 3,650 1/1/1969 1/1/1969 41,245$ 218,185$ 1000636 NORTHWOOD IV APTS 636 Residence 3,159 2,712 1/1/1969 1/1/1969 31,727$ 167,834$ 1000637 NORTHWOOD IV APTS 637 Residence 7,034 6,264 1/1/1969 1/1/1969 70,328$ 372,033$ 1000638 NORTHWOOD IV APTS 638 Residence 5,775 5,073 1/1/1969 1/1/1969 57,637$ 304,899$ 1000639 NORTHWOOD IV APTS 639 Residence 8,029 7,141 1/1/1969 1/1/1969 80,374$ 425,180$ 1000640 NORTHWOOD IV APTS 640 Residence 5,425 4,813 1/1/1969 1/1/1969 54,464$ 288,116$ 1000641 NORTHWOOD IV APTS 641 Residence 4,478 3,937 1/1/1969 1/1/1969 44,946$ 237,765$ 1000642 NORTHWOOD IV APTS 642 Residence 4,061 3,603 1/1/1969 1/1/1969 40,716$ 215,387$ 1000643 NORTHWOOD IV APTS 643 Residence 5,363 4,722 1/1/1969 1/1/1969 53,935$ 285,318$ 1000644 NORTHWOOD IV APTS 644 Residence 8,348 7,428 1/1/1969 1/1/1969 83,547$ 441,964$ 1000645 NORTHWOOD IV APTS 645 Residence 6,279 5,424 1/1/1969 1/1/1969 62,925$ 332,871$ 1000646 NORTHWOOD IV APTS 646 Residence 5,425 4,813 1/1/1969 1/1/1969 54,464$ 288,116$ 1000647 NORTHWOOD IV APTS 647 Residence 4,123 3,650 1/1/1969 1/1/1969 41,245$ 218,185$ 1000648 NORTHWOOD IV APTS 648 Residence 3,159 2,712 1/1/1969 1/1/1969 31,727$ 167,834$ 1000649 NORTHWOOD IV APTS 649 Residence 4,442 3,890 1/1/1969 1/1/1969 44,417$ 234,968$ 1000650 NORTHWOOD IV APTS 650 Residence 4,123 3,650 1/1/1969 1/1/1969 41,245$ 218,185$ 1000651 NORTHWOOD IV APTS 651 Residence 5,425 4,813 1/1/1969 1/1/1969 54,464$ 288,116$ 1000652 NORTHWOOD IV APTS 652 Residence 6,701 5,931 1/1/1969 1/1/1969 67,155$ 355,249$ 1000653 NORTHWOOD IV APTS 653 Residence 4,442 3,890 1/1/1969 1/1/1969 44,417$ 234,968$ 1000654 NORTHWOOD IV APTS 654 Residence 5,425 4,813 1/1/1969 1/1/1969 54,464$ 288,116$ 1000655 NORTHWOOD IV APTS 655 Residence 11,099 9,808 1/1/1969 1/1/1969 111,044$ 587,420$ 1000656 NORTHWOOD IV APTS 656 Residence 10,080 8,897 1/1/1969 1/1/1969 100,997$ 534,273$ 1000657 NORTHWOOD IV APTS 657 Residence 6,727 5,977 1/1/1969 1/1/1969 67,155$ 355,249$ 1000658 NORTHWOOD IV APTS 658 Residence 8,480 7,446 1/1/1969 1/1/1969 85,133$ 450,355$ 1000659 NORTHWOOD IV APTS 659 Residence 9,269 8,259 1/1/1969 1/1/1969 93,065$ 492,314$ 1000660 NORTHWOOD IV APTS 660 Residence 8,348 7,428 1/1/1969 1/1/1969 83,547$ 441,964$ 1000661 NORTHWOOD IV APTS 661 Residence 5,744 5,100 1/1/1969 1/1/1969 57,637$ 304,899$ 1000662 NORTHWOOD IV APTS 662 Residence 3,159 2,712 1/1/1969 1/1/1969 31,727$ 167,834$ 1000663 NORTHWOOD IV APTS 663 Residence 9,650 8,592 1/1/1969 1/1/1969 96,766$ 511,895$ 1000664 NORTHWOOD IV APTS 664 Residence 8,348 7,428 1/1/1969 1/1/1969 83,547$ 441,964$ 1000665 NORTHWOOD IV APTS 665 Residence 3,159 2,712 1/1/1969 1/1/1969 31,727$ 167,834$ 1000666 NORTHWOOD IV APTS 666 Residence 4,442 3,937 1/1/1969 1/1/1969 44,417$ 234,968$ 1000667 NORTHWOOD IV APTS 667 Residence 6,665 5,931 1/1/1969 1/1/1969 66,626$ 352,452$ 1000668 NORTHWOOD IV APTS 668 Residence 9,331 8,305 1/1/1969 1/1/1969 93,594$ 495,111$ 1000669 NORTHWOOD IV APTS 669 Residence 8,348 7,428 1/1/1969 1/1/1969 83,547$ 441,964$ 1000670 NORTHWOOD IV APTS 670 Residence 7,095 6,237 1/1/1969 1/1/1969 70,856$ 374,830$ 1000671 NORTHWOOD IV APTS 671 Residence 10,858 9,854 1/1/1969 1/1/1969 108,928$ 576,231$ 1000672 NORTHWOOD IV APTS 672 Residence 5,425 4,813 1/1/1969 1/1/1969 54,464$ 288,116$ 1000673 NORTHWOOD IV APTS 673 Residence 9,779 8,610 1/1/1969 1/1/1969 97,824$ 517,489$
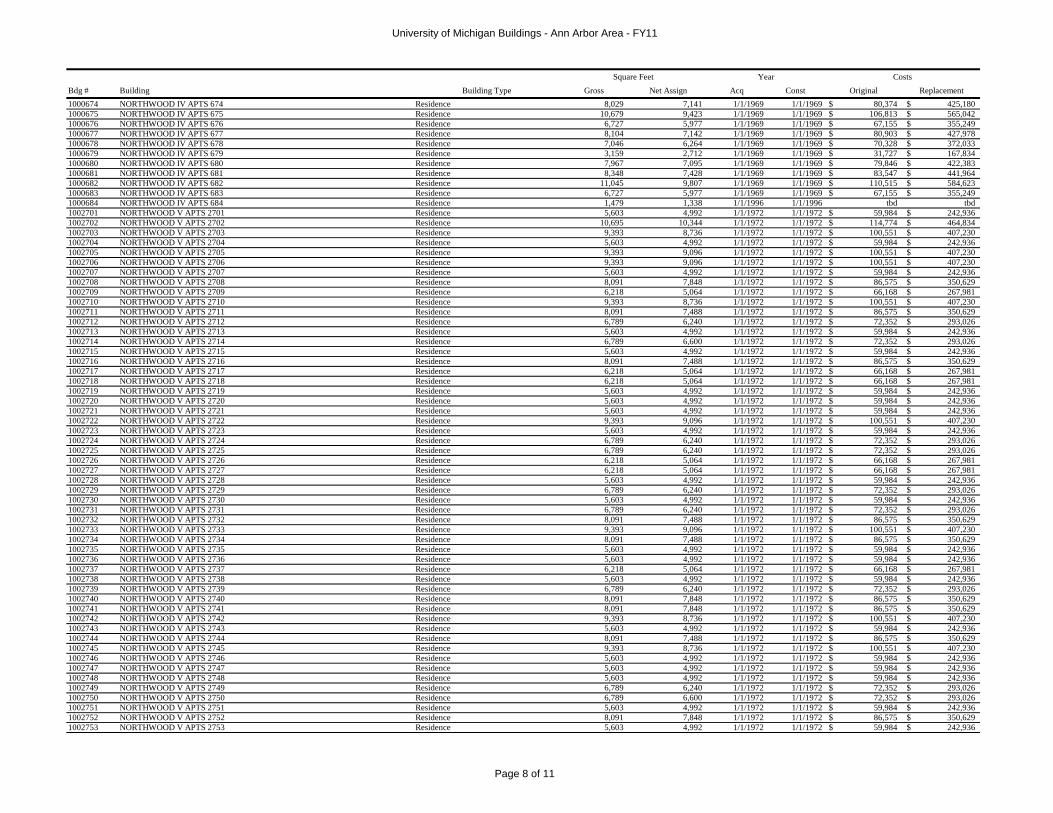
University of Michigan Buildings - Ann Arbor Area - FY11
Page 8 of 11
Bdg # Building Building Type Gross Net Assign Acq Const Original ReplacementSquare Feet Year Costs
1000674 NORTHWOOD IV APTS 674 Residence 8,029 7,141 1/1/1969 1/1/1969 80,374$ 425,180$ 1000675 NORTHWOOD IV APTS 675 Residence 10,679 9,423 1/1/1969 1/1/1969 106,813$ 565,042$ 1000676 NORTHWOOD IV APTS 676 Residence 6,727 5,977 1/1/1969 1/1/1969 67,155$ 355,249$ 1000677 NORTHWOOD IV APTS 677 Residence 8,104 7,142 1/1/1969 1/1/1969 80,903$ 427,978$ 1000678 NORTHWOOD IV APTS 678 Residence 7,046 6,264 1/1/1969 1/1/1969 70,328$ 372,033$ 1000679 NORTHWOOD IV APTS 679 Residence 3,159 2,712 1/1/1969 1/1/1969 31,727$ 167,834$ 1000680 NORTHWOOD IV APTS 680 Residence 7,967 7,095 1/1/1969 1/1/1969 79,846$ 422,383$ 1000681 NORTHWOOD IV APTS 681 Residence 8,348 7,428 1/1/1969 1/1/1969 83,547$ 441,964$ 1000682 NORTHWOOD IV APTS 682 Residence 11,045 9,807 1/1/1969 1/1/1969 110,515$ 584,623$ 1000683 NORTHWOOD IV APTS 683 Residence 6,727 5,977 1/1/1969 1/1/1969 67,155$ 355,249$ 1000684 NORTHWOOD IV APTS 684 Residence 1,479 1,338 1/1/1996 1/1/1996 tbd tbd1002701 NORTHWOOD V APTS 2701 Residence 5,603 4,992 1/1/1972 1/1/1972 59,984$ 242,936$ 1002702 NORTHWOOD V APTS 2702 Residence 10,695 10,344 1/1/1972 1/1/1972 114,774$ 464,834$ 1002703 NORTHWOOD V APTS 2703 Residence 9,393 8,736 1/1/1972 1/1/1972 100,551$ 407,230$ 1002704 NORTHWOOD V APTS 2704 Residence 5,603 4,992 1/1/1972 1/1/1972 59,984$ 242,936$ 1002705 NORTHWOOD V APTS 2705 Residence 9,393 9,096 1/1/1972 1/1/1972 100,551$ 407,230$ 1002706 NORTHWOOD V APTS 2706 Residence 9,393 9,096 1/1/1972 1/1/1972 100,551$ 407,230$ 1002707 NORTHWOOD V APTS 2707 Residence 5,603 4,992 1/1/1972 1/1/1972 59,984$ 242,936$ 1002708 NORTHWOOD V APTS 2708 Residence 8,091 7,848 1/1/1972 1/1/1972 86,575$ 350,629$ 1002709 NORTHWOOD V APTS 2709 Residence 6,218 5,064 1/1/1972 1/1/1972 66,168$ 267,981$ 1002710 NORTHWOOD V APTS 2710 Residence 9,393 8,736 1/1/1972 1/1/1972 100,551$ 407,230$ 1002711 NORTHWOOD V APTS 2711 Residence 8,091 7,488 1/1/1972 1/1/1972 86,575$ 350,629$ 1002712 NORTHWOOD V APTS 2712 Residence 6,789 6,240 1/1/1972 1/1/1972 72,352$ 293,026$ 1002713 NORTHWOOD V APTS 2713 Residence 5,603 4,992 1/1/1972 1/1/1972 59,984$ 242,936$ 1002714 NORTHWOOD V APTS 2714 Residence 6,789 6,600 1/1/1972 1/1/1972 72,352$ 293,026$ 1002715 NORTHWOOD V APTS 2715 Residence 5,603 4,992 1/1/1972 1/1/1972 59,984$ 242,936$ 1002716 NORTHWOOD V APTS 2716 Residence 8,091 7,488 1/1/1972 1/1/1972 86,575$ 350,629$ 1002717 NORTHWOOD V APTS 2717 Residence 6,218 5,064 1/1/1972 1/1/1972 66,168$ 267,981$ 1002718 NORTHWOOD V APTS 2718 Residence 6,218 5,064 1/1/1972 1/1/1972 66,168$ 267,981$ 1002719 NORTHWOOD V APTS 2719 Residence 5,603 4,992 1/1/1972 1/1/1972 59,984$ 242,936$ 1002720 NORTHWOOD V APTS 2720 Residence 5,603 4,992 1/1/1972 1/1/1972 59,984$ 242,936$ 1002721 NORTHWOOD V APTS 2721 Residence 5,603 4,992 1/1/1972 1/1/1972 59,984$ 242,936$ 1002722 NORTHWOOD V APTS 2722 Residence 9,393 9,096 1/1/1972 1/1/1972 100,551$ 407,230$ 1002723 NORTHWOOD V APTS 2723 Residence 5,603 4,992 1/1/1972 1/1/1972 59,984$ 242,936$ 1002724 NORTHWOOD V APTS 2724 Residence 6,789 6,240 1/1/1972 1/1/1972 72,352$ 293,026$ 1002725 NORTHWOOD V APTS 2725 Residence 6,789 6,240 1/1/1972 1/1/1972 72,352$ 293,026$ 1002726 NORTHWOOD V APTS 2726 Residence 6,218 5,064 1/1/1972 1/1/1972 66,168$ 267,981$ 1002727 NORTHWOOD V APTS 2727 Residence 6,218 5,064 1/1/1972 1/1/1972 66,168$ 267,981$ 1002728 NORTHWOOD V APTS 2728 Residence 5,603 4,992 1/1/1972 1/1/1972 59,984$ 242,936$ 1002729 NORTHWOOD V APTS 2729 Residence 6,789 6,240 1/1/1972 1/1/1972 72,352$ 293,026$ 1002730 NORTHWOOD V APTS 2730 Residence 5,603 4,992 1/1/1972 1/1/1972 59,984$ 242,936$ 1002731 NORTHWOOD V APTS 2731 Residence 6,789 6,240 1/1/1972 1/1/1972 72,352$ 293,026$ 1002732 NORTHWOOD V APTS 2732 Residence 8,091 7,488 1/1/1972 1/1/1972 86,575$ 350,629$ 1002733 NORTHWOOD V APTS 2733 Residence 9,393 9,096 1/1/1972 1/1/1972 100,551$ 407,230$ 1002734 NORTHWOOD V APTS 2734 Residence 8,091 7,488 1/1/1972 1/1/1972 86,575$ 350,629$ 1002735 NORTHWOOD V APTS 2735 Residence 5,603 4,992 1/1/1972 1/1/1972 59,984$ 242,936$ 1002736 NORTHWOOD V APTS 2736 Residence 5,603 4,992 1/1/1972 1/1/1972 59,984$ 242,936$ 1002737 NORTHWOOD V APTS 2737 Residence 6,218 5,064 1/1/1972 1/1/1972 66,168$ 267,981$ 1002738 NORTHWOOD V APTS 2738 Residence 5,603 4,992 1/1/1972 1/1/1972 59,984$ 242,936$ 1002739 NORTHWOOD V APTS 2739 Residence 6,789 6,240 1/1/1972 1/1/1972 72,352$ 293,026$ 1002740 NORTHWOOD V APTS 2740 Residence 8,091 7,848 1/1/1972 1/1/1972 86,575$ 350,629$ 1002741 NORTHWOOD V APTS 2741 Residence 8,091 7,848 1/1/1972 1/1/1972 86,575$ 350,629$ 1002742 NORTHWOOD V APTS 2742 Residence 9,393 8,736 1/1/1972 1/1/1972 100,551$ 407,230$ 1002743 NORTHWOOD V APTS 2743 Residence 5,603 4,992 1/1/1972 1/1/1972 59,984$ 242,936$ 1002744 NORTHWOOD V APTS 2744 Residence 8,091 7,488 1/1/1972 1/1/1972 86,575$ 350,629$ 1002745 NORTHWOOD V APTS 2745 Residence 9,393 8,736 1/1/1972 1/1/1972 100,551$ 407,230$ 1002746 NORTHWOOD V APTS 2746 Residence 5,603 4,992 1/1/1972 1/1/1972 59,984$ 242,936$ 1002747 NORTHWOOD V APTS 2747 Residence 5,603 4,992 1/1/1972 1/1/1972 59,984$ 242,936$ 1002748 NORTHWOOD V APTS 2748 Residence 5,603 4,992 1/1/1972 1/1/1972 59,984$ 242,936$ 1002749 NORTHWOOD V APTS 2749 Residence 6,789 6,240 1/1/1972 1/1/1972 72,352$ 293,026$ 1002750 NORTHWOOD V APTS 2750 Residence 6,789 6,600 1/1/1972 1/1/1972 72,352$ 293,026$ 1002751 NORTHWOOD V APTS 2751 Residence 5,603 4,992 1/1/1972 1/1/1972 59,984$ 242,936$ 1002752 NORTHWOOD V APTS 2752 Residence 8,091 7,848 1/1/1972 1/1/1972 86,575$ 350,629$ 1002753 NORTHWOOD V APTS 2753 Residence 5,603 4,992 1/1/1972 1/1/1972 59,984$ 242,936$
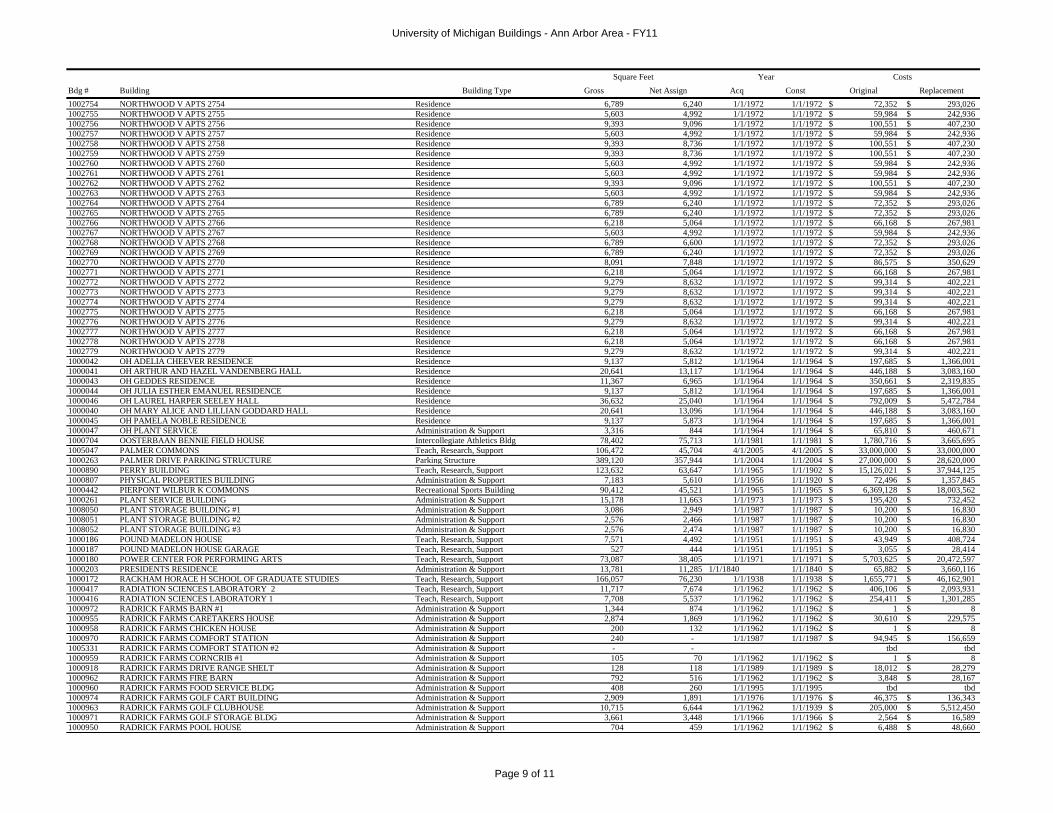
University of Michigan Buildings - Ann Arbor Area - FY11
Page 9 of 11
Bdg # Building Building Type Gross Net Assign Acq Const Original ReplacementSquare Feet Year Costs
1002754 NORTHWOOD V APTS 2754 Residence 6,789 6,240 1/1/1972 1/1/1972 72,352$ 293,026$ 1002755 NORTHWOOD V APTS 2755 Residence 5,603 4,992 1/1/1972 1/1/1972 59,984$ 242,936$ 1002756 NORTHWOOD V APTS 2756 Residence 9,393 9,096 1/1/1972 1/1/1972 100,551$ 407,230$ 1002757 NORTHWOOD V APTS 2757 Residence 5,603 4,992 1/1/1972 1/1/1972 59,984$ 242,936$ 1002758 NORTHWOOD V APTS 2758 Residence 9,393 8,736 1/1/1972 1/1/1972 100,551$ 407,230$ 1002759 NORTHWOOD V APTS 2759 Residence 9,393 8,736 1/1/1972 1/1/1972 100,551$ 407,230$ 1002760 NORTHWOOD V APTS 2760 Residence 5,603 4,992 1/1/1972 1/1/1972 59,984$ 242,936$ 1002761 NORTHWOOD V APTS 2761 Residence 5,603 4,992 1/1/1972 1/1/1972 59,984$ 242,936$ 1002762 NORTHWOOD V APTS 2762 Residence 9,393 9,096 1/1/1972 1/1/1972 100,551$ 407,230$ 1002763 NORTHWOOD V APTS 2763 Residence 5,603 4,992 1/1/1972 1/1/1972 59,984$ 242,936$ 1002764 NORTHWOOD V APTS 2764 Residence 6,789 6,240 1/1/1972 1/1/1972 72,352$ 293,026$ 1002765 NORTHWOOD V APTS 2765 Residence 6,789 6,240 1/1/1972 1/1/1972 72,352$ 293,026$ 1002766 NORTHWOOD V APTS 2766 Residence 6,218 5,064 1/1/1972 1/1/1972 66,168$ 267,981$ 1002767 NORTHWOOD V APTS 2767 Residence 5,603 4,992 1/1/1972 1/1/1972 59,984$ 242,936$ 1002768 NORTHWOOD V APTS 2768 Residence 6,789 6,600 1/1/1972 1/1/1972 72,352$ 293,026$ 1002769 NORTHWOOD V APTS 2769 Residence 6,789 6,240 1/1/1972 1/1/1972 72,352$ 293,026$ 1002770 NORTHWOOD V APTS 2770 Residence 8,091 7,848 1/1/1972 1/1/1972 86,575$ 350,629$ 1002771 NORTHWOOD V APTS 2771 Residence 6,218 5,064 1/1/1972 1/1/1972 66,168$ 267,981$ 1002772 NORTHWOOD V APTS 2772 Residence 9,279 8,632 1/1/1972 1/1/1972 99,314$ 402,221$ 1002773 NORTHWOOD V APTS 2773 Residence 9,279 8,632 1/1/1972 1/1/1972 99,314$ 402,221$ 1002774 NORTHWOOD V APTS 2774 Residence 9,279 8,632 1/1/1972 1/1/1972 99,314$ 402,221$ 1002775 NORTHWOOD V APTS 2775 Residence 6,218 5,064 1/1/1972 1/1/1972 66,168$ 267,981$ 1002776 NORTHWOOD V APTS 2776 Residence 9,279 8,632 1/1/1972 1/1/1972 99,314$ 402,221$ 1002777 NORTHWOOD V APTS 2777 Residence 6,218 5,064 1/1/1972 1/1/1972 66,168$ 267,981$ 1002778 NORTHWOOD V APTS 2778 Residence 6,218 5,064 1/1/1972 1/1/1972 66,168$ 267,981$ 1002779 NORTHWOOD V APTS 2779 Residence 9,279 8,632 1/1/1972 1/1/1972 99,314$ 402,221$ 1000042 OH ADELIA CHEEVER RESIDENCE Residence 9,137 5,812 1/1/1964 1/1/1964 197,685$ 1,366,001$ 1000041 OH ARTHUR AND HAZEL VANDENBERG HALL Residence 20,641 13,117 1/1/1964 1/1/1964 446,188$ 3,083,160$ 1000043 OH GEDDES RESIDENCE Residence 11,367 6,965 1/1/1964 1/1/1964 350,661$ 2,319,835$ 1000044 OH JULIA ESTHER EMANUEL RESIDENCE Residence 9,137 5,812 1/1/1964 1/1/1964 197,685$ 1,366,001$ 1000046 OH LAUREL HARPER SEELEY HALL Residence 36,632 25,040 1/1/1964 1/1/1964 792,009$ 5,472,784$ 1000040 OH MARY ALICE AND LILLIAN GODDARD HALL Residence 20,641 13,096 1/1/1964 1/1/1964 446,188$ 3,083,160$ 1000045 OH PAMELA NOBLE RESIDENCE Residence 9,137 5,873 1/1/1964 1/1/1964 197,685$ 1,366,001$ 1000047 OH PLANT SERVICE Administration & Support 3,316 844 1/1/1964 1/1/1964 65,810$ 460,671$ 1000704 OOSTERBAAN BENNIE FIELD HOUSE Intercollegiate Athletics Bldg 78,402 75,713 1/1/1981 1/1/1981 1,780,716$ 3,665,695$ 1005047 PALMER COMMONS Teach, Research, Support 106,472 45,704 4/1/2005 4/1/2005 33,000,000$ 33,000,000$ 1000263 PALMER DRIVE PARKING STRUCTURE Parking Structure 389,120 357,944 1/1/2004 1/1/2004 27,000,000$ 28,620,000$ 1000890 PERRY BUILDING Teach, Research, Support 123,632 63,647 1/1/1965 1/1/1902 15,126,021$ 37,944,125$ 1000807 PHYSICAL PROPERTIES BUILDING Administration & Support 7,183 5,610 1/1/1956 1/1/1920 72,496$ 1,357,845$ 1000442 PIERPONT WILBUR K COMMONS Recreational Sports Building 90,412 45,521 1/1/1965 1/1/1965 6,369,128$ 18,003,562$ 1000261 PLANT SERVICE BUILDING Administration & Support 15,178 11,663 1/1/1973 1/1/1973 195,420$ 732,452$ 1008050 PLANT STORAGE BUILDING #1 Administration & Support 3,086 2,949 1/1/1987 1/1/1987 10,200$ 16,830$ 1008051 PLANT STORAGE BUILDING #2 Administration & Support 2,576 2,466 1/1/1987 1/1/1987 10,200$ 16,830$ 1008052 PLANT STORAGE BUILDING #3 Administration & Support 2,576 2,474 1/1/1987 1/1/1987 10,200$ 16,830$ 1000186 POUND MADELON HOUSE Teach, Research, Support 7,571 4,492 1/1/1951 1/1/1951 43,949$ 408,724$ 1000187 POUND MADELON HOUSE GARAGE Teach, Research, Support 527 444 1/1/1951 1/1/1951 3,055$ 28,414$ 1000180 POWER CENTER FOR PERFORMING ARTS Teach, Research, Support 73,087 38,405 1/1/1971 1/1/1971 5,703,625$ 20,472,597$ 1000203 PRESIDENTS RESIDENCE Administration & Support 13,781 11,285 1/1/1840 1/1/1840 65,882$ 3,660,116$ 1000172 RACKHAM HORACE H SCHOOL OF GRADUATE STUDIES Teach, Research, Support 166,057 76,230 1/1/1938 1/1/1938 1,655,771$ 46,162,901$ 1000417 RADIATION SCIENCES LABORATORY 2 Teach, Research, Support 11,717 7,674 1/1/1962 1/1/1962 406,106$ 2,093,931$ 1000416 RADIATION SCIENCES LABORATORY 1 Teach, Research, Support 7,708 5,537 1/1/1962 1/1/1962 254,411$ 1,301,285$ 1000972 RADRICK FARMS BARN #1 Administration & Support 1,344 874 1/1/1962 1/1/1962 1$ 8$ 1000955 RADRICK FARMS CARETAKERS HOUSE Administration & Support 2,874 1,869 1/1/1962 1/1/1962 30,610$ 229,575$ 1000958 RADRICK FARMS CHICKEN HOUSE Administration & Support 200 132 1/1/1962 1/1/1962 1$ 8$ 1000970 RADRICK FARMS COMFORT STATION Administration & Support 240 - 1/1/1987 1/1/1987 94,945$ 156,659$ 1005331 RADRICK FARMS COMFORT STATION #2 Administration & Support - - tbd tbd1000959 RADRICK FARMS CORNCRIB #1 Administration & Support 105 70 1/1/1962 1/1/1962 1$ 8$ 1000918 RADRICK FARMS DRIVE RANGE SHELT Administration & Support 128 118 1/1/1989 1/1/1989 18,012$ 28,279$ 1000962 RADRICK FARMS FIRE BARN Administration & Support 792 516 1/1/1962 1/1/1962 3,848$ 28,167$ 1000960 RADRICK FARMS FOOD SERVICE BLDG Administration & Support 408 260 1/1/1995 1/1/1995 tbd tbd1000974 RADRICK FARMS GOLF CART BUILDING Administration & Support 2,909 1,891 1/1/1976 1/1/1976 46,375$ 136,343$ 1000963 RADRICK FARMS GOLF CLUBHOUSE Administration & Support 10,715 6,644 1/1/1962 1/1/1939 205,000$ 5,512,450$ 1000971 RADRICK FARMS GOLF STORAGE BLDG Administration & Support 3,661 3,448 1/1/1966 1/1/1966 2,564$ 16,589$ 1000950 RADRICK FARMS POOL HOUSE Administration & Support 704 459 1/1/1962 1/1/1962 6,488$ 48,660$
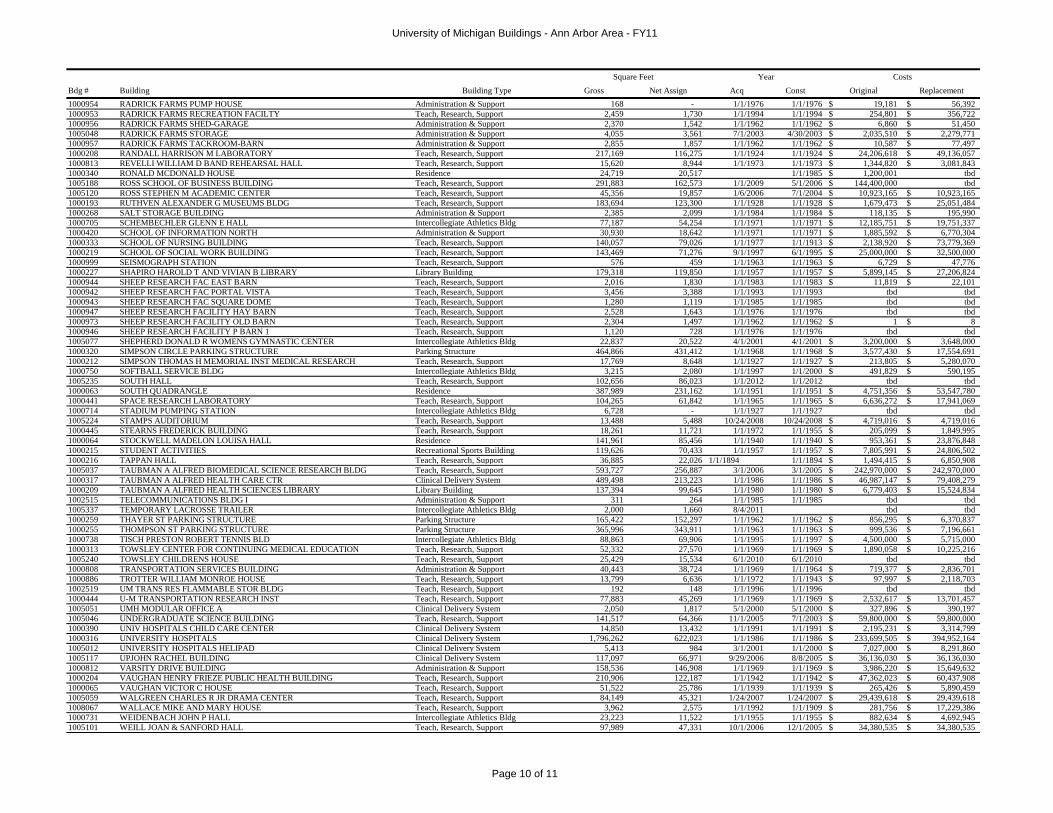
University of Michigan Buildings - Ann Arbor Area - FY11
Page 10 of 11
Bdg # Building Building Type Gross Net Assign Acq Const Original ReplacementSquare Feet Year Costs
1000954 RADRICK FARMS PUMP HOUSE Administration & Support 168 - 1/1/1976 1/1/1976 19,181$ 56,392$ 1000953 RADRICK FARMS RECREATION FACILTY Teach, Research, Support 2,459 1,730 1/1/1994 1/1/1994 254,801$ 356,722$ 1000956 RADRICK FARMS SHED-GARAGE Administration & Support 2,370 1,542 1/1/1962 1/1/1962 6,860$ 51,450$ 1005048 RADRICK FARMS STORAGE Administration & Support 4,055 3,561 7/1/2003 4/30/2003 2,035,510$ 2,279,771$ 1000957 RADRICK FARMS TACKROOM-BARN Administration & Support 2,855 1,857 1/1/1962 1/1/1962 10,587$ 77,497$ 1000208 RANDALL HARRISON M LABORATORY Teach, Research, Support 217,169 116,275 1/1/1924 1/1/1924 24,206,618$ 49,136,057$ 1000813 REVELLI WILLIAM D BAND REHEARSAL HALL Teach, Research, Support 15,620 8,944 1/1/1973 1/1/1973 1,344,820$ 3,081,843$ 1000340 RONALD MCDONALD HOUSE Residence 24,719 20,517 1/1/1985 1,200,001$ tbd1005188 ROSS SCHOOL OF BUSINESS BUILDING Teach, Research, Support 291,883 162,573 1/1/2009 5/1/2006 144,400,000$ tbd1005120 ROSS STEPHEN M ACADEMIC CENTER Teach, Research, Support 45,356 19,857 1/6/2006 7/1/2004 10,923,165$ 10,923,165$ 1000193 RUTHVEN ALEXANDER G MUSEUMS BLDG Teach, Research, Support 183,694 123,300 1/1/1928 1/1/1928 1,679,473$ 25,051,484$ 1000268 SALT STORAGE BUILDING Administration & Support 2,385 2,099 1/1/1984 1/1/1984 118,135$ 195,990$ 1000705 SCHEMBECHLER GLENN E HALL Intercollegiate Athletics Bldg 77,187 54,254 1/1/1971 1/1/1971 12,185,751$ 19,751,337$ 1000420 SCHOOL OF INFORMATION NORTH Administration & Support 30,930 18,642 1/1/1971 1/1/1971 1,885,592$ 6,770,304$ 1000333 SCHOOL OF NURSING BUILDING Teach, Research, Support 140,057 79,026 1/1/1977 1/1/1913 2,138,920$ 73,779,369$ 1000219 SCHOOL OF SOCIAL WORK BUILDING Teach, Research, Support 143,469 71,276 9/1/1997 6/1/1995 25,000,000$ 32,500,000$ 1000999 SEISMOGRAPH STATION Teach, Research, Support 576 459 1/1/1963 1/1/1963 6,729$ 47,776$ 1000227 SHAPIRO HAROLD T AND VIVIAN B LIBRARY Library Building 179,318 119,850 1/1/1957 1/1/1957 5,899,145$ 27,206,824$ 1000944 SHEEP RESEARCH FAC EAST BARN Teach, Research, Support 2,016 1,830 1/1/1983 1/1/1983 11,819$ 22,101$ 1000942 SHEEP RESEARCH FAC PORTAL VISTA Teach, Research, Support 3,456 3,388 1/1/1993 1/1/1993 tbd tbd1000943 SHEEP RESEARCH FAC SQUARE DOME Teach, Research, Support 1,280 1,119 1/1/1985 1/1/1985 tbd tbd1000947 SHEEP RESEARCH FACILITY HAY BARN Teach, Research, Support 2,528 1,643 1/1/1976 1/1/1976 tbd tbd1000973 SHEEP RESEARCH FACILITY OLD BARN Teach, Research, Support 2,304 1,497 1/1/1962 1/1/1962 1$ 8$ 1000946 SHEEP RESEARCH FACILITY P BARN 1 Teach, Research, Support 1,120 728 1/1/1976 1/1/1976 tbd tbd1005077 SHEPHERD DONALD R WOMENS GYMNASTIC CENTER Intercollegiate Athletics Bldg 22,837 20,522 4/1/2001 4/1/2001 3,200,000$ 3,648,000$ 1000320 SIMPSON CIRCLE PARKING STRUCTURE Parking Structure 464,866 431,412 1/1/1968 1/1/1968 3,577,430$ 17,554,691$ 1000212 SIMPSON THOMAS H MEMORIAL INST MEDICAL RESEARCH Teach, Research, Support 17,769 8,648 1/1/1927 1/1/1927 213,805$ 5,280,070$ 1000750 SOFTBALL SERVICE BLDG Intercollegiate Athletics Bldg 3,215 2,080 1/1/1997 1/1/2000 491,829$ 590,195$ 1005235 SOUTH HALL Teach, Research, Support 102,656 86,023 1/1/2012 1/1/2012 tbd tbd1000063 SOUTH QUADRANGLE Residence 387,989 231,162 1/1/1951 1/1/1951 4,751,356$ 53,547,780$ 1000441 SPACE RESEARCH LABORATORY Teach, Research, Support 104,265 61,842 1/1/1965 1/1/1965 6,636,272$ 17,941,069$ 1000714 STADIUM PUMPING STATION Intercollegiate Athletics Bldg 6,728 - 1/1/1927 1/1/1927 tbd tbd1005224 STAMPS AUDITORIUM Teach, Research, Support 13,488 5,488 10/24/2008 10/24/2008 4,719,016$ 4,719,016$ 1000445 STEARNS FREDERICK BUILDING Teach, Research, Support 18,261 11,721 1/1/1972 1/1/1955 205,099$ 1,849,995$ 1000064 STOCKWELL MADELON LOUISA HALL Residence 141,961 85,456 1/1/1940 1/1/1940 953,361$ 23,876,848$ 1000215 STUDENT ACTIVITIES Recreational Sports Building 119,626 70,433 1/1/1957 1/1/1957 7,805,991$ 24,806,502$ 1000216 TAPPAN HALL Teach, Research, Support 36,885 22,026 1/1/1894 1/1/1894 1,494,415$ 6,850,908$ 1005037 TAUBMAN A ALFRED BIOMEDICAL SCIENCE RESEARCH BLDG Teach, Research, Support 593,727 256,887 3/1/2006 3/1/2005 242,970,000$ 242,970,000$ 1000317 TAUBMAN A ALFRED HEALTH CARE CTR Clinical Delivery System 489,498 213,223 1/1/1986 1/1/1986 46,987,147$ 79,408,279$ 1000209 TAUBMAN A ALFRED HEALTH SCIENCES LIBRARY Library Building 137,394 99,645 1/1/1980 1/1/1980 6,779,403$ 15,524,834$ 1002515 TELECOMMUNICATIONS BLDG I Administration & Support 311 264 1/1/1985 1/1/1985 tbd tbd1005337 TEMPORARY LACROSSE TRAILER Intercollegiate Athletics Bldg 2,000 1,660 8/4/2011 tbd tbd1000259 THAYER ST PARKING STRUCTURE Parking Structure 165,422 152,297 1/1/1962 1/1/1962 856,295$ 6,370,837$ 1000255 THOMPSON ST PARKING STRUCTURE Parking Structure 365,996 343,911 1/1/1963 1/1/1963 999,536$ 7,196,661$ 1000738 TISCH PRESTON ROBERT TENNIS BLD Intercollegiate Athletics Bldg 88,863 69,906 1/1/1995 1/1/1997 4,500,000$ 5,715,000$ 1000313 TOWSLEY CENTER FOR CONTINUING MEDICAL EDUCATION Teach, Research, Support 52,332 27,570 1/1/1969 1/1/1969 1,890,058$ 10,225,216$ 1005240 TOWSLEY CHILDRENS HOUSE Teach, Research, Support 25,429 15,534 6/1/2010 6/1/2010 tbd tbd1000808 TRANSPORTATION SERVICES BUILDING Administration & Support 40,443 38,724 1/1/1969 1/1/1964 719,377$ 2,836,701$ 1000886 TROTTER WILLIAM MONROE HOUSE Teach, Research, Support 13,799 6,636 1/1/1972 1/1/1943 97,997$ 2,118,703$ 1002519 UM TRANS RES FLAMMABLE STOR BLDG Teach, Research, Support 192 148 1/1/1996 1/1/1996 tbd tbd1000444 U-M TRANSPORTATION RESEARCH INST Teach, Research, Support 77,883 45,269 1/1/1969 1/1/1969 2,532,617$ 13,701,457$ 1005051 UMH MODULAR OFFICE A Clinical Delivery System 2,050 1,817 5/1/2000 5/1/2000 327,896$ 390,197$ 1005046 UNDERGRADUATE SCIENCE BUILDING Teach, Research, Support 141,517 64,366 11/1/2005 7/1/2003 59,800,000$ 59,800,000$ 1000390 UNIV HOSPITALS CHILD CARE CENTER Clinical Delivery System 14,850 13,432 1/1/1991 1/1/1991 2,195,231$ 3,314,799$ 1000316 UNIVERSITY HOSPITALS Clinical Delivery System 1,796,262 622,023 1/1/1986 1/1/1986 233,699,505$ 394,952,164$ 1005012 UNIVERSITY HOSPITALS HELIPAD Clinical Delivery System 5,413 984 3/1/2001 1/1/2000 7,027,000$ 8,291,860$ 1005117 UPJOHN RACHEL BUILDING Clinical Delivery System 117,097 66,971 9/29/2006 8/8/2005 36,136,030$ 36,136,030$ 1000812 VARSITY DRIVE BUILDING Administration & Support 158,536 146,908 1/1/1969 1/1/1969 3,986,220$ 15,649,632$ 1000204 VAUGHAN HENRY FRIEZE PUBLIC HEALTH BUILDING Teach, Research, Support 210,906 122,187 1/1/1942 1/1/1942 47,362,023$ 60,437,908$ 1000065 VAUGHAN VICTOR C HOUSE Teach, Research, Support 51,522 25,786 1/1/1939 1/1/1939 265,426$ 5,890,459$ 1005059 WALGREEN CHARLES R JR DRAMA CENTER Teach, Research, Support 84,149 45,321 1/24/2007 1/24/2007 29,439,618$ 29,439,618$ 1008067 WALLACE MIKE AND MARY HOUSE Teach, Research, Support 3,962 2,575 1/1/1992 1/1/1909 281,756$ 17,229,386$ 1000731 WEIDENBACH JOHN P HALL Intercollegiate Athletics Bldg 23,223 11,522 1/1/1955 1/1/1955 882,634$ 4,692,945$ 1005101 WEILL JOAN & SANFORD HALL Teach, Research, Support 97,989 47,331 10/1/2006 12/1/2005 34,380,535$ 34,380,535$
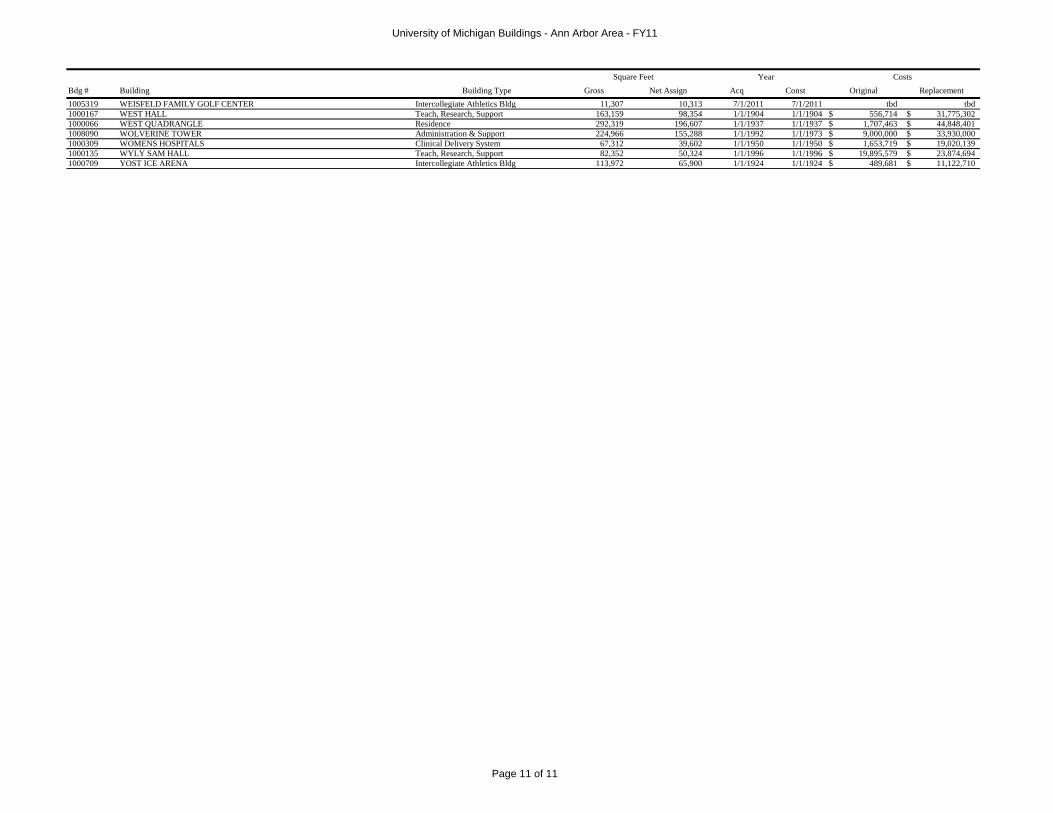
University of Michigan Buildings - Ann Arbor Area - FY11
Page 11 of 11
Bdg # Building Building Type Gross Net Assign Acq Const Original ReplacementSquare Feet Year Costs
1005319 WEISFELD FAMILY GOLF CENTER Intercollegiate Athletics Bldg 11,307 10,313 7/1/2011 7/1/2011 tbd tbd1000167 WEST HALL Teach, Research, Support 163,159 98,354 1/1/1904 1/1/1904 556,714$ 31,775,302$ 1000066 WEST QUADRANGLE Residence 292,319 196,607 1/1/1937 1/1/1937 1,707,463$ 44,848,401$ 1008090 WOLVERINE TOWER Administration & Support 224,966 155,288 1/1/1992 1/1/1973 9,000,000$ 33,930,000$ 1000309 WOMENS HOSPITALS Clinical Delivery System 67,312 39,602 1/1/1950 1/1/1950 1,653,719$ 19,020,139$ 1000135 WYLY SAM HALL Teach, Research, Support 82,352 50,324 1/1/1996 1/1/1996 19,895,579$ 23,874,694$ 1000709 YOST ICE ARENA Intercollegiate Athletics Bldg 113,972 65,900 1/1/1924 1/1/1924 489,681$ 11,122,710$

Section VIII
FCA Program
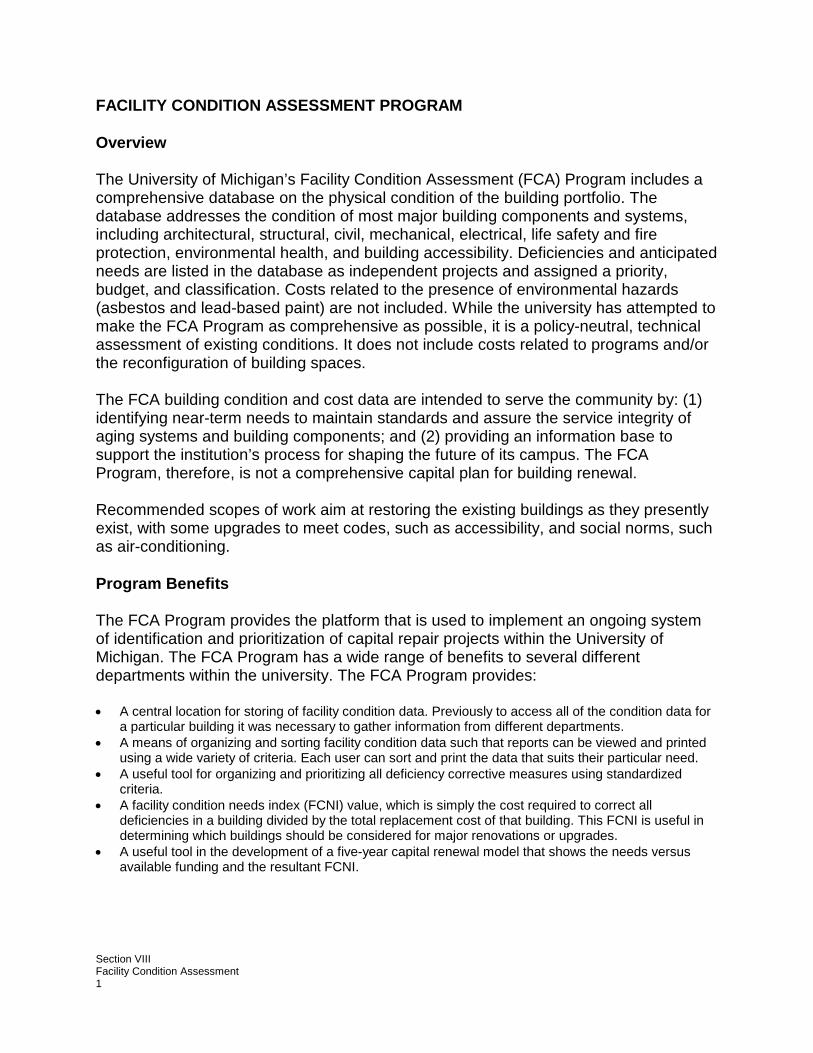
Section VIII Facility Condition Assessment 1
FACILITY CONDITION ASSESSMENT PROGRAM Overview The University of Michigan’s Facility Condition Assessment (FCA) Program includes a comprehensive database on the physical condition of the building portfolio. The database addresses the condition of most major building components and systems, including architectural, structural, civil, mechanical, electrical, life safety and fire protection, environmental health, and building accessibility. Deficiencies and anticipated needs are listed in the database as independent projects and assigned a priority, budget, and classification. Costs related to the presence of environmental hazards (asbestos and lead-based paint) are not included. While the university has attempted to make the FCA Program as comprehensive as possible, it is a policy-neutral, technical assessment of existing conditions. It does not include costs related to programs and/or the reconfiguration of building spaces. The FCA building condition and cost data are intended to serve the community by: (1) identifying near-term needs to maintain standards and assure the service integrity of aging systems and building components; and (2) providing an information base to support the institution’s process for shaping the future of its campus. The FCA Program, therefore, is not a comprehensive capital plan for building renewal. Recommended scopes of work aim at restoring the existing buildings as they presently exist, with some upgrades to meet codes, such as accessibility, and social norms, such as air-conditioning. Program Benefits The FCA Program provides the platform that is used to implement an ongoing system of identification and prioritization of capital repair projects within the University of Michigan. The FCA Program has a wide range of benefits to several different departments within the university. The FCA Program provides: • A central location for storing of facility condition data. Previously to access all of the condition data for
a particular building it was necessary to gather information from different departments. • A means of organizing and sorting facility condition data such that reports can be viewed and printed
using a wide variety of criteria. Each user can sort and print the data that suits their particular need. • A useful tool for organizing and prioritizing all deficiency corrective measures using standardized
criteria. • A facility condition needs index (FCNI) value, which is simply the cost required to correct all
deficiencies in a building divided by the total replacement cost of that building. This FCNI is useful in determining which buildings should be considered for major renovations or upgrades.
• A useful tool in the development of a five-year capital renewal model that shows the needs versus available funding and the resultant FCNI.
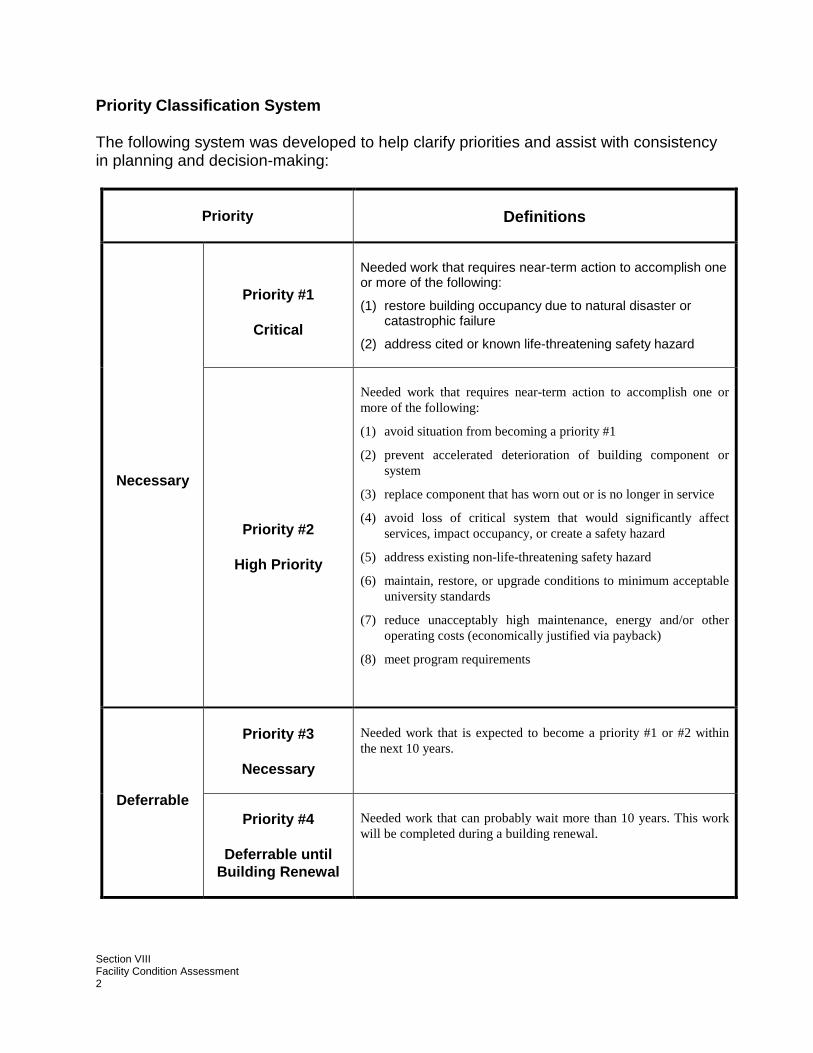
Section VIII Facility Condition Assessment 2
Priority Classification System The following system was developed to help clarify priorities and assist with consistency in planning and decision-making:
Priority Definitions
Necessary
Priority #1
Critical
Needed work that requires near-term action to accomplish one or more of the following:
(1) restore building occupancy due to natural disaster or catastrophic failure
(2) address cited or known life-threatening safety hazard
Priority #2
High Priority
Needed work that requires near-term action to accomplish one or more of the following:
(1) avoid situation from becoming a priority #1
(2) prevent accelerated deterioration of building component or system
(3) replace component that has worn out or is no longer in service
(4) avoid loss of critical system that would significantly affect services, impact occupancy, or create a safety hazard
(5) address existing non-life-threatening safety hazard
(6) maintain, restore, or upgrade conditions to minimum acceptable university standards
(7) reduce unacceptably high maintenance, energy and/or other operating costs (economically justified via payback)
(8) meet program requirements
Deferrable
Priority #3
Necessary
Needed work that is expected to become a priority #1 or #2 within the next 10 years.
Priority #4
Deferrable until Building Renewal
Needed work that can probably wait more than 10 years. This work will be completed during a building renewal.
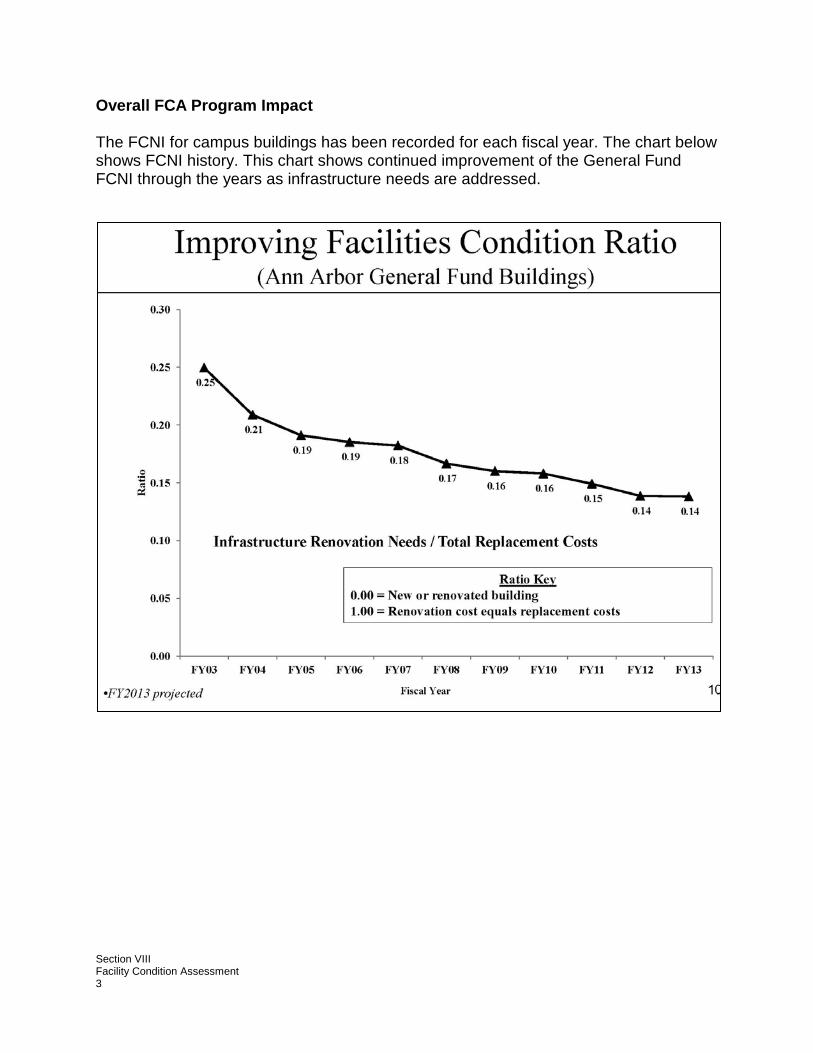
Section VIII Facility Condition Assessment 3
Overall FCA Program Impact The FCNI for campus buildings has been recorded for each fiscal year. The chart below shows FCNI history. This chart shows continued improvement of the General Fund FCNI through the years as infrastructure needs are addressed.