Law Enforcement National Data Exchange BJA Regional Information Sharing Conference
Five-minute parameter of thromboelastometry is sufficient todetect thrombocytopenia and hypofibrinogenaemia inpatients undergoing liver transplantationJ.-G. Song, S.-M. Jeong, I.-G. Jun, H.-M. Lee and G.-S. Hwang*
Department of Anaesthesiology and Pain Medicine, Asan Medical Center, University of Ulsan College of Medicine, Seoul, Republic of Korea
* Corresponding author. E-mail: [email protected]
Editor’s key points
† Rapid diagnosis ofcoagulopathy is critical toappropriate treatment ofperioperative bleeding.
† Early parameters of clotformation measured byrotationalthromboelastometrywere studied in livertransplant patients.
† The clot amplitude at 5min correlated with lowplatelet counts and lowfibrinogen concentration,which might serve as arapid guide to transfusionin these patients.
Background. Early detection of coagulopathy is important to prevent bleeding during livertransplantation (LT). Rotation thromboelastometry (ROTEMw) provides the earliest parameter ofclot amplitudes at 5 min (A5). We evaluated whether A5 correlates with platelet count (PLT) andfibrinogen concentration (Fib) and can predict thrombocytopenia and hypofibrinogenaemia inhypocoagulable patients undergoing living-donor LT (LDLT).
Methods. A total of 3446 retrospective ROTEMw measurements, including 1139 EXTEM, 1182INTEM, and 1125 FIBTEM, with simultaneously measured PLT and Fib, were analysed duringLDLT in 239 patients. The correlations between A5 and maximum clot firmness (MCF) index, PLT,and Fib were calculated. Receiver operating characteristic analysis with area under the curve(AUC) was used to assess A5 thresholds predictive of PLT and Fib.
Results. The median PLT was 47 000 mm23 and the median Fib was 100 mg dl21 during LDLT. TheA5parametersofEXTEM(A5EXTEM)andINTEM(A5INTEM)werehighlycorrelatedwithMCF(r¼0.96andr¼0.95, respectively), PLT (r¼0.76 and r¼0.77, respectively), and Fib (r¼0.63 and r¼0.64,respectively). A5 of FIBTEM (A5FIBTEM) was also correlated with MCF (r¼0.91) and Fib(r¼0.75). A5EXTEM thresholds of 15 and 19 mm predicted PLT,30 000 mm23 (AUC¼0.90) and,50 000 mm23 (AUC¼0.87), respectively, whereas A5FIBTEM 4 mm predicted Fib,100 mg dl21
(AUC¼0.86). Biases from A5EXTEM and A5FIBTEM to their MCFs were 16.4 and 1.3 mm, respectively.
Conclusions. A5 as an early variable of clot firmness is effective in detecting critically low PLTandFib. A5 can therefore be a reliable fast index guiding transfusion therapy in hypocoagulablepatients undergoing LDLT.
Keywords: blood coagulation; liver transplantation; thromboelastometry
Accepted for publication: 2 July 2013
Patients who undergo liver transplantation (LT) often experi-ence massive bleeding requiring transfusion. The transfusion ofmany allogeneic blood products, however, without a fast and re-liable monitoring system, can furtheraggravate the haemostaticdisorders of thesepatients, resulting inpooroveralloutcomes.1–4
Early detection and timely correction of coagulopathy are crucialin preventing further exacerbation of bleeding diathesis and inbreaking the vicious cycle of coagulopathy during LT, in additionto improving overall patient outcomes.
Rotation thromboelastometry (ROTEMw delta, TEM Inter-national GmbH, Munich, Germany) is a point-of-care coagula-tion monitoring system that evaluates the viscoelasticity ofwhole blood, allowing the entire clotting process, from clot ini-tiation and formation to clot stability, to be assessed.5 6 Incontrast to conventional laboratory tests [e.g. measurementsof platelet count (PLT), prothrombin time (PT), activatedpartial thromboplastin time (aPTT), and fibrinogen concentra-tion (Fib)], ROTEMw can measure early variables, such as clot
amplitude at 5 min (A5) and 10 min (A10) after clotting time(CT) in EXTEM, INTEM, and FIBTEM. Owing to its rapid assess-ment of PLTand Fib, ROTEMw is frequently used to guide transfu-sion therapy.7–10 Moreover, a recent study with a large databasedemonstrated that early measures of clot firmness, including A5,A10, and clot amplitude at 15 min (A15), are linearly correlatedwithROTEMwdeterminedmaximumclotfirmness(MCF),allowingthe fast and reliable prediction of MCF in non-cardiac patients, in-cluding those with subnormal, normal, and supranormal MCFvalues.11
The A10 of EXTEM (A10EXTEM) was shown to be rapid andvaluable in predicting coagulation status, and also being usefulin assessing the need for perioperative transfusion of plateletsand fibringen.8 The correlations of the more rapid A5 with PLTcount and Fib concentration have not been determined, and itremains unclear whether A5 could determine quantitative PLTand Fib level in hypocoagulable patients undergoing living-donorLT (LDLT) surgery. We therefore assessed whether A5 on ROTEMw
British Journal of Anaesthesia 112 (2): 290–7 (2014)Advance Access publication 24 September 2013 . doi:10.1093/bja/aet325
& The Author [2013]. Published by Oxford University Press on behalf of the British Journal of Anaesthesia. All rights reserved.For Permissions, please email: [email protected]
Dow
nloaded from https://academ
ic.oup.com/bja/article-abstract/112/2/290/285142 by guest on 04 April 2019
analysis is an early and reliable index for the transfusion of PLTand Fib during LDLT. We also assessed A5 cut-off values predict-ing thrombocytopenia and hypofibrinogenaemia in patientsundergoing LDLT.
MethodsPatients
A total of 401 patients who underwent LT at Asan MedicalCenter, Seoul, Republic of Korea, between June 2010 and May2011 were enrolled. Of these, 162 patients were excludedfrom this analysis, including 73 who received orthotopic LT,53 who had incomplete ROTEMw and laboratory test data, and36 patients aged ,18 yr. The remaining 239 LDLT recipientswere included in this retrospective analysis. Records about an-aesthesia, available on computerized databases, were analysedretrospectively. This study protocol was approved by the Institu-tional Review Board of the Asan Medical Center.
Anaesthetic technique
General anaesthesia for LDLTsurgery was performed accordingto our institutional standard protocol.12 Briefly, anaesthesia wasinduced with i.v. thiopental, fentanyl, and vecuronium, andmaintained with1%sevoflurane, a50% O2/air mixture,and con-tinuous infusion with fentanyl and vecuronium. Twenty-gaugefemoral and radial arterial catheters were inserted to monitorarterial pressure and to sample blood. A 7.5 French pulmonaryartery catheter (Swan–Ganz CCOmbo V CCO/SvO2/CEDV,Edwards Lifesciences LLC, CA, USA) was inserted to monitorhaemodynamic variables. Body temperature was measuredusing a thermistor in a pulmonary artery catheter. Transfusionsof packed red blood cells, fresh-frozen plasma, and cryoprecipi-tate were based on clinical decisions or guided by standard la-boratory tests or the transfusion algorithm based on ROTEMparameters. According to institutional standards, transfusionswere administered to maintain PT,2.0 INR, Fib.100 mg dl21,and PLT.30 000 mm23. Synthetic colloidal solution was notused, but solutions of 5% albumin with balanced crystalloidwere administered during LDLT.
Blood sampling and thromboelastomery
During LDLT, standard coagulation assays and ROTEMw testswereroutinelyperformed,usingbloodsamplesatpre-establishedtime points, including 1 h after induction of general anaesthe-sia, 1 h after surgical incision, 30 min after hepatectomy, and30 min after graft reperfusion and after hepatic artery anasto-mosis. ROTEMw tests were performed according to the manu-facturer’s instructions, using equipment and test reagentsprovided by Tem International GmbH. The ROTEMw devicewas placed in the operating theatre and all tests were per-formed by transplantation anaesthesiologists or anaesthesianurses trained to perform ROTEMw tests. Of the ROTEMw testsperformed, inadequate runtime, patients who received throm-bin inhibitor or signs of hyperfibrinolysis were excluded. Finally,1139 EXTEM, 1182 INTEM, and 1125 FIBTEM tests wereincluded in the study. ROTEMw variables recorded included: (i)clotting time (CT), defined as the time (s) from the start of
measurement to the initiation of clotting, defined as a clotfirmness of 2 mm; (ii) clot formation time (CFT), defined asthe time (s) from initiation of clotting until a clot firmness of20 mm; (iii) MCF, defined as the maximal amplitude (mm) ofthe graphical trace of clot firmness; (iv) a-angle (a), definedas the tangent to the graphic trace at an amplitude of 2 mm;and A5 and A10 (mm), which reflect the amplitudes 5 and 10min, respectively, after CT. At each time point, blood sampleswere withdrawn from the radial artery, and haemoglobin, PT,PLT, and Fib were measured.
Standard coagulation assays
PT was assessed using Thromborel S kits (Siemens HealthcareDiagnostics, GmbH, Marburg, Germany), and fibrinogen wasassayed using the Dade Thrombin Reagent (Siemens Health-care Diagnostics). All tests were performed using an automaticcoagulation analyser (Sysmex CA-7000, Siemens HealthcareDiagnostics).
Statistical analyses
Continuous variables were expressed as median (inter-quartilerange) or mean [standard deviation (SD)]. Between-group com-parisons were evaluated using the x2 test, Fisher’s exact tests,t-tests, and Mann–Whitney U-tests, as appropriate. Correla-tions between standard coagulation test results and those per-formed on ROTEMw were analysed using Spearman’s rankcorrelation coefficient (r). The Bland–Altman analyses13 wereperformed to estimate the mean difference (bias) (SD) betweenearly measures of clot firmness (A5 and A10) and MCF. Receiveroperating characteristic (ROC) curves and the area under the
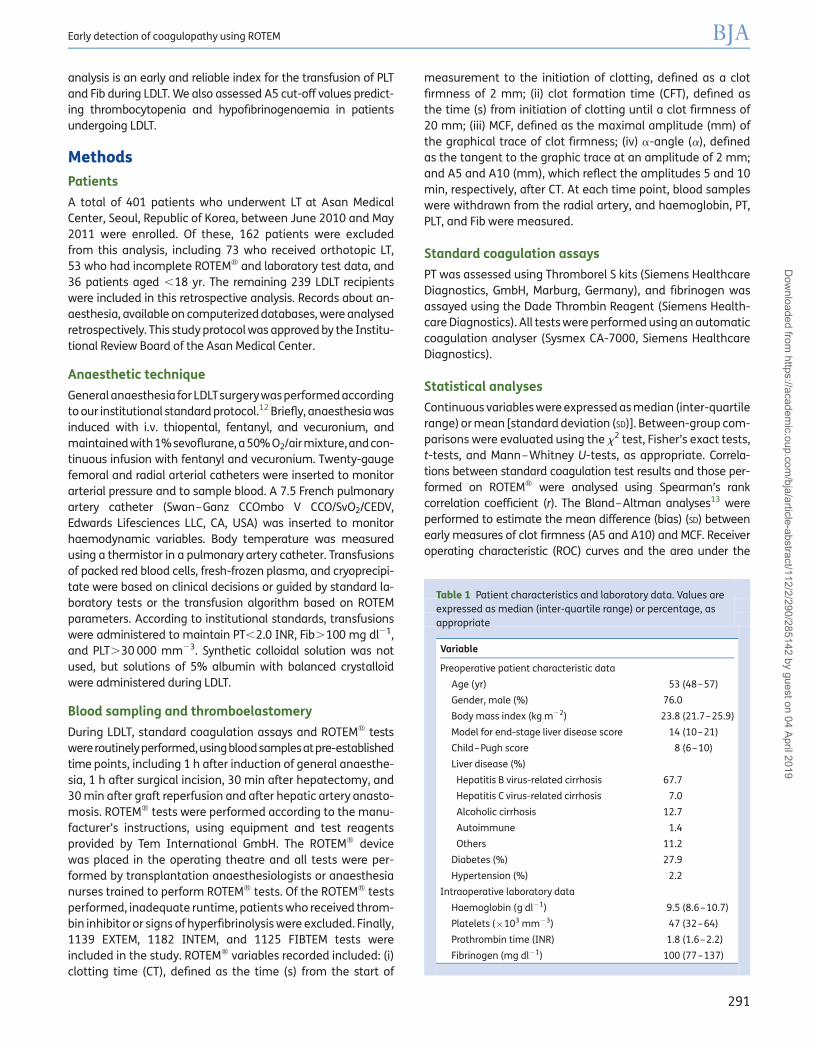
Table 1 Patient characteristics and laboratory data. Values areexpressed as median (inter-quartile range) or percentage, asappropriate
Variable
Preoperative patient characteristic data
Age (yr) 53 (48–57)
Gender, male (%) 76.0
Body mass index (kg m22) 23.8 (21.7–25.9)
Model for end-stage liver disease score 14 (10–21)
Child–Pugh score 8 (6–10)
Liver disease (%)
Hepatitis B virus-related cirrhosis 67.7
Hepatitis C virus-related cirrhosis 7.0
Alcoholic cirrhosis 12.7
Autoimmune 1.4
Others 11.2
Diabetes (%) 27.9
Hypertension (%) 2.2
Intraoperative laboratory data
Haemoglobin (g dl21) 9.5 (8.6–10.7)
Platelets (×103 mm23) 47 (32–64)
Prothrombin time (INR) 1.8 (1.6–2.2)
Fibrinogen (mg dl21) 100 (77–137)
Early detection of coagulopathy using ROTEM BJA
291
Dow
nloaded from https://academ
ic.oup.com/bja/article-abstract/112/2/290/285142 by guest on 04 April 2019

curve (AUC) was used to determine the optimal cut-off valuesof A5, A10, and MCF on EXTEM, INTEM, and FIBTEM predictingPLT counts ,30 000 and ,50 000 mm23 and Fib concentra-tions ,100 mg dl21. Sensitivity and specificity were also calcu-lated. All statistical analyses were performed using Medcalcw
(Medcalc Software, Mariakerke, Belgium) statistical software.A two-tailed P-value of ,0.05 was considered statisticallysignificant.
ResultsThe patient characteristics, intraoperative laboratory data,and liver transplant results of the 239 included patients areshown in Table 1. During LDLT, the median (inter-quartilerange) PLT was 47 000 (32 000–64 000) mm23, the medianFib was 100 mg dl21 (772137 mg dl21), and the median PTwas 1.8 (1.6–2.2) INR, demonstrating that these patients
0
80
60
40
20
0
80
60
40
20
25
20
15
10
5
0
25
20
15
10
5
00 5 10 15 20 25 30 0 5 10 15 20 25 30
0
80
60
40
20
0
80
60
40
20
0 10 20 30 40 50 50 70 80 0 10 20 30 40 50 50 70 80
0 10 20 30 40 50 50 70 800 10 20 30 40 50 50 70 80
r=0.961
r=0.975 r=0.965
r=0.951r=0.907
r=0.950
EX
TE
M A
5 (m
m)
EXTEM MCF (mm)
EXTEM MCF (mm)
INTEM MCF (mm)
INTEM MCF (mm)
INT
EM
A5
(mm
)
EX
TE
M A
10 (
mm
)F
IBT
EM
A5
(mm
)
FIBTEM MCF (mm) FIBTEM MCF (mm)
FIB
TE
M A
10 (
mm
)IN
TE
M A
10 (
mm
)
Fig 1 Correlations between early ROTEM parameters and MCF. Early ROTEM parameters (A5 and A10) on all ROTEM assays (EXTEM, INTEM, andFIBTEM) demonstrated excellent correlations with MCF.
BJA Song et al.
292
Dow
nloaded from https://academ
ic.oup.com/bja/article-abstract/112/2/290/285142 by guest on 04 April 2019
were in a hypocoagulable state. We found that 1026 analyses(90.1%) of MCFEXTEM and 1069 (90.4%) of MCFINTEM presentedvalues below the reference range (,50 mm each), whereas inFIBTEM analysis, 823 assays (73.2%) of MCFFIBTEM were belowthe reference range (MCFFIBTEM,9 mm). Correlation analysesbetween ROTEMw parameters (A5, A10, and MCF of EXTEM,INTEM, and FIBTEM) are shown in Figure 1. Among the ROTEMw
parameters, both A5EXTEM (r¼0.961, P,0.0001) and A10EXTEM
(r¼0.975, P,0.0001) were highly correlated with MCFEXTEM, andalso with MCFINTEM (r¼0.950 and r¼0.965, respectively;P,0.0001 each). In addition, A5FIBTEM (r¼0.907, P,0.0001) andA10FIBTEM (r¼0.951, P,0.0001) showed high correlation withMCFFIBTEM.
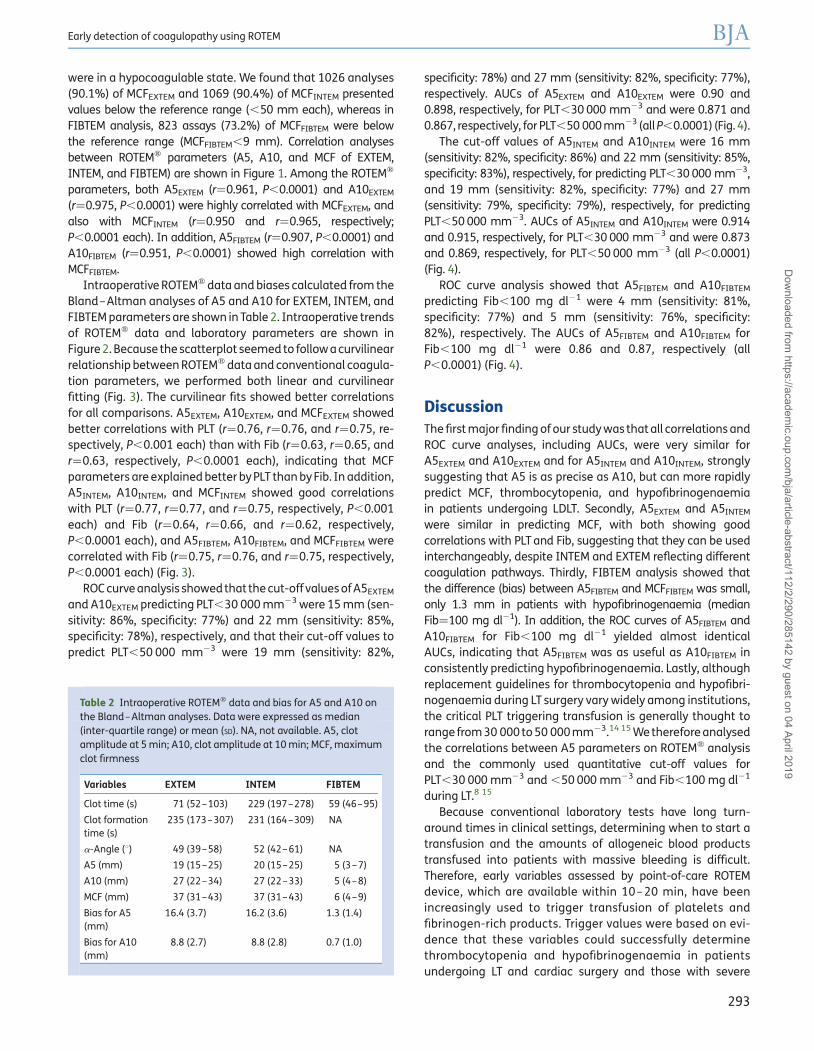
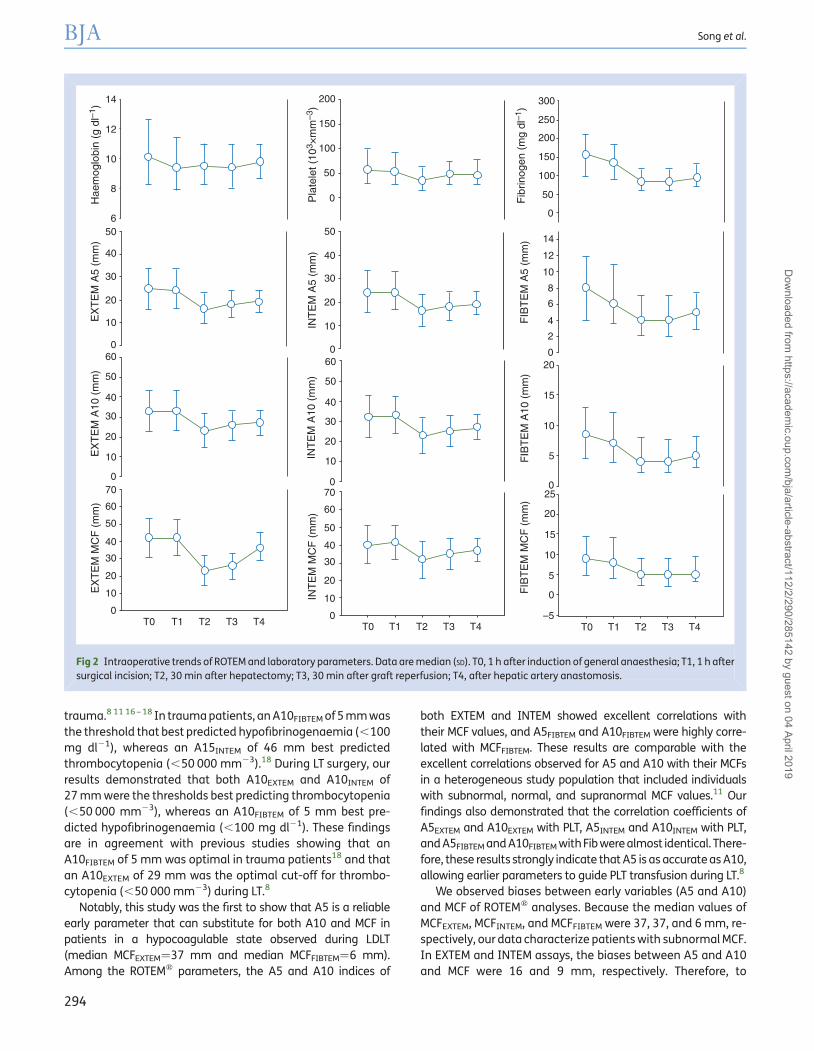
Intraoperative ROTEMw data and biases calculated from theBland–Altman analyses of A5 and A10 for EXTEM, INTEM, andFIBTEM parameters are shown in Table 2. Intraoperative trendsof ROTEMw data and laboratory parameters are shown inFigure 2. Because the scatterplot seemed to follow a curvilinearrelationship between ROTEMw data and conventional coagula-tion parameters, we performed both linear and curvilinearfitting (Fig. 3). The curvilinear fits showed better correlationsfor all comparisons. A5EXTEM, A10EXTEM, and MCFEXTEM showedbetter correlations with PLT (r¼0.76, r¼0.76, and r¼0.75, re-spectively, P,0.001 each) than with Fib (r¼0.63, r¼0.65, andr¼0.63, respectively, P,0.0001 each), indicating that MCFparameters are explained better by PLT than by Fib. In addition,A5INTEM, A10INTEM, and MCFINTEM showed good correlationswith PLT (r¼0.77, r¼0.77, and r¼0.75, respectively, P,0.001each) and Fib (r¼0.64, r¼0.66, and r¼0.62, respectively,P,0.0001 each), and A5FIBTEM, A10FIBTEM, and MCFFIBTEM werecorrelated with Fib (r¼0.75, r¼0.76, and r¼0.75, respectively,P,0.0001 each) (Fig. 3).
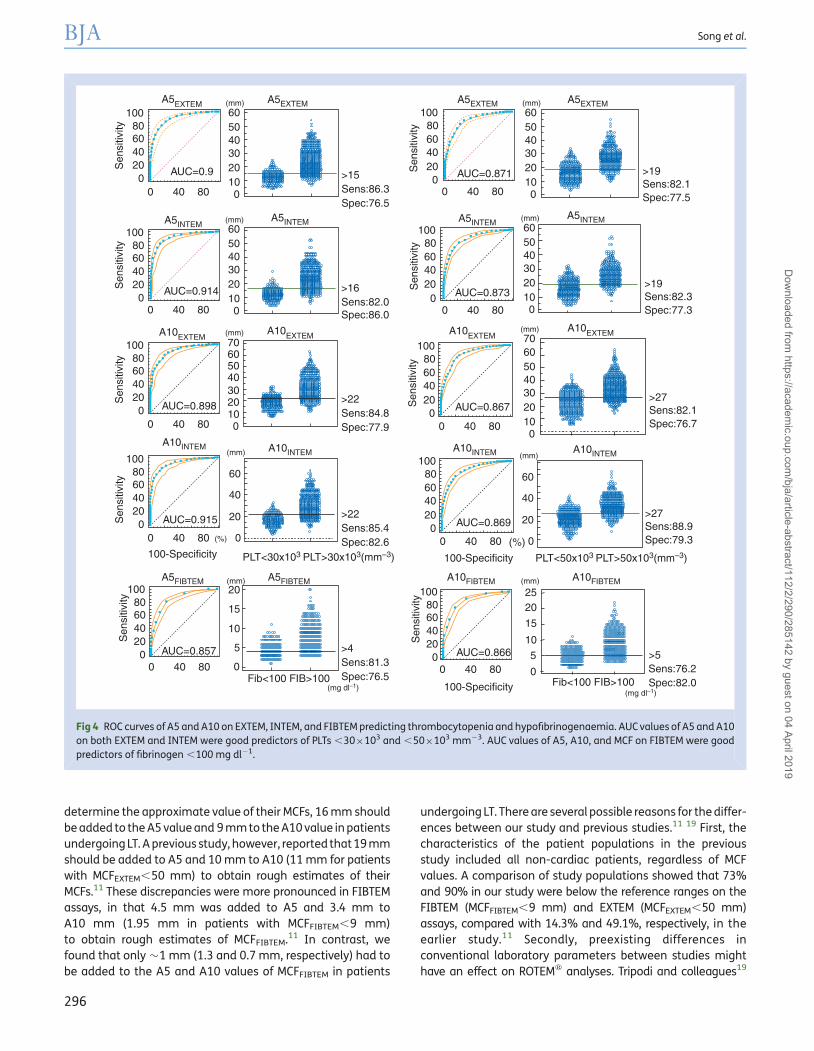
ROC curve analysis showed that the cut-off values of A5EXTEM
and A10EXTEM predicting PLT,30 000 mm23 were 15 mm (sen-sitivity: 86%, specificity: 77%) and 22 mm (sensitivity: 85%,specificity: 78%), respectively, and that their cut-off values topredict PLT,50 000 mm23 were 19 mm (sensitivity: 82%,
specificity: 78%) and 27 mm (sensitivity: 82%, specificity: 77%),respectively. AUCs of A5EXTEM and A10EXTEM were 0.90 and0.898, respectively, for PLT,30 000 mm23 and were 0.871 and0.867, respectively, for PLT,50 000 mm23 (all P,0.0001) (Fig. 4).
The cut-off values of A5INTEM and A10INTEM were 16 mm(sensitivity: 82%, specificity: 86%) and 22 mm (sensitivity: 85%,specificity: 83%), respectively, for predicting PLT,30 000 mm23,and 19 mm (sensitivity: 82%, specificity: 77%) and 27 mm(sensitivity: 79%, specificity: 79%), respectively, for predictingPLT,50 000 mm23. AUCs of A5INTEM and A10INTEM were 0.914and 0.915, respectively, for PLT,30 000 mm23 and were 0.873and 0.869, respectively, for PLT,50 000 mm23 (all P,0.0001)(Fig. 4).
ROC curve analysis showed that A5FIBTEM and A10FIBTEM
predicting Fib,100 mg dl21 were 4 mm (sensitivity: 81%,specificity: 77%) and 5 mm (sensitivity: 76%, specificity:82%), respectively. The AUCs of A5FIBTEM and A10FIBTEM forFib,100 mg dl21 were 0.86 and 0.87, respectively (allP,0.0001) (Fig. 4).
DiscussionThe first major finding of our study was that all correlations andROC curve analyses, including AUCs, were very similar forA5EXTEM and A10EXTEM and for A5INTEM and A10INTEM, stronglysuggesting that A5 is as precise as A10, but can more rapidlypredict MCF, thrombocytopenia, and hypofibrinogenaemiain patients undergoing LDLT. Secondly, A5EXTEM and A5INTEM
were similar in predicting MCF, with both showing goodcorrelations with PLT and Fib, suggesting that they can be usedinterchangeably, despite INTEM and EXTEM reflecting differentcoagulation pathways. Thirdly, FIBTEM analysis showed thatthe difference (bias) between A5FIBTEM and MCFFIBTEM was small,only 1.3 mm in patients with hypofibrinogenaemia (medianFib¼100 mg dl21). In addition, the ROC curves of A5FIBTEM andA10FIBTEM for Fib,100 mg dl21 yielded almost identicalAUCs, indicating that A5FIBTEM was as useful as A10FIBTEM inconsistently predicting hypofibrinogenaemia. Lastly, althoughreplacement guidelines for thrombocytopenia and hypofibri-nogenaemia during LT surgery vary widely among institutions,the critical PLT triggering transfusion is generally thought torange from 30 000 to 50 000 mm23.14 15 We therefore analysedthe correlations between A5 parameters on ROTEMw analysisand the commonly used quantitative cut-off values forPLT,30 000 mm23 and ,50 000 mm23 and Fib,100 mg dl21
during LT.8 15
Because conventional laboratory tests have long turn-around times in clinical settings, determining when to start atransfusion and the amounts of allogeneic blood productstransfused into patients with massive bleeding is difficult.Therefore, early variables assessed by point-of-care ROTEMdevice, which are available within 10–20 min, have beenincreasingly used to trigger transfusion of platelets andfibrinogen-rich products. Trigger values were based on evi-dence that these variables could successfully determinethrombocytopenia and hypofibrinogenaemia in patientsundergoing LT and cardiac surgery and those with severe
Table 2 Intraoperative ROTEMw data and bias for A5 and A10 onthe Bland–Altman analyses. Data were expressed as median(inter-quartile range) or mean (SD). NA, not available. A5, clotamplitude at 5 min; A10, clot amplitude at 10 min; MCF, maximumclot firmness
Variables EXTEM INTEM FIBTEM
Clot time (s) 71 (52–103) 229 (197–278) 59 (46–95)
Clot formationtime (s)
235 (173–307) 231 (164–309) NA
a-Angle (8) 49 (39–58) 52 (42–61) NA
A5 (mm) 19 (15–25) 20 (15–25) 5 (3–7)
A10 (mm) 27 (22–34) 27 (22–33) 5 (4–8)
MCF (mm) 37 (31–43) 37 (31–43) 6 (4–9)
Bias for A5(mm)
16.4 (3.7) 16.2 (3.6) 1.3 (1.4)
Bias for A10(mm)
8.8 (2.7) 8.8 (2.8) 0.7 (1.0)
Early detection of coagulopathy using ROTEM BJA
293
Dow
nloaded from https://academ
ic.oup.com/bja/article-abstract/112/2/290/285142 by guest on 04 April 2019
trauma.8 11 16 – 18 In trauma patients, an A10FIBTEM of 5 mm wasthe threshold that best predicted hypofibrinogenaemia (,100mg dl21), whereas an A15INTEM of 46 mm best predictedthrombocytopenia (,50 000 mm23).18 During LT surgery, ourresults demonstrated that both A10EXTEM and A10INTEM of27 mm were the thresholds best predicting thrombocytopenia(,50 000 mm23), whereas an A10FIBTEM of 5 mm best pre-dicted hypofibrinogenaemia (,100 mg dl21). These findingsare in agreement with previous studies showing that anA10FIBTEM of 5 mm was optimal in trauma patients18 and thatan A10EXTEM of 29 mm was the optimal cut-off for thrombo-cytopenia (,50 000 mm23) during LT.8
Notably, this study was the first to show that A5 is a reliableearly parameter that can substitute for both A10 and MCF inpatients in a hypocoagulable state observed during LDLT(median MCFEXTEM¼37 mm and median MCFFIBTEM¼6 mm).Among the ROTEMw parameters, the A5 and A10 indices of
both EXTEM and INTEM showed excellent correlations withtheir MCF values, and A5FIBTEM and A10FIBTEM were highly corre-lated with MCFFIBTEM. These results are comparable with theexcellent correlations observed for A5 and A10 with their MCFsin a heterogeneous study population that included individualswith subnormal, normal, and supranormal MCF values.11 Ourfindings also demonstrated that the correlation coefficients ofA5EXTEM and A10EXTEM with PLT, A5INTEM and A10INTEM with PLT,and A5FIBTEM and A10FIBTEM withFib were almost identical. There-fore, these results strongly indicate that A5 is as accurate as A10,allowing earlier parameters to guide PLT transfusion during LT.8
We observed biases between early variables (A5 and A10)and MCF of ROTEMw analyses. Because the median values ofMCFEXTEM, MCFINTEM, and MCFFIBTEM were 37, 37, and 6 mm, re-spectively, our data characterize patients with subnormal MCF.In EXTEM and INTEM assays, the biases between A5 and A10and MCF were 16 and 9 mm, respectively. Therefore, to
14
12
10
8
650
40
30
20
10
060
50
40
30
20
10
0
60
70
50
40
30
20
10
0T0 T0 T1 T2 T3 T4 T0 T1 T2 T3 T4T1 T2 T3 T4
200 300
250
200
150
100
50
0
14
12
10
8
6
4
2
020
15
10
5
25
20
15
10
5
0
–5
0
150
100
50
0
50
40
30
20
10
060
50
40
30
20
10
070
60
50
40
30
20
10
0
Hae
mog
lobi
n (g
dl–
1 )
Pla
tele
t (10
3 ×m
m–3
)IN
TE
M A
5 (m
m)
INT
EM
A10
(m
m)
INT
EM
MC
F (
mm
)
FIB
TE
M M
CF
(m
m)
FIB
TE
M A
10 (
mm
)F
IBT
EM
A5
(mm
)F
ibrin
ogen
(m
g dl
–1)
EX
TE
M A
5 (m
m)
EX
TE
M A
10 (
mm
)E
XT
EM
MC
F (
mm
)
Fig 2 Intraoperative trends of ROTEM and laboratory parameters. Data are median (SD). T0, 1 h after induction of general anaesthesia; T1, 1 h aftersurgical incision; T2, 30 min after hepatectomy; T3, 30 min after graft reperfusion; T4, after hepatic artery anastomosis.
BJA Song et al.
294
Dow
nloaded from https://academ
ic.oup.com/bja/article-abstract/112/2/290/285142 by guest on 04 April 2019

80
60
40
20
80
60
40
20
8070
60
50
40
30
20
10
00 50000 100000 150000 2000000 0 50000 100000 150000 2000000
0
80
60
40
20
0
80
60
40
20
00 100 200 300 400 500 0 100 200 300 400 500
0
-20
80
60
40
20
0
80
70
60
50
40
30
2010
0
80
60
40
20
0
80 30
25
20
15
10
5
0
35
30
25
20
15
10
5
0
0 100 200 300 400 500
60
40
20
0
80
60
40
20
0
80
60
40
20
0
8025
20
15
10
5
0
60
40
20
0
EX
TEM
A5
(mm
)
INTE
M A
5 (m
m)
INTE
M A
10 (m
m)
INTE
M A
10 (m
m)
INTE
M M
CF
(mm
)
FIB
TEM
MC
F(m
m)
FIB
TEM
A10
(mm
)FI
BTE
M A
5 (m
m)
INTE
M A
5 (m
m)
INTE
MM
CF
(mm
)
EX
TEM
MC
F (m
m)
EX
TEM
A10
(mm
)
EX
TEM
A10
(mm
)E
XTE
M A
5 (m
m)
EX
TEM
MC
F (m
m)
r=0.764
r=0.757 r=0.766 r=0.648 r=0.659 r=0.761
r=0.769 r=0.629 r=0.638 r=0.750
R2=0.49 R2=0.49 R2=0.67R2=0.66R2=0.65
R2=0.64 R2=0.65R2=0.49 R2=0.49
R2=0.69
Y=7.6+0.0003X–3.7E–10X2
r=0.752 r=0.750 r=0.628 r=0.615 r=0.745
R2=0.62 R2=0.62 R2=0.45 R2=0.42 R2=0.72Y=17.9+0.0005X–1.3E–10X2 Y=118+0.0004X–1.3E–9X2 Y=17.5+0.2X–0.0003X2 Y=18.4+0.2X–0.0003X2
Y=1.5+0.04X+6.6E–5X2
Y=11.2+0.0004X–8E–10X2Y=10.2+0.2X–0.0002X2 Y=10+0.2X–0.0002X2
Y=0.5+0.05X+1.5E–5X2
Y=7.2+0.0003X–4.8E–10X2Y=6.4+0.14X–0.0001X2 Y=6.1+0.15X–0.0001X2 Y=0.5+0.04X+1.3E–5X2
Y=11.5+0.0004X–8E–10X2
PLT (mm–3) PLT (mm–3) Fibrinogen (mg dl–1) Fibrinogen (mg dl–1) Fibrinogen (mg dl–1)
Fig 3 Linear (r) and curvilinear (R2) relationship between ROTEM parameters and conventional coagulation tests. Note that A5, A10, and MCF on both EXTEM and INTEM showed good correlationswith PLTs and moderate correlations with fibrinogen concentration. A5, A10, and MCF of FIBTEM also showed good correlations with fibrinogen concentration.
Earlyd
etectionofcoagu
lopathy
usin
gR
OTEM
BJA295
Dow
nloaded from https://academ
ic.oup.com/bja/article-abstract/112/2/290/285142 by guest on 04 April 2019
determine the approximate value of their MCFs, 16 mm shouldbe added to the A5 value and 9 mm to the A10 value in patientsundergoing LT. A previous study, however, reported that 19 mmshould be added to A5 and 10 mm to A10 (11 mm for patientswith MCFEXTEM,50 mm) to obtain rough estimates of theirMCFs.11 These discrepancies were more pronounced in FIBTEMassays, in that 4.5 mm was added to A5 and 3.4 mm toA10 mm (1.95 mm in patients with MCFFIBTEM,9 mm)to obtain rough estimates of MCFFIBTEM.11 In contrast, wefound that only �1 mm (1.3 and 0.7 mm, respectively) had tobe added to the A5 and A10 values of MCFFIBTEM in patients
undergoing LT. There are several possible reasons for the differ-ences between our study and previous studies.11 19 First, thecharacteristics of the patient populations in the previousstudy included all non-cardiac patients, regardless of MCFvalues. A comparison of study populations showed that 73%and 90% in our study were below the reference ranges on theFIBTEM (MCFFIBTEM,9 mm) and EXTEM (MCFEXTEM,50 mm)assays, compared with 14.3% and 49.1%, respectively, in theearlier study.11 Secondly, preexisting differences inconventional laboratory parameters between studies mighthave an effect on ROTEMw analyses. Tripodi and colleagues19
100 60(mm)
50403020100
Sen
sitiv
ity 806040200
0 40 80
A5EXTEM
A10EXTEMA10EXTEM A10EXTEM
A10EXTEM
A5INTEM
A10INTEM A10INTEM A10INTEM A10INTEM
A5INTEM A5INTEMA5INTEM
A5EXTEM A5EXTEM A5EXTEM60
(mm)
50403020100
60(mm)
(mm)
50403020100
6070
50403020100
100
Sen
sitiv
ity 806040200
0 40 80
100
Sen
sitiv
ity
806040200
0 40 80
100
Sen
sitiv
ity 806040200
0 40 80
A5FIBTEM A5FIBTEM A10FIBTEM A10FIBTEM
AUC=0.915
AUC=0.866
AUC=0.898
AUC=0.914
AUC=0.857
100
Sen
sitiv
ity 806040200
0 40 80
100
Sen
sitiv
ity 806040200
0 40 80
AUC=0.9
100
Sen
sitiv
ity 806040200
0 40 80
AUC=0.871
100
Sen
sitiv
ity
806040200
0 40 80
AUC=0.867
100806040200
0 40 80
AUC=0.869
100
Sen
sitiv
ity
80604020
00 40 80
AUC=0.873
>15Sens:86.3Spec:76.5
60(mm)
(mm)
(mm)
(mm) (mm)
(mg dl–1)(mg dl–1)
(%) (%)
50403020100
>16Sens:82.0Spec:86.0
>22Sens:84.8Spec:77.9
>22Sens:85.4Spec:82.6
>27Sens:88.9Spec:79.3
>27Sens:82.1Spec:76.7
>19Sens:82.3Spec:77.3
>19Sens:82.1Spec:77.5
>5Sens:76.2Spec:82.0
>4Sens:81.3Spec:76.5
PLT<30x103 PLT>30x103(mm–3) PLT<50x103 PLT>50x103(mm–3)
70
60
40
20
20 2520
15
10
5
0
15
10
5
0Fib<100 FIB>100 Fib<100 FIB>100
0
(mm)
60
40
20
0100-Specificity 100-Specificity
100-Specificity
6050403020100
Fig 4 ROC curves of A5 and A10 on EXTEM, INTEM, and FIBTEM predicting thrombocytopenia and hypofibrinogenaemia. AUC values of A5 and A10on both EXTEM and INTEM were good predictors of PLTs ,30×103 and ,50×103 mm23. AUC values of A5, A10, and MCF on FIBTEM were goodpredictors of fibrinogen ,100 mg dl21.
BJA Song et al.
296
Dow
nloaded from https://academ
ic.oup.com/bja/article-abstract/112/2/290/285142 by guest on 04 April 2019

demonstrated that PLT was the most important determinant inMCF in patients with stable cirrhosis, in which the study popula-tionshowedlowPLTwith nearlynormal Fib. Incontrast,ourstudypopulation showed both low PLT [47 000 (32 000–64 000) vs65 000 (24 000–178 000) mm23] and Fib [100 (772137) vs199 (108–423) mg dl21], respectively, compared with thatstudy.19 Thirdly, differences in the use of colloids might havean effect on the observed bias, particularly for FIBTEM. Synthet-ic colloids such as hydroxyethyl starch solutions are known tohave an impact on fibrin polymerization, resulting in decreasedMCF.20 21 However, as we used only albumin for colloid solutionduring LDLT, our data would not be affected by synthetic col-loids in the bias between early variables of clot firmness (A5and A10) and MCF. This difference might result in increasedbias between A5 (A10) and MCF, in particular in FIBTEM,between our study and the earlier study.11 Taken together,because of the potentials for selection and observationbiases among different studies (e.g. differences in gender, eth-nicity, clinical conditions, types of fluid replacement, etc.), careshould be taken when interpreting the results of bias betweenearly variables (A5 and A10) and MCF of ROTEMw analyses.
Our study had several limitations. First, it was a retrospective,single-centre study, suggesting caution in interpreting ourresults as there might have been observation bias and bias inpatient selection. Secondly, we did not assess the predictabilityof transfusionrequirementsbasedon ROTEMw analysis or stand-ard coagulation tests. Further studies are needed to evaluatewhether threshold levels of ROTEMw parameters can estimateclinical bleeding and guide transfusion therapy to improve treat-ment of haemostatic derangements associated with LDLT.
In conclusion, our findings indicate that A5 as an early vari-able of clot firmness in thromboelastometry is effective todetect thrombocytopenia and hypofibrinogenaemia in hypo-coagulable patients undergoing LT. A5 on ROTEMw analysismight be the earliest, most reliable index in selecting transfu-sion guidelines based on PLT and Fib during LDLT.
Authors’ contributionsJ.-G.S.: study design, study data analysis, manuscript prepar-ation, and revision; S.-M.J.: study design and data analysis;I.-G.J.: data collection and analysis; H.-M.L.: data analysis;G.-S.H.: study design, study conduct, data analysis, manuscriptpreparation, and revision.
Declaration of interestNone declared.
FundingNo financial support was received from any funding agency.
References1 de Boer MT, Christensen MC, Asmussen M, et al. The impact of
intraoperative transfusion of platelets and red blood cells on sur-vival after liver transplantation. Anesth Analg 2008; 106: 32–44
2 Nacoti M, Cazzaniga S, Lorusso F, et al. The impact of perioperativetransfusion of blood products on survival after pediatric liver trans-plantation. Pediatr Transplant 2012; 16: 357–66
3 Benson AB, Burton JR Jr, Austin GL, et al. Differential effects ofplasma and red blood cell transfusions on acute lung injury and in-fection risk following liver transplantation. Liver Transpl 2011; 17:149–58
4 Massicotte L, Sassine MP, Lenis S, Seal RF, Roy A. Survival ratechanges with transfusion of blood products during liver transplant-ation. Can J Anaesth 2005; 52: 148–55
5 McCluskey SA, Karkouti K, Wijeysundera DN, et al. Derivation of a riskindex for the prediction of massive blood transfusion in liver trans-plantation. Liver Transpl 2006; 12: 1584–93
6 Ganter MT, Hofer CK. Coagulation monitoring: current techniquesand clinical use of viscoelastic point-of-care coagulation devices.Anesth Analg 2008; 106: 1366–75
7 Ebinger T, Ruland A, Lakner M, Schwaiger M. Validity, regulatoryregistration and approval of ROTEM thromboelastometry. BloodCoagul Fibrinolysis 2010; 21: 106–7
8 Roullet S, Pillot J, Freyburger G, et al. Rotation thromboelastometrydetects thrombocytopenia and hypofibrinogenaemiaduringortho-topic liver transplantation. Br J Anaesth 2010; 104: 422–8
9 Davenport R, Manson J, De’Ath H, et al. Functional definition andcharacterization of acute traumatic coagulopathy. Crit Care Med2011; 39: 2652–8
10 Schochl H, Cotton B, Inaba K, et al. FIBTEM provides early predictionof massive transfusion in trauma. Crit Care 2011; 15: R265
11 Gorlinger K, Dirkmann D, Solomon C, Hanke AA. Fast interpretationof thromboelastometry in non-cardiac surgery: reliability inpatients with hypo-, normo-, and hypercoagulability. Br J Anaesth2013; 110: 222–30
12 Kim YK, Shin WJ, Song JG, et al. Comparison of stroke volumevariations derived from radial and femoral arterial pressure wave-forms during liver transplantation. Transplant Proc 2009; 41:4220–8
13 Bland JM, Altman DG. Statistical methods for assessing agreementbetween two methods of clinical measurement. Lancet 1986; 1:307–10
14 Slichter SJ. Evidence-based platelet transfusion guidelines. Hema-tology Am Soc Hematol Educ Program 2007: 172–8
15 Kang Y, Audu P. Coagulation and liver transplantation. Int Anesthe-siol Clin 2006; 44: 17–36
16 Blasi A, Beltran J, Pereira A, et al. An assessment of thromboelasto-metry to monitor blood coagulation and guide transfusion supportin liver transplantation. Transfusion 2012; 52: 1989–98
17 Dirkmann D, Gorlinger K, Dusse F, Kottenberg E, Peters J. Earlythromboelastometric variables reliably predict maximum clot firm-ness in patients undergoing cardiac surgery: a step towards earlierdecision making. Acta Anaesthesiol Scand 2013; 57: 594–603
18 Rugeri L, Levrat A, David JS, et al. Diagnosis of early coagulation ab-normalities in trauma patients by rotation thrombelastography.J Thromb Haemost 2007; 5: 289–95
19 Tripodi A, Primignani M, Chantarangkul V, et al. The coagulopathy ofcirrhosis assessed by thromboelastometry and its correlation withconventional coagulation parameters. Thromb Res 2009; 124:132–6
20 Winstedt D, Hanna J, Schott U. Albumin-induced coagulopathy isless severe and more effectively reversed with fibrinogen concen-trate than is synthetic colloid-induced coagulopathy. Scand J ClinLab Invest 2013; 73: 161–9
21 Schramko A, Suojaranta-Ylinen R, Kuitunen A, Raivio P, Kukkonen S,Niemi T. Hydroxyethylstarch and gelatin solutions impair blood co-agulation after cardiac surgery: a prospective randomized trial. Br JAnaesth 2010; 104: 691–7
Handling editor: H. C. Hemmings
Early detection of coagulopathy using ROTEM BJA
297
Dow
nloaded from https://academ
ic.oup.com/bja/article-abstract/112/2/290/285142 by guest on 04 April 2019