Fitness vs. Fatness Debate [email protected] China Medical University, Lifu Teaching Building...
50
Fitness vs. Fatness Debate [email protected] China Medical University, Lifu Teaching Building Taichung, Taiwan; April26 th 2011
-
Upload
deborah-walsh -
Category
Documents
-
view
218 -
download
0
Transcript of Fitness vs. Fatness Debate [email protected] China Medical University, Lifu Teaching Building...
Fitness vs. Fatness Debate
China Medical University, Lifu Teaching BuildingTaichung, Taiwan; April26 th 2011
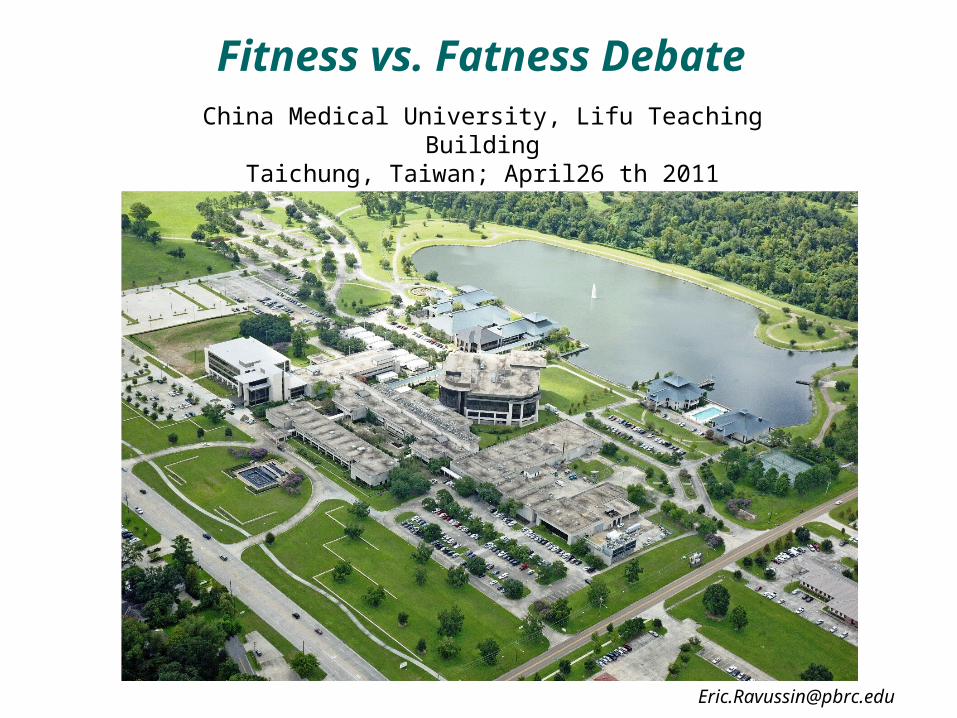
Obesity Facts
Over 66% of Americans are overweight or obese Number of Obese American adults rose to 33%
Over last decade alone an increase of 12% - overweight 70% - obese
Occurred for all population subsets: children, elderly & all racial/ethnic groups
Second leading cause of preventable death
Over 280,000 – 325,000 obesity related deaths annually (including co-morbidities)
Trust for America’s Health Facts 2005http://www.cdc.gov/pcd/issues/2005/jan/04_0087.htm
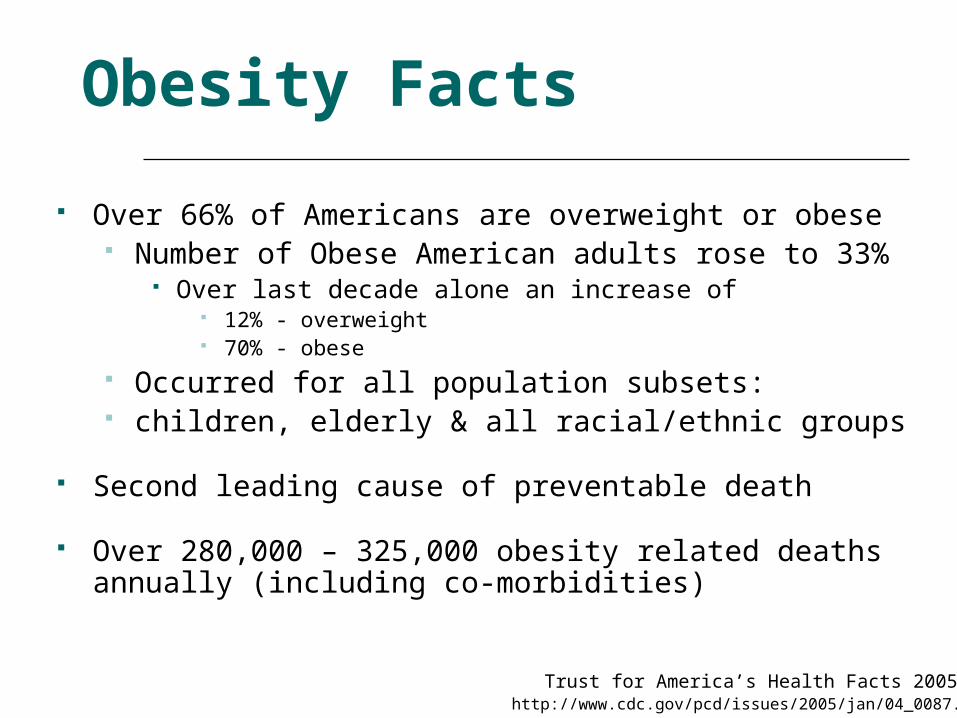
NHANES 1976-1980NHANES 1999-2004
1976-1980 32.1 ± 0.6 15.0 ± 0.4 1.4 ± 0.1
2003-2004 33.4 ± 1.2 32.9 ± 1.3 5.1 ± 0.6
BM
I d
istr
ibu
tio
n (
%)
Overweight Obese Extremely Obese
Redman & Ravussin 2008
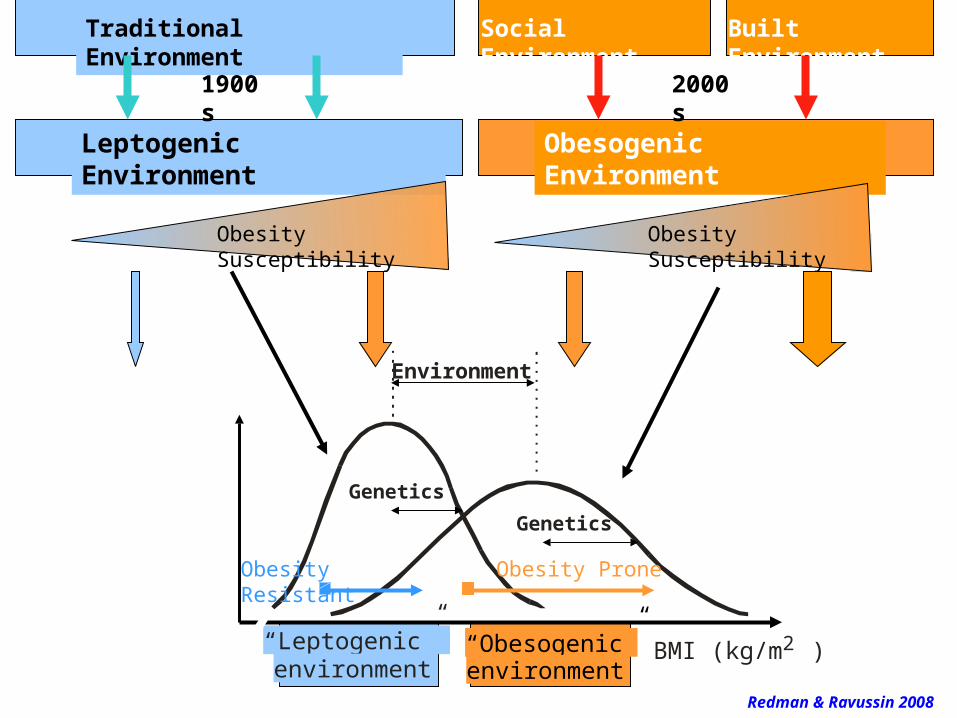
Traditional Environment
Leptogenic Environment
Social Environment Built Environment
Obesogenic Environment
1900s 2000s
“Leptogenic” environment
“Obesogenic”environment
BMI (kg/m )2
Genetics
Environment
Genetics
Obesity Resistant Obesity Prone
Obesity Susceptibility Obesity Susceptibility
Redman & Ravussin 2008
Obesity Epidemic: Reduced Physical Activity and/or Increased Energy Intake?
Fitness vs. Fatness Debate
Exercise for Weight Loss or Weight Maintenance?
Fitness vs. Fatness Debate
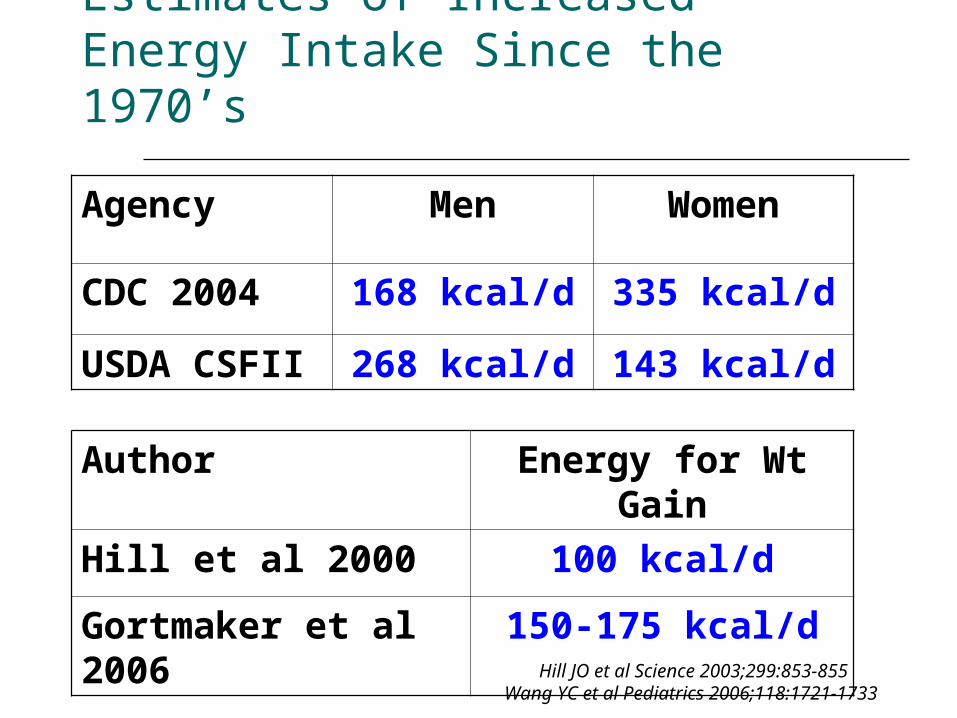
Estimates of Increased Energy Intake Since the 1970’s
Agency Men Women
CDC 2004 168 kcal/d 335 kcal/d
USDA CSFII 268 kcal/d 143 kcal/d
Author Energy for Wt Gain
Hill et al 2000 100 kcal/d
Gortmaker et al 2006 150-175 kcal/d
Hill JO et al Science 2003;299:853-855Wang YC et al Pediatrics 2006;118:1721-1733
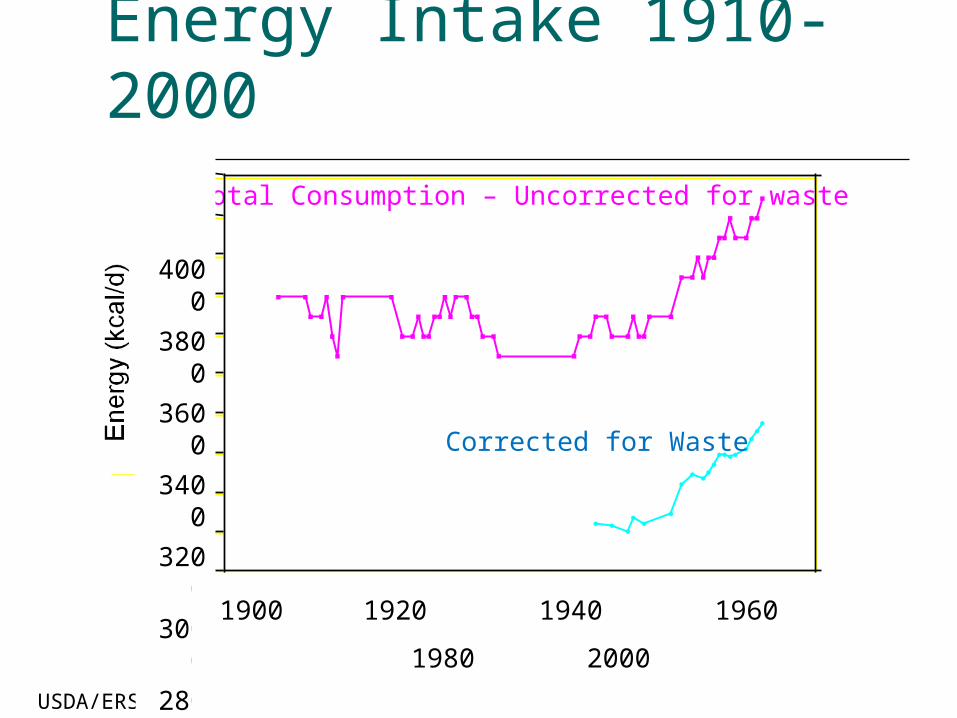
Energy Intake 1910-2000
USDA/ERS Food Review 2002;25:2-15
1900 1920 1940 1960 1980 20002000
2200
2400
2600
2800
3000
3200
3400
3600
3800
4000
Year
En
erg
y (k
cal/
d)
Corrected for Waste
Total Consumption – Uncorrected for waste
4000
3800
3600
3400
3200
3000
2800
2600
2400
2200
2000 1900 1920 1940 1960 1980 2000
Year

0
30
Time A Time B
En
erg
y fl
ux
(dai
ly T
EI
and
TE
E)
‘Energy Imbalance Gap’ = the average difference between daily TEI (top
line) and TEE (bottom line) needed to produce weight gain over a period of time ‘Energy Flux
Gap’ = the average difference
in energy flux (TEI ≈ TEE) between two
points in time
Period of weight gain
(Settling point A, lower mean weight)
(Settling point B, higher mean weight)
Energy Gap Terminology
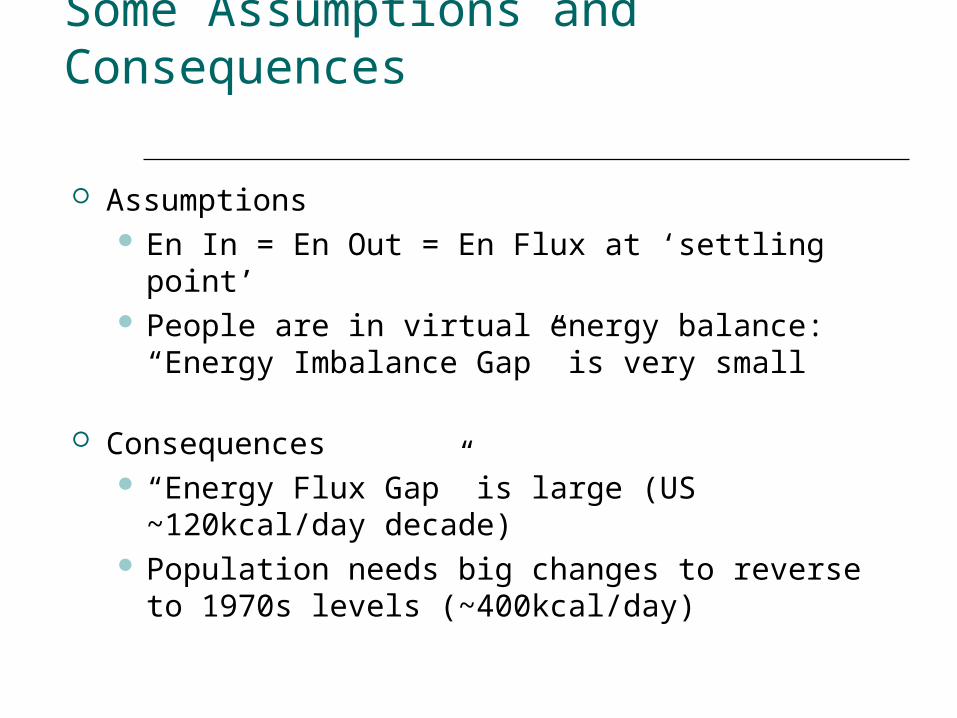
Some Assumptions and Consequences
Assumptions En In = En Out = En Flux at ‘settling point’ People are in virtual energy balance: “Energy
Imbalance Gap” is very small
Consequences “Energy Flux Gap” is large (US ~120kcal/day
decade) Population needs big changes to reverse to
1970s levels (~400kcal/day)
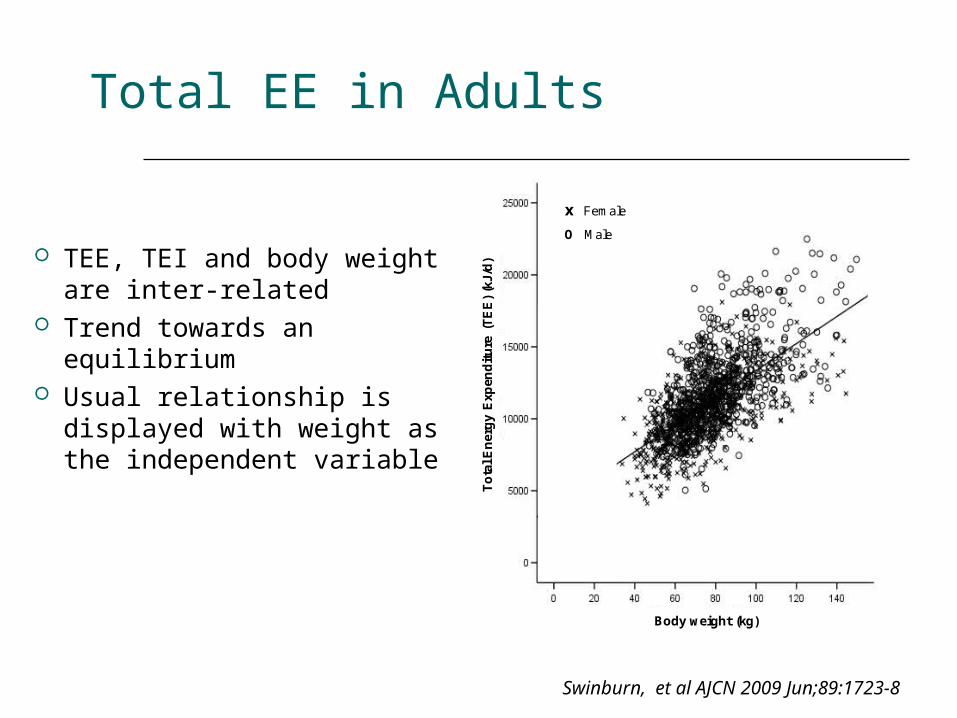
Total EE in Adults
TEE, TEI and body weight are inter-related
Trend towards an equilibrium
Usual relationship is displayed with weight as the independent variable
x Female
O Male
Body weight (kg)
To
tal E
ner
gy
Exp
end
itu
re (
TE
E)
(kJ/
d)
Swinburn, et al AJCN 2009 Jun;89:1723-8
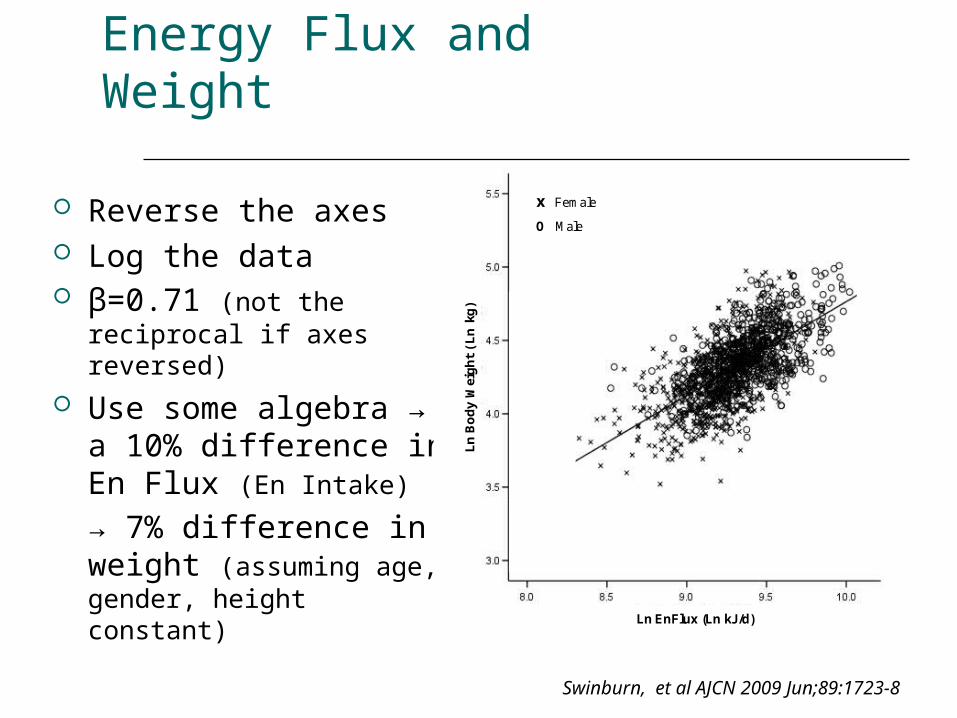
Energy Flux and Weight
Reverse the axes Log the data β=0.71 (not the
reciprocal if axes reversed)
Use some algebra → a 10% difference in En Flux (En Intake) → 7% difference in weight (assuming age, gender, height constant)
x Female
O Male
Ln EnFlux (Ln kJ/d)
Ln
Bo
dy
Wei
gh
t (L
nkg
)
Swinburn, et al AJCN 2009 Jun;89:1723-8
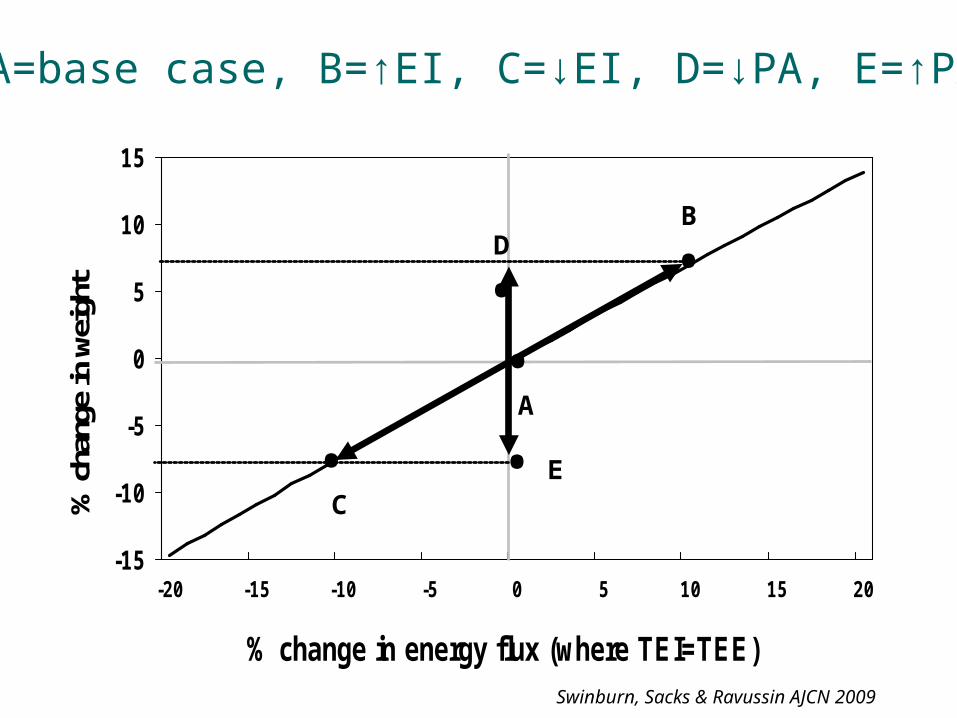
-15
-10
-5
0
5
10
15
-20 -15 -10 -5 0 5 10 15 20
% change in energy flux (where TEI=TEE)
% c
hang
e in
wei
ght
B
•
• C
• A
D•
• E
A=base case, B=↑EI, C=↓EI, D=↓PA, E=↑PA
Swinburn, Sacks & Ravussin AJCN 2009

Is the epidemic due to ↑EI or ↓PA?
The equations could estimate the proportion of the epidemic due to ↓PA or ↑EI or mixture
NHANES changes in weight for adults and children
USDA calorie ‘disappearance’ data (proportioned for adults and children)
Weig
ht
incr
ease
↓PA ↑EIMixture
Slope Adults 0.71
Children 0.43
Swinburn, Sacks & Ravussin AJCN 2009
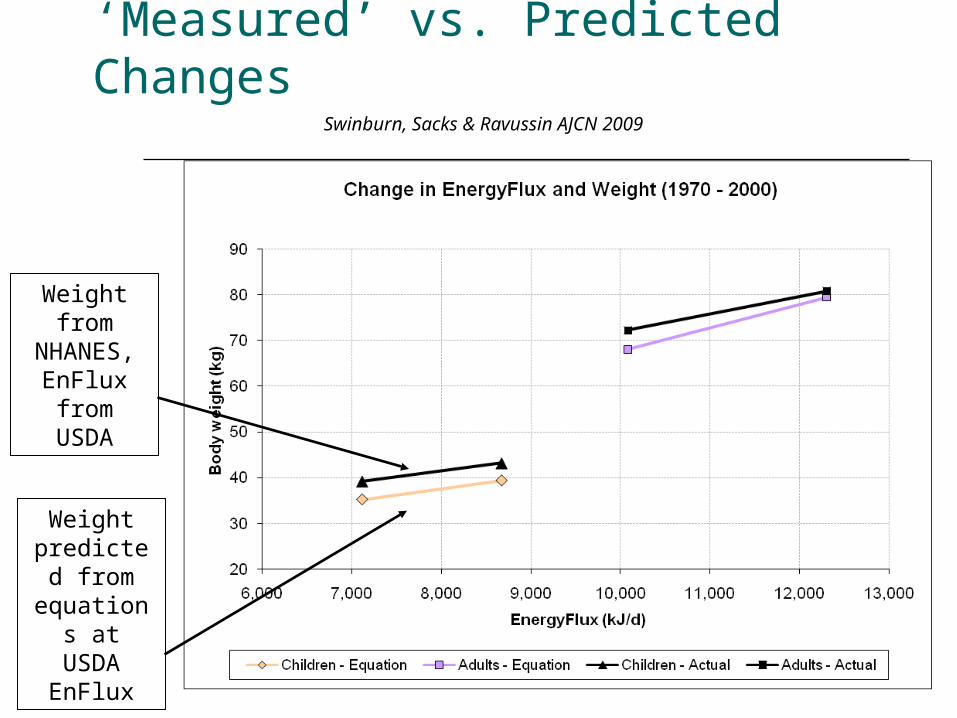
‘Measured’ vs. Predicted Changes
Weight from
NHANES, EnFlux from USDA
Weight predicted
from equations at USDA EnFlux
Swinburn, Sacks & Ravussin AJCN 2009
Summary and Issues
Terminology and values for the ‘energy gaps’
Increased energy intake has been the major drive of the epidemic Stopping the epidemic Returning to 1970s level
Need behavioural interventions and environmental interventions
Distinguish the drivers (EI) vs. the modulators (physiology, genetics...)
Obesity Epidemic: Reduced Physical Activity and/or Increased Energy Intake?
Fitness vs. Fatness Debate
Exercise for Weight Loss or Weight Maintenance?
Fitness vs. Fatness Debate
0
5
10
15
20
25
30
35
40
45
Rel
ativ
e R
isk
<21 21-22.9
23-24.9
25-26.9
27-29.9
30-32.9
33-34.9
35-39.9
40
BMI
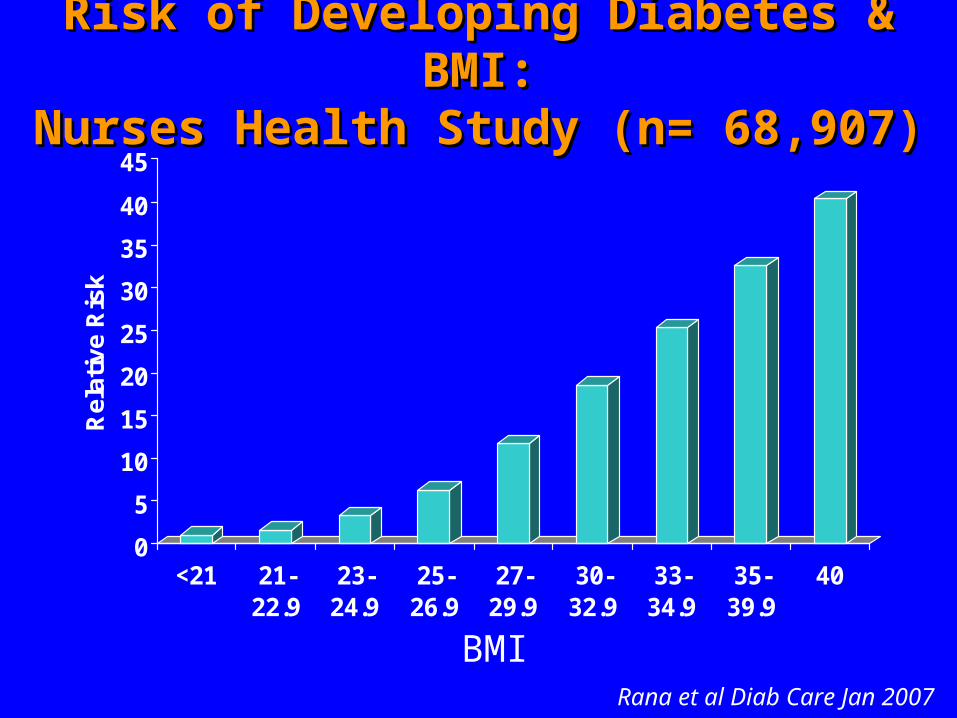
Risk of Developing Diabetes & BMI:Risk of Developing Diabetes & BMI:Nurses Health Study (n= 68,907)Nurses Health Study (n= 68,907)
Rana et al Diab Care Jan 2007
Aerobics Center Longitudinal Aerobics Center Longitudinal Study DatabaseStudy Database
• Dr. Steve Blair & Dr Tim Church
• Consists of Cooper Clinic patients– >70,000 individuals enrolled
• Examinations dating back to 1970
• Follow-up for mortality and morbidity – every 3-4 years

Fitness TestingFitness Testing
• Maximal exercise test on a treadmill (Balke)
• Standardized fitness categories based on age, gender & time on treadmill:
• Fitness => measure of physical activity habits

Fitness ClassificationsFitness Classifications
• Low Fitness = “Unfit”– Lower 20% time on treadmill for gender and age
• Moderate Fitness-– Next 40% time on treadmill for gender and age
– @150 minutes of walking per week
• High Fitness-– Highest 40% time on treadmill for gender and age

Diabetes Diabetes Incidence Rates Incidence Rates By By Fitness Groups, Men (n=8633)Fitness Groups, Men (n=8633)
5.9
2.7
1.6
0
1
2
3
4
5
6
7
Low Moderate High
Wei M et al. Ann Int Med 1999
Cardiorespiratory Fitness Groups
Dia
bete
s in
cide
nce/
1000
men
0
5
10
15
20
25
30
35
40
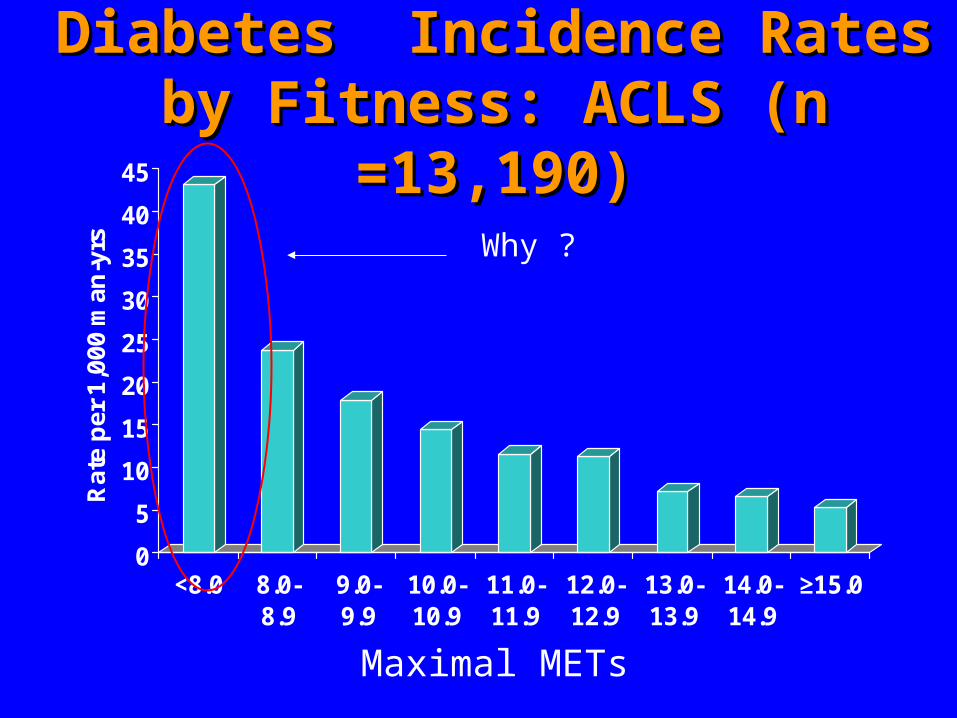
45
Rat
e p
er 1
,000
man
-yrs
<8.0 8.0-8.9
9.0-9.9
10.0-10.9
11.0-11.9
12.0-12.9
13.0-13.9
14.0-14.9
≥15.0
Maximal METs
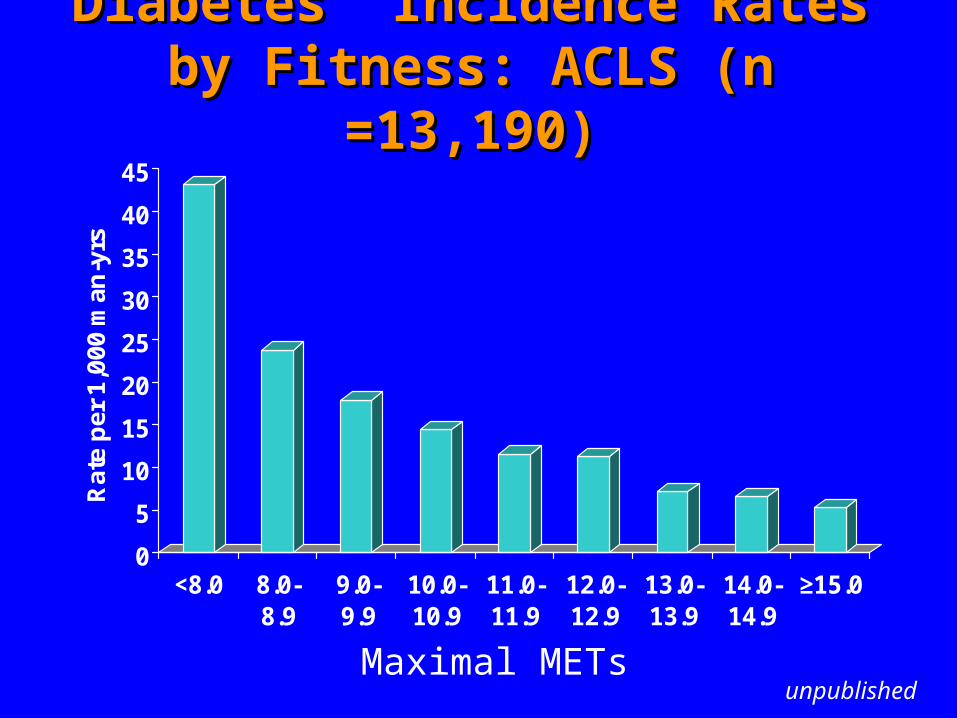
Diabetes Incidence Rates by Diabetes Incidence Rates by Fitness: ACLS (n =13,190)Fitness: ACLS (n =13,190)
P trend < 0.0001
unpublished

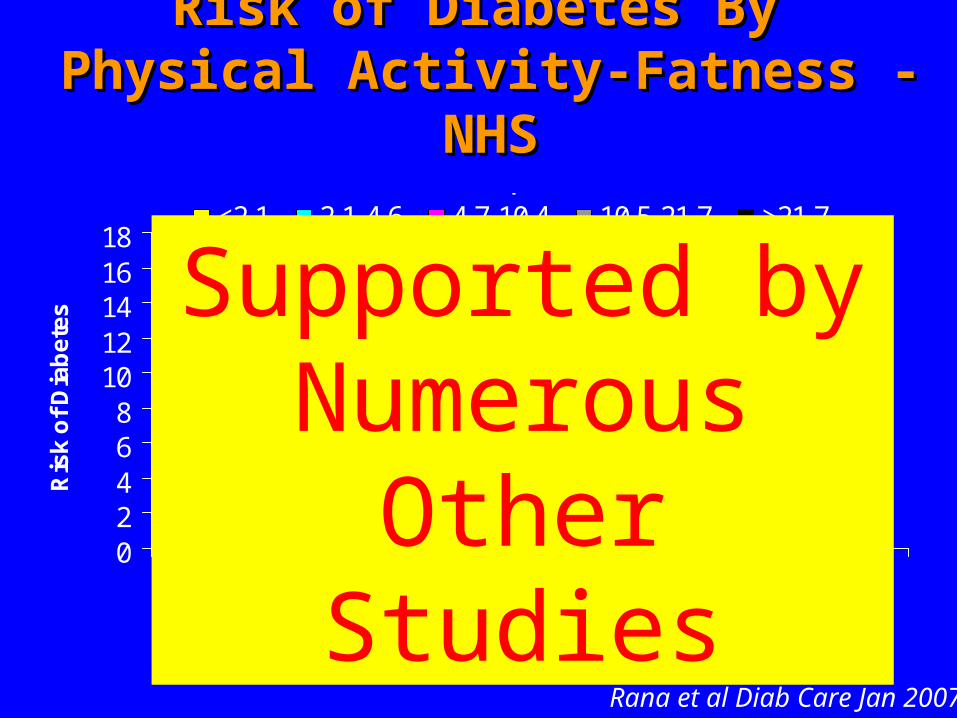
Risk of Diabetes By Risk of Diabetes By Physical Activity-Fatness - NHSPhysical Activity-Fatness - NHS
02468
1012141618
Normal Overweight Obese
Ris
k o
f D
iab
ete
s
<2.1 2.1-4.6 4.7-10.4 10.5-21.7 >21.7
MET hours per week
Rana et al Diab Care Jan 2007
Risk of Diabetes By Risk of Diabetes By Physical Activity-Fatness - NHSPhysical Activity-Fatness - NHS
02468
1012141618
Normal Overweight Obese
Ris
k o
f D
iab
ete
s
<2.1 2.1-4.6 4.7-10.4 10.5-21.7 >21.7
MET hours per week
Rana et al Diab Care Jan 2007
Supported by Numerous Other
Studies
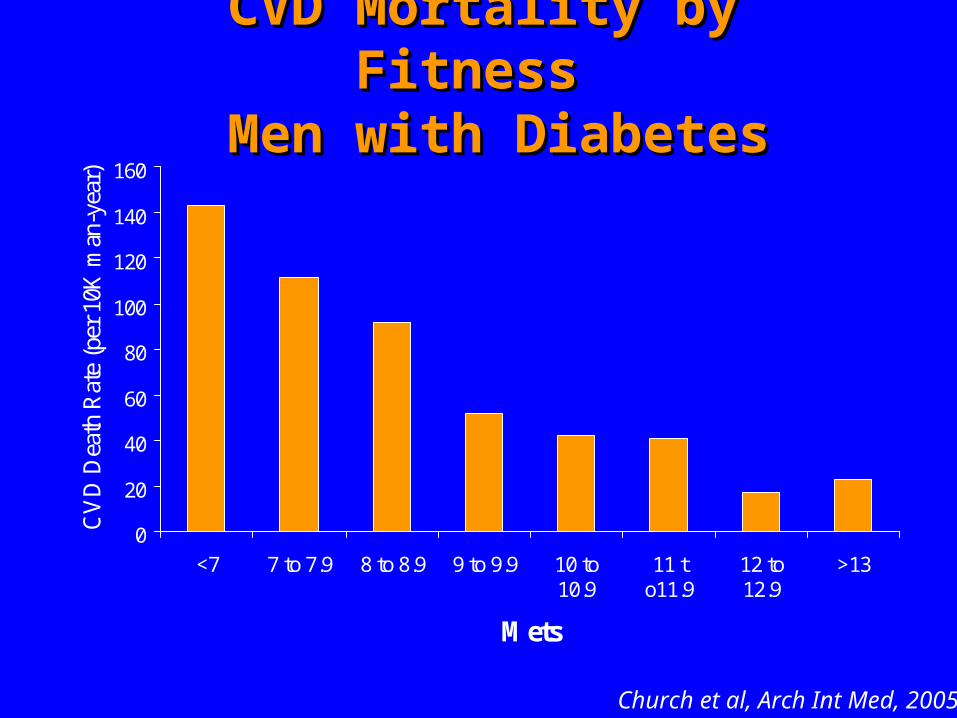
CVD Mortality by Fitness CVD Mortality by Fitness Men with Diabetes Men with Diabetes
Church et al, Arch Int Med, 2005
0
20
40
60
80
100
120
140
160
<7 7 to 7.9 8 to 8.9 9 to 9.9 10 to10.9
11 to11.9
12 to12.9
>13
Mets
CV
D D
eath
Rat
e (p
er 1
0K m
an-y
ear)

0.6
0.65
0.7
0.75
0.8
0.85
0.9
0.95
1
0 5 10 15 20 25 30
Su
rviv
al R
ate
(%)
Low Fitness
Moderate Fitness
High Fitness
Fitness & Risk CVD in Fitness & Risk CVD in Individuals with Individuals with
DiabetesDiabetes
Church et al, Arch Int Med, 2005

0.7
0.75
0.8
0.85
0.9
0.95
1
0 5 10 15 20 25 30
Su
rviv
al R
ate
(%)
18.5 - 24.9 kg/m2
25.0 - 29.9 kg/m2
30.0 - 34.9 kg/m2
0.7
0.75
0.8
0.85
0.9
0.95
1
0 5 10 15 20 25 30
Su
rviv
al R
ate
(%)
Low Fitness
Moderate Fitness
High Fitness
Church et al, Archives of Internal Medicine, 2005
Fit-Fat & Risk CVD in Fit-Fat & Risk CVD in Individuals with DiabetesIndividuals with Diabetes
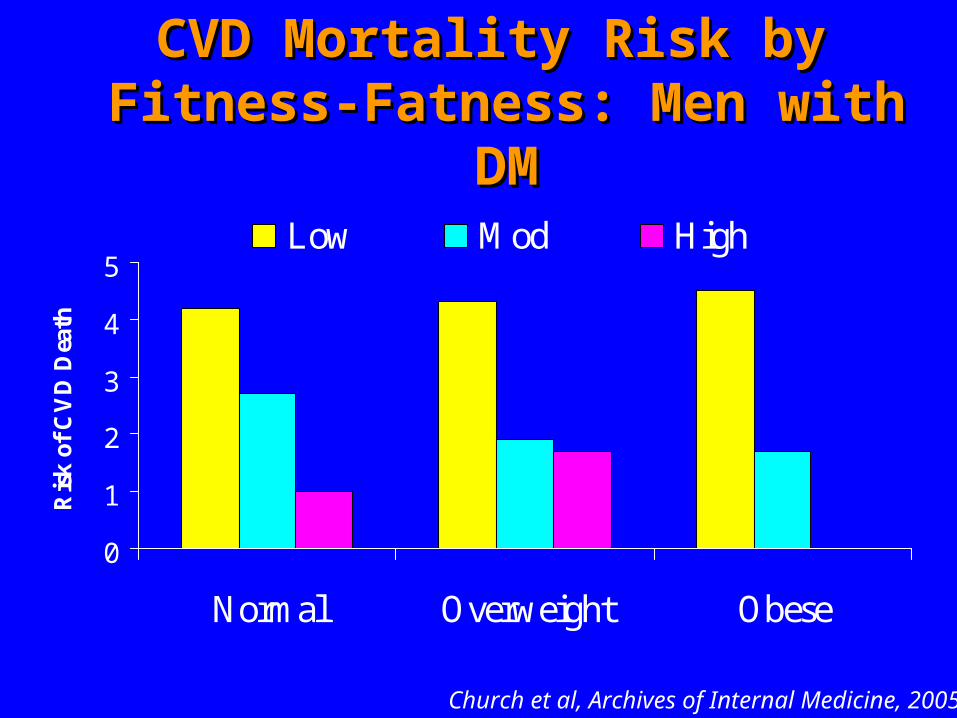
CVD Mortality Risk by CVD Mortality Risk by Fitness-Fatness: Men with DMFitness-Fatness: Men with DM
0
1
2
3
4
5
Normal Overweight Obese
Ris
k o
f C
VD
Dea
th
Low Mod High
Church et al, Archives of Internal Medicine, 2005
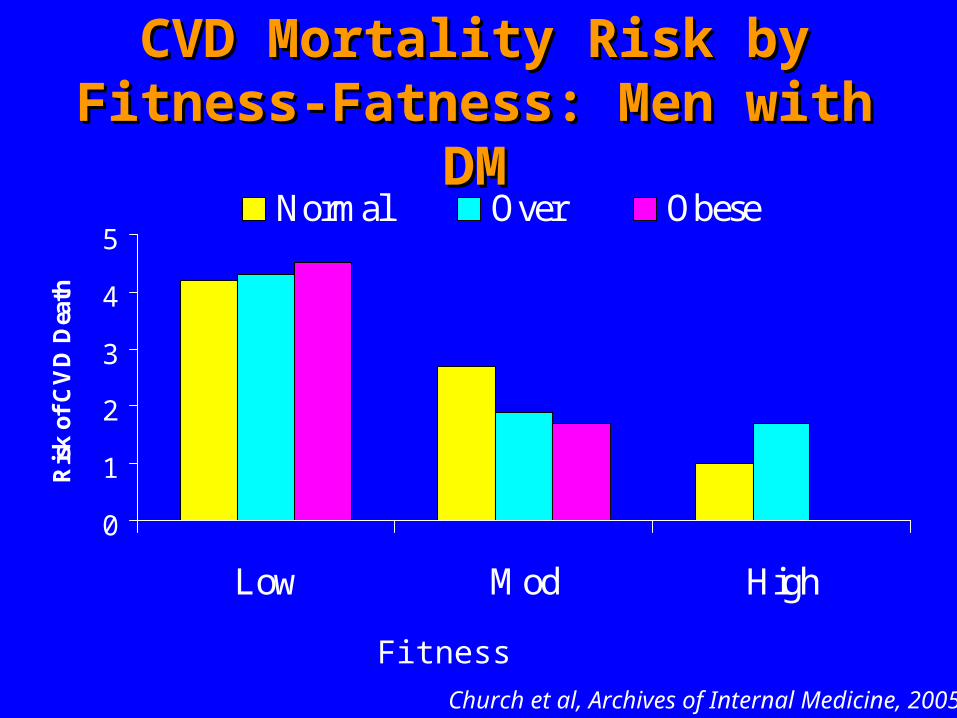
CVD Mortality Risk by Fitness-CVD Mortality Risk by Fitness-Fatness: Men with DMFatness: Men with DM
0
1
2
3
4
5
Low Mod High
Ris
k o
f C
VD
Dea
th
Normal Over Obese
Fitness
Church et al, Archives of Internal Medicine, 2005

FitnessFitness
CVDCVDDMDM
Weight Weight WeightWeight
FitnessFitness

FitnessFitness
CVDCVDDMDM
WeightWeightWeightWeight
FitnessFitness
X
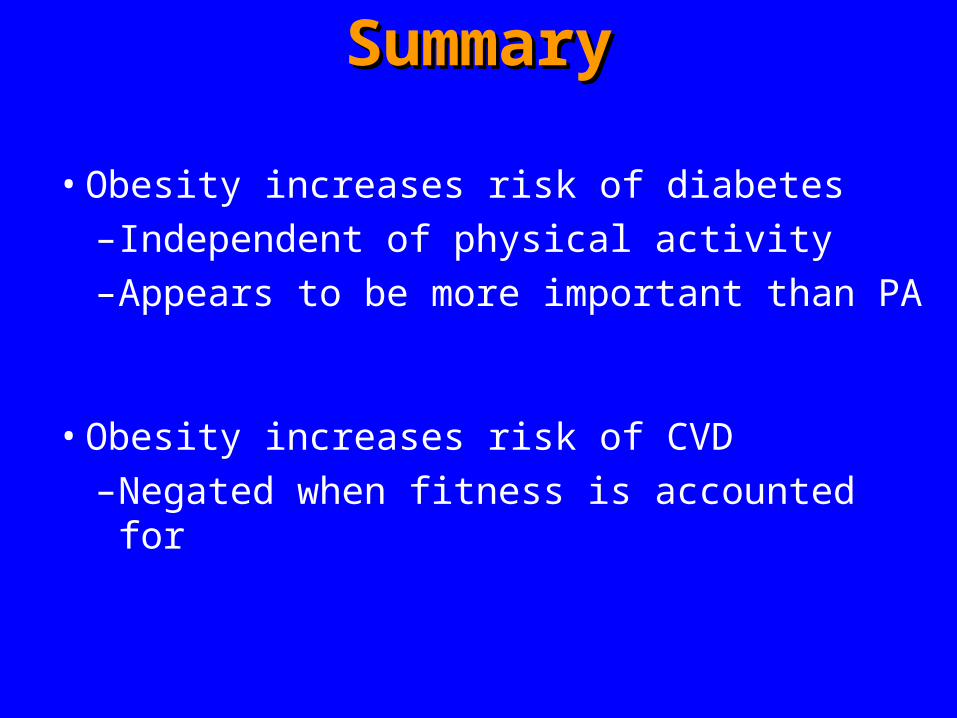
SummarySummary
• Obesity increases risk of diabetes
– Independent of physical activity
– Appears to be more important than PA
• Obesity increases risk of CVD
– Negated when fitness is accounted for
How does fitness protect How does fitness protect overweight/obese individuals overweight/obese individuals
with diabetes from CVD?with diabetes from CVD?

Exercise is PleiotropicExercise is PleiotropicPhysiological Benefits
Improved heart rate variability Reduced systemic inflammation
Reduced blood pressure Improved insulin sensitivity
Improved endothelial function Decreased myocardial oxygen demand
Increased myocardial function Maintains lean mass
Decreased platelet aggregation Increased fibrinolysis
Reduced blood and plasma viscosity Increased capillary density
Increased mitochondrial density Reduced visceral adiposity
Better sleep Improved mood and reduced anxiety
Reduced risk of developing…….Hypertension Osteoporosis
Metabolic syndrome Osteoarthritis
Depression Breast and colon cancer
Type 2 diabetes Dementia and Alzheimer’s disease
0
5
10
15
20
25
30
35
40
45
Rat
e p
er 1
,000
man
-yrs
<8.0 8.0-8.9
9.0-9.9
10.0-10.9
11.0-11.9
12.0-12.9
13.0-13.9
14.0-14.9
≥15.0
Maximal METs
P trend < 0.0001
Why ?
Diabetes Incidence Rates by Diabetes Incidence Rates by Fitness: ACLS (n =13,190)Fitness: ACLS (n =13,190)

Fitness and All-Cause Mortality, ACLS Men, 1970-1989
0
50
100
150
200
250
300
0 5 10 15 20 25 30
GXT Test Performance (minutes)
Ad
just
ed
Death
Rate
per
10
,00
0 P
Y
95% Upper Limit
Adjusted Death Rate
95% Lower Limit
Expected RelationExpected Relation

Fitness and All-Cause Mortality, ACLS Men, 1970-1989
0
50
100
150
200
250
300
0 5 10 15 20 25 30
GXT Test Performance (minutes)
Ad
just
ed
Death
Rate
per
10
,00
0 P
Y
95% Upper Limit
Adjusted Death Rate
95% Lower Limit
Expected Relation

Obesity Epidemic: Reduced Physical Activity and/or Increased Energy Intake?
Fitness vs. Fatness debate
Exercise for Weight Loss or Weight Maintenance?
Fitness vs. Fatness Debate

30 minutes
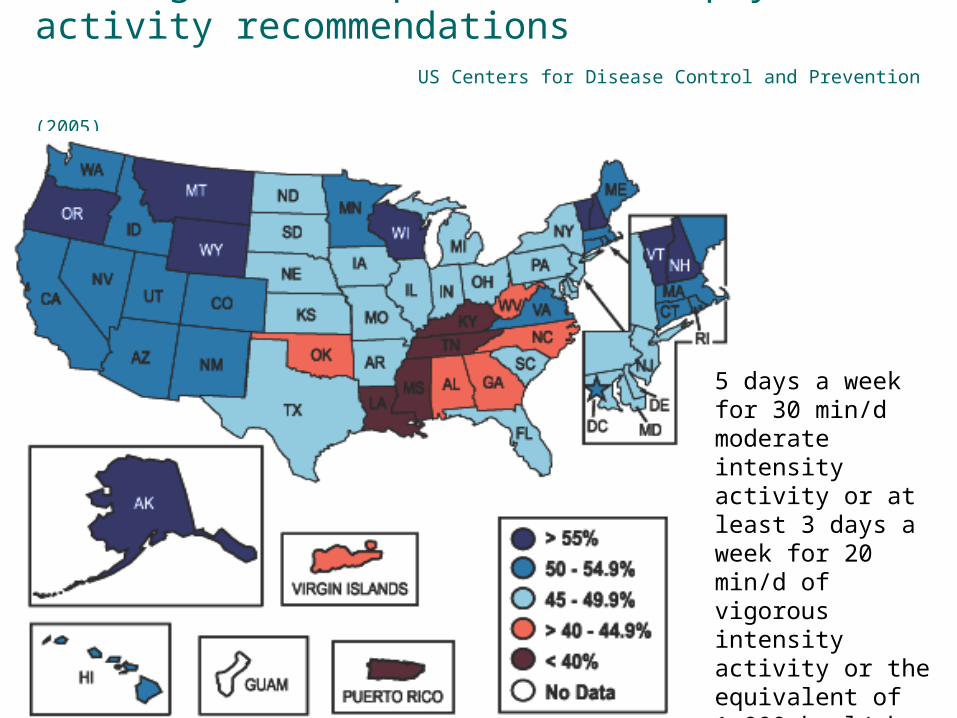
Prevalence of people in each state meeting current public health physical activity recommendations
US Centers for Disease Control and Prevention (2005)
5 days a week for 30 min/d moderate intensity activity or at least 3 days a week for 20 min/d of vigorous intensity activity or the equivalent of 1,000 kcal/wk in activity

Exercise-Induced Weight Loss
Reduction in Obesity and Related Comorbid Conditions after Diet-Induced Weight Loss or Exercise-Induced Weight Loss in Men (N=52; 3 mo; 700kcal/d) (R Ross et al Ann Int Med 2000; 92-103)
Exercise-Induced Redduction in Obesity and Insulin Resistance in Women: a RCT (N=54; 14-wk; 500Kcal/d) (R Ross et al; Obes Res 2004; 789-98)
Effect of a 16-m Randomized Controlled Exercise Trial on Body Weight and Composition in Young Overweight Men and Women (N=74; 16 mo; 400 kcal/d for 5 days) (JE Donnelly et al; Ann Int Med 2003; 1343-50)
Effect of Calorie Restriction with or without Exercise on Body Composition and Fat Distribution (LM Redman et al; JCEM 2007; 875-82)
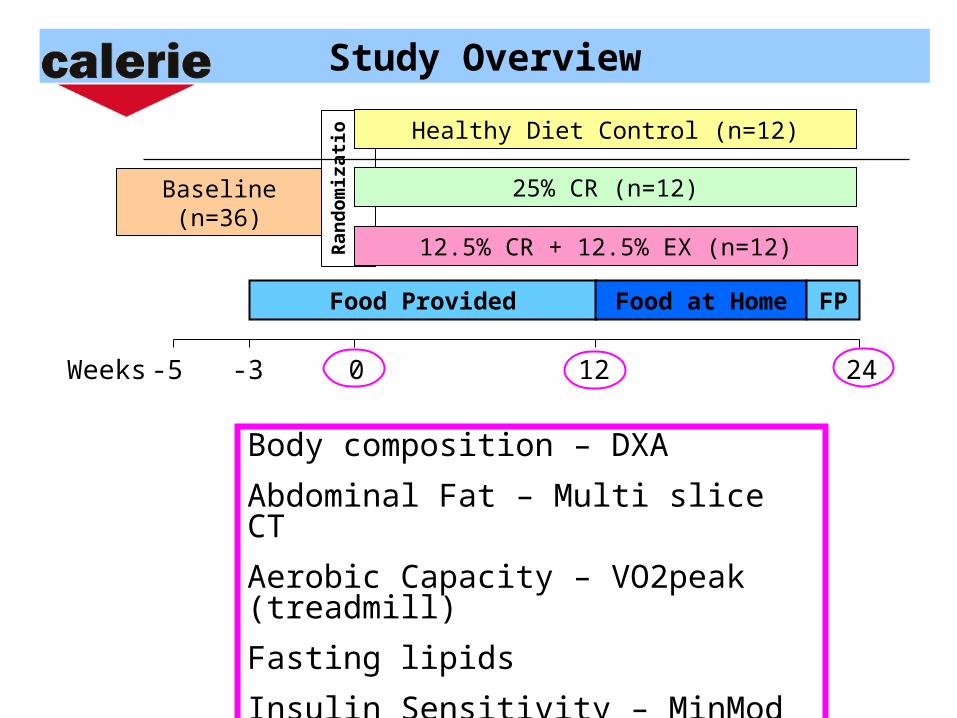
Study Overview
Ran
do
miz
atio
n
25% CR (n=12)
12.5% CR + 12.5% EX (n=12)
Baseline (n=36)
Healthy Diet Control (n=12)
Weeks -5 -3 0 12 24
Food Provided Food at Home FP
Body composition – DXA
Abdominal Fat – Multi slice CT
Aerobic Capacity – VO2peak (treadmill)
Fasting lipids
Insulin Sensitivity – MinMod (Bergman)

Caloric PrescriptionEnergy Requirement for weight maintenance
2 x 14d Doubly Labeled Water
Dai
ly E
nerg
y R
equi
rem
ent
100
75
Energy Deficit
Dietary Restriction only
CR
Dietary Restriction
Aerobic Exercise
Energy Deficit
CR+EX
+
Healthy Diet
Control
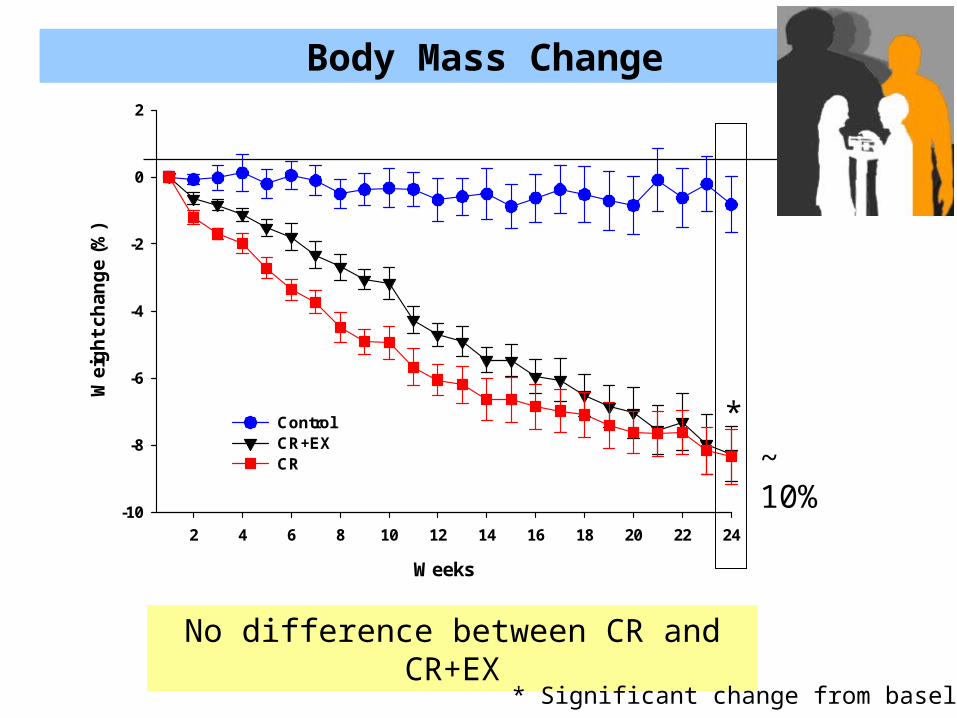
~ 10%
Body Mass Change
Weeks
2 4 6 8 10 12 14 16 18 20 22 24
Wei
gh
t c
ha
ng
e (
%)
-10
-8
-6
-4
-2
0
2
Control CR+EXCR
No difference between CR and CR+EX
*
* Significant change from baseline

Body Fat Change
Control CR CR+EX-40
-30
-20
-10
0
Per
cent
cha
nge
in F
M
CONTROL CR CR+EX-40
-30
-20
-10
0
Per
cent
cha
nge
in V
AT
Fat Mass by DXA
Visceral Fat by CT
* ** *
No difference between CR and CR+EX
* Significant change from baseline
National Weight Control Registry
(av. Wt loss 30kg for 5 years)
Eat a diet low in fat
Self monitoring of weight and food intake
Very high level of physical activity

Physical Activity Recommendations (CDC)
Current physical activity recommendations call for 30 minutes of moderate intensity activity on most days of the week, or the equivalent of expending approximately 1,000 kcal in activity per week
The Role of Physical Activity in Maintaining a Reduced Weight (Johannsen DL & Ravussin, Curr Athero Rep 2007)
Reduction in chronic disease and all-cause mortality with current recommendations of 30 min per day (1000 Kcal/wk)
60-90 min/d of moderate activity is necessary to maintain a reduced weight (2600-2800 Kcal/wk)
Energy Expenditure in Physical Activity for Maintenance of Weight
Loss

The new challenge is living better longer
The challenge is not living longer……
Dr Cefalu is on his way for a long healthy life but …. It is hard work