
Fishing fleet typology, economic dependence, and … · de critères technico-économiques : i) les...
13
Aquat. Living Resour. 22, 535–547 (2009) c EDP Sciences, IFREMER, IRD 2009 DOI: 10.1051/alr/2009031 www.alr-journal.org Aquatic Living Resources Fishing fleet typology, economic dependence, and species landing profiles of the French fleets in the Bay of Biscay, 2000-2006 Fabienne Daurès 1, a , Marie-Joëlle Rochet 2 , Sylvie Van Iseghem 1 and Verena M. Trenkel 2 1 Ifremer, UMR AMURE, Département DEM, Technopole de Brest-Iroise, BP 70, 29280 Plouzané, France 2 Ifremer, Département EMH, rue de l’île d’Yeu, BP 21105, 44311 Nantes Cedex 3, France Received 21 November 2008; Accepted 20 May 2009 Abstract – Thirty French fleets fishing primarily in the Bay of Biscay were defined based on techno-economic input criteria: i) 18 fishing gear or gear combinations ii) the location of fishing grounds visited during a year (<12 nautical miles from coast, beyond 12 nm or both) and iii) total vessel length (<20 m for trawlers and other gears <24 m). The fleets were then characterised in terms of horse power, economic dependence on a list of nine dominant commercial species (sole, Nephrops, sea bass, hake, monkfish, anchovy, cuttlefish, sardine and squid) and their contribution to the landings of these species from the Bay of Biscay. Most fleets derived the majority of their income from one or two among the nine species. Species dependencies changed little during the study period, except for those vessels targeting anchovy before the fishery restrictions starting in 2005. Fish community impacts were compared based on fleet landings’ profiles. Twelve landings profiles were determined using hierarchical cluster analysis. Fleets using similar gears had the same landings’ profiles and therefore exercised similar pressures on the ecosystem, though not always in the same areas. The depletion of anchovy and the closure of the fishery lead to a change in landings profile for offshore pelagic trawlers from anchovy dominance to one with a larger proportion of albacore and sea bass. During the study period, the overall vessel number decreased from 2163 to 1845. Few vessels changed fleets, but if they did, they primarily started to fish closer to the coast, which might be a result of increasing fuel prices. Key words: Fishing methods / Fishing vessels / Fleet dynamics / Mixed fisheries / Catch distribution / Economy / Atlantic Ocean Résumé – L’activité de pêche dans le golfe de Gascogne est pratiquée par 30 flottilles regroupant des navires à partir de critères technico-économiques : i) les engins ou combinaisons d’engins de pêche (on en recense 18), ii) la localisation des zones de pêche exploitées dans l’année (à moins de 12 milles nautiques de la côte, au delà de 12 nm de la côte) iii) la longueur totale du navire (< 20 m pour les navires utilisant le chalut et < 24 m pour les autres navires). Les flottilles sont décrites en termes de puissance motrice, de dépendance économique à une liste de 9 espèces commerciales majeures exploitées dans le golfe de Gascogne (sole, langoustine, bar, merlu, baudroie, anchois, seiche, sardine et calmar) et de contribution aux débarquements de ces espèces. La plupart des flottilles sont majoritairement dépendantes d’une ou deux espèces parmi les 9 retenues. Les dépendances aux espèces évoluent peu au cours de la période d’étude, sauf pour les flottilles qui ciblaient l’anchois avant les mesures réglementaires de fermeture de cette pêcherie en 2005. Les pressions exercées par ces flottilles sur les communautés de poisson sont étudiées à partir de leurs profils de débarquement. Ainsi, 12 profils de débarquement sont définis à partir d’une classification hiérarchique. On observe que les flottilles utilisant des engins similaires possèdent des profils de débarquement identiques et exercent donc des pressions de même intensité sur l’écosystème, bien qu’elles ne pêchent pas systématiquement dans les mêmes zones. Les mesures réglementaires sur la pêcherie de l’anchois ont conduit à une modification des profils de débarquement des chalutiers pélagiques du large, d’un profil dominé par l’anchois, vers un profil où la proportion de thon et de bar est forte. Durant la période d’étude, le nombre total de navires a diminué passant de 2163 à 1845. Peu de navires changent de flottilles ; ceux qui l’ont fait se sont reportés vers la côte, du fait probablement de l’augmentation des prix du gasoil sur la période d’étude. a Corresponding author: [email protected] Article published by EDP Sciences
Transcript of Fishing fleet typology, economic dependence, and … · de critères technico-économiques : i) les...

Aquat. Living Resour. 22, 535–547 (2009)c© EDP Sciences, IFREMER, IRD 2009DOI: 10.1051/alr/2009031www.alr-journal.org
AquaticLivingResources
Fishing fleet typology, economic dependence, and specieslanding profiles of the French fleets in the Bay of Biscay,2000-2006Fabienne Daurès1,a, Marie-Joëlle Rochet2, Sylvie Van Iseghem1 and Verena M. Trenkel2
1 Ifremer, UMR AMURE, Département DEM, Technopole de Brest-Iroise, BP 70, 29280 Plouzané, France2 Ifremer, Département EMH, rue de l’île d’Yeu, BP 21105, 44311 Nantes Cedex 3, France
Received 21 November 2008; Accepted 20 May 2009
Abstract – Thirty French fleets fishing primarily in the Bay of Biscay were defined based on techno-economic inputcriteria: i) 18 fishing gear or gear combinations ii) the location of fishing grounds visited during a year (<12 nauticalmiles from coast, beyond 12 nm or both) and iii) total vessel length (<20 m for trawlers and other gears <24 m). Thefleets were then characterised in terms of horse power, economic dependence on a list of nine dominant commercialspecies (sole, Nephrops, sea bass, hake, monkfish, anchovy, cuttlefish, sardine and squid) and their contribution to thelandings of these species from the Bay of Biscay. Most fleets derived the majority of their income from one or twoamong the nine species. Species dependencies changed little during the study period, except for those vessels targetinganchovy before the fishery restrictions starting in 2005. Fish community impacts were compared based on fleet landings’profiles. Twelve landings profiles were determined using hierarchical cluster analysis. Fleets using similar gears hadthe same landings’ profiles and therefore exercised similar pressures on the ecosystem, though not always in the sameareas. The depletion of anchovy and the closure of the fishery lead to a change in landings profile for offshore pelagictrawlers from anchovy dominance to one with a larger proportion of albacore and sea bass. During the study period, theoverall vessel number decreased from 2163 to 1845. Few vessels changed fleets, but if they did, they primarily startedto fish closer to the coast, which might be a result of increasing fuel prices.
Key words: Fishing methods / Fishing vessels / Fleet dynamics / Mixed fisheries / Catch distribution / Economy /Atlantic Ocean
Résumé – L’activité de pêche dans le golfe de Gascogne est pratiquée par 30 flottilles regroupant des navires à partirde critères technico-économiques : i) les engins ou combinaisons d’engins de pêche (on en recense 18), ii) la localisationdes zones de pêche exploitées dans l’année (à moins de 12 milles nautiques de la côte, au delà de 12 nm de la côte) iii) lalongueur totale du navire (< 20 m pour les navires utilisant le chalut et < 24 m pour les autres navires). Les flottilles sontdécrites en termes de puissance motrice, de dépendance économique à une liste de 9 espèces commerciales majeuresexploitées dans le golfe de Gascogne (sole, langoustine, bar, merlu, baudroie, anchois, seiche, sardine et calmar) et decontribution aux débarquements de ces espèces. La plupart des flottilles sont majoritairement dépendantes d’une oudeux espèces parmi les 9 retenues. Les dépendances aux espèces évoluent peu au cours de la période d’étude, saufpour les flottilles qui ciblaient l’anchois avant les mesures réglementaires de fermeture de cette pêcherie en 2005.Les pressions exercées par ces flottilles sur les communautés de poisson sont étudiées à partir de leurs profils dedébarquement. Ainsi, 12 profils de débarquement sont définis à partir d’une classification hiérarchique. On observeque les flottilles utilisant des engins similaires possèdent des profils de débarquement identiques et exercent donc despressions de même intensité sur l’écosystème, bien qu’elles ne pêchent pas systématiquement dans les mêmes zones.Les mesures réglementaires sur la pêcherie de l’anchois ont conduit à une modification des profils de débarquementdes chalutiers pélagiques du large, d’un profil dominé par l’anchois, vers un profil où la proportion de thon et de bar estforte. Durant la période d’étude, le nombre total de navires a diminué passant de 2163 à 1845. Peu de navires changentde flottilles ; ceux qui l’ont fait se sont reportés vers la côte, du fait probablement de l’augmentation des prix du gasoilsur la période d’étude.
a Corresponding author: [email protected]
Article published by EDP Sciences

536 F. Daurès et al.: Aquat. Living Resour. 22, 535–547 (2009)
1 Introduction
The move towards an ecosystem approach to fisheriesmanagement requires that the consequences of human activ-ities on the marine ecosystem in all its dimensions be takeninto account. To achieve this, it is now widely acknowledgedthat the human component in both its economic and social as-pects is to be taken as part of the system (sensu FAO 2003;Garcia and Cochrane 2005) and further research on fisher-men behaviour and fleet dynamics need to be undertaken (e.g.Le Floc’h et al. 2008 and 2007; Salas et al. 2004; Hilborn1985). In particular, managing fisheries in an ecosystem per-spective requires a good understanding of the mutual influ-ences between the ecosystem and the fishing community thatlives on it. This in turn relies on the definition of appropriateentities that form the basic units of these interactions and canbe monitored and managed. That is, we need to define ecologi-cal units (species or groups of species or spatial areas) that willproduce resources available to exploitation and bear the impactof this exploitation; and groups of vessels or gear-types that de-pend on these resources and exert the exploitation pressure onthem. Often, in multi-species, multi-fleet fisheries, there is awide diversity of species and fishing gears linked by a com-plex network of interactions; for understanding, monitoringand management purposes, some grouping is necessary (Lewyand Vinther 1992). This is not new and, in the past, groups offishing trips targeting a given species have been sought to es-timate the fishing effort on this target (e.g., Biseau 1998) orfisheries have been defined based on the spatial and temporalvariability of the catch species composition (Murawski et al.1983). What is new however with the ecosystem approach isthat we need units that are relevant both to the ecological andeconomic dynamics as both are to be considered together asparts of the fishery system.
Analyses of the fleet-ecosystem interactions have beenconducted at various scales. On the shorter time scale, catchcomposition at the trip or set level reveal, on the ecosys-tem side, spatial or seasonal variations in species assemblagesavailable to the fleets, and on the human side, the influence offishing tactics (e.g. small-scale spatial allocation of effort ortechnical settings) on catch composition, often interpreted interms of fishing power directed at some target species (e.g.,Lewy and Vinther 1992; He et al. 1997; Pech and Laloë 1997;Marchal et al. 2006; Quirijns et al. 2008). On a much longertime-scale, trends in the catch composition of vessels or fleetsreflect long-term trends in species availability and the changesin fishing strategies (large-scale spatial effort allocation andspecies targeting) that result from these changes, but also fromchanges in regulations (Holley and Marchal 2004), in fleetsize and composition (Bertignac 1992) and technical progress(Mahévas et al. 2004). At an intermediate scale, year-to-yearvariations in catch composition should reflect fluctuations andshort-term trends in fish abundance and communities and inthe annual amount of effort as measured by e.g. fishing days ornumber of vessels. The latter varies with entry and exit of ves-sels in the fleet, partly determined by catch fluctuations: thishas been mainly examined for single fleets and one or a fewspecies (Ward and Sutinen 1994; Pradhan and Leung 2004;Merino et al. 2007a; Merino et al. 2007b). While the annualscale is obviously relevant to assess the profitability of fishing
strategies, and cost and earnings data are currently only avail-able at this temporal scale, it has been the focus of few ecolog-ical analyses. However, if we are to tackle both economic andecological dynamics together, this scale becomes relevant forboth domains.
The Bay of Biscay is a typical multi-species multi-fleetfishery with a large diversity of species exploited by a widerange of fishing gears operated from French and Spanish ports.The French fleet operating in the Bay of Biscay consists ofapproximately 2000 vessels, whose size varies from 3.6 to24 m. They deploy gillnets, trawls, sieves, long-lines, potsand dredges; in many cases a vessel uses different types ofgears during the year. The main target species are: sole, hake(both of which are currently undergoing rebuilding plans), seabass, sardine and Nephrops. Anchovy used to be a major targetspecies but the fishery has been mainly closed since the stockcollapsed in 2005. All these stocks, excepted sea bass, aremanaged by TAC under the Common Fisheries Policy (CFP)of the European Union, and by gear restrictions. Since the in-stauration of the hake recovery plan in 2002, minimum meshsize for trawls was increased to 100 mm in a large part of theBay of Biscay, but since 2006 trawlers using a square meshpanel were allowed to use a 70 mm mesh size (ICES 2008). Amanagement plan for sole was adopted in February 2006, con-sisting of a gradual reduction of fishing mortality to increasethe spawning stock. The CFP also entailed important reduc-tions in fleet size in recent years, while the increase in fuelprice created another pressure on the fleet. Detailed data onthe technical characteristics of the French fleet and its landingscomposition are available in the Fishery Information System ofIfremer for 2000-2006.
This paper aims at matching, at the annual scale, Bay ofBiscay fishery units defined by technological criteria (e.g. typeof vessel and fishing gear), with their pressure on the ecosys-tem described by their catch composition. At the scale of thetrip, Marchal (2008) categorized the French fleets fishing in theNorth-Atlantic based on fishing area, gear, and either mesh-size or alleged target-species. He was able to forecast the catchprofiles of the most species-selective fleets, like netters andpelagic trawlers. Bottom trawl catches however, seemed to beless predictable owing to changes in the demersal fish commu-nity. At the scale of the year, Duarte et al. (2009) had to usea mixture of landings’ profiles clustering and segmentation bytechnical variables to identify manageable vessel groups. Here,we examine whether fleets defined on the basis of fine techni-cal criteria can be grouped into a reduced set of catch profilesthat can be related to similar pressure on the fish community;whether groups of catch profiles are made up of the same fleetsacross years; and whether vessels often change fleet.
In the following sections, first, fishing fleets, or groups ofvessels having similar behaviour and fishing strategies, are de-fined based on input criteria (sensu Marchal 2008): type ofgear used and distance from the coast, the latter considered asa proxy for vessel size. Second, economic dependence of thesefleets on the major target species and their contribution to thesespecies’ production are analyzed. Third, the degree to whichdifferent fleets exert a similar pressure on the fish community,and whether this pressure is consistent over time, is examinedby a multivariate analysis of their catch profiles. Finally, the

F. Daurès et al.: Aquat. Living Resour. 22, 535–547 (2009) 537
dynamics of these fleets, in terms of the frequency of year-to-year movements of vessels between fleets, is described.
2 Material and methods
2.1 Fisheries data
Several types of fisheries data for the period 2000-2006 were extracted from the Fishery Information System ofIfremer (Leblond et al. 2008). The fleet data set includes tech-nical information for each French commercial vessel regis-tered on December 31 of each year: vessel length and age,engine power, tonnage and maritime district. The market dataset (from auction halls) contains for each vessel and fishingtrip the landed value and quantity by species. Direct sales arenot considered in the study and may be important for somespecies landed by coastal small-scale vessels (e.g. glass eel).Trip data are compiled to obtain yearly sales data per ves-sel and per species. Negative sale values were ignored (0.06%of entries); they correspond to a posteriori corrections by theauction hall due to customer complaints that cannot be linkedwith the original sales. The fishing method and activity dataset was derived from an activity questionnaire filled in annu-ally for all registered vessels (Berthou et al. 2008). The data setcontains broad information on fishing location and gear usedduring the year, as well as landings and target species. Moredetailed information on the fishing gear such as mesh size wasnot available.
This study deals with vessels that fished primarily in theBay of Biscay, defined as ICES areas VIII a, b and d and thatwere registered in one of the Atlantic maritime districts rang-ing from Southern Brittany to Aquitaine (Fig. 1). In order toremove vessels that primarily operated elsewhere, for examplein the Celtic Sea, trawlers larger than 20 m and other vesselslarger than 24 m were excluded. These vessel size limits weredetermined from a large scale vessel activity analysis (Leblondet al. 2007).
French vessels operating in the Bay of Biscay land over200 species. Twenty species contributed over 80% in volumeand value during the period 2000 to 2006 (Table 1). Ninespecies or species groups (hereafter “species”) with averageannual landings worth more than five millions euros wereretained for detailed study: sole, Nephrops, seabass, hake,monkfish, anchovy, cuttlefish, sardine and squid (Daurès et al.2007).
2.2 Definition and characterisation of fishing fleets
Homogenous fishing fleets were defined based on fishinggears used and fishing distance from the coast. There are 18fishing gear classes, seven of which contain several gears, e.g.the class of mixed bottom and pelagic trawls (Table 2). Beamtrawls are rarely used in the Bay of Biscay. The mixed gearclasses correspond to vessels that change gear either withinor between fishing trips. The “Inactive” class contains vesselsthat were registered but did not go out fishing in a given year.Three fishing distance classes have been identified. Class 1refers to coastal vessels, fishing within 12 nm from the coast
Fig. 1. Number of vessels per fleet and per maritime district (region).For gear classification into passive and active see Table 2 and for fleetdefinitions Table 3. Circle diameters are proportional to the numberof vessels: 733 Southern Brittany, 522 Pays de Loire, 331 Aquitaineand 288 Poitou-Charentes.
during at least 75% of their fishing time. Class 3 refers to off-shore vessels spending at least 75% of their fishing time be-tween 12 nm to and the shelf break. Class 2 refers to shelf ves-sels, and it groups all other vessels, i.e. those fishing both inthe coastal and offshore areas at different times of the year. Afleet is then defined by the unique combination of a fishing gearclass and a distance class. Overall 31 fleets were defined in thisway as not all possible combinations actually occur (Table 3).
The gear characteristics available in the fleet data set didnot allow the distinction between Nephrops, pelagic and otherbottom trawls or between gill nets for sole and other nets suchas drift nets or gill nets targeting hake. Therefore species con-tribution to landings and gross revenue was used to deducewhich type of gear had been used by the vessel. Thus, vesselswere assigned to the Nephrops trawl fleet if Nephrops con-tributed at least 30% of their income a given year. For distin-guishing between sole nets and other nets, all vessels that hadlanded any sole a given year (at least one trip targeting sole)were assigned to the fleet using sole nets. The thresholds of30% for Nephrops income and 1 trip for sole netter were ob-tained by an analysis of vessel catch composition that clearlyshowed distinct groups with Nephrops versus fish and sole ver-sus no sole. The assumption that catch composition is the re-sult of specific technological choices was confirmed by geartechnology experts. Data for the year 2005 was used for pre-senting the production capacity of each fishing fleet (number

538 F. Daurès et al.: Aquat. Living Resour. 22, 535–547 (2009)
Table 1. List of the twenty main species landed by the French fleets in the Bay of Biscay, in decreasing order of average landings, in volume,over the period 2000-2006. The top nine species in value are marked *.
Code English Name Latin Name Landing (t) Value (x ¤1000)SAR * sardine Sardina pilchardus 14 116 7 394ANC * anchovy Engraulis encrasicholus 5 019 10 549HAK * hake Merluccius merluccius 4 674 19 708CUT * cuttlefish Sepia spp. 4 231 8 591NEP * Nephrops Nephrops norvegicus 3 866 32 713SOL * sole Solea solea 3 774 42 496MON * monkfish Lophius spp. 3 042 15 794MAC mackerel Scomber scombrus 3 019 2 543CON conger eel Conger conger 2 487 4 410BAS * sea bass Dicentrarchus labrax 2 341 23 452HOR horse mackerel Trachurus trachurus 1 967 2 052ALB albacore Thunnus alalunga 1 714 4 098WHI whiting Merlangus merlangius 1 542 3 417SPI spider crab Maja squinado 1 326 2 717MHO Mediterranean horse mackerel Trachurus mediterraneus 1 194 2 083POL pollack Pollachius pollachius 1 134 4 615POU pouting Trisopterus luscus 1 079 821SQU * squid Loligo spp. 1 000 5 642CAT small-spotted catshark Scyliorhinus canicula 964 525SCA scallop Pecten maximus 838 3 340
Table 2. Gear classes for French vessels operating in the Bay of Biscay.
Type Code Name Gears
Active
T Trawl Bottom otter trawls, midwater pair trawlsBT Bottom trawl Bottom otter trawls, bottom pair trawlsPT Pelagic trawl Midwater pair trawlsMT Bottom and pelagic trawls Bottom otter trawls, midwater pair trawls, midwater otter trawls,
bottom pair trawlsNT Nephrops trawl Bottom pair trawls, bottom otter trawlsU Trawl & other gears Bottom otter trawls, glass eel sieve, boat dredge,
bottom pair trawlsS Seine Purse seineD Dredge Boat dredgeG Glass eel sieve
Passive
N Net Trammel nets, driftnets, set gillnetsNS Sole net Driftnets, trammel netsQ Nets & pots Pots, trammel nets, set gillnets, driftnetsE Nets & hooks Set gillnets, set longlines, handlinesES Sole net & hooks Trammel nets, set gillnets, set longlines, handlinesP Pots PotsF Pots & hooks Pots, set longlines,H Hooks Set longlines, handlines
Mixed O Miscellaneous gearsI Inactive
of vessels, total engine power) and the total fleet production invalue and weight.
The 30 active fleets (i = 1 to 30) defined above used dif-ferent gears to target the same or different species ( j = 1 to 9)in coastal or offshore areas or both. The economic dependenceof fleet i on species j was defined as
Di, j = Qi, j
/∑j
Qi, j
where Qi, j is the revenu of the vessels in fleet i from sellingspecies j in a given year. The summation in the denominatoris with respect to all landed species.
Conversely, the contribution of fleet i to the exploitation ofspecies j is the proportion of landings of species i due to fleet j
Ci, j = Li, j
/∑i
Li, j
where Li, j are the landings (weight or value) of species j byfleet i in a given year. The summation is with respect to allfleets i that were landing species j.

F. Daurès et al.: Aquat. Living Resour. 22, 535–547 (2009) 539
Tabl
e3.
Des
crip
tors
for
Fre
nch
fish
ing
flee
tsin
the
Bay
ofB
isca
yin
2005
.For
spec
ies
code
sse
eTa
ble
1.D
epen
denc
ies
are
the
perc
enta
geof
inco
me
deri
ved
from
agi
ven
spec
ies.
Coa
stal
flee
tsop
erat
ew
ithi
n12
nmfr
omth
eco
ast,
offsh
ore
flee
tsbe
yond
12na
utic
alm
iles
from
the
coas
tand
shel
ffl
eets
inbo
thzo
nes.
Spec
ies
depe
nden
ce(%
)C
ontr
ibut
ion
tola
ndin
gsof
9*sp
ecie
sF
leet
nam
eC
ode
Num
ber
Tota
lA
vera
geTo
tal
Tota
lSO
LH
AK
BA
SM
ON
AN
CN
EP
CU
TSQ
USA
RO
ther
s%
wei
ght
%va
lue
vess
els
kWL
engt
hla
ndin
gsla
ndin
gs(m
)(t
)(k¤
)C
oast
alN
ephr
ops
traw
lers
1NT
367
817
14.1
210
311
015
106
15
057
12
018
36
Coa
stal
traw
lers
1T23
342
511
.41
049
366
213
55
30
48
95
481
1C
oast
altr
awls
&ot
her
gear
s1U
238
2290
510
.03
225
1390
720
45
10
911
50
444
5S
helf
Nep
hrop
str
awle
rs2N
T62
1561
115
.24
448
2352
39
61
70
572
10
167
12S
helf
bott
omtr
awle
rs2B
T46
1250
715
.64
668
1828
918
86
50
811
130
326
8S
helf
bott
om&
pela
gic
traw
lers
2MT
153
364
13.9
187
13
866
97
62
35
28
2039
21
She
lfpe
lagi
ctr
awle
rs2P
T8
195
514
.11
645
223
10
2010
02
00
019
492
1S
helf
traw
ls&
othe
rge
ars
2U13
201
411
.653
02
691
207
33
035
12
129
11
Off
shor
eN
ephr
ops
traw
lers
3NT
318
775
16.4
282
513
592
74
113
050
21
022
47
Off
shor
ebo
ttom
traw
lers
3BT
3711
289
16.9
447
616
724
64
233
08
76
034
67
Off
shor
ebo
ttom
&pe
lagi
ctr
awls
3MT
144
743
18.0
200
46
304
55
245
136
85
129
23
Off
shor
epe
lagi
ctr
awle
rs3P
T16
547
518
.72
639
829
60
143
021
00
00
342
3C
oast
alse
iner
s1S
285
395
15.0
1517
810
108
00
60
10
00
5736
344
Coa
stal
dred
gers
1D95
936
69.
81
412
638
317
021
40
04
00
541
2C
oast
alne
tter
s1N
563
970
7.0
247
124
70
276
80
01
00
590
0C
oast
also
lene
tter
s1N
S91
1122
110
.01
986
1161
141
46
60
01
00
422
4C
oast
alne
ts&
pots
1Q11
48
416
8.0
118
35
499
154
54
00
20
069
11
Coa
stal
nets
&ho
oks
1E42
366
28.
040
82
309
05
561
00
10
038
01
Coa
stal
sole
nets
&ho
oks
1ES
636
220
9.0
101
85
752
213
353
00
20
037
12
Coa
stal
pott
ers
1P41
278
77.
623
01
263
00
00
01
30
096
00
Coa
stal
pots
&ho
oks
1F47
372
78.
338
52
749
10
370
00
00
061
01
Coa
stal
hook
s1H
117
1068
38.
61
402
853
20
263
00
00
00
351
3S
helf
sole
nett
ers
2NS
4811
178
15.1
272
620
111
622
48
00
10
022
410
She
lfho
oks
2H13
206
411
.378
62
214
01
190
00
00
080
00
Off
shor
eso
lene
tter
s3N
S17
488
519
.12
065
1157
143
295
100
01
00
124
6Off
shor
eN
ette
rsO
ther
3N10
401
422
.01
978
835
90
690
270
00
00
45
5C
oast
algl
ass
eels
ieve
s1G
396
2520
47.
696
95
826
112
350
00
40
048
12
Coa
stal
mis
c.ge
ars
1O49
255
26.
229
173
20
350
00
90
054
00
She
lfm
isc.
gear
s2O
213
971
12.8
188
44
623
302
91
00
10
752
31
Off
shor
em
isc.
gear
s3O
113
969
21.9
178
88
002
183
40
20
00
071
11
Inac
tive
I72
517
68.
19
92
*spe
cies
mar
ked
by*
inTa
ble
1.

540 F. Daurès et al.: Aquat. Living Resour. 22, 535–547 (2009)
In order to identify fleets that had similar types of impactson the ecosystem, the species composition of their annual land-ings (in weight) were compared. The annual landings of themajor 20 species by the 30 active fleets were turned into land-ing profiles by dividing by total annual production by eachfleet. Euclidean distance between these 30×7 = 210 landings’profiles was calculated and analysed by hierarchical clusteringto group the most similar profiles. Initially, each profile is as-signed to its own cluster and then the algorithm proceeds itera-tively, at each stage joining the two most similar clusters, con-tinuing until there is just a single cluster. The two most similarclusters are selecting according to Ward’s minimum variancemethod that is, as those with the lowest within-cluster vari-ance. The resulting tree was cut where the F-statistic (ratio ofbetween- to within-cluster variance) was maximized, resultingin 12 clusters. Each cluster was characterized by its averagelandings’ profile.
Vessel change fleets by either changing distance class, e.g.reducing the activity radius from shelf to coastal zone, or byinvesting in additional or new fishing gear to increase theirfishing power or modify their target. Inter-annual vessel move-ments between fleets were characterized by transition matri-ces, where each cell (i, j) contains the proportion of vessels offleet i that moved to fleet j between years t and t + 1. Wheni = j, the vessels remained in the same fleet, that is, if all ves-sels would keep the same activity the diagonal of the transitionmatrix would consist of 1s and all other cells would be 0s. Themore there are changes between fleets, the more there will benon-empty cells outside the diagonal. As variability betweenannual transition matrices for the period 2000-2006 was low,only the average annual transition matrix is presented. Twoadditional dummy fleets were added for this study of fleet dy-namics, corresponding to new vessels appearing in the Bay ofBiscay, which either fished elsewhere before or were newlybuilt vessels (“In”), and vessels leaving the Bay of Biscay,either moving elsewhere or ceasing to fish (“Out”).
3 Results
3.1 Description of French fleets in the Bay of Biscay
Overall 1870 French vessels operated primarily in the Bayin 2005, with a total engine power of 228 340 kW. They landed67 162 t of sea products for a total value of 240.5 millions eu-ros, for an average price of 3.7¤ kg−1. Using economic inputcriteria regarding fishing gears and fishing distance from thecoast, they were grouped into 30 active fleets plus one inac-tive fleet (Table 3). In 2005, 72 vessels were inactive, hencethey are not expected to land anything. The number of reg-istered vessels decreased from North to South in the Bay ofBiscay (Fig. 1). The figure also shows some regional special-ization. Passive gears were little used by vessels registered inAquitaine compared to other districts. Vessels from SouthernBrittany were specialised in Nephrops trawling while usingrelatively less glass eel sieves. Coastal seiners (1S) were ab-sent from Pays de Loire and Poitou-Charente.
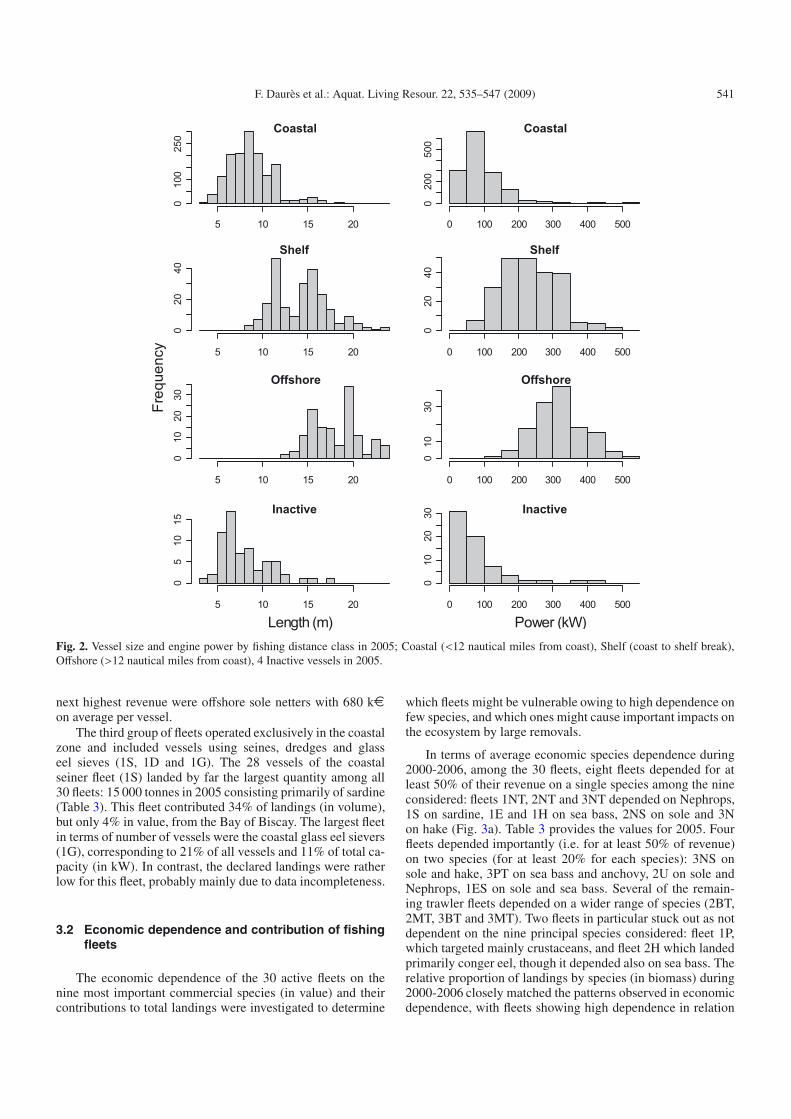
Vessel size and engine power are well connected to thefishing distance class (Fig. 2). In 2005, small vessels (<10 m
and 100 kW) were exclusively fishing in the coastal area (fish-ing distance class 1), while in the offshore area (class 3) onlylarge vessels were found (18–24 m, >350 kW). Intermediatevessels developed mixed localisation strategies between off-shore and coastal areas. Inactive vessels were mostly smallvessels (<10 m and 100 kW). It is interesting to notice that onthe contrary, length and power alone may not be good predic-tors of the fishing distance regarding the large overlap betweenneighbouring categories (Fig. 2). This is a reason for the choiceof distance class rather than length or power for fleet segmen-tation even if the latter are widely available.
Three large groups of fleets can be distinguished, based ongear type or “family” and are briefly examined below: trawlerfleets, passive gear fleets and a third group of heterogeneousfleets. The average vessel age in the French Bay of Biscayfleets was 22 years in 2005. The youngest vessels were foundamong the group of passive gear fleets, with an average ageof 11 years for shelf sole netters (2NS) and 14 years for shelfliners using hooks (2H).
There were 12 fleets using trawls, three of which wereoperating exclusively in the coastal zone (1NT, 1T and 1U),four exclusively offshore (3NT, 3BT, 3MT and 3PT) andthe remaining five anywhere on the Bay of Biscay shelf(2NT, 2BT, 2MT, 2PT and 2U) (Table 3). Among trawlerfleets, coastal non-exclusive trawlers (1U) were the largestfleet in terms of number of vessels (238) and total power(23 000 kW), followed by shelf Nephrops trawlers (2NT,62 vessels, 15 000 kW). Offshore (3BT) and shelf bottomtrawlers (2BT) were important in terms of total power (morethan 10 000 kW for each fleet), but less so in terms of numbers(37 and 46 respectively). The same four trawler fleets had alsothe largest annual landings in weight and value. Among these,the highest value of landings was achieved by shelf Nephropstrawlers (2NT) with more than 23 millions ¤ in 2005, whichwas 12% of the total value landed from the Bay of Biscay. Interms of landed value per vessel, offshore Nephrops trawlers(3NT) were leading the trawler fleets (13.5 millions ¤ for31 vessels). The largest vessel fishing capacity, with vessellength over 18m and power over 300 kW, was found in theoffshore fleets using pelagic trawls (3MT and 3PT).
Twelve fleets used various passive gears and most of themoperated in the coastal zone (Table 3). Only netters (2NS, 3NSand 3N) and vessels using hooks (2H) were operating outsidethe coastal area. The most important fleets in the passive geargroup were coastal netters targeting sole (1NS), with a total of11 221 kW and 91 vessels and the coastal fleet using hooks(1H) with 10 683 kW and 117 vessels. In terms of vessel num-bers, coastal netters and potters (1Q) were important (114 ves-sels), similarly 63 vessels used both sole nets and hooks (1ES).Shelf sole netters (2NS) had a high average capacity (234 kWper vessel) compared to coastal sole netters (1NS, 123 kW).The former fleet also had the second highest landings in valuein 2005 (20 millions ¤), which corresponded to 10% of thelanded value in the Bay of Biscay and was comparable to theshelf Nephrops trawler fleet. Among the vessels included inthis study, the offshore fleet using nets and other gears (3N),consisted of the most powerful vessels (401 kW on average)with the highest average landed value in 2005 by any of the 30active fleets, 836 k¤ per vessel on average. The fleet with the
F. Daurès et al.: Aquat. Living Resour. 22, 535–547 (2009) 541
Coastal
5 10 15 20
010
025
0
Coastal
0 100 200 300 400 500
020
050
0
Shelf
5 10 15 20
020
40
Shelf
0 100 200 300 400 500
020
40
Offshore
5 10 15 20
010
2030
Offshore
0 100 200 300 400 500
010
30
Inactive
5 10 15 20
05
1015
Inactive
0 100 200 300 400 500
010
2030
Length (m) Power (kW)
Freq
uenc
y
Fig. 2. Vessel size and engine power by fishing distance class in 2005; Coastal (<12 nautical miles from coast), Shelf (coast to shelf break),Offshore (>12 nautical miles from coast), 4 Inactive vessels in 2005.
next highest revenue were offshore sole netters with 680 k¤on average per vessel.
The third group of fleets operated exclusively in the coastalzone and included vessels using seines, dredges and glasseel sieves (1S, 1D and 1G). The 28 vessels of the coastalseiner fleet (1S) landed by far the largest quantity among all30 fleets: 15 000 tonnes in 2005 consisting primarily of sardine(Table 3). This fleet contributed 34% of landings (in volume),but only 4% in value, from the Bay of Biscay. The largest fleetin terms of number of vessels were the coastal glass eel sievers(1G), corresponding to 21% of all vessels and 11% of total ca-pacity (in kW). In contrast, the declared landings were ratherlow for this fleet, probably mainly due to data incompleteness.
3.2 Economic dependence and contribution of fishingfleets
The economic dependence of the 30 active fleets on thenine most important commercial species (in value) and theircontributions to total landings were investigated to determine
which fleets might be vulnerable owing to high dependence onfew species, and which ones might cause important impacts onthe ecosystem by large removals.
In terms of average economic species dependence during2000-2006, among the 30 fleets, eight fleets depended for atleast 50% of their revenue on a single species among the nineconsidered: fleets 1NT, 2NT and 3NT depended on Nephrops,1S on sardine, 1E and 1H on sea bass, 2NS on sole and 3Non hake (Fig. 3a). Table 3 provides the values for 2005. Fourfleets depended importantly (i.e. for at least 50% of revenue)on two species (for at least 20% for each species): 3NS onsole and hake, 3PT on sea bass and anchovy, 2U on sole andNephrops, 1ES on sole and sea bass. Several of the remain-ing trawler fleets depended on a wider range of species (2BT,2MT, 3BT and 3MT). Two fleets in particular stuck out as notdependent on the nine principal species considered: fleet 1P,which targeted mainly crustaceans, and fleet 2H which landedprimarily conger eel, though it depended also on sea bass. Therelative proportion of landings by species (in biomass) during2000-2006 closely matched the patterns observed in economicdependence, with fleets showing high dependence in relation

542 F. Daurès et al.: Aquat. Living Resour. 22, 535–547 (2009)
Dependences1.0 0.8 0.6 0.4 0.2 0.0
a)
1NT1T1U2NT2BT2MT2PT2U3NT3BT3MT3PT1S1D1N1NS1Q1E1ES1P1F1H2NS2H3NS3N1G1O2O3OI
Production (1000 tonnes)0.0 0.5 1.0 1.5 2.0 2.5 3.0 3.5
SARSQUCUTNEPANC
MONBASHAKSOL
b)
Fig. 3. a) Average dependence (proportion of landings value) and b) average production (×1000 tonnes) of French fleets in the Bay of Biscayfor nine most valuable species during 2000-2006. The bar widths are proportional to the total power of the fleets concerned, in kW. For speciesabbreviations, see Table 1. For fleet definitions and total power see Table 3. Total production of fleet 1S is 11 493.21 tonnes.
to one species also contributing the majority of landings of thatspecies (Fig. 3b).
Economic dependence on most species was stable for mostfleets during the study period. The main exception was thoseexploiting anchovy (2PT, 3MT, 3PT, 3BT and 1S), the coastalfleets using trawls and other gears (1U) or glass eel sieves (1G)and offshore netters (3N), Fig. 4a. Owing to poor recruitment,the anchovy fishery was closed in July 2005 for a year and avery small TAC was set for 2006. As the availability of an-chovy decreased from 2005 onwards, coastal seiners (1S) in-creased their dependence and landings of sardine, while off-shore bottom and pelagic trawlers (3BT and 3PT) increasedtheir landings and their dependence on sea bass (Fig. 4a). Atthe beginning of the time series, fleet 1U increased its eco-nomic dependence on squid and cuttlefish (Fig. 4a), increasingits landings of these species (Fig. 4b). During the same period,fleet1G increased its relative dependence on sea bass despitestable landings of this species. Similarly, fleet 3N obtained anincreasing part of its revenue from hake (Fig. 4a), although itshake landings did not increase (Fig. 4b).
In terms of average contributions in 2005, ten fleets con-tributed 80% of total landings (in weight) for the nine selectedspecies, and three fleets contributed nearly 50% (Table 3). Indecreasing order of volume landed, these fleets were coastalseiners (1S, 34%), shelf Nephrops trawlers (2NT, 7%) andshelf bottom trawlers (2BT, 6%). Thus, a large proportion ofthe biomass production from the Bay of Biscay resulted fromfew fleets. The concentration was slightly less marked in terms
of landed value as 80% of the landing value was produced by12 fleets and 50% by six fleets. The largest contributors werethe shelf Nephrops trawlers (2NT) with a 12% share in landedvalue, closely followed by sole netters (2NS) with a 10% shareand offshore bottom and Nephrops trawlers (3BT and 3NT)with 7% each.
3.3 Landing profiles
Landing profiles were created to compare the pressure ex-erted by the various fleets on the fish community, based on thespecies composition of their catches. Cluster analysis of an-nual landings by fleet (in weight) for the main 20 species (seeTable 1) lead to the definition of 12 profiles (Fig. 5). Most pro-files were dominated by one or two species, with the exceptionof profile 7 and 5, for which none of the 20 species was clearlydetermining. The nine studied species (in bold in Fig. 5) char-acterized most profiles, additionally conger eel was importantfor profiles 10 and 11.
Fleets using similar gear had generally the same pro-files thus globally a similar type of impact on the ecosystem(Table 4). For example, the landings of all Nephrops trawlers(1NT, 2NT and 3NT) were characterised by profile 1. For allother bottom trawlers (1T, 2BT, 3BT, 1U), landings corre-sponded to profile 2, dominated by cuttlefish. Fleets 1D usingdredges and 1G using glass eel sieves had the same landingsprofile 2 because their targets (respectively scallops and glass

F. Daurès et al.: Aquat. Living Resour. 22, 535–547 (2009) 543
0.0
0.4
0.8
2000 2003 2006
1U
0.0
0.4
0.8
2000 2003 2006
2NT
0.0
0.4
0.8
2000 2003 2006
3BT
0.0
0.4
0.8
2000 2003 2006
3PT
0.0
0.4
0.8
2000 2003 2006
1S
0.0
0.4
0.8
2000 2003 2006
1H
0.0
0.4
0.8
2000 2003 2006
3N
0.0
0.4
0.8
2000 2003 2006
1G
Dep
ende
nces
a)
0.0
1.0
2000 2003 2006
1U
01
23
45
2000 2003 2006
2NT
0.0
1.0
2.0
2000 2003 2006
3BT
01
23
45
2000 2003 2006
3PT
04
812
2000 2003 2006
1S
0.0
0.2
0.4
0.6
2000 2003 2006
1H
0.0
1.0
2000 2003 2006
3N
0.0
0.2
0.4
2000 2003 2006
1G
SARSQUCUTNEPANC
MONBASHAKSOL
Pro
duct
ion
(100
0 to
nnes
)
b)
Fig. 4. Time trends in a) species dependences and b) species produc-tions for selected French fleets in the Bay of Biscay (2000-2006). Forspecies abbreviations see Table 1. For fleet definitions, see Table 3.
eel) were not included in the 20 species analysed. Offshorepelagic trawlers (3PT) had profile 4 (anchovy) until 2004 andthen shifted to the more diversified profile 5. Two fleets hadunique landings profiles: coastal seiners (1S) had profile 6 andfleet 2H using hooks had profile 11, resulting from their partic-ular target species sardine and conger eel respectively. Profile7 deserves special mention as none of the main 20 species con-sidered in this study characterised it particularly. The reason isthat the two coastal corresponding fleets (1Q and 1P), usingpots mainly landed crustaceans which were not considered inthis analysis which concentrates on the most valuable speciesin the Bay of Biscay.
For most fleets the landing profiles were rather stable dur-ing the study period with a few exceptions (Table 4). Fleet 1Gseemed to have switched from cuttlefish (profile 2) to congereel (profile 10) in 2006. Offshore netters (3NS and 3N) ap-peared to have switched between profiles 8 and 12. However,hake was the dominant species in both profiles, the main dif-ference being the proportion of sole and albacore which washigher in profile 8. Profile 4, dominated by anchovy, was theonly profile that disappeared during the study period, when
Landing profilesS
peci
es1 2 3 4 5 6 7 8 9 10 11 12
SARANCHAKCUTNEPSOLMONMACCONBASHORALBWHISPIMHOPOLPOUSQUCATSCA
Fig. 5. Landings’ profiles based on a cluster analysis of French annualfleet landings data in the Bay of Biscay for the 20 first fish species inweight (Table 1). Circle diameters are proportional to the proportionof species in the profile. Species are ranked by increasing landingweight.
offshore pelagic trawlers (3PT) switched to profile 5 charac-terised by albacore and to a lesser degree by sea bass andmackerel; 2PT had profile 4 only in 2000 and profile 3 (sar-dine) in the remaining years. The overall stability of landingprofiles provides an explanation for the stability in economicdependence shown in the previous section.
3.4 Fleet dynamics
The total number of vessels in the studied fishing fleets de-creased steadily from 2163 in 2000 to 1845 in 2006, whichcorresponds to an average decrease of 53 vessels (or 2.6%)per year (Fig. 6). The decreasing trend is remarkable for allfleets with the noticeable exception of the seiners which gainedvessels over the period (from 23 vessels in 2000 to 28 in2006).The largest decrease (–22%) occurred in fleets usingtrawls and dredges and the smallest (–8%) in the glass eel fleet.
The average transition matrix between the 33 fleets (30 ac-tive fleets, 1 inactive plus two dummy fleets for vessels en-tering and leaving the Bay of Biscay) revealed a rather highfidelity of vessels to their fleet (heavy right hand diagonal inFig. 7a). This implies that few vessels changed gears or fish-ing grounds (distance from the coast) during the study period.When transitions between fleets were observed, they occurredmainly within the same gear class, changing the distance class.For example, on average, more vessels changed from fleet 2Uto 1U than the other way round. This means that certain vesselsthat fished both offshore and in the coastal area stopped fish-ing offshore and restrained their activities to the coastal area.A similar reduction in fishing distance was observed for sev-eral other fleets. This can be seen in bubbles generally larger

544 F. Daurès et al.: Aquat. Living Resour. 22, 535–547 (2009)
Table 4. Annual landings’ profile classes for French Bay of Biscayfleets for the period 2000 to 2006. the 12 landings’ profiles were de-termined from the hierarchical cluster analysis (cf. Fig. 4). For fleetdefinitions, see Table 3.
Fleetcode 2000 2001 2002 2003 2004 2005 20061NT 1 1 1 1 1 1 12NT 1 1 1 1 1 1 13NT 1 1 1 1 1 1 11T 2 2 3 2 2 2 22BT 2 2 2 2 2 2 21U 2 2 2 2 2 2 23BT 2 2 2 2 2 2 22U 5 5 5 2 2 2 21D 2 2 2 2 2 2 21G 2 2 2 2 2 2 102MT 3 3 3 3 3 3 32PT 4 3 3 3 3 3 33MT 5 5 5 5 5 5 53PT 4 4 4 4 4 5 51S 6 6 6 6 6 6 61Q 7 7 7 7 7 7 71P 7 7 7 7 7 7 71N 7 8 7 7 7 8 83NS 8 8 12 8 12 8 83N 8 8 12 12 12 12 121NS 9 9 9 9 9 9 92NS 9 9 9 9 9 9 91E 10 10 10 10 10 10 101ES 10 10 10 10 10 10 71F 10 10 10 10 10 10 101H 10 10 10 10 10 10 102H 11 11 11 11 11 11 11
below than above the right hand diagonal (Fig. 7a). For exam-ple, vessels from fleet 3MT joined fleet 2MT, those of 3NTjoined 2NT and 2H joined 1H. The only major move in the op-posite direction was observed for Nephrops trawlers with anaverage net movement from the coastal fleet 1NT to the shelffleet 2NT. Vessels joining from outside the Bay of Biscay weremainly coastal (1G and 1O), while vessels ceased fishing fromall fleets, but mainly inactive vessels.
Inspection of annual transition matrices revealed that al-though some differences between years occurred, the overallpattern during the study period is described (Fig. 7a). Giventhe partial closure of the anchovy fishery from 2005 onwards,however, it is of interest to describe the reactions of the fourfleets previously targeting anchovy in more details (Fig. 7b).Several types of reaction can be observed: change of gear,adoption of a mixture of gears, change of fishing distance, join-ing the fleet of inactive vessels or leaving the Bay of Biscayfishery (category “out” in Fig. 7b). Change of gear was ob-served for coastal seiners from fleet 1S which moved to fleets1Q and 1H and vessels from the pelagic offshore fleet whichadded bottom trawls and other gears to their tool box thus join-ing fleets 3MT and 3O. Change of fishing distance occurredfor shelf pelagic trawlers (2PT) moving exclusively to the off-shore area (3PT); this was observed during the whole studyperiod and can be seen also in the average annual transition
0
200
400
600
800
1000
2000 2002 2004 2006
Num
ber o
f ves
sels
per
flee
t
0
500
1000
1500
2000
2500
Num
ber of vessels-Total
Active Trawls and DredgesSeinersPassive GearsSeelsOthersTotal
Fig. 6. Number of French vessels fishing primarily in the Bay ofBiscay during 2000-2006 by broad gear category and in total.
matrix (Fig. 7a). Finally, some pelagic trawlers (2PT and 3PT)also left the Bay of Biscay fishery.
4 Discussion
Using fishing technology and fishing practice criteria suchas fishing gear and fishing distance, both strongly linked tovessel size and engine power, 30 French fleets fishing primar-ily in the Bay of Biscay during the period 2000-2006 wereidentified. These fleets landed many species, but 20 of themcontributed 80% (and 9 of them contributed 60%) of the land-ings in weight and value. The fishing pressure deployed bythese fleets (expressed by the landings) varied widely, withonly ten fleets being responsible for about 70% of landings(in weight and value). These ten fleets represented 34% ofvessels, 51% of total fishing power (kW), indicating a strongconcentration of means of production in the Bay of Biscay.Furthermore, the results revealed widely varying dependenceon the nine major species, with in many cases a high degree ofdependence on one or two species only. Overall, four groupsof fleets can be distinguished with respect to their contribu-tion to landings and economic dependence on the nine mostimportant species in the Bay of Biscay:
i) Nine fleets with high contribution and dependence:Nephrops trawlers, coastal seiners and shelf and offshoresole and other netters (1NT, 2NT, 3NT, 2BT, 3BT, 1S, 2NS,3NS, 3N);
ii) Two fleets with high contributions but low dependence:mixed trawlers and other gear users and sole netters incoastal areas (1U, 1NS);
iii) Seven fleets with low contributions but high dependencespanning a range of gears and all distance classes (2MT,3MT, 2U, 3PT, 1E, 1ES, 1H);
iv) Twelve fleets with low contributions and low dependence,using mainly pots and nets or a mixture of gears primarilyin the coastal zone (1T, 1D, 1N, 1Q, 1F, 1P, 2H, 1G, 1O,2O, 3O).

F. Daurès et al.: Aquat. Living Resour. 22, 535–547 (2009) 545
Fig. 7. Transition matrix for vessel movements among fleets, a)average annual matrix 2000 to 2006, b) 2004-2005.
The analysis of landings for the period 2000-2006 yielded12 distinct profiles and grouped fleets using similar gears totarget the same species, independent of the fishing area. Thusthe type of impact of a fleet on the fish community seems to beprimarily determined by the gear it is using. This is not surpris-ing considering the obvious link between the gear (and fishingpractice) and the targeted species. Most of them have distinctbehaviours, thus specific fishing gear is required to catch them.
The present analysis of the economic dependence ofFrench fleets, in terms of relative value of the landings, on
Fig. 8. Fuel prices excluding taxes (current euros) from 2000 to 2007.
different species in the Bay of Biscay, complements earlierworks focussing primarily on landings in volume and tech-nical characteristics of vessels (Dardignac 1984; Decampset al. 1988). The historic comparison with these works showsthat fishing gears have changed little over the last couple ofdecades, indicating that there has been no major technical in-novation in the fishing sector and no new kind of pressures onthe Bay of Biscay ecosystem. It is regrettable that the sparse-ness of detailed gear information in the system forced us touse landings compositions to indirectly derive information ongear used. The recent widening of the Data Collection Regu-lation (Decision 2008/949/CE) based now on the metier-fleetapproach will certainly allow overcoming this lack of infor-mation as data on metier will become available under the newData Collection Framework. Moreover, it is expected that themost detailed level of the metier will include the mesh size ofthe engine directed to target species. The future studies basedon these datasets will show how far this issue should have im-pacted the main findings of this study.
Most fleets kept the same landings’ composition profileduring the study period. Different fleets might target the samespecies when available, but they may display distinct responseswhen: (i) target species become less available (as seen for an-chovy); (ii) prices decrease; (iii) costs for fishing increase, e.g.due to increased fuel prices; (iv) or specific management mea-sures are implemented. The response options are then not onlychanging target species, but also changing or adding other geartypes or changing fishing distance (i.e. the operation range).The latter option may not be available to small vessels whichcannot move offshore. Thus by considering fleets as groups offishing units which have a similar type of fishing impact andbehaviour (particularly in case of change) we might be betterequipped to understand fleets responses to economic, environ-mental and governance change. However, we also show that,in a given fleet, responses may differ between vessels. Thus,future studies on vessel behaviour are required to understandthe differences between vessels of the same fleet when reactingto change.
During the study period, spawning stock biomass (SSB) ofNephrops and hake showed an increasing trend while sole SSBdecreased until 2003 and stabilised thereafter (ICES 2008).Sardine and sea bass were not formally assessed, but sur-vey data indicate that sea bass population size in the Bay of

546 F. Daurès et al.: Aquat. Living Resour. 22, 535–547 (2009)
Biscay increased (unpublished data) and sardine populationsize varied widely with no trend, though total landings in-creased (ICES 2007). The decreasing availability of sole haddetectable consequences. Vessels moved from the offshore solenetter fleet to the shelf sole netters, and from those to thecoastal sole netter fleet, resulting in change in economic de-pendences. For Nephrops, an increase in the variability of thefishing distance of Nephrops trawlers was observed with amove from both the offshore and the coastal fleet to the shelffleet. Nonetheless, dependence on Nephrops remained stablefor all three fleets. Increasing hake abundance might be respon-sible for the observed increasing dependence, from 50 to over70%, of the offshore netters (3N) on this species. Increasingsea bass abundance and the absence of any catch or effort reg-ulation were probably responsible for attracting vessels fromoutside into the coastal Bay of Biscay fleets using hooks (fleets1H and 1E). Offshore pelagic trawlers switched from anchovyto albacore and to a lesser degree to sea bass and mackerelwhen the anchovy fishery was closed in 2005. These resultsconfirm the trip-level analysis of the same pelagic trawlers andsome purse seiners carried out by Vermard et al. (2008), whoanalysed fishing trip choices during the period 2000-2005. Thechoice concerned the main target species of each trip, leadingto the identification of four métiers defined by anchovy, seebass, albacore and a mixture of species. Using a random utilitymodel, Vermard et al. tried to predict the consequences of thepartial anchovy closure on métier choice in 2005. The modelwas successful in predicting the increase in the albacore andsea bass métiers but underestimated the switch to inactivity. Asnoted by the authors, fishing choices at the same period in theprevious year were less important than expected for explainingcurrent choices. Thus, the analysis of the annual scale for thisfleet revealed a big picture complementary to the shorter timescale because the annual scale gives information on the broadspectrum of the species composition allowed by the techno-logical choice.
Furthermore, the authors defined the fleet in terms of tar-get species instead of fishing gear and area as done here, whichresulted in vessels with the same potential species portfolio be-ing grouped despite using different gears in different areas. Itmight be suspected that reactions to changes in species avail-ability or management measures might be more similar withinthe fleets defined by their gear and area of operation than fleetsdefined by their landing profile for a given period although theresponse chosen is also dependent on the captain skills, risktaking position, availability of capital. Indeed, analysis of in-terannual transitions between fleets revealed that the reactionsof the fleets targeting anchovy were quite distinct betweenfleets and within fleets. For example, in 2005 vessels from theshelf pelagic fleet (2PT) moved for some of them to the off-shore pelagic fleet (3PT), remained in the same fleet (2PT) orfor the rest of them, left the Bay of Biscay fleet (“out”). For theoffshore pelagic fleet (3PT), beside remaining in the same fleetfor most of the vessels and changing their species composition,some vessels moved in 2005 to the fleet of mixed bottom andpelagic trawlers (3MT).
This paper attempted to deal with one of the challenges ofthe ecosystem approach to fisheries (EAF) predicting changeand adapting to it at low cost. It focused on the components
of the fishery sector in the Bay of Biscay with the hope thatthey would be operational enough to meaningfully describethe interactions between the multispecies resource base andthe multifleet-multigear fishery and the pressure exerted bythe fleets on the fish community. The paper has shown thatwhile keeping main patterns unchanged for years, fleets werenonetheless adapting to change through migration of someof their units between gears, species, and fishing areas. Thisshows that there is plasticity in the fleet composition and func-tioning and hence a degree of resilience. Moreover, it is shownthat strong dependency on species (reflecting specialization)may not be synonymous of “vulnerability”. This may add tothe resilience of the resource base itself (e.g. as it adapt to cli-mate change) and hence to the total resilience of the system.However, the observations also show that the opportunities forchange (e.g. in the fishing range, fishing technology and tar-get species) may be observed and perhaps roughly foreseen,but cannot yet be accurately predicted. More detailed studies,at vessel level, might be able to improve the understanding ofchange at that scale and perhaps the capacity to predict it.
Acknowledgements. We would like to thank our colleagues PatrickBerthou, Michèle Jézequel and the whole Système d’Informationhalieutique team for providing the data and useful discussions. Wethank an anonymous referee for his comments on a previous versionof the manuscript, and our editor Serge Garcia who greatly helped toimprove the text and figures. This contribution received financial sup-port from the Biodiversity project ANR-IFB 2005 “Global change,dynamics of exploited marine biodiversity, and viability of fisheries(CHALOUPE)” and the EC-funded research project FP6 – 044227“Indicators for fisheries Management in Europe (IMAGE)”.
References
Berthou P., Guyader O., Leblond E., Demanèche S., Daurès F.,Merrien C., Lespagnol P., 2008, From fleet census to samplingschemes: an original collection of data on fishing activity for theassessment of the French fisheries. ICES CM 2008/ K: 12.
Bertignac M., 1992, Les rendements par espèce de la pêche chalutièrehauturière française de l’Atlantique Nord-Est entre 1972 et 1989.Aquat. Living Resour. 5, 261–275.
Biseau A., 1998, Definition of a directed fishing effort in a mixed-species trawl fishery, and its impact on stock assessments. Aquat.Living Resour. 11, 119-136.
Dardignac J., 1984, Les pêcheries du golfe de Gascogne, Bilan desconnaissances. Rapp. Ifremer, DRV.
Daurès F., Planchot M., Demanèche S., Van Iseghem S., BerthouP., Leblond E., Jezequel M., 2007, Contribution et dépendancedes flottilles de pêches aux espèces commerciales majeures dugolfe de Gascogne. Rapp. Ifremer, DEM http://www.ifremer.fr/docelec/doc/2007/rapport-4697.pdf.
Duarte R., Azedevo M., Afonso-Dias M., 2009, Segmentationand fishery characteristics of the mixed-species mutli-gearPortuguese fleet. ICES J. Mar.Sci. 66, 594-606.
Decamps P., Léauté J.P., 1988, Flottilles de pêches maritimes du suddu golfe de Gascogne. Ifremer, Rapp. Scient. Techn. 13.
FAO 2003, The ecosystem approach to fisheries. FAO TechnicalGuidelines for Responsible Fisheries, 4, Suppl. 2, FAO, Rome.
Garcia S.M., Cochrane K.L., 2005, Ecosystem approach to fisheries: areview of implementation guidelines. ICES J. Mar. Sci. 62, 311–318.

F. Daurès et al.: Aquat. Living Resour. 22, 535–547 (2009) 547
He X., Bigelow K.A., Boggs C.H., 1997, Cluster analysis of longlinesets and fishing strategies within the Hawaii-based fishery. Fish.Res. 31, 147–158.
Hilborn R., 1985, Fleet dynamics and individual variation: why somepeople catch more fish than others. Can. J. Fish. Aquat. Sci. 32,2–13.
Holley J.F., Marchal P., 2004, Fishing strategy development underchanging conditions: examples from the French offshore fleetfishing in the North Atlantic. ICES J. Mar. Sci. 61, 1410–1431.
Le Floc’h, P., Daurès F., Bihel J., Boncoeur J., Brigaudeau C.,Thebaud O., 2007, Analyzing fishermen behaviour face to in-creasing energy costs – A French case study. ICES CM 2007/M: 09.
Le Floc’h P., Daurès F., Brigaudeau C., Bihel J., 2008, A comparisonof economic performance in the fisheries sector: a short and longterm perspective. Mar. Policy 32, 421–431.
Leblond E., Daurès F., Berthou P., Dintheer C., 2008, The FisheriesInformation System of Ifremer: a multidisciplinary monitoringnetwork and an integrated approach for the assessment of Frenchfisheries, including small-scale fisheries. ICES CM 2008/ K: 11.
Leblond E., Daurès F., Berthou P., 2007, La Synthèse des flottilles depêche 2005 - Flotte mer du Nord-Manche-Atlantique. IFREMER,SIH.
Lewy P., Vinther M., 1992, Identification of Danish North Sea trawlfleets and fisheries. ICES CM 1992/ G: 45.
Mahévas S., Sandon, Y., Biseau A., 2004, Quantification of annualvariations in fishing power due to vessel characteristics: an appli-cation to the bottom-trawlers of South-Brittany targeting angler-fish (Lophius budegassa and Lophius piscatorius). ICES J. Mar.Sci. 61, 71–83.
Marchal P., 2008, A comparative analysis of métiers and catch pro-files for some French demersal and pelagic fleets. ICES J. Mar.Sci. 65, 674–686.
Marchal P., Andersen B., Bromley D., Iriondo A., Mahévas S.,Quirijn F.J., Rackham B., Santurtún M., Tien, N., Ulrich C., 2006,
Improving the definition of fishing effort for important Europeanfleets by accounting for the skipper effect. Can. J. Fish. Aquat.Sci. 63, 510–533.
Merino G., Maynou F., Garcia-Olívares A., 2007a, Effort dynamics ina fisheries bioeconomic model: a vessel level approach throughgame theory. Sci. Mar. 71, 537–550.
Merino G., Maynou, F., Garcia-Olívares A., 2007b, A new bioeco-nomic simulation tool for small scale fisheries based on game the-ory: GAMEFISTO model. Aquat. Living Resour. 20, 223–230.
Murawski S.A., Lange A.M., Sissenwine M.P., Mayo R.K., 1983,Definition and analysis of multispecies otter-trawl fisheries offthe northeast coast of the United States. J. Cons. CIEM 41, 13–27.
Pech N., Laloë F., 1997, Use of principal component analysis withinstrumental variables (PCAIV) to analyse fisheries catch data.ICES J. Mar. Sci. 54, 32–47.
Pelletier D., Mahevas S., Drouineau H., Vermard Y., Thebaud O.Guyader O., Poussind B., 2009, Valuation of the bioeconomicsustainability of multi-species multi-fleet fisheries under a widerange of policy options using ISIS-Fish. Ecol. Model. 220, 1013–1333.
Pradhan N.C., Leung P., 2004, Modeling entry, stay, and exit deci-sions of the longline fishers in Hawaii. Mar. Policy 28, 311–324.
Quirijns F.J., Poos J.J., Rijnsdorp A.D., 2008, Standardizing commer-cial CPUE data in monitoring stock dynamics: accounting for tar-geting behaviour in mixed fisheries. Fish. Res. 89, 1–8.
Salas S., Gaertner D., 2004, The behavioural dynamics of fishers:management implications. Fish Fish. 5, 153–167.
Vermard Y., Marchal P., Mahévas S., Thebaud O., 2008, A dynamicmodel of the Bay of Biscay pelagic fleet simulating fishing tripchoice: the response to the closure of the anchovy fishery in 2005.Can. J. Fish. Aquat. Sci. 65, 2444–2453.
Ward J.M., Sutinen J.G., 1994, Vessel entry-exit behavior in the Gulfof Mexico shrimp fishery. Am. J. Agric. Econ. 76, 916–923.


