Fishery and aquaculture products - European Commission · 1 buy Fishery and aquaculture products an...
8
€ € € buy 1 Fishery and aquaculture products an overview of EU consumer habits Maritime Affairs & Fisheries
Transcript of Fishery and aquaculture products - European Commission · 1 buy Fishery and aquaculture products an...
€€€
buy1
Fishery andaquacultureproductsan overview of EU consumer habits
Maritime Affairs& Fisheries

Fish sauce
FAPs
mon
thly
con
sum
ptio
n
74 % of respondents say that they eat FAPs at least once a month
Overall,
93 %
26 %Hungary
TOP FAP consumers
LOWEST FAP consumption
Spain Sweden
month
62 %Bulgaria
57 %Austria
52 %Slovakia
56 %Czech Republic
Estonia Denmark Finland92 % 87 % 87 % 85 %

Fish sauce
FAPs
mon
thly
con
sum
ptio
n
74 % of respondents say that they eat FAPs at least once a month
Overall,
93 %
26 %Hungary
TOP FAP consumers
LOWEST FAP consumption
Spain Sweden
month
62 %Bulgaria
57 %Austria
52 %Slovakia
56 %Czech Republic
Estonia Denmark Finland92 % 87 % 87 % 85 %
buy1
Where consum
ers buy FAPs
40 %buy from a fishmonger
or specialist shop
9 %buy at a fish farm or
directly from a fisherman
1 %buy online
I buy FAPs FROM A GROCER
I buy FAPs from aFISHMONGER or SPECIALIST SHOP
95 %Finland
93 %Sweden
92 %Slovakia
74 %buy FAPs at a grocer’s store, supermarket or
hypermarket
25 %buy FAPs at
a market
74 %Malta
59 %Italy
59 %Greece
40 % of consumers in Greece buy at a fish farm or directly from a fisherman!

Younger and middle aged respondents are more likely to buy frozen products from time to time.
Larger households are more likely to buy frozen products.
73 % 74 %
Type
of
prod
ucts
€€€O en or from time to time…
I buy FROZEN PRODUCTS
I buy FRESH PRODUCTS
80 %Austria
82 %Portugal
82 %Sweden
93 % Greece
90 % Malta
87 % Portugal
87 % Spain
I buy TINNED PRODUCTS
I buy SMOKED, SALTED, DRIED OR IN BRINE
79 %Slovakia
89 % Malta
86 % Spain
69 %buy frozen products
67 %buy fresh products
61 %buy tinned products
50 %buy smoked, salted,
dried or in brine
41 %buy breaded products and ready meals based on FAPs
76 %Denmark
69 %Estonia
68 %Latvia
67 %UK,Portugal,the Netherlands
?
?
?
?
I prefer WILD PRODUCTS
I prefer FARMED PRODUCTS
I don’t have a preference
18 %Hungary
50 %UK
37 %Bulgaria
16 %Poland
14 %Romania
Wild or farm
ed products?
31 %have no preference
14 %don’t know whether FAPs they buy or eat are wild or farmed
11 %say it depends on the
type of products
8 %say they prefer farmed
products
Factors drivingpurchase
58 %Product’s appearance
34 %prefer wild products
2 %don’t know
60 %Greece
60 %Malta
50 %France
50 %Portugal
36 %Estonia, Ireland, Romania
55 %Cost
42 % Origin of the product
24 % Brand or quality label
21 %Easy and
quick to prepare
15 %Environmental, social
or ethical impact
?
€ € €

dd/mm/yyyy
?
?
?
?
name
38 %Hungary
54 %Estonia
54 %UK
44 %Germany
23 %Latvia
20 %Czech Republic, Romania, SlovakiaSe
a or
fre
shw
ater
pro
duct
s?Re
leva
nce
ofm
anda
tory
info
rmat
ion 94 %
“Use by” or “best before” date
88 %Name of the product
and species
85 %Whether the product was
previously frozen
73 %Distinction between a wild
or farmed product
72 %Area of catchor production
44 %Fishing gear
78 %Greece
70 %Malta
65 %Portugal
I prefer PRODUCTS FROM THE SEA
I prefer FRESHWATER PRODUCTS
35 %don’t have preferences
11 %say it depends on the product
7 %prefer freshwater
products
7 %are not sure whether the
product they buy come from the sea or freshwater sources
39 %prefer products from
the sea
1 %don’t know
?
I don’t have a preference
? ? ?
?
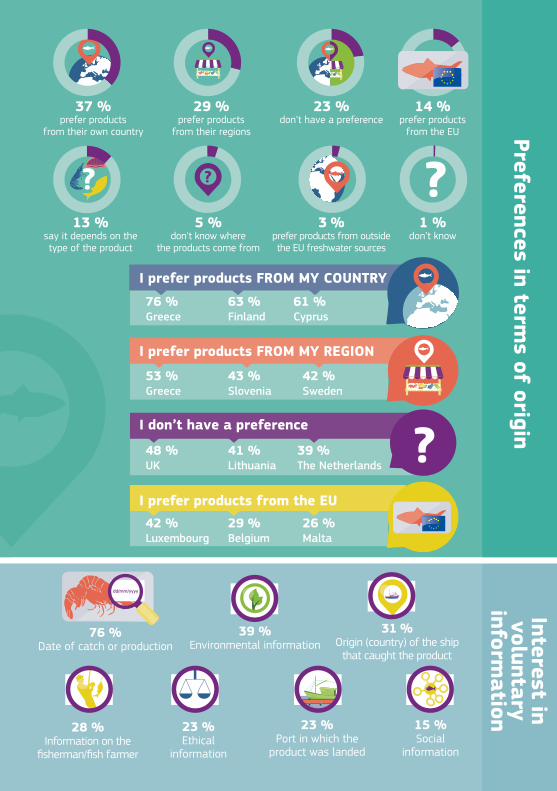
Preferences in terms of origin
I prefer products FROM MY COUNTRY
I prefer products FROM MY REGION
I don’t have a preference
I prefer products from the EU
76 %Greece
53 %Greece
48 %UK
63 %Finland
43 %Slovenia
41 %Lithuania
39 %The Netherlands
42 %Sweden
42 %Luxembourg
29 %Belgium
26 %Malta
61 %Cyprus
29 %prefer products
from their regions
23 %don’t have a preference
13 %say it depends on the type of the product
3 %prefer products from outside the EU freshwater sources
5 %don't know where
the products come from
37 %prefer products
from their own country
1 %don’t know
14 %prefer products
from the EU
dd/mm/yyyy
76 %Date of catch or production
28 %Information on the
fisherman/fish farmer
23 %Ethical
information
15 %Social
information
23 %Port in which the
product was landed
39 %Environmental information
31 %Origin (country) of the ship
that caught the product
Interest involuntary
information

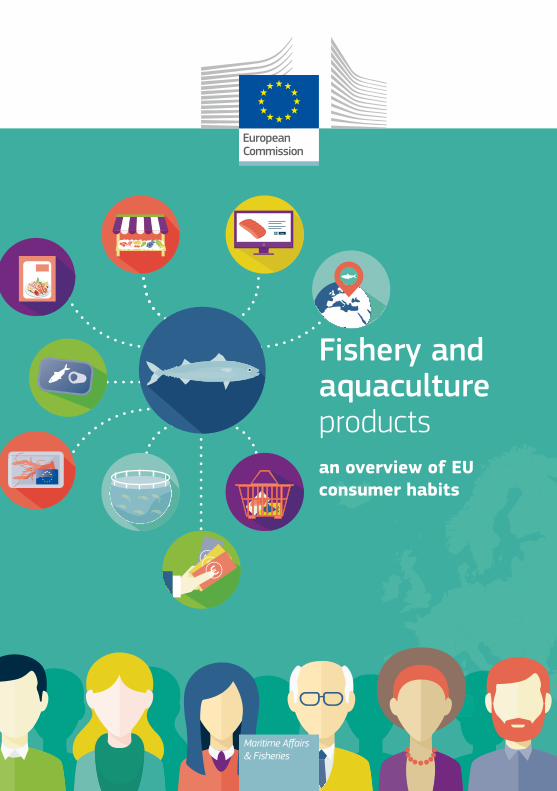
The European Union is the biggest world market for fishery and aquaculture products.In 2015, EU consumers spent 54 billion euro for these products. To better understand consumer habits, preferences and expectations across the EU, the European Commission has interviewed in June 2016 around 27,800 citizens from all walks of life, ages and genders. This leaflet summarises the findings of this survey.
“This survey is about how we Europeans choose our seafood. This insight will help us better meet consumer demands. But by definition, making a choice means having a selection to choose from. Our job is to make sure that consumers continue to have a wide selection of healthy, high quality seafood from which to choose. That is why we are so committed to reaching the EU targets on sustainable fishing by 2020”
To find out more: http://ec.europa.eu/COMMFrontOffice/publicopinion/index.cfm/Survey/getSurveyDetail/instruments/SPECIAL/surveyKy/2106
Karmenu VellaEuropean Commissioner for the Environment, Maritime Affairs and Fisheries