FISHERIES RESEARCH TECHNICAL REPORT No. 87 - … · FISHERIES RESEARCH TECHNICAL REPORT No. 87 ......
27
MINISTRY OF AGRICULTURE, FISHERIES AND FOOD DIRECTORATE OF FISHERIES RESEARCH FISHERIES RESEARCH TECHNICAL REPORT No. 87 Population genetics of cod (Gadus morhua (L.)), haddock (Melanogrammus aeglefinus (L.)), whiting (Merlangius merlangus (L.)) and saithe (Pollachius virens (L.)) A.R. CHILD LOWESTOFT, 1988
Transcript of FISHERIES RESEARCH TECHNICAL REPORT No. 87 - … · FISHERIES RESEARCH TECHNICAL REPORT No. 87 ......

MINISTRY OF AGRICULTURE, FISHERIES AND FOOD
DIRECTORATE OF FISHERIES RESEARCH
FISHERIES RESEARCH TECHNICAL REPORT No. 87
Population genetics of cod (Gadus morhua (L.)), haddock (Melanogrammus aeglefinus (L.)), whiting (Merlangius merlangus (L.)) and saithe (Pollachius virens (L.))
A.R. CHILD
LOWESTOFT, 1988

MINISTRY OF AGRICULTURE, FISHERIES AND FOOD DIRECTORATE OF FISHERIES RESEARCH
FISHERIES RESEARCH TECHNICAL REPORT NUMBER 87
Population genetics of cod (Gadus morhua ( L . ) ) , haddock (Melanogrammus aeglefinus ( L . ) ) , whiting (Merlangius merlangus ( L . ) ) and saithe (Pollachius virens ( L . ) ) .
A.R. CHILD
LOWESTOFT 1988
The author:
A. R. Child, M1 Biol. C Biol. PhD, is a Higher Scientific Officer in Fish Stock Management Division, Section 4 of the Directorate of Fisheries Research. He is based at the Fisheries Laboratory at Conwy. North Wales.
Fish. Res. Tech. Rep., MAFF Direct. Fish. Res., L.owestoft, (87) 27 pp.
O Crown Copyright 1988

CONTENTS
l . Introduction
2. Materials and methods
2.1 Sample collection
2.1. l Cod- North Sea
2.1.2 Cod - Irish Sea
2.1.3 finddock - North Sea
2.1.3 Whiting - North Sea
2.1.5 Snithe
2.2 Sample preservation and analysis
2.3 Statistical analysis
3. Results and discussion
3.1 Cod populations in the North Sea
3.1.1 Glucose phosplzate isomerase analysis
3.1.2 Lactate dehydrogenusc. unalysi.~
3.1.3 Discussion
3.2 Cod populations in the Irish Sea
3.2.1 Glucose phosphate isornerase analysis
3.2.2 Lactate dehydrogenase analysis
3.2.3 Discussion
3.3 Haddock populations in the North Sea
3.3.1 Glucose phosphate isomerase analysis
3.3.2 Lactate dehydrogenase analysis
3.3.3 Discussion
3.4 Whiting populations in the North Sea
3.4.1 Phosphoglucornutase analysis
3.4.2 Glucose phosphate isomerase analysis
3.4.3 Discussion
3.5 Saithe populations
3.5.1 Glucose phosphate isomerase analysis
3.5.2 Lactate dehydrogenase analysis
3.5.3 Discussion
4. Conclusions
Acknowledgements
5. References

1. Introduction based on their response to the environment at crucial stages in their development rather than on any genetic differences.
Electrophoretic techniclues have been used successfully to separate 'stocks' of fish. This report describe5 a series of population genetic studies made on four co~nmercially important gadoid species - cod, haddock, whiting ancl .;:tithe.
Thc concept of the 'unit stock' is fundnrncntal to fisheries management. However. there arc several different interpretation\ of what is meant t ~ y a 'stock' of fish. A synthehis o f the dcfinitionx gi\,en by the 1nternation:tl Conimission for the North-West Atlantic I-'isherics (ICNAF) (Anon.. 1960). Bcvcrton :tnd Holt (1 9571 and Gushing (l9S1 ) descril>cs a unit stock as a self-contained population with a single spawning ground. l'herc arc negligihlc changes in composition cither by immigi-ation or emigration and the stock is maintained in a steady state with adults returning annually to spawn. This description is essentially :I Mendelian population which has bccn tlcscrihccl as a large random- breeding group of a species in which ctlanges by immigration, emigration. selection and mutation are negligible.
I n practice, a stock defined for fisherie.; management purposes may not conform to these strict limitations. A typical stock description may simply relate to an aggregation of fish within a certitin geographical area. determined to a great extent, by physical f;ictors such as substrate and hydrography. Whilst recruitment to the stock is an essential factor in its maintcnancc, thc origins of the recruits may not be known with certainty and, as 21 consequence, the genetic integrity of such a unit stock may be in doubt.
Several parameters have been used to distinguish fish stocks. Thesc include the comparison of continuous morphometric characteristics such as growth rate (as revealed by agellerigth keys) and body proportions and con~parisons of discrete meristic characters such as the numbers of fin rays or vertebrae. Morphometric variations were used by Yilrrell (1836) and Day (1880-1884) to differentiate North Sea cod. Schmidt (1930) showed that there were variations in the numbers of 2nd dorsal fin-rays and in the numbers of vertebrae in North Atlantic cod. Variations in the relative rates of growth between ycar classcs of herring. (Cluprrr harerlgus L.) wcre used to distinguish between three stocks in the North Sea (Cushing and Bridger. 1966).
Stocks have heen identified by similarities in the patterns of annual rings laid down in the otoliths (Rollefsen. 1934; Trout, 1957; Holden, 1960). The amount of growth, estimated as the distance between the otolith nucleus and the first annual ring (L,) can be used to distinguish between regional stocks of mackerel (Scornher scornbr~~s L.) (Dawson. 1983).
Tagging data have heen used extensively to distinguish fish stocks. However. tagging is subject to a number of important constraints. Fish cannot be marked until they have reached a certain size. Eggs and larval fish cannot be studied by this method and it is. therefore, not possible to monitor the early lifc histories of the species. Tagging returns give a measure of the migration patterns of a species and supply information on longevity hut they are subject, to a considerable extent, to the vi~garie\ of fishing intensity and to the whims of the fishing fraternity. A number of species suffer high mortalities due to tagging, imposing pr;ictical limitations on the method.
The distribution of fish species infested with certain parasites has a l ~ o been uhed to describe stocks (Kabata, 1958, 1967; Hislop and MacKcnzie. 1976). The records are often confined to older fi.;h whilst ignoring the early stages. It is highly likely that the infommation obtained describes the distribution of intcrmrdiate host hpecies and the extent to which these species are a.;sociated with the species being studied. For example. Kabatn (1958) reported that the parasite, Lc-rnrtcoccra was absent in specimens of haddock captured at Faroe but was common in haddock from the northern North Sea. This distribution was found to be linked with the di.;trihution of the parasite's intermediate host, the lemon sole (Microstomrts kirr).
There can be no doubt that the above methods each contribute to the definition of fish stocks but, nevertheless, they play a limited part in the definition of a particular stock as a genetic entity. A genetic stock has been described as "any discrete breeding unit showing genetic variation" (Jamieson, 1974). In contrast to the previously described ecotypic characteristics, the genetic identity of an individual is determined at the moment of zygote formation and remains unchanged throughout its lifc. Modern techniques allow analysis of all stages of the fish's life cycle, including eggs and larvae.
The aclvantages of biochemical genetic analysis in stock identification were recognized by Cushirig (1952). Marr and Sprague (1963) and Parrish (1964). Early results of clectrophoretic analysis were presented at a special ICES meeting in Duhlin in 1969 (dc Ligny, 1971). Since then, a vast amount of information has been produced describing the genetics of populntions of many species. Despite many advances in protein sequencing methodology and deoxyribonucleic acid (DNA) analysis, electrophoretic separation and histochemical staining of structural proteins and enzymes still provides the simplest method of analysing the gene products of an individual.
All of these methods may be uscfully employed to The search for electrophoretically-detectable polymorphic differentiate between spatially separated groups of fish. loci is generally made by utilising previously published However, discrimination of the stocks is more likely to be methods and observations. In many fish species, variants at

the transferrin and haemoglobin loci and polyrnorphic enzymes such as glucose phosphate isomerase ( G P I ) , phosphoglucomutase ( P G M ) , several dehydrogenases and esterases have proved to be useful in population studies. Samples from the areas of interest are analysed and the observed numbers of phenotypes are tested against the expected numbers determined from the genetic model known as the Hardy-Weinberg equilibrium. The results of this cornparison show whether the population sample is representative of a random-breeding population. Deviations from the predictions of this genetic rnodel may indicate population sub-division. For example, an excess of homozygotes could result from the mixing of two or more sub- populations. It may indicate that the sample contains different age groups having different genc lrcquencies due to variation in selective forces. or it may show the occurrence of different genc frequencies between male and female fish within the population. It is, thus, important to obtain as much biological information as possible, relating to the sample, before attempting to interpret the results. In the absence of deviations from genetic ecluilibrium, it may be possible t o show that there are significant differences between samples frorn different areas which may indicate isolated populations of the species in question. S;uiiple size is an important factor in population genetics since the variance of the genc frequency estimates is a function of li3N \\here N is the h,~niple sit<.. It is possible to obtain quite Inrge differences in gene frcclucncy between small saniplci; and this random sampling error must be taken into account nhcn interpreting the results of a populatioii arialysis.
Wliil\i significant clifferences between the gcnc frccjueiicies of 11: ' ; 1cIu;11 saniplcs indicatc a degree 01' stock cliffcrcnti;~tior~. s~nt~l:,,,iics bctw~,cri samples are more difficult to ~n tc~ .prc t . Such \~ri~ilaritres may . b e due to a stable, I>alancecl polyrncti-phisrn \\liicl~ is entirely c~>i~lcidcr~tal , so i t in~portant to a~.'~i?bc: , IS man! diffcrcnt scnc locr as po\sil>lc it1
the study of popuiittion \;~ri;riion.
tli.icl! ot the i.;~rl;: woih 11sh 1101;: .;1111111 geiiclic.\ W i i \
carrted out on gacioids. Sich ( I0hla.l ' i.,i\,,:~i ii,icnic:!-i . ' , ; I :
gene frequencies in c t ~ d and \ \ I i r t ~ ~ i ~ ~ . i g ~ , ~ ! S ' . :
tliffercnccs \yere lounci a t this locus bct\\i ,~. I I \;rinl:ic'i oi i . i ! i , ~ , i
species in the North Scit. J;t~~:icson ( l O 7 I l ~ f r lc i .I,~i!~ic\i)ri , I , ' !
Ihornpsor~ (l972:1.b) studied viiriatiorr '11 tiic h ; ~ ~ i n o ~ I c ) l ~ ~ i i . transferrin, lactate dcliydrcycnaxe rLL) l l ) <ir!(.i i~u!!rii. estcrase loci in North Sea cod. 'l'heir ~-cstiit\ \l~o\scii illat t1ic.i-c was no signilicant \ari;~tion between cod s a ~ r ~ p l c \ in the North Sea. Dando (1974) clescl.ibed th t C;/'/ locu\ i n cocl. I t was shown by Cross and Payne (197t3. 107S) that thc~r~ . \\as hoine variation at this locus hetaecn cod froin the c<iht ; I I ~ C ~ \\clrt Atlantic Ocean. Lactate dehydrogcnasc isoz!,rneh h a ~ e beer1
Note: t-nryme loci arc rcfcrrccl to ;I\ i taIi\~\cd ,ibI>tc\ ixtions C.:.
I'GM. Where therc are inultiplc loci \\ i t11 tl~l'fcrcnt tiwuc distribution. the locus la given as uppcrcaw dcwr~ptor c.g f-l>/l-A and L,I)ti-fl. Multiplc allclic torlns arc ~iurnbered \ + ~ t l : a superscript according 10 the rclati\:c mohilitie\ of tlie different isozymes coded. For e.i;~mplc. the most commc,n LDH-B allele is numbered LIIII-B ""'; a second hypc>thcticirl allele coding for an isozymc with twice thc electrophorct~i mobility would be tlesignated LDH-B2'".
studied in a number of gadoid species. Lush (1970). Odense t.t ul (1969), Jamieson (1975) and Cross and Payne (1976) reported polymorphism at the L D H - R locus in cod. They found little variation in gene frequencies at this locus over the entire North Atlantic range of species. Lush (1970) and Odense et (11. (1971) reported variation at two L D H loci in the saithe. Odense ancl Leung (1975) found evidence of polymorphism in haddock.
This report contains the results of analyses of G P I and L D H in cod, G P 1 anci L D H in haddock, PGM and GP1 in whiting and LL)tl itrid (;PI in saithe.
2. Materials and methods
2.1 Sample collection
2.1. / Coil-North Seu
The sampling sites are shown in Figure 1 and the sampling details (sample size, date and research vessel used) are given in Table 1. Samples from the International Council for the Exploration of the Sea (ICES) statistical rectangles 34F1, 33F1 and 30F1 were I-group cod caught in trawls from chartered vessels. The
Figure I 'The distribution ol \ ; ! i i i i ) i ! . L,\ and (he number ot
indiciclual 0-group c!.(: \ : , b i , - ! ~~d at each 4te .

Table 1 Siunpling dctails for cod, Iiaddock, whiting and saithc
Species Area Sampling Specimens Age' Vessel' Date site' in sample (ICES rectangle)
Haddock
Whiting
Cnd North Sea 39E9 49F2 4XE7 3SE9 47E5 47E6 36E5 36E6 35E6 45E7 33E7 42E7 47E9 3lE7 41F6 39E8 39 F7 38F0 36F3 36F6 36F7 35FO 34FI 33F1 30F 1
Irish Sea 35E4 38ES 37E5 37E6 36E4 35E6 34E3 37E5 35E6 33E3
North Sea 51F1 50F1 50F3 48FO 47E7 47E7 46FO 45F4 42E8 42F2 41FO 41F5
North Sea 47E8 45E7
JH EXP COR J H
EXP COR EXP EXP EXP COR EXP COR COR COR TRI COR CL1 COR CIR CL1 CL1 CHA CHA CHA CHA CL1 CL1 CL.1 CL1 CL1 CL1 CL1 COR COR COR EXP EXP JH J H
CIR EXP CIR CIR C1 R C1 R CIR J H
C1 R CIR

Table l Continued
Species Area Sampling Specimens Age' Vessel' Date site' in sample (ICES rectangle)
Whiting North Sea 43E9 41 E9 41F5 40E8 40F1 39FO 39F6 38F5 38F6 37F1 35F0 35F1 35 F2 34F0 34F0 33F1 33F1
W. Ireland 38EO S. Minch 42E2 S. Minch 4282 W. Hebrides 43E0 Rockall 43D5 North Sea 51EX
51FO 49E8 49FO 47E8 47F0 47F2 45F4
Saithe
1 C1 R 1 C1 R 1 CIR 1 CIR 1 CIR 1 C1 R 1 CIR 1 CIR 1 CIR 1 CIR 1 C1 R 1 C1 R 1 CIR 1 CHA 1 CHA l CHA 1 CIR - CIR - CIR
CIR CIR
- GAR - CIR
CIR CIR CIR C1 R
- CIR - CIR - CIR
' ICES rectangles are statistical divisions of the sea areas as shown in the Figures ' O=Spawned in the calendar year; 1 =Spawned in the previous year; -=Age not determined ' CIR =RV CIROLANA, MAFF GAR=RV G. A. REAY. MAFF-Torry*
COR =RV CORELLA, MAFF* JH =RV JOHAN HJORT. Norway CL1 =RV CLIONE, MAFF* TRI =RV TRIDENS, F-lolland EXP =RV EXPLORER, DAFS CIHA =Chartered vessels
* Indicates research vessels in use at the time of the investigations but since withdrawn from service.
remaining samples were 0-group pelagic larvae collected with frame trawl. I-group cod wcrc collected in 1980 using a an International Young Gadoid Trawl (IYGT) during ICES Granton trawl. Sampling sites (Figure 2) and sampling details sampling exercises between 1977 and 1980. (Table I ) are given.
2. l .2 Cod-Irish Sea 2.1 ..1 Hadrlock-North Scrt
0-group cod were collected in 1979 from two areas of larval 0-group specimens were collected i i \ ing an IYGT in 1979. concentration in the Solway Firth and off the east coast of Sampling sites (Figure 3) and sampling details (Table 1) are Ireland. Both of these samples were caught using a Lowestoft given.
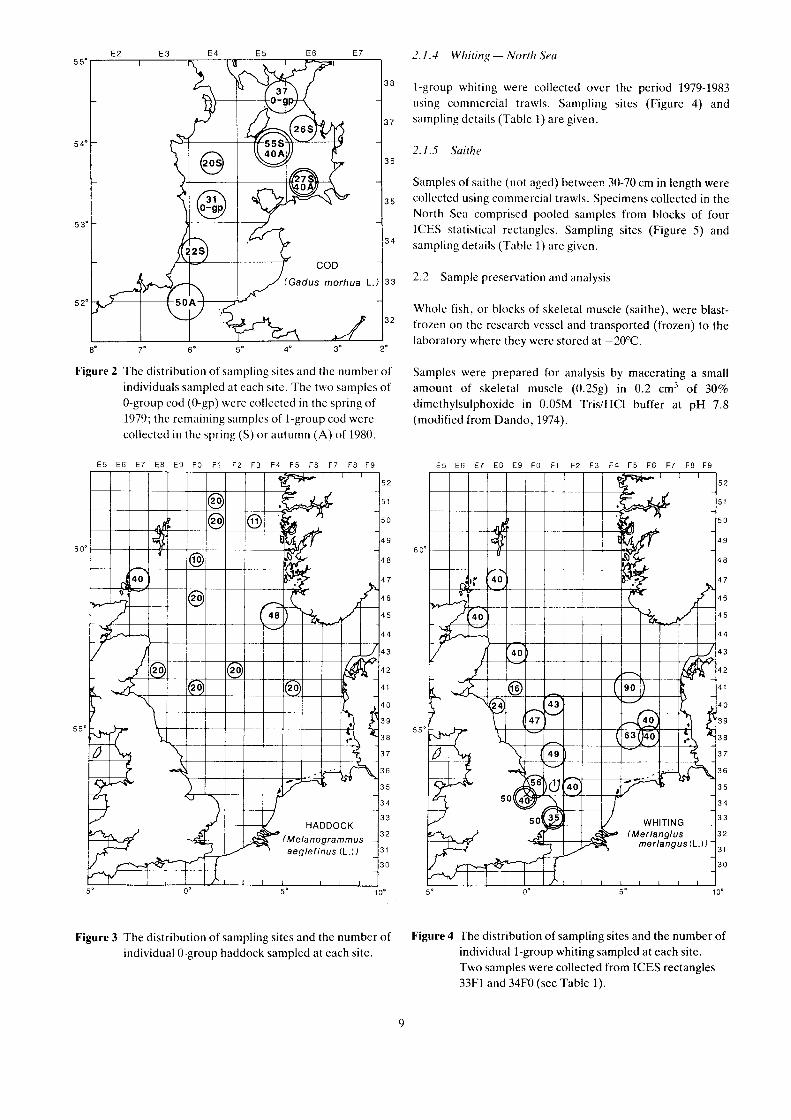
-3.1.4 Wl?iting - North Seu
Figure 2 The distribution of sampling sites and the number of individuals sampled at each site. The two samples of 0-group cod (0-gp) were collcctcd in the spring of 1979; the remaining samples of l-group cod were collected in the spring (S) or autumn (A) of 1980.
I-group whiting were collected over the period 1979-1983 using commercial trawls. Sampling sites (Figure 4) and sampling details (Table l ) are given.
2.1.5 Saithe
Samples of saithe (not aged) betweer? 30-70 cm in length were collected using commercial trawls. Specimens collected in the North Sea comprised pooled samples from blocks of four ICES statistical rectangles. Sampling sites (Figure 5) and sampling details (Table 1) are given.
2.2 Sample preservation and analysis
Whole fish, or blocks of skeletal muscle (saithe), were blast- frozen on the research vessel and transported (frozen) to the laboratory where they were stored at -20°C.
Samples were prepared for analysis by macerating a small amount of skeletal muscle (0.25g) in 0.2 c m h f 30% dimethylsulphoxide in 0.05M TrisiHCl buffer at pH 7.8 (modified from Dando, 1974).
Figure 3 The distribution of sampling sites and the number of Figure 4 The distribution of sampling sites and the number of individual 0-group haddock sampled at each site. individual 1-group whiting sampled at each site.
Two samples were collected from ICES rectangles 33F1 and 34F0 (see Table 1).

frequencies according to the Hardy-Weinberg model.
Figure 5 The distribution of sampling sites and the number of individual saithe sampled at each site. Two samples were collected from ICES rectangle 42E2 (see Table 1); circles marked with an asterisk are drawn in the centre of a block of four ICES rectangles from which the sample was taken; the dashed line shown in the North Sea represents the boundary between the E C and Norwegian Territorial Waters (see Sub- section 3.5.3).
The supernatant was absorbed onto Smrn X Smrn squares of Whatman 3M filter paper which were inserted into 13% starch gels, prepared using a discontinuous buffer system (Ridgway et al., 1970):
vessel buffer: 0.1M lithiurn hydroxidcM).23M boric acid; gel buffer: 0.03M Trisi0.005M citric acid.
Gels were cut in half horizontally and the cut surfaces were stained for the appropriate enzyme. Enzyme staining methods were as described in Harris and Hopkinson (1976) with slight modifications. Staining solutions were modified by the replacement of phenazine methosulphatc (PMS) with 0.2 cm' Meldola's Blue solution (0.4% in distilled water) in 25 cm3 staining solution (Turner and Hopkinson, 1979). Meldola's Blue has the advantage over PMS in eliminating the blue background staining which occurs whcn PMS is exposed to light.
1 .3 Statistical analysis
The numbers of each phenotype were tabulated and the gene frequencies of each allele were calculated. The expected numbers of each phenotype were estimated from the gene
The observed numbers of homozygotes and heterozygotes were tested against the expected numbers for heterogeneity. The heterogeneity x2 with N-2 degrees of freedom was found by subtracting the sum of individual X' values obtained for N samples from the X' value obtained for the population total. This X' value tests the null hypothesis that all samples are in genetic equilibrium.
Tests for contingency of allele distribution were made by calculating the expected numbers of alleles in each sample from the row (r) and column (c) totals and estimating the x2 value with (r- l)(c- l ) degrees of freedom by comparison with the observed numbers of alleles in each sample. This X' value estimates the probability that all samples are representative of a single population.
All calculations were performed using a Fortran 77 program (HGENE2) written by the author.
3. Results and discussion
3.1 Cod populations in the North Sea
Samples from 24 sites were analysed at the GPI-B locus and samples from 21 sites were analysed at the LDH-B locus.
S. l . l Glucose phosphate isotnerase (GPI-B: EC 5.3.1.9) analysis
This locus coded for dimeric codominant alleles. Isozyme activity was observed and was assumed to be controlled by three alleles G P I - B ~ ~ , G P I - B " ~ ~ ~ ~ GP[-p ' .
Observed and expected phenotype numbers are shown in Table 2 together with the estimated allele frequencies. The heterogeneity X' test was not significant: ~ 2 2 ~ = 20.057; 0.7 > P > 0.5 (Table 3).
The test for contingency of allele distribution was not significant: X$, = 51.973; 0.3 > P > 0.2 (Table 4).
3.1.2 L~ctcttr tlehyclrogenase (LDH-B: EC 1 . I. 1.27) analysis
This locus coded for tetrameric codominant alleles. isozyme activity was assumed to be controlled by three alleles: Lt l t l -B l". LDII-B""' and LDH-H"".
Observed and expected phcnotypc numbers and gene l'requencies ;ire shown in Table S. The hctcrogeneity X? test was not significant: X:,, = 15.165; 0.8 > P > 0.7 (Table 6). Phenotypes coded by LDII-B"' were uncommon and in the contingency test these allcles were poolcd with LDH-B'" alleles. The contingency X' valuc \r;is not significant: X;,, =
16.494: 0.7 > P > 0.5 (Table 7 ) .
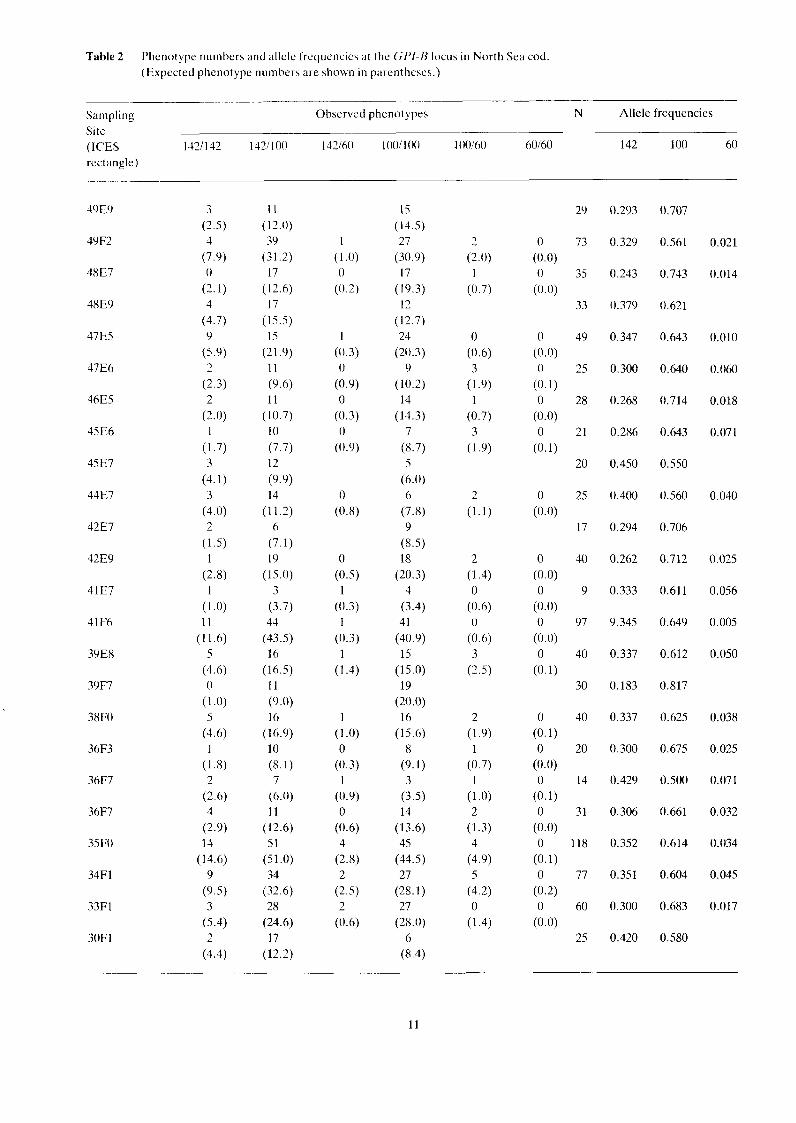
Table 2 Phenotype numbers and allele frequencies at the GPI-13 locus in North Sea cod (Expected phenotype numbers are shown in parentheses.)
Sampling Observed phenotypes N Allele frequencies Site (ICES 1421 142 1431 100 142160 10011 00 100160 60160 142 100 60 rectangle)

Table 3 Heterogeneity F test for North Sea cod at the GPI-B locus. (Expected numbers are shown in parentheses.)
Sampling site ( ICES rectangle)
Homozygotes Heterozygotes N X Sampling site ( ICES
rectangle)
Homozygotes Heterozygotes
'Total 479 477 (S(I4.2) (45 1 .X)
Sum 111 ir~dividual X:, 22.717 Total X: 2.661 Heterogeneity X'?? 20.057 0.7 > P > 0.5
Table 4 Contingency test of allele distribution at GPI-B locus in North Sea cod. (Expected numbers in parentheses are calcuiated from row and column totals.)
Sampling Alleles N X Sampling Alleles N F site site ( ICES 142 I (X) M) ( ICES 142 I tN) 60 rectangle) rectangle)
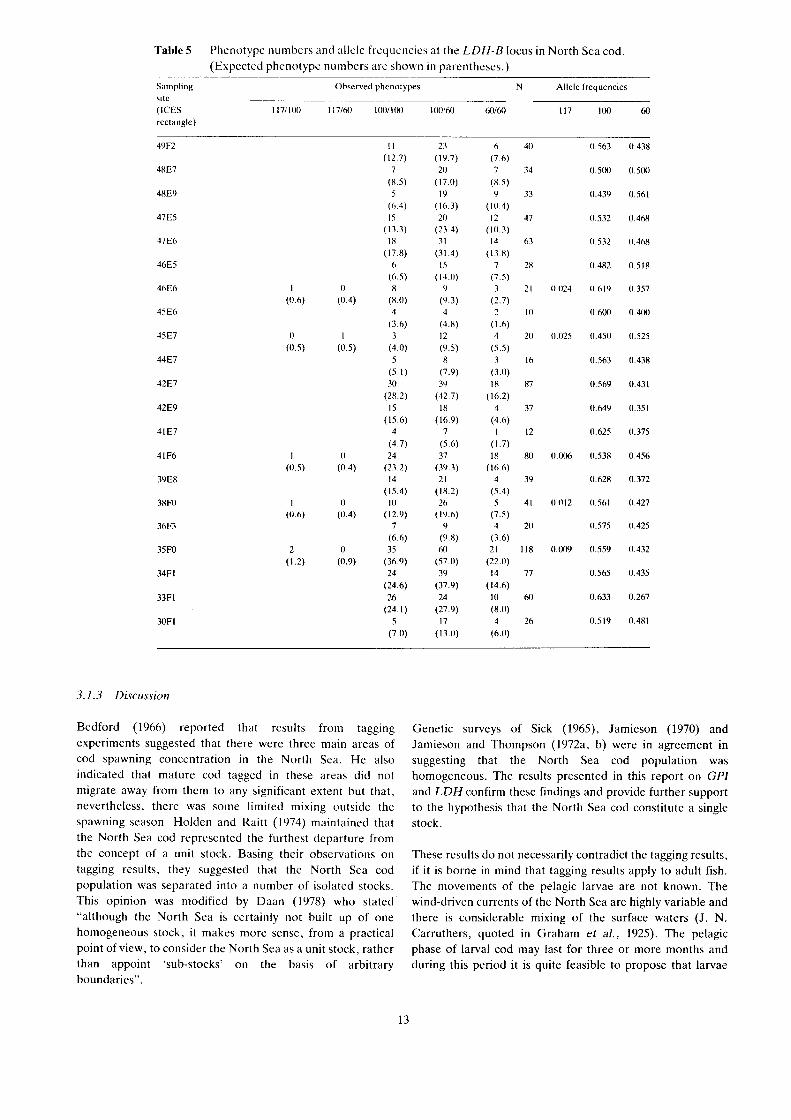
Table 5 Phcnotype number\ and allele frequenc~cs at the LDH-B locus in North Sea cod (Expected phenotype numbers are shown in parenthcscs.)
S;~rnpling site (ICES rectangle)
Ohserved phenotypes N Allele frequencies
3.1.3 Discussion
Bedford (1966) reported that results from tagging experiments suggested that there were three main areas of cod spawning concentration in the North Sea. H e also indicated that mature cod tagged in these areas did not migrate away from them to any significant extent but that, nevertheless, there was some limited mixing outside the spawning season. Holden and Raitt (1974) maintained that the North Sea cod represented the furthest departure from the concept of a unit stock. Basing their observations on tagging results, they suggested that the North Sea cod population was separated into a number of isolated stocks. This opinion was modified by Daan (1978) who stated "although the North Sea is certainly not built up of one homogeneous stock, it makes more sense, from a practical point of view, to consider the North Sea as a unit stock, rather than appoint 'sub-stocks' on the basis of arbitrary boundaries".
Genetic surveys of Sick (1965), Jamieson (1970) and Jamieson and Thompson (1972a, b) were in agreement in suggesting that the North Sea cod population was homogeneous. The results presented in this report on GP1 and LDH confirm these findings and provide further support to the hypothesis that the North Sea cod constitute a single stock.
These results do not necessarily contradict the tagging results, if it is borne in mind that tagging results apply to adult fish. The movements of the pelagic larvae are not known. The wind-driven currents of the North Sea are highly variable and there is considerable mixing of the surface waters (J. N. Carruthers, quoted in Graham et al., 1925). The pelagic phase of larval cod may last for three or more months and during this period it is quite feasible to propose that larvae

Table 6 Heterogeneity x2 test for North Sea cod at the LDH-B locus. (Expected numbers are shown in parentheses.)
Sampling Homozygotes Heterozygotes N X' Sampling Homozygotes Heterozygotes N X' site site (ICES (ICES rectangle) rectangle)
49F2 17 (20.313)
48E7 14 (17.0W)
4889 14 (1 6.742)
47E5 27 (23.596)
4786 32 (3 1.627)
4685 13 (14.018)
46E6 1 1 ( l l ,005)
45E6 6 (5.200)
4587 7 (10.025)
44E7 8 (8. 125)
42E7 48 (44.328)
Sumofx2= 16.113 Total x2 = 0.949 Heterogeneity X:,= 15.165
37 0.140
12 0.633
80 0.158
39 0.797
41 3.288
20 0.120
I I X 0.407
77 0.069
60 1.002
26 2.485
Total 446 463 (4M.6 ) (448.4 )
Table7 Contingency test of allele distribution at the L D H - B locus in North Sea cod. (Expected numbers in parentheses are calculated from row and column totals.)
Sampling Alleles N X' Sampling Alleles N X' site (ICES 100 60' rectangle)
site (ICES 100 M)' rectangle)
49m 45 35 (44.664) (35.336)
4887 34 34 (37.965) (30.035)
4889 29 37 (36.848) (20.152)
4785 50 44 (52.481) (41.519)
47 E6 67 5 '1 (70.347) (55.053)
4685 27 2!, (31.265) (24.735)
46E6 26 16 (23.449) (18.551)
45E6 12 8 (1 1.166) (X.834)
45E7 19 21 (22.332) (1 7.668)
44E7 18 14 (17.866) (14.134)
42E7 99 75 (99.145) (76.855)
Contingency X:,, = 16.494 0.7 > P > 0.5
LDH-B"' pooled with LDH-B"'

from any number of isolated spawning grounds may be mixed together. The consequences of mixing, in genetic terms, is the production of a homogeneous population. Recruitment to an isolated stock must be from within the stock if it is to maintain its genetic integrity. It is highly unlikely that this condition can be maintained in the North Sea.
3.2 Cod populations in the Irish Sea
Samples collected in the spring of 1979 (2). the spring of 1980 (5) and the autumn of 1980 (3) were analysed for GPI-B. The samples collected in the spring of 1979 and the spring of 1980 were also analysed for LDH-B.
3.2.1. Glucose phosphate isomerase (GPI- B: EC 5.3.1.9) analysis
Evidence for seven alleles was found at this locus (four of which were uncommon (*)). They were GPI-B'~~*, GPI-B'~~ ,
GPZ- GPI-B"~ * , GPI-B"", GPI-B~'* , and GPI-p' For the calculation of the contingency X' the uncommon alleles were combined with the GPZ-B60 alleles. Observed and expected phenotype numbers and gene frequencies are shown in Table 8. The heterogeneity test was not significant: X; = 11.180; 0.3 > P > 0.2 (Table 9). The contingency test of allele distribution was highly significant: xt8 = 41.423; 0.01 >P> 0.001 (Table 10).
The difference in allele distribution for the two 0-group cod samples collected in 1979 was significant: X: = 17.973; P >
0.001. The l-group cod collected in 1980 were compared with each of the 0-group samples and it was found that those cod collected in spring 1980 from the west of the Irish Sea (ICES rectangles 36E4 and 34E3) and from the east of the Isle of Man (ICES rectangle 36E5) were significantly different from the Solway Firth sample. The sample collected off St Bees Head (ICES rectangle 37E6) was significantly different from the Kish Bank 0-group sample off Dublin (ICES rectangle 35E4). The sample from North Wales (ICES rectangle 3586) was more similar to the Solway Firth population than to the Kish Bank population, although it was not significantly different from either group (Table l la) . None of the samples collected in the autumn of 1980 was significantly different from the Solway Firth sample but the St Bees Head and North Wales samples were both significantly different from the Kish Bank group (Table l lb).
3.2.2 Lactate dehydrogenase (LDH-B: EC 1.1.1.27) analysis
The isozymes observed at this locus were assumed to be controlled by three alleles: LDH-B"', LDH-B"", and LDH- BM'. The observed and expected phenotype numbers and the gene frequencies are shown in Table 12. The heterogeneity test was not significant: X: = 5.021; 0.5 > P > 0.3 (Table 13). The contingency test of allele distribution in which LDH-B1I7
alleles were combined with LDH-BM' alleles was not significant: X: = 5.373; 0.5 > P > 0.3 (Table 14).
Table 8 Phenotype numbers and allele frequencies at the GPI-B locus in Irish Sea cod. (Expected phenotype numbers are shown in parentheses.)
S-79-0
S-79-0
S-W- I
S-80- I
S-80- I
S-Rll- I
S-811- I
A-KO- I
A-KO-l
A-80-1
1 R 2 37 0.243 (19.7) (1.5)
3 1 31 0.532 (4.3) (2.2) I I 3 55 0.435
(13.5) (3.0) I2 1 26 0.288
(12.5) (0.7) 4 0 1 20 0.425
( 5 0 ) (0.5) (1.0) I I 27 0 389
(10 I ) I 2 2 2 0.3M
(5 .0) (0 .5) ( 1 9 ) 211 l 2 40 0 275
(IH')) ( 0 7 ) ( 1 4 ) I ') 1 40 0.013 0.313
( I h 9) ( 1 3) I I8 4 50 0.310
( O . I l 0 ) (19.2) ( 3 7 )
' S = h1;ty A = Septcmhcr
! 0 = Sp;~wncd in thc m l e ~ l d ; ~ r yc;w I = Sp;~wncd in thc prcvious year
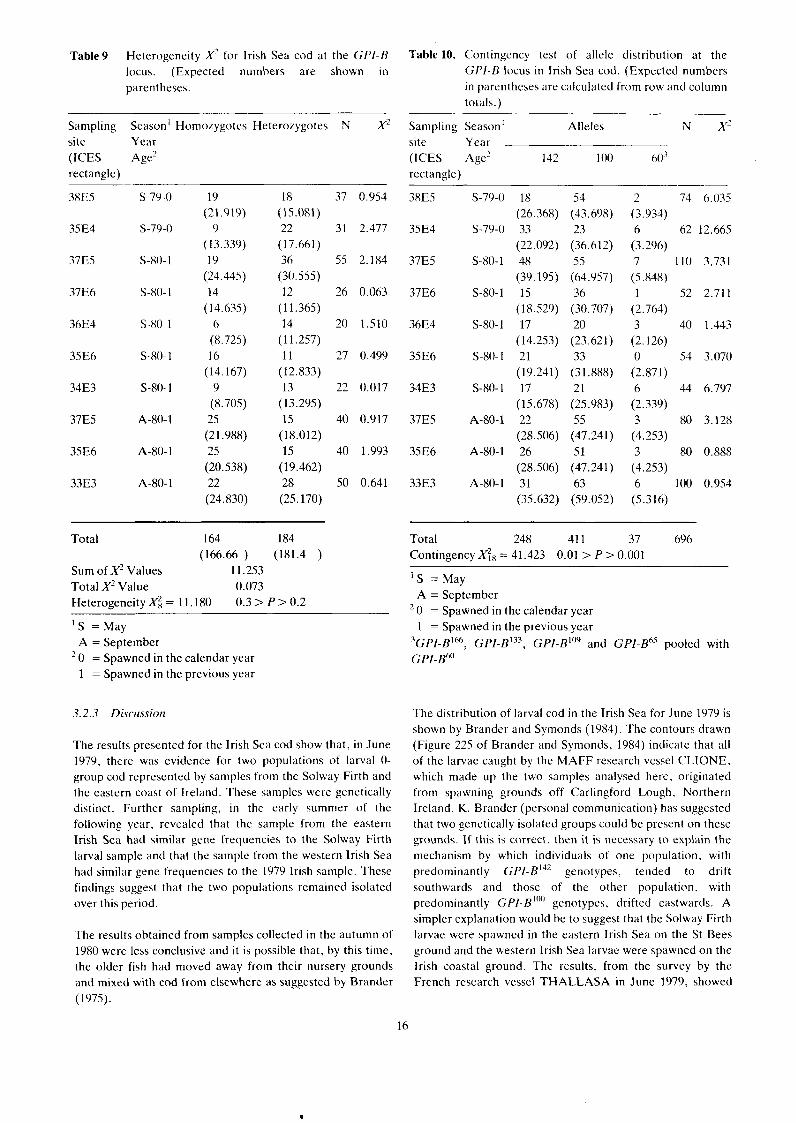
Table9 Heterogeneity X'- for Irish Sea cod at the GP/-H locus. (Expected numbers are shown in parentheses.
Sampling season' Homozygotes Heterozygotes N X' site Year (ICES Age2 rectangle)
Total 164 184 (166.66 ) (181.4 )
Sum of X' Values 11.253 Total X' Value 0.073 ~ e t e r o ~ e n e i t ~ X; = 11.180 0.3 > P > 0.2
' S = May A = September 0 = Spawned in the calendar year 1 = Spawned in the previous year
The results presented for the Irish Sea cod show that, in June 1979, there was evidence for two populations of larval 0- group cod represented by samples from the Solway Firth and the eastern coast of Ireland. These samples were genetically distinct. Further sampling, in the early summer of the following year. revealed that the sample from the eastern Irish Sea had similar gene frequencies to the Solway Firth larval sample and that the sample from the western Irish Sea had similar gene frequencies to the 1979 Irish sample. These findings suggest that the two populations remained isolated over this period.
The results obtained from samples collected in the autumn of 1980 were less conclusive and it is possible that, by this time, the older fish had moved away from their nursery grounds and mixed with cod from elsewhere as suggested by Brander (1975).
Table 10. Contingency test of allele distribution at the GP/-B locus in Irish Sea cod. (Expected numbers in parentheses are calculated from row and column totals.)
Sampling Season' Alleles N X' site Year (ICES Age2 142 100 603 rectangle)
38E5 S-79-0 18 54 2 74 6.035 (26.368) (43.698) (3.933)
35E4 S-79-0 33 23 6 62 12.665 (22.092) (36.612) (3.296)
37E5 S-80-1 48 55 7 110 3.731 (39.195) (64.957) (5.848)
37E6 S-80-1 15 36 1 52 2.711 (18.529) (30.707) (2.764)
36E4 S-80-1 17 20 3 40 1.443 (14.253) (23.621) (2.126)
3586 S-80-1 21 33 0 54 3.070 (19.241) (31.888) (2.871)
34E3 S-80-1 17 2 1 6 44 6.797 (15.678) (25.983) (2.339)
37E5 A-80-1 22 55 3 80 3.128 (28.506) (47.241) (4.253)
35E6 A-80-1 26 51 3 80 0.888 (28.506) (47.241) (4.253)
33E3 A-80-1 31 63 6 100 0.954 (35.632) (59.052) (5.316)
Total 248 41 1 37 696 Contingency X:, = 41.423 0.01 > P > 0.001
' S = M a y A = September ' 0 = Spawned in the calendar year
1 = Spawned in the previous year %PI-B"~, GPI-B'", G P I - B ' ~ and GP/-Bh"oo1ed with G PI- B")
The distribution of larval cod in the Irish Sea for June 1979 is shown by Brander and Symonds (1984). The contours drawn (Figure 225 of Brander and Symonds, 1984) indicate that all of the larvae caught by the MAFF research vessel CLIONE, which made up the two samples analysed here, originated from spawning grounds off Carlingford Lough, Northern Ireland. K. Brander (personal communication) has suggested that two gcnctically isolated groups could be present on these grounds. If this is correct. then it is necessary to explain the mechanism by which individuals of one population, with predominantly GP/-B'" genotypes, tended to drift southwards and those of the other population. with predominantly GP/-B"" genotypes. drifted eastwards. A simpler explanation would be to suggest that the Solway Firth larvae were spawned in the eastern Irish Sea on the St Bees ground and the western Irish Sea larvae were spawned on the Irish coastal ground. The results, from the survey by the French research vessel THALLASA in June 1979, showed
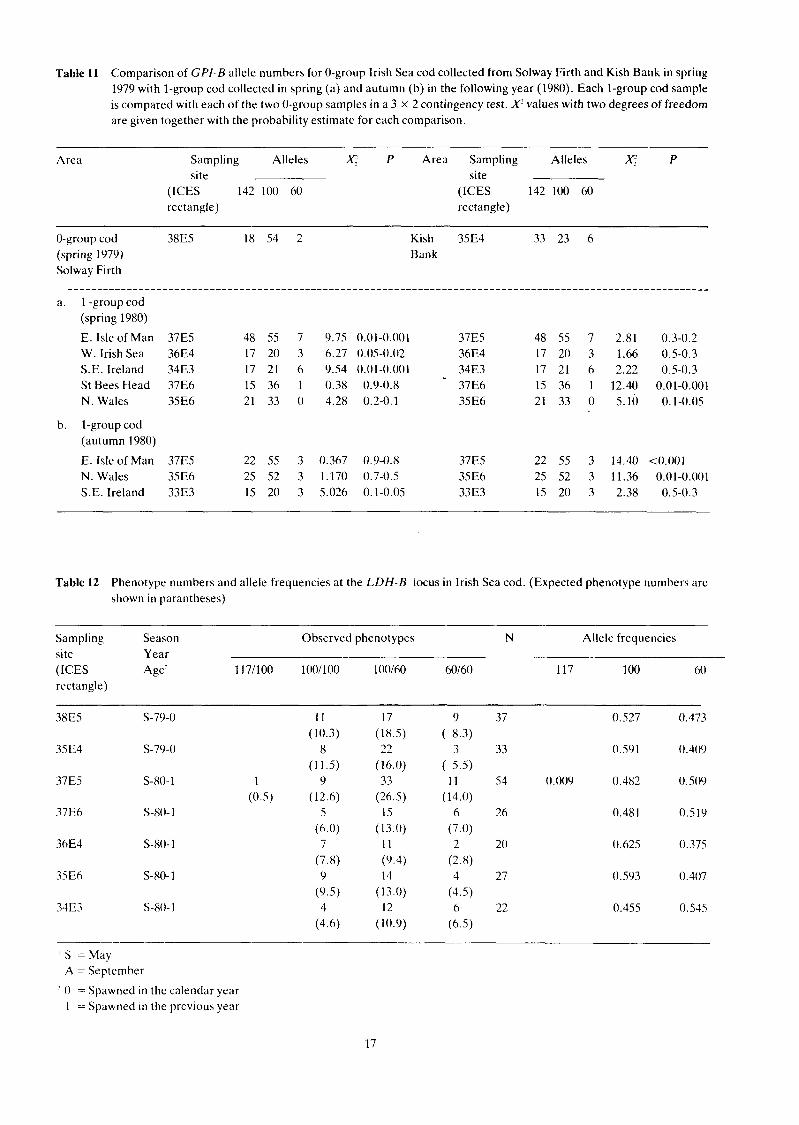
Table l 1 Comparison of GPI-B allele numbers for 0-group Irish Sea cod collected from Solway Firth and Kish Bank in spring 1979 with l-group cod collected in spring (a) and autumn (b) in the following year (1980). Each 1-group cod sample is compared with each of the two 0-group samples in a 3 X 2 contingency test. X? values with two degrees of freedom are given together with the probability estimate for each comparison.
Area Sampling Alleles P Area Sampling Alleles P site site
(ICES 142 100 60 (ICES 142 100 60 rectangle) rectangle)
0-group cod 38E5 18 54 2 (spring 1979) Solway Firth
a. l -group cod (spring 1980)
E. Isle of Man 37E5 48 55 7 9.75 W. Irish Sea 36E4 17 20 3 6.27 S.E. Ireland 3483 17 21 6 9.54 St Bees Head 37E6 15 36 1 0.38 N. Wales 35E6 21 33 0 4.28
Kish 35E4 33 23 6 Bank
b. l-group cod (autumn 1980)
E. Isle of Man 37E5 22 55 3 0.367 0.9-0.8 37E5 22 55 3 14.40 <0.001 N. Wales 35E6 25 52 3 1.170 0.7-0.5 35E6 25 52 3 11.36 0.01-0.001 S.E. Ireland 33E3 15 20 3 5.026 0.1-0.05 33E3 15 20 3 2.38 0.5-0.3
Table 12 Phenotype numbers and allele frequencies at the LDH-B iocus in Irish Sea cod. (Expected phenotype numbers arc shown in parantheses)
Sampling Season' Observed phenotypes N Allele frequencies site Year (ICES Age' 1 171100 l001100 100160 60160 117 100 60 rectangle)
' S =May A = September
0 = Spawned in the calendar year l = Spawned In the previous year
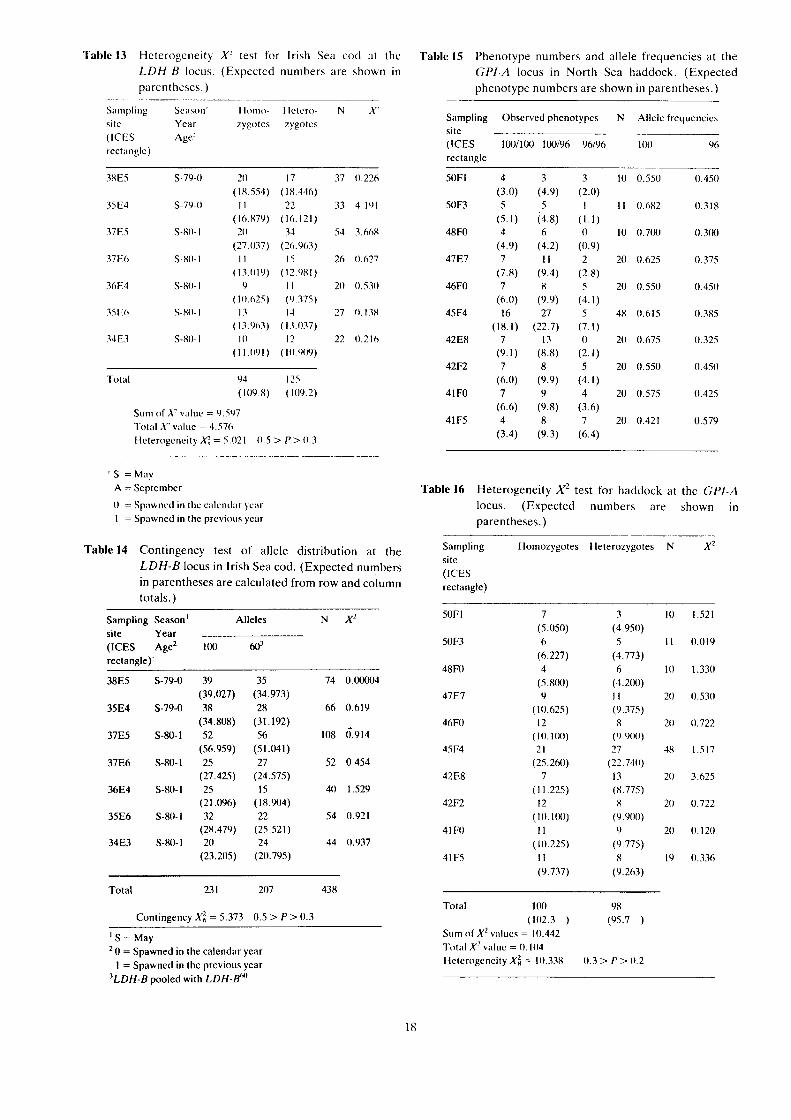
Table l3 Heterogeneity X" test for Irish Sea cod at the LDH-B locus. (Expected numbers arc shown in parentheses.)
Table 15 Phenotype numbers and allele frequencies at the GPI-A locus in North Sea haddock. (Expected phenotype numbers are shown in parentheses.)
Si~lnplillg Sct~son' l l - l t r o N X' site Year zygotes zygotes (ICES Age' rectangle)
38E5 S-79-0 20 17 37 0.226 (18.554) (18.446)
35 E4 S-79-0 I I 22 33 4.101 (10.879) (10.121)
37E5 S-80- I 21 1 34 54 3.608 (27.037) (26.963)
37E6 S-80- I I I 15 26 0.627 (l3.019) (I2.08l)
36E4 S-80- I Y I I 20 0.530 ( l . 2 5 ) (0.375)
351 (0 S-80- I 13 I J 27 0.13X ( 17.003) ( 1.3.037)
34E3 S-80- I I0 12 22 0.210 ( I I . I I ~ I ) (Io.yo9)
Total 04 125 (109 8) (109.2)
Sun1 of X v:~lue = 9.597 1'ot;ll X'v;~luc = 4.576 Hcterogcneity X;' = 5.021 0.5 > P > 0.3
Sampling Ohserved phenotypes site (ICES 1001100 100196 96196 rectangle
50F1 4 3 3 (3.0) (4.9) (2.0)
50F3 5 5 l (5.1) (4.8) (1.1)
48F0 4 6 0 (4.9) (4.2) (0.9)
4787 7 11 2 (7.8) (9.4) (2.8)
46F0 7 X 5 (6.0) (9.9) (4.1)
45F4 16 27 5 (18.1) (22.7) (7.1)
42EX 7 13 0 (9.1) (8.8) (2.1)
42F2 7 8 5 (6.0) (9.9) (4.1)
41FO 7 9 4 (6.6) (9.8) (3.6)
41F5 4 8 7 (3.4) (9.3) (6.4)
Allele frcqucncics
100 36
0.550 0.450
0.682 0.318
0.700 0.300
0.625 0.375
0.550 0.450
0.615 0.385
0.675 0.325
0.550 0.450
0.575 0.425
0.421 0.579
' S = May A = September
0 = Sptlwnctl in tllc c:~lrnd:~r yc:lr I = Spawned in the previous ycar
Table 16 Heterogeneity X' test for haddock at the GPI-A locus. (Expected numbers are shown in parentheses.)
Table l4 Contingency test of allele distribution at the LDH-B locus in Irish Sea cod. (Expected numbers in parentheses are calculated from row and column totals.)
Sampling Season' Alleles N x2 site Year (ICES ~ g e ' 100 60' rectangle).
Total 23 1 207 438
Contingency X: = 5.373 0.5 > P > 0.3
' S = M a y 0 = Spawned in the calendar year I = Spawned in thc previous year
'LDH-B pooled with LDH-B"'
Sampling Homozygotes Heterozygotes N X' site (ICES rectangle)
Total 100 98 (102.3 ) (95.7 )
Sum of X' v;ilucs = 10.442 l'otal X' v;lluc = 0.104 ~ e t e r o ~ e n c i t ~ X: = 10.338 0.3 > l'> 0.2

concentrations of larvae off the Cumbrian coast and off the Irish coast. The distribution is given by Brander and Symonds ( 1984).
It is apparent from the results of the biochemical analysis that two genetically distinct populations remained separated for at least one season. They may then disperse and mix but if. as suggested by Brander (1975) the adult cod return to their original spawning grounds, then this could result in continued genetic isolation. Brander (1975) showed, from tagging experiments, that there is a degree of isolation between western and eastern Irish Sea cod. He also described some genetic variation at the haemoglobin locus, although the findings were thought to be inconclusive.
The results presented in this paper are for one season only and the opportunity to sample further larval concentrations has not arisen since. It would be essential to carry out further analyses to confirm these findings.
3.3 Haddock populations in the North Sea
Samples of 0-group haddock were collected from eleven sites in the North Sea. Ten samples were analysed for GP1 and eight for LDH.
3.3.1 Glucose phosphate isomerase (GPI-A: EC 5.3.1.9) analysis
Isozymes observed at this locus were assumed to be controlled by two alleles: GPI-A"" and GP[-A". The observed and expected phenotype numbers and the gene frequencies are shown in Table 15. The heterogeneity test and the contingency test were not significant: X; = 10.338; 0.3 > P > 0.2 and X; = 8.591; 0.5 > P> 0.3 respectively (Tables 16 and 17).
3.3.2 Luct~te dehydrogenase (LDH-A: EC 1.1.1.27) analysis
Isozymes observed at this locus were assumed to be controlled by three alleles: LDH-A"~, LDH-A'"? and LDH- A"". The observed and expected phenotype numbers and the gene frequencies are shown in Table 18. Neither the heterogeneity test nor the contingency test were significant: X: = 0.946; P > 0.99 and = 13.156; 0.7 > P> 0.5 respectively (Tables 19 and 20).
.?.3.3 Discussion
3.4 Whiting populations in the North Sea
Samples collected from 19 sites in the North Sea were analysed for PGM and GPI-A.
3.4. I Phosphoglucomutase (PCM: EC2.7.5.1) analysis
This locus codes for monomoric codominant alleles. The isozymes ohscrvcd i ~ t this locus were assumed to be controlled by three alleles: PGM"', PGM"" and PGM". The observed and expected numbers of phenotypes and the gene frequencies are shown in Table 21. The tests for heterogeneity and contingency of allele distribution were not significant: xi7 = 17.926; 0.5 > P > 0.3 and X$, = 36.992; 0.5 > P > 0.3 respectively (Tables 22 and 23).
3.4.2 Glucose phosphate isomerase (GPI-A: EC 5.3.1.9) analysis
The isozymes observed at this locus were assumed to be controlled by four alleles: CPI-A [lM, GPI-A GPI-A l'" and GP1-A~'. The observed and expected phenotype numbers and gene frequencies are shown in Table 24.
Table l7 Contingency test of allele distribution at the GPI-A locus in haddock. (Expected numbers in parentheses are calculated from row and column totals.)
Sampling Alleles N X' site (ICES 100 96 rectangle)
(9 .oOO) 6 20 0.985
(X. 182) 15 40 0.192
(16.364) 18 40 0.277
(16.364) 37 96 0.223
(39.273) 13 40 1.170
(16.364) 18 40 0.277
(16.364) 41F0 23 17 40 0.042
The results presented in this report suggest that the North Sea (23.636) (16.364) haddock may consist of a single homogeneous stock.
41 F5 16 22 38 4.535 However, as stated in Section 1, observations showing (22.455) (15.545) similarities at particular loci do not prove that the stock is homogeneous. Studies on the variations at the transferrin locus in haddock (A. Jamieson and R.J. Turner, personal Total 2340 162 396 communication) suggest that there might he genetic variation between haddock found to the west and cast of the Contingency X; = 8.591 0.5 > P > 0.3 Greenwich meridian.

Table 18 Phenotype numbers and allele frequencies at the LDH-A locus in haddock. (Expected phenotype numbers are shown in parentheses.)
Saihpling Observed phenotypes N Allele frequencies site (ICES 2621192 2621100 19211 92 1921100 l00/100 262 192 100 rectangle)
Table 19 Heterogeneity X? test for haddock at the LDH-A Table 20 Contingency test of allele distribution at the locus. (Expected numbers are shown in LDH-A locus in haddock. (Expected numbers in parentheses.) parentheses are calculated from row and column
totals.)
Sampling Homo- Hetero- N X L Sampling Alleles N X site zytgotes zygotes (ICES
site (ICES
rectangle) rectanlgle
Total 119 4 1 (120.0) (40.0)
Sum of X? values = 0.974 Total X? value = 0.028 Heterogeneity X, = 0.946 p = 0.99
Total 15 30 275 320 Contingency X, = 13.168 0.7 > P > 0.5

Table 21 Phenotype numbers and allele frequencies at the PGM locus in whiting. (Expected phenotype numbers are shown in parentheses.)
Sampling Observed phenotypes N Allele frequencies site (ICES 1221122 1221100 122176 1001100 100176 76/76 122 100 76 rectangle

Table 22 Heterogeneity X test for whiting at the PGM locus. (Expected numbers are shown in parentheses.)
S;~nipling t lo~i i~zygt~tes 11eter0~ygotc~ N X-' S;lmpling Homo7yg(ltes Heterozygotes N X sitc sitc (ICES (ICES rectangle) rectangle)
Total 425 379 (403.0) (41 l .O)
Sum of X-' values = 22 948 Total X value = 5.022 Hcterogencity r, = 17.926 0.5 > P > 0 .3
Table23 Contingency test of allele distribution at the PGM locus in whitivg. (Expected numbers in parentheses are calculated from row and column totals.)
- - -- - S:impling Allclcs N F S:1111pling Allclc.; N X sitc cite (ICES 122 100 76 (ICES 122 I(K) 76 rectangle) rectangle)
Total 808 812 8 1628
Contingency Xh = 36.992 0.5 > P > 0.3
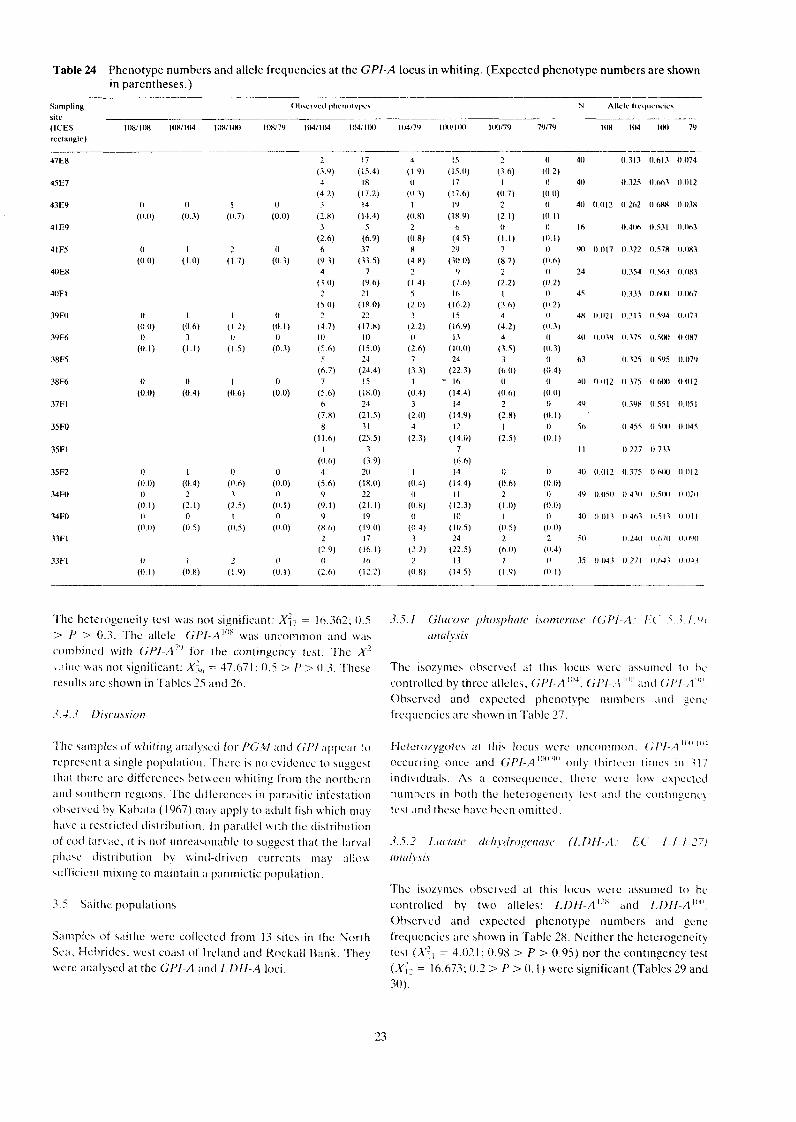
Table 24 Phenotype numbers and allele frequencies at the GPI-A locus in whiting. (Expected phenotype numbers are shown in parentheses.)
S.8111pling \ale
(ICES rectangle)
2 (3.9) 4
(4 2) 0 0 l 0 3
( l ) (0.3) (11 7) ( 0 ) (2 X ) 5
(2.6) O l 2 I1 6
(0 0) (1.0) (1.7) (0.3) (9.3) 4
(3.0) (9.6) ( I 4 ) 2 2 1 5
( 5 0) (18.0) (?.l)) 0 I I 0 2 22 3 (fill) ( 0 6 ) ( 1 2 ) ( l l .1) ( 4 7 ) (17.8) ( 2 2 )
I1 3 l1 O 10 10 0 (0.1) (1 .1 ) (1.5) (0.3) (S 61 ( I S U) ( 2 6)
5 2.4 7 ( 6 7 ) (24.4) (3 3)
0 0 I 0 7 15 1 (0.0) (0.4) (0.6) (0.0) (5.6) (18.0) (0.4)
6 24 3 (7 8) (21 5) (2 0) 8 3 1 4
( I I 6) (25.5) (2.3) I 3
(11.6) (3.9) 0 1 0 O 4 20 I
( l ) (0.4) (0.6) (0.0) (5 6) ( I R 0) (0.4) O 2 3 0 Y 22 0
(0 I ) (2.1) (2.5) (U.1) (9.1) (21 I ) (0.X) 0 0 l 0 Y 19 0
(0.0) (0.5) (0.5) (00) ( X h ) (190) ( 0 4 ) 2 17 3
(2 Y) (16.1) (2 2) 0 I 2 O 0 16 2
(0 I ) (0 8) ( 1 V ) (0.1) (2 6) (12.2) (0 8)
The heterogeneity test was not significant: X:, = 16.362; 0.5 > I' > 0.3. 'The allele GflI-A"'X was uncommon and \\:IS
comhiricd with GPI-A'" for the contingency test. Thc X' \ , i iuc . \+;IS not significant: X:,, = 47.071 ; 0.5 > P > 0.3. These resultb are shown in Tables 25 and 26.
'I'he s~rrnples o f whiting analysccl for J'G.tl and <;/'l appear- t o
represent a single pop~~liitiun. 'fhcl-e is no cvidencc to suggest that thcrc are differences t>et\\ecn whitin? from the northern ancl s o ~ ~ t h e r n regions. The clil'l'crcricc\ in parasitic infcstation oherkcd by Kabata (1967) mii\ apply to adult fish which may h. < I \ L .,. 'I rchtricted c l i s t r ih~~t i~n . I n parallcl with the distribution
ol cod lar\.;le, i t ia riot unre ;~ \o~~ahle to suggest that the larval piiasc di5tribution hy wintl-driven currents may ;il!ow sufCicicnt ~ n i x ~ n g to maintain ;I panmictic population.
3.5 S:iithc populations
Samples of \:tithe were cclllccted from 13 sites in the North Sea. Hebrides. \vest coast of Ireland and Rockall Hank. They ucrc analysed at the G P / - A and LDt-I-A loci.
.?..T. l Glucose pl~o.rp11ritc~ i.somc~riisc ((;l'/-,\: I.'( ' .< . .K 1 ';I
orlmlv.si.s
The iso~ymex ohservecl at this locus \vcrc ;issumcd to 1.' controlled by three allelcb, (;flI-ill"J, (;/'I-..\ "l ' ! irnct (;/'I-A"". Ohserved and expected phenotype nun1hel.s ant1 gciic frcciuencies are shown in Table 27.
t?etcrozygotc*s at this locua were uncommorl. (;['/-,.l "l" ' " l
occurring once and G P I - ~ Z """"" only tliirtccri tirnc3s in 3 17 individuals. A\ a consequence, thc.1-c were I O U cxpcc~cd riurnl>ers in both the heterogeneity t o t and the contingency tcst ;Incl these have hecn omitted.
.?..Y. 2 l,clct(lt<> ~ l ~ ~ / l ~ c / r o ~ i ~ f ~ ~ l . s ~ ~ (l. l)kI-/l: l . I . l . 271 clrrrr1vvi.s
Tlic iso~qmes observed at this locus were assunicd to bc controlled by two alleles: L , D H - A ' . ' \ I ~ ~ 1,I)Il-A"'". Obscrvcd and expected phenotype numbers and gcne t'recli~encies are shown in 'I'ahle 28. Neither the heterogeneity tcst ( X i l = 4.021; 0.98 > P > 0.95) nor the contingency test (X:? = 16.671; 0.2 > P > 0.1) were significant (Tables 29 and 30).
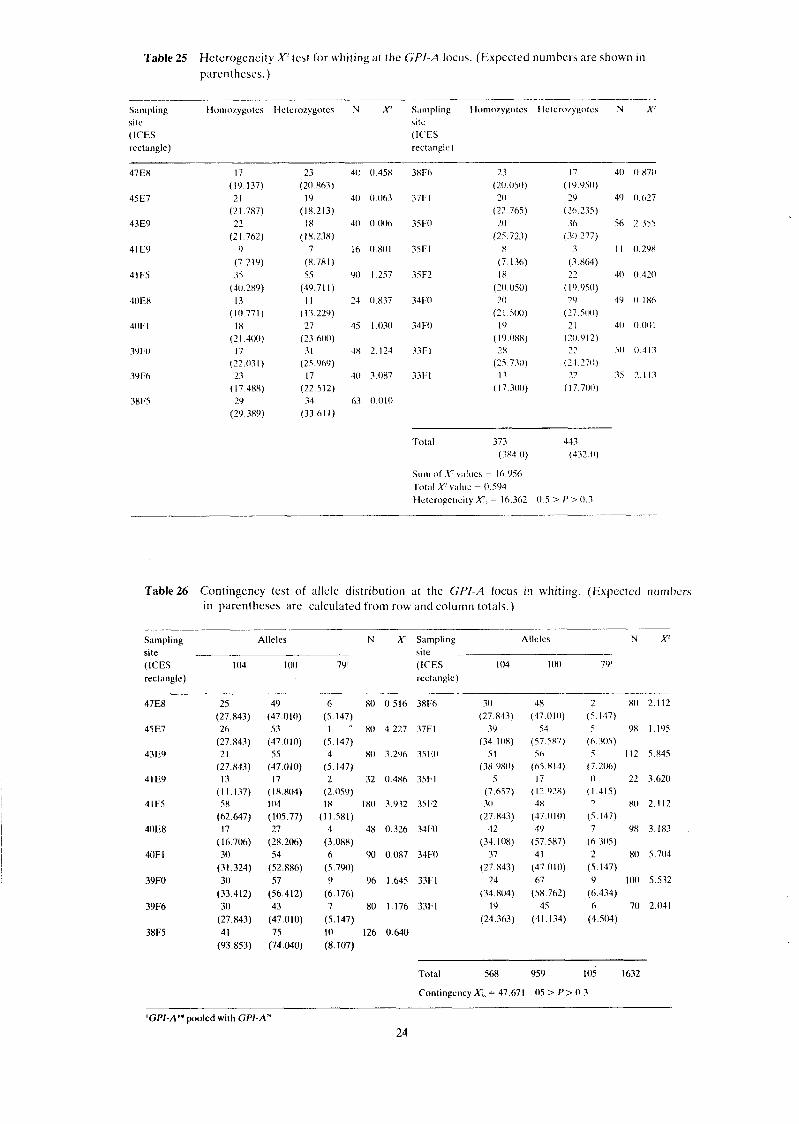
Table 25 Heterogeneity X' test for whttrng at the GP/-A locus. (Expected n u m h e ~ s are shown In
parentheses.)
S;lmpling Iio~nozygotcs Ilctcrozygotcs N ,V S;~nlpling Ilomorygolcs Ilclcrof)golcs N X' site sile (ICES (ICES rectangle) rectangle)
Total 373 443 (384 0) (432.0)
Sr~ln oIAcvv;~lue\ = 16.956 .I'ot;lI X v:~luc = 0.594 Heterogeneity F . = 10.362 0 S > P > 0.3
Table26 Contingency test of allele distribution at the GP/ -A locus in whiting. (Expected numbers in parentheses are calculated from row and column totals.)
--
Sampling Alleles N X? Sampling Allcles N X? site site (ICES 104 1 (M) 79' (ICES 104 !(H) 79' rectangle) recl ;~~~glc)
Total 568 959 l05 1632
Contingency X?,, = 47 671 05 > P> 0 3
'GPI-A"* pooled with GPI-AN
24

Table 27 Phenotype numbers and allele frequencies at the Table 29 Heterogeneity F test for saithe at the LDH-A - - GPI-A locus in saithe. (Expected numbers are locus. (Expected numbers are shown in shown in parentheses.)
Sampling Ohserved phenotypes N Allele frequencies site (ICES 104/11XlI(WVI0(1 IOKKYO 104 I(X) 90 rectangle)
38EO
42E2
4282
43E0
4305
51E8'
51FOg
49E8.
49 FO'
47E8'
47F0°
Table28 Phenotype numbers and allele frequencies at the
parentheses.)
Sampllng Homozygotes Heterozygotes N X: site (ICES rectangle)
Total 283 34 (279.5) (37.5)
Sum of X? values = 4.387 Total X? value = 0.364 Heterogene~ty K , = 4.021 0.98 > P >O 95
LDH-A locus in saithe. (Expected numbers are Table 30 Contingency test of allele distribution at the shown in parentheses.) LDH-A locus in saithe. (Expected numbcrs in
Sampling Ohserved phenotypes N Allele freqdencies site (ICES 128/128128/100100/100 128 l(W)
rectangle)
parentheses are calculated from row and column totals.)
Sampling Alleles N X slte
(ICES 128 rectangle)
Total 40 594 634 * Sample from four ICES rectangles. Code refers to the Cont~ngency X;: = 16 673 0 2 >P >O I upper left-hand rectangle.
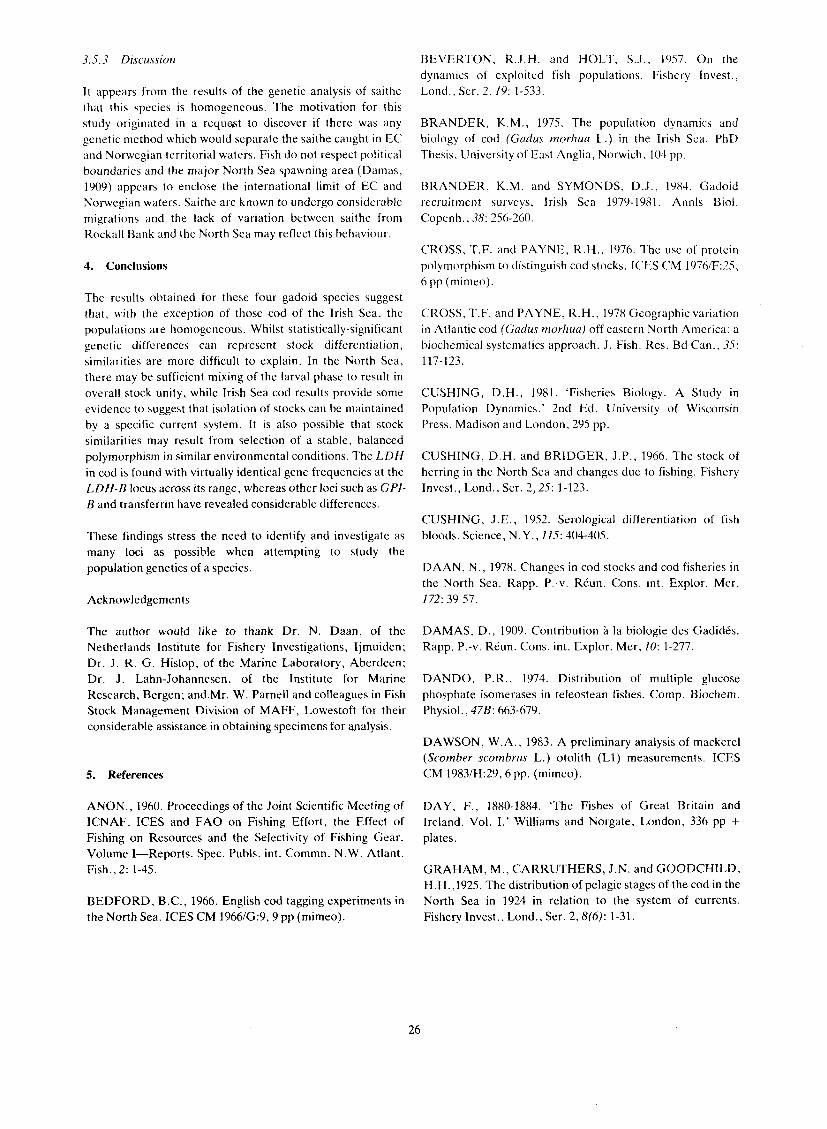
It appears from the results of the genetic analysis of saithe that this species is homogeneous. The motivation for this study originated in a r e q u e ~ t to discover if there was any genetic method which would separate the saithe caught in E C and Norwegian territorial waters. Fish do not respect political boundaries and the major North Sea spawning area (Damas, 1909) appears to enclose the international limit of E C and Norwegian waters. Saithe are known to undergo considerable migrations and the lack of variation between saithe from Rockall Bank and the North Sea may reflect this behaviour.
4. Conclusions
The results obtained for these four gadoid species suggest that, with the exception of those cod of the Irish Sea, the populations are homogeneous. Whilst statistically-significant genetic differences can represent stock differentiation, similarities are more difficult to explain. In the North Sea, there may be sufficient mixing of the larval phase to result in overall stock unity, while Irish Sea cod results provide some evidence to suggest that isolation of stocks can be maintained by a specific current system. It is also possible that stock similarities may result from selection of a stable, balanced polymorphism in similar environmental conditions. The LDH in cod is found with virtually identical gene frequencies at the LDH-B locus across its range, whereas other loci such as GPI- B and transferrin have revealed considerable differences.
These findings stress the need to identify and investigate as many loci as possible when attempting to study the population genetics of a species.
Acknowledgements
The author would like to thank Dr. N. Daan, of the Netherlands Institute for Fishery Investigations, Ijmuiden; Dr. J. R. G . Hislop, of the Marine Laboratory, Aberdeen; Dr. J . Lahn-Johannesen, of the Institute for Marine Research, Bergen; and.Mr. W. Parnell and colleagues in Fish Stock Management Division of MAFF, Lowestoft for their considerable assistance in obtaining specimens for analysis.
5. References
ANON.. 1960. Proceedings of the Joint Scientific Meeting of ICNAF, ICES and F A O on Fishing Effort, the Effect of Fishing on Resources and the Selectivity of Fishing Gear. Volume I-Reports. Spec. Publs. int. Commn. N.W. Atlant. Fish., 2: 1-45.
BEDFORD, B.C., 1966. English cod tagging experiments in the North Sea. ICES CM 1966/G:9,9 pp (mimeo).
BEVERTON. R.J .H. and HOLT, S.J., 1957. On the dynamics of exploited fish populations. Fishery Invest.. Lond., Ser. 2,lY: 1-53?.
BRANDER, K.M., 1975. The population dynamics and biology of cod (Gudus morhuu L.) in the Irish Sea. PhD Thesis. University o f East Anglia, Norwich, 104 pp.
BRANDER, K.M. and SYMONDS, D.J . , 1984. Gadoid recruitment surveys, Irish Sea 1979-1981. Annls Biol. Copenh., 38: 256-260.
CROSS, T.F. and PAYNE. R . H . , 1976. The use of protein polymorphism to distinguish cod stocks. ICES CM 1976/F:25, h pp (mimeo).
CROSS, T.F. and PAYNE, R.H. , 1978 Geographic variation in Atlantic cod (Gadus morhua) off eastern North America: a biochemical systematics approach. J . Fish. Res. Bd Can.. 35: 117-123.
CUSHING, D.H. , 1981. 'Fisheries Biology. A Study in Population Dynamics.' 2nd Ed. University of Wisconsin Press, Madison and London. 295 pp.
CUSHING, D.H. and BRIDGER, J.P., 1966. The stock of herring in the North Sea and changes due to fishing. Fishery Invest., Lond., Ser. 2,25: 1-12?,
CUSHING, J.E., 1952. Serological differentiation of fish bloods. Science, N.Y., 115: 404-405.
DAAN, N . , 1978. Changes in cod stocks and cod fisheries in the North Sea. Rapp. P.-v. Reun. Cons. int. Explor. Mer, 172: 39-57.
DAMAS, D . , 1909. Contribution a la biologie des GadidCs. Rapp. P.-v. Reun. Cons. int. Explor. Mer, 10: 1-277.
DANDO, P.R., 1974. Distribution of multiple glucose phosphate isomerases in teleostean fishes. Comp. Biochem. Physiol., 47B: 663-679.
DAWSON, W.A., 1983. A preliminary analysis of mackerel (Scomber scornbrus L.) otolith (LI) measurements. ICES CM 1983/H:29,6 pp. (mimeo).
DAY, F., 1880-1884. 'The Fishes of Great Britain and Ireland. Vol. I.' Williams and Norgate, London, 336 pp + plates.
GRAHAM, M , , CARRUTHERS, J.N. and GOODCHILD, H.H. ,1925. The distribution of pelagic stages of the cod in the North Sea in 1924 in relation to the system of currents. Fishery Invest., Lond.. Ser. 2,8(6): 1-31.

HARRIS, H. and HOPKINSON, D.A., 1976. 'Handbook of Enzyme Electrophoresis in Human Genetics.' North Holland Pub. CO, Amsterdam, pag. var.
HISLOP, J.R.G. and MACKENZIE, K., 1976. Population studies of the whiting Merlangius rnerlangus (L.) of the northern North Sea. J. Cons. int. Explor. Mer, 37: 98-1 10.
HOLDEN, M. J., 1960. Evidence of cod (Gadus morhua L.) migrations from the Norway coast to the Faroese Island. J . Cons. int. Explor. Mer, 26: 68-72.
HOLDEN, M.J. and RAITT, D.F.S., 1974. Manual of fisheries science, Part 2. FAO Fish. Tech. Pap, (1 15): 1-21 4.
JAMIESON, A. , 1970. Cod transferrins and genetic isolates. pp. 533-538. In: 'Proc. XI. Eur. Conf. on Animal Blood Groups and Biochemical Polymorphism, Warsaw, 1968.' Dr. W. Junk, The HagueIPWN, Warsaw, 607 pp.
JAMIESON, A., 1974. Genetic tags for marine fish stocks. pp. 91-99 In: 'Sea Fisheries Research', edited by F.R. Harden Jones. Elek Science, London, 510 pp.
JAMIESON, A., 1975. Enzyme types of Atlantic cod stocks on the North American banks. pp. 491-515. In: 'Isozymes. IV. Genetics and Evolution'. edited by C.L. Markert. Academic Press, New York and London, 965 pp.
JAMIESON, A. and THOMPSON, D., 1972(a). Blood proteins in North Sea cod. pp. 585-591. In: 'Proc. XI1 Eur. Conf. on Animal Blood Groups and Biochemical Polymorphism, Budapest, 1970'. edited by G. Kovacs and M. Papp. Dr. W. Junk, The Hague, 686 pp.
JAMIESON, A. and THOMPSON, D. , 1972(b). Butyric esterase differences in Atlantic cod (Gadus morhua L.). ALES CM 1972/F:32,5 pp. (mimeo).
KABATA, Z., 1958. The invisible enemies. 111. Note on parasites of fish. Scott. Fish. Bull., 10: 20-22.
KABATA, Z., 1967. Whiting stocks and their gall-bladder parasites in British waters. Mar. Res., 1967(2): 1-1 1.
de LIGNY, W., 1971. Special Meeting on the Biochemical and Serological Identifications of Fish Stocks, Dublin, 1969. Rapp. P.-v. Reun. Cons. int. Explor. Mer, 161: 1-179.
LUSH, I. E., 1970. Lactate dehydrogenase isoenzyrnes and their genetic variation in coalfish (Gadus virens) and cod (Gacius morhua). Comp. Biochem. Physiol., 32: 23-32.
MARR, J.C. and SPRAGUE, L.M., 1963. The use of blood group characteristics in studying sub-populations of fishes. Spec. Publ. int. Comm. N.W. Atlant. Fish., (4): 308-313.
ODENSE, P.H.. LEUNG, T.C. ALLEN T.M. and PARKER. E.. 1969. Multiple forms of lactate dehydrogenase in cod Gadus morhua L. Biochem. Genet., 3: 317-334.
ODENSE, P.H., LEIJNG, T.C. and MACDOUGALL, Y .M, . 1971. Polymorphism of lactate dehydrogenase (LDN) in some gadoid species. Rapp. P.-v. Rkun. Cons. int. Explor. Mer, 161: 75-79.
ODENSE, P.H. and LEUNG, T.C., 1975. Isoelectric focusing on polyacrylamide gel and starch gel electrophoresis of some gadiform fish lacate dehydrogenase EC 1.1.1.27 isozymes. pp. 485-501. In: 'Isozymes. 111. Developmental Biology', edited by C.L. Markert, Academic Press, New York and London, 1034 pp.
PARRISH, B.B., 1964. Notes on the identification of sub- populations of fish by serological and biochemical methods, the status of techniques and problems of their future application. FAO Fish. Biol. Tech. Pap., (30): 1-9.
RIDGWAY, G.J., SHERBURNE, S. W. and LEWIS, R.D., 1970. Polymorphism in the esterases of Atlantic herring. Trans. Am. Fish. Soc. Y9: 147-15 1.
ROLLEFSEN, G., 1934. The cod otolith as a guide to race, sexual development and mortality. Rapp. P.-v. RCun. Cons. perm. int. Explor. Mer, 88(2): 5 pp.
SCHMIDT, J., 1930. The Atlantic cod, (Gndus callian1.5 l, ) and local races of the same. C. r. Lab. Carlsberg, XVlIl ( h ) : 1 -
SICK, K., 1961 (a). Haemoglobin polymorphism in whir ing and cod. ICES CM 1961. Paper No. 128,s pp. (mimeo).
SICK, K. , 1961(b). Haemoglobin polymorphism in fishes. Nature Lond., 192: 894-896.
SICK. K. , 1965. Haemoglobin polymorphisni of cod in the North Sea and the North Atlantic Ocean. Hereditas, 53: 49- 73.
TROUT, G.C., 1957. The Bear Island cod: migrations and movements. Fishery Invest., Lond., Ser. 2,21: 1-51.
TURNER, V.S. and HOPKINSON, D.A., 1979. Thc use of Meldola Blue in isozyme stains after electrophoresis. FEBS Letts., 105: 376-378.
YARREL, W., 1836. "A History of British Fishes. Vol. 11." John van Voorst, London, 472 pp.