
FISHERIES REGIONAL AND OTHER ASPECTS ... - … · CONTENTS Page Introduction 1 Scopeoftheanalysis 2...
30
A UNITED STATES DEPARTMENT OF COMMERCE PUBLICATION V U.S. DEPARTMENT OF COMMERCE NATIONAL OCEANIC AND ATMOSPHERIC ADMINISTRATION NATIONAL MARINE FISHERIES SERVICE REGIONAL AND OTHER RELATED ASPECTS OF SHELLFISH CONSUMPTION Some Preliminary Findings From the 1969 Consumer Panel Survey Marine Biological Laboratory LIBRARY AUG 9 1971 WOODS HOLE, MASS.
Transcript of FISHERIES REGIONAL AND OTHER ASPECTS ... - … · CONTENTS Page Introduction 1 Scopeoftheanalysis 2...
A UNITED STATES
DEPARTMENT OF
COMMERCEPUBLICATION
V U.S. DEPARTMENT OF COMMERCENATIONAL OCEANIC AND ATMOSPHERIC ADMINISTRATION
NATIONAL MARINE FISHERIES SERVICE
REGIONAL ANDOTHER RELATED ASPECTS OFSHELLFISH CONSUMPTION
Some Preliminary Findings
From the
1969 Consumer Panel Survey
Marine Biological LaboratoryLIBRARYAUG 9 1971
WOODS HOLE, MASS.

UNITED STATES DEPARTMENT OF COMMERCEMaurice H. Stans, Secretary
NATIONAL OCEANIC AND ATMOSPHERIC ADMINISTRATION
Dr. Robert M. White, Adminisiralor
NATIONAL MARINE FISHERIES SERVICE
Philip M. Roedel, Diredor
Regional and Other Related Aspects of
Shellfish Consumption -- Some Preliminary Findings
From the 1969 Consumer Panel Survey
By
MORTON M. MILLER
and
BARREL A. NASH
Circular 361
Seattle, Washington
June 1971


CONTENTS
Page
Introduction 1
Scope of the analysis 2
Geographic concentration and distribution patterns 2
Oysters 3
Clams 4
Crabs 5
Lobsters 6
Shrimp 7
Scallops 7
Lobster tails 8
Recap 8
Seasonality factors 9
Consumption at home and away from home 10
Relationship between income and consumption 11
Effects of age on consumer preference 13
Acknowledgment 13
Technical note 13
Literature cited 14
Appendices 15
1. Geographic divisions of the United States and distribution ofsurvey sample 15
2. Estimated at-home consumption of shellfish, finfish, and cannedfish by region. Population data from Bureau of the Census .... 16
3. Regional supplies and distribution of oysters 17
4. Regional supplies and distribution of clams 17
5. Regional supplies and distribution of crabs 17
6. Survey panel consumption and monthly index of consumption ofshrimp, oysters, crabs, clams, and scallops 17
7. Consumer panel consumption of fresh and frozen clams, crabs,and oysters at home and away from home 18
8. Consumption at home and away from home, by survey panel:shrimp, lobster, halibut, haddock, and flounder 18
9. Consumption per household by household income group for se-
lected species 18
10. Per capita consumption by household income group for selected
species 18
ui

FIGURES
Page
1. Reg-ional distribution of total shellfish consumption (at home) andpopulation. 1969. Source: Appendix 2 2
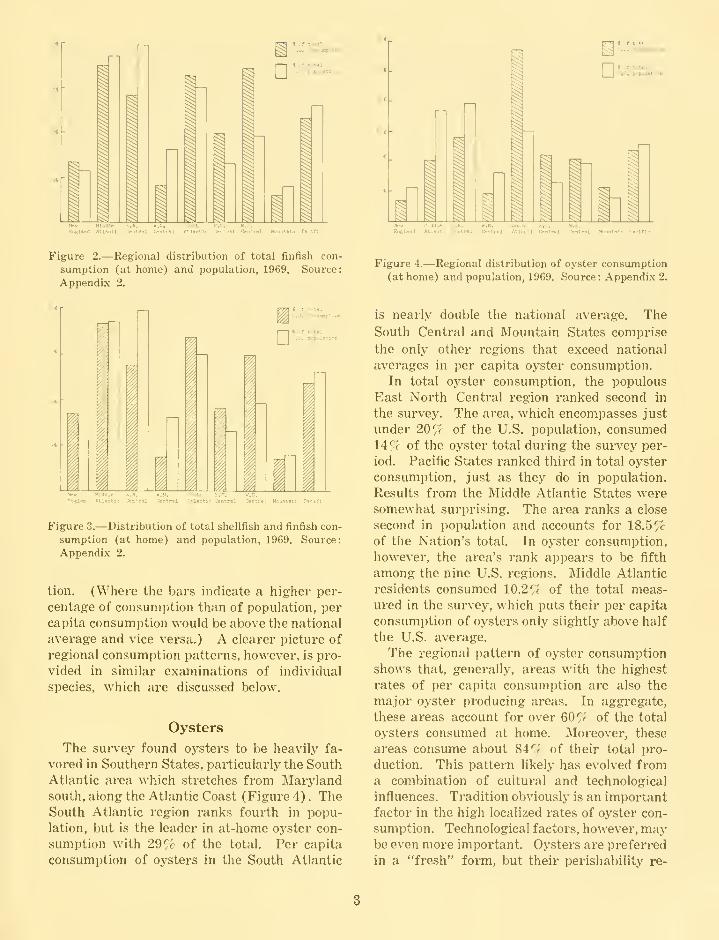
2. Regional distribution of total finfish consumption (at home) andpopulation, 1969. Source: Appendix 2 3
3. Distribution of total shellfish and finfish consumption (at home) andpopulation, 1969. Source: Appendix 2 3
4. Regional distribution of oyster consumption (at home) and popu-lation, 1969. Source: Appendix 2 3
5. Regional supplies and distribution of oysters. Source: Appendix 3 . 4
6. Regional distribution of clam consumption (at home) and popula-
tion, 1969. Source: Appendix 2 4
7. Regional supplies and distribution of clams. Source: Appendix 4 . . 5
8. Regional distribution of crab consumption (at home) and popu-lation, 1969. Source: Appendix 2 6
9. Regional sui^plies and distribution of crabs. Source: Appendix 5 . . . 6
10. Regional distribution of lobster consumption (at home) and popula-
tion, 1969 6
11. Regional distribution of shrimp consumption (at home) and popula-
tion, 1969 V
12. Regional distribution of scallop consumption (at home) and popula-
tion, 1969 8
13. Regional distribution of lobster tail consumption (at home) andpopulation, 1969 8
14. Monthly index of survey panel consumption of oysters, crabs, andclams 9
1.5. Monthly index of survey panel consumption of shrimp and scallops 10
16. Consumption at home and away, by survey panel: clams, crabs,
and oysters 10
17. Consumption at home and away, by survey panel: shrimp, lobster,
halibut, haddock, and flounder 11
18. Per capita consumj^tion by household income group: crabs, clams,
oysters, and shrimp. Source: Appendix 9 12
19. Consumption per household by household income group: crabs,
clams, oysters, and shrimp. Source: Appendix 10 12
20. Per capita consumption by household income group: scallops, ocean
perch, and light tuna. Source: Appendix 9 12
21. Consumption per household by household income group: scallops,
ocean perch, and light tuna. Source: Appendix 10 12
TABLES
Page
1. Regional ranking in at-home consumption of fishery products, and in
population 9
2. Percent of total U.S. seafood consumption by household income, 1969 11
3. Percentage distribution of seafood consumption at home by age of
household head 13
IV

Regional and Other Related Aspects of Shellfish Consumption-
Some Preliminary Findings
From the 1969 Consumer Panel Survey
By
MORTON M. MILLER and BARREL A. NASH, Economists
National Marine Fisheries Service, Division of Economic ResearchCollege Park, Md. 20740
ABSTRACT
A consumer survey panel, consisting of representative households through-
out the United States, recorded their fishery product purchases for a 12-monthperiod, beginning in February 1969. They were participants in a study conducted
under the aegis of the National Marine Fisheries Service, Division of EconomicResearch. This paper deals mainly with study findings respecting the consump-tion of major species of shellfish, at home and away from home.
Findings of the study indicate marked regional preferences for individual
shellfish items. For example, oysters are consumed in South Atlantic States at
nearly double the national per capita rate. Similarly, clams enjoy a high rate
of consumption in Middle Atlantic and New England areas. All of which sug-
gests an important correlation between consumption and tradition as well as a per-
sistent tendency for seafood varieties, particularly those consumed in a "fresh"
form, to be consumed in the area of catch.
The study also indicated an association between high income households andshellfish consumption, with oysters a single notable exception. Age of consumer,
too, has an apparent bearing on shellfish consumption as it was found that older
consumers are the more disposed toward consumption of these products.
With respect to consumption away from home, it appears that half or moreof the crabs and lobsters are consumed in meals outside the home, but the major-
ity consumed of other products was at home.
INTRODUCTIONThis paper reviews several key areas of in-
formation yielded in an extensive survey of
consumer purchases of fishery products during
1969. The survey was conducted under the
auspices of the National Marine Fisheries
Service and represents a major effort by Ser-
vice economists to resolve, at least partially,
previously unanswered questions regarding the
consumption of fish and shellfish. The results
of the survey can be developed into useful
guidelines for industry decisions, especially in
marketing. Also the results can greatly en-
hance the accuracy of forecasting future eco-
nomic events in the fishing industry.
It is difficult to overstate the importance of
building on our knowledge of consumer be-
havior. Consumers in a market economy are

the inevitable arbiters of what and how much
will be produced. Meticulous production sched-
ules and faultless distribution mechanics can
become expensive exercises in the face of con-
sumer aloofness. In Marshallian terms, the
consumer is the regulator of all demands, his
yeas and nays expressed convincingly in his
mode of allocating limited funds.
Marketing problems represent, in large part,
an encounter with "consumerism," i.e. the de-
cision-making process undertaken by consu-
mers in their acts of purchasing. Consumer
actions (or reactions) characteristically defy
prediction, however, and render the best of
marketing strategies uncertain. New products
introduced by food companies, for example,
have less than a one in four chance of success.
Nonetheless there are discernible patterns in
consumer behavior. Studies have established
reasonable inferences that prices, size of in-
come, ethnic origin, age, and other demographic
variables influence consumption of food prod-
ucts. The present survey was designed to test
the applicability of these inferences to fish
product consumption.
The survey's approach was direct. Members
of a representative consumer panel, consisting
of 1,500 households throughout the United
States, logged the details of their fish product
purchases for a 12-month period, February
1969 to January 1970. Essential character-
istics of each household were known — income,
ages, etc. — making it possible to arrange the
data for intergroup comparisons and for ex-
amination for evidence of relationships be-
tween various demographic characteristics and
fish consumiition. The Service recognizes that
knowledge of these relationshii)s is a prereq-
uisite to the formulation of successful market-
ing strategies and accurate forecasting.
SCOPE OF THE ANALYSIS
The focus of this paper is on certain char-
acteristics of shellfish consumption. Major
shellfish species are covered in the analysis as
well as other seafood varieties where compar-
isons are relevant. Five aspects of consumption
are examined: (1) geographic concentration
and distribution patterns, (2) seasonality fact-
ors, (3) comparisons between volumes con-
sumed at home and away from home, (4) re-
lationships between size of income and volume
consumed, and (5) effects of age on consumer
preferences.
The analysis touches only highlights of the
survey. Nonetheless, these reveal several im-
portant characteristics of fishery product con-
sumption in the United States. These are dis-
cussed under the five above-noted topic
headings.
GEOGRAPHIC CONCENTRATIONAND DISTRIBUTION PATTERNS'
The survey revealed marked regional differ-
ences in apparent consumer preferences for
fishery products. Shellfish varieties, for ex-
amijle, are highly popular in New England
where per capita at-home consumption is more
than double the U.S. average. The per capita
rate of finfish consumption in New England,
however, is not much above the national aver-
age (Appendix 2) . In the West South Central
States the reverse is true. ' While the area's
per capita rate of finfish consumption tops the
national average by 15'^f, the shellfish con-
sumption rate is below average. The picture
in the North Central States is again different.
There, per capita consumption of both fish and
shellfish are well below national averages.
The above examples are indicative of the re-
gional contrasts in aggregate fish and shellfish
consumption in the United States. These con-
trasts are illustrated in Figures 1, 2, and 3,
which relate consumption to regional popula-
See Appendix 1 for geographic divisions.
j U.S. coMiaptloa
$
§:
§
SoftU.S.,
^."p.glBnd AlUnllC 0«oir«l Crntral Ati»rHlc i>n!r»>l Cer.tml ltl.t.1 lB.MfK
Figure 1.—Regional distribution of total shellfish con-
sumption (at home) and population, 1969. Source:
Appendix 2.
* of Wt«lU.S. coniuoptloa
Di or wtBi'-.S. jicpulattoi
iIU.S. «on*uBptloci
D i of totalU.S. popuiMtlOD
i
I
i
§
^ i
t^ I t^ I K3 _h£<; LJisl I H^ l_tii
Central Mountoln P«ctflc
Figure 2.—Regional distribution of total finfish con-
sumption (at home) and population, 1969. Source:
Appendix 2.
Figure 4.—Regional distribution of oyster consumption
(at home) and population, 1969. Source: Appendix 2.
I
1 * Qf total
j U.S. <;onBUBptlon
1
1
D« of totalU.S. populatlM
r
r
i
i
I 1A-.:a^.;!r >n-r5l
Figure 3.—Distribution of total shellfish and finfish con-
sumption (at home) and population, 1969. Source:
Appendix 2.
tion. (Where the bars indicate a higher per-
centage of consumption than of population, per
capita consumption would be above the national
average and vice versa.) A clearer picture of
regional consumption patterns, however, is pro-
vided in similar examinations of individual
species, which are discussed below.
Oysters
The survey found oysters to be heavily fa-
vored in Southern States, particularly the SouthAtlantic area which stretches from Marylandsouth, along the Atlantic Coast (Figure 4) . TheSouth Atlantic region ranks fourth in popu-
lation, but is the leader in at-home oyster con-
sumption with 29% of the total. Per capita
consumption of oysters in the South Atlantic
is nearly double the national average. The
South Central and Mountain States comprise
the only other regions that exceed national
averages in per capita oyster consumption.
In total oyster consumption, the populous
East North Central region ranked second in
the survey. The area, which encompasses just
under 20% of the U.S. population, consumed14% of the oyster total during the survey per-
iod. Pacific States ranked third in total oyster
consumption, just as they do in population.
Results from the Middle Atlantic States weresomewhat surprising. The area ranks a close
second in population and accounts for 18.5%of the Nation's total. In oyster consumption,
however, the area's rank appears to be fifth
among the nine U.S. regions. Middle Atlantic
residents consumed 10.2% of the total meas-
ured in the survey, which puts their per capita
consumption of oysters only slightly above half
the U.S. average.
The regional pattern of oyster consumption
shows that, generally, areas with the highest
rates of per capita consumption are also the
major oyster producing areas. In aggregate,
these areas account for over 60% of the total
oysters consumed at home. Moreover, these
areas consume about 84 '^< of their total pro-
duction. This pattern likely has evolved froma combination of cultural and technological
influences. Tradition obviously is an important
factor in the high localized rates of oyster con-
sumption. Technological factors, however, maybe even more important. Oysters are i^referred
in a "fresh" form, but their perishability re-

duces incentive to market output at distant
points. Aside from the high risk of spoilage,
producers and distributors in many instances
face the obstacle of being inaccessible to de-
pendable shipping channels.
Oysters, are, nonetheless, consumed in all
regions in the United States. As noted in Fig-
ure 5, only two regions — the South Atlantic
and West South Central — are completely self-
sufficient in the product. The surplus from
these regions thus moves in trade to the sev-
eral other regions which rely on inshipments
of oysters to satisfy demand. The shaded areas
of the left scale of Figure 5 denote the quantity
of inshipments, by region, including foreign
imports, and the unshaded areas indicate the
quantity produced within the region. On the
right-hand scale of Figure 5, shaded areas in-
DISTRIBUTION
IKSHIPMQITS H Oin-SHIPMENTS
Q LAKDINCS CONSUMPTION*
* Total contuiDptLon - at hutne and away
Figure 5.—Regional supplies and distribution of
oysters. Source: Appendix 3.
dicate outshipments of the product within the
region; the light areas show regional con-
sumption.
There is, it appears, a national market for
oysters. However, regions outside the produc-
ing areas consume less than their proportional
share of output (based on population) and can
be categorized as underdeveloped markets.
The existence of underdeveloped market
areas for oysters implies fertile ground for
future market expansion, assuming, of course,
adequate resource availability. The fact that
consumption rates are already high in the pro-
ducing areas further implies that successful
expansion of the industry will be linked closely
with the development of the distant markets.
The price effects of placing substantially in-
creased supplies in local markets could be
disastrously adverse.
It is not unlikely that aggressive marketing
development in the underdeveloped market
areas would produce advantages under the
present scales of oyster production. These
markets are in the high income, densely pop-
ulated regions of the United States, which in-
dicates a potential for marketing large quanti-
ties of oysters at prices more favorable than
those received in local markets. There are,
moreover, additional advantages to the regional
economy that would come about through a shift
in oyster marketing efforts toward more in-
terregional trade. These include the value of
such services as long-haul transportation per-
formed by regional firms in the export activity
for the local oyster industry.
Clams
It is apparent that clam markets are highly
concentrated in three regions— New England,
Middle Atlantic, and Pacific — where, in ag-
gregate, STf of the U.S. population consumes
about 85 Sc of the national total.
n:
s
M J I -I i .^ ^Hrw Kiaalf C.ir. W.H. SouUi B.C. w.s.
fntlfDi All»ntlc C*ntr>l 0»nlr«l AlIwUc C»ntr«l Oer.tr«l Howitatn Pacific
Figure 6.—Regional distribution of clam consumption
(at home) and population, 1969. Source: Appendix 2.

Clams exemplify the influence of tradition in
fishery product consumption. Per capita con-
sumption of clams in New En<?iand, it appears,
is close to nine times the national average, and
the region accounts for over 50 ^r of clam
products (from all species) consumed at home(Figure 6) . New England, however, no longer
is a leading clam-producing area and must de-
pend on other regions for over 80 ^r of its
supplies.
Outside of New England, clam products are
consumed chiefly in the Middle Atlantic and
Pacific regions. The two account, respectively,
for 18% and 16% of U.S. clam consumption,
and the per capita rate of consumption in both
areas is close to the U.S. average. In all other
regions, per capita consumption of clams is
less than half the national average.
Unlike the situation for oysters, the major
clam-producing areas are net exporters of the
product (Figure 7). The Middle Atlantic re-
SUPPLIES
(Million pounds)
4u 2
n™ E IGLAUD
W. N. C: UTRAL
E. N. ramEAL
DISTRIBUTION
(Million pounds)
20 40"T~
Q INSHIPMENTS
[~| LANDINGS
* Total consumption - at home and away
DOin-SHIPMENTS
CONSUMPTION*
Figure 7.—Regional supplies and distribution of clams.
Source: Appendix 4.
gion accounts for over 75% of the quantity of
clams landed in the United States, but 3 out
of every 4 lb. landed in the area are shipped
to other regions, chiefly for consumption in
New England and on the U.S. West Coast.
The South Atlantic area ranks behind the Mid-
dle Atlantic in clam production and exports
over half of what it produces. (Clam produc-
tion in the South Atlantic is concentrated heav-
ily in the Chesapeake area.)
The reason why clam consumption is ex-
tremely low throughout the central regions of
the United States cannot be found in the nature
of the product. Over 60'/r of the clam harvest
consists of surf clams that are further pro-
cessed into frozen or canned products. Thus,
there are few preservation or other technical
problems that would tend to set geographic
market limits. The relatively high rate of
consumption on the West Coast bears this out.
What is likely reflected here is the limitation
with respect to the clam resource. Producers
simply have not been confronted with a supply
situation that required a broader market base.
In any event, if discovery of new resource areas
led to substantially heavier catches, there ap-
pears to be a high potential for marketing in-
creases in supplies.
Crabs
There is a heavy concentration of crab con-
sumption in the Pacific Coast States. The area
accounts for over 40% of crabs consumed at
home in the United States, and the per capita
rate is better than three times the national
average. Consumption in the Pacific States
consists chiefly of king and dungeness crabs,
which are products of the Northwest Pacific
States and Alaska. The indications are that
the region consumes over three-fourths of its
output of king and dungeness crabs and the
remainder goes into interregional trade.
Outside the Pacific region, the volume of
crabs consumed is shared almost entirely by
six regions, roughly in proportion to area pop-
ulations; that is, per capita consumption in
each approximates the national average. In
the two remaining regions, which are the East
and West North Central, crabs apparently are
not consumed in significant quantity.
The regional distribution of crab consump-
tion (at home) is illustrated in Figure 8, where
it is shown that the one-two-three order of total
consumption is Pacific, South Atlantic, and

I
i or touiU.S. ccoMapUoo
D i or totalU,B. populatlcn
§
§
§
M ^ m^*" kiaaie E.M. W.H. south E.3. M.S.
Eael«o4 Aclantlf Central OnCral Atlantic Central Central Mountain Pacific
Figure 8.—Regional distribution of crab consumption
(at home) and population, 1969. Source: Appendix 2.
Middle Atlantic. The South Atlantic and East
South Central regions are the only regions
other than the Pacific that account for some-
thing more than their proportional shares of
crab consumption. The excess is moderate, but
does indicate a localized consumption pattern
inasmuch as the South Atlantic and East South
Central States are major producers of blue
crabs. The South Atlantic States apparently
consume about 60% of their output, while the
East and West South Central States utilize
their entire output plus imports from other
areas (Figure 9).
The catch of king crabs in 1969 was espe-
cially low, which probably accounts for the
large proportion of total supplies apparently
consumed in the Pacific area. In years of high
output, it is not unlikely that larger quantities
would be shipped out-of-region. The product
is marketed in frozen form and presents fewshipping and storage problems. Obviously the
local market for the product is attractive to
producers. This could mean that interregional
trade in Pacific crabs would suflfer nearly the
full impact of further declines in king crab
production.
Lobsters
New England households, according to the
survey, account for nearly two-thirds of lob-
sters purchased for consumption at home. Mostof the remaining one-third of lobster purchases
are made in the Middle Atlantic and SouthAtlantic regions (Figure 10). Consumption
(Hlllion pounds)
2'.' 15 10
DisritiDvnoN
(HI 11 Ion pounds)
"T" "T-SEW E fCLAHD
MIDDLE iHAKTlC
Illlilll Hl f K IIIP
E. N. CptTKAl.
U. N. C 3[TRAL
II
SOUTH AT .ANTIC
^. S. CJiJKJd.
W. S, C:JJTRAL
g INSHIPHDaS
I I
LANDINGS
*Total Consumption - at home and away
I^OUTSHIPMOfTS
[—] CONSUMPTION*
Figure 9.—Regional supplies and distribution of crabs.
Source: Appendix 5.
D
Ii of total
I U.S. coasuaptlea
i oT totalU.S. popuUtlcf
M Jl ^ .^iH
Figure 10.-—Regional distribution of lobster consump-tion (at home) and population, 1969.
in all other regions is insignificant, with the
exception of the East South Central area, whichaccounts for just under 5^'c of the total. Thefigures represent fresh lobster and consist
chiefly of northern lobster. It is likely, how-ever, that some of the quantity attributed to
the southern area States represents local spiny
lobster.

New England's predominance in at-home
lobster consumption reflects the difliculties and
high cost of shipping live lobster from the pro-
ducing areas. Tradition, of course, insures
a strong local market for limited supplies of
northern lobster. It should be noted, however,
that the survey also revealed that home con-
sumption of lobsters represents only 40 ^r of
the total quantity consumed in the United
States. Thus, with restaurant consumption
taken into account, the regional distribution
may not favor the New England area quite so
heavily. Nonetheless, the important inference
to be drawn from the at-home consumption dis-
tribution is that out-of-area retailers are re-
luctant to assume the risks of marketing live
lobsters, which are highly perishable, outside
their normal environment. Consequently, in
the event that lobster production should be
increased, and this is a possibility with deep-
sea lobster fishing, improved ways of handling
lobsters will be needed to enhance retailers' dis-
positions toward marketing the product.
Shrimp
Shrimp products, which are marketed mostly
in frozen form, have a fairly even distribution
among the regions of the United States (Fig-
ure 11). With a single exception, no region's
i of tctBlU.S. consuaptloi
D * or totalU.S. populAtloi
HountBip Fteltic
Figure 11.—Regional distribution of shrimp consump-tion (at home) and population, 1969.
per capita consumption of shrimp eaten at homevaries more than 32 ""r from the national aver-
age. Four regions are above average in per
capita consumption; one is approximately av-
erage; and four are below average.
The Middle Atlantic States account for 24%of the total at-home consumption and rank first
in this respect. Per capita consumption in the
Middle Atlantic States is about 29 /r above the
national average. The South Atlantic States
follow in total consumption with 19% of the
total, and the East North Central States are
third with 15^/ of the total.
In the South Atlantic States the per capita
consumption is about ZS^'r above the U.S. av-
erage, whereas in the East North Central States
the per capita consumption is 26% below the
national average. Shrimp are also consumedin quantity in the West South Central States.
In that area, per capita consumption tops the
national average by 50^ f.
Heavy shrimp consumption in the South At-
lantic and South Central States is indicative
of the tendency for seafood products to be con-
sumed largely in their area of catch. Shrimp,
though, lend themselves to preservation and
packaging techniques that assure quality main-
tenance in long-distance shipping. Thus, there
is an effective nationwide marketing network
for shrimp products. The Mountain area
States, for example, have a high per capita rate
of consumption, although they are located at
relatively long distances from the producing
areas.
The universality of shrimp consumption in-
dicates little need for concentrated market de-
velopment strategies. By the same token, the
firmly entrenched competitive position of
shrimp throughout the regions of the United
States is a factor to be taken into account in
the marketing of other seafoods. In any event,
the geographic distribution pattern of shrimp
consumption illustrates the favorable possibil-
ities for seafoods that are suitably processed
and packaged to undergo long-distance distri-
bution.
Scallops
Scallops, like shrimp, adapt well to freezing
techniques and can be marketed with consistent
quality in distant markets. However, the geo-
graphic distribution of at-home consumption
indicates a heavy preference for scallops in the
New England and Middle Atlantic regions and
a low rate of consumption in the Central and

Southern portions of the United States (Figure
12). The New England and Middle Atlantic
D5
M .Bl M>n*.™l C*-:'
Figfure 12.-—Regional distribution of scallop consump-
tion (at home) and population, 1969.
States account for nearly half of the scallops
consumed at home, but include only about one-
fourth of the U.S. population. Consumption
in the South Atlantic States is less than pro-
portional to the area's population, and the sameis true for the North Central region, although
in total quantity consumed, the North Central
region ranks in third place behind the Middle
Atlantic and New England. The South Central
regions (East and West) along with the WestNorth Central area consume less than Z^'c of
total scallops purchased for use at home, al-
though the areas have about one-fourth of the
U.S. population.
Most of the U.S. catch of scallops is landed
at New England ports, and there is an active
local market for what is produced. Local
marketings likely consist in large part of fresh
(that is not frozen) scallops which have be-
come a traditional favorite in New England.
The proximity of the Middle Atlantic States to
the major producing areas helps to explain the
l)opularity of scallops in the area.
The easy adaptability of scallops to process-
ing as a frozen product is born out especially
by the high rate of consumption in the Mountain
area States, where the per capita rate is over
two and a half times the U.S. average. Sig-
nificant quantities of scallops are also con-
sumed in the Pacific area, which ranks fourth
in total consumption.
Lobster Tails
Frozen lobster tails, which are mostly foreignimports, are consumed most heavily in the Mid-dle Atlantic region. Per capita consumptionof lobster tails in the Middle Atlantic is 1.6
times the U.S. average for at-home consump-tion, and the area accounts for 29 ^'f of the total
consumed in the United States. The East NorthCentral States consumed 27 ':r of the U.S. total,
and their per capita rate is about 1.4 times the
national average. The East South Central re-
gion also is a major market for lobster tails
and accounts for Wr of the total consumedat home (Figure 13).
I( of total
IU.S. ccosiaptlOB
§ M
D t of totalU.S. popuLttla
M ^ mItov Kiddie l^.K. V.n. oc^lh E.S. W.S.
Sanland AUontlc Ontrol Crntml Atlifitlo Cvatral >iitr*L Mc^iau P»;inc
Figure 13.—Regional distribution of lobster tail con-
sumption (at home) and population, 1969.
Not surprisingly, consumption of frozen lob-
ster tails is low in New England, what with
the availability of local supplies of northern
lobsters. Consumption also is low (almost in-
significant) in the West Central States, both
North and South. Beyond this belt, however,
lobster tail consumjjtion picks up considerably,
and in the Mountain areas the per capita rate
is 1.5 times the national average. There are
also significant quantities consumed in the Pa-
cific States which account for 8^'f of the U.S.
total although the per capita rate in that area
is only 61 "Tr of the national average.
Recap
To recapitulate some of the findings regard-
ing geographic distribution of fishery product
consumption, it is useful to compare regional
rankings. These comjjarisons are shown in
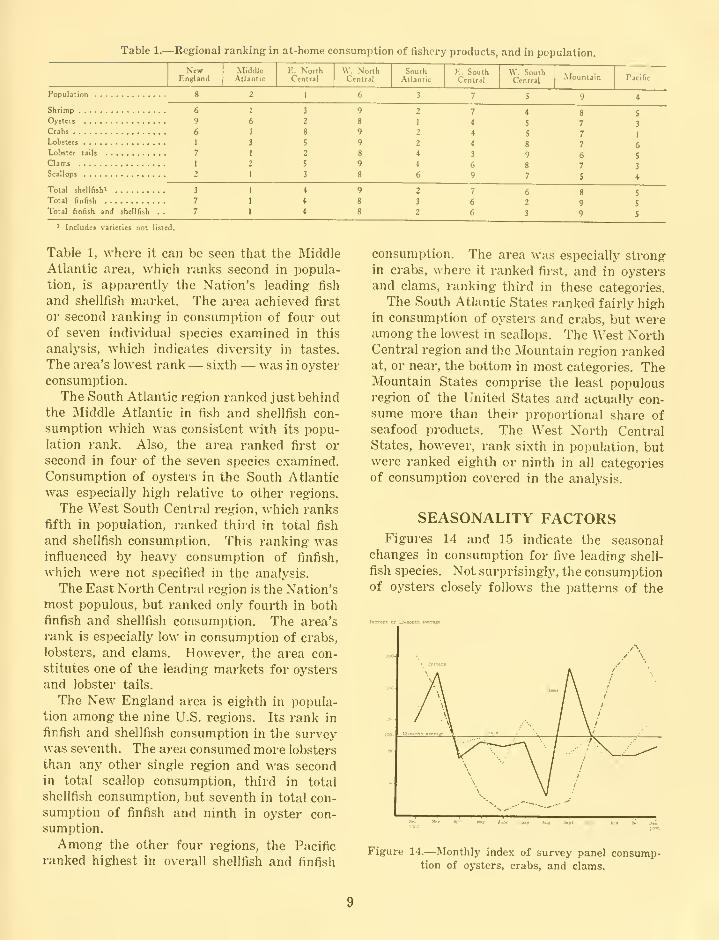
Table 1.—Regional ranking in at-home consumption of fishery products, and in population.

Figure 15.—Monthly index of survey panel consump-
tion of shrimp and scallops.
"R" months, when most of the catch is landed.
This reflects the fact that oysters are consumed
chiefly in the "fresh" form. Consumption of
clams also shows wide seasonal swings, which
complement to a degree the changes in oyster
consumption. This suggests the probability
of substitution between products. For example,
consumption of both oysters and clams drops
sharply from March to April. At this point
clam consumption rises while oyster consump-
tion continues to fall. Clam consumption is
steady through the early summer months (al-
though below winter levels), but rises sharply
during August. From September onward clam
consumption drops as oyster consumption
climbs sharply.
Crab consumption varies from month to
month, but not to the degree exhibited by oys-
ters and clams. Crab consumption apparently
has a summer peak in July and a winter peak
in January-February.
Month-to-month variations in both scallop
and shrimp consumption appear slight in con-
trast to the wide seasonal swings in crabs,
clams, and oysters. The picture here for scal-
lops and shrimp is a winter i)eak with a steady
tapering off beginning in March and lasting
through November. The relatively smooth
seasonality of consumption of scallops and
shrimp reflects the availability of year-round
supplies from both current catch and inven-
tories.
CONSUMPTION AT HOME ANDAWAY FROM HOME
The survey covered the question of the
quantities of seafood consumed away from
home. Although the answers were not as pre-
cise as would be desired, they did give some in-
dication of the proportions of fishery i)roducts
distributed through retail stores and through
institutional outlets — restaurants, etc." (Fig-
ures 16 and 17).
(Pounds)
1 .000 750 500 250
I1 1 r
(Psundt)
250 500 750 1 ,000
^m
Figure 16.—Consumption at home and away, by survey
panel: clams, crabs, and oysters.
Wide variations were found among the spe-
cies examined in the breakdown between at-
home and away-from-home consumption. It
appeared, however, that proportionally more
shellfish meals are consumed outside the homethan finfish. Lobsters and clams, for example,
appeared more likely to be consumed away from
home than other varieties examined. The sur-
vey indicated that 59 ''r of lobster consumption
and 48 'r of clam consumption occur away from
home. Consumption of shrimp and oysters out-
side the home accounts, respectively, for 21%and 19 "^Y of the total consumption of each.
Fewer crabs proportionally — 9''r — are eaten
away from home than other species. Among
* The question regarding consumption away fromhome was cast in terms of number of meals. It wasthus necessary to transform the number of meals eaten
away from home into pounds, which was done byassuming average cooked portions in the neighborhoodof .'! oz. This figure was obtained from the U.S. De-partment of .\griculture study of portion sizes served
in institutional outlets (Peterkin and Evans, 1965).
10

(Pounds)
t., .inri l.niw ? .nnnI ,;mi)
(Founds)
1,000 2,000 3.000 4,000 5,000
Figure 17.—Consumption at home and away, by survey
panel: shrimp, lobster, halibut, haddock, and
flounder.
the finfish examined, it was found that the pro-
portion of halibut and flounder consumed awayfrom home was 11 '^r in each case, while 7%of haddock was consumed outside the home.
The above estimates are the result of pre-
liminary considerations of the data in the sur-
vey. Further study in this direction is in-
tended. It should be noted, however, that the
finding's are not inconsistent with the results of
a 1965 survey of food consumption conducted
by the U.S. Department of Agriculture (Le-
Bovit, 1970) . In that survey it was found that,
overall, about 20% of fish product consump-
tion occurred away from home. The aver-
age from the present survey appears to be
slightly lower. Possibly these estimates will
evoke surprise from domestic producers of
certain seafood products who are accustomed
to marketing 40% or more of their output to
the institutional trade, which appears to be
the case for shrimp and finfish portions. Withthis in mind, and assuming a fair degree of
accuracy in the survey, it would appear that
imports are predominant in retail sales. Forexample, if it is true that about 80% of shrimp
are consumed at home and also that 40% of
the domestic output of shrimp is distributed
through institutions, then 3 out of every 5 lb.
of shrimp purchased in retail stores are im-
ports. In any event, the important point is
that the larger volume of total distribution of
seafood products flows through the retail mar-kets and these outlets warrant attention in massmarketing strategies. Competition from im-
ports in the retail markets is likely to be keener
than experienced in the institutional trade.
RELATIONSHIP BETWEEN INCOMEAND CONSUMPTION
The survey indicated a clear tendency for
households with higher incomes to consumegreater quantities of most shellfish products.
Consumer panel households in the $10,000 plus
income bracket, for example, consumed 38%of the shrimp tallied in the survey although
the group comprised only 31% of the total num-ber of households. Similarly, the upper income
group consumed well above their proportional
share of other shellfish with the exception of
oysters (Table 2). Apparently the income-
Table 2.—Percent of total U.S. seafood consumption
by household income, 1969.

Pounds HrCapitaC«pii
Undvr 5.000-7 ,yuu- lO.UiJO tt
$5,000 6.9%9 9.999 Over
Pound PerCaplt«
nUnder 5,GOD- 7,000-10.000 &55,000 6,?V9 9,999 Over
Pound! ParCjplts
Under 5,000-7.000- lu,000 &55,000 6.999 9,999 Over
OCEAK PLttCH
Poisida PerCapitao.95r
L'nder 5,000- 7,000- lO.OOO i55,000 6.999 9,999 Over
Pounds PerCapita
0.30
Under 5,000- 7,000- 10,000 &$5,000 6.999 9,999 Over
Pounds PerCapitai.oor
Under 5.000- 7,000- 10,000 &$5,000 6,999 9,999 Over
LIGHT TUNAPounds Per
Capita2.oN-
I'J^der S.UJlT- V.UUU-'IU.WU &SS.OOO 6,999 9,999 Over
Figure 18.—Per capita consumption by household in-
come group: crabs, clams, oysters, and shrimp.
Source: Appendix 9.
Figure 20.—Per capita consumption by household in-
come group: scallops, ocean perch, and light tuna.
Source: Appendix 9.
Pounds PerHouseholdo.eop
Under 5.000- 7,000- lO.OuO &
$5,000 6,999 9,999 Over
Founds PerHousehold
0.4(>-
nUnder 5.000- 7.000- 10,000 &55,000 6.999 9,999 Over
Pounds PerHouseholdo.4or
Under 5,000- 7,000- 10.000 &
55,000 6,999 9,999 Over
OCEAN PERCH
Pounds PerHousehold2.50 r
Under 5,000- 7,000- 10,000 &
$5 ,000 6 ,999 9 .999 Over
Pounds PerHousehold
0.so-
under 5,000- 7.000- 10,000 i.
55.000 6,999 9,999 Over
Pounds PerHgugehold
Under 5.000- 7,000- 10,000 t,
55,000 6,999 9,999 Over
LIGHT TUNAPounds PerHousehold6.00 r
Under 5,000- 7,000- 10.000 &55,000 6,999 9,999 Over
Figure 19.—Consumption per household by household
income group: crabs, clams, oysters, and shrimp.
Source: Appendix 10.
Figure 21.—Consumption per household by household
income group: scallops, ocean perch, and light tuna.
Source: Appendix 10.
12
canned tuna consumption showed a tendency
to increase with income.
In evaluating the association between income
group and consumption, it is necessary to view
consumption on a per capita basis as well as
per household. Families in the survey tended to
be larger in the upper income brackets, and
this fact would account, at least in part, for
greater consumption. As may be seen in Fig-
ures 18 through 21, however, the income-con-
sumption relationships for shellfish products
are similar on both household and per capita
bases, which supports the contention that high-
er incomes influence greater consumption of
shellfish products. It should be pointed out that
the reverse indication for oysters does not ne-
cessarily brand this species as a unique ex-
ception. Supplies of oysters, it appears, are
more available to lower income areas, and tech-
nological barriers sustain this situation. Given
the experience of other shellfish, there appears
little reason to disbelieve that per capita con-
sumption of oysters among higher income
groups in urban areas could be increased con-
siderably provided consistent supplies are madeavailable.
Interestingly, the income distribution of
canned tuna consumption flattened out whenper capita rates were considered. This indi-
cates that income level per se has little in-
fluence on demand for tuna.
EFFECTS OF AGE ONCONSUMER PREFERENCE
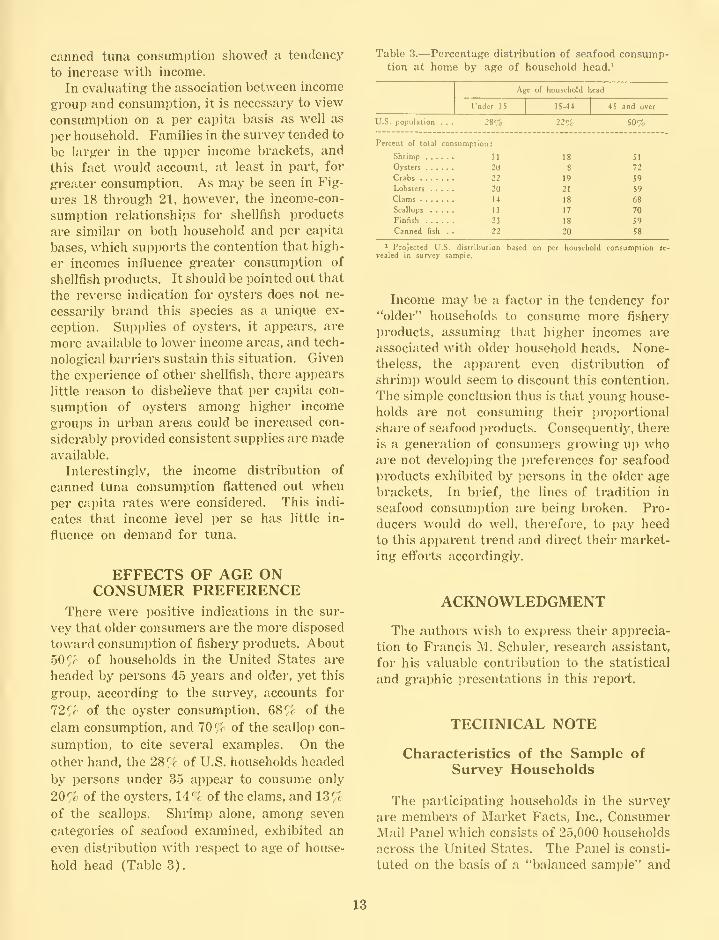
There were positive indications in the sur-
vey that older consumers are the more disposed
toward consumption of fishery products. About
50% of households in the United States are
headed by persons 45 years and older, yet this
group, according to the survey, accounts for
72% of the oyster consumption, 68% of the
clam consumption, and 70% of the scallop con-
sumption, to cite several examples. On the
other hand, the 28% of U.S. households headed
by persons under 35 appear to consume only
20 %o of the oysters, 14% of the clams, and 13%of the scallops. Shrimp alone, among seven
categories of seafood examined, exhibited an
even distribution with respect to age of house-
hold head (Table 3).
Table 3.—Percentage distribution of seafood consump-tion at home by age of household head.'

is designed to parallel census data for the Unit-
ed States with respect to geographic divisions,
household income, population density and de-
gree of urbanization, and age of Panel
members.
A sample of 1,500 households was selected
from the full Panel by stratified random samp-
ling. The smaller sample maintains corres-
pondence with the above mentioned census data
and provides a reasonable cross section of other
demographic characteristics, e.g. education,
occupation, race, religion, family size, and age
and sex composition of the children.
The survey Panel may be considered closely
representative of the population of U.S. house-
holds with respect to the significant demograph-
ic variables. Household surveys, however, are
particularly vulnerable to nonsampling errors
arising from unavoidable biases in the question-
naire and in the memories of the respondents.
To minimize the nonsampling errors, completedquestionnaires were monitored for obvious re-
porting errors.
LITERATURE CITEDLeBOVIT, C.
1970. Foods eaten away from home. National food
situation. U.S. Department of Agriculture, Wash-ington, D.C. 25-31.
PETERKIN, B., and B. EVANS.1965. Food purchasing guide for group feeding.
U.S. Department of Agriculture, Washington, D.C.
54 p.
14

APPENDICES
#PAanc (2626 HOUSEHOLDS
13.1
EAST NORTH CENTRAL3974 HOUSEHOLDS
19.9
NEW ENGLAND1154 HOUSEHOLDS'^
5.8"»-
MIDDLE ATLANTIC
3848 HOUSEHOLDS19.2 '^5
EAST SOUTH CENTRAL
1218 HOUSEHOLDS6.1
SOUTH ATUNTIC\2812 HOUSEHOLDS
14.1%
Appendix 1.—Geographic divisions of the United States and distribution of survey sample.
15

Appendix 2.—Estimated at-home consumption of shellfish, finfish, and canned fish by region. Population datafrom Bureau of the Census,
NewEngland
MiddleAilantic
E. NorthCenlral
W- NorthCentral
SouthAtlantic
E. SouthCenual
\V. SouthCentral
Mountain Pacific Total
POPULATION:(Thousands)
CONSUMPTION*
:
Shrimp:
Per capita
Total ...
%Oyitert:
Per capita
Total ...
%Crabs:
Per capita
Total . . .
Lobster
:
Per capita
Total ...
Lobster tails:
Per capita . -
Total
Qams:Per capita
Total . . .
%Scallops
:
Per capita
Total . . .
%Other shellftsh:
Per capita
Total . . .
Total sheltlisli:
Per capita
Total . . .
%Total finfish:
Per capita
Total . . .
Total shellRih
and finfish:
Per capita
Total . . .
%Total canned fish:
Per ctpita . .
Total
11,466
5.67
0.998
11,443
5.82
0.125
1,433
3.38
0.161
1,846
5.50
1,895
21,728
64.78
0.052
596
2.21
0.649
7,441
50.08
0.275
3.153
18.37
0.009
103
6.70
4.164
47,744
13.03
5.802
66,526
6.71
9.966
114,270
8.41
5.677
65,092
6.07
37,242
18.49
1.257
46,813
23.82
0.116
4,320
10.21
126
4,692
14.00
0.114
4,246
1265
0.211
7,858
29.20
0.073
2.719
18.30
0.131
4,879
28.43
0.003
112
7.29
2.031
75.639
20.64
4.648
173,101
17.46
6.679
248,739
18.32
5.657
210,678
19.66
39,759
19.74
.726
28,865
14.68
0.149
5.924
14.00
0.018
716
2.13
0.021
835
2.48
0.181
7,196
26.74
0.021
835
5.62
0.069
2,743
15.98
0.008
318
20.70
1. 193
47,432
12.94
3.506
139,395
14.06
4.699
186.828
13.76
4.168
165,716
15.47
16,206
8.04
.466
7,552
3.84
0121
1.961
4.63
0.006
97
0.28
0.004
65
0.19
0.025
405
1.50
0.009
146
0.85
0,631
10.226
2.79
2.454
39.770
4.01
3.085
49.996
3.68
4.159
67.401
6.29
30.145
14.96
1.253
37.772
19.22
0.403
12.148
28.71
0.213
6.421
19.16
0.141
4.250
12.67
0.087
2.623
9.74
0.035
1.055
7.10
0.056
1.688
9.83
0.009
271
17.64
2.197
66.229
18.07
5.375
162.029
16.35
7.572
228.258
16.81
5.293
159.557
14.89
Total theII6sh, finfish and canned fish (Includes specialty items not shown):
Per capita . . , 17.609 14.294 10.044 7.882 14.220
Total 201.905 532.337 399.229 127.736 428,662
% 7.43 19.60 14.71 4.70 15.79
13.054
6.48
.863
11.266
5.73
0.360
4.699
11.10
0.203
2,650
7.90
0.122
1,593
4.74
0.336
4,386
16.29
0.016
209
1.40
0.007
91
0.53
0.004
52
3.38
1.911
24,946
6.80
7.491
97,788
9.87
9.402
122,734
9.04
6.778
88,480
8.25
17.237
225,012
8.28
19,337
9.60
1.265
24.461
12.44
0.227
4.389
10.37
0.097
1.876
5.59
0.005
97
0.28
0.004
77
0.28
0.003
58
0.39
0.014
271
1.57
0.019
367
23.89
1.634
31,597
8.62
8.630
166.878
16.84
10.264
198.475
14.61
5.513
106.605
9.95
16.555
320.124
11.79
8.102
4.02
1.287
10.427
5.30
0.296
2.398
5.66
0.151
1.223
3.64
0.022
178
0.53
0.201
1,629
6.05
0.017
138
0.92
0.227
1,839
10.71
2.201
17.833
4.86
3.712
30.075
3.03
5.913
47,907
3.52
6.545
53,028
4.95
14.239
115,364
4.24
26.095
I2.9S
0.686
17.901
9.10
01935.036
11.90
0.536
13.987
41.74
0.021
548
1.63
0.082
2.140
7.95
0.092
2.401
16.16
0.090
2.349
13.68
0.012
313
20.37
1. 712
44.675
12.19
4.433
115.679
11.67
6.145
160.354
11.81
5.926
154.639
14.43
13.958
364.234
13.41
201.406
100.0
0.976
196.500
1000
0.210
42.308
100.0
0.166
33,508
100.0
0.167
33,540
100.0
0.134
26,910
100.0
007414,856
100.0
008517.159
lOO.O
0.008
1.536
100.0
1.819
366.321
100.0
4.922
991.240
100.0
6.740
1.357,560
100.0
5 318
1,071.196
100
13.479
2,714,713
1000
t Per capita consumption in pounds, total in thousands of pounds.
16

Appendix 3.—Regional supplies and distribution of
oysters.
Supplies
In-shipment^
Distribution
Landings Consumption Out-shipment
New England 2.024
Middle Atlantic
East Nonh Central . .
West North Central . .
South Atlantic
East South Central . .
West South Central . .
Mountain
Pacific
Total 26,473
Thousand

Appendix 7.—Consumer panel consumption of fresh
and frozen clams, crabs, and oysters at home and
away from home.
Appendix 8.—Consumption at home and away fromhome, by surs'ey panel: shrimp, lobster, halibut,
haddock, and flounder.
hem Ac bom« Away from home Item At home Away from home
aana .
Crabs . .
Oysterf
— — — — Pounds '— —368 339
(52%) (48%)
772 139
(91%) (9%)
991 235
(81%) (19%)
Shrimp . .
Lobster
Halibut .
Haddock
Flounder
Pounds
4,699


Regional and Other Related Aspects of Shellfish Consumption; Some Pre-liminary Findings from the 1969 Consumer Panel Survey, by Morton M.Miller and Barrel A. Nash, Circular 361
ERRATA
Page 13, right column. In the Technical Note, the reference to the con-
sumer mail panel should read "consists of 20,000 households," rather
than "consists of 25,000 households."
Page 15. The Appendix title should read "Geographic divisions of the
United States and distribution of full consumer panel."


OSFH
1971
UNITED STATESDEPARTMENT OF COAAMERCE
NATIONAL OCEANIC & ATMOSPHERIC ADMINISTRATIONNATIONAL MARINE FISHERIES SERVICE
SCIENTIFIC PUBLICATIONS STAFF
BLDG. 67, NAVAL SUPPORT ACTIVITY
SEAHLE, WASHINGTON 98115
POSTAGE AND FEES PAID
U.S. DEPARTMENT OF COMMERCE
OFFICIAL BUSINESS
PER iOD ICAL^. L ( liHMi i /iM
MARINE BiOLOGlCAL LABORATORYLIBRARYWOODS HOLE, KA 02^43


![Properties Affected by Different Shape and Different ... · exoskeleton of arthropods such as insects, crabs, shrimps, lobsters, and certain fungal cell walls [22]. Compared with](https://static.fdocuments.in/doc/165x107/5f5c2d18288167751a22aafb/properties-affected-by-different-shape-and-different-exoskeleton-of-arthropods.jpg)